trading off dietary choices, physical exercise and cardiovascular ... · trading off dietary...
TRANSCRIPT
Trading off dietary choices, physical exercise and cardiovasculardisease risks
Grisolia, J., Longo, A., Boeri, M., Hutchinson, G., & Kee, F. (2013). Trading off dietary choices, physical exerciseand cardiovascular disease risks. Social Science & Medicine, 93, 130-138.https://doi.org/10.1016/j.socscimed.2013.05.031
Published in:Social Science & Medicine
Document Version:Peer reviewed version
Queen's University Belfast - Research Portal:Link to publication record in Queen's University Belfast Research Portal
Publisher rights 2013 Elsevier Ltd. All rights reserved.
© 2015, Elsevier. Licensed under the Creative Commons Attribution -NonCommercial-NoDerivs License(https://creativecommons.org/licenses/by-nc-nd/4.0/), which permits distribution and reproduction for non-commercial purposes, provided theauthor and source are cited.General rightsCopyright for the publications made accessible via the Queen's University Belfast Research Portal is retained by the author(s) and / or othercopyright owners and it is a condition of accessing these publications that users recognise and abide by the legal requirements associatedwith these rights.
Take down policyThe Research Portal is Queen's institutional repository that provides access to Queen's research output. Every effort has been made toensure that content in the Research Portal does not infringe any person's rights, or applicable UK laws. If you discover content in theResearch Portal that you believe breaches copyright or violates any law, please contact [email protected].
Download date:04. Feb. 2020

Trading off dietary choices, physical exercise and cardiovascular
disease risks
Abstract
Despite several decades of decline, cardiovascular diseases are still the most common
causes of death in Western societies. Sedentary living and high fat diets contribute to the
prevalence of cardiovascular diseases. This paper analyses the trade-offs between lifestyle
choices defined in terms of diet, physical activity, cost, and risk of cardiovascular disease
that a representative sample of the population of Northern Ireland aged 40-65 are willing to
make. Using computer assisted personal interviews, we survey 493 individuals at their
homes using a Discrete Choice Experiment (DCE) questionnaire administered between
February and July 2011 in Northern Ireland. Unlike most DCE studies for valuing public
health programs, this questionnaire uses a tailored exercise, based on the individuals’
baseline choices. A “fat screener” module in the questionnaire links personal cardiovascular
disease risk to each specific choice set in terms of dietary constituents. Individuals are
informed about their real status quo risk of a fatal cardiovascular event, based on an initial
set of health questions. Thus, actual risks, real diet and exercise choices are the elements
that constitute the choice task. Our results show that our respondents are willing to pay for
reducing mortality risk and, more importantly, are willing to change physical exercise and
dietary behaviours. In particular, we find that to improve their lifestyles, overweight and
obese people would be more likely to do more physical activity than to change their diets.
Therefore, public policies aimed to target obesity and its related illnesses in Northern
Ireland should invest public money in promoting physical activity rather than healthier
diets.
Keywords: Northern Ireland, Dietary choices, Choice experiments, Willingness to pay for risk
reduction, Cardiovascular diseases
1. Introduction
Obesity and overweight have become a growing problem affecting most of Western societies.
According to the World Health Organization (WHO), in 2008 there were about 1.5 billion
overweight adults. This figure is increasing dramatically because of our sedentary lifestyles
and worsening eating habits (World Health Organization, 2011). In Northern Ireland almost
60% of adults are either overweight or obese, and, according to the Public Health Agency,
this figure is growing (Department of Health, Social Service and Public Safety, 2011).This
epidemic has become an economic burden (Muller, 2007), as well as a major health problem,
as obesity increases the risk of type 2 diabetes, cancer and cardiovascular diseases (CVD). As
a result, governments and public health agencies are diverting considerable resources to
prevent obesity and promote healthy lifestyles (World Health Organization, 2001; Fit
Futures, 2006; Foresight Report, 2007; Department of Health, Social Service and Public
Safety, 2010). Thus it is important to explore strategies that help people choose healthier
lifestyles and to estimate their willingness to pay for improvements in their health and for
reductions in their risk of disease.
A discrete choice experiment (DCE) survey is the appropriate framework to analyse
individuals’ stated behaviour in response to a broad range of hypothetical choices (Ben Akiva
& Lerman, 1985; Louviere, Hensher, & Swait, 2000; Train, 2009; Carlsson & Martinsson,
2003; Ryan, Gerard & Amaya, 2008). DCEs allow researchers to analyse to what extent, and
under what conditions, individuals are willing to change their unhealthy lifestyles for
healthier ones. This health improvement is presented here in terms of a reduction of the risk
of suffering from CVD, which are among the most serious obesity-related health problems, in
the context of food choices and physical activity behaviour.
Food choices and risk have been analysed with respect to genetically modified food (Rigby &
Burton, 2005, 2006), traceability (Van Rijswjk & Frewer, 2008) and food safety (Lobba,
Mazzocchi & Trail, 2007). Most of these studies are based on one single choice or a set of
single choices. Conversely, in our study, we set a more realistic framework for dietary
choices, which implies a series of regular choices over many years. In addition, respondents
are not asked to choose between artificial scenarios completely unrelated to their own
habitual food choices and amounts of physical activity. We tailor our DCE questions using
individuals’ actual diet, level of physical activity and the CVD risk they face.
Dietary choices are based on habit but are the result of a trade-off between taste (sensory
perceptions), health, cost, and among other attributes, attitudes, values, and beliefs (Furst et
al., 1996). Cardiovascular diseases are known to be highly correlated with high levels of
cholesterol in the blood (Mente et al., 2009), part of which comes from an excess of saturated
fat intake. At the same time, the presence of fat is correlated with taste and palatability in
food. On the other hand, a sedentary lifestyle tends to be correlated with high levels of
cholesterol in the diet (Lakdawalla & Philipson, 2009; Auchincloss et al., 2009). Despite its
well-known benefits, the majority of people in the UK do not engage in regular physical
activity. Physical activity levels are declining in Northern Ireland (NI), with 23% of the
population classed as sedentary (Northern Ireland Health and Social Wellbeing Survey
2005/06).
In this paper, our DCE asks a representative sample of the adult population of Northern
Ireland to choose between their current lifestyle, described in terms of their own dietary
habits, levels of physical activity and actual risk of suffering a fatal CVD in the next ten
years, and other hypothetical lifestyles described by different combinations of diet, exercise,
risk of a fatal CVD event in the next ten years, and cost. Cost is shown as increases from
respondents’ current expenditures. Diets are presented as reductions in the consumption
frequency of the most unhealthy (in terms of fat intake) food items consumed by respondents,
whilst levels of physical activity are described in terms of increments from respondents’
current levels measured in minutes.
The remainder of the paper is structured as follows. Section two briefly describes the DCE
method; section three gives an overview of the questionnaire used and reports the descriptive
statistics of the sample of the Northern Ireland population we surveyed; section three reports
the results of the econometric models and discussion; section four concludes the paper with
policy implications.
2. Methodology, questionnaire and data collection
2.1 Methodology
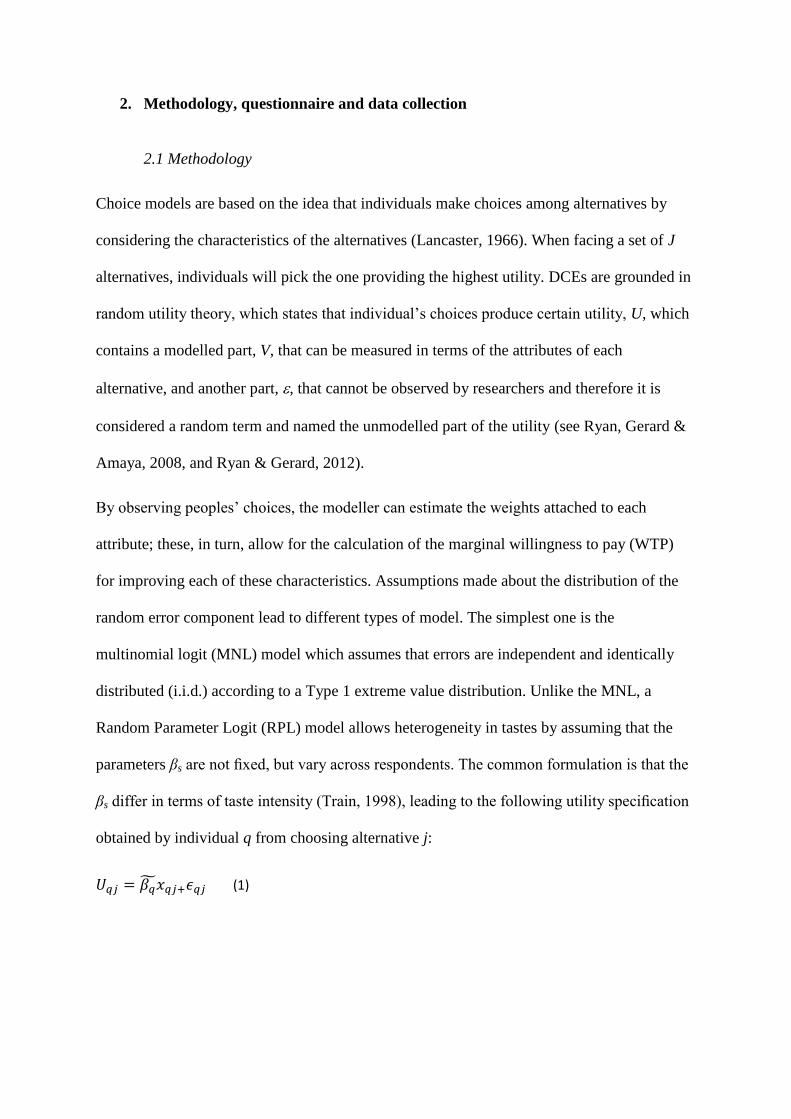
Choice models are based on the idea that individuals make choices among alternatives by
considering the characteristics of the alternatives (Lancaster, 1966). When facing a set of J
alternatives, individuals will pick the one providing the highest utility. DCEs are grounded in
random utility theory, which states that individual’s choices produce certain utility, U, which
contains a modelled part, V, that can be measured in terms of the attributes of each
alternative, and another part, , that cannot be observed by researchers and therefore it is
considered a random term and named the unmodelled part of the utility (see Ryan, Gerard &
Amaya, 2008, and Ryan & Gerard, 2012).
By observing peoples’ choices, the modeller can estimate the weights attached to each
attribute; these, in turn, allow for the calculation of the marginal willingness to pay (WTP)
for improving each of these characteristics. Assumptions made about the distribution of the
random error component lead to different types of model. The simplest one is the
multinomial logit (MNL) model which assumes that errors are independent and identically
distributed (i.i.d.) according to a Type 1 extreme value distribution. Unlike the MNL, a
Random Parameter Logit (RPL) model allows heterogeneity in tastes by assuming that the
parameters βs are not fixed, but vary across respondents. The common formulation is that the
βs differ in terms of taste intensity (Train, 1998), leading to the following utility specification
obtained by individual q from choosing alternative j:
𝑈𝑞𝑗 = 𝛽�̃�𝑥𝑞𝑗+𝜖𝑞𝑗 (1)
Where X is a vector of attributes describing alternative j and the random taste parameters
˜ q
depend on the values of the parameters θ of an underlying “mixing distribution” f (β|θ).
Researchers have to make assumptions about the distributions of the random component.
For the MNL, the WTP for an attribute is calculated as the negative of the ratio between that
attribute coefficient and the cost attribute, and welfare estimates can be calculated as
described in Lancsar & Savage (2004). Whenever random parameters are used, this formula
is not so straightforward (Armstrong, Garrido & Ortúzar, 2001). In such a case, the
calculation of means and confidence intervals would be difficult, although the distribution
itself may still exist. For this reason a different parameterization of the utility function –
namely WTP–space – has been recently developed (Train & Weeks, 2005). In further
applications, WTP-space has been shown to provide more realistic and informative welfare
estimates obtained from DCE data (e.g., Train & Weeks, 2005; Scarpa, Thiene & Train,
2008; Balcome, Chalak & Fraser, 2009). Moreover, as documented in Train & Weeks (2005)
and in Scarpa, Thiene & Train (2008), a random cost coefficient in a WTP-space model
allows for individual scale heterogeneity – even if it is confounded with the cost coefficient
(Thiene & Scarpa, 2010 and Scarpa, Thiene & Hensher, 2012). WTP-space is a
transformation of the utility function that involves expressing all non-cost parameters
estimates as ratios with the cost coefficient. As discussed by Louviere (2006), if errors are
i.i.d. type-one extreme value, there is no difference in the fits of the two models, except for
rounding errors. This re-parameterization of the utility function allows the direct estimation
of population moments. The utility function is re-written by substituting for each attribute k
the parameter 𝛽𝑘 with a new parameter which is a direct estimate of the WTP by noting that
𝛽𝑘 = 𝛽𝑐𝑜𝑠𝑡 ∙ 𝑊𝑇𝑃𝑘 .
In order to obtain more accurate WTP values from the observed sample for policy
recommendations, we compute the WTP for each attribute for each individual (WTPk,q)
conditional to the pattern of choices observed, yq. The coefficients for the model at an
individual level can be computed using the estimator proposed by Scarpa, Campbell &
Hutchinson (2007):
�̂� [𝑊𝑇𝑃𝑘,𝑞] =
1
𝑅∑ 𝑊𝑇𝑃𝑘,𝑞
�̂� 𝐿(𝑊𝑇𝑃𝑘,𝑞�̂� |𝑦𝑞,𝑋𝑞)
𝑅
𝑟=1
1
𝑅∑ 𝐿(𝑊𝑇𝑃𝑘,𝑞
�̂� |𝑦𝑞,𝑋𝑞)𝑅
𝑟=1
, (2)
where L(.) is the posterior likelihood of the individual respondents and the 𝑊𝑇𝑃𝑘,𝑞�̂� are drawn
from the multivariate normal computed at the Maximum Simulated Log-likelihood estimates
using r=1,2,…R draws. In our calculation we will use R=100,000 Halton draws.
2.2 Questionnaire
We used computer assisted personal interviews (CAPI) during the months February – July
2011 to administer a questionnaire to a sample of 493 individuals aged 40-65 representative
of this age group in Northern Ireland. Ethical approval for this study was obtained by the
Ethical Research Committee of the School of Biological Sciences, Queen’s University
Belfast. The questionnaire is divided into five parts: health and physical activity, diet, a risk
tutorial, the DCE choices, and socio-demographic questions. The DCE questions were
tailored and individually generated to take account of each respondent’s current dietary
choices, levels of physical activity and fatal CVD risk, thus making the experiment realistic
to the subject.
We began with general questions about health, adapted from the MOS SF36 Health
questionnaire (McHorney et al, 1994), and asked respondents about health conditions related
to diabetes, smoking, arthritis, systolic blood pressure, cardiovascular diseases, family history

of cardiovascular diseases and individual’s weight and height. For example, when enquiring
about respondents’ health, we asked: “In general, would you say that your health is... Very
good; Good; Fair; Poor; Very Poor; Don’t know/Refused”. We then asked questions about
age, gender and postcode address. These health data were incorporated into the QRISK1
prediction algorithm developed by the University of Nottingham for CVD risk in the British
population (Hippisley-Cox et al., 2008) to estimate respondents’ own CVD risks. The
outcome of the algorithm, in terms of the percentage risk of having a heart attack or stroke in
the next ten years was then shown to respondents and later reported in the “status quo” option
in the DCE questions. Physical activity questions were based on the UK National Health
Service version of the International Physical Activity Questionnaire (IPAQ) (Craig et al,
2003) to elicit respondents’ engagement with moderate activities (household, gardening,
shopping), moderate exercises (walking, cycling) and vigorous physical activities. For
example, respondents were asked “During the last week, how many hours did you spend
walking, including walking to work, shopping, for pleasure etc.? None; Some but less than 1
hour; More than 1 hour but less than 3 hours; 3 hours or more; Don’t know/Refused”.
To determine people’s willingness to modify their diet in exchange for health improvements,
we collected information about respondents’ current eating habits. As we deemed impractical
for a CAPI interview to use a diary of food intake during one week, we focused on eliciting
respondents’ consumption of food items with a high fat content, as these items could lead to
high levels of blood cholesterol and, therefore, are likely to contribute to CVD. We followed
the Block Questionnaire (Block, 2000), a tool developed in the nutritional literature, that
offers a snapshot of an individual’s levels of fat intake through questions about the eating
frequency and the portion size for 17 selected items. We adapted the Block Questionnaire to
the Irish diet considering the main sources of fat (Joyce et al, 2007), by selecting 17 fatty
items often found in the Northern Irish diet: salad dressings (not low-fat); chicken or other
poultry (eg. Turkey); beef: roast, steak, mince, stew or casserole; corned beef, spam,
luncheon meats; boiled, mashed, instant or jacket potatoes; chips and savoury snacks; cheese;
pork: roast, chops, stew or slices; beefburgers; butter; savoury pies, eg. meat pie, pork pie,
pasties, steak and kidney pie, sausage rolls; roast potatoes; biscuits, pastries and cakes (not
low-fat); bacon; sausages; potato salad; whole milk. Respondents were asked the frequency
of consumption of these items from ‘never’ to ‘five or more times a week.’ Each item was
presented in a separate screen (see Figure 1). After the frequency, individuals were asked
about portion sizes and cooking styles. We would later use the answer to the Block
Questionnaire to build the ‘diet’ attribute for the DCE questions, as described below.
Figure 1 about here
The third part of the questionnaire provides a risk tutorial to explain the concept of
probability using visual aids. Following a tutorial developed by Alberini et al. (2004) and
Alberini & Chiabai (2007) to assess the WTP for reducing mortality risk for cardiovascular
and respiratory causes, the concept of probability is taught at first with simple examples and
then, by increasing the degree of complexity and abstraction.
The fourth part of the questionnaire presents ten DCE questions. Each DCE question entails
three alternatives: the respondent’s current lifestyle and two alternative hypothetical
lifestyles. Each alternative is described by a diet, an amount of physical activity, a risk of a
fatal CVD event in the next ten years and a cost to the respondent. An example of a DCE
question is shown in figure 2.
Figure 2 about here
Just before the DCE questions, a “cheap talk” text (Carlsson, Frykblom, & Lagekvist, 2005)
was used to emphasise research findings on the correlation between sedentary lifestyle,
excessive fat consumption, poor intake of fruit and vegetables and coronary heart diseases.
Cost increases were justified on the basis of the following statement: “these alternative
lifestyles will also impact your budget because fruit and vegetables are usually more
expensive than other food and physical exercise might also have a cost.”
The final part of the questionnaire asked a set of follow-up Likert scale questions to measure
attitudes, perceptions and beliefs about the individuals’ health, and concluded by eliciting
respondents’ socio-demographic characteristics.
2.3 Attributes and levels
Physical exercise was defined as minutes spent in a moderate physical exercise per day. The
levels of this attribute were: the current level of physical activity, and increases by 10, 20, 30,
or 40 minutes per day compared to the current level. The CVD risk was defined as the
probability of a fatal heart attack in the next ten years. The status quo level for the current life
style was the one resulting from the QRISK1 prediction algorithm. The levels for the other
alternative scenarios were calculated as a reduction in such a risk by 40%, 50%, 60%, 75%
and 85%. Therefore, for a respondent whose current risk was equal to 5%, a 50% reduction
would result in a risk of 2.5%. Cost was described as an increase in the money spent on food
and physical exercise per week and its levels were set to £2, £5, £7, £10, £15 and £18, after
insights from focus groups, where participants were asked their maximum additional weekly
willingness to pay for healthier food consumption, increased levels of physical activity and
resulting benefits of decreased CVD risks. The diet attribute was the most complex to define.
In focus groups we ruled out the idea of using a hypothetical food basket described in terms
of an abstract nutritional content, as such a description would not convey well the
information of the ‘taste’ of food and the ‘sacrifice’ resulting from reducing the consumption
of favourite food products and from increasing the consumption of fruit and vegetables. We

also discarded the possibility of using flagship unhealthy food items, such as pizza, chicken
curry, fish and chips, or an ‘Irish Breakfast’, as they might not have been relevant to all
respondents. Therefore, we used the information collected from the Block Questionnaire and
selected, for each respondent, the five food items most frequently consumed. The CAPI
automatically selected the five items from the Block Questionnaire that were most frequently
consumed by each respondent and used these five items to build the DCE questions. This
information was presented to respondents under the current choice. The alternative
hypothetical scenarios were described in terms of reduction in the consumption of these five
items and an increase in fruit and vegetables. We selected four levels for the diet attribute
defined in terms of overall fat content. Considering the current diet as the reference value, we
defined light, medium, high and restricted diets, corresponding to reductions in fat intake by
10% (light), between 20% and 30% (medium), between 40% and 50% (high) and between
60% and 75% (restricted) from the current diet respectively. This approach allowed us to
compare diets across respondents and build a variable expressed in terms of reduction of
grams of fat from the current diet. We are aware that this approach may lead to a ‘researcher
bias,’ as in our econometric model we assume that respondents trade off grams of fat when
choosing different life styles. However, we are unaware of a more efficient approach to
investigate comparable dietary choices across respondents in a tractable way for a DCE
survey. Our approach leads to comparable choices, and choices meaningful to respondents. In
focus groups we tried adding the information of ‘grams of fat’, but this information appeared
to convey a wrong message, as respondents would only grasp the unhealthy message
conveyed by ‘grams of fat’ and were unable to consider the ‘taste’ and ‘sacrifice’ elements of
reducing the consumption of their favourite food items. Table 1 shows the attributes and their
levels used in this DCE study.
Table 1 about here
Once the attributes and levels were decided, to determine the choice sets and the combination
of attribute levels for each alternative, we used a Bayesian D-efficient experimental design,
which has been shown to produce smaller standard errors for small samples compared to
other experimental designs, such as orthogonal designs (Bliemer & Rose, 2008; Scarpa,
Campbell & Hutchinson, 2007; Ferrini & Scarpa, 2007). The design was implemented in two
waves, obtaining new priors after modelling half of the sample data. Each respondent was
presented with 10 different choice scenarios. The initial priors information was obtained from
pre-test and then enhanced with the first wave obtaining -1.38 for status quo, -0.169 for cost,
0.0175 for exercise (in minutes, not in METs as was finally employed in the model) 0.047 for
fat and -0.0677 for fatal CVD risk.
The econometric models use the independent variables Fat, Exercise, Cost and Risk. Fat
represents the sacrifice from a respondent’s diet, in terms of grams of fat per week that the
individual has to give up. This variable was built using the information from the adapted
Block Questionnaire and was translated into grams of fat using the study of calories and fat
provided by McCance and Widdowson (Food Standard Agency, 2002). Exercise in the DCE
data analysis was translated into metabolic equivalent of task (MET) which is a unit that
expresses the amount of energy necessary to execute each type of physical activity per
minute, and is particularly useful for comparing diet and exercise in terms of energy (see
Ainsworth et al., 1993). This variable was calculated from the responses to the IPAQ, and the
different units of MET that each minute of moderate, medium or vigorous exercise represent.
Therefore, its coefficient represents the contribution to utility of one additional unit of MET.
Cost is the payment for changes in lifestyle, justified in terms of increasing costs of healthy
diets, measured in GBP per week. Risk is the risk of suffering a fatal CVD event over the next
ten years, expressed on a percentage basis. In addition to a specification that includes only the
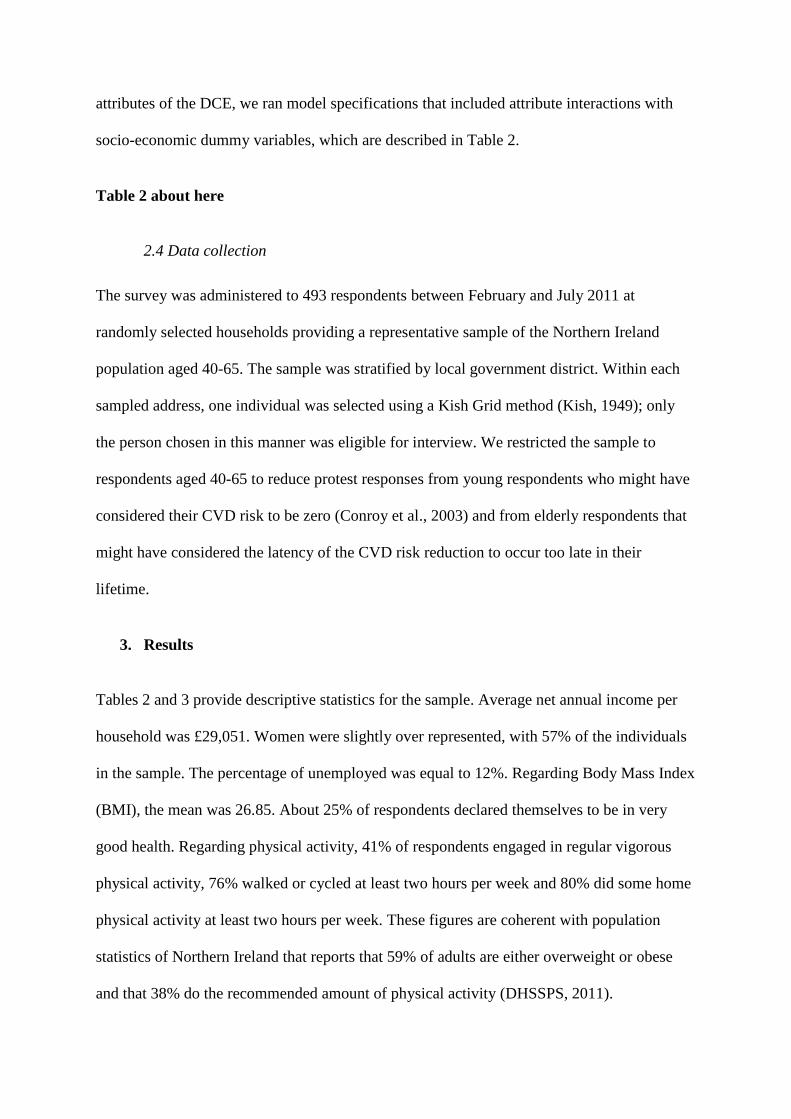
attributes of the DCE, we ran model specifications that included attribute interactions with
socio-economic dummy variables, which are described in Table 2.
Table 2 about here
2.4 Data collection
The survey was administered to 493 respondents between February and July 2011 at
randomly selected households providing a representative sample of the Northern Ireland
population aged 40-65. The sample was stratified by local government district. Within each
sampled address, one individual was selected using a Kish Grid method (Kish, 1949); only
the person chosen in this manner was eligible for interview. We restricted the sample to
respondents aged 40-65 to reduce protest responses from young respondents who might have
considered their CVD risk to be zero (Conroy et al., 2003) and from elderly respondents that
might have considered the latency of the CVD risk reduction to occur too late in their
lifetime.
3. Results
Tables 2 and 3 provide descriptive statistics for the sample. Average net annual income per
household was £29,051. Women were slightly over represented, with 57% of the individuals
in the sample. The percentage of unemployed was equal to 12%. Regarding Body Mass Index
(BMI), the mean was 26.85. About 25% of respondents declared themselves to be in very
good health. Regarding physical activity, 41% of respondents engaged in regular vigorous
physical activity, 76% walked or cycled at least two hours per week and 80% did some home
physical activity at least two hours per week. These figures are coherent with population
statistics of Northern Ireland that reports that 59% of adults are either overweight or obese
and that 38% do the recommended amount of physical activity (DHSSPS, 2011).
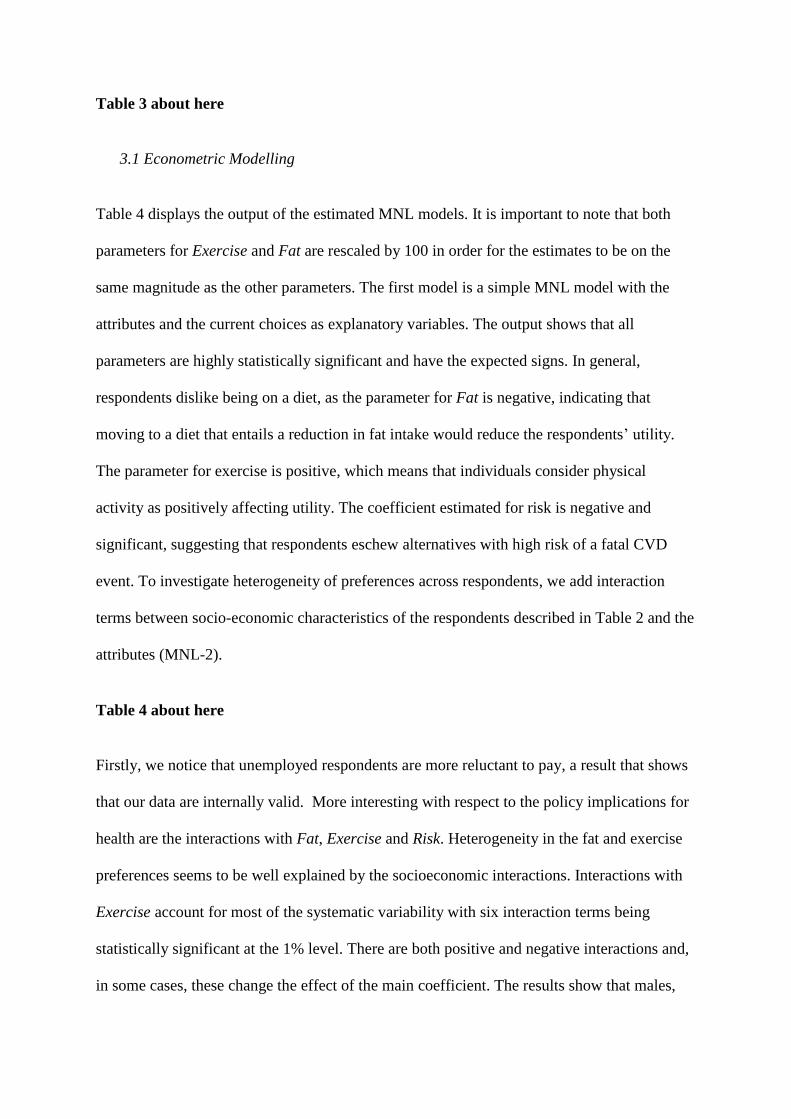
Table 3 about here
3.1 Econometric Modelling
Table 4 displays the output of the estimated MNL models. It is important to note that both
parameters for Exercise and Fat are rescaled by 100 in order for the estimates to be on the
same magnitude as the other parameters. The first model is a simple MNL model with the
attributes and the current choices as explanatory variables. The output shows that all
parameters are highly statistically significant and have the expected signs. In general,
respondents dislike being on a diet, as the parameter for Fat is negative, indicating that
moving to a diet that entails a reduction in fat intake would reduce the respondents’ utility.
The parameter for exercise is positive, which means that individuals consider physical
activity as positively affecting utility. The coefficient estimated for risk is negative and
significant, suggesting that respondents eschew alternatives with high risk of a fatal CVD
event. To investigate heterogeneity of preferences across respondents, we add interaction
terms between socio-economic characteristics of the respondents described in Table 2 and the
attributes (MNL-2).
Table 4 about here
Firstly, we notice that unemployed respondents are more reluctant to pay, a result that shows
that our data are internally valid. More interesting with respect to the policy implications for
health are the interactions with Fat, Exercise and Risk. Heterogeneity in the fat and exercise
preferences seems to be well explained by the socioeconomic interactions. Interactions with
Exercise account for most of the systematic variability with six interaction terms being
statistically significant at the 1% level. There are both positive and negative interactions and,
in some cases, these change the effect of the main coefficient. The results show that males,
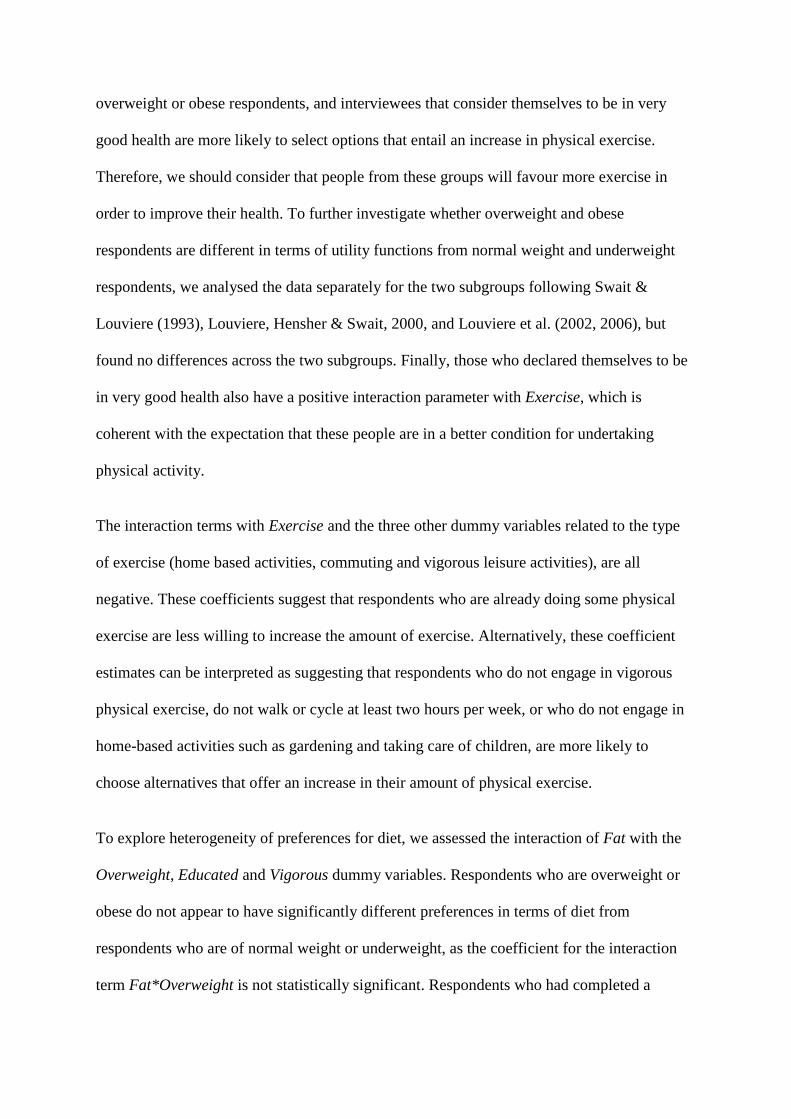
overweight or obese respondents, and interviewees that consider themselves to be in very
good health are more likely to select options that entail an increase in physical exercise.
Therefore, we should consider that people from these groups will favour more exercise in
order to improve their health. To further investigate whether overweight and obese
respondents are different in terms of utility functions from normal weight and underweight
respondents, we analysed the data separately for the two subgroups following Swait &
Louviere (1993), Louviere, Hensher & Swait, 2000, and Louviere et al. (2002, 2006), but
found no differences across the two subgroups. Finally, those who declared themselves to be
in very good health also have a positive interaction parameter with Exercise, which is
coherent with the expectation that these people are in a better condition for undertaking
physical activity.
The interaction terms with Exercise and the three other dummy variables related to the type
of exercise (home based activities, commuting and vigorous leisure activities), are all
negative. These coefficients suggest that respondents who are already doing some physical
exercise are less willing to increase the amount of exercise. Alternatively, these coefficient
estimates can be interpreted as suggesting that respondents who do not engage in vigorous
physical exercise, do not walk or cycle at least two hours per week, or who do not engage in
home-based activities such as gardening and taking care of children, are more likely to
choose alternatives that offer an increase in their amount of physical exercise.
To explore heterogeneity of preferences for diet, we assessed the interaction of Fat with the
Overweight, Educated and Vigorous dummy variables. Respondents who are overweight or
obese do not appear to have significantly different preferences in terms of diet from
respondents who are of normal weight or underweight, as the coefficient for the interaction
term Fat*Overweight is not statistically significant. Respondents who had completed a
university degree appeared to like a low fat diet as the coefficient for the interaction term
between Fat an Educated is positive and statistically significantly different from zero.
Finally, the last interaction term between Fat and Vigorous is negative and significant,
indicating that respondents who undertake vigorous physical activity would not prefer a low
fat diet. The last interaction term, between Risk and the dummy variable Children indicating
whether respondents had dependent children, is negative, but not statistically significant,
suggesting that having children does not make respondents more risk averse than respondents
that do not have to look after children.
3.2 Willingness to pay
When we apply a RPL model to the data, we find a considerable improvement to the fit of the
data compared to the previous two MNL models, as can be seen by the improvement in the
log likelihood function of the model in Table 5.
Table 5 about here
This model has been estimated directly in WTP-space to avoid problems in computing
posterior WTP estimates. We used normal distributions for Exercise and Fat, lognormal for
Cost, while we did not allow for random heterogeneity for Risk. The output shows negative
and highly significant coefficient estimates for the current choice and for risk, strengthening
the results of the previous two models: respondents would prefer to change their lifestyle and
would favour alternatives with lower risks of fatal CVD. Unobserved heterogeneity is
captured by the spread (Sigma) of the normal distributions for Exercise, Fat and the
lognormal distribution for Cost. All spread coefficients are statistically significant, suggesting
that preferences vary across respondents. When we further look at the effects of
socioeconomic variables, we confirm the findings from the MNL, however some of the
previous interactions are now not statistically significant as the random parameters capture
some heterogeneity that in MNL2 is considered observed.
The output from table 5 shows that some respondents have a positive and some have a
negative WTP for Exercise, meaning that part of the sample are willing to pay to undertake
physical activity and part are reluctant to do it, and therefore appear to require compensation.
Similarly, we find that some respondents have a positive WTP and some have a negative
WTP for Fat. Therefore, to investigate the WTP for Exercise and Fat, which are allowed to
be heterogeneous across the sample, we use equation 2 to retrieve posterior individual WTP
values. These values, reported in Table 6, can be used for policy analysis, as our sample
mirrors the population well.
Table 6 about here
For Exercise, we find that the median WTP of the sample is almost zero, and the sample is
split 51% with a positive WTP and 49% with a negative WTP. On average, respondents are,
however, willing to pay 0.243 GBP per 100 MET. On the other hand, reducing the fat intake
is considered negatively for the majority of the sample, as the median is equal to -0.312 and
only 41% of the sample has a positive WTP for a reduction in fat intake. Even though the
median WTP for fat reduction is negative, the mean WTP is positive, as driven by some
respondents with very high WTP, and is equal to 1.387 GBP for a reduction of 100 grams of
fat. Looking at the interactions, it is possible to conclude that respondents with a positive
WTP are educated and normal weight or underweight, while obese and overweight
respondents and respondents who do vigorous physical activity have a negative WTP.
4. Discussion and conclusion
Lifestyle choices, seen as long run decisions, imply certain risks for health. Individuals
naturally trade off these risks, (presented here as fatal CVD risks), with money, physical
exercise and changes in dietary habits. Our study is the first respondent’s tailored DCE to
assess the WTP for and the trade-offs between health risks and lifestyle behaviours. In our
survey, we used respondent’s specific choice experiments based on each individual’s current
health conditions, actual dietary and physical activity habits, and then presented respondents
with realistic hypothetical lifestyle alternatives.
Our results show that many respondents recognize the value of reducing their fat intake and,
in general, would also be willing to increase their level of physical exercise to reduce their
health risks. We also find that males are more likely to engage in physical exercise, as
confirmed by other research (see, for instance Biddle & Mutrie, 2008). More interesting is the
positive preference of overweight individuals towards exercise but with significant
heterogeneity in this regard. In fact, up to 51% of the sample has a positive WTP.
Considering that 1 minute of moderate exercise such as stationary bicycling implies a
consumption of 5.5 METs, respondents show a WTP of approximately 0.80 GBP per hour,
which is about one third of the cost of accessing a gym in Northern Ireland, and is about one
eighth of the minimum hourly wage, suggesting that one hour of moderate physical activity is
only modestly valued by our respondents.
We find a mean WTP equal to 1.387 GBP for a reduction of 100 grams of fat. This equates to
a WTP of 4.85 GBP per week for a 50 grams reduction of fat intake in a weekly diet, which
corresponds to a reduction of about 60 grams of butter in a week. A reduction of 50 grams of
fat per week equates to a reduction of about 7 grams of fat per day. For example, such a daily
amount of fat is found in 20 grams of mature Cheddar cheese, or in one oatmeal biscuit, or in
two slices of bacon. It is not surprising that some people are willing to pay to reduce their fat
intake and, in fact, this is consistent with the attitude of the food industry that applies a price
premium to low fat products.
We find an average WTP for reducing by 1 percentage point the risk of a fatal CVD event in
the next 10 years equal to 0.632 GBP per week. This implies a value of 32.86 GBP per year,
and, considering a 3.5% discount rate, over 10 years, this is equal to 282.85 GBP. As the
current Northern Ireland population between 40 to 65 years old is comprised of 285,226
individuals, this would represent an aggregate WTP of £80.7 million. CVD costs the health
care systems in the UK about £240 per person per year (Allender et al, 2008), which is equal
to £3.7 billion over a ten year period (using a 3.5% discount rate and a reference population
of 1,789,000 people) for the population of Northern Ireland. We find, therefore, that the
aggregate WTP of £80.7 million is equivalent to 2% of the CVD cost in Northern Ireland. We
conclude that a policy that would reduce the risk of a fatal CVD event by 1% is worth about
2% of the current Northern Ireland cost for CVD.
The results of this study provide useful guidance for addressing obesity and sedentary
behaviour in Northern Ireland. Our models show that to improve their lifestyle, overweight
and obese people would be more likely to do more physical activity than to change their
diets. Therefore, public policies aimed to target obesity and its related illnesses in Northern
Ireland should invest public money in promoting physical activity rather than healthier diets.
However, as we also find that lifestyles characterised by increased levels of physical activity
are more likely to be chosen by males, it is likely that to improve the lifestyles of females the
government should subsidise healthy food choices. In terms of research, these findings
suggest that we need to explore further the reasons behind people’s attachment to specific
items of the Irish diet. With such knowledge, public policies might be better designed to
discourage fat consumption.

Nonetheless, our study has some limitations that should be acknowledged. We have
constrained our sample to subjects between 40 to 65 years of age, which may limit the
broader generalization for other age groups in Northern Ireland. In addition, as the
construction of the DCE questions is tailored to each individual, the need to ask detailed
questions regarding diet and physical activity and presenting respondents with the risk
tutorial prior to introducing the DCE questions brings with it a certain respondent burden.
References
Ainsworth B. E., Haskell, W. L., Leon, A. S., Jacobs, D. R., Montoye, H. J., Sallis, S. F., &
Pafembarger, R. S. (1993). Compendium of physical activities: classification of energy costs
of human physical activities. Med Sci Sports Exerc. 1993 Jan;25(1):71-80.
Alberini, A. & Chiabai, A. (2007). Urban environmental health and sensitive populations:
How much are the Italians willing to pay to reduce their risks? Regional Science and Urban
Economics, 37(2): 239-258.
Alberini, A., Cropper, M., Krupnick, A., & Simon, N. (2004). Does the value of a statistical
life vary with age and health status? Evidence from the U.S. and Canada. Journal of
Environmental Economics and Management, 48(1): 769–792.
Allender, S., Scarborough, P., Peto, V., Rayner, M., Leal, J., Luengo-Fernandez, R., & Gray,
A. (2008). European cardiovascular disease statistics. European Heart Network: Brussels.
Armstrong, P., Garrido, R., & Ortúzar, J. de D. (2001). Confidence intervals to bound the
value of time. Transportation Research Part E, 37, 143–161.
Auchincloss, A. H., Diez Roux, A. V., Mujahid, M. S., Shen, M., Bertoni, A. G., &
Carnethon, M. R. (2009). Neighborhood Resources for Physical Activity and Healthy Foods
and Incidence of Type 2 Diabetes Mellitus. The Multi-Ethnic Study of Atherosclerosis.
Archives of Internal Medicine, 169(18):1698-1704.
Balcome, K., Chalak, A. & Fraser, I. (2009). Model selection for the mixed logit model with
bayesian estimation. Journal of Environmental Economics and Management 57: 226–237.
Ben-Akiva, M., & Lerman, S. R. (1985). Discrete Choice Analysis: Theory and Application
to Travel Demand. The MIT Press, London, England.
Biddle, S. J. H., & Mutrie, N. (2008). Psychology of Physical Activity. Determinants, well-
being and interventions. Routledge. London and New York.
Bliemer, M. C. J., & Rose, J. M. (2008). Construction of experimental designs for mixed logit
models allowing for correlation across choice observations. 87th Annual TRB Meeting,
Washington, D.C., January 2008, USA.
British Heart Foundation (2010). 2010 Coronary heart disease statistics. London: BHF.
Carlsson F., & Martinsson, P. (2003). Design techniques for stated preference methods in
health economics. Health Economics 12:281-294.
Carlsson, F., Frykblom, P., & Lagekvist, C. J. (2005). Using cheap talk as a test of validity in
choice experiments. Economic Letters, 89: 147–152.
Conroy, R. M., Pyorala, K., Fitzferald, A. P., Sans, S., Menotti, A., De Backer, G., De
Craig, C. L., Marshall A. L., Sjöström, M., Bauman, A. E., Booth, M. L., Ainsworth, B. E.,
Pratt, M., Ekelund, U., Yngve, A., Sallis, J. F., & Oja, P. (2003). International physical
activity questionnaire: 12-country reliability and validity. Med Sci Sports Exerc, 35: 1381-95.
Bacquer, D., Ducimetière, P., Jousilahti, P., Keil, U., Njølstad, I., Oganov, R. G., Thomsen,
T., Tunstall-Pedoe, H., Tverdal, A., Wedel, H., Whincup. P., Wilhelmsen, L., & Graham, I.
M. (2003). Estimation of ten-year risk of fatal cardiovascular disease in Europe: the SCORE
project. European Heart Journal, 24:987–1003.
Department of Health, Social Service and Public Safety (2010). Obesity Prevention
Framework 2011-2012. Health Development Policy Branch, Northern Ireland.
Department of Health, Social Service and Public Safety (2011). Health Survey Northern
Ireland: First Results from the 2010/11 Survey. Department of Health, Social Services and
Public Safety, Belfast, UK.
Ferrini, S., & Scarpa, R. (2007). Designs with a priori information for non market valuation
with choice experiments: a Monte Carlo study. Journal of Environmental Economics and
Management, 53: 342–363.
Fit Futures (2006). Investing for Health. Department of Health, Social Services and Public
Safety, Ref 126/2005.
Food Standard Agency (2002). McCance and Widdowson’s The Composition of foods Sixth
Summary edition. Cambridge: Royal Society of Chemistry.
Foresight (2007). Tackling Obesities: Future Choices. Project Report October 2007,
Department of Innovation Universities and Skills, DIUS/PUB8654/2K/12/07/AR.
Furst, T., Connors, M., Bisogni, C. A., Sobal, J., & Winter Falk, L. (1996). Food choice: a
conceptual model of the process, Appetite 26: 247–265.
Hippisley-Cox, J., Coupland, C., Vinogradova, Y., Robson, J., May, M. & Brindle, P.
(2007). Derivation and validation of QRISK, a new cardiovascular disease risk score for the
United Kingdom: prospective open cohort study. BMJ 335(7611):332-336.
Hughes, J., Kee, F., Bennett, K., O'Flaherty, M., Critchley, J, & Capewell, S. (2010).
Explaining the decline in coronary heart disease mortality in Northern Ireland between 1987
and 2007. Journal of Epidemiological Community Health 64:A34-A35.
Irish University Nutrition Alliance (2001). North/South Ireland food consumption survey.
Food Safety Promotion Board, Abbey Court, lower Abbey Street, Dublin 1.
Joyce, T., Wallace, A. J., McCarthy, S. N., & Gibney, M. J. (2007). Intakes of total fat,
saturated, monounsaturated and polyunsaturated fatty acids in Irish children, teenagers and
adults. Public Health Nutrition: 12(2):156–165.
Kish, L. (1949). A procedure for objective respondent selection within the household.
Journal of the American Statistical Association, 44(247): 380–387.
Krupnick, A., Alberini, A., Maureen, C., Simon, N., O’Brien, N., Goeree, R., & Heintzelman,
M. (2002). Age, Health and the Willingness to Pay for Mortality Risk Reductions: A
Contingent Valuation Survey of Ontario Residents. The Journal of Risk and Uncertainty,
24(2):161–186.
Lakdawalla, D., & Philipson, T. (2009). The growth of obesity and technological change.
Economics and Human Biology, 7:283-293.
Lancaster, K. J. (1966). A new approach to consumer theory. Journal of Political Economy,
74:132–157.
Lancsar, E., & Savage, E. (2004). Deriving welfare measures from discrete choice
experiments: a response to Ryan and Santos Silva. Health Economics, 13 (9).
Lobba, A. E., Mazzocchi, M., & Trailla, W.B. (2007). Modelling risk perception and trust in
food safety information within the theory of planned behaviour. Food Quality and
Preference, 18(2): 384–395.
Louviere, J. J. (2006). What You Don’t Know Might Hurt You: Some Unresolved Issues in
the Design and Analysis of Discrete Choice Experiments. Environmental and Resource
Economics, 34:173-188.
Louviere, J. J., Hensher, D., & Swait, J. (2000). Stated Choice Methods: Analysis and
Application. Cambridge University Press, Cambridge, UK.
Louviere, J. J., Street, D., Carson, R., Ainslie, A., DeShazo, J. R., Cameron, T., Hensher, D.,
Kohn, R., & Marley, A. A. T. (2002). Dissecting the Random Component of Utility.
Marketing Letters, 13(3):177-193.
Louviere, J. J., Train, K., Ben-Akiva, M., Bhat, C., Brownstone, D., Cameron, T. A., Carson,
R. T. , DeShazo, J. R., Fiebig, D., Greene, W., Hensher, D., & Waldman, D. (2006). Recent
Progress on Endogeneity in Choice Modelling, Marketing Letters, 16:3-4.
McFadden, D. L. (1974). Conditional logit analysis of qualitative choice behavior. In P.
Zrembka (ed.), Frontiers in Econometrics. New York: Academic Press.
McHorney, C. A., War, J. E., Lu, J. F. R., & Sherbourne, C. D. (1994). The MOS 36-Item
Short-Form Health Survey (SF-36): III. Tests of Data Quality, Scaling Assumptions, and
Reliability across Diverse Patient Groups. Medical Care , 32(1):40-66.
Mente, A., de Koning, L., Shannon, H. S., & Anand, S. S. (2009). A systematic review of the
evidence supporting a causal link between dietary factors and coronary heart disease. JAMA
Internal Medicine, 169(7):659-69.
Müller-Riemenschneider, F., Reinhold, T., Berghöfer, A., & Willich, S. N (2007). Health-
economic burden of obesity in Europe. European Journal of Epidemiology, 23(8): 499-509.
Northern Ireland Health and Social Wellbeing Survey in 2005/06. Available at
http://www.csu.nisra.gov.uk/survey.asp5.htm.
Ortúzar, J. de D., & Willumsen, L. G. (2001). Modelling Transport. Chichester: John Wiley
& Sons.
Rigby, D., & Burton, M. (2005). Preference heterogeneity and GM food in the UK. European
Review of Agricultural Economics, 32(2):269–288.
Rigby, D., & Burton, M. (2006) Modeling Disinterest and Dislike: A Bounded Bayesian
Mixed Logit Model of the UK Market for GM Food. Environmental & Resource Economics.
33: 485–509.
Ryan, M., & Gerard, K., (2012). Discrete choice experiments in health economics: a review
of the literature. Health Economics, 21(2):145-172.
Ryan, M., Gerard, K., & Amaya, M. (2008). Using Discrete Choice to Value Health and
Health Care. Springer: Berlin.
Scarpa, R., Campbell, D., & Hutchinson, W.G. (2007). Benefit transfer for landscape
improvements: sequential bayesian design and respondent’s rationality in a choice
experiment, Land Economics 83:617–634.
Scarpa, R., Thiene, M., & Hensher, D. (2012). Preferences for tap water attributes within
couples: An exploration of alternative mixed logit parameterisations. Water Resource
Research, 48(W01520):1-11.
Scarpa, R., Thiene, M., & Train, K. E. (2008). Utility in willingness to pay space: a tool to
address confounding random scale effects in destination choice to the alps. American Journal
of Agricultural Economics, 90(4)994–1010.
Swait, J., & Louviere, J. J. (1993). The Role of the Scale Parameter in the Estimation and
Comparison of Multinomial Logit Models. Journal of Marketing Research, 30:305-314.
Thiene, M., & Scarpa, R. (2010). An empirical investigation of individual wtps within
couples under scale and taste heterogeneity: the case of household water. World Congress of
Environmental and Resource Economists, 28 June - 2 July.
Train, K. E. (1998). Recreation demand models with taste differences over people. Land
Economics, 74:230–239.
Train, K. E. (2009). Discrete Choice Methods with Simulation. Cambridge University Press:
Cambridge.
Train, K. E., & Weeks, M. (2005) Discrete choice models in preference space and willingness
to pay space. In Scarpa, R., & Alberini, A. (Eds.), Applications of Simulation Methods in
Environmental and Resource Economics, pp.1-16, Springer, Dordrecht, The Netherlands.
Van Rijswijk, W., & Frewer, L. J. (2008) Consumer perceptions of food quality and safety
and their relation to traceability. British Food Journal, 110(10): 1034-1046.
World Health Organization (2001). Obesity: Preventing and managing the global epidemic.
Report on a WHO Consultation, Technical report series, no. 894, World Health Organization.
World Health Organization (2011). Obesity and overweight fact sheet N° 311. March, World
Health Organization, http://www.who.int/mediacentre/factsheets/fs311/en/index.html.

Figure 1: Example of question in the eating habits part of the questionnaire
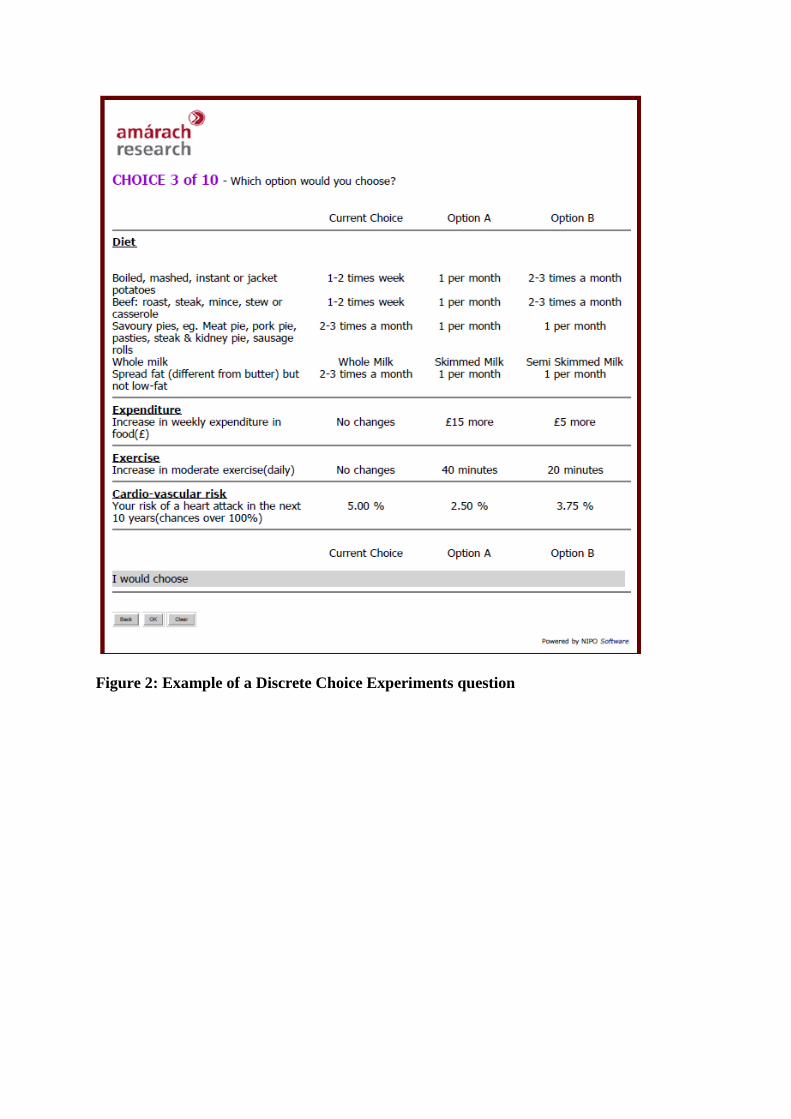
Figure 2: Example of a Discrete Choice Experiments question
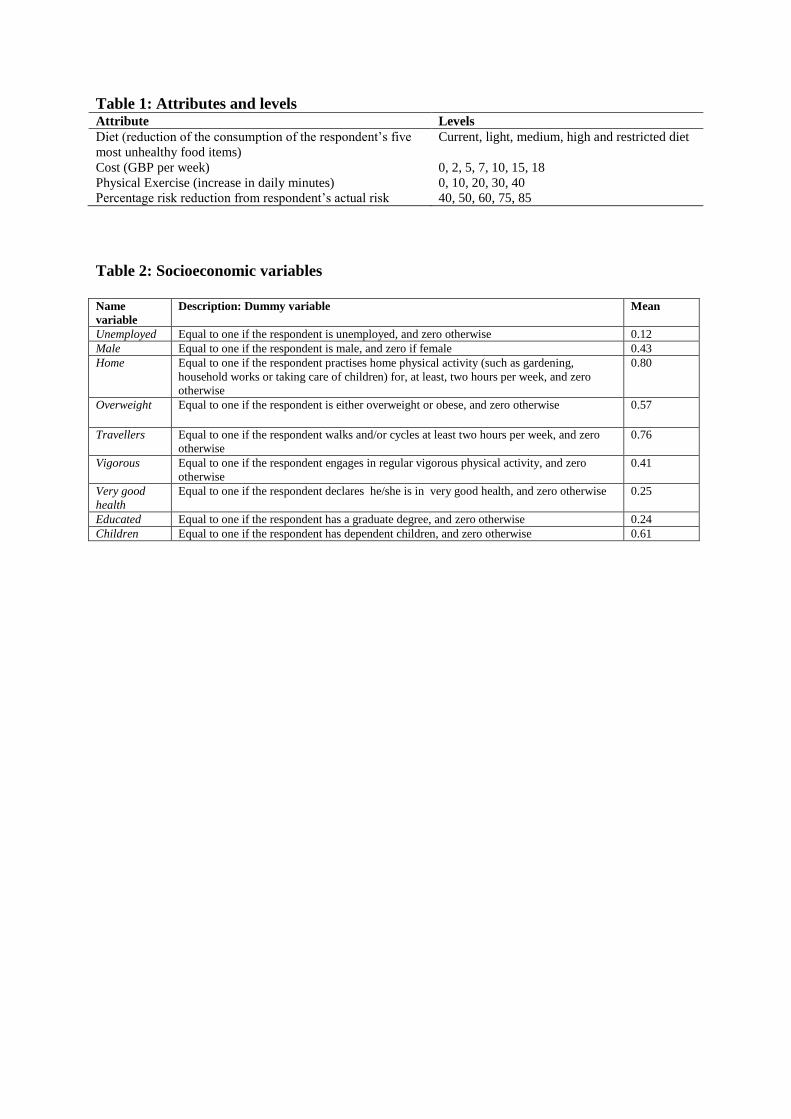
Table 1: Attributes and levels Attribute Levels
Diet (reduction of the consumption of the respondent’s five
most unhealthy food items)
Current, light, medium, high and restricted diet
Cost (GBP per week) 0, 2, 5, 7, 10, 15, 18
Physical Exercise (increase in daily minutes) 0, 10, 20, 30, 40
Percentage risk reduction from respondent’s actual risk 40, 50, 60, 75, 85
Table 2: Socioeconomic variables
Name
variable
Description: Dummy variable Mean
Unemployed Equal to one if the respondent is unemployed, and zero otherwise 0.12
Male Equal to one if the respondent is male, and zero if female 0.43
Home Equal to one if the respondent practises home physical activity (such as gardening,
household works or taking care of children) for, at least, two hours per week, and zero
otherwise
0.80
Overweight Equal to one if the respondent is either overweight or obese, and zero otherwise 0.57
Travellers Equal to one if the respondent walks and/or cycles at least two hours per week, and zero
otherwise
0.76
Vigorous Equal to one if the respondent engages in regular vigorous physical activity, and zero
otherwise
0.41
Very good
health
Equal to one if the respondent declares he/she is in very good health, and zero otherwise 0.25
Educated Equal to one if the respondent has a graduate degree, and zero otherwise 0.24
Children Equal to one if the respondent has dependent children, and zero otherwise 0.61
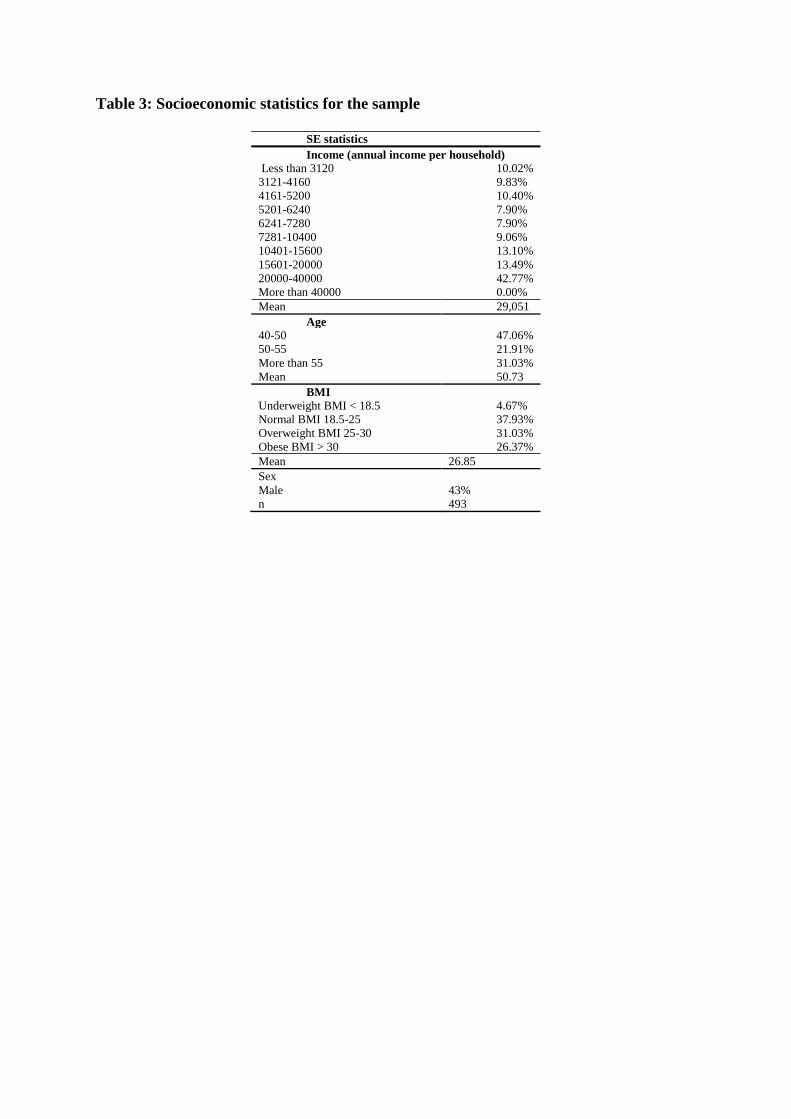
Table 3: Socioeconomic statistics for the sample
SE statistics
Income (annual income per household)
Less than 3120 10.02%
3121-4160 9.83%
4161-5200 10.40%
5201-6240 7.90%
6241-7280 7.90%
7281-10400 9.06%
10401-15600 13.10%
15601-20000 13.49%
20000-40000 42.77%
More than 40000 0.00%
Mean 29,051
Age
40-50 47.06%
50-55 21.91%
More than 55 31.03%
Mean 50.73
BMI
Underweight BMI < 18.5 4.67%
Normal BMI 18.5-25 37.93%
Overweight BMI 25-30 31.03%
Obese BMI > 30 26.37%
Mean 26.85
Sex
Male 43%
n 493
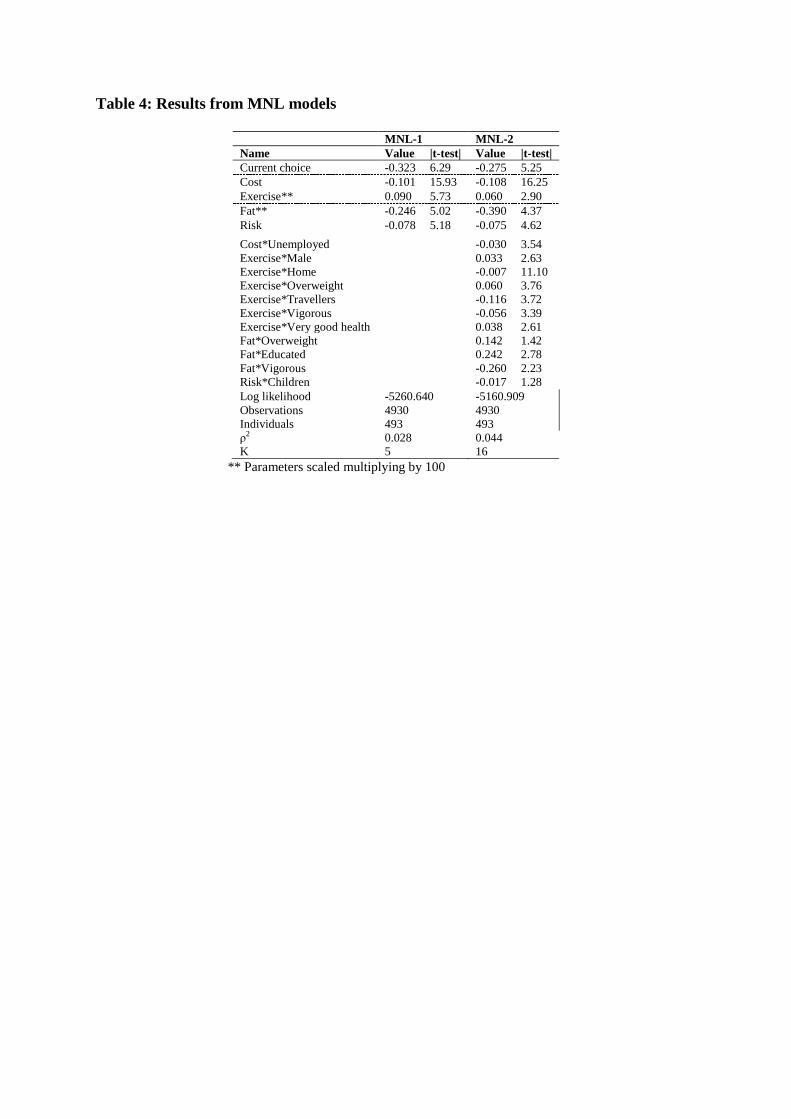
Table 4: Results from MNL models
MNL-1 MNL-2
Name Value |t-test| Value |t-test|
Current choice -0.323 6.29 -0.275 5.25
Cost -0.101 15.93 -0.108 16.25
Exercise** 0.090 5.73 0.060 2.90
Fat** -0.246 5.02 -0.390 4.37
Risk -0.078 5.18 -0.075 4.62
Cost*Unemployed -0.030 3.54
Exercise*Male 0.033 2.63
Exercise*Home -0.007 11.10
Exercise*Overweight 0.060 3.76
Exercise*Travellers -0.116 3.72
Exercise*Vigorous -0.056 3.39
Exercise*Very good health 0.038 2.61
Fat*Overweight 0.142 1.42
Fat*Educated 0.242 2.78
Fat*Vigorous -0.260 2.23
Risk*Children -0.017 1.28
Log likelihood -5260.640 -5160.909
Observations 4930 4930
Individuals 493 493
ρ2 0.028 0.044
K 5 16
** Parameters scaled multiplying by 100
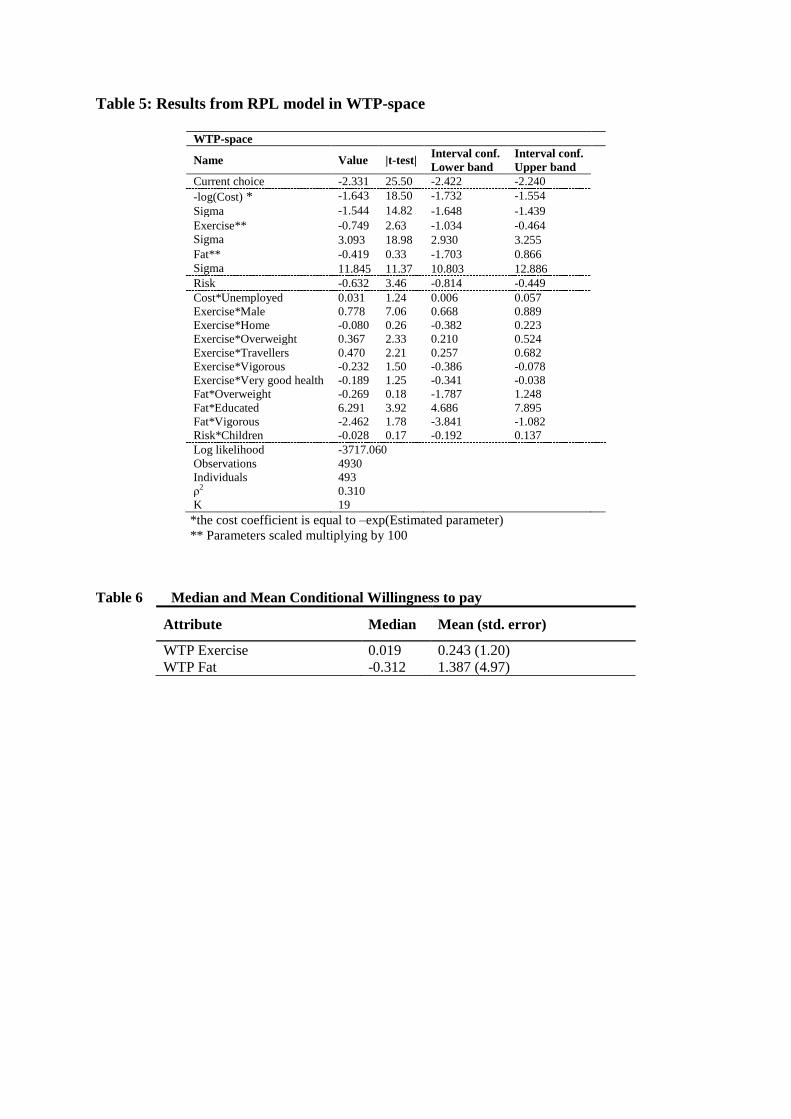
Table 5: Results from RPL model in WTP-space
WTP-space
Name Value |t-test| Interval conf.
Lower band
Interval conf.
Upper band
Current choice -2.331 25.50 -2.422 -2.240
-log(Cost) *
Sigma
-1.643 18.50 -1.732 -1.554
-1.544 14.82 -1.648 -1.439
Exercise**
Sigma
-0.749 2.63 -1.034 -0.464
3.093 18.98 2.930 3.255
Fat**
Sigma
-0.419 0.33 -1.703 0.866
11.845 11.37 10.803 12.886
Risk -0.632 3.46 -0.814 -0.449
Cost*Unemployed 0.031 1.24 0.006 0.057
Exercise*Male 0.778 7.06 0.668 0.889
Exercise*Home -0.080 0.26 -0.382 0.223
Exercise*Overweight 0.367 2.33 0.210 0.524
Exercise*Travellers 0.470 2.21 0.257 0.682
Exercise*Vigorous -0.232 1.50 -0.386 -0.078
Exercise*Very good health -0.189 1.25 -0.341 -0.038
Fat*Overweight -0.269 0.18 -1.787 1.248
Fat*Educated 6.291 3.92 4.686 7.895
Fat*Vigorous -2.462 1.78 -3.841 -1.082
Risk*Children -0.028 0.17 -0.192 0.137
Log likelihood -3717.060
Observations 4930
Individuals 493
ρ2 0.310
K 19
*the cost coefficient is equal to –exp(Estimated parameter)
** Parameters scaled multiplying by 100
Table 6 Median and Mean Conditional Willingness to pay
Attribute Median Mean (std. error)
WTP Exercise 0.019 0.243 (1.20)
WTP Fat -0.312 1.387 (4.97)