trading off dietary choices, physical exercise and...
TRANSCRIPT

J.M. Grisolía, A. Longo and G. Hutchinson Diet Choices and Health Risks
1
Trading off dietary choices, physical exercise and cardiovascular disease risks
José M. Grisolía * + ×
Alberto Longo + ×
George Hutchinson + ×
Frank Kee y x
* Department of Applied Economic Analysis, Universidad de Las Palmas de Gran Canaria.
+ Gibson Institute for Land, Food and Environment, School of Biological Sciences, Queen’s University,
Belfast.
y Queen's School of Medicine, Dentistry and Biomedical Sciences, Queen’s University, Belfast.
× RCUK Centre of Excellence for Public Health (NI)
Abstract
This paper analyses how individuals trade-off health risks against lifestyle choices. The
work uses a choice experiment (CE) survey for a representative sample of the Northern
Ireland population. Unlike most CE studies for valuing public health programs, this
questionnaire uses a tailored exercise based on the individuals’ baseline choices. A fat
screener links actual cardiovascular diseases (CVD) risk to each specific choice set in terms
of diet. Individuals are informed about their real status quo risk of a fatal cardiovascular
event, based on an initial set of health questions. Thus, actual risks, real diet and exercise
choices are the elements that constitute the choice task. Our results show that our
respondents are willing to pay for reducing mortality risk and, more importantly, are willing
to change physical exercise and dietary behaviours. In particular, subjects with Body Mass
Index (BMI) in the range of overweight or obese seem more inclined to practise physical
exercise than to modify their diet to reduce their CVD risks.
1. Introduction
Obesity and overweight have become a growing problem affecting most of Western societies.
According to the World Health Organization (WHO), in 2008 there were about 1.5 billion
overweight adults; this figure is increasing dramatically due to the sedentary lifestyle and
worsening eating habits with high-caloric diets (WHO, 2011). In Northern Ireland almost
70% of adults are either overweight or obese and this figure is growing according to the
Public Health Agency.1 This epidemic has become an economic burden (Muller, 2007), as
well as a major health problem, as it increases the risk of type 2 diabetes, cancer and
cardiovascular diseases (CVD). As a result, governments and public agencies are diverting a
considerable amount of resources to prevent obesity and promote healthy lifestyles (WHO,
2001; Fit Futures, 2006; Foresight Report, 2007; DHSSPS, 2010).
1 http://www.healthpromotionagency.org.uk/work/Publicrelations/PressReleases/obesity.htm

J.M. Grisolía, A. Longo and G. Hutchinson Diet Choices and Health Risks
2
In this context it is relevant to explore strategies that help people to choose healthier lifestyles
and to estimate people’s willingness to pay for improvements in their health and reduction in
illnesses related to obesity. This will help to allocate public resources more efficiently and
provide insights into public health programs aimed at changing people’s eating and exercise
behaviour.
A choice experiments (CE) survey is the appropriate framework to analyse individuals’ stated
behaviour in response to a broad range of hypothetical choices (Ben Akiva and Lerman,
1985; Louviere et al, 2000; Train, 2003; Carlsson and Martinsson, 2003; Ryan et al, 2008).
CE allow researchers to analyse to what extent, and under what conditions, individuals are
willing to change their unhealthy lifestyles for healthier ones. This health improvement is
presented here in terms of a reduction of the risk of suffering from CVD, which are among
the most serious obesity-related health issues. We analyse this problem in terms of risk
because when individuals choose a particular lifestyle, characterized by dietary habits and
amounts of physical activity, they incur risks to their health in the long run. In fact, it is a case
of risk when choices can lead to consequences that cannot be measured with certainty, as in
this case.
Food choices and risk have been analysed with respect to genetically modified food (Rigby
and Burton, 2005; 2006) traceability (Van Rijswjk and Frewer, 2008) and food safety (Lobba
et al, 2007). Most of these works are based on one single choice or a set of single choices.
Conversely, in our study, we are setting a more realistic framework of dietary choices, which
implies a series of regular choices over many years. In addition, we are not asking the
respondent to choose between artificial scenarios that might be distant to his/her own food
choices and amount of physical activity. We tailor our CE questions using individuals’ actual
diet, level of physical activity and CVD risk they face.
Dietary choices are based on habit but are the result of a trade-off between taste (sensory
perceptions), health and cost, among other attributes, attitudes, values and beliefs (Furst,
Connors, Bisogni, Sobal, and Falk, 1996). On the one hand, the problem that we are
addressing here, cardiovascular diseases, is known to be highly correlated with high levels of
cholesterol in a subject’s blood (Mente et al 2009). Part of this cholesterol comes from excess
of saturated fat intake from diet. At the same time, the presence of fat is extremely correlated
with taste in food. On the other hand, a sedentary lifestyle is also highly correlated with high
levels of cholesterol (Lakdawalla and Philipson, 2009, Auchincloss et al, 2009). Despite its
well-known benefits, the majority of people in the UK do not engage in regular physical
activity. Physical activity levels are on the decline in Northern Ireland (NI), with 23% of the
population currently classed as sedentary (Northern Ireland Health and Social Wellbeing
Survey 2005/06). Identification of patterns of physical activity interacting with dietary
choices is essential to plan Public Health strategies in this field.
In this paper, our CE asks a sample representative of the population of Northern Ireland to
choose between their current lifestyle, described in terms of their own dietary habits, levels of
physical activity and actual risk of suffering a fatal CVD in the next ten years, and other
hypothetical lifestyles described by different combinations of diet, exercise, risk of fatal CVD
in the next ten years, and cost. Cost is shown as increases from respondents’ current
expenditures. Diets are presented as reductions in the consumption frequency of the most
unhealthy (in terms of fat intake) food items consumed by respondents, whilst levels of
physical activity are described in terms of increments from respondents’ current levels.

J.M. Grisolía, A. Longo and G. Hutchinson Diet Choices and Health Risks
3
The remainder of the paper is structured as follows. Section two describes the economic
model of CE and the econometric models used in the analysis; section three gives an
overview of the questionnaire used to sample the population of Northern Ireland and also
reports the descriptive statistics of the sample; section four reports the results of the
econometric models; and section five concludes the paper with policy implications.
2. Theoretical background of Choice Experiments
In this section we briefly explain the Choice experiments (CE) method, which is based on the
idea that individuals make choices among alternatives by considering the characteristics of
the alternatives (Lancaster, 1966). When facing a set of J alternatives, individuals will pick
the one providing the highest utility. Discrete CE are grounded in random utility theory,
which states that individual’s choices produce certain utility, U, which contains a modelled
part, V, that can be measured in terms of the attributes of each alternative, and another part, ,
that cannot be observed by researchers and therefore it is considered a random term and
named the unmodelled part of the utility. Examples in health economics can be found in Ryan
et al. (2008), whilst a review of the literature of CE in health economics is presented in Ryan
and Gerard (2012).
By observing peoples’ choices, the modeller can estimate the weights attached to each
attribute; these, in turn, allow for the calculation of the willingness to pay (WTP) for
improving each of these characteristics. As shown in (1), the utility associated with option j
can be decomposed into V, the modelled component, and , the error component. The first
term can be expressed as the sum of the product of k attributes x multiplied by their weights
βk; these parameters are the ultimate object of the estimation process:
jkkjjjjjjj xxxVU ...22110 (1)
Assumptions made about the distribution of the random error component lead to different
types of model. The simplest one is the multinomial logit (MNL) model which is derived
assuming that errors are independent and identically distributed (IID) according to a Type 1
extreme value distribution. For a linear utility, it can be proven that the probability of
choosing alternative j among i alternatives in choice set C facing individual q is given by
(McFadden, 1974):
Ci
q
q
Ci
iqq
jqq
jqx
x
V
VP
)exp(
)exp(
)exp(
)exp( (2)
Where the parameters β are considered as not varying among the population, which implies
that there is no difference in individuals’ tastes (i.e. the weight or coefficient of price is the
same for all individuals); λ is an unidentifiable scale parameter (Walker, 2002) inversely
related to the unknown standard deviation of the error distribution.
Unlike the MNL, a Random Parameter Logit (RPL) model allows differences in tastes by
J.M. Grisolía, A. Longo and G. Hutchinson Diet Choices and Health Risks
4
assuming that the parameters βs are not fixed, but vary across respondents. This model may
be more realistic than the MNL as it allows for random variation in tastes. The common
formulation is that the βs differ in terms of taste intensity (Train, 1998), leading to the
following utility specification:
Uqj˜ qxqj qj (3)
Where the random taste parameters ˜ q depend on the values of the parameters θ of an
underlying “mixing distribution” f (β|θ). Researchers have to make assumptions on the
distributions of the random component. It is generally assumed that this part is distributed
following the normal, lognormal, or triangular distribution (see Train, 2003). In the case of
the RPL model, the probability of choosing alternative j for individual q is conditioned to a
particular value of β:
Pqj Pqj( )P( b) (4)
3. Questionnaire and data collection
3.1 Questionnaire
We used computer assisted personal interviews (CAPI) to administer a questionnaire which
was divided into five parts: health questions and physical activity questions, diet questions, a
risk tutorial, the CE questions, and socio-demographic questions. Unlike most stated
preference surveys, these CE questions were tailored and individually generated to take
account of each respondent’s current dietary choices, levels of physical activity and CVD
risk, thus making the experiment realistic to the subject.
We begun with general questions about health and asked details about health conditions
related to diabetes, smoking, arthritis, systolic blood pressure, cardiovascular diseases, family
history of cardiovascular diseases and individual’s weight and height.2 We then asked
questions about age, gender and postcode address. This medical information was then fed
into the QRISK1 prediction algorithm3 developed by the University of Nottingham for CVD
risk in the British population (Hippisley-Cox et al., 2008) to estimate respondents’ own CVD
risks. The outcome of the algorithm, in terms of percentage risk of having a heart attack or
stroke in the next ten years was then shown to respondents and later reported in the status quo
option in the CE questions.4 Physical activity questions were based on the version of the
International Physical Activity Questionnaire (IPAQ) (Craig et al, 2003) used by the National
Health Service of the UK which includes five questions that elicit respondents’ engagement
2 The health questions were adapted from the MOS SF 36 Health questionnaire (McHorney et al. 1994).
3 This algorithm can be implemented through a special program under a licence and is available at
http://www.qrisk.org/. 4 Krupnick et al (2002) describe risk in terms of 10
3 since changes in risk for air pollution are small. We tried to
use this measure, but when piloting the questionnaire we found that respondents felt confused. Therefore we decided to keep the 100 per cent base.

J.M. Grisolía, A. Longo and G. Hutchinson Diet Choices and Health Risks
5
with very moderate activities (household, gardening, shopping), moderate exercises (walking,
cycling) and vigorous physical activities (gym, swimming, jogging, aerobic, etc).
In order to ask people their willingness to modify their diet in exchange for health
improvements it was necessary to obtain information about respondents’ current eating
habits. This is a complex task that usually involves asking respondents to report a diary of
their food intake during one week.5 As this task would have been very lengthy and not
compatible with an in-person interview, we only focused on eliciting respondents’
consumption of food items with a high fat content, as these items could lead to high levels of
blood cholesterol and, therefore, likely to contribute to CVD. We followed the Block
Questionnaire (Block, 2000), a tool developed in the nutritional literature, that offers a rapid
snapshot of an individual’s levels of fat intake through questions about the frequency and the
portion size of eating 17 selected items. We adapted the Block Questionnaire to the Irish diet
considering the main sources of fat (Joyce et al, 2007), by selecting 17 fatty items often found
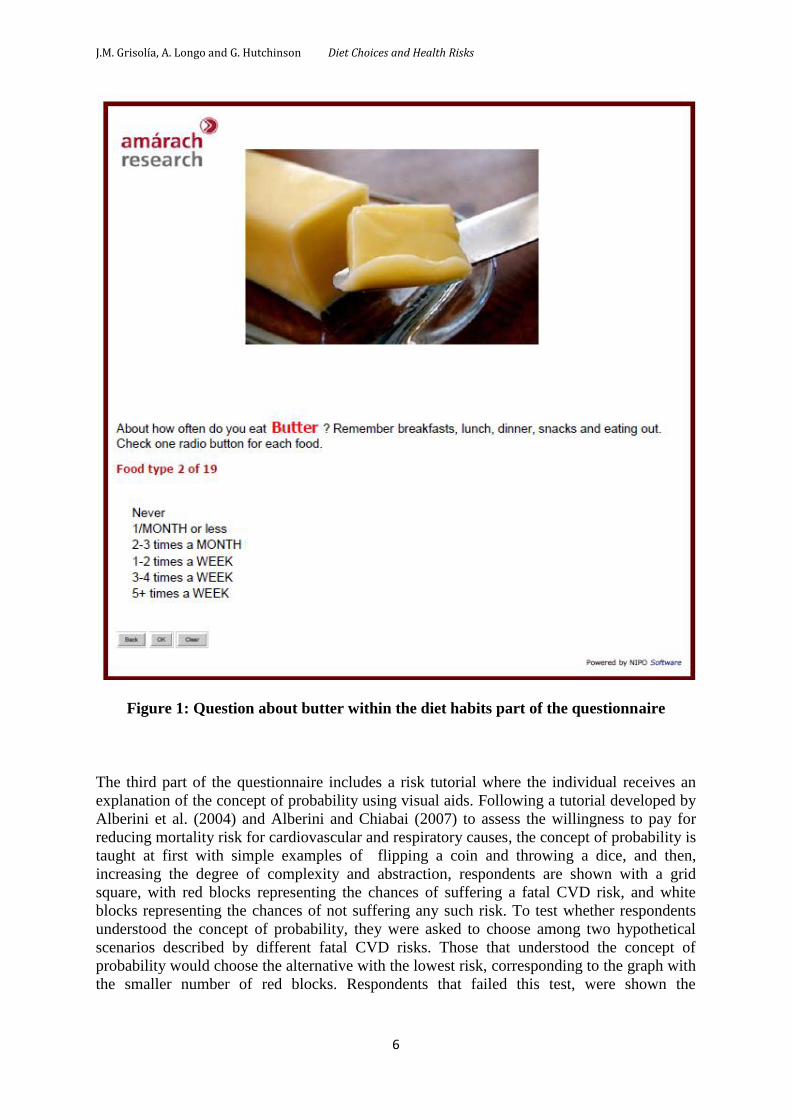
in the Northern Irish diet.6 Subjects in the sample were asked the frequency of consumption
of these items from ‘never’ to ‘five or more times a week.’ Each item was presented in a
separate screen (see Figure 1). After the frequency, individuals were asked about portion
sizes and cooking styles. We would later use the answer to the Block Questionnaire to build
the ‘diet’ attribute for the CE questions, as described below.
5 Irish University Nutrition Alliance (2001). North/South Ireland food consumption survey Published by: Food
Safety Promotion Board, Dublin. 6 The seventeen items are: 1. Salad dressings (not low-fat); 2. Chicken or other poultry (eg. Turkey); 3. Beef:
roast, steak, mince, stew or casserole; 4. Corned beef, Spam, luncheon meats; 5. Boiled, mashed, instant or jacket potatoes; 6. Chips and savoury snacks; 7. Cheese; 8. Pork: roast, chops, stew or slices; 9. Beefburgers; 10. Butter; 11. Savoury pies, eg. Meat pie, pork pie, pasties, steak & kidney pie, sausage rolls; 12. Roast potatoes; 13. Biscuits, pastries and cakes (not low-fat); 14. Bacon; 15. Sausages; 16. Potato salad; 17. Whole milk.
J.M. Grisolía, A. Longo and G. Hutchinson Diet Choices and Health Risks
6
Figure 1: Question about butter within the diet habits part of the questionnaire
The third part of the questionnaire includes a risk tutorial where the individual receives an
explanation of the concept of probability using visual aids. Following a tutorial developed by
Alberini et al. (2004) and Alberini and Chiabai (2007) to assess the willingness to pay for
reducing mortality risk for cardiovascular and respiratory causes, the concept of probability is
taught at first with simple examples of flipping a coin and throwing a dice, and then,
increasing the degree of complexity and abstraction, respondents are shown with a grid
square, with red blocks representing the chances of suffering a fatal CVD risk, and white
blocks representing the chances of not suffering any such risk. To test whether respondents
understood the concept of probability, they were asked to choose among two hypothetical
scenarios described by different fatal CVD risks. Those that understood the concept of
probability would choose the alternative with the lowest risk, corresponding to the graph with
the smaller number of red blocks. Respondents that failed this test, were shown the
J.M. Grisolía, A. Longo and G. Hutchinson Diet Choices and Health Risks
7
probability tutorial once more until they grasped the concept. This tutorial and its test support
the internal validity of the questionnaire in terms of valuation of risk reduction.
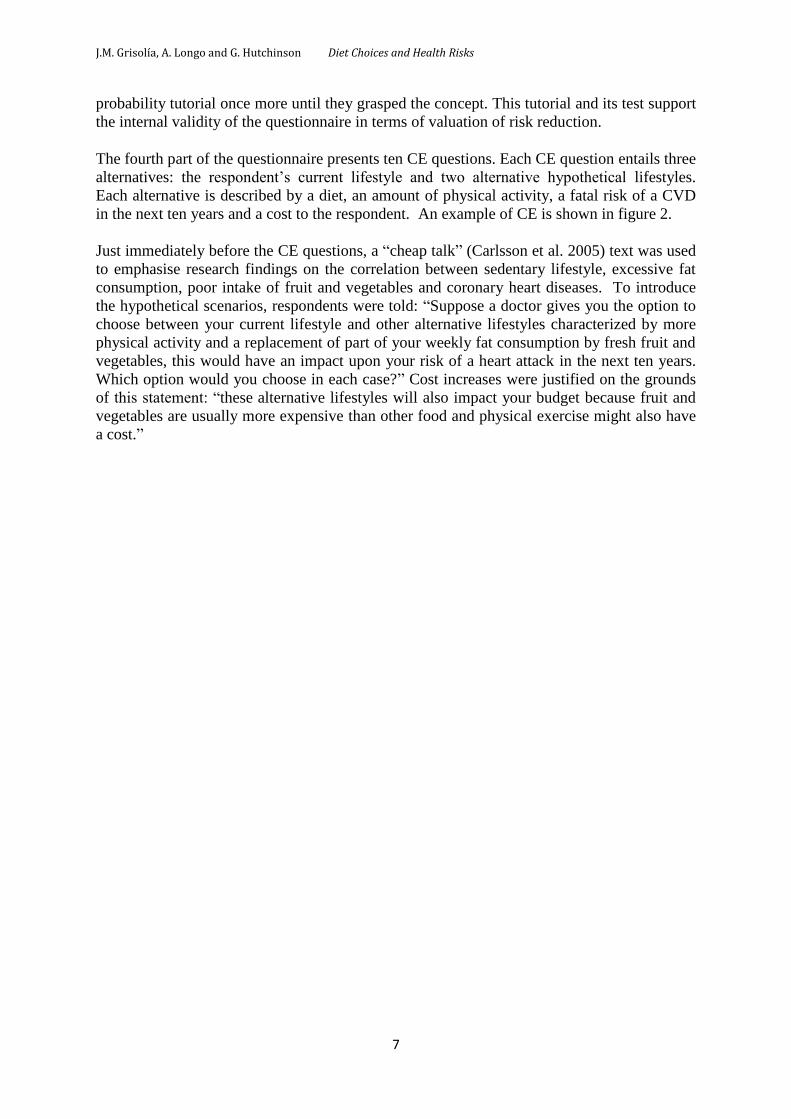
The fourth part of the questionnaire presents ten CE questions. Each CE question entails three
alternatives: the respondent’s current lifestyle and two alternative hypothetical lifestyles.
Each alternative is described by a diet, an amount of physical activity, a fatal risk of a CVD
in the next ten years and a cost to the respondent. An example of CE is shown in figure 2.
Just immediately before the CE questions, a “cheap talk” (Carlsson et al. 2005) text was used
to emphasise research findings on the correlation between sedentary lifestyle, excessive fat
consumption, poor intake of fruit and vegetables and coronary heart diseases. To introduce
the hypothetical scenarios, respondents were told: “Suppose a doctor gives you the option to
choose between your current lifestyle and other alternative lifestyles characterized by more
physical activity and a replacement of part of your weekly fat consumption by fresh fruit and
vegetables, this would have an impact upon your risk of a heart attack in the next ten years.
Which option would you choose in each case?” Cost increases were justified on the grounds
of this statement: “these alternative lifestyles will also impact your budget because fruit and
vegetables are usually more expensive than other food and physical exercise might also have
a cost.”
J.M. Grisolía, A. Longo and G. Hutchinson Diet Choices and Health Risks
8
Figure 3: Example of a choice card
The final part of the questionnaire asked a set of follow-up Likert scale questions to measure
attitudes, perceptions and beliefs about the individuals’ health, and concluded eliciting
respondents’ socio-demographic characteristics.
3.2 Attributes and levels
Hughes et al, (2010), in explaining the determinants of coronary heart diseases in Northern
Ireland, highlight that “obesity and physical inactivity are of major concern. More aggressive
policies to promote healthy food and increase physical activity may therefore be needed to
decrease future coronary heart disease deaths.” We therefore decided to study these two
attributes, diet and physical activity, because of their importance in terms of health policy and
their simplicity to explain to respondents. This approach allowed us to develop individually
tailored CE questions without creating much complicated tasks. In addition, it allowed us to
present respondents with credible scenarios of health improvements driven by changes in
dietary patterns and levels of physical activity. Physical exercise was defined as minutes
spent in a moderate physical exercise per day. The levels of this attribute were: the current

J.M. Grisolía, A. Longo and G. Hutchinson Diet Choices and Health Risks
9
level of physical activity, and increases by 10, 20, 30, or 40 minutes per day compared to the
current level. The CVD risk was defined as the probability of a fatal risk of a heart attack in
the next ten years. The level for the current life style was the one resulting from the QRISK1
prediction algorithm. The levels for the other alternative scenarios were calculated as a
reduction in such a risk by 40%, 50%, 60%, 75% and 85%. Therefore, for a respondent
whose current risk was equal to 5%, a 50% reduction would result in a risk of 2.5%. Cost was
described as an increase in the money spent on food and physical exercise per week. The
levels for this attribute were defined in focus groups where we had asked a contingent
valuation question to elicit focus groups participants’ willingness to pay per week for a
medicine that reduces their risk of suffering a heart attack in the next ten years. From this
initial point we set different price levels for healthier lifestyle choices.
The diet attribute was the most complex to define. In focus groups we ruled out the idea of
using a hypothetical food basket described in terms of an abstract nutritional content, as such
description would not well convey the information of the ‘taste’ of food and the ‘sacrifice’
resulting from reducing the consumption of favourite food products and from increasing the
consumption of fruit and vegetables. We also discarded the possibility of using flagship
unhealthy food items, such as pizza, chicken curry, fish and chips, or Irish Breakfast, as they
might not have been relevant to all respondents, making the CE not credible, hence seriously
questioning the incentive compatibility of the survey instrument. Therefore, we decided to
use the information collected in the second part of the questionnaire from the Block
Questionnaire. For each respondent, we selected the five food items mostly and most
frequently consumed.7 This information was presented to respondents under the current
choice. The alternative hypothetical scenarios were described in terms of reduction in the
consumption of these five items and an increase in food and vegetables. We selected four
levels for the diet attribute defined in terms of overall fat content. Considering the current diet
as the reference value, we defined light, medium, high and restricted diets, corresponding to
reductions in fat intake by 10% (light), between 20% and 30% (medium), between 40% and
50% (high) and between 60% and 75% (restricted) from the current diet respectively. This
approach allowed us to compare diets across respondents and build a variable expressed in
terms of reduction of grams of fat from the current diet.8 Table 1 shows the attributes and
their levels used in this CE.
7 In five focus groups we found that individuals were able to answer choice experiments questions described
by five food items, and were struggling when additional food items were included. The CAPI we designed automatically selected the five items from the Block Questionnaire that were mostly and most frequently consumed by each respondent and used these five items to build the CE questions. 8 We are aware that this approach may lead to a researcher bias, as in our econometric model we assume that
respondents trade off grams of fat when choosing different life styles. However, we are unaware of a more efficient approach to investigate comparable dietary choices across respondents in a tractable way for a CE survey. Our approach leads to comparable choices, and choices meaningful to respondents. In focus groups we tried adding the information of ‘grams of fat’, but this information appeared to convey a wrong message, as respondents would only grasp the unhealthy message conveyed by ‘grams of fat’ and were unable to consider the ‘taste’ and ‘sacrifice’ elements of reducing the consumption of their favourite food items.
J.M. Grisolía, A. Longo and G. Hutchinson Diet Choices and Health Risks
10
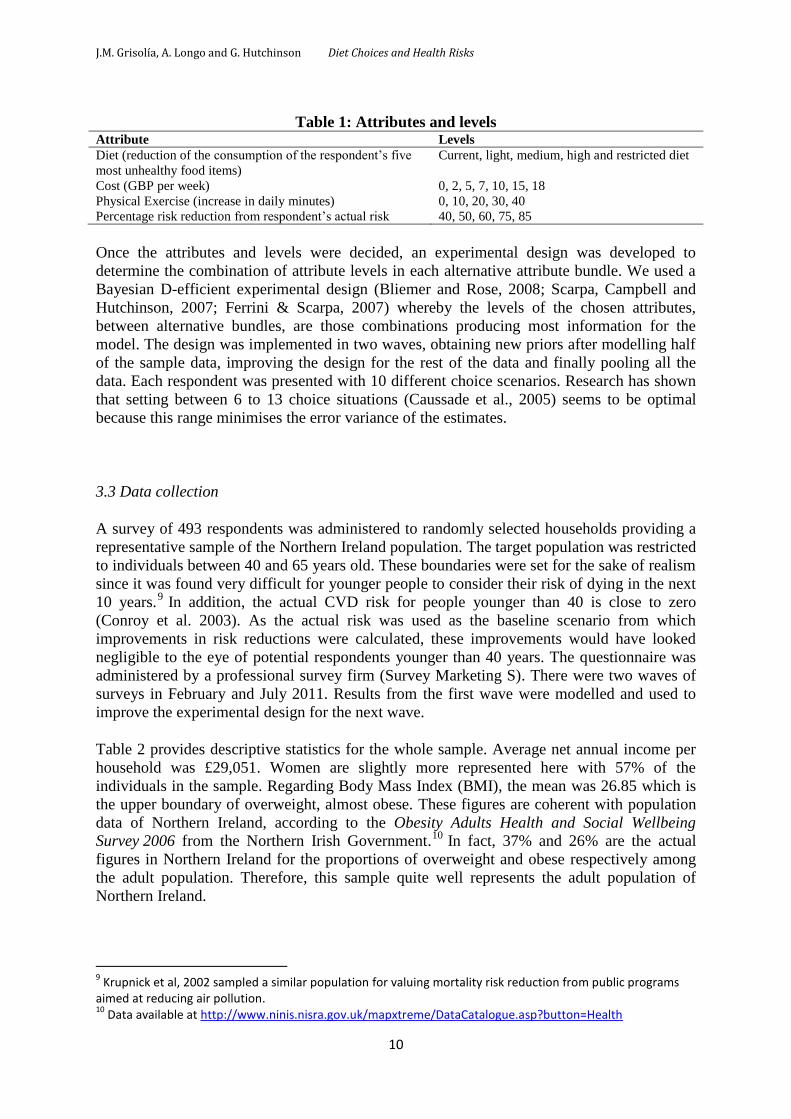
Table 1: Attributes and levels Attribute Levels
Diet (reduction of the consumption of the respondent’s five
most unhealthy food items)
Current, light, medium, high and restricted diet
Cost (GBP per week) 0, 2, 5, 7, 10, 15, 18
Physical Exercise (increase in daily minutes) 0, 10, 20, 30, 40
Percentage risk reduction from respondent’s actual risk 40, 50, 60, 75, 85
Once the attributes and levels were decided, an experimental design was developed to
determine the combination of attribute levels in each alternative attribute bundle. We used a
Bayesian D-efficient experimental design (Bliemer and Rose, 2008; Scarpa, Campbell and
Hutchinson, 2007; Ferrini & Scarpa, 2007) whereby the levels of the chosen attributes,
between alternative bundles, are those combinations producing most information for the
model. The design was implemented in two waves, obtaining new priors after modelling half
of the sample data, improving the design for the rest of the data and finally pooling all the
data. Each respondent was presented with 10 different choice scenarios. Research has shown
that setting between 6 to 13 choice situations (Caussade et al., 2005) seems to be optimal
because this range minimises the error variance of the estimates.
3.3 Data collection
A survey of 493 respondents was administered to randomly selected households providing a
representative sample of the Northern Ireland population. The target population was restricted
to individuals between 40 and 65 years old. These boundaries were set for the sake of realism
since it was found very difficult for younger people to consider their risk of dying in the next
10 years.9 In addition, the actual CVD risk for people younger than 40 is close to zero
(Conroy et al. 2003). As the actual risk was used as the baseline scenario from which
improvements in risk reductions were calculated, these improvements would have looked
negligible to the eye of potential respondents younger than 40 years. The questionnaire was
administered by a professional survey firm (Survey Marketing S). There were two waves of
surveys in February and July 2011. Results from the first wave were modelled and used to
improve the experimental design for the next wave.
Table 2 provides descriptive statistics for the whole sample. Average net annual income per
household was £29,051. Women are slightly more represented here with 57% of the
individuals in the sample. Regarding Body Mass Index (BMI), the mean was 26.85 which is
the upper boundary of overweight, almost obese. These figures are coherent with population
data of Northern Ireland, according to the Obesity Adults Health and Social Wellbeing
Survey 2006 from the Northern Irish Government.10
In fact, 37% and 26% are the actual
figures in Northern Ireland for the proportions of overweight and obese respectively among
the adult population. Therefore, this sample quite well represents the adult population of
Northern Ireland.
9 Krupnick et al, 2002 sampled a similar population for valuing mortality risk reduction from public programs
aimed at reducing air pollution. 10
Data available at http://www.ninis.nisra.gov.uk/mapxtreme/DataCatalogue.asp?button=Health

J.M. Grisolía, A. Longo and G. Hutchinson Diet Choices and Health Risks
11
Table 2: Socioeconomic statistics for the sample
SE statistics
Income (annual income per household)
Less than 3120 10.02%
3121-4160 9.83%
4161-5200 10.40%
5201-6240 7.90%
6241-7280 7.90%
7281-10400 9.06%
10401-15600 13.10%
15601-20000 13.49%
20000-40000 42.77%
More than 40000 0.00%
Mean 29,051
Age
40-50 47.06%
50-55 21.91%
More than 55 31.03%
Mean 50.73
BMI
Underweight BMI < 18.5 4.67%
Normal BMI 18.5-25 37.93%
Overweight BMI 25-30 31.03%
Obese BMI > 30 26.37%
Mean 26.85
Sex
Male 43%
n 493

J.M. Grisolía, A. Longo and G. Hutchinson Diet Choices and Health Risks
12
4. Results
4.1 Modelling
The econometric models use the variables Fat, Exercise, Cost and Risk. Fat represents the
sacrifice of following a diet in terms of grams of fat per week that the individual has to give
up. As we explained earlier, each individual faced a particular set of items and individual
specific diets. This information was then translated into grams of fat using the detailed study
of calories and fat provided by McCance and Widdowson (2002). Exercise in the CE data
analysis was translated into metabolic equivalent of task (MET) which is a unit that expresses
the amount of energy necessary to execute each type of physical activity per minute (see
Ainsworth et al., 1993). This variable was calculated considering the current level of physical
activity, using the answers to the IPAQ, and the different units of MET that each minute of
moderate, medium or vigorous exercise represent. Therefore, its coefficient represents the
contribution to utility of one additional unit of MET.11
Cost is the payment for changes in
lifestyle, justified in terms of increasing food costs of healthy diets, measured in GBP per
week. Risk is the risk of suffering a fatal event of CVD during the next ten years in 100 per
cent basis. In addition to a specification that includes only the attributes of the CE, we run
model specifications interacting the CE attributes with socio-economic dummy variables,
which are described in Table 3.
Table 3: Socioeconomic variables
Name
variable
Description: Dummy variable Mean (sd)
Unemployed Equal to one if the respondent is unemployed, and zero otherwise 0.12 (0.33)
Male Equal to one if the respondent is male, and zero if female 0.43 (0.49)
Home Equal to one if the respondent practises home physical activity (such as gardening,
household works or taking care of children) for, at least, two hours per week, and zero
otherwise
0.80 (0.39)
Overweight Equal to one if the respondent is either overweight or obese, and zero otherwise 0.31 (0.46)
Travellers Equal to one if the respondent walks and/or cycles at least two hours per week, and zero
otherwise
0.76 (0.52)
Vigorous Equal to one if the respondent engages is regular vigorous physical activity, and zero
otherwise
0.41 (0.36)
Very good
health
Equal to one if the respondent declares he/she is in very good health, and zero otherwise 0.25 (0.42)
Educated Dummy variable equal to one if the respondent has a graduate degree, and zero otherwise 0.24 (0.42)
Children Dummy variable equal to one if the respondent has dependent children, and zero otherwise 0.61 (1.07)
Table 4 displays the output of the estimated models. The first model is a simple MNL model
with the attributes and the current choice as explanatory variables. The output shows that all
parameters are highly statistically significant and have the expected signs. In general,
respondents like following a diet, as the parameter for ‘fat’ is positive. Reducing fat intake in
diet may therefore be seen as something positive for different reasons, including general
health improvements and aesthetic reasons. Individuals are, on the other hand, unhappy with
their current choice (current choice) and would prefer to change life style. The parameter on
exercise is positive, which means that individuals in the sample consider physical activity as
positively affecting utility. The coefficient estimate for risk is negative and significant,
suggesting that respondents shy away from alternatives with high risk of fatal CVD. To
11
Respondents saw minutes rather than MET but using one or the other does not affect modelling results. However, MET is more useful in terms of analysis and widely used in epidemiological studies. Using MET allows us to compare diet and exercise in terms of energy.

J.M. Grisolía, A. Longo and G. Hutchinson Diet Choices and Health Risks
13
investigate heterogeneity of preferences across respondents we add interaction terms between
socio-economic characteristics of the respondents and the attributes (MNL-2).
Table 4: Modelling results
MNL-1 MNL-2 RPL WTP
Name Value t-test Value t-test Value t-test Value t-test
Current choice -0.343 -6.80 -0.362 -6.96 -2.58 -18.24 -2.45 -25.34
Cost μ -0.0942 -15.24 -0.101 -15.66 -0.158 -10.22 -0.113 -15.57
σ 0.178 13.49 0.227 15.59
Exercise
µ 0.0207 5.78 0.000783 3.77 0.00301 8.33
σ 0.00341 10.20
µw 0.00302 2.29
σw 0.0113 9.37
Fat µ -0.00204 -4.21 0.00337 3.77 0.00346 2.02
σ 0.00307 1.59
µw 0.0596 4.77
σw 0.0441 5.21
Risk µ -0.0664 -4.47 -0.0635 -3.94 -3.16 -9.75
σ 5.24 21.58
µw -0.686 -5.20
σw 5.93 12.99
Cost*Unemployed -0.0303 -3.68 -0.714 -1.91 -0.0853 -3.10
Exercise*Male 0.000289 2.26
Exercise*Home -0.00230 -10.20 -0.00323 -4.21
Exercise*Overweight 0.000624 3.88
Exercise*Travellers -0.00106 -3.35
Exercise*Vigorous -0.000548 -3.35 -0.00133 -2.54
Exercise*Very good
health
0.000287 1.94
Fat*Overweight -0.00151 1.50
Fat*Educated -0.00155 1.76
Fat*Vigorous 0.00425 -3.59
Risk*Children -0.0194 -1.44
Log likelihood -5450.409 -5165.533 -3617.548 -3590.320 n 4930 4930 4930 4930
Individuals 493 493 493 493
ρ2 0.024 0.043 0.332 0.335
k 5 16 11 10
Firstly, we notice that unemployed respondents are more reluctant to pay, a result that shows
that our data are internally valid. More interesting is the interaction with fat, exercise and
risk. Heterogeneity in the fat parameter seems to be better explained by the socioeconomic
interactions, whereas for risk and price this variation is better captured in the random
parameter (RPL) model, as discussed below. Interaction with exercise accounts for most of
the systematic variability with six interaction terms being statistically significant at the 1%
level. There are both positive and negative interactions and, in some cases, these change the
effect of the main coefficient. The results show that males, overweight or obese respondents,
and interviewees that consider themselves to be in very good health are more likely to select
options that entail an increase in physical exercise compared to their current level. When we
look at the magnitude of the coefficients of these three interaction terms, we also notice that
being either overweight or obese is the major determinant in driving respondents to choose
programs that entail an increase in physical exercise. Therefore, we should consider that
people from this group will favour more exercise in order to improve their health. Finally,
those who declared themselves to be in a very good health also have a positive interaction
parameter with exercise, which is coherent with the expectation that these people are in a
better condition for undertaking physical activity.
J.M. Grisolía, A. Longo and G. Hutchinson Diet Choices and Health Risks
14
The other interaction terms with exercise and three other dummy variables capturing the
characteristics of physical exercise that the respondents do, Home, Travellers and Vigorous,
are all negative. These coefficients suggest that respondents that are already doing some
physical exercise are less willing to improve their amount of physical exercise. Alternatively,
these coefficient estimates can be interpreted suggesting that respondents that do not engage
in vigorous physical exercise, do not walk or cycle at least two hours per week, or do not
engage in homemaking activities such as gardening and taking care of children, are more
likely to choose alternatives that offer an increase in their amount of physical exercise. The
fat coefficient is, in general, positive which might reflect the desire of people to make their
eating habits healthier. To explore respondents’ heterogeneity of preferences for diet, we
interact fat with Overweight, Educated and Vigorous dummy variables. Respondents that are
overweight or obese do not appear to have different preferences in terms of diet from
respondents who are of normal weight or underweight, as the coefficient for the interaction
term fat*overweight is not statistically significant at the 10% level of significance.
Respondents that have completed a university degree appear to have a slight reluctance for a
low fat diet as the coefficient for the interaction term between Fat an Educated is negative,
but is statistically significantly different from zero only at the 10% significance level. Finally,
the last interaction term between Fat and Vigorous is positive and significant, indicating that
respondents who undertake vigorous physical activity would prefer a healthier diet.The last
interaction term, between risk and a dummy variable equal to one if respondents have
dependent children, is negative, but not statistically significant, suggesting that having
children does not make respondents more risk averse than respondents that do not have to
look after children.
The third model, a Random parameter logit (RPL) improves considerably the goodness of fit
of the previous two models, as can be seen by the improvement in the log likelihood function.
The RPL model uses random parameters for all coefficients, although for fat the spread
parameter σ is not statistically significant at the 10% significance level. We used normal
distributions for all random parameter except for risk which follow a lognormal distribution
in order to force its distribution in the negative range.12
The output shows large coefficient
estimates for the current choice and for risk, strengthening the results of the previous two
models: respondents would prefer to change their life style and would favour alternatives
with lower risks of fatal CVD. Random heterogeneity is captured by the random parameters.
Except for fat, all spread coefficients are statistically significant, suggesting that preferences
vary among respondents. For example, the results show that some respondents are not willing
to increase their time spent in physical exercise. When we further look at the effects of socio
economic variables, we confirm the findings from the MNL: our survey is internally valid,
respondents that engage in homework activities are less likely to increase the amount of their
physical exercise, and respondents already doing vigorous physical activity are more likely to
reduce the fat intake in their diet.
4.2 Willingness to pay
For the MNL, the marginal willingness to pay (WTP) for an attribute is calculated as the
negative of the ratio between that attribute coefficient and the cost attribute. Whenever
random parameters are used, this formula is not so straightforward. For example, when the
12
When estimating the RPL model, we changed the sign for the coefficient of ‘risk’ as the lognormal distribution restricts the sign of the coefficient estimates to be positive.

J.M. Grisolía, A. Longo and G. Hutchinson Diet Choices and Health Risks
15
two random parameters distribute normally, their ratio is distributed as a Cauchy distribution,
which has unknown moments (Armstrong et al., 2001). In such a case, the calculation of
means and confidence intervals would be difficult, although the distribution itself may still
exist. For this reason, it has been a common practice in recent years to estimate the marginal
WTP in WTP space, rather than in preference space (Train and Weeks, 2005). WTP space is
a transformation of the utility space that involves expressing all estimates as ratios of the cost
coefficient. As discussed by Louviere (2006), if errors are i.i.d. type-one extreme value, there
should be no difference in the fits of the two models, except for rounding errors. This
reparameterization of the utility function13
allows the estimation of population moments. The
last model in table 4 shows the WTP estimates, in GBP per unit change, using the estimation
in WTP space as applied to the RPL model. Exercise shows a positive and negative range
meaning that part of the sample are willing to pay to undertake physical activity and part are
reluctant to do it, and therefore should be compensated. Considering the spread of this
coefficient across the sample, almost 65% of respondents consider exercise as positive per se
and are willing to pay for it. On average, the payment is 0.00475 GBP per MET. Considering
that 1 minute of moderate exercise such as stationary bicycling implies a consumption of 5.5
MET per minute that represents a WTP of approximately 1.7 GBP per hour, which is about
one third of the cost of accessing a gym in Northern Ireland, and is about one fith of the
minimum hourly wage, suggesting that one hour of moderate physical activity is valued quite
low by our respondents. On the other hand, dietary change is considered positive for the
majority of the sample and only 9% of the sample considers this attribute as a negative
attribute. On average, participants are willing to pay 0.0452 GBP for a reduction of one gram
of fat. It is not surprising that people are willing to pay to reduce their fat intake and, in fact,
this is consistent with the attitude of the food industry that applies a price premium to low fat
products. This result that we find might reflect the widespread awareness about health
benefits and improvements in aesthetics resulting from a reduction in fat intake. Since CHD
risk was inserted with a negative sign and using a lognormal distribution, its result falls
entirely into the negative range. The WTP for reducing 1 percentage point of risk of a fatal
CVD event is 1.14 GBP per week. This implies a value of 592.8 GBP per year considering a
ten years reduction.
4.3 Marginal Rate of Substitution
It would be also interesting to analyze marginal rates of substitution (MRS) between
parameters in the sample using the coefficients in Table 4. The MRS is obtained as the ratio
of marginal utilities of each parameter of the model. This calculation helps to draw up a
pattern of substitutions that might be useful in terms of policy, aside from the willingness to
pay estimates. In our case, the model provides interesting relations between diet, exercise and
health risks. Our results are shown in Table 5 and are based on the outcome of the RPL
model.
13
The idea is to re-write the utility function entering the WTP as a new parameter. This would be expressed for the k-attribute in this way . Thus, replacing every parameter of the utility function by the product between WTP and the cost parameter allows us the direct estimation of the WTP.

J.M. Grisolía, A. Longo and G. Hutchinson Diet Choices and Health Risks
16
Table 5: MRS 1 met 1 gram of fat 1% reduction in CVD
risk
1 met 1 -0.8699 -0.00095253 1 gram of fat -1.14 1 -0.00109494 1% reduction in CVD risk
1049.83 -913.29 1
According to these results, substitution between exercise and fat leads to the equivalence of
1.14 METs to 1 gram of fat; that is, respondents would be willing to exchange 1.14 of MET
for 1 gram of fat to keep their utility constant. Reducing fat intake will improve the
individual’s utility. To remain in the same utility level, exercise should be reduced in an
equivalent amount. For instance, ingesting 10 grams less of fat per week will imply reducing
moderate exercise of 4.6 minutes. In terms of risk, individuals would trade 1049.83 METs for
1% variation of risk. As one minute of moderate exercise represents 2.9 METs, a 1%
reduction in CVD risk is equivalent to 362.01 minutes per week or 6.03 hours of moderate
physical activity. In other words, one percent point risk represents more than 6 hours per
week of moderate exercise, that is, approximately 51 minutes per day. Finally, the MRS
between fat and risk shows that people would be indifferent to exchange 913.29 grams of fat
per week for 1% variation of CVD risk.
5. Conclusions
Lifestyle choices, seen as long run decisions, imply certain risks on health. Individuals
naturally trade off these risks, presented here as CVD risks, with money, physical exercise
and changes in dietary habits. This work shows that people are unhappy with their current
health situation and are willing to modify their lifestyles in order to improve their health.
They would like to reduce their fat intake and, in general, would be willing to increase the
time they spend in moderate exercise. Our results suggest that males are more likely to
engage in physical exercise, as confirmed by other research (see, for instance Biddle and
Mutrie, 2008). More interesting is the positive preference of overweight individuals towards
exercise. In fact, up to 65% of the sample has a positive willingness to pay, on average 1.7
GBP for one minute of exercise. Fat is seen as undesirable and reducing its presence in diet
has a positive effect on people’s choices. Thus people are willing to pay 0.0452 GBP for one
gram of fat reduction. The MRSs demonstrate an equivalence in terms of utility between 51
minutes of daily exercise and one point variation in the risk of suffering a fatal CVD disease.
Finally, we found a willingness to pay for a reduction of one point in risk for a CVD disease
during ten years equal to 592.8 GBP. For the current Northern Ireland population within 40 to
65 years old, this would represent a total of 3,32 millions GBP per year during ten years
which should be accounted as the social welfare measure of a public program able to reduce
one point percent the risk of a fatal CVD event. These results lead us to conclude that policies
orientated to reduce health risks from illnesses linked to obesity will be more likely to
succeed if these are planned into the diet domain. If the problem is people with a BMI in the
overweight and obesity range, the work shows that these individuals are more inclined to do
physical activity to improve their health. Hence, to improve the health of overweight and
obese people in Northern Ireland, public moneys should be better spent for promoting
physical activity rather than healthier diets.

J.M. Grisolía, A. Longo and G. Hutchinson Diet Choices and Health Risks
17
REFERENCES
Ainsworth B.E.; Haskell, W.L., Leon, A.S., Jacobs, D.R., Montoye, H.J., Sallis, S.F., Pafembarger, R.S. (1993)
“Compendium of physical activities: classification of energy costs of human physical activities”. Med Sci Sports
Exerc. 1993 Jan;25(1):71-80
Alberini, A. and Aline Chiabai (2007), “Urban environmental health and sensitive populations: How much are
the Italians willing to pay to reduce their risks?” Regional Science and Urban EconomicsVolume 37, Issue 2,
March 2007, Pages 239-258
Alberini, Anna, Maureen Cropper, Alan Krupnick and Nathalie Simon (2004), “Does the value of a statistical
life vary with age and health status? Evidence from the U.S. and Canada.” Journal of Environmental Economics
and Management, 48 (1), pp. 769–792
Armstrong, P., Garrido, R., & Ortúzar, J. de D. (2001). Confidence intervals to bound the value of time.
Transportation Research Part E, 37, 143–161.
Auchincloss, A.H., Diez Roux, A.V., Mujahid, M.S, Shen, M., Bertoni,A.G., Carnethon, M.R. (2009) .
Neighborhood Resources for Physical Activity and Healthy Foods and Incidence of Type 2 Diabetes Mellitus.
The Multi-Ethnic Study of Atherosclerosis. Archives of Internal Medicine, 169(18):1698-1704.
Ben-Akiva, M. and Lerman, S.R. (1985) Discrete Choice Analysis: Theory and Application to Travel Demand.
The MIT Press, London, England.
Biddle, S.J.H. and Mutrie, N. (2008) Psychology of Physical Activity. Determinants, well-being and
interventions. Routledge. London and New York
Bliemer, M. C .J. & Rose, J. M. (2008). Construction of experimental designs for mixed logit models allowing
for correlation across choice observations. 87th Annual TRB Meeting, Washington, D.C., January 2008, USA.
Carlsson F., Martinsson P. 2003. Design techniques for stated preference methods in health economics, Health
Economics 12, 281-294
Carlsson, F.; Frykblom, P.; Lagekvist, C.J. (2005) “Using cheap talk as a test of validity in choice experiments”
Economic Letters, 89 (2005), pp. 147–152
Conroy RM, Pyorala K, Fitzferald AP, et al. (2003) “Estimation of ten-year risk of fatal cardiovascular disease
in Europe: the SCORE project. European Heart Journal 2003;24:987–1003.
DHSSPS (2010) “Obesity Prevention Framework 2011-2012” Health Development Policy Branch, Northern
Ireland
Ferrini, S. and Scarpa, R. 2007. Designs with a priori information for non market valuation with choice
experiments: a Monte Carlo study. Journal of Environmental Economics and Management, 53: 342–363
Fit Futures (2006), “Investing for Health,” Department of Health, Social Services and Public Safety, January
2006 Ref 126/2005
Food Standard Agency (2002) McCance and Widdowson’s The Composition of foods: Sixth Summary edition.
Cambridge: Royal Society of Chemistry.
Foresight (2007),”Tackling Obesities: Future Choices” Project Report October 2007, Department of Innovation
Universities and Skills, DIUS/PUB8654/2K/12/07/AR
Furst, T; Connors, M.; Bisogni, C.A.; Sobal, J.; and Winter Falk, L. (1996) “Food choice: a conceptual model of
the process”, Appetite 26 (1996), pp. 247–265
Hippisley-Cox, J; Coupland, C; Vinogradova, Y; Robson, J. May, M. and Brindle, P. (2007) “Derivation and
validation of QRISK, a new cardiovascular disease risk score for the United Kingdom: prospective open cohort
study”. BMJ Volume 335, Number 7611, pp. 332-336
Hughes,J. ; Kee, F.;Bennett, K.; O'Flaherty3, Critchley, J.; Capewell, S. (2010) Explaining the decline in
coronary heart disease mortality in Northern Ireland between 1987 and 2007 Journal of Epidemiological
Community Health 2010;64:A34-A35
Irish University Nutrition Alliance (2001) North/South Ireland food consumption survey. Published by: Food
Safety Promotion Board, Abbey Court, lower Abbey Street, Dublin 1.
Irish University Nutrition Alliance. North/South Ireland food consumption survey Published by: Food Safety
Promotion Board, Dublin
Joyce, T.; Wallace, A.J.; McCarthy S. N. and Gibney, M.J. (2007) “Intakes of total fat, saturated,
monounsaturated and polyunsaturated fatty acids in Irish children, teenagers and adults”. Public Health
Nutrition: 12(2), 156–165
Krupnick, A.; Alberini, A.; Maureen, C. ; Simon, N.; O’Brien, N RON GOEREE, MARTIN HEINTZELMAN
(2002) “Age, Health and the Willingness to Pay for Mortality Risk Reductions: A Contingent Valuation Survey
of Ontario Residents” The Journal of Risk and Uncertainty, 24:2; 161–186, 2002

J.M. Grisolía, A. Longo and G. Hutchinson Diet Choices and Health Risks
18
Lakdawalla,D., Philipson,T. (2009).The growth of obesity and technological change. Economics and Human
Biology,7, 283-293.
Lancaster, K. J. (1966). A new approach to consumer theory. Journal of Political Economy, 74, 132–157.
Lobba, A.E. ; Mazzocchib, M.; Trailla, W.B. (2007) “Modelling risk perception and trust in food safety
information within the theory of planned behaviour” Food Quality and Preference Volume 18, Issue 2, March
2007, Pages 384–395
Louviere, J. (2006) What You Don’t Know Might Hurt You: Some Unresolved Issues in the Design and
Analysis of Discrete Choice Experiments, Environmental and Resource Economics, 34, 173-188.
Louviere, J. Hensher, D. and Swait, J. (2000) Stated Choice Methods: Analysis and Application. Cambridge
University Press, Cambridge, UK.
McFadden, D. L. (1974). Conditional logit analysis of qualitative choice behavior. In P. Zrembka (ed.),
Frontiers in Econometrics. New York: Academic Press.
McHorney, C.A.; War, J.E. ; Lu, J.F.R. and Sherbourne, C.D. (1994) “The MOS 36-Item Short-Form Health
Survey (SF-36): III. Tests of Data Quality, Scaling Assumptions, and Reliability across Diverse Patient Groups” Medical Care , Vol. 32, No. 1 (Jan., 1994), pp. 40-66 Mente A, de Koning L, Shannon HS, Anand SS.(2009) “A systematic review of the evidence supporting a
causal link between dietary factors and coronary heart disease”.Arch Intern Med. 2009 Apr 13;169(7):659-69.
Müller-Riemenschneider, F.; Reinhold, T.; Berghöfer, A. and Willich, S.N (2007) “Health-economic burden of
obesity in Europe” European Journal of Epidemiology Volume 23, Number 8, pp. 499-509
Northern Ireland Health and Social Wellbeing Survey in 2005/06. Available at
http://www.csu.nisra.gov.uk/survey.asp5.htm
Ortúzar, J. de D., & Willumsen, L. G. (2001). Modelling Transport. Chichester: John Wiley & Sons.
Rigby, D and M. Burton (2005) “Preference heterogeneity and GM food in the UK” European Review of
Agricultural Economics Vol 32 (2) (2005) pp. 269–288
Rigby, D and M. Burton (2006) “Modeling Disinterest and Dislike: A Bounded Bayesian Mixed Logit Model of
the UK Market for GM Food” Environmental & Resource Economics (2006) 33: 485–509 Ryan M and Gerard K, (2012). “Discrete choice experiments in health economics: a review of the literature.”
Health Economics, 21(2), 145-172.
Ryan M, Gerard K, Amaya M. (2008). Using Discrete Choice to Value Health and Health Care.
Springer: Berlin.
Scarpa, R., Campbell, D. and Hutchinson, W.G. (2007). “Benefit transfer for landscape improvements:
sequential bayesian design and respondent’s rationality in a choice experiment”, Land Economics 83, 617–634 Train, K. E. (1998). Recreation demand models with taste differences over people. Land Economics, 74, 230–
239.
Train, K.E., 2003. Discrete Choice Methods with Simulation. Cambridge University Press: Cambridge.
Train, K.E., and Weeks, M. (2005) “Discrete choice models in preference space and willingness to pay space” in
Scarpa, R. and Alberini, A. Applications of Simulation Methods in Environmental and Resource Economics,
pp.1-16, Springer, Dordrecht, The Netherlands.
Van Rijswijk, W. Frewer, L.J. (2008) “Consumer perceptions of food quality and safety and their relation to
traceability” British Food Journal Vol. 110 No. 10, 2008 pp. 1034-1046
Walker, J. and Ben-Akiva, M. (2002) "Generalized random utility model" Mathematical Social Sciences
Volume 43, Issue 3, July 2002, Pages 303-343
WHO (2001) “Obesity: Preventing and managing the global epidemic.” Report on a WHO Consultation,
Technical report series, no. 894. WHOWorld Health Organization, 2001.
WHO (2011). Obesity and overweight fact sheet N° 311. March, World Health Organization,
http://www.who.int/mediacentre/factsheets/fs311/en/index.html.