trade union strength, organisation and impact in...
TRANSCRIPT

CENTRE FOR ECONOMIC PERFORMANCE
DISCUSSION PAPER NO. 258
August 1995
TRADE UNION STRENGTH, ORGANISATIONAND IMPACT IN SPAIN
S. MILNER and G. NOMBELA
ABSTRACT
Spanish trade unions enjoy an uncomfortable mix of high coverage and very lowmembership base. This state of affairs has arisen primarily because of state supportfor the collective representation system. Union organisation in terms of the core andits branches and union finances are also heavily influenced by the structure ofrepresentation. The limited facts on union membership, organisation and finance arefleshed out in this paper. The impact of unions on three economic outcomes isassessed: pay/employment flexibility; pay dispersion; and productivity growth.Although the data are quite limited, there is some suggestion that whereas unions areable to resist the pressure for widening pay dispersion, they are associated withsomewhat poorer productivity performance. However, this research throws up asmany unanswered puzzles about unions in Spain, as it does answer the previouslyunanswered. There is clearly a need for a representative survey of firms orworkplaces to investigate both this and other aspects of Spanish industrial relations.
This paper was produced as part of the Centre'sProgramme on Industrial Relations

TRADE UNION STRENGTH, ORGANISATION AND IMPACT IN SPAIN
S. MILNER and G. NOMBELA
AUGUST 1995
Published byCentre for Economic Performance
London School of Economics and Political ScienceHoughton Street
London WC2A 2AE
© S. Milner and G. Nombela
ISBN 0 7530 0277 9

TRADE UNION STRENGTH, ORGANISATIONAND IMPACT IN SPAIN
Simon Milner and Gustavo Nombela
Page
1. Introduction 1
Part I2. A Brief History of Trade Unionism
in Spain 13. Measuring and Analysing Union Strength
in Spain 24. Union Organisation 135. Union Finances 156. Inter-Union Relations 16
Part II
7. What do Unions do in Spain? 188. Conclusions, Policy Prescriptions
and Further Research 27
Endnotes 30Appendix 31Tables 36Figures 51References 54
The Centre for Economic Performance is financed by the Economic and SocialResearch Council.

ACKNOWLEDGEMENTS
Useful comments on an earlier draft have been received from David Metcalf.Financial assistance from the Bank of Spain is gratefully acknowledged.
TRADE UNION STRENGTH, ORGANISATIONAND IMPACT IN SPAIN
Simon Milner and Gustavo Nombela
1. IntroductionTrade unions in Spain are something of a curious phenomenon. Having
survived Franco as covert organisations, they enjoyed a huge surge in membershipin the late 1970s with the advent of democratic government. Their membership fallin the 1980s, however, was equally precipitous despite the presence of a socialistgovernment in power and new rights to representation and to strike afforded toemployees. Therefore on the basis of membership changes alone, they seem to beforlorn organisations. On the other hand, over 80% of Spanish employees have theirterms and conditions of employment determined through collective negotiations.1
Worker representatives involved in the latter are predominantly associated with atrade union. Therefore on the basis of collective bargaining coverage, Spain's unionsare significant players in the industrial relations field. This low membership, highcoverage nexus is not unique to Spain, France has a similar combination, but thereis rather a lot to be explained here if we are to understand the role Spanish unionsplay in industrial relations institutions, processes and outcomes.
This paper has three main aims: to describe the main features of Spanishunionism in terms of strength, organisation, interactions and finances; to investigateexplanations for certain important features - in particular to examine the role of thestate, especially through its labour legislation - and; to analyse the impact of unionson performance outcomes - ie to answer the question "what do unions do"? Perhapsunsurprisingly, whilst in some areas there is a glut of information on union activities(notably on the worker representation system) in others there are some importantgaps in knowledge (union membership numbers and composition are sketchy andfairly unreliable). Therefore some analytical points are built on rather unstablefoundations which need underpinning through more representative, validatedsources.
Part I fulfils the first two of our aims in four sections analysing respectively:alternative measures of union strength and explanations for their current andprevious states; internal union organisation; union finances; and inter-union relations. In Part II theimpact of unions on pay/employment flexibility, trends in pay dispersion andproductivity growth are evaluated using industry level data.
Part I
2. A Brief History of Trade Unionism in SpainUnionism developed in Spain during the last decades of the nineteenth century
and the first of the twentieth. One of the current main unions, Unión General deTrabajadores (UGT), was founded in 1888 and was closely linked to the socialist partyPartido Socialista Obrero Español (PSOE). As with the rest of Europe socialist politicswere gaining support amongst workers around this time - especially thoseconcentrated in the urban manufacturing centres. There was also significant supportin Spain for a more revolutionary ideology, represented by the anarchist unionConfederación Nacional del Trabajo (CNT). The latter union still exists today, but unlike

2
other unions it has never recovered the glories of its pre-Franco heyday. Theseparate union for the Basque Country - Sindicato de Trabajadores Vascos (ELA-STV) -also originated before the Civil War.
As in many other aspects of political and economic life, the Civil War (1936-1939) and the Francoist period marked a deep break in Spanish union history. Tradeunions were outlawed, their assets seized by the state, and a new system of industrialrelations was established. Employers and workers were obliged to join a singleofficial union, which supposedly represented their interests, but in fact was stronglycontrolled by the state. Only after changes to the system during the 1960s wereworkers allowed to choose representatives directly who formed works councils atworkplace level (Jurados de Empresa). Although the system was highly regulated,Spain's other main union, Comisiones Obreras (CCOO), owes its origins to the Francoindustrial relations environment because of association and cooperation betweenthose elected worker representatives. Another union which has its roots in thisperiod is Unión Sindical Obrera (USO), with christian social democrat origins, whichenjoyed a degree of support in the first years of transition to democracy in the late1970s.
After the death of Franco, the first democratic governments laid thefoundations for the current industrial relations system. Through their politicalaffiliations, the three main unions influenced the structure and content of labourreform. UGT was the union arm of PSOE, CCOO was linked to the communist partyPartido Comunista Español (PCE), and USO was considered to be close to the centre-right party in power, Union del Centro Democrático (UCD). The principal industrialrelations concern of the new government was over which system of workerrepresentation to adopt. The decisions made at this time have had long runimplications for how unions are structured, how they organise and their relationshipswith their officials and members.
3. Measuring and Analysing Union Strength in Spain
a. Membershipi. introduction: Traditionally, union strength is measured simply by union density -typically, the proportion of employees in employment who are union members(occasionally as the proportion of the labour force who are union members). Therises and falls in this indicator are used as the barometer of the strength of labourmovements around the world, and is the most common comparator (eg Blanchflowerand Freeman, 1992; OECD, 1994). Data inadequacies regarding union membershipare common, and in this Spain is no exception. In fact, there is no recognised,authoritative source of data on union membership in Spain. Therefore, we drawtogether the disparate data on trends in overall membership and compositionaldifferences in terms of industry, gender, occupation, employment contract and thedifferent unions. In general, these data suggest a movement in the crisis withperilously low membership, often concentrated in industries in decline and thereforeapparently of little importance in the economic schema.
ii. union density: Almost every study on Spanish unions (see Lawlor and Rigby1986, for a good English language description on the topic) comments on thedifficulties of trying to obtain reliable data on membership. The density estimates are
3
derived from unions' own publications, or from small-scale surveys, hence somecaution is warranted when analysing them. However, there is a general agreementthat union membership rates are very low by European standards, at the momentonly between 10 and 15% of workers are union members. Table 1 summarises theavailable data on aggregate density back to 1978 and also provides some comparativeevidence from other OECD countries.
It is impossible to determine the level of genuine union membership in thepre-democracy period because unions were officially banned. However, there wasclearly an enormous increase in membership in the transition to democracy periodreaching a peak of over 35% in 1979, and over 50% in manufacturing. Membershipstarted to fall at a precipitous rate - probably faster than it had risen - in the late1970s, plummeting to under 15% by the mid-1980s. Since then membership hasremained relatively low but apparently stable.
iii. differing fortunes of the major unions: The data difficulties are most apparentwhen attempting to estimate the relative density rates of the main unions. Table 2shows the estimates of union membership and density rates from individual levelsurveys for the two main unions, CCOO and UGT, since 1979. The final twocolumns contain UGT's own estimate of membership and density for the same years(CCOO has not been able to supply similar data). The discrepancies can besummarised as: in the early 1980s UGT estimates are significantly below individualsurvey estimates but more recently are slightly above. Although we cannot becertain, the explanation for the large discrepancy in the early 1980s may well lie indifferent definitions of membership and the consequences of rapidly fallingmembership. UGT's own figures are members paying subscriptions, whereas thesurvey definitions are probably rather looser. In a period of rapidly fallingmembership - ie the late 1970s, early 1980s - a large proportion of employees maywell still report themselves as members even though they no longer paysubscriptions. This may be particularly so if they joined the union in a state ofdemocratic euphoria, which was presumably the case for rather a lot of Spanishworkers. Therefore the UGT figures are probably more accurate for the early 1980s.The small remaining discrepancy in the figures is typical of the difference betweenunion and individual reported figures on union membership found elsewhere (in theUK the discrepancy is around 2-3 percentage points for the early 1990s).
Bearing in mind the caveats about the data, we are forced to use the surveydata to compare the fortunes of different unions since we do not have union reportedfigures from all the unions. The two main unions, CCOO and UGT, togethercomprise more than 70% of all union membership. The changes in their respectivefortunes are detailed in Table 2. In the late 1970s, CCOO had the edge over UGTwith around 17% of all employees, rising to nearly one third in manufacturing,compared to less than 14% in UGT, with roughly the same in manufacturing. Morethan four-in-five union members were in either of the two large unions at their peak.Currently, each union has only around 5% of employees in employment as membersaccording to the survey data, though UGT's own numbers report around 7%.Therefore, in relative terms CCOO membership has collapsed slightly more thanUGT's, dropping more than 10 percentage points since 1978, compared to less than8 for UGT.
4
The remaining unions have very low levels of membership, and we have littlein the way of time series data. ELA-STV is reported to have had around 85,000members in 1993, or about 13% of employees in the Basque Country. Therefore2
within its restricted sphere of operation, the union appears to be doing rather betterthan the two main unions - though membership may be higher in the BasqueCountry whatever the union because of the industrial mix there. As for the otherunions, USO reported a membership of only 72,000 in 1992 and the public sectorunion, Confederación Sindical Independiente de Funcionarios (CSIF), reported membershipof 110,000 in 1991 rising to 141,000 in 1993. Unfortunately, there appears to be noreadily available data on the membership of the exclusively Galician union,Converxencia Intersindical Galega (CIG).
iv. union composition: Even in the UK, where there is a century-long time series onaggregate union density, it is only comparatively recently that it has been possible toaccurately gauge the extent of union membership among different gender,occupation, age, educational achievement groups or in different industrial sectors andregions. Therefore, given the paucity of aggregate information in Spain, it isunsurprising that union composition data are relatively few and far between and aresubject to source-based bias.
Table 3 summarises UGT data on its density rates by sector in 1981 and 1992.The higher density levels in manufacturing are typical but what is rather surprisingis the large increase in density in services over the period - up around 6 percentagepoints according to UGT's own data. Table 3 also shows the composition of unionmembership by sector (the proportion of union members in each sector) for the twomain unions in 1981 and 1990. Both unions have undergone some changes inmembership structure, presumably mirroring similar changes in the structure ofemployment, with shifts from manufacturing towards services being the mostimportant development. These data may also give some indication as to why therelative fall in UGT membership was less than that for CCOO - because UGT hasbeen more successful at stemming the losses from manufacturing decline byrecruiting in the service sector.
A survey of employees in 1988 revealed that the majority of union membersare skilled middle-aged males, with manufacturing jobs and hired through permanentcontracts in large or medium size firms (Instituto IDES 1989). In small unions thereis a higher proportion of women, white-collar and administrative workers than inUGT and CCOO, and their political beliefs are more conservative than those ofmembers of the main unions. The main reasons expressed by non-members for notjoining a union in a UGT survey were: no sympathy for any union (18.2%),"politicization" of unions (12.4%), lack of credibility or honesty (10.9%) and lack ofreal representativity (8.7%).
Information from the public sector shows that the membership rate is higherin this sector at around 27% (UGT, 1992). There is a higher presence of womenmembers (comprising 40% of all members) which probably reflects the fact that thereare relatively more women in the public than in the private sector. Membership ratesare higher in the lower categories of workers, and rates decrease when the level ofeducation is higher. Those workers with a university degree show the lowestinclination to join unions.
5
v. why such low membership?: In the UK and US, the level of union membershipis largely determined by the interplay of two relationships, that between employerand union(s) - whether or not unions are recognised for collective bargaining - andthat between employee and union - whether or not an individual chooses to belongto a union, usually one recognised for bargaining their terms and conditions ofemployment. This statement is justified on the grounds that holding all else equalunion density is significantly higher in workplaces or firms or industries whereunions are recognised for collective bargaining. Therefore increases and declines inunion membership can be analysed in terms of two stages, changes in the tendencyof employers to recognise unions and changes in the disposition of individualemployees to join recognised unions. In general, five factors are said to influencethese interactions: the composition of jobs, workers and firms; macroeconomicvariables; state policies; employer actions; and union activities.
In Spain's case the question of what determines the incidence of unionrecognition is moribund, since recognition is effectively mandatory should theworkers demand it (of course, we could still be interested in what determinesworkers' proclivity towards demanding worker representative elections). Thereforethe analysis of why union membership is so low in Spain, and why it declined sorapidly at the end of the 1970s/early 1980s, must focus on individual's preferencesvis a vis union membership. We can still consider the five potential determinantslisted above, but concentrate on their impact on individual preferences.
Given the UGT data on the typical union member - male, skilled, middle aged,permanent contract, manufacturing job, working in a medium-sized or large firm -the changing composition of employment story seems, a priori, a highly plausibleexplanation for low membership. All the compositional changes in the Spanishlabour force since the early 1980s have been away from these areas with increasingproportions of women, younger, fixed-term contract employees and jobs in theservice sector and in small firms (Segura et al 1991). Given that these groups appearto have a lower propensity to unionize, the composition story reads rather well.However, as with composition stories elsewhere in the world, there are somesignificant problems. These can be summarised as timing and lack of analyticaldepth. Some of the labour force changes, most notably the enormous increase in theincidence of fixed-term contracts, occurred well after (ie from the mid-1980s) thedramatic fall in membership indicating a timing problem. On the analytical level, thisexplanation accepts at face value that some groups have lower unionisation rates thanothers, without offering an adequate assessment of why such groups have lowerpropensities to unionise. Finally, the history of union movements worldwide showenormous variation in the tendencies of different labour force groups to unionise overtime - propensities to unionise are not set in stone.
The business cycle explanation focuses on the role of unemployment, realwages and inflation changes which collectively influence individuals' predilectiontowards union membership. Although there have been variations in such a model,the general prediction is that high and rising unemployment leads to fallingmembership, relatively high real wage growth is associated with lower steady-statemembership and high relative inflation leads to higher membership. The mechanismslinking these variables to membership are multi-layered. Rising unemployment hasboth a direct effect as newly unemployed union members leave unions, and indirecteffects, such as employees anxious to avoid future unemployment leave unions in

6
order to appease management or firms derecognise unions regarding their activitiesas a threat to jobs. Relative real wage growth effects can be summarised as a `threat'effect. When real wage growth is relatively high and unthreatened, employeesperceive no need for unions. On the other hand, when growth is threatenedemployees join unions in the anticipation of unions' ability to protect real wages. Thecircularity of this mechanism is rather worrying, however, in that the level of unionmembership is also said to influence real wage growth, such that detecting causalityis always likely to be difficult. There is a similar problem when analysing the impactof changes in inflation on union membership in terms of this `threat effect'. It seemssensible to imagine that workers join unions when inflation is rising to protectthemselves, but it may just be that inflation rises because of cost-push factors due torising union membership! The difficulties of defining sensible, non-endogenous,mechanisms linking these determinants to union membership shifts, has lead themain proponents of these explanations in Britain to concentrate solely on dataanalysis rather than solving the mechanism conundrum (Carruth and Disney, 1988;Disney, 1990).
A proper assessment of this explanation in Spain's case would require moredetailed union membership data. Therefore these comments are somewhat tentative.The unemployment story seems reasonably credible for Spain, but only until the late1980s/early 1990s when, despite large falls in unemployment, membership remainedstubbornly low. It would still be interesting to investigate whether or not the recentlarge increases in unemployment to reach a quarter of the active labour force hasresulted in further falls in membership. The real wages explanation hits difficultiesrather earlier than the unemployment story, in that real wage growth actually fell inthe late 1970s and remained relatively low until the late 1980s (Bentolila and Dolado,1994) which sits uneasily with the union density data. The correlation betweenfalling inflation and falling membership from the peak of both around the late 1970sis consistent with the business cycle explanation apart from the fact that Spanishinflation continued to decline from the mid-1980s whilst union density apparentlyreached a floor at this time. Therefore the correlation broke down.
State policies regarding unions have been cited by most commentators as animportant explanation for low union membership in Spain. Unlike Britain, however,where anti-union policies have been associated with falling density (Freeman andPelletier, 1990) in Spain's case the suggestion is that the state has "killed by kindness".By providing a legal right to representation for all workers who want it, the state hasobviated the need for employees to join unions and seek recognition from employersby weight of numbers to protect their interests. It seems perfectly rational for anindividual to save the cost of union subscription, if being a union member makes nodifference to whether or not a union bargains over the individual's terms andconditions. This argument seems fairly convincing, and is probably appropriate forFrance as well where employee representation enjoys similar legal protection.However, the story is not completely straightforward. Non-union respondents to theUGT survey, discussed above, did not include "No need to join because coveredanyway" as a reason for non-membership - though perhaps people are reluctant tobe revealed in a callous, individualist light, especially to interviewers acting for atrade union.
Although rarely mentioned by other authors, it is important to consider theimpact of legislation other than that concerning the worker representation system.
7
Rights of association (the right to join a trade union) are protected under theconstitution for all workers except members of the armed forces and the police.However, rights to dissociation are also protected (the right not to belong to a tradeunion) so the closed shop - compulsory union membership - is illegal. Although itis impossible to quantify the exact effect of the closed shop on union membership,most commentators would argue that it was an important determinant of risingmembership in Britain in the 1970s and its demise contributed to union membershipdecline in the 1980s. Therefore the illegality of the closed shop may partly explainlow membership in Spain.
Two other aspects of the legislative framework may impact upon membership- one positively and the other negatively. On the plus side for aggregate unionmembership was the extension of the worker representation system to most parts ofthe public sector from 1987 (discussed below) which must have stimulatedmembership in that workers' unions would now be recognised for collectivebargaining on their behalf. On the negative side, may be the rights afforded to workscouncils to perform functions which in other countries could only be fulfilled by atrade union. The most obvious example of this is the calling and organisation ofstrikes, the right to do so which is restricted in many countries to trade unions(Milner, 1995).
The actions and policies of employers seem the least plausible explanation forthe decline and low level of Spanish union density. Apart from the significant blackeconomy, the size of which might in part be explained by pro-union legislation (butis more likely to be explained by the desire to avoid other state instruments such asemployment taxes and safety rules), there is little evidence of Spanish employerspursuing anti-union or union-busting strategies. In large part this must be due to theillegality of such policies - workers cannot vote away their right to collectiverepresentation. There is also little authoritative evidence to suggest that employershave encouraged workers to commit themselves to the firm rather than a union,through human resource management policies of employee involvement, performancerelated pay or single status.
The final explanation concerns the role of unions' own activities - usuallyconcentrating on the resources expended on recruitment as opposed to collectivebargaining. Although there is no evidence to definitively confirm this, it does seemlikely that Spanish unions are not spending significant resources on local recruitmentcampaigns. This is due to a number of factors: general paucity of resources,especially in terms of personnel at local level; conditioning by the collectivebargaining system to focus resources on fighting worker representative elections andnegotiating at industry level; and concentration of resources on servicing existingmembers because of worries about retention. It may also be that unions arerationally choosing not to spend money on recruitment because they are correctlyassessing the cost-benefit ratio as unfavourable. If relative union strength in anindustry is assessed on the basis of votes in worker representative elections, ratherthan the respective levels of union membership, a rational, resource-constrainedunion would devote those resources to election campaigns not membership drives.
The decline in union membership in Britain has been the subject of intensedebate among various commentators. Some have sought to pin their colours to oneparticular mast, whilst others have been content to argue that a multi determinantexplanation is more plausible and that it is very difficult to delineate exactly the

8
contribution of each factor. A modified version of the latter approach seems to bean appropriate conclusion to draw on Spain. Statistical analysis of the decline indensity is unlikely to be fruitful because of the difficulties in measuring thedependent variable at aggregate, let alone industry or regional, level. We have to becontent to argue that all five of the determinants detailed above may play some role,but the most important explanation is probably the legislative framework whichobviates the need for Spanish workers to join unions to seek protection of livingstandards and/or from arbitrary employer action.
vi. conclusions: Spain's unions are among the weakest in the OECD, when measuredby union density, even bearing in mind the less than authoritative data sources. Thedomination of the two main unions, CCOO and UGT, remains unchallenged despitehuge falls in membership in the last fifteen years. Explaining these falls and the lowlevel of membership involves deliberating between a number of plausibledeterminants, none of which can be totally rejected or upheld. It seems more likelythat a combination of these factors explains Spain's low membership, but the weightattached to each determinant cannot be determined without more representative dataon union density across different groups and over time. Finally, this picture of weakunionism is undoubtedly overstated, since in fact unions in Spain actually enjoy hugeinfluence despite their low membership base. An alternative measure of unionstrength, union coverage, provides an almost diametrically opposite picture of unionfortunes since the late 1970s.
b. Union coveragei. a more appropriate measure of union strength: Measuring union strength byweight of membership numbers rests on the assumption that membership densitytranslates into procedural and substantive power. Examples of procedural powerinclude membership of tripartite institutions, negotiating with employers at differentlevels within an industry and being involved with other public institutions such astraining boards and adult education institutes. Substantive power implies that unionshave some impact on the processes of and outcomes from work - manning levels,production process, productivity, wages etc. In fact, Spanish unions exercise powerto an extent wholly disproportionate to their membership levels - because of theirvirtual monopoly of the pervasive worker representation system. An associated paperprovides evidence on the significant increase in the coverage of the workerrepresentative system from the late 1970s, and the continuing high level sustainedinto the 1990s (Milner and Metcalf, 1994). The disparity compared union densitychanges and the striking difference between Spain and other OECD countries, apartfrom France, is shown in Figure 1.
The degree of union involvement in this system is best calculated as a unioncoverage measure - the proportion of workers covered by union negotiated collectiveagreements. This is certainly a good measure of procedural strength. Whether or notthis also signifies high levels of substantive strength depends on the extent to whichunions are able to affect the terms and conditions of covered workers. This can onlybe gleaned by examining data on the impact of unions on economic outcomes - whichis attempted in Part II below.
In an associated paper, the legislative framework determining the system ofworker representation is outlined (Metcalf, 1994). The central institution of the

9
modern Spanish workers' representation system are the workers' representativeelections, or improperly but usually called union elections. These elections are heldeach four years, during a three to six month period with dates varying across firms.The elections play a dual role: selecting representatives at workplace level to sit onworks councils; and secondly, to determine the relative presence of different unionsin sector level bargaining (in each region). The proportion of representatives underthe auspices of each union determines that union's status nationally, regionally andwithin individual industries. This status affords certain significant rights to theparticular union. Therefore worker representative election results are probably amore appropriate measure of overall and relative union strength, than union density.
The number of representatives elected at each firm depends on the size of thefirm. In firms with between 6 and 49 workers, representatives are called staffdelegates whereas in firms of 50 or more workers, representatives form a workscouncil. Table 4 summarises the rules regarding number of representatives per firm,and illustrates the implications for number of representatives per thousand workers(which we term worker representative presence). In general, smaller firms are likelyto have higher relative worker representative presence than medium and large ones.This creates a certain distortion in the representation system, because observeddifferences in worker representation can be caused by different firm size structures.Beneyto (1991) also points out that this distortion affects the status of the "mostrepresentative union", since that is calculated on the number of delegates obtained,not on the actual number of votes. Therefore, workers in small firms have arelatively higher weight attached to their vote when choosing the most representativeunion at other levels.
The most representative unions nationally are those which obtain a minimumof 10% of all elected delegates in the country or 15% at regional level. Only CCOOand UGT have representative status at national level, giving them the right to sit onall negotiating bodies throughout the country. In addition, there are two regionswhere local unions enjoy significant support and therefore are recognized asrepresentative unions in these areas - ELA-STV, which obtained 37.8% of delegatesin the Basque Country in 1990; and CIG, with 23.4% of Galician delegates in 1990.
The status of "most representative" gives unions certain representation rights:they can participate in boards of public institutions on environmental, health andeducation; they have rights to participate in collective bargaining at national andsector level; their union sections at firm level have special rights on information andparticipation in works councils; and they qualify for subsidies from the state. Whatis more important about the status of most representative union is that this monikerapplies not only to the main organization but also to every single union affiliated tothe organization. This implies that if union X is considered representative at nationallevel, its federation in a particular sector enjoys the rights of a most representativeunion regardless of the actual support from workers in that sector. Paradoxically, itcould be the case that although a sector-based union dominates an industry, thecollective agreement would be negotiated by a representative union at national level.However, the law also allows for the presence of sector-representative unions (thosewith 10% or more of the delegates in that sector) at the sector-level negotiation table.
Public administration workers also have similar rights to be represented (apartfrom members of the armed forces, the police and judges) and they also vote for theirrepresentatives in elections. These rights are not regulated by the Workers Statute

10
but by a different law hence elections were first held in the public sector in 1987.Although there are slight differences in the number of representatives by workplacesize, and works councils operate under a different name compared to the privatesector (Juntas de Personal), the representation system is basically the same as that forprivate sector workers.
ii. overall and relative union strength: Table 5 summarises aggregate data onworker representative elections held periodically in Spain since 1978. The keymeasure of union procedural strength is surely the proportion of such representativeswho are associated with a union, which has increased in every election. In 1978, 70%of representatives were union backed, with the rest unaffiliated. By 1982 the ratiohad moved substantially in favour of unions - 88 to 12 - and by 1990 to almostcomplete union control - 96.5 to 3.5. Non-union representatives are few and farbetween. Whilst there are a number of possible reasons for the demise of the non-union representative (with the concentration of union resources on elections probablyof most significance), it is rather curiously negatively correlated with the rise of non-unionism among employees. In fact the decline in non-union representation has beeneven steeper and more prolonged than the decline in unionisation which reached afloor around the mid-1980s.
The election data in Table 5 also describe the relative strength of each union.The dominance of the two main unions is striking, and increasing throughout, suchthat by the time of the 1990 election almost four-in-five representatives were affiliatedto either CCOO or UGT, up from just over half in 1979. UGT has fared much betterthan its rival over the elections, increasing its share of the vote every year andsurpassing CCOO for the first time in 1982. Currently the gap is 5 percentage points.
Regarding the remaining unions, apart from the already mentioned regionalunions ELA-STV and CIG based in the Basque Country and Galicia respectively, noother union achieves the category of "most representative" union within anyjurisdiction. The social-democrat union USO, which was influential in the late 1970s,has suffered from several divisions and some of its members joined the main unions.At the moment, the number of representatives linked to USO is around 3% of thetotal. Remaining unions are small, most of them specialized in particular sectors, oreven firms (Escobar, 1993) without a national level structure.
There are some differences in the public sector, where a civil servants union -CSIF, obtained the highest number of representatives (25%) in the first public sectorelections held in 1987. However, CCOO and UGT were also highly represented inthis sector, with 24.2% and 23.1% of representatives respectively. The CSIF wasestablished partly because a majority of civil servants have centre-right politicalaffiliations which are not in conflict with the leftist ideologies of the CCOO and UGT.Moreover the UGT was closely linked to the party in power (PSOE) and public sectoremployees may be indisposed to vote for their employer's union. However, the mainunions succeeded in gaining more ground in the 1990 elections which changed thecomposition somewhat. CCOO obtained the highest share of representatives (28.4%),while UGT obtained 26.9%. In contrast CSIF lost ground obtaining a share of only19.4%.
Table 6 contains data on union representatives for each sector from the 1990election. Alongside data in Table 5 these show that the picture of union presence inSpain is dominated by the UGT and CCOO in every sector. There is a high number

11
of small unions, sector or firm based, which may be playing some role in theirparticular area, but they do not reach the representativity levels required by law toparticipate in collective agreements at national levels, or in other institutions.
iii. why do unions operate within the worker representation system?: Although wehave touched on this crucial question at various points above, it is worthwhileconsidering just why it is that Spanish unions seem content to operate within theboundaries of the worker representation system rather than try to build membershipthrough local organisation. There are a number of explanatory factors here. Firstly,as already mentioned most union movements world-wide are constrained by legalenvironments. It would be very difficult legally for Spanish unions to change theindustrial relations system by unilateral action since workers have a right torepresentation only through their elected representatives. However, it would bemisleading to give the impression that the unions operate in this system because oflegal coercion alone. Although the UGT makes noises about preferring a more directchannel of communication with management through shop stewards at workplacelevel - presumably elected just by UGT members - the CCOO is an open advocate ofthe worker representative electoral system as it now stands. Therefore another reasonwhy unions work within the system is because this is their policy decision.
Three other explanations for the status quo are: the conditioning by customand practice clouds union leaders' perceptions of the cost and benefits of alternatives;and a pragmatic recognition that abandoning the system might well bring about thedecimation of the union movement - since it would have to rely on the efforts of thevery small membership to maintain an alternative system; and the long-suspectedpreference of union leaders for procedural rather than necessarily substantive power.The impact of custom conditioning also helps to explain the previous distrust byreluctance of works councils by British unions, which has disappeared over the lastfew years in many unions to be replaced by conscious campaigns in favour of the EUimposing compulsory works councils on British firms. Therefore whilst some Spanishunions may rue the day the worker representation system was inaugurated becauseof its apparent impact on membership levels, British unions want to see such asystem introduced here in the belief that it might actually shore up membership.
iv. the CCOO/UGT duopoly: The existence of this union duopoly and its effects onthe Spanish labour market outcomes has been extensively debated, especially by theunions themselves. There appear to be two main reasons for the duopoly - one aresult of the election system, and one a result of union objectives.
Any electoral system, political or otherwise, which sets a threshold ofrepresentation status is likely to promote the existence of a small number of largeelectoral organisations. In addition, the provisions regarding the status of "mostrepresentative" union for every organization organised into national confederations(providing the proportion of representatives is surpassed) encourages theamalgamation of small unions into larger ones.
Secondly, both the major unions were formed as class-based general unionsfrom the very beginning - ie they have no specific industry or regional roots.Therefore it does not require a great change in objectives or character to absorb othersmaller unions or recruit previously unrecruited electors. Moreover, their relativelyloose structures - with little attempt or ability to control the actions of local
12
representatives or branches (discussed below) - makes it relatively easy to keep thedisparate groups within the same umbrella organisation.
Finally we should also consider why the duopoly has not become a monopoly.Given the existence of union elections every four years, unions have to competeamong themselves to try to gain votes, since a higher number of votes imply morerepresentative share and more benefits. That leads unions to differentiate theircampaigning programmes and does not favour either cooperation between them orintegration into a single organization. Election periods are especially notable forinter-union conflict. In the last elections (1990) disputes over the timing of electionsreached court. Both unions are said to be dissatisfied with this state of affairs, since3
they believe that the image of confrontation may have negative effects in terms ofmembership and support. However, there are also grounds for arguing that electoralconfrontation is likely to engender more worker interest rather than less.
v. workplace representation outside of the works council system: There is scopewithin the worker representation system for a second channel of workerrepresentation at firm level - union shop stewards (delegados sindicales). Although theworker representation system is mainly based in the existence of works councils,unions are also allowed shop stewards at firms. The most representative unions haverights to participate in collective agreements (ie to substitute for works councils) toprovide information to workers and they can have an office at firms with more than250 workers. The minimum number of shop stewards stipulated by law isdetermined by the size of the firm and ranges from 1 to 4 - with a minimumthreshold of 250 workers and a minimum of 4 shop stewards is guaranteed for firmswith more than 5,000 workers. It is not clear the extent to which these minima areexceeded in practice.
When shop stewards are not members of the works council they have the sameguarantees as those legally established for members of works councils and also haveaccess to the same information and documentation which an employer is obliged toprovide for works council members. The shop stewards also have the right to attendmeetings of councils and other company committees including those on health andsafety. They must be heard by the company prior to the adoption of collectivemeasures affecting workers or their members, particularly with respect to disciplineand dismissals. The combined committee of shop stewards may also act as thenegotiating party for single-employer collective agreements.
It is a difficult task to measure the importance of these shop stewards in theindustrial relations system, given that there are no publicly available data on thenumber of sections or shop stewards. It is likely that shop stewards only play asignificant role in a small number of large firms. Data from a survey of registeredcollective agreements by García et al (1994) reveal that shop stewards negotiated inplace of works councils in only around 10% of firm-level agreements in both 1986and 1992-3. Given that firm-level agreements covered less than 15% of workersduring this period, shop steward bargaining is obviously a rare exception to thegeneral rule of works council negotiations.
vi. how strong are unions in Spain?: The evidence presented on workerrepresentative elections suggests that unions in Spain are disproportionately powerful
13
compared to their low levels of membership. However, this rather presupposes thatthe unions exercise some degree of control over their affiliated representatives. AUGT survey of its 1986 batch of representatives found that 40% of them were notunion members when elected. Three years later less than half these delegates hadjoined the union, with 23.8% of all representatives still not members of the union.A majority of these expressed no reason for not joining, and only some of themanswered that they wished to be independent or that they had some disagreementwith the union.
This phenomenon may not apply to CCOO as well, but either way this doesraise an important question about the degree of control which the two large unionshave over their representatives, and also highlights possible inaccuracies in the dataon union/non-union representatives. If a quarter of UGT representatives are notactually members of the union, this rather changes the perspective of the datareported in Table 5. The implications of these non-union union representatives onworks councils must be worth further investigation through workplace or firm levelsurveys.
c. ConclusionsTable 7 and Figure 2 summarise the available data on union strength detailing
the proportion of workers who are union members, the worker representativeelectorate (proportion of workers in firms holding elections), the proportion ofworkers actually voting in elections and the percentage of workers covered bycollective bargaining. The most striking aspect of Figure 2 is the mirror image ofunion density decline and collective bargaining coverage increase from the late 1970s.Union potential strength should surely be measured as the proportion of workerscovered by bargaining involving union representatives, rather than by unionmembership. Although the latter provides a distorted picture of apparent unionweakness, the former may also overstate the importance of unions if those unionsexert little control over the actions of many of their delegates.
4. Union OrganisationHaving assessed the changing strength of Spain's unions, another piece of the
picture concerns the internal organisation of the main unions. The degree of controlexercised by the centre is likely to be strongly influenced by the structure of theunion and the communication mechanisms within the organisation. Local branchesoperating in a loose, federal organisation are more likely to enjoy autonomy than ina centrally directed union. We are also concerned with explaining why unions arestructured in certain ways and to what extent they are influenced by external factors.In the UK, successive governments have attempted to interfere with internal unionaffairs with the avowed intention of making unions more democratic. There is partialevidence that this has forced some unions to make significant changes to theirmethods of operation. However, given the lack of similar legislation in Spain -interfering in the internal organisation of unions would smack of Francoism, suchthat even if justified on an economic policy level, this would be politically unfeasible
The most striking aspect of union organisation in Spain is that the internalstructures of UGT and CCOO are almost identical. Both unions are organised alongconfederal lines. They comprise a number of regional and sector based federations,within each of which there are separate branches. Most branches are members of

14
both a regional and an industry federation. UGT currently has 12 industryfederations while CCOO reports 20. Both unions are aiming to simplify the industrystructure by mergers of similar activities, and give more power and resources to thesefederations. There are also some special federations within both unions: white-collarand professional workers; retired workers; and departments for women and youths.
The territorial structure follows the political-administrative structure of Spain.Both unions have federations in each of the 17 autonomous communities, comprisingsmaller territorial units (provinces and local federations). The practice of maintaininga double structure is justified by both unions as a way of giving unity to theirpolicies, considering not only the particular interests of workers in a sector, but theircollective interests as a class. Apparently, this territorial structure plays acomplementary role in the unions' structure, since the most relevant internal tasks(collecting members' fees, electoral strategies, etc) are attributed generally to theproductive structure. However, some collective agreements are signed at regionallevel, hence they are negotiated by the territorial federations.
Each federation appears to have a high degree of autonomy over its activitiesand operations. The main stipulation is that they must have statutes which are notin contradiction with the statutes of the union confederation. Each federation mustcomply with confederal agreements and general lines of policy designed by theorganization, but otherwise they are free to manage their own resources and toimplement their own policies. The principal threat which the confederation can useto keep a federation in check concerns their assets. If a federation decides to secedefrom the main union, its assets must be returned to the central organization.
In terms of confederal level institutions, both unions have surprisingly similarstructures. The central decision-making body of UGT and CCOO is the ConfederalCongress, held every four years. The tasks of the Congress are to determine the4
general tenor of union policies and to elect members of the confederation boards.Delegates elected at sector and territorial level participate in the Congress, inproportion to the importance of each group. For example the UGT Congress consistsof 60% delegates from industry federations and 40% from regional federations, whilein the CCOO Congress the split is fifty-fifty.
When the Congress is not in session, the governing bodies of unions are theirExecutive Commissions, formed by a General Secretary and a small number ofmembers, and another larger representative institution which meets regularly duringthe periods between Congresses to supervise the actions of the ExecutiveCommission. This body is called the Confederal Committee in UGT, with meetingsheld twice a year, and the Confederal Council in CCOO meeting five times a year.There are also other committees in both unions, to supervise the finances and to solveinternal conflicts (Commissions of Control of Finances, and Commissions ofGuarantees).
The similarity in organisation between the two main unions, and the fact thatthe much smaller USO is organised along similar lines, suggests that these structuresmay be heavily influenced by the industrial relations environment in which theunions operate. Their dual structure must be in large part because of the mix ofcollective agreements at sector and regional level which are the prime focus of unionactivities. The increasing concentration on activities at sector level must be connectedwith the breakdown of tripartite agreements at national level after 1986-7. Clearlyunion structures are self-determined, with no state interference.
15
5. Union FinancesThe health of union finances may play a large part in explaining their
influence, structure and policies. Willman et al (1993) have recently conducted themost comprehensive research project undertaken on British unions' finances,constructing an "acid test" of union financial health in the process. They define healthas assets minus liabilities divided by annual expenditure. This measures how longa union could survive without any income. It has fallen from an average of over 4to around 1.5 years in the postwar period. Unfortunately, data on Spanish unionfinances are rather inadequate for conducting this acid test.
The main sources of revenue for unions are: members' fees, which comprisethe largest single source; rents from assets and securities, which have increasedenormously since the advent of democracy as the state has gradually returned assets(principally office buildings) seized under Franco; sale of publications and services(the main unions offer members a range of services: finance and fiscal advice,advantageous insurance policies, house building cooperatives, and even travelagencies); state subsidies (directly from a budget provision, split according with thenumber of representatives obtained at elections); and indirectly, as payments for thetraining courses organized by unions for INEM (National Employment Office).
Although there are no reliable data on total revenue, some estimates using thenumber of members and the average subscription fee have been calculated. Usingthese data, the journal Economía y Finanzas reported an annual income in 1994 of6,000m pesetas for UGT and 6,500m pesetas for CCOO. Escobar (1993) reports anincome for UGT of 5,202m pesetas for the period January 1986 to January 1989, ofwhich 2,127m pesetas (41%) is attributed to state subsidies. These estimates differwidely, especially taking the different time periods into account, but without data onactual union accounts, it is not possible to assess the validity of either.
The impression from unions' own literature is that their finances are quiteprecarious bearing in mind the tasks they undertake - although they do receivesubsidies from the state in recognition that they represent all workers covered bybargaining, even those who are not union members. Nevertheless, unions claim thatthere is no stable mechanism of union funding by the state - ie the funding is opento political interference. The law provides a mechanism of union funding from levieson workers wages to alleviate the problem of free riders, by making non-unionistspay a voluntary fee (canon sindical) to the agents who bargain agreements for them.It seems, however, that this mechanism has never worked in practice, so the subsidiesfrom the state are probably still justified.
With respect to the internal organisation of finances, federations are requiredto furnish the confederation with annual accounts. In the case of UGT, industrybranches are responsible for the collection of fees, with the stipulation that they musttransfer 35% of this income to the confederation. The regional federations receive80% of this subscription income and the rest is used to finance the central institutions.There is an internal Solidarity Fund, to which federations pay 9.3% of their income,aimed to redistribute resources internally to help federations reduce their debts.
The different federations of UGT determine the amount of union members'fees, while the confederation only sets a minimum fee to cover the amount thatfederations must transfer to them. Federations are free to impose reductions oradditional charges on that minimum fee. The objective is that members pay 1% oftheir annual wage to the union.
16
In the case of CCOO, it is less specified in their documents who is responsiblefor the fees' collection and how their resources are spent. CCOO seems to have moreproblems of information and control over finances than UGT. One of the objectivesof their last Congress in 1991 was to have a budget for the whole Confederation by1993. Their division of resources from fees is the following: branches - 60%;territorial federations - 30%; confederal institutions, 10%. The resources obtained byother means than fees (subsidies, etc) are used in common by the confederation - iethey are not managed directly by the federation which receives the funds, but byconfederal institutions.
Although there are some estimates of unions' financial health, and informationabout how fees are collected and the proceeds distributed, in general we know verylittle about union finances in Spain. Given that their apparent paucity of resourcesmust be a majorconstraint on their ability to function effectively, it is perhaps surprising that theirfinances have not been investigated more thoroughly in the past. However, it mustalso be acknowledged that if they are relatively badly off financially, it is unlikelythat they will be willing to allow researchers open access to their financial records -let alone allowing the state to investigate their financial health.
6. Inter-Union RelationsUnlike the UK, Spain has two peak organisations representing the interests of
labour, whereas the TUC fulfils this role here. One of its main raisons d'etre is to helpsettle inter-union disputes, principally over members, which has been traditionallyconducted through the so-called "Bridlington rules", after the seaside town wherethey were drawn up. There is no institution with specific remit to settle inter-uniondisputes in Spain and therefore it is not possible to come up with a measure of theextent of inter-union conflict. Instead we have to rely on anecdotal information.
The two main unions have important ideological differences which certainlyled to conflict about dealings with government in the early 1980s. When the PSOEcame to power in 1982, the strategies of the two were diametrically opposed. WhileUGT chose to cooperate with the government (after all they had common roots)CCOO adopted a more critical position in refusing to be a party to any tripartiteagreement involving the government. However, as the PSOE government's labourmarket policies increasingly turned towards the promotion of flexibility and asunemployment continued to rise, UGT became more critical of the government untilthe two organisations broke their historic links in 1988. The milestone was probablythe general strike in December of that year organised jointly by UGT and CCOO.
The weakening of the UGT's political links, plus the electoral frailty of thecommunist party, PCE, has led to something of a rapprochement between the twounion confederations. Cooperation seems to be the main strategy of the last fewyears, though this is unlikely to ever lead to merger. As well as the national level,there seems to be little evidence of significant conflict at industry, regional or firmlevel either. For example, although the law does allow for multiple bargaining unitsat industry level if the different groups of worker representatives feel unable to speakwith one voice, apparently single table bargaining is the overwhelming norm.

17
Therefore the duopoly of the UGT and CCOO seems unlikely to be an importantextra element in determining the impact of unions in Spain.
18
Part II
7. What do Unions do in Spain?a. Introduction
Having provided a picture of union presence, structures and strength andhaving analysed the environmental factors contributing to these arrangements, thecrucial question of the impact of unions remains unanswered. Freeman and Medoff(1984) encapsulated this question as "What do unions do?" Providing theoreticaljustification and/or empirical evidence for either detrimental or beneficial effects onperformance, has dominated labour economists' debates on unions for at least adecade. A range of outcome variables have come under the microscope - wagedifferentials, wage dispersion, job creation and job destruction, the pay/jobs trade off,productivity, profits and both human and physical capital investment. Of all theseoutcomes, wages, employment and productivity have dominated the voluminousliterature. Assessing the impact of unions on economic performance is an essentialelement in understanding the influence of industrial relations institutions in generalin Spain, because only a relatively small proportion of employees work in non-unionenvironments.
Analysts of union effects have made use of a number of different indicatorsof union presence and activity - including recognition, density, multiple unionism,collective bargaining coverage and levels, number of shop stewards and incidence oftheir committees - and have investigated associations using industry, firm andworkplace level data. Without a doubt the most authoritative work in the UK hasbeen done at workplace level, principally using one or more of the three WorkplaceIndustrial Relations Surveys (WIRS). In the absence of publicly available data ateither firm or plant level in Spain which would be adequate to conduct properempirical tests of the impact of unions, a second best option (by rather a long way)is to analyse industry level data.
In proceeding sections three measures of economic performance -employment/pay flexibility, trends in wage dispersion and productivity growth - areexamined alongside three relatively crude union indicators - bargaining coverage,bargaining levels and a worker representative presence measure. The resultsreported on the impact of unions on economic performance are rather tentative andare subject to a series of caveats including the relatively small number of "matchedindustries", the lack of control variables, the aggregated basis of the data andconcerns about endogeneity. However, despite the caveats, the results provide abasis for more thoroughgoing analyses of union effects using less aggregated industrydata and as an ultimate aim, establishment or enterprise level data.
b. Measures of union presence and activityIn the absence of both reliable and disaggregated union density data, three
alternative indicators are used:i. the coverage of collective bargaining: Defined as the proportion of employees inemployment reported to be affected by collective agreements at either single or multi-employer level. These data are reported every year by the Ministry of Labour, butare somewhat unreliable in that in certain industries coverage appears to be greaterthan 100% (on occasion three or four times in excess of this figure). Suchdiscrepancies are not unusual with employer association or union reported figuresof collective bargaining coverage. In the UK, official data on the number of workers

19
affected by national agreements (published 1893-1978) regularly exceeded the numberemployed in certain industries (Milner, 1994). For the purposes of our empiricalanalysis of unions in Spain, it is assumed in such circumstances that these industrieshave complete bargaining coverage in the relevant years.
A further problem with using bargaining coverage data as a measure of unionpresence is that although most worker representatives involved in the negotiation ofcollective agreements at different levels do represent unions, a small minority are notaffiliated to any union (and as reported in Part I, some union representatives areactually not even union members). Secondly, although this measure does indicate thedegree to which unions play at least some role in determining the pay and conditionsof workers within an industry, they reveal nothing about the depth of union activityin the industry - ie to what extent unions function at workplace or firm level.Because of the aggregated nature of the data, they also tell us very little aboutvariation in union presence within the industry - some firms are likely to have higherworker election turnouts than others - perhaps indicating greater local activity byunions - yet the workers may still be covered by the same agreement.
Nevertheless, collective bargaining coverage data are used relatively frequentlyin industry-level analyses of union effects (eg Denny and Nickell, 1992) and despitethe relatively blunt nature of this indicator it is still a sensible starting point for theanalysis of union effects on economic performance. Note that we have conductedsome tests of pay/employment flexibility in Spain using bargaining coverage as acontrol variable in an associated paper (Milner and Metcalf, 1994).
ii. bargaining levels: Given the extent of collective bargaining coverage generally inSpain, it is important to analyse variations in the impact of unions within this highcoverage environment by analysing the effects of different levels of collectivebargaining. If Spain had its own version of WIRS, it would be possible to examinethe impact of unions on workplace performance in situations where single employerbargaining dominates, compared to where multi-employer bargaining holds sway.With Spanish industry data, however, we can merely indicate whether or not inter-industry performance can be differentiated on the axiom of the degree of bargainingdecentralisation. The variable used is the proportion of all employees in employmentin the industry (ie not just those covered by collective bargaining) who are coveredby a single employer agreement. In theory, a relatively high degree of decentralisedbargaining might lead to unions acting in a more sectional way - accentuatingtendencies towards insiderism.
The bargaining levels indicator suffers from similar drawbacks as the coveragemeasure (except that recorded single employer coverage is very rarely higher thanthe number of reported employees in employment in the industry), plus some moreexclusive problems. The official data do not record the extent of double-coverage, iethe number of workers covered by both single and multi-employer agreements or therelative importance of different levels within the double coverage sector. Thequestions required to root out data on such issues can only be applied in a workplaceor firm-level survey, and even then they are very difficult to both word properly andanalyse in a straightforward way. One should also be aware of potential problemsof interpretation of empirical results because of the endogenous nature of the extentof decentralised bargaining. The decision to adopt single-employer bargaining maywell be conditioned by the economic performance of the firm or industry rather than

20
vice versa. However, given that bargaining structures have shown a degree ofstability and have so for around a decade, endogeneity problems are likely to berelatively minor.
iii. worker representative presence: Both the above indicators of union presenceand activity are relatively widely used in studies on unions or collective bargainingin both single country and comparative studies, but are open to the obvious criticismthat they are as much a measure of the impact of management as they are of unionssince collective bargaining involves at least two parties. A complementary indicator,which is not commonly used, is the extent of worker representative presence whichis available for Spain in the form of worker election results by industry (unfortunatelyonly 1990 data are available). The measure is defined as the number of electedworker representatives per 1000 covered workers. Ostensibly one might imagine thatthere is little variation in such a measure since the state lays down certain rules aboutthe number of worker representatives which are mandatory for plants or firms of acertain size (see Part I). However, the 1990 election data reveal that in fact there ishuge variation in this measure from a low of 25.5 in construction to an enormous274.2 in the production and primary transformation of metals industry. The latternumber is absurdly high and is probably due to a large underestimate of the numberof workers covered by collective bargaining. This reinforces the need to collect microlevel, validated data on the activity of unions.
The most important criticism of this indicator is that the variation in it may beless explained by the extent of union organisation or activity, and much more so bythe composition of the industry in terms of plant and firm size. Consider twoimaginary industries each with 10,000 workers. In the unlikely event of one beingcomposed solely of plants with 50 employees and the other of plants with 1,000employees, the respective indices of worker representative presence would be 100 and21 respectively (if the second industry had only one plant, the index would fall to amere 3.9). However, in the absence of data on plant size composition withinindustries, it is difficult to directly measure the extent to which worker representativepresence is pre-determined irrespective of what unions may do in that industry. Assuch, this indicator is used with a healthy degree of scepticism about how good ameasure of local union activity and organisation it is and with a strong appreciationof the need for less ambiguous measures.
c. Unions and pay/employment flexibilityi. overall results: As discussed in an associated paper (Milner and Metcalf, 1994) akey issue concerning flexibility in the industrial wage structure is whether or not thecorrelations between wage and employment changes indicate that there is competitiveflexibility in the labour market. The flexibility debate turns on the question of whatfactors determine changes in labour allocation across industries. In a competitiveflexibility environment, sector-specific shifts in labour demand will translate intorelative wage changes as well as employment changes in the short run withexpanding sectors increasing their wages to attract workers from other industries.However, in the medium to long run such positive correlations will disappear as thelabour supply curve to the firm is more elastic in the long run than the short run.An alternative point of view is that employers signal increased demand through jobvacancies rather than higher relative wages, such that there should be no strong

21
association between relative changes in wages and employment either in the short orlong run. The OECD has pitched its tent firmly in the latter camp, as empiricalinvestigation reveals that in most countries very few sectors exhibited signs thatsector-specific excess demand influenced real wage movements (OECD 1985a, 1985b).
Considering the whole sample of twenty Spanish industries first and to recapour earlier findings, reported again in Table 8, there is no evidence of competitiveflexibility in the Spanish industrial wage structure over the period 1980-88 for whichwe have adequate disaggregated data on wages, since none of the one yearcorrelations between changes in hourly wages and employment is statisticallysignificant and the majority are negatively signed. In fact the only significantcoefficients are for the four and eight year periods, which have negative signs. Weinterpret these data as suggestive of an identification problem - ie rather than changesin relative employment leading to changes in relative wages, instead changes inwages caused by shifts in the labour supply curve to certain industries of a greatermagnitude and speed than shifts in the labour demand curve, may contribute todifferences in relative wage movements. In other words positive employmentchanges are large where positive pay changes are lower with causation running frompay to jobs. This interpretation is supported by the incidence of two importantchanges in labour supply particularly from the mid-1980s - a rise in the labour forceparticipation rate of women (Milner et al, 1995: Figure 3) and the massively increaseduse of fixed-term employment contracts. Both women workers and those on fixed-term contracts are likely to be associated with relatively lower wages.
ii. high and low collective bargaining coverage: Disaggregating the 20 matchedindustries into those with high and those with low bargaining coverage provides arelatively primitive way of determining the influence of unions on the relativepay/employment relationship. Analysis of such data conducted for an earlier paper(not reported here) reveals that sectors with high coverage exhibited a moresignificant negative association between employment and pay changes than thosewith lower coverage, both over the 1984-1988 period and the longer 1980-88 period.This rather suggests that unions act in a beneficial way where coverage is high, byholding down wage growth in order to promote greater relative employment growth.
A priori this result seems rather against expectations that unionised firms andindustries are associated with higher pay increases and greater (smaller) employmentdecline (growth) than non-union environments. However, the comparison beingmade here is not one of union versus non-union, but between different unionisedstates of high coverage versus less high coverage. An alternative interpretation of theresults in terms of what they mean for unions, is that encompassing unions (ie thosecovering a relatively large proportion of employees in an industry) are likely to placerelatively more weight on employment rather than wages as an objective comparedto their less encompassing counterparts in other industries. Low relative coverage(which can still mean coverage of 40% or more) may lead to greater insiderism inwage setting - a lower probability of employment enhancing wage setting behaviour.
iii. bargaining decentralisation: A standard interpretation of the impact ofbargaining decentralisation is that a lower centre of gravity of bargaining leads tobetter productivity performance but a worse pay/jobs trade off. Industry or nationallevel agreements may prevent employers using productivity related settlementswhich would be more feasible in a decentralised environment. Again when relating
22
this to the "what do unions do?" debate, this is really a consideration of what dounions do in different bargaining environments rather than a pure union effectquestion.
Correlation coefficients on changes in hourly pay and employment over 1 year,4 year and 8 year periods are reported in Table 8, both for all 20 matched industriesand separately for sectors with high and low levels of bargaining decentralisation.Ten industries have less than 20% of employees covered by employer bargainingonly, while the remainder have a higher proportion covered by such arrangements.There is only one significant positive association between employment changes andpay changes in the two series (for the high bargaining decentralisation sector)suggesting little evidence of the competitive allocation of labour process in either ofthe two sectors. However, it is only in the low decentralisation sector that thenegative association between employment and pay changes in all sectors is replicated,albeit with less significant coefficients. This evidence is consistent with thehypothesis that sectors with higher levels of bargaining are more likely to exhibitemployment enhancing wage setting behaviour compared to those with a greaterdegree of single employer bargaining.
iv. worker representative presence: Potentially the best measure of union activityis the worker representative presence (WRP) index - despite the various caveats aboutwhat determines variations in presence - since it provides an indication of the degreeof union organisation at firm level within a sector. A high level of WRP mightsuggest a greater likelihood of wage drift from sector level agreements because thereare relatively more agents at local level to bargain with employers, who by weightof numbers may be difficult to control or direct from the centre by union leaders. Ahigher degree of representative presence might be associated with poorerperformance on the pay/employment front.
It turns out that the correlation coefficient results on pay and employmentchanges disaggregated by high and low WRP sectors, are very consistent with theexpected result (Table 9). Sectors with less than 40 representatives per 1000 coveredemployees exhibit a strong and significant negative coefficient for both the 4 yearperiods (1980-84 and 1984-1988) and for the full eight year period examined. Bycontrast the sectors with relatively high levels of WRP provide a less consistentpicture in the medium and long run. The one significant association is positive forthe period 1984-1988 - higher employment growth associated with relatively highergrowth in wages - whilst the coefficients for 1980-84 and 1980-88 are not significant.Although only correlations, these data are at least suggestive of a relationshipbetween the extent of union activity at workplace level and poorer economicperformance. Obviously a more persuasive analysis would require workplace orplant based samples with better measures of union organisation and activity.
d. Unions and trends in pay dispersioni. overall results: Over the whole period 1980-1988 the Spanish hourly wagestructure became more egalitarian as the sectors with the highest initial pay, hadrelatively the lowest subsequent increases, therefore the pay structure wascompressed. In our earlier paper, it was pointed out that, by contrast with the UKand US experience, the degree of pay compression was smaller in the first half of the1980s - when incomes policies were in force - compared to the second half, whenincome policies were initially relaxed and finally abandoned. This degree of pay

23
compression appeared to have beneficial knock-on effects on employment growth -hardly unexpected given the negative association between wages and employmentgrowth over the medium and long run. Sectors with relatively high initial wagesexperienced the highest growth in employment apparently because of relativelyslower growth in wages compared to those with lower starting wages. Unions aregenerally associated with a narrower wage distribution than would result in a non-unionised labour market - both external and internal. This is partly because ofempirical evidence suggesting such an association but also because of unions'tendency to organise relatively low paid workers (and by increasing their wages,compress the overall wages structure) and espoused union policies such as "rate forthe job" and anti-performance- related pay.
ii. collective bargaining coverage: Analysis of wage compression behaviour amongsectors with high or low coverage conducted in our previous paper showed thatwhilst pay compression occurred in both high and low coverage sectors (allcoefficients are negative), the correlation coefficients were more impressive for thehigh coverage sector. This seems to be quite good evidence of the positiveassociation between unions and pay dispersion, assuming less dispersion is adesirable outcome. However, given the high coverage of unions overall in Spain, weshould also be interested in investigating variations in the impact of unions indifferent environments - in this case in either decentralised or centralised bargainingand in either high local activity and low local activity sectors.
Before discussing the results it should be noted that neither theoretical norempirical work in this area has investigated variation in union effects on wagedispersion either in terms of union or collective bargaining structures. Given otherfactors associated with decentralised collective bargaining, we might well expectunions to have greater wage dispersion reducing effects in centralised bargainingenvironments - since the rate for job rather than performance related pay is morelikely to be associated with such an environment. It is rather more difficult to makepredictions about any relationship between levels of WRP - our local union activitymeasure - and changes in pay dispersion. A high relative number of shop stewardsmay indicate greater factionalism which could lead to greater dispersion as theworker representatives act as representatives of relatively smaller constituencies. Onthe other hand, high WRP might indicate a greater ability of unions to impose a ratefor the job policy on employers and therefore reduce wage dispersion. What isobviously needed is an analysis of the explanation for different levels of WRP in eachindustry or organisation. Does a high WRP indicate more extensive union activityin general or a higher degree of factionalism between work groups associated withcontrol difficulties for central union leaders? Such an analysis is beyond the scopeof this study, requiring more micro based data and case studies, but it may well beessential to understanding variations in the impact of unions in Spain.
iii. bargaining decentralisation: The correlations on pay changes compared to initialpay levels disaggregated by high and low decentralisation sectors provide somestriking results (Table 10). In the ten sectors with low levels of decentralisation, forthe second half of the 1980s and the period as a whole there are strongly significant,negative coefficients. This indicates a clear tendency towards wage compression -paradoxically even more so after the weakening of incomes policies (the coefficienton 1980-84 is negative but non-significant). In stark contrast, the correlations for the

24
high decentralisation sector are all non-significant and one is slightly positive. Thisis as predicted - centralised bargaining is associated world-wide and over time witha narrower pay distribution compared to decentralised bargaining. The key questionis what this tells us about unions and pay dispersion. If anything this suggests thatunions can have quite different effects dependent on their environment - there is nomonolithic "union effect".
The knock-on effects in terms of employment changes are more equivocal inthat although the coefficients for the low decentralisation sector are positive - as withthe aggregated data for all industries - only one (1980-88) is significant. Morepuzzling still are the results for the high decentralisation sectors where one coefficientis strongly negative and significant (1984-88), whilst the others are positive, with1980-84 strongly significant. This change in slope, whilst just about consistent withobverse changes in the signs on the pay changes/initial pay levels correlations, seemsrather odd. For 1980 to 1984, the high initial pay sectors have the highestemployment growth, whilst the reverse is true for 1984 to 1988. These resultsillustrate the pitfalls of using industry level data to investigate the impact of aninstitution which is best analysed using plant or firm level data.
iv. worker representative presence: The wage compression and knock-on effects onemployment correlation coefficients are more difficult to interpret for the high andlow WRP sectors (Table 11). There appears to be a consistent relationship betweenlow WRP and positive effects in terms of significant and strongly negative coefficientson initial wages and subsequent wage growth (for two out of the three correlations)and positive and significant initial wages/employment growth correlations (again twoout of three). However, the results for high WRP industries look less consistent. Allthree of the initial wages/wage growth correlations are negative, with onesignificantly so, but two of the initial wages/employment growth correlations arenegative, and one of these (1984-88) is significant. These results suggest that in the1984-88 period, in the high WRP sector, those industries with the highest initial wageshad the lowest subsequent wage growth, but also the lowest employment growthcompared to other sectors. Whilst we should not be too surprised by such oddresults when using industry data over a short period without control variables, theresults also suggest that the WRP measure may be a poor measure of union strengthor local activity.
e. Unions and productivityi. introduction: There is a well worked-over debate within labour economics andindustrial relations about the effects of unions on productivity. Theoretical debateturns on the union monopoly effect (restricting productivity growth) versus the unionvoice effect (improving productivity performance). A range of mechanisms withineach of these effects link union presence and activity to efficiency - such as restrictivepractices, the closed shop and industrial action on the negative side and lowerturnover, less absenteeism and greater investment in human capital on the plus side.As it is difficult to directly measure the role and impact of each of these mechanismsto judge the usefulness of the different hypotheses, most empirical work in the areahas instead tested whether or not union presence and activity is associated withbetter or worse productivity performance.

25
For the UK there now seems to be a reasonably consistent story that onaverage unions were associated with poorer productivity growth until the early 1980sbut that during the 1980s and 1990s growth had been more impressive in union thannon-union workplaces (possibly in two separate spurts in the early and late 1980s)(Gregg et al, 1993). Most commentators agree that the catch-up in productivity levelsbetween union and non-union plants is due to a combination of anti-union legislation,increased product market competition and high unemployment. In other words thepractices and attitudes which reinforced negative union effects have been reined back.It is still an open question as to whether or not the voice effects of unions have nowor will in the future take over, such that productivity levels will surpass those in non-union plants.
Turning to Spain, applying the theory is made more difficult because of certainbreaks on productivity which are not associated with unions per se - in particular thelabour ordinances and high firing costs for permanent workers. To the extent towhich they are adhered to, the labour ordinances must act as a break on functionalflexibility within firms -which is surely a more effective means to increaseproductivity rather than numerical flexibility in the form of fixed-term contracts.Similarly the high cost of firing permanent workers means that high unemploymentis unlikely to have positive spin-offs on employed worker effort - there is insufficientlabour market induced fear for a large group of protected workers. Given thesefactors we might expect a marginal impact of unions on productivity performance -perhaps by ensuring the strict enforcement of labour ordinances or making legalresources available for permanent workers threatened with dismissal.
As with the employment and pay data, the absence of firm or plant levelsurveys of industrial relations in Spain means that we are forced to fall back onindustry level data to investigate the relationship between unions and productivitygrowth. Again as it is difficult to isolate a pure union measure, we use the threeindicators employed above - bargaining coverage, levels and worker representativepresence.
If unions do have detrimental effects on productivity growth in Spain wemight expect a negative correlation between union presence - measured as collectivebargaining coverage -and productivity growth across industries. However, given thehigh general level of union coverage, we should also investigate whether or not unioneffects on productivity differ in alternative bargaining environments.
There is a strong theme in industrial relations that centralised bargainingenvironments, whilst often useful for improving the pay/jobs trade-off, are inimicalto productivity enhancing wage policies. This is the criticism levelled at both the UKexperience of incomes policies in the late 1960s and 1970s, and the Australian Accordin operation since 1983. If such analyses hold up for Spain, when comparing thedegree of decentralisation with productivity growth, we would expect to see apositive correlation over time. Note that the latter result is more likely ifdecentralisation of bargaining also means that the employer and workerrepresentatives can jointly agree to replace the industry's labour ordinances withworking practices of their own design. One note of caution, however, is thatdecentralised bargaining may not promote better productivity growth when incomespolicies are in force (until after 1986-7 in Spain's case) since the scope for productivityenhancing pay settlements is curtailed.
26
Finally on the WRP indicator, if this variable does measure the extent of localunion activity and organisation, then we might expect to find a negative correlationbetween WRP and productivity growth. Much of the rationale behind the negativeunion effect on productivity growth focuses on the influence of local representativesblocking working practice reforms at workplace level and protecting demarcationswhich contribute to relatively worse performance.
In all the results reported, productivity growth is measured as the change invalue added per head in each of 22 manufacturing industries between the years inquestion. Scatter plots and correlation coefficients are reported for three periodsagainst each union indicator -1981-86, 1986-91 and 1981-91. Note that the results donot include controls for the many other influential factors in determining differencesin productivity growth across industries, and are therefore very tentative. They aresubject to similar caveats to previous results and as mere correlations should betreated as the starting point for future analysis rather than hard and fast findingsabout union effects.
ii. collective bargaining coverage and productivity growth: The data reported inFigure 3, with the correlation coefficients reported below, suggest that there is noassociation between bargaining coverage (measured at 1986) and productivity growthacross industries in any of the three periods investigated. The coefficients are noteven consistently signed, with two positive and one negative.
There are a number of possible interpretations of these results: unions are notassociated with poorer (or superior) productivity performance perhaps because thestrength and degree of observation of labour ordinances and the role of permanentworker protection override any general union effect; bargaining coverage is tooimprecise an indicator of union presence in an industry; the industry data are tooaggregated to reveal the more important impact of unions at workplace or firm level -at industry level there are much larger forces at work determining productivitygrowth such that even with better measures of unionisation any union effect may notsurface. These interpretations can only be rejected or verified with micro level data.
iii. bargaining levels and productivity growth: Figure 4 plots changes inproductivity against the degree of bargaining decentralisation in each industry (alsomeasured at 1986) for the two five year periods and for the 10 year period as awhole. The correlation coefficients are reported below the figure. These data areconsistent with the general hypothesis that decentralised bargaining is associated withsuperior productivity performance. All three correlation coefficients are positive andtwo are significant - 1981-86 and 1981-91. On average the industries with the highestproportion of employees covered by single-employer bargaining have the highestgrowth in productivity. The fact that the 1981-86 correlation is significant, while the1986-91 correlation is not is rather curious since in the earlier period incomes policieswere in effect, whilst they were absent in the later period. Perhaps incomes policiesnorms were applied rather more flexibly in industries with high levels ofdecentralisation and that the relaxation of incomes policies prompted moreproductivity enhancing deals in multi-employer environments in the late 1980s. Thisis all worth considerably more investigation.
This result prompts a number of interesting questions which these data areunable to answer: what is the mechanism which links decentralised bargaining to

27
superior productivity performance? (alternatives include: productivity based paysettlements; evasion of labour ordinances; weaker union organisation atfirm/workplace than sector level; increased responsibility for plant performanceincreases both management and employee effort); are there possible endogeneityproblems which mean that decentralisation would not produce such positive spin-offsfor all sectors?; are these results likely to be replicated in micro level studies of firmand workplace performance?
iv. workplace representative presence and productivity growth: The final figure(Figure 5) shows data on difference in WRP by industry (in 1990) and productivitygrowth over the same three periods as previous graphs. Although all threecorrelation coefficients are negative as expected, none reach significance. This maywell be due to the bluntness of the union indicator and the relatively small numberof observations. A more accurate picture of the impact of local union activity andorganisation on labour productivity is only likely to be gleaned from a workplace-or firm-level dataset.
8. Conclusions, Policy Prescriptions and Further ResearchSpanish unions enjoy a possibly uncomfortable mix of high coverage through
their dominance of representatives in the works council system, but very lowmembership since the early 1980s. Their strength measured on these two dimensionslooks alternatively either similar to union movements in many other OECD countriesor particularly sapped compared to other movements worldwide. The workerrepresentation system has been cited as the main explanation for this high coverage,low density nexus and the mirror image of coverage growth and density decline isstriking after the system was enshrined in the legal framework of the new democracy.However, there is much to be explored here because other factors are also likelyaffecting workers' decisions to on the one hand vote in ever larger numbers for unionrepresentatives, yet on the other hand remain extremely reluctant to join those sameunions.
Information on union internal organisational structures reveals that these arealso quite heavily influenced by the collective bargaining system as determined bythe worker representation system. Both the main unions, CCOO and UGT, whichtogether comprise around three-quarters of all union members and a similarproportion of workplace representatives, are confederations comprising a number ofregional and industrial federations. Each one of these federations incorporates a bodyof branches which are usually members of both a regional and industrial federation.The duopoly of the CCOO and UGT is propagated by the mechanism for selectingwhich unions have "most representative union" status at different bargaining levels.By virtue of their dominance nationally, both the major confederations have the rightto sit on every negotiating body apart from those just operating at firm-level.
The importance of the worker representation system is further reiterated by thefact that most unions appear to have concentrated their apparently fairly limitedresources on fighting the periodic elections, to the detriment of both recruitment andencouraging the activities of shop stewards as a second channel of workerrepresentation within firms. Although permissable under the law in large firms, thelatter seem to play on a very minor role in workplace industrial relations comparedto their works council colleagues.

28
The high coverage equals high union strength conclusion is tempered by anumber of important caveats. Strength may be either procedural - being involved indecision making processes - or substantive - materially affecting those decisions - andin the Spanish case, high coverage may only represent the former type of strength.This may be especially the case if unions exercise little control over the actions anddecisions of their representatives. Given that a survey commissioned by one of thetwo main unions found that nearly a quarter of their representatives were non-members by choice (ie they did not join even after being elected), there are somegrounds for believing that control mechanisms are very loose. Finally, substantivestrength implies that unions are having some effect on performance outcomes. Highcoverage, or indeed high membership, data are not in themselves proof that unionshave significant effects either positively or negatively on such outcomes.
In order to illuminate the crucial question "What do unions do in Spain?", wemake use of rather restricted industry data on bargaining coverage, bargaining levelsand worker representative presence, to investigate three sets of outcomes -pay/employment flexibility, trends in pay dispersion and productivity growth.Empirical evidence of this sort on the impact of unions using industry level data isalways rather unsatisfactory - especially when the number of matched industries isquite small - since the scope for control variables is severely limited and theimportant intra-industry differences are completely obscured. Note also that becauseno industry records particularly union presence, strictly we are not able to measurea pure union effect - even if we had a panoply of control variables. Instead we areable to investigate what unions might be doing in different environments. A pureunion effect would only be detectable with workplace or firm-level data, with areasonable proportion of unionised and non-unionised observations. Nevertheless,these results provide at least a starting point for a more thorough, micro level set ofstudies of union effects which should aim to investigate these and other performanceindicators.
On pay and employment flexibility, there is some support for the hypothesesthat higher bargaining coverage, multi-employer bargaining and relatively low levelsof union organisation and activity are associated with more desirable outcomes thantheir counterparts. Although the data show no evidence of competitive pay flexibilityin the Spanish industry wage structure, there is evidence that in some sectors relativewage moderation is associated with superior relative employment change. Highbargaining coverage and relatively centralised bargaining appear to be associatedwith a narrowing of the pay distribution, with positive knock-on employment effects,again consistent with some theories on the impact of collective bargaining andunions. However, there is no evidence that high levels of local union activity areassociated with either a narrowing or a widening of the pay distribution. Finally,there is a positive, significant correlation between the degree of bargainingdecentralisation and productivity growth across manufacturing industry over the1980s. This is consistent with both theory and evidence from other countries on theimpact of bargaining decentralisation. Neither of the other two union indicators usedshow any significant association with inter-industry productivity growth over thisperiod.
Future research on trade unions will be inevitably linked to that on workscouncils since their recent fortunes, structures and futures are heavily intertwined.Therefore any work on, say, the economic impact of trade unionism in Spanish firms,

29
would probably need a dual focus on both what unions do and what works councilsdo. However, there are some specific union related issues worthy of furtherinvestigation.
Accurately measuring union membership in Spain is notoriously difficult withcurrent data sources and yet may well be crucial to understanding the influence ofunions in different firms and industries, how and why they operate in certain waysand the consequences for their finances. It may well be worthwhile consideringadding a question concerning union membership to the labour force survey. Theaddition of such a question to the counterpart UK survey in the late 1980s, hascertainly contributed enormously to our understanding of both changes in uniondensity and more importantly its composition across different groups in the labourforce, industries and regions. The discrepancies in individual level survey and unionreported data on membership are sufficiently large to warrant significant furtheranalysis.
Clearer illumination of the internal organisation of trade unions may providefurther insights into the fundamental question concerning what role unions play inSpain - just how much control are union leaders able to exert over theirrepresentatives at workplace, firm and sector level. We should not be surprised tofind significant differences in the degree of control at each of these levels. Thisinformation, when patched into data on the structures of collective bargaining andlocal union activity, may be invaluable in determining the impact of industrialrelations institutions in Spain.
Finally, the limited analysis of union economic effects needs significantreassessment using more disaggregated data. Researchers need to locate alternativemeasures of unionisation and union activity, and both address other economicoutcome variables and, of course, include important control variables. Such researchis only likely to be feasible once a WIRS or FIRS is completed in Spain.
It is likely to be politically unfeasible for current or future Spanishgovernments to consider implementing laws which seek to internally reform tradeunions as successive Conservative governments in the UK have done. However,unions are likely to react to and be affected by changes in any or all of the aboveinstitutions. This is definitely the case with any reforms of the collective bargainingsystem or the works council legislation, but also highly likely with the employmentprotection and industrial dispute arenas.
The tentative results of our investigation of union effects using industry-leveldata, might suggest that the government should both discourage further paybargaining decentralisation - if they are worried about pay/employment flexibilityand pay dispersion - and encourage it - if they are concerned about productivitygrowth. The negative association between high worker representative presence andsome indicators - although in substantial need of elucidation - might suggest a needto reassess the statutory minima on the number of worker representatives per firm.

30
1. Throughout this paper we use the official data on collective bargainingcoverage. However, a recent OECD report on collective bargaining coverage (OECD,1994) using data supplied by Juan Jimeno, states that the official Spanish dataoverestimate bargaining coverage, principally because of double counting, by up to20 percentage points. The Jimeno corrected figures are shown in Figure 1 and theofficial data in Table 8 and Figure 2.
2. Membership was reported in Economía y Finanzas February 1994. Density iscalculated using membership as the numerator and employed labour force (ieincluding self-employed) as the denominator taken from Boletín de EstadísticasLaborales, EPA-29, because employees in employment by region is not reported inthe Boletín. Therefore union density measured in the conventional way (withemployees in employment as the denominator) would be higher, perhaps up to 20%.
3. Earlier this year there was some reform of the computation of election results,which is likely to ease inter-union disputes over the timing of the elections. Resultsto determine representativeness will be computed continuously as elections takeplace, instead of waiting until the end of the election period.
4. CCOO held its last Confederal Congress (its 5th) on December 1991, whileUGT's last Congress (its 36th) was held more recently in April 1994.
ENDNOTES

31
APPENDIX
Data used in Tables 8 to 11 and Figures 3 to 5
1. Notes and sources
a. Employment Data
Employees in employment (asalariados) by industry
Source: Boletín de Estadísticas Laborales, Ministerio de Trabajo y SeguridadSocial, Table EPA-16.
Notes: 1. 33 classifications (matched to 20 pay classifications). Annual1980-1991 (matched to 1980-88 pay data).
b. Pay Data
Average hourly pay by industry
Source: Encuesta de Salarios en la Industria y Servicios, Instituto Nacional deEstadística.
Notes: 1. 23 classifications (matched to 20 employment classifications).Annual 1980-1988.
c. Value added data
Value added by industry
Source: Anuario Estadístico (INE), Cap. IX, 2.1.7.Notes: 1. 26 classifications (matched to 22 employment classifications).
Annual 1981-1991.
d. Collective Bargaining Data
Proportion of workers covered by any collective agreement by industryProportion of workers covered by employer bargaining only by industry
Source: Boletín de Estadísticas Laborales, Ministerio de Trabajo y SeguridadSocial. Tables Con-15 and Con-18.
Notes: 1. Employment and pay correlations: 33 classifications (matched to33 employment and 20 pay classifications). 1984 data (mid-pointof pay data series) are used to identify industries with high orlow levels of bargaining decentralisation.
2. Productivity correlations: 33 classifications (matched to 33employment and 22 value added classifications). 1986 data (mid-

32
point of value added data series) are used to calculate the degreeof bargaining coverage and the extent of decentralisedbargaining.
3. In some instances the number of workers reported covered bycollective bargaining is in excess of the number of employees inemployment. In such cases it is assumed that all workers arecovered.
e. Worker Representatives Data
Number of worker representatives per 1000 covered workers by industry (WorkerRepresentative Presence -WRP)
Source: Correspondence from Juan Jimeno, FEDEA.Notes: 1. 64 classifications (matched to 33 employment and collective
bargaining, 20 pay and 22 value added classifications). Data arefrom the 1990 worker representatives election results.
2. In instances when more are reported covered than are employed,it is assumed that 100% of employees in the industry are coveredwhen calculating the WRP figure.
2. Matched Industry Details
a. 1980-1988 Employment/Pay Correlations - 20 2-Digit Industries
Spanish English MLH
Extracción, preparación, aglomeración Coal extraction and manufacture of 11de combustibles sólidos y coquerias solid fuels
Electricidad, gas y agua Electricity, gas and water supply 15
Extracción de minerales Extraction of minerals 21
Producción y primera transformación Production and primary 22de metales transformation of metals
Industrias de productos minerales no Non-metallic minerals 24metálicos
Industria química Chemical industry 25
Fabricación de productos metálicos y Metal products, mechanical 31-32construcción de maquinaria y equipo equipment and machinesmecánico
Construcción de maquinaria y material Electrical machines and materials 33-35eléctrico, construcción de máquinas de and electronic office machines andoficina y material electrónico materials
Construcción de vehículos automóviles Cars and spare parts and naval 36-38y sus piezas de repuesto; construcción and other transport materialsnaval y otro material de transporte

33
Industrias de productos alimenticios Food, drink and tobacco 41-42bedidas y tabaco
Industria textil Textiles 43
Industrias del calzado, vestido y otras Footwear and clothing 45confecciones textiles
Industrias de la madera, corcho y Timber, cork and wooden furniture 46muebles de madera
Industrias del papel y fabricación Paper and paper products 47artículos de papel. Artes gráficas yedición
Industrias de transformación del Processing of rubber and plastic 48-49caucho y materias plásticas y otras materials and other manufacturingindustrias manufactureras industries
Construcción Construction 50
Comercio al por mayor,intermediarios; Wholesale distribution,scrap and 61-65comercio y recuperación de productos; waste metals, commission agentsy comercio al por menor and retail distribution
Restaurantes, cafés y hostelería Restaurants, cafes and hotels 66
Otros transportes terrestres Other inland transport 72
Instituciones financieras y seguros. Banking, finance, insurance, and 81-85Inmobilarias. Servicios a las empresas. business servicesAlquileres

34
b. 1981-1991 Productivity Correlations - 22 2-Digit Industries
Spanish English MLH
Extracción, preparación, aglomeración Coal extraction and manufacture of 11de combustibles sólidos y coquerías solid fuels
Extracción de petróleo y gas natural Extraction of mineral oil and 12natural gas
Electricidad, gas y agua Electricity, gas and water supply 15
Extracción de minerales Extraction of minerals 21
Producción y primera transformación de Production and primary 22metales transformation of metals
Industrias de productos minerales no Non-metallic mineral industry 24metálicos
Industria química Chemicals 25
Fabricación de productos metálicos Metal products 31
Construcción de maquinaria y equipo Mechanical machinery and 32mecánico equipment
Construcción de máquinas de oficina y Electronic office machines and 33,35material electrónico materials
Construcción de maquinaria y material Electrical machines and materials 34eléctrico
Construcción de vehículos automóviles Cars and spare parts 36y sus piezas de repuesto
Construcción naval y otro material de Naval and other transport 37,38transporte materials
Fabricación de instrumentos de Optical and similar precision 39precisión óptica y similares instruments
Industrias de productos alimenticios, Food, drink and tobacco 41-42bedidas y tabaco
Industria textil Textiles 43
Industria del cuero Leather and leather goods 44
Industrias del calzado, vestido y otras Footwear and clothing 45confecciones textiles
Industrias de la madera corcho y Timber, cork and wooden furniture 46muebles de madera

35
Industrias del papel y fabricación Paper and paper products 47artículos de papel. Artes gráficas yedición
Industrias de transformación del caucho Rubber and plastic materials 48y materias plasticas
Otras industrias manufactureras Other manufacturing industries 49

36
TABLE 1
Union Density in Spain and Other OECD Countries 1970-1990
1970 1980 1990
Australia 50.2 48.0 40.4
Belgium 45.5 55.9 51.2
France 22.3 17.5 9.8
Germany 33.0 35.6 32.9
Greece 35.8 36.7 34.1
Ireland 53.1 57.0 49.7
Italy 36.3 49.3 38.8
Japan 35.1 31.1 25.4
Netherlands 38.0 35.3 25.5
New Zealand - 56.0 44.8
Portugal 60.8 60.7 31.8
Spain 27.4 25.0 11.0
United Kingdom 44.8 50.4 39.1
United States 23.2 22.3 15.6
Notes: 1. For some countries, data do not correspond exactly to 1970 or1980.
2. In the case of Spain, the 1970 figure corresponds to 1977.
Source: OECD (1994), chapter 5.
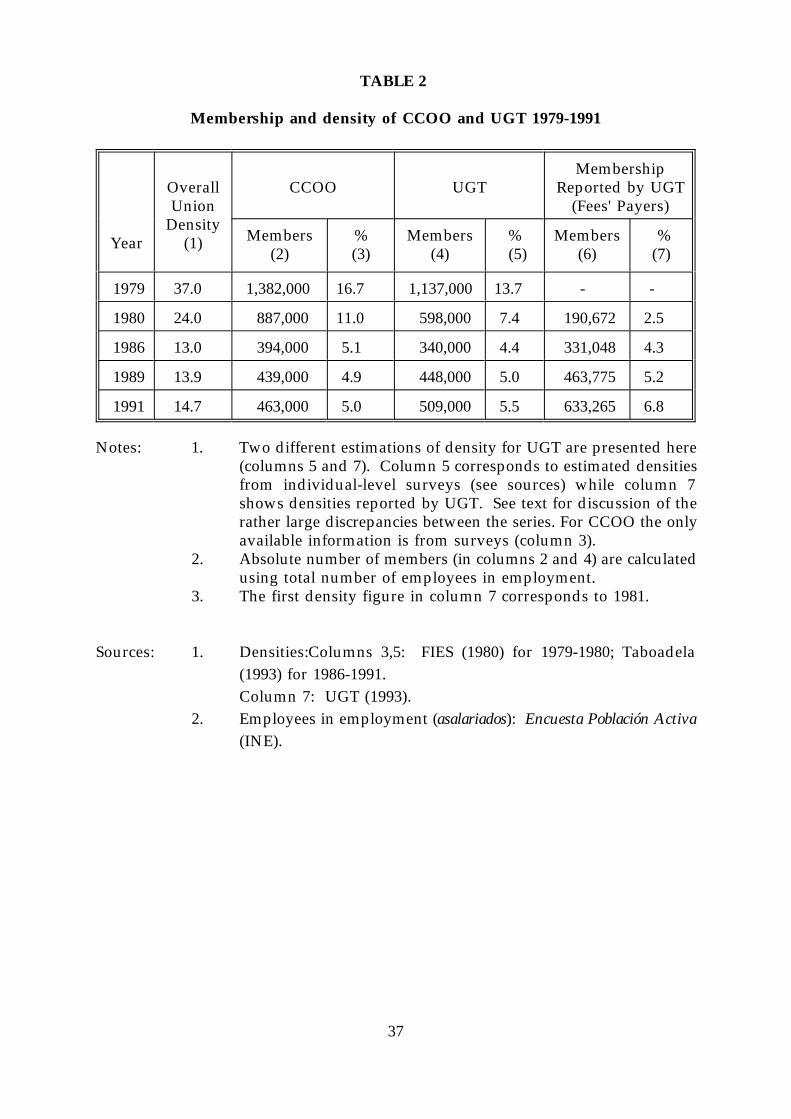
37
TABLE 2
Membership and density of CCOO and UGT 1979-1991
Year (1)
Overall CCOO UGT Reported by UGTUnion (Fees' Payers)
Density
Membership
Members % Members % Members %(2) (3) (4) (5) (6) (7)
1979 37.0 1,382,000 16.7 1,137,000 13.7 - -
1980 24.0 887,000 11.0 598,000 7.4 190,672 2.5
1986 13.0 394,000 5.1 340,000 4.4 331,048 4.3
1989 13.9 439,000 4.9 448,000 5.0 463,775 5.2
1991 14.7 463,000 5.0 509,000 5.5 633,265 6.8
Notes: 1. Two different estimations of density for UGT are presented here(columns 5 and 7). Column 5 corresponds to estimated densitiesfrom individual-level surveys (see sources) while column 7shows densities reported by UGT. See text for discussion of therather large discrepancies between the series. For CCOO the onlyavailable information is from surveys (column 3).
2. Absolute number of members (in columns 2 and 4) are calculatedusing total number of employees in employment.
3. The first density figure in column 7 corresponds to 1981.
Sources: 1. Densities:Columns 3,5: FIES (1980) for 1979-1980; Taboadela(1993) for 1986-1991.Column 7: UGT (1993).
2. Employees in employment (asalariados): Encuesta Población Activa(INE).

38
TABLE 3
Composition of Union Membership by Sector
a. UGT density rates by sector
1981 1992 (%) (%)
Agriculture 2.1 6.8
Manufacturing 3.7 9.9
Construction 2.9 5.0
Services 1.6 7.6
Total 2.5 7.9
Source: UGT (1993).
b. Distribution of CCOO and UGT Membership by Sector
UGT CCOO
1981 1990 1981 1990(%) (%) (%) (%)
Agriculture 6.3 2.3 4.3 3.2
Manufacturing 50.0 38.1 59.2 50.9
Construction 11.9 5.4 12.0 10.9
Services 31.8 54.2 24.5 35.0
100 100 100 100
Source: Taboadela (1993).

39
TABLE 4
Statutory Number of Representatives at Firm Level
Workers Representatives (reps per 1,000 workers)Worker Representative Presence
6-30 1 55.5
31-49 3 75
50-100 5 66.7
101-250 9 51.3
251-500 13 34.6
501-750 17 27.2
751-1000 21 24
Notes: 1. In firms with more than 1,000 workers, the works council musthave 2 additional members for every 1,000 workers or fraction.The maximum size of a works council is 75 members.
2. The worker representative presence has been computed choosingthe central point of each interval.
Source: Guía Laboral (1993).

40
TABLE 5
Worker Representative Elections Results
(Number of Elected Representatives and Distribution between Unions)
1978 1980 1982 1986-87 1990
Total number 193,112 164,617 140,770 175,363 237,261
UGT 21.7% 29.3% 36.7% 39.6% 42.0%
CCOO 34.5% 30.9% 33.4% 33.8% 37.0%
UGT+CCOO 56.2% 60.2% 70.1% 73.4% 79.0%
Other unions 13.4% 13.4% 17.8% 19.4% 17.5%
Non-union reps 30.4% 26.4% 12.1% 7.2% 3.5%
Note: Data for 1986-87 and 1990 include public sector representatives. The first publicsector elections were held in 1987.
Source: Beneyto (1991).
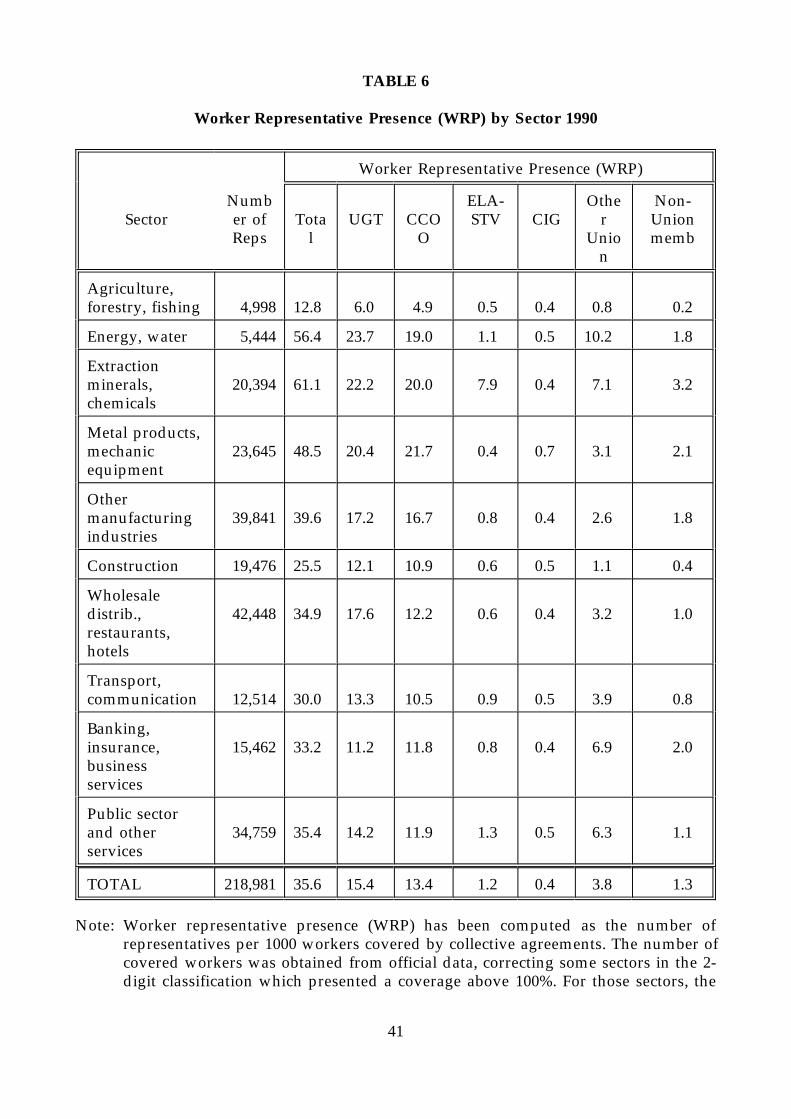
41
TABLE 6
Worker Representative Presence (WRP) by Sector 1990
Worker Representative Presence (WRP)
Sector er of Tota UGT CCO STV CIG r UnionNumb ELA- Othe Non-
Reps l O Unio membn
Agriculture,forestry, fishing 4,998 12.8 6.0 4.9 0.5 0.4 0.8 0.2
Energy, water 5,444 56.4 23.7 19.0 1.1 0.5 10.2 1.8
Extractionminerals, 20,394 61.1 22.2 20.0 7.9 0.4 7.1 3.2chemicals
Metal products,mechanic 23,645 48.5 20.4 21.7 0.4 0.7 3.1 2.1equipment
Othermanufacturing 39,841 39.6 17.2 16.7 0.8 0.4 2.6 1.8industries
Construction 19,476 25.5 12.1 10.9 0.6 0.5 1.1 0.4
Wholesaledistrib., 42,448 34.9 17.6 12.2 0.6 0.4 3.2 1.0restaurants,hotels
Transport,communication 12,514 30.0 13.3 10.5 0.9 0.5 3.9 0.8
Banking,insurance, 15,462 33.2 11.2 11.8 0.8 0.4 6.9 2.0businessservices
Public sectorand other 34,759 35.4 14.2 11.9 1.3 0.5 6.3 1.1services
TOTAL 218,981 35.6 15.4 13.4 1.2 0.4 3.8 1.3
Note: Worker representative presence (WRP) has been computed as the number ofrepresentatives per 1000 workers covered by collective agreements. The number ofcovered workers was obtained from official data, correcting some sectors in the 2-digit classification which presented a coverage above 100%. For those sectors, the

42
total number of employees has been used. In the 1-digit classification of the table,all sectors are affected by these corrections, apart from energy, construction,transport and banking.
Sources: 1. Worker representatives elections results, 1990: correspondence fromJ.Jimeno.
2. Number of workers covered by collective bargaining by industry:Boletín Estadísticas Laborales (Nov.1993), Table CON-15.
3. Employers in employment by industry: Boletín Estadísticas Laborales(Nov.1993), Table EPA-16.

43
TABLE 7
Summary Data on Union Presence in Spain 1978-1990
Year Employees Covered Electorate Voting Members% % % % % Union
1978 8,456.6 53.9 _ _ 37.0
1980 8,032.5 76.3 41.9 _ 24.0
1982 7,733.8 81.2 38.6 29.4 _
1986 7653.9 82.0 54.3 43.3 13.0
1990 9273.4 82.2 57.9 44.7 14.7
Note: The first and last figures for union density correspond to 1979 and 1991,respectively.
Sources: 1. Employees in employment: Encuesta Población Activa (EPA).2. Coverage: Boletín Estadísticas Laborales (Nov.1993), Table CON-1.3. Electorate, proportion voting: García et al (1994).4. Union density: Table 2.

44
TABLE 8
Correlations Coefficients on Hourly Pay and Employment using Data for 20 2-DigitIndustries - Disaggregated by Degree of Bargaining Decentralisation (BD)
Association Between Employment Changes and Pay Changes
Correlation Coefficients Hourly Pay
Years Overall Correlation 10 Industries with 10 Industries with HighLow BD BD
1981 0.0882 -0.0622 0.4038
1982 -0.1642 0.1490 -0.3637
1983 -0.0413 -0.4619 0.3279
1984 -0.0112 0.2611 -0.3801
1985 0.2059 0.3497 -0.1890
1986 -0.2339 -0.0394 -0.3274
1987 0.1128 -0.2484 0.5999***
1988 -0.3359 -0.3843 0.3718
1980-1984 -0.2963 -0.7659*** 0.1148
1984-1988 -0.4789*** -0.4741* 0.1430
1980-1988 -0.4775*** -0.5029* 0.2682
Notes and Sources:1. BD = proportion of workers covered by single employer bargaining only.
High or low defined as above or below the median = 19.97.2. See appendix.3. Significance levels: * 10%, ** 5%, *** 1%.

45
TABLE 9
Correlations Coefficients on Hourly Pay and Employment using Data for 20 2-DigitIndustries - Disaggregated by High and Low Worker Representative Presence (WRP)
Association between Employment Changes and Pay Changes
Years Correlation Coefficients Hourly Pay
Overall 10 Industries with 10 Industries withCorrelation Low WRP High WRP
1981 0.0882 0.0763 -0.0472
1982 -0.1642 0.2642 -0.4438
1983 -0.0413 -0.6906*** 0.7713***
1984 -0.0112 -0.0534 0.1057
1985 0.2059 0.0745 -0.0098
1986 -0.2339 -0.1154 0.0377
1987 0.1128 -0.1114 0.0332
1988 -0.3359 -0.3816 0.3616
1980-1984 -0.2963 -0.8110*** -0.0419
1984-1988 -0.4789*** -0.5454*** 0.5592***
1980-1988 -0.4775*** -0.6846*** 0.2098
Notes and Sources:1. WRP = number of worker representatives per 1000 covered workers. High
or low defined as above or below the median = 40.47.2. See appendix.3. Significance levels *10%, **5%, ***1%
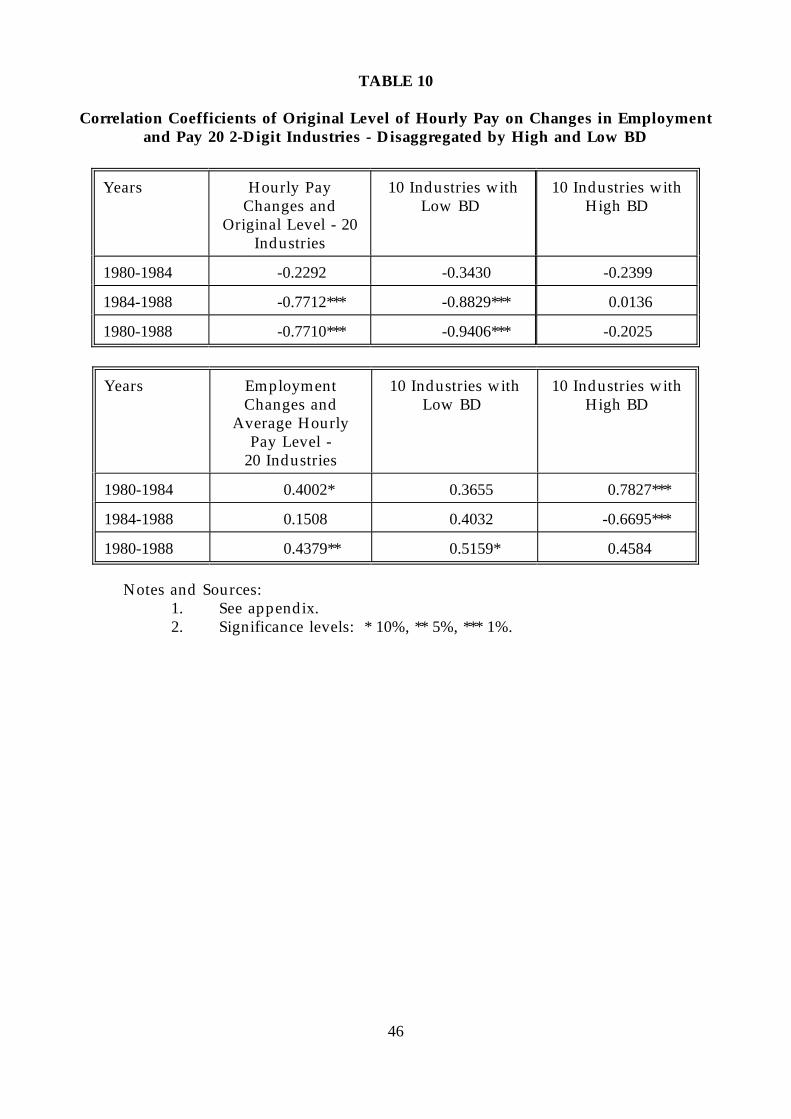
46
TABLE 10
Correlation Coefficients of Original Level of Hourly Pay on Changes in Employmentand Pay 20 2-Digit Industries - Disaggregated by High and Low BD
Years Hourly Pay 10 Industries with 10 Industries withChanges and Low BD High BD
Original Level - 20Industries
1980-1984 -0.2292 -0.3430 -0.2399
1984-1988 -0.7712*** -0.8829*** 0.0136
1980-1988 -0.7710*** -0.9406*** -0.2025
Years Employment 10 Industries with 10 Industries withChanges and Low BD High BD
Average HourlyPay Level -
20 Industries
1980-1984 0.4002* 0.3655 0.7827***
1984-1988 0.1508 0.4032 -0.6695***
1980-1988 0.4379** 0.5159* 0.4584
Notes and Sources:1. See appendix.2. Significance levels: * 10%, ** 5%, *** 1%.

47
TABLE 11
Correlation Coefficients of Original Level of Hourly Pay on Changes in Employmentand Pay 20 2-Digit Industries - Disaggregated by High and Low WRP
Years Hourly Pay Changes 10 Industries with 10 Industries withand Original Level - Low WRP High WRP
20 Industries
1980- 1984 -0.2292 -0.3940 -0.1014
1984-1988 -0.7712*** -0.8666*** -0.4927*
1980-1988 -0.7710*** -0.9227*** -0.3069
Years Employment Changes 10 Industries with 10 Industries withand Average Hourly Low WRP High WRP
Pay Level - 20Industries
1980-1984 0.4002* 0.5627** 0.3507
1984-1988 0.1508 0.3962 -0.7734***
1980-1988 0.4379** 0.5863*** -0.1125
Notes and Sources:1. See appendix.2. Significance levels: * 10%, ** 5%, *** 1%.

48

49

50

51
FIGURE 3
Collective Bargaining Coverage and Changes in Labour Productivity in 22Spanish Manufacturing Industries 1981-1991
Correlation Coefficients:1981-1986= 0.17371986-1991=-0.16241981-1991= 0.0164
Notes and Sources: 1. See appendix.

52
FIGURE 4
Collective Bargaining Level and Changes in Labour Productivity in 22 SpanishManufacturing Industries 1981-1991
Correlation Coefficients:1981-1986= 0.4954***1986-1991= 0.11071981-1991= 0.4050**
Notes and Sources:1. See appendix.

53
FIGURE 5
Worker Representative Presence and Changes in Labour Productivity in 22Spanish Manufacturing Industries 1981-1991
Correlation Coefficients:1981-1986=-0.07741986-1991=-0.16241981-1991=-0.1276
Notes and Sources:1. See appendix.

54
REFERENCES
Beneyto, P.J., (1991), `Elecciones Sindicales 1990 en la Comunidad Valenciana', Revistade Treball, 17, Generalitat Valenciana.
Blanchflower, D. and Freeman, R., (1992), `Unionism in the United States and OtherAdvanced OECD Countries', Industrial Relations, Vol.31.1, pp.56-79.
Caruth, A. and Disney, R., (1988), `Where Have Two Million Trade Union MembersGone?', Economica, Vol.55, pp.1-19.
Comisiones Obreras (CCOO) (1992), Confederal Statutes and Documents from the5th Congress.
Denny, K. and Nickell, S, (1992), `Unions and Investment in British Industry',Economic Journal, 102.413, pp.874-887.
Disney, R., (1990), `Explanations of the Decline in Union Density in Britain: AnAppraisal', British Journal of Industrial Relations, Vol.28.2, pp.165-177.
Escobar, M., (1993), `Works or Union Councils? The Representative System inMedium and Large Sized Spanish Firms', Instituto Juan March de Estudios eInvestigaciones, Working Paper No.43.
Fundación para la Investigación Económica y Social (FIES) (1979, 1980), Surveys onunion density, reported in Alvira, F. and García López, J., `Las RelacionesIndustriales: Un Problema a la Paz Laboral', Papeles de Economía Española, nº 4,1990, FIES.
Freeman, R. and Medoff, J., (1984), What do unions do?, Basic Books: New York.
García, J., Rodríguez-Sañudo, F. and Gutiérrez, R., (1994), `Los Criterios deRepresentatividad y su Incidencia en la Configuración del Sistema Español deRepresentación Sindical', Bank of Spain, mimeo.
Gregg, P., Machin, S. and Metcalf, D., (1993), `Signals and Cycles? ProductivityGrowth and Changes in Union Status in British Companies, 1984-89', EconomicJournal, 103.419, pp.894-907.
Instituto IDES (1989), `Estudio Sociológico Sobre las Orientaciones, Actitudes yDemandas Sindicales de los Trabajadores Españoles', Estudios y Encuestas, No. 15.
Lawlor, T. and Rigby, M., (1986), `Contemporary Spanish Trade Unions', IndustrialRelations Journal, Vol.17.3, pp.249-265.
Milner, S., `Industrial Disputes and the Law in Spain', London School of Economics,Centre for Economic Performance Discussion Paper No.250, July 1995.
Milner, S., `Charting the Coverage of Collective Pay Setting Institutions in Britain:1895-1990', London School of Economics, Centre for Economic PerformanceDiscussion Paper No. 215, December 1994.
55
Milner, S., Metcalf, D. and Nombela G., `Employment Protection Legislation andLabour Market Outcomes in Spain', London School of Economics Centre for EconomicPerformance Discussion Paper No.244, May 1995.
Milner, S. and Metcalf, D., `Spanish Pay Setting Institutions and PerformanceOutcomes', London School of Economics, Centre for Economic Performance,Discussion Paper No.198, June 1994.
OECD (1985a), Employment Outlook, Paris.
OECD (1985b), Employment Outlook, Paris.
OECD (1994), Employment Outlook, July, OECD: Paris.
Segura, J., Durán, F., Toharia, L. and Bentolila, S., (1991), Análisis de la ContrataciónTemporal en España, Ministerio de Trabajo y Seguridad Social, Madrid.
Taboadela, O., (1993), `La Afiliación Sindical: Hacia una Aproximación al Sistemade Representación de Intereses en el Sindicalismo Contemporáneo', PhD dissertation,Universidad Complutense, Madrid.
Unión General de Trabajadores (UGT) (1992), Afiliación Sindical en la FunciónPública, Madrid.
UGT (1993), Consideraciones Sobre la Afiliación Sindical, Madrid.
UGT (1994), Confederal Statutes and Resolutions from the 36th Congress.
Willman, P., Morris, T. and Aston, B., (1993), Union Business: Trade UnionOrganisation and Financial Reform in the Thatcher Years, Cambridge UniversityPress: Cambridge.