trade choices you have $1,000 to spend and your alternatives are: purchase 1 u.s.-made television...
TRANSCRIPT

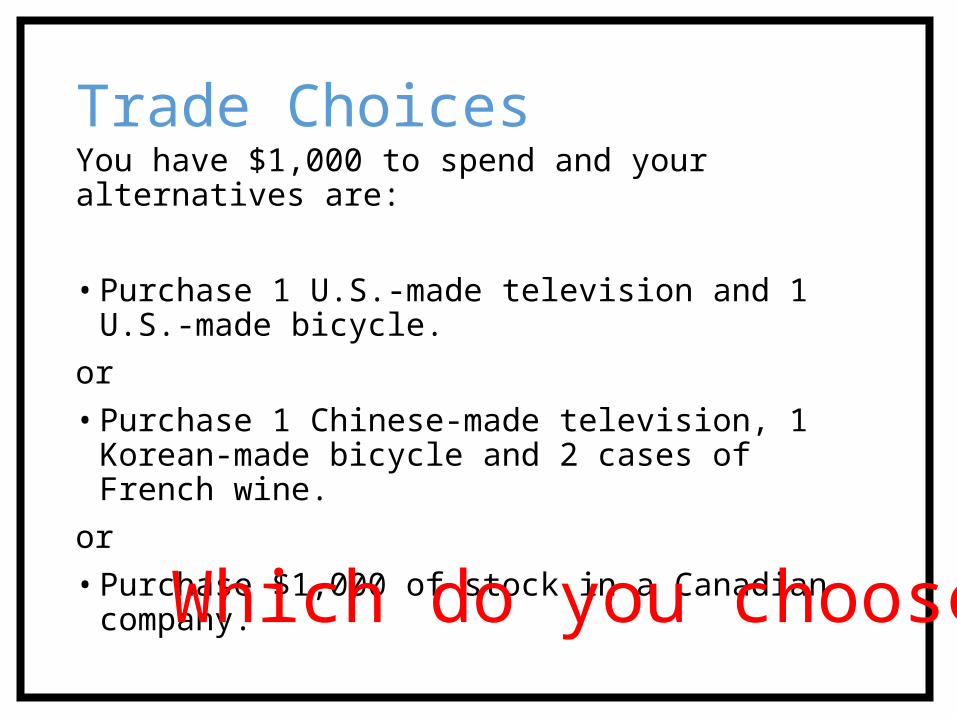
Trade ChoicesYou have $1,000 to spend and your alternatives are:
• Purchase 1 U.S.-made television and 1 U.S.-made bicycle.or• Purchase 1 Chinese-made television, 1 Korean-made bicycle
and 2 cases of French wine.or• Purchase $1,000 of stock in a Canadian company.
Which do you choose?

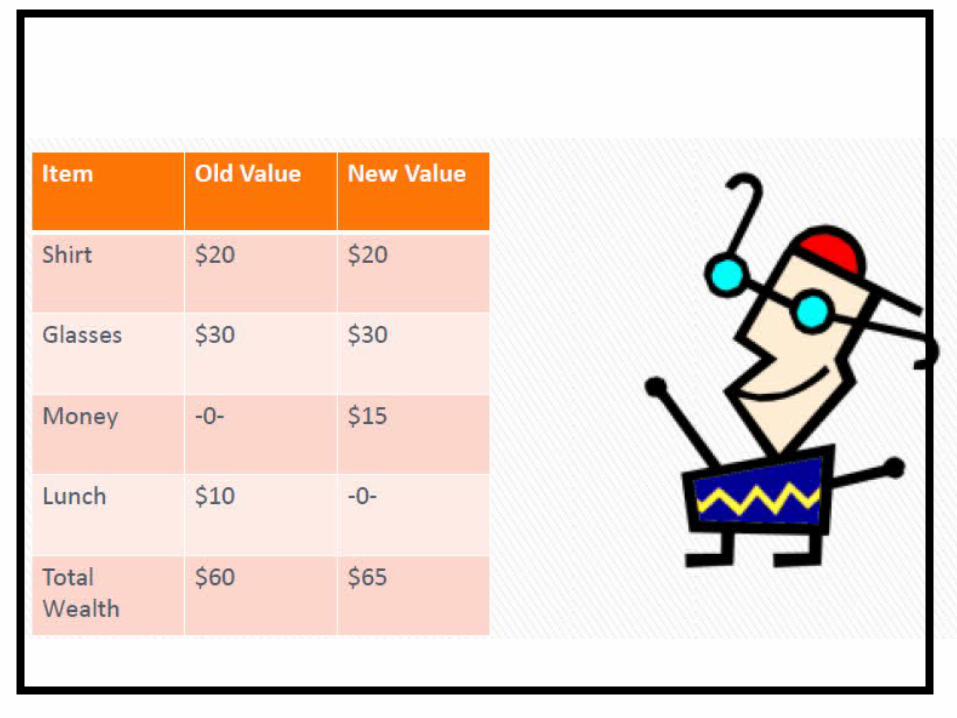
Voluntary Trade
Creates Wealth
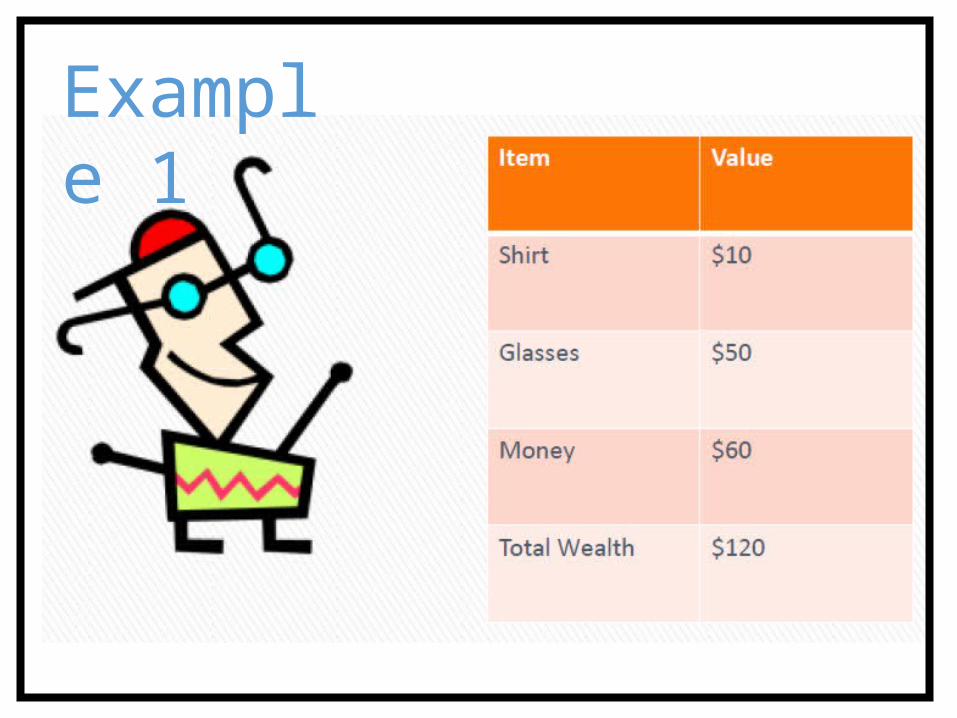
Example 1
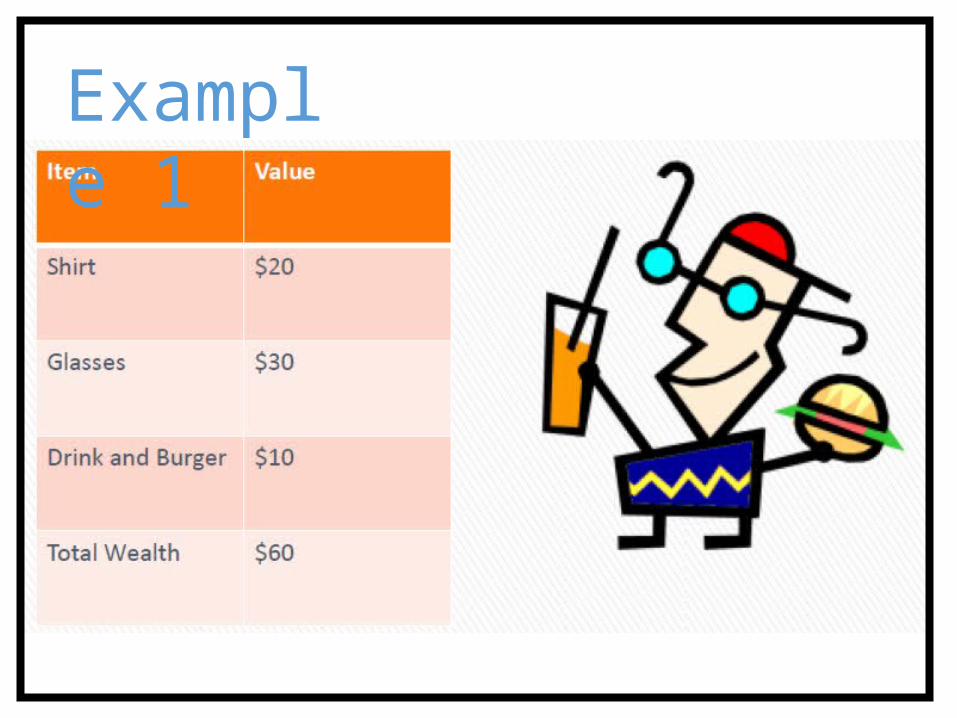
Example 1


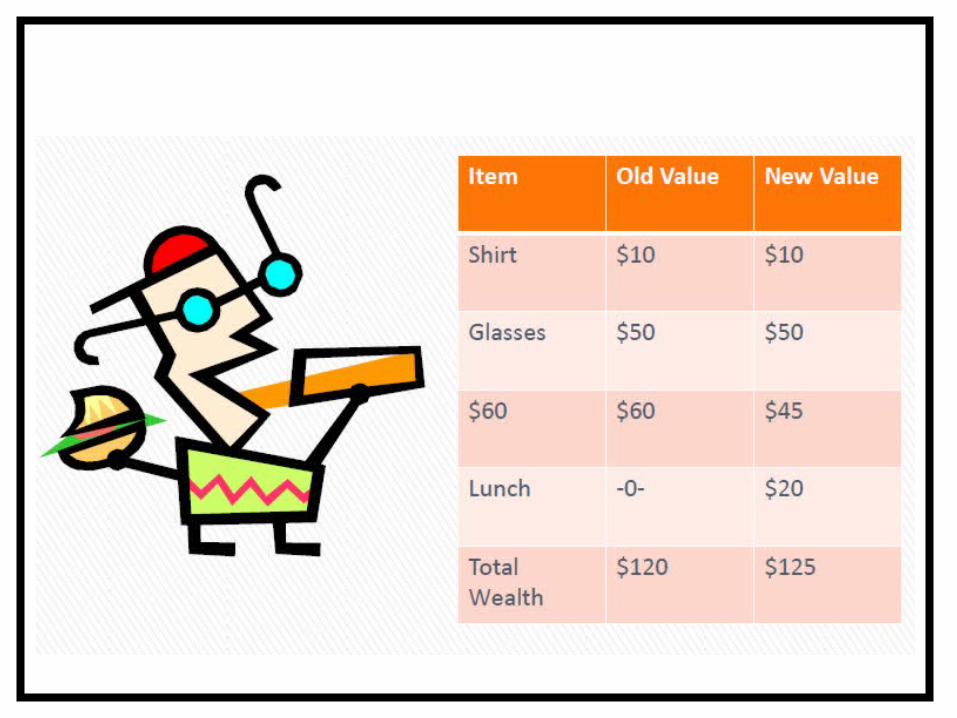

Win - Win

Win – Win ?

Win – Win ??

Win – Win ???

Apples and Oranges
• Apple price $.70/lb• Orange Price $.70/lb
• Washington Grower• 20 acres yields• Apples 50 bu/acre• Oranges 1bu/acre
• Florida Grower• 20 acres yields• Apples 2bu/acre• Oranges 40 bu/acre
Trade & Comparative Advantage – Example

Rank Country Exports Imports Total Trade
% of Total Trade
--- Total, All Countries
665.2 948.2 1,613.4 100.0%
1 Canada 127.0 141.0 268.0 16.6%2 China 49.3 174.5 223.8 13.9%3 Mexico 98.3 119.0 217.2 13.5%4 Japan 27.7 55.3 82.9 5.1%5 Germany 21.1 50.2 71.3 4.4%6 Korea, South 18.8 27.9 46.7 2.9%7 United Kingdom 21.3 22.4 43.7 2.7%8 France 13.1 19.7 32.8 2.0%9 Saudi Arabia 7.2 24.4 31.6 2.0%
10 Brazil 17.7 11.2 29.0 1.8%
Top 10 U.S. Trade Partners, Total Trade, Year to Date (May, 2014)
US$, bn, unrevised
http://www.census.gov/foreign-trade/statistics/highlights/top/top1405yr.html

Rank Country Imports % of Total
Imports--- Total, Top 15
Countries726.5 76.6%
1 China 174.5 18.4%
2 Canada 141.0 14.9%
3 Mexico 119.0 12.5%
4 Japan 55.3 5.8%
5 Germany 50.2 5.3%
6 Korea, South 27.9 2.9%
7 Saudi Arabia 24.4 2.6%
8 U.K 22.4 2.4%
9 France 19.7 2.1%
10 India 19.2 2.0%
Country Exports % of Total
ExportsTotal, Top 15 Countries
477.5 71.8%
Canada 127.0 19.1%
Mexico 98.3 14.8%
China 49.3 7.4%
Japan 27.7 4.2%
U.K. 21.3 3.2%
Germany 21.1 3.2%
Korea, South 18.8 2.8%
Netherlands 17.9 2.7%
Brazil 17.7 2.7%
Hong Kong 16.8 2.5%
U.S. Trade, Imports & Exports, Year to Date (May, 2014)
US$, bn, unrevised
http://www.census.gov/foreign-trade/statistics/highlights/top/top1405yr.html

Rank Country Surplus1 Hong Kong 14.52 Netherlands 8.83 United Arab
Emirates7.6
4 Australia 6.75 Brazil 6.56 Singapore 6.17 Belgium 5.38 Panama 4.29 Argentina 2.7
10 Egypt 2.6
Rank Country Deficit1 China -28.82 Germany -6.63 Japan -5.14 Mexico -4.35 Canada -2.86 Korea, South -2.77 Saudi Arabia -2.78 India -2.49 Ireland -2.1
10 Italy -2.1
U.S. Trade Surplus & Deficit, Year to Date (May, 2014)
US$, bn, unrevised
http://www.census.gov/foreign-trade/statistics/highlights/top/top1405yr.html

http://www.census.gov/foreign-trade/data/index.html
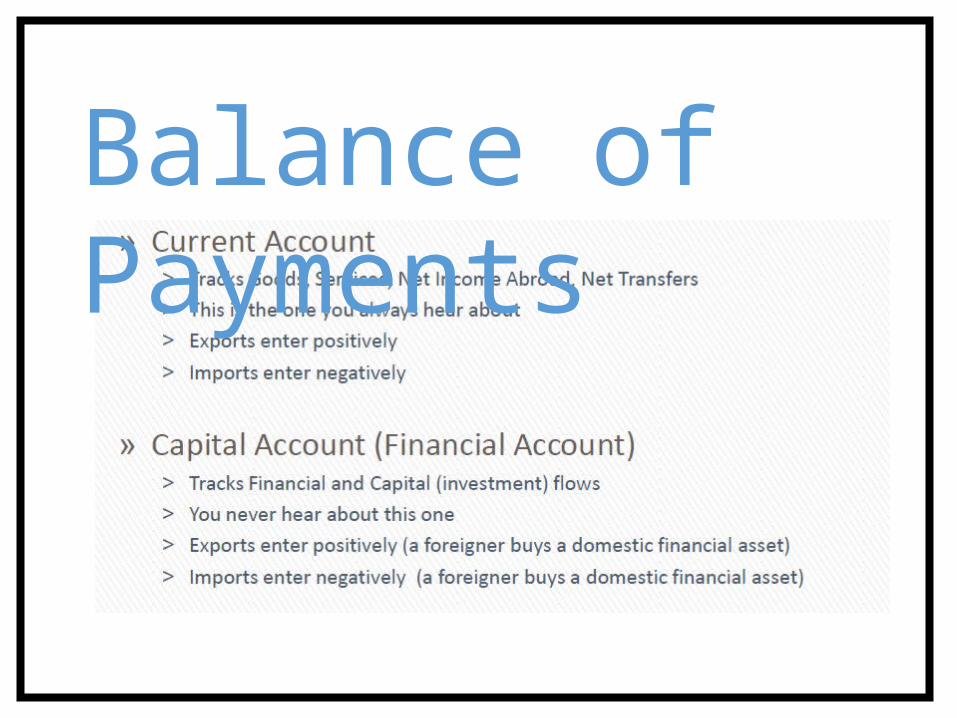
Balance of Payments

Example

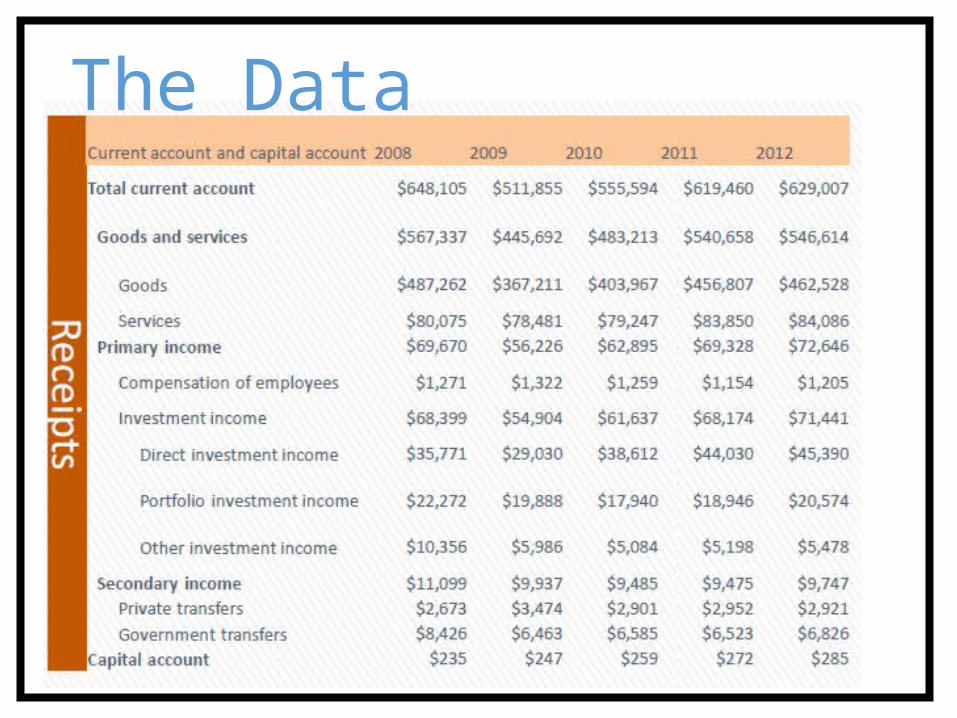
The Data

The Data

The Balances
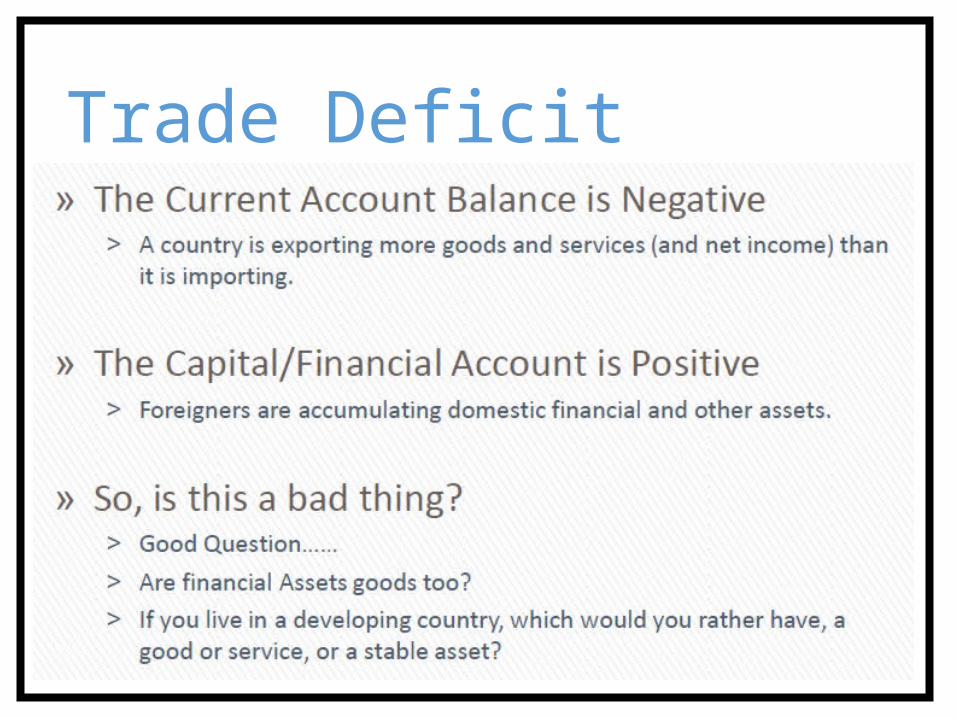
Trade Deficit
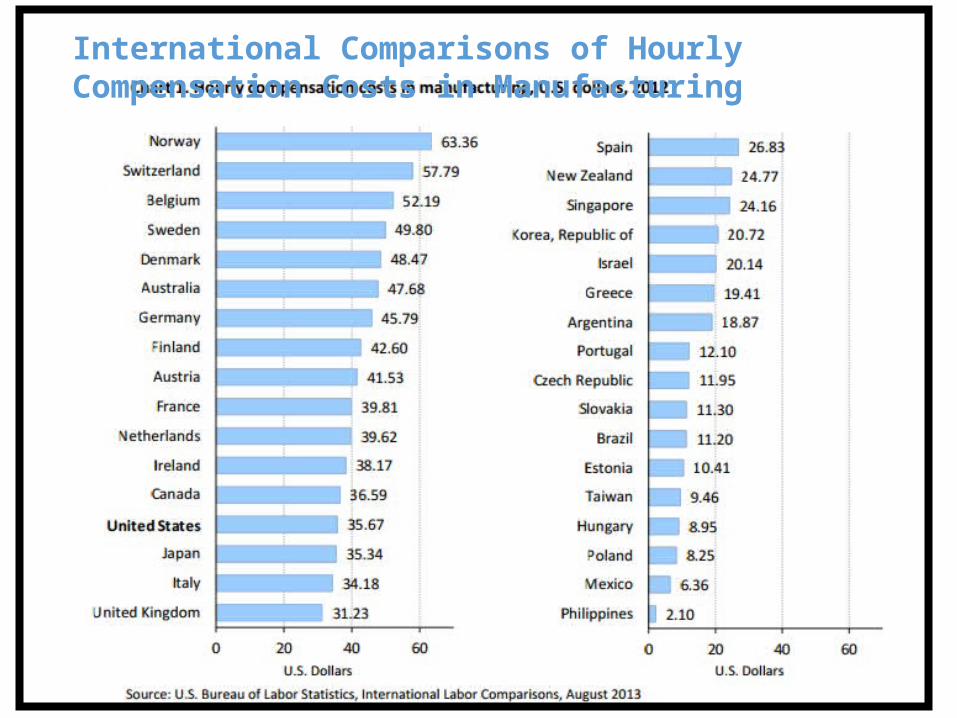
International Comparisons of Hourly Compensation Costs in Manufacturing