trade and geography in the economic origins of islam ... et al - trade...jel classification...
TRANSCRIPT
Trade and Geography in the Economic Origins of Islam: Theory and
Evidence∗
Stelios Michalopoulos†, Alireza Naghavi‡, Giovanni Prarolo§
First Draft: July, 2009This Draft: May, 2010
Abstract
This research examines the economic origins of Islam and uncovers two empirical regularities. First,
Muslim countries, virtual countries and ethnic groups, exhibit highly unequal regional agricultural
endowments. Second, Muslim adherence is systematically larger along the pre-Islamic trade routes in
the Old World. The theory argues that this particular type of geography (i) determined the economic
aspects of the religious doctrine upon which Islam was formed, and (ii) shaped its subsequent economic
performance. It suggests that the unequal distribution of land endowments conferred differential gains
from trade across regions, fostering predatory behavior from the poorly endowed ones. In such an
environment it was mutually beneficial to institute a system of income redistribution. However, a
higher propensity to save by the rich would exacerbate wealth inequality rendering redistribution
unsustainable, leading to the demise of the Islamic unity. Consequently, income inequality had to
remain within limits for Islam to persist. This was instituted via restrictions on physical capital
accumulation. Such rules rendered the investments on public goods, through religious endowments,
increasingly attractive. As a result, capital accumulation remained low and wealth inequality bounded.
Geography and trade shaped the set of economically relevant religious principles of Islam affecting its
economic trajectory in the preindustrial world.
Keywords: Religion, Islam, Geography, Physical Capital, Human Capital, Land Inequality, Wealth
Inequality, Trade.
JEL classification Numbers: O10, O13, O16, O17, O18, F10, Z12.
∗The authors would like to thank Daron Acemoglu, Quamrul Ashraf, Roland Benabou, Maristella Botticini, MatteoCervellati, Ernesto Dal Bo, Allan Drazen, Skander Esseghaier, Ioanna Grypari, Oded Galor, Gordon Hanson, Andros
Kourtellos, Timur Kuran, Beatrice Manz, Peter Neary, Gianmarco Ottaviano, Jean-Philippe Platteau, Giulio Soravia,
Thierry Verdier and Robert Woodberry for valuable comments and suggestions. We would like, also, to thank participants
at the Collegio Carlo Alberto, University of Bologna, NBER Summer Institute 2009, the NBER conference on the Economics
of Religion, the NEUDC 2009, the CEPR conference on Economics of Culture, Institutions, and Crime, Northeastern
University, Toulouse School of Economics, Stockholm University, Tufts University, University College Dublin, University of
Los Andes, University of Milan and University of Oxford for valuable comments.†Tufts University, Braker Hall, 8 Upper Campus Rd., Medford, MA 02155. E-mail: [email protected].
The author was a visiting Fellow at Collegio Carlo Alberto while this project was written and gratefully acknowledges their
hospitality. Funding from Faculty Research Awards Committee at Tufts University is also acknowledged.‡University of Bologna and FEEM. Department of Economics, Piazza Scaravilli 2, 40126 Bologna, Italy, E-mail:
[email protected]§University of Bologna and FEEM. Department of Economics, Piazza Scaravilli 2, 40126 Bologna, Italy, E-mail: gio-
0
1 Introduction
Religion is widely viewed in the realm of social sciences as instrumental for the understanding of socioeco-
nomic processes. Within economics, there has been a large and growing literature beginning with Barro
and McCleary (2003), that links religious affiliation and religiosity to differences in economic performance
across countries. Similarly, within sociology, anthropology, political science, psychology and history, the
volume of work investigating the causes and effects of religion attests to its paramount importance.
Nevertheless, despite the prominence of religion as a focal research topic across disciplines, its origins
within economics are poorly understood. Consequently, identifying the forces behind the formation of
religious adherence will greatly enhance our understanding of the phenomenon and its implications for
comparative economic development. This study examines theoretically and empirically the economic
origins and spread of Islam.
A novel and defining feature of this paper is that it provides a systematic exploration of the deter-
minants of Muslim adherence within as well as across countries, shedding light on the geographic roots
of Islam. In particular, the empirical investigation, conducted at various levels of spatial aggregation,
establishes that inequality in regional agricultural potential and proximity to pre-Islamic trade routes
are both fundamental determinants of contemporary Muslim adherence.
In the context of the proposed theory this particular type of geography conferred differential gains
from trade across regions, fostering predatory behavior from the poorly endowed ones. In an environ-
ment of conflicting interests brought about by the unequal geography, cultivators in productive lands
faced a significant threat when engaging in trade. This led to concessions towards dwellers in poor
regions to secure passage and access to trade networks, and in turn the endogenous adoption of the
Islamic economic doctrine.1 The resulting pact could manifest itself in the classic form of static income
redistribution, that is a simple income transfer from the rich towards the poor. However, to the extent
that bequests are increasing with income the presence of static income redistribution alone would allow
for income inequality to exacerbate over time. Hence, to prevent bequests from exclusively benefiting
the heirs of the rich, restrictions on physical capital accumulation were implemented. Such limits in
the context of the proposed theory, distorted the relative returns to the factors of production against
capital accumulation inducing investments in labor productivity through religious endowments (dynamic
income redistribution).2 So, the Islamic economic principles allowed the Muslim lands to escape from
a state of constant feuding and flourish in the preindustrial world, though limiting their potential for
growth in the eve of large scale shipping trade and capital-intensive industrialization.
As the theory emphasizes the importance of unequal productive endowments and trade opportu-
nities in the formation of Islam, we test its predictions empirically by constructing new data on (i) the
1Section 2 discusses in detail the role of trade in the formation and expansion of Islam as well as the Islamic economic
principles this paper focuses upon.2We thank Thierry Verdier for suggesting the distinction between static versus dynamic redistribution.
1
historical trade routes on the eve of Islam and (ii) the regional potential for agriculture. In a stage
of development when land determines productive capabilities, regional agricultural suitability plays a
fundamental role in shaping the potential of a region to produce a surplus and thus engage and profit
from trade. Combining this data with information on Muslim adherence at a disaggregated level we
perform a series of empirical tests.
First, to mitigate the concerns related to the endogeneity of contemporary political boundaries,
inherent to the literature on cross-country regressions, we arbitrarily divide the world into geographic
entities, called virtual countries. Consistent with the theory, we find that Muslim adherence is system-
atically related to the underlying regional inequality in agricultural potential. Arguably, modern states
have differentially affected religious affiliation via state-sponsored religion, for example. As such it is
crucial to account for these state specific histories. Unlike a cross-country analysis, this is feasible in
the context of virtual country regressions, where we show that the results are robust to the inclusion of
country fixed effects. These results remain robust (i) when we account for the proximity to trade routes
and (ii) after controlling for contagion effects, that is, conversions provoked by proximity to Mecca and
the borders of Muslim empires.
A second noteworthy feature of the empirical analysis is that it focuses across ethnicities by taking
further advantage of information on the traditional location of ethnic groups. Consistent with the
hypothesis that Islamic principles provided an attractive social contract for populations residing along
productively unequal regions, we find that Muslim adherence increases in the degree of geographic
inequality. The results demonstrate that Islam spread successfully among groups historically located
in agriculturally poor regions featuring few pockets of fertile land. It was along these places that
the Islamic institutional arrangement would be appealing to the indigenous populations. Third, the
importance of geography in shaping Muslim representation is validated at a cross-country level. In
countries characterized by more unequal land endowments their inhabitants are more likely to be Muslim.
While we do not rule out the spread of Islam through conquests, we show that our results hold
true along regions outside the Muslim empires where forced conversion is a lesser concern. Focusing on
these territories allows us to single out the effect of geography by abstracting from other issues that may
arise within Muslim empires, such as coercion, migration, and efforts to maximize tax revenue.3 Indeed,
the acceptance of Islam through most of Inner Asia, South-East Asia, and Sub-Saharan Africa is well
known to have occurred through contacts with merchants and as a means of entry into extensive trading
networks, Lapidus (2002) and Insoll (2003). This is the reason why proximity to pre-Islamic trade routes
is an important variable in our empirical analysis.4 Notably, while the link between pre-industrial trade
3Jews and Christians were subject to higher taxes than Muslims in exchange for economic and political rights and
security, Lewis (2003).4The independent role of proximity to trade routes in the spread of Islam may be exemplified by the case of Indonesia,
whose location along highly lucrative commercial routes precipitated the spread of Islam since the 11 century despite a
fairly equally distributed regional agricultural potential, Ricklefs (1991).
2
routes and Islam has been a widely accepted hypothesis among historians, this is the first study to our
knowledge that produces systematic empirical evidence on the role of pre-Islamic trade routes in the
spread of Islam.
Related Literature
The link between the structure of production and institutional formation was early identified by Marx
(1833 [1970]). According to Marx (1833 [1970]), religion is like any other social institutions in that
it is dependent upon the economic realities of a given society, i.e. it is an outcome of its productive
forces. Similarly, this study argues that since Islam emerged when land dictated productive decisions, the
Islamic institutional arrangement had to be compatible with the conflicting interests of groups residing
along regions characterized by a highly unequal distribution of agricultural potential.5
Religion has been viewed as being both a cause and an outcome of economic development with We-
ber (1905 [1930]) pioneering the independent role of Protestant ethics in fostering economic progress.6
In the last decade, the cross—country growth literature has seen an increased interest on the relation-
ship between religion and politico-economic performance. For example, Barro and McCleary (2006a,
2006b) provide an overview regarding the interaction of religion with political economy and show that
religious beliefs affect economic growth whereas overall religiosity declines with economic development.
Nevertheless, the evidence regarding the impact of Islam on economic and political indicators is at best
controversial. Some studies identify a negative effect, see La Porta et al. (1997) and Barro and McCleary
(2003), whereas others conclude that the effect is positive or insignificant, see Pryor (2007) and Martin
et al. (2004).7 The current study contributes to this literature by showing that Muslim adherence is
systematically higher in places characterized by unequal agricultural endowments, thus, (non) findings
relating Islam to economic and political outcomes have to be carefully interpreted.
The results of this research are also directly related to the literature on economic development and
institutions. Studies by Engerman and Sokoloff (1997, 2002) and Acemoglu et al. (2001, 2002) among
5Within economics religious affiliation has been linked to the formation of a common identity. For example, Iannaccone
(1992) considers religion as a club good featuring positive congestion externalities and shows how people choose rationally
to participate in a religion that involves voluntary limitations. Greif (1994) offers the distinction between individualistic
and collectivistic societies and analyzes how these shaped religious affiliation and determined the transaction costs between
and within communities.6Becker and Woessmann (2009) show in a recent study, however, that the significant association between Protestantism
and economic prosperity across counties in late 19th-century Prussia may be attributed to differences in the literacy
between protestant and non protestant regions. Along the same lines, Botticini and Eckstein (2005, 2007) document how
an exogenous change in the Judaic religious doctrine in the 2nd century transformed the Jewish human capital towards
literacy providing them with a comparative advantage in urban, skilled occupations several centuries later. On the role
of the economic environment in affecting religious rules, Cervellati et al. (2008) provide a theory where differences in the
religious norms regarding charity versus self-responsibility, i.e. Catholicism versus Protestantism, depend on the relative
importance of luck versus effort when individuals invest in human capital and face non-insurable idiosyncratic income
shocks.7Platteau (2008, 2009) provide a detailed account of the relationship between religion and politics in Islam arguing
that whereas religion is subordinate to politics, it is when the state falls into crisis when both the ruler and his political
opponents try to outbid each other by using the religious idiom.
3
others, have highlighted the role of geography in shaping the type of institutions (extractive versus
growth promoting) that colonizers established during the process of the colonization. Our approach
complements this literature by empirically demonstrating that the Muslim world follows a consistent
geographic pattern. Islamic principles were devised as a means of governing the divergent interests
of highly unequal regions in the beginning of 7 century Arabia. Islam, consequently, expanded and
eventually persisted across ethnic groups and territories featuring similarly unequal land endowments.
This is a prime example of geography dictating the diffusion and persistence of a set of rules. It is useful
to note that we do not argue that Islamic principles are the only rules that may emerge under unequal
geographic conditions. We do show nevertheless, that those rules prescribed in the Islamic economic
doctrine provide a solution to the conflicting interests caused by an unequal geography.8
The rest of the paper is organized as follows. Section 2 describes the role of trade and geography
in the formation and expansion of Islam and discusses the elements of its economic doctrine. Section 3
presents the theory. Section 4 discusses the data and presents the empirical analysis. This is conducted (i)
across ethnic groups, (ii) across virtual countries, and (iii) across countries. Finally, section 5 summarizes
the key findings and concludes.
2 Trade and the Islamic Economic Doctrine
The proposed theory rests upon two fundamental building blocks: (i) trade interests were a major driving
force in the formation and expansion of Islam and (ii) inequality was a primal feature of the pre-Islamic
Arabian economy which the economic principles of Islam had to directly address. We argue that such
conditions brought forward a set of economic rules focusing on (i) income redistribution and poverty
alleviation, the zakat, (ii) explicit costs imposed on capital accumulation, the anti-riba laws, and (iii)
investments in public goods provision through donations to religious endowments, the waqfs.
Arabia has a distinct geography with few places in Yemen, Bahrain, Central Arabia and several
scattered oases in the interior producing agricultural goods, such as frankincense, myrrh, vine, dyes and
spices on the eve of Islam. The rest of the peninsula features deserts and semi-arid regions where nomadic
life-style was the norm, Ibrahim (1990). Across these infertile swaths of land, tribes were directly involved
in the collection of booty by conducting raids, known as ghazw, on commercial caravans, Berkey (2003).
In the pre-Islamic era, trade was maintained in the Peninsula as long as peripheral kingdoms along
the edges of Arabia, namely Himyarites, Ghassanids and Lakhmids, guarded the routes and policed
Bedouin tribes. These kingdoms all disintegrated in the course of the 6 century, despite several efforts
to reestablish their dominance, restore order in the deserts and protect trade and oasis cultivators. As a
8Although a comparison between communism and Islamic economic principles is beyond the scope of the study it is
perhaps interesting to note that the common goal of narrowing income inequality was pursued via very different means.
Notably, Islam encouraged a market economy tolerating individual property rights while limiting capital accumulation,
whereas communism featured the opposite characteristics.
4

result, political and commercial control over the Bedouin communities could no longer be exerted, and
the Arabian economy was in decline, Lapidus (2002).
In parallel, the Persian and Byzantine empires had been fighting a series of long and exhausting wars
since the start of the 6 century. By the early 7 century, the conflicts had ruined or disrupted major
international trade routes between the two empires, Lewis (1993). Piracy in the Red Sea was also on the
rise due to the declining sea power of the Byzantines, Winder (2008). These events caused a diversion
of trade through the peninsula giving profound commercial value to overland trade routes in Arabia.
The resulting merchant diversion created new potential economic benefits for the oasis cultivators in
two ways. First, by selling to the merchants they could take advantage of markets outside Arabia, and
second, the increased caravan traffic was equivalent to locally higher demand of domestic goods.
In order to materialize these benefits, the trade hubs along the routes had to be safely reached. Yet
due to the extremely unequal Arabian geography, these hubs were surrounded by unsafe deserts. As a
result caravans were constantly exposed to raids by the Bedouins, who made up a considerable fraction of
the population in the Arabian peninsula at that time, Berkey (2003). Such increased trade gains coupled
with unsafe trade routes prompted early attempts to mitigate conflict in pre-Islamic Arabia. For example,
in search for security the Meccan merchants offered the arrangement of ilaf according to which they would
carry with them commodities produced by other tribes to be sold in markets and fairs. In exchange,
these tribes would provide security and protection (khafara) for Meccan caravans passing through their
territories. Also, within Mecca rich merchants were engaging in alms provision to alleviate poverty. Such
attempts coupled with the formation of tribal alliances partially decreased tensions, nevertheless these
measures were short-leaved since many tribes were not bound by the institution of ilaf and alliances
were constantly switching, Ibrahim (1990). These elements produced a highly conflicting environment
featuring the merchants and oasis cultivators on one side and the Bedouins on the other. Ibrahim (1990)
succinctly summarizes the economic conditions prevailing in the eve of Islam: "An unequal distribution
of wealth and resources already existed in and around Mecca. This unequal distribution had the potential
to disrupt its network of alliances and trade routes".
It was in this cross-section of historical events that Muhammad was born. The importance of trade
in the formation of Islamic principles can hardly be underestimated.9 Muhammad himself was a Meccan
merchant, and the majority of those who contributed to the crystallization of the Muslim law over time
had a merchant or craftsman background, Cohen (1970).10
To gain a hearing across conflicting Arabian tribes, a doctrine appealing to the divergent inter-
est groups of the Arabian Peninsula was necessary. Consequently, this study argues that the Islamic
economic principles were forged to align these clashing interests nurtured by an underlying unequal
9See Bairoch (1988) for a discussion on how trade preceded urbanization in the Middle East.10 In addition, Hodgson and Burke (1993) stresses that the interests of merchants who wanted to gain access to the widest
possible network of trade routes coupled with the casteless and egalitarian message of Islam contributed to its massive
expansion.
5
geography.11
Poverty alleviation and redistribution feature prominently among the Islamic principles. In Islam,
acts of charity are voluntary (sadaqa) and obligatory (zakat). Zakat is a religious obligation and is one
of the Five Pillars of Islam.12 The Qur’an requires a believer of sufficient economic means to give a
fraction of her accumulated income for alms. Zakat is allocated among the needy, the poor, those in
debt, travelers, the zakat collector and for slaves or captives. During the early history of Islam, zakat
was collected and distributed by the government appointed officials, in a centralized manner and it was
effective in alleviating poverty. Over time however, its centralized collection was less frequently enforced
and adherence to it was left to at the local authorities, see Kuran (2008b).13
An additional dimension along which Islamic doctrine features a host of detailed rules is on the limits
imposed on the accumulation of capital and wealth in general. The role of inheritance laws, anti-usury
laws and the prohibition on the rise of the corporation are three characteristic examples. Islamic law by
recognizing only natural persons effectively blocked the emergence of more complex organizational forms
restricting the mobilization and pooling of resources. Regarding the inheritance laws Qur’an specifies
that two-thirds of one’s wealth be allocated to various family members, including very distant relatives
making it a rather egalitarian distribution system, Kuran (2008a).14
Islamic law did not only impose limits on the evolution of equity investment contracts. Perhaps,
the most widely known Muslim economic principle is the prohibition against riba, which most Muslim
scholars have interpreted as “interest” (riba).15 Riba in the pre-Islamic days was a system whereby
the principle kept redoubling every time a borrower could not pay it back. Such arrangement would
frequently lead to the imprisonment or enslavement of the borrower. As a result of the riba-ordinance
of the Qur’an, Islam was formally committed to the eradication of interest in loan contracts.16
In the context of the proposed theory, such restrictions on interest bearing loans as well as on the
formation of more efficient organizational forms, distorted the relative returns to the factors of production
11Aswad (1963) notes that Muhammad’s message was first accepted in Medina as a result of Medina’s oasis cultivators
facing increased conflict from nomads in the periphery.12For a discussion on how the doctrines of salvation and damnation provide different incentives for performing economic
activities and charitable deeds in Hinduism, Buddhism, Christianity, and Islam, see McCleary (2007).13Kuran (2001) notes that the third Caliph Uthman turned the obligation to pay zakat essentially into a tax on agricultural
output. Also, Jalili (2006) recognizes that although the tax systems differ considerably among the Shiite and the four Sunni
Schools (Malekite, Shafeite, Hanafite and Hanbalite) they share common key objectives with respect to alleviating poverty
and improving income distribution.14Equitable inheritance laws coupled with the fact that more wealthy individuals were allowed to have more wives and
consequently children, was an additional force against the concentration of wealth and the increase in inequality. For a
thorough discussion on the economic principles of Islam see Kuran (2004a). Also Kuran (2003) argues that a by-product of
such inheritance laws was an increase in the costs of dissolving a business partnership following a partner’s death rendering
business enterprises small, simple, and generally ephemeral.15There was substantial controversy among early Muslims regarding the scope of this prohibition or even on the definition
of “interest”, see Rahman (1964) for a detailed discussion. Nevertheless, in the Islamic lands, Christians and Jews who
were not subject to this restriction, systematically engaged in money lending.16Kuran (2004b) argues that in practice, money lending continued, however uncertainty about the legitimacy of interest,
combined with the lack of corporate law, imposed significant transactions costs on both lenders as well as borrowers.
6

against capital accumulation and in favor of labor productivity investments. In fact, the Qur’an declares
that the opposite of riba is sadaqah which is spending to the benefit of people, that is, investing in assets
enhancing the welfare of the community, see Rahman (1964). In Islam the institution that emerged to
allow for investing in such public functions was the waqf, i.e. an inalienable endowment created by a
person who granted land or other immovable property in perpetuity for the advancement of a charitable
or pious purpose, see Kuran (2001) for a comprehensive account of the waqf system.17
Unlike zakat that catered to the immediate needs of the poor, waqfs were voluntary and enhanced
the population’s productive capacity through the provision of public goods such as education, health
care, and public utilities.18 Other examples of waqfs include mosques, free accommodations for the
poor, building and maintenance of water conduits and other public services that would benefit the
community. The earliest waqfs appear in the first decades of Islam. By the 18th and 19th century
aggregate estimates on land waqfs reveal their enormous economic standing. In Turkey three quarters
of the country’s arable land, half of the agricultural land in Algeria, one third in Tunisia and sizeable
fractions in many other Muslim countries were under waqf. Although similar estimates for assets other
than land are not available, it is known that the waqf system controlled a vast array of urban assets.19
Thus, unlike pre-Islamic local institutions like ilaf and khafara that focused on static income
redistribution and failed to settle ongoing conflicts, Islam by offering a set of rules that dictated both
static and dynamic income redistribution in the form of zakat and waqfs respectively, provided a credible
commitment device for the conflicting sides.20
We do not argue that the economic principles discussed above are unique to the Islamic religion.
Indeed, similar principles on redistribution, limits on capital accumulation and donations to religious
endowments may be found in the other Abrahamic religions at certain points in history, but in the course
of time they became less focal. We do argue, though, that these principles emerged and persisted in
Islam because of a geography characterized by highly unequal agricultural endowments which shaped
the economic aspects of the Islamic religious doctrine. In fact, we show that the empirical relationship
between geographical inequality and religious affiliation is unique to Muslim adherence.21
17There are two types of waqfs the purely public ones and the family waqf. The key difference being that unlike the
public one whose services would be purely serving the community, in case of the family waqf a fraction of wealth generated
by the endowment would be directed to the family members of the donor or the donor himself.18Shatzmiller (2001) stresses that "What conferred a unique historical significance on the public waqf, was the fact that
for hundreds of years it provided the only regular financial support for the medresa, a provider of higher education."19According to Kuran (2001), the Islamic waqf emerged as a result of volatile property rights, where religious endowments
provided a credible commitment device to give property owners economic security in return for social services and lower
taxation. Also, by allowing the waqf donor to designate the manager of the waqf granted him a way to circumvent the
strict inheritance laws.20Others have linked the success of Islamic expansion to its platform of state formation, mediation among lineage groups
and moral reform, Lapidus (2002). For example, Crone (1987) highlights that Islam was mainly offering a programme of
Arab state formation and conquest. This point of view, however, does not take into account that even if conquest was
the primary reason, in order to unite conflicting local interests as those among tribes in pre-Islamic Arabia, a set of rules
aligning such opposing interests had to emerge.21 It will be seen in the empirical section that the only other religion that follows a geographic pattern similar to Islam is
7

Christianity emerged in current day Israel and Palestine which feature a prominently unequal
distribution of land endowments. These common geographical origins may explain the similarities in
the economic doctrine between Christianity and Islam. However, the fact that Christianity eventually
persisted in regions with a radically different geography, i.e. Western Europe and the Mediterranean,
arguably influenced its economic predicaments. For example, although Christianity did enforce rigor-
ously the prohibition on interest primarily on consumption loans, over time and particularly with the
Protestant Reformation attitudes towards usury were relaxed, Lewison (1999).22 Also, perhaps more
importantly, in Christianity inheritance laws were preserving economic inequality allowing in several
instances such laws as that of primogeniture, see Bertocchi (2006), and there were no restrictions on the
formation of the corporation effectively facilitating the mobilization of resources and the accumulation
of physical capital.
Finally, it is important to note that this study aims at rationalizing only the economically relevant
principles of the Islamic doctrine without attempting to analyze its religious doctrine. Having discussed
the role of trade and geography in the emergence and spread of Islam as well as the economic principles
that characterize the Islamic doctrine we now turn to the formal exposition of the model.
3 The Model
3.1 The Basics
The theory illustrates the conditions under which an unequal geography exposed to trade opportunities
may lead to the adoption of Islamic principles. The crux of the argument is the following: The appearance
of trade routes creates divergent economic opportunities across territories characterized by unequal
agricultural endowments. On the one hand, fertile thus surplus producing regions can greatly benefit
from trade by selling their surplus at higher prices, whereas regions with poor land endowments cannot.
However, to the extent that the latter are numerous enough to significantly threaten the trade activities
of the former, a set of rules similar in essence to the economic principles of Islam may emerge. Hence,
it is the juxtaposition of few fertile pockets of land with an overwhelming majority of agriculturally
poor regions that causes the predatory behavior from the poorly endowed ones when trade opportunities
arise. As in Anderson and Bandiera (2006) the interaction of predators, whose density in our model is
shaped by the mass of infertile regions, and prey is crucial. Any encounter between the merchants and
the Bedouins results in a loss and the greater the density of predators to prey, the more vulnerable are
traders’ activities. In the context of the theory this relative capacity to avoid predation, determined by
the underlying geographical inequality, is the ultimate determinant of the concessions, i.e. the extent of
Buddhism, which shares similar altruistic principles under trade-relevant unequal geographies such as Inner Asia.22 In fact, by the beginning of the 17 century usury was downgraded from an offence against public morality to a private
conscience issue, Visser and Macintosh (1998). Also, during the Amoraic period in Babylonia (200AD to 500AD) interest
rate started being accepted by the Jewish community.
8
income redistribution, that fertile regions are willing to accept.23
Consider an overlapping-generations economy in which economic activity extends over infinite dis-
crete time. In every period, each region produces a single homogeneous good. The good is produced
using land quality which is a technological parameter, effective labor and physical capital. Regional out-
put grows over time due to the accumulation of effective labor and physical capital, while land quality
is exogenous and fixed. The stock of physical capital in every period is the output produced in the
preceding period net of consumption and investments in labor productivity.
In every period a unit mass of individuals live in regions characterized by different land qualities ,
where = {} refers to poor and rich land quality respectively. There is one to one mapping betweenregions and individuals, so regional and per capita quantities coincide.24 Without loss of generality we set
= 1 so relative land quality equals 0 == 1
1. The fractions of low quality and high quality
regions are and (1− ), respectively. Each individual has one child and migration across regions is not
allowed, so regional population is stationary.25 We consider all the individuals living in the low (high)
quality areas as the representative poor (rich) agent of mass and (1− ) respectively. With the vector
(0 ) we may characterize the economy-wide land quality distribution whose geographical inequality is
increasing in both the arguments.
The agents may decide to sell their regional output at a foreign market if profitable. The price on
the foreign market is 1, where 1 is the normalized domestic price. Trade involves a fixed goods’ cost
12, needed to set up a caravan going to the foreign market.26 If an agent does not find it profitable
to trade, he may challenge those who engage in trade by incurring a cost equal to 12 where is the
fraction of goods the raider loses in the end of the raid. Hence, merchants face a risk of losing a fraction
of their goods in an organized ambush. We refer to such confrontation between raiders and traders as
conflict hereafter, whose outcome is determined by the relative size of each group.
23The theory does not model the merchant class independently. Allowing for a merchant class would not alter the
predictions qualitatively. The goal of the merchants is to ensure a smooth passage of goods. Similarly, the oasis cultivators
want to have their goods sold intact via the merchants to the outside markets. Thus, both parties have a common incentive
to keep trade routes open and avoid caravan raids. Since the interests of merchants and oasis cultivators are perfectly
aligned we model them as one party that experienced a positive price shock as a result of trade routes crossing the Arabian
peninsula in the beginning of the 7 century.24Allowing for endogenous fertility would not change the predictions of the model. In a Malthusian environment where
higher incomes translate into higher fertility, regions with better land quality would be more densely populated, see Ashraf
and Galor (2009). In this case, the differential regional participation in trade would arise from more populated areas being
able to share the fixed costs of trade among a larger group of people.25The predictions of the theory would remain intact if we were to allow for labor mobility and property rights over land.
Doing so, wage income would be equalized across regions but land rents would remain systematically larger in the high
quality regions preserving the qualitative forces governing the evolution of the economy.26Labib (1969) stresses that the prosperity of Islam mainly depended on trading its agricultural and handicraft production.
9

3.2 Production of Final Output
Production in each region displays constant-returns-to-scale with respect to the reproducible factors of
production. The output produced at time in region , is :
= {[(1− )] + ()
} 1 ; ∈ (0 1) ∈ (0 1] = {}
where is land quality in region , and represent the regional effective labor and the amount
of physical capital employed at period in region . Note that given the one to one mapping between
individuals and regions, regional and per capita quantities coincide.
To simplify things we focus on the case of = 1 Marginal product of effective labor and capital
are equal to the wage rate per unit of effective labor and the rate of return to capital respectively.
With perfect substitutability implied by = 1, the producers’ inverse demand for factors of production
is: = (1− )
= (1)
that is constant over time in each region . We assume that capital depreciates fully every period and
that
1
2 (C1)
implying that capital is relatively more productive than labor.
3.3 Individuals’ Wealth and Preferences
Each individual lives two periods. An adult at time is an individual of generation . In the first period,
agents are economically idle. In the second period, they supply inelastically their effective labor in
region where they are born, earning the prevailing wage rate . Moreover, they may receive physical
capital bequests, −1 from their parents, generating an income that is the return rate on capital
times the amount of bequests. Each agent’s gross income is therefore
= +−1 (2)
which can be consumed locally or traded abroad. Moreover, the rich can transfer a part of their gross
income to the poor in order to avoid the risk of being raided.
An individual’s preferences are defined over consumption in the second period of his life, , and
potential gross income of his offspring, +1.27 We assume that people consume up to a satiation level
, after which, they maximize utility on the basis of the gross income of their child. Consider a utility
function (; +1) defined as
(; +1) = + +1 (3)
27Alternatively, parents may care about the net income of their children. As it will become evident this would make
adults anticipate and derive utility from the expected level of inequality. Allowing for such behavior would not alter the
qualitative results.
10

together with the constraint ≤ , where 1. As it will become apparent this utility function is
adopted to capture the spirit of Kaldorian-Keynesian savings behavior i.e., bequests and savings are an
increasing function of wealth.28
3.4 Optimal Consumption and Transfers
In this section we look at the optimization problem of rich and poor agents given their net income, .
See section 3.5 on how gross income evolves into net income through the process of trade and
conflict. Agents may trade in each period once local production has taken place and gross income
is realized. The amount of goods available for trade by each agent is simply his gross income minus
the fixed trade cost .
3.4.1 Physical and Human Capital Bequests
Effective labor may accumulate over time through investments, in public goods that enhance labor
productivity, i.e. waqfs. Unlike capital bequests that are individual specific, public goods by nature
provide benefits across all regions of the economy. The following law of motion describes how effective
labor evolves over time:
+1 = 1 + [(1− ) + ] (4)
Each individual is endowed with one unit of labor in absence of any waqf investment and 0 1
captures the marginal benefit of waqf. Note that if poor do not invest in waqfs, = 0 then may
be interpreted as the dilution effect, that is public goods’ benefits being diluted among a larger set of
regions that do not invest.
It follows from (3) that an adult allocates her net income towards own consumption up to the
level of , and devotes her remaining income to maximize the potential gross income of her child in
(2). In deciding how to best finance a child’s gross income, an adult anticipates future wage rates and
capital returns and optimally splits bequests between physical capital and a waqf investment,
Investment in physical capital delivers a marginal benefit equal to whereas from (4) the marginal
benefit of investing in waqf is (1− ) for a rich individual and for a poor one. If net income
is ≤ it is entirely spent on consumption, while if , utility (3) is maximized subject to budget
constraint:
+ ≤ − (5)
where − is net income after consumption.
28Allowing for a more standard utility function, like = ln + (1− ) ln +1 would deliver qualitatively similar
results. However, in this case the adult’s income threshold of investing in children’s income (either through savings or
effective labor enhancing investments) becomes endogenous to the anticipated factor returns, making the analysis more
cumbersome without adding further insights. More generally, the qualitative predictions would go through as long as
there are non-convexities in either the production side or in the utility function producing an economic environment where
inequality increases over time.
11

Now that we have defined the main building blocks and individuals’ optimization structure, it is
useful to define the starting point of the economy:
Definition 1 The initial condition of the model (at time = 0) is one in which 0 = 1 and −1 =
−1 = 0, so that 0 =1−0
and 0 = 1− .
In order for trade opportunities to act as a trigger for capital accumulation, we assume that in
absence of trade, = 1 no individuals leave bequests:
1− (C2)
It follows that without trade and under (C2) regional incomes remain constant. Moreover, throughout
the analysis we assume that agriculturally poor regions are unable to engage in trade, i.e.
∀ (C3)
and this is always true for large enough values of 0. Condition (C3) implies that if 0 → 1 the poor
regions are indistinguishable from the rich regions because their productivities coincide and they would
behave in the same way in terms of production, trade, and bequests. Moreover, looking at (1), (2) and
(4), 0 →∞ gives → 0. Hence, we consider small enough values of poor land productivity such
that the emergence of trade opportunities creates conflicting interests between regions.
In what follows, we characterize the optimal behavior of agents in the rich regions given the following
three conditions: (C1), (C2) and (C3). Note that in absence of income transfers, poor regions cannot
reach satiation point , thus do not leave bequests.
3.4.2 Anti-Riba Regulation and Investment in Public waqf
Kuran (2008a) argues that anti-riba laws for the Muslims were equivalent to increasing transactions
costs which coupled with the absence of the corporation in the Islamic law limited the return on physical
capital for Muslim adherents.29 Despite its important consequences, penalizing capital accumulation
to induce investments in public goods has not, to the best of our knowledge, been incorporated in a
general equilibrium growth model. We introduce this through an imposed change in the relative price
of the factors of production. Let us define the net return on capital investments as = , where
∈ [0 1] captures the distortion in the marginal product of physical capital induced by the restrictions oncontracts involving capital investments. The comparison between the two forms of investment boils down
to evaluating the returns from capital bequests versus public good investments, i.e. ≶ (1− ).
29The lower return on capital investment implied by the anti-riba law may be theoretically rationalized as follows: Since a
debt-contract with fixed interest rate is not possible, an agent who lends his money to generate physical capital in presence
of moral hazard and adverse selection, must monitor each investment he is financing. Such costs decrease the expected
return from investing in physical capital. Hence, as monitoring costs increase the agents may find it optimal to switch from
investing into physical capital into labor enhancing investments.
12

Returns to factors of production are independent of the quantity of factors employed. So, individuals
from fertile regions prefer capital savings over public waqfs as long as:30
1−
(1− ) ≡
This is trivially true for = 1 since 1−
(1 − ) 1 holds given (C1) and 1. So, the returns
to physical capital must be sufficiently distorted to induce investment towards public goods, this will
happen once:
1 (6)
Below we study the bequest behavior of parents as a function of the riba regime in which they live, i.e.
with or without restrictions on capital investments.
When riba is allowed (i.e. = 1), rich only bequeath physical capital when bequests are positive:
∗() =
(0 if
− if (7)
When riba is not allowed, i.e. (6) holds, the rich invest in public goods. In this case optimal labor
enhancing investment becomes:
∗() =
(0 if
− if (8)
Note that because of (4) the poor benefit from the waqf investment made by the rich.31
3.5 Trade, Conflict, and Redistribution
In absence of bequests, foreign prices and the level of land quality determine the ability to engage in
trade. Generally, a region trades if and only if ( − )⇐⇒ −1 when there is no risk of
conflict. In this section, we discuss the initial stage of the model at = 0 as defined above.
3.5.1 Trade and the Threat of a Raid
When trade becomes a viable option only fertile regions may participate. Poor regions because of (C3)
cannot overcome the fixed traded cost, . Nevertheless, they may raid the caravans of the trading regions
and obtain part of the goods if it is profitable. The outcome of the confrontation depends on the fighting
strength of each side, determined by a retention function () ∈ [0 1] whose argument is the fraction ofpoorly endowed regions . Given the one to one mapping between regions and individuals, the fighting
strength of each side is purely determined by the relative population size of the two sides. The function
30One can show that under increasing returns in the production of labor productivity, an initial investment in waqf due
to the anti-riba law persists once productivity reaches a certain level, even if the anti-riba law is later abolished.31Given our utility function, there are no free riding incentives. Given once = is attained, the only way to
increase utility is to leave bequests.
13

() is continuous and differentiable. Without loss of generality we focus on the retention rate of the
rich regions, i.e. () = 1− () which is bounded between zero and one. A key property of () is:
−()
1− (9)
so that an increase (decrease) in the share of poor regions sufficiently decreases (increases) the strength
of the rich.
We model the trade and raid process as a two stage sequential game where the rich evaluate the
profitability of trade conditional on the decision of the poor whether to raid. It follows from (3), (7),
and (8) that utility is increasing in net income. So, the rich representative agent would trade if his
post-conflict net income () exceeds his income with no trade :
() ≡ ( − )()
which in period 0 can be rewritten as
()− 1−
(1− − ) 0 (10)
The inequality shows that trade is more likely to occur as the ability of the rich to retain goods during a
raid increases (larger ()), and gains from trade are large (a higher gross income 1− , higher prices
, or lower trade costs ). Consistent with the importance of trade in the origins of Islam, the retention
rate of the rich in period 0 allows them to engage in trade, i.e. (→ 1) = 1−(1−−) , (→ 0) = 1.
Thus, defining a lower bound of as
≡
(1− − )(C4)
it is straightforward to show that for any condition (10) above holds in period 0 ∀ ∈ [0 1).Poor regions may plunder the goods being traded. In line with our historical section, we assume a
raid may occur when caravans are on their way to the trade routes.32 There is a cost of conflict for the
poor that represents resources spent to organize an ambush. In particular, they sustain a loss equivalent
to a fraction of the goods they seize at the end of the conflict.33 Thus, raiding is only a credible threat
if what the poor can obtain exceeds the income of remaining passive and consuming own production, i.e.
+1−
( − )[ ()− ] (11)
which can be rewritten as
()− 0 (12)
The inequality shows that the poor would only raid if the share of goods they obtain is large enough to
overcome the costs of conflict .
32Note that as the poor cannot overcome the costs of setting up a caravan, we assume away the possibility of trading
goods collected during a raid.33Assuming that rich also bear a conflict cost does not change the results.
14
Lemma 1 There exists a unique threshold of poor regions’ size ∈ (0 1) giving () = , so that a
raid is only a meaningful threat for .
P roof. Note that () is continuous, monotonically increasing in and (0) = 0 and (1) =
1− 1−(1−−) Since and (C2) it follows from the Intermediate Value Theorem that there exists a
unique level of poor regions’ size such that () = ≡ . Hence there exists a ≡ such that if
then () and the poor raid, whereas if then () and there is no conflict.
3.5.2 The zakat Redistribution System
We now introduce the possibility of static, that is same period, income redistribution, zakat, and in-
vestigate the necessary conditions under which a zakat contract is accepted by both sides.34 The zakat
contract takes the form of a fraction of rich’s income that is transferred to the poor. We assume that
zakat once agreed upon is paid prior to trade. The poor would only accept a zakat payment as a form
of compensation to refrain from conflict if the transfer is larger than what they would gain from a raid
+1−
( − ) ≥ +
1−
[( ()− ]( − )
where zakat and conflict earnings per poor region is equal to the amount of goods achieved from each
individual rich region multiplied by their size (1− ) and divided by the mass of poor regions, This
gives a minimum acceptable zakat rate, of
≡ () = max{0 ()− } (13)
which is weakly increasing in (), thus weakly increasing in and weakly decreasing in . Note that
only becomes positive at , which looking at (12) occurs at the exact level of poor regions’ size ,
that is when the poor start finding it optimal to raid.
A zakat system would only go through if it also makes the rich better off. The maximum zakat
rate the rich would be willing to pay can be found by comparing their post-trade income under conflict
with that under a zakat regime:
(1− )( − ) ≥ ()( − )
which gives
≡ () = () 1 (14)
and is increasing in . Note that conflict occurs only when () Below this threshold there is no
conflict so the maximum zakat rate of the rich is 0.
34We abstract from partial coalition formation, i.e. the rich bribing some poor regions into power-sharing, thus limiting
the strength of the remaining poor regions to a sufficiently low level.
15

It is easy to see from (13) and (14) that always holds. Consistent with the initial days of
Islam, a zakat rate of is enforced when agreed upon by both sides as long as is non-negative i.e.
.
Lemma 2 Using (13) and (14), a zero zakat rate obtains for ≤ , while for there exists a
positive zakat rate of increasing in , which is beneficial for both sides.
P roof. Follows by directly comparing (13) to (14) and the properties of ().
Given the structure of trade and redistribution, we can now define the net income of the rich as
=
³ −
´no conflict
()³ −
´conflict
(1− )³ −
´zakat
(15)
The net income of the poor is always equal to their gross income, plus zakat earnings, with the
latter being equivalent to their potential gains from conflict. To avoid a counterintuitive overpropor-
tional transfer from the rich to the poor, we assume that the zakat transfer received by each poor
region,1−()
³ −
´, does not exceed the minimum amount required to convince them to forgo
raiding, ()³ −
´, i.e.,35
() = min{();µ1−
¶()} (16)
The net income of the poor is therefore
= + ()¡ −
¢ (17)
3.6 Geography and the Rise of Islam
We now turn to conditions that give rise to the emergence of Islam as an endogenous institution. We
refer to Islam as a contract containing a static income redistribution system, i.e. zakat, along with
regulations limiting capital accumulation inducing public good investments, i.e. waqfs, by the rich. Note
that investments in waqfs by the rich is a dynamic form of redistribution, since the benefits to the next
generation in terms of higher labor productivity are also enjoyed by the poor. We concentrate on the
initial condition at = 0 while in the last part of this section we report further results based on the
dynamic analysis.
An Islamic pact is offered and must be accepted by both sides to go through. Starting with the
poor, while makes them indifferent between conflict and redistribution, they are strictly better off with
a full Islamic pact that includes a waqf -inducing anti-riba regime for sufficiently large values of 0.
35Although not modelled explicitly here, this can be thought of as increasing transaction (collection) costs that arise
when the number of rich regions cross a certain level, i.e. (1− ) ≥ 12.
16

Lemma 3 For sufficiently large differences in land quality 0 that prevent the poor from leaving bequests,
their utility under Islam is always greater than that under conflict or redistribution, i.e. 0
0.
P roof. The net income of the poor under conflict or redistribution is () = 1−
0+()(1−−),
where the first term on the LHS goes to zero when 0 →∞. Subsequently, for large enough 0, the poorare unable to leave capital bequest as long as ( ()−)(1−−) which always holds by condition
(C2). As a result, since the only extra source of utility to the poor is the benefits spilled over to their
offspring from public investment by the rich (+1 1), we obtain 0
0.
The poor use the threat of conflict to establish Islam with their bargaining power increasing in .
To see whether or not Islam goes through one may compare the utility of the rich with and without
Islam.
The rich regions calculate their utility under Islam 0 with both zakat and anti-riba in place and
compare it to their outside option 0, which is conflict for all . Recall that the rich always prefer
to pay the zakat rate to avoid conflict as long as raiding is a credible threat. At time = 0, the level of
net income under conflict () that gives
() = , above which the rich leave capital bequests, solves
()−
(1− − ) 0 (18)
With equality, (18) gives ≡ 0 so that capital bequests are positive if 0 and zero otherwise. In
addition, looking at (10) and (18) along with (C2) and (C4) assures that 0 1.36 Bequests are
more likely to be positive as () increases, a higher initial gross income 1 − , higher prices , and
lower trade costs .
Lemma 4 Under conflict there exists a unique threshold of poor regions’ size 0 ∈ ( 1) giving (0) =
(1−−) so that capital bequests are only positive for 0.
P roof. Since () is continuous with () = 1− and (→ 1) = 1−(1−−) , given (C2), (C4),
(7), (10), (15) and (18), it follows from the Intermediate Value Theorem that there exists a share of poor
regions 0 ∈ ( 1) such that (0) ≡ (1−−) = 0. Also, since () is monotonically decreasing
in , this 0 is unique. So, if 0 then () 0 and capital savings by the rich are positive,
whereas if 0 then () 0 and optimal bequests are zero.
Similarly, one may derive the threshold of poor regions below which investments are positive under
an Islamic contract, by solving for the net income under Islam, () , that guarantees consumption
equal to The only difference from the previous case is the additional gain from avoiding conflict. The
following inequality solves for 0 below which bequests under Islam are positive:
()−
(1− − )+ 0 (19)
36Relaxing the assumption (C4) we could also have 0, which implies an economy without institutions for small ,
and a direct switch to Islam at the point when conflict starts, i.e. .
17
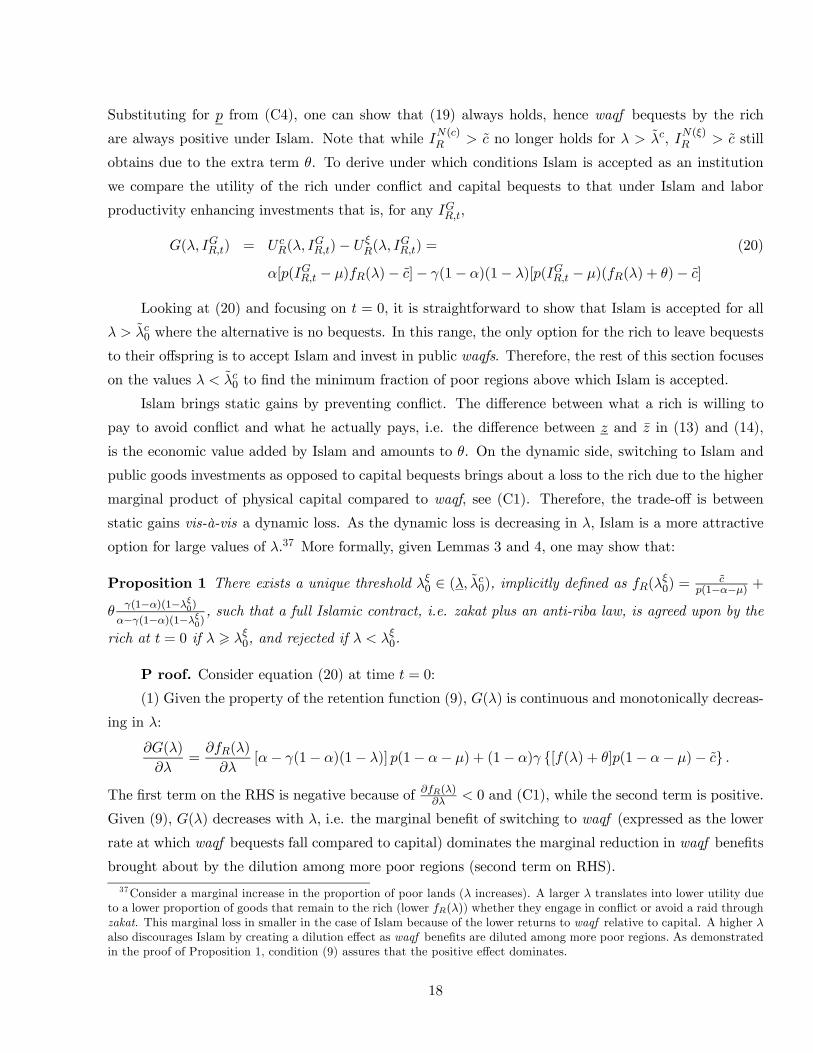
Substituting for from (C4), one can show that (19) always holds, hence waqf bequests by the rich
are always positive under Islam. Note that while () no longer holds for ,
() still
obtains due to the extra term . To derive under which conditions Islam is accepted as an institution
we compare the utility of the rich under conflict and capital bequests to that under Islam and labor
productivity enhancing investments that is, for any ,
( ) = (
)−
(
) = (20)
[( − )()− ]− (1− )(1− )[( − )(() + )− ]
Looking at (20) and focusing on = 0, it is straightforward to show that Islam is accepted for all
0 where the alternative is no bequests. In this range, the only option for the rich to leave bequests
to their offspring is to accept Islam and invest in public waqfs. Therefore, the rest of this section focuses
on the values 0 to find the minimum fraction of poor regions above which Islam is accepted.
Islam brings static gains by preventing conflict. The difference between what a rich is willing to
pay to avoid conflict and what he actually pays, i.e. the difference between and in (13) and (14),
is the economic value added by Islam and amounts to . On the dynamic side, switching to Islam and
public goods investments as opposed to capital bequests brings about a loss to the rich due to the higher
marginal product of physical capital compared to waqf, see (C1). Therefore, the trade-off is between
static gains vis-à-vis a dynamic loss. As the dynamic loss is decreasing in , Islam is a more attractive
option for large values of .37 More formally, given Lemmas 3 and 4, one may show that:
Proposition 1 There exists a unique threshold 0 ∈ ( 0), implicitly defined as (0) =
(1−−) +
(1−)(1−0)
−(1−)(1−0), such that a full Islamic contract, i.e. zakat plus an anti-riba law, is agreed upon by the
rich at = 0 if > 0, and rejected if
0.
P roof. Consider equation (20) at time = 0:
(1) Given the property of the retention function (9), () is continuous and monotonically decreas-
ing in :
()
=
()
[− (1− )(1− )] (1− − ) + (1− ) {[() + ](1− − )− }
The first term on the RHS is negative because of()
0 and (C1), while the second term is positive.
Given (9), () decreases with i.e. the marginal benefit of switching to waqf (expressed as the lower
rate at which waqf bequests fall compared to capital) dominates the marginal reduction in waqf benefits
brought about by the dilution among more poor regions (second term on RHS).
37Consider a marginal increase in the proportion of poor lands ( increases). A larger translates into lower utility due
to a lower proportion of goods that remain to the rich (lower ()) whether they engage in conflict or avoid a raid through
zakat. This marginal loss in smaller in the case of Islam because of the lower returns to waqf relative to capital. A higher
also discourages Islam by creating a dilution effect as waqf benefits are diluted among more poor regions. As demonstrated
in the proof of Proposition 1, condition (9) assures that the positive effect dominates.
18
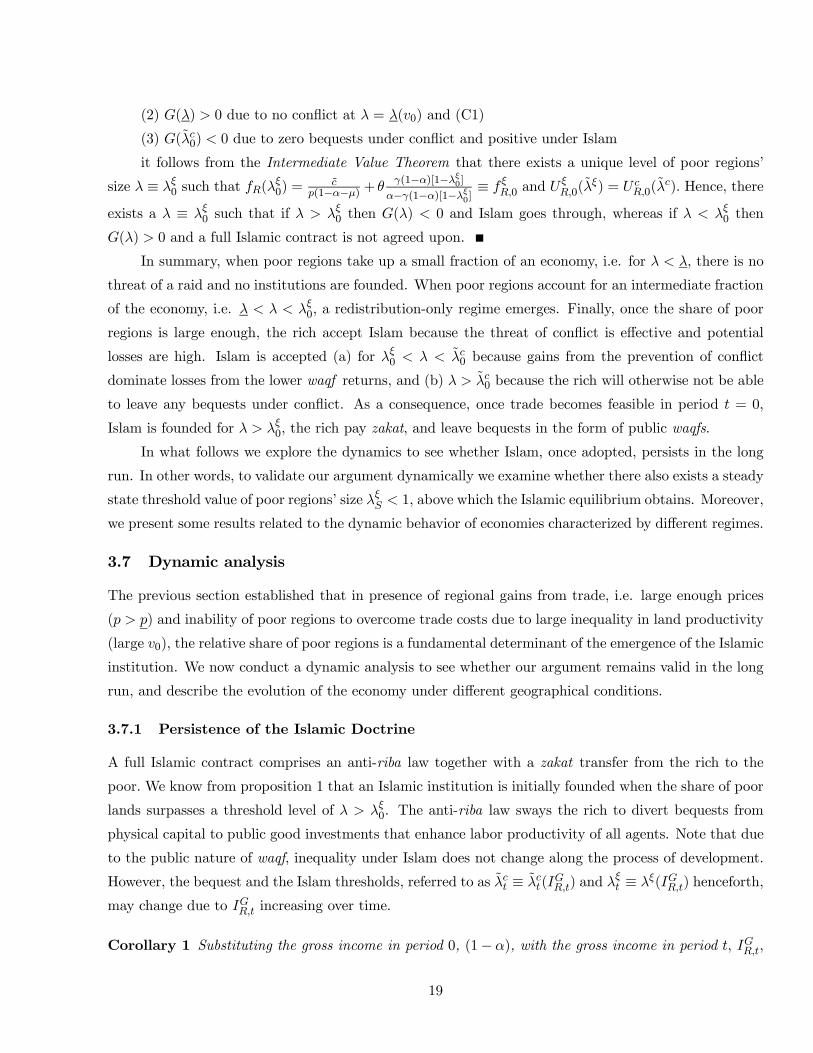
(2) () 0 due to no conflict at = (0) and (C1)
(3) (0) 0 due to zero bequests under conflict and positive under Islam
it follows from the Intermediate Value Theorem that there exists a unique level of poor regions’
size ≡ 0 such that (
0) =
(1−−) +
(1−)[1−0]−(1−)[1−0]
≡ 0 and
0(
) = 0(
) Hence, there
exists a ≡ 0 such that if
0 then () 0 and Islam goes through, whereas if
0 then
() 0 and a full Islamic contract is not agreed upon.
In summary, when poor regions take up a small fraction of an economy, i.e. for , there is no
threat of a raid and no institutions are founded. When poor regions account for an intermediate fraction
of the economy, i.e. 0 a redistribution-only regime emerges. Finally, once the share of poor
regions is large enough, the rich accept Islam because the threat of conflict is effective and potential
losses are high. Islam is accepted (a) for 0 0 because gains from the prevention of conflict
dominate losses from the lower waqf returns, and (b) 0 because the rich will otherwise not be able
to leave any bequests under conflict. As a consequence, once trade becomes feasible in period = 0,
Islam is founded for 0, the rich pay zakat, and leave bequests in the form of public waqfs.
In what follows we explore the dynamics to see whether Islam, once adopted, persists in the long
run. In other words, to validate our argument dynamically we examine whether there also exists a steady
state threshold value of poor regions’ size 1, above which the Islamic equilibrium obtains. Moreover,
we present some results related to the dynamic behavior of economies characterized by different regimes.
3.7 Dynamic analysis
The previous section established that in presence of regional gains from trade, i.e. large enough prices
( ) and inability of poor regions to overcome trade costs due to large inequality in land productivity
(large 0), the relative share of poor regions is a fundamental determinant of the emergence of the Islamic
institution. We now conduct a dynamic analysis to see whether our argument remains valid in the long
run, and describe the evolution of the economy under different geographical conditions.
3.7.1 Persistence of the Islamic Doctrine
A full Islamic contract comprises an anti-riba law together with a zakat transfer from the rich to the
poor. We know from proposition 1 that an Islamic institution is initially founded when the share of poor
lands surpasses a threshold level of 0. The anti-riba law sways the rich to divert bequests from
physical capital to public good investments that enhance labor productivity of all agents. Note that due
to the public nature of waqf, inequality under Islam does not change along the process of development.
However, the bequest and the Islam thresholds, referred to as ≡ () and
≡ () henceforth,
may change due to increasing over time.
Corollary 1 Substituting the gross income in period 0, (1− ), with the gross income in period
19

in the RHS of (0) in Lemma 3 and (
0) in Proposition 1, the two expressions become (
) =
(
−) and (
) =
(
−) +
(1−)(1− )−(1−)(1− )
respectively. Since(
)
0 and(
)
0, it
follows that the threshold values and rise over time as
increases. Intuitively, a larger gross
income eases the constraint to leave bequests for the rich in presence of conflict and discourages the
persistence of Islam.
P roof. Proposition 1 shows that 0 exists and is unique, so under the Islamic contract
depends
on gross income of the rich, , and can be written implicitly using (20) as the value of that satisfies
the following implicit function
(
) =
(
)−
(
) ≡ 0 (21)
By the Implicit function theorem
= −
(
)
(
)
(22)
which is positive as the denominator is negative from (9) when substituting for 0, and the
numerator is
( )
=
[( − )− ]
( − )2+
(1− )(1− )[1− (1− )(1−
)]
− (1− )(1− )
which is positive as long as the steady state income of the rich under Islam is finite, i.e. 1((1 −)(1 −
)). This gives
0, while
0 follows by directly inspecting the expression in the
Corollary and using the properties of ().
Given Corollary 1, as long as Islamic rules are accepted in every period and the economy
evolves according to the dynamic equations⎧⎪⎨⎪⎩+1 = (1− )(1 + (1− )[(1− ())( − )− ])
+1 =+10
(23)
where we have used condition (C3) and equations (8), (13), (15) and (17). Note that income inequality
is constant and equal to 0 along the process of development. Gross income of the rich increases in every
period and eventually reaches the steady state level
= (1− )
µ1 + (1− )
(1− − ) (1− ())−
1− (1− ) (1− )(1− ())
¶(24)
that is the wage rate times the steady state level of investment in public goods (the ratio in the paren-
theses, which can be referred to as ). It is positive and larger than initial gross income (1− ) from
(C4).
20
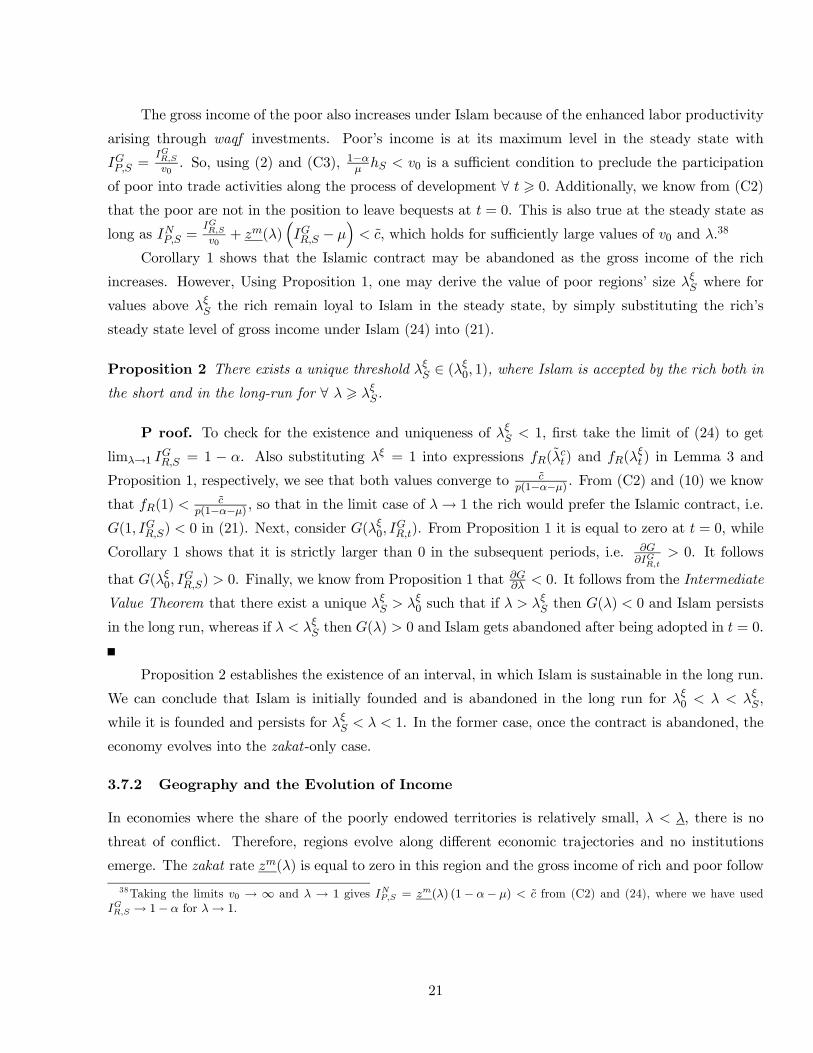
The gross income of the poor also increases under Islam because of the enhanced labor productivity
arising through waqf investments. Poor’s income is at its maximum level in the steady state with
=0. So, using (2) and (C3), 1−
0 is a sufficient condition to preclude the participation
of poor into trade activities along the process of development ∀ > 0. Additionally, we know from (C2)
that the poor are not in the position to leave bequests at = 0. This is also true at the steady state as
long as =
0+ ()
³ −
´ , which holds for sufficiently large values of 0 and .38
Corollary 1 shows that the Islamic contract may be abandoned as the gross income of the rich
increases. However, Using Proposition 1, one may derive the value of poor regions’ size where for
values above the rich remain loyal to Islam in the steady state, by simply substituting the rich’s
steady state level of gross income under Islam (24) into (21).
Proposition 2 There exists a unique threshold ∈ (0 1), where Islam is accepted by the rich both in
the short and in the long-run for ∀ > .
P roof. To check for the existence and uniqueness of 1, first take the limit of (24) to get
lim→1 = 1 − . Also substituting = 1 into expressions () and (
) in Lemma 3 and
Proposition 1, respectively, we see that both values converge to (1−−) . From (C2) and (10) we know
that (1)
(1−−) , so that in the limit case of → 1 the rich would prefer the Islamic contract, i.e.
(1 ) 0 in (21). Next, consider (0
). From Proposition 1 it is equal to zero at = 0, while
Corollary 1 shows that it is strictly larger than 0 in the subsequent periods, i.e.
0. It follows
that (0
) 0. Finally, we know from Proposition 1 that
0. It follows from the Intermediate
Value Theorem that there exist a unique
0 such that if
then () 0 and Islam persists
in the long run, whereas if then () 0 and Islam gets abandoned after being adopted in = 0.
Proposition 2 establishes the existence of an interval, in which Islam is sustainable in the long run.
We can conclude that Islam is initially founded and is abandoned in the long run for 0
,
while it is founded and persists for 1. In the former case, once the contract is abandoned, the
economy evolves into the zakat-only case.
3.7.2 Geography and the Evolution of Income
In economies where the share of the poorly endowed territories is relatively small, , there is no
threat of conflict. Therefore, regions evolve along different economic trajectories and no institutions
emerge. The zakat rate () is equal to zero in this region and the gross income of rich and poor follow
38Taking the limits 0 → ∞ and → 1 gives = () (1− − ) from (C2) and (24), where we have used
→ 1− for → 1.
21
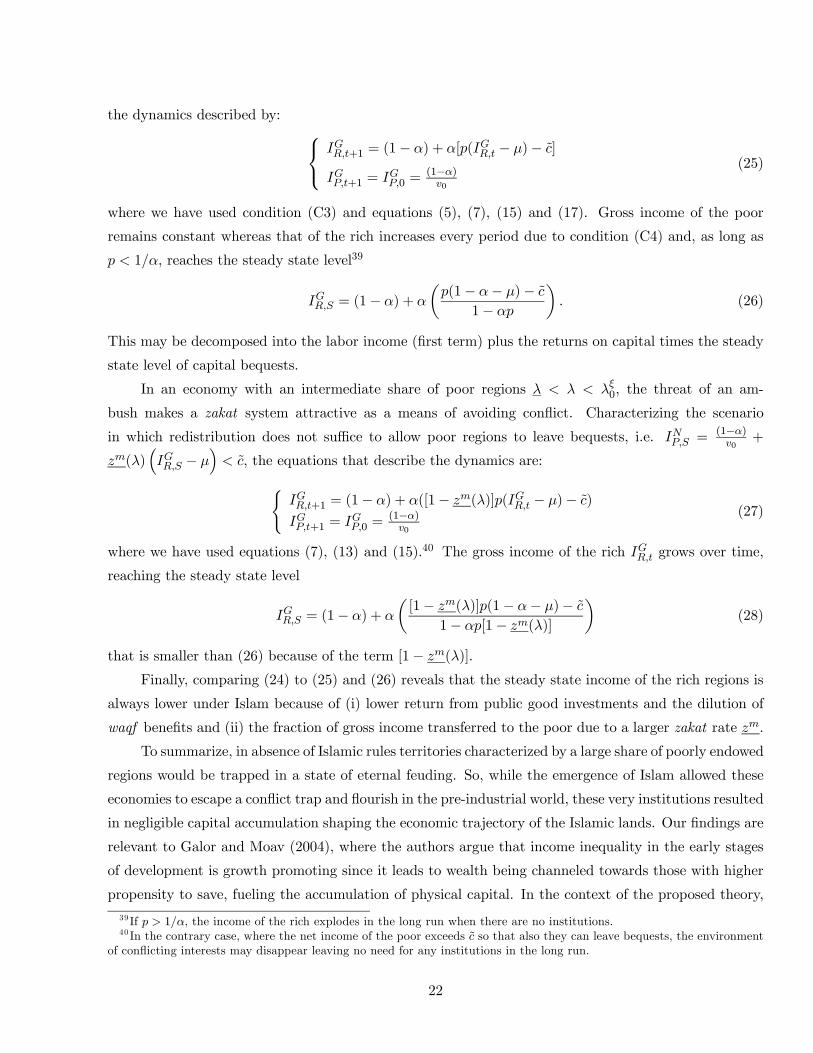
the dynamics described by: ⎧⎨⎩ +1 = (1− ) + [( − )− ]
+1 = 0 =(1−)0
(25)
where we have used condition (C3) and equations (5), (7), (15) and (17). Gross income of the poor
remains constant whereas that of the rich increases every period due to condition (C4) and, as long as
1, reaches the steady state level39
= (1− ) +
µ(1− − )−
1−
¶ (26)
This may be decomposed into the labor income (first term) plus the returns on capital times the steady
state level of capital bequests.
In an economy with an intermediate share of poor regions 0, the threat of an am-
bush makes a zakat system attractive as a means of avoiding conflict. Characterizing the scenario
in which redistribution does not suffice to allow poor regions to leave bequests, i.e. =(1−)0
+
()³ −
´ , the equations that describe the dynamics are:(
+1 = (1− ) + ([1− ()]( − )− )
+1 = 0 =(1−)0
(27)
where we have used equations (7), (13) and (15).40 The gross income of the rich grows over time,
reaching the steady state level
= (1− ) +
µ[1− ()](1− − )−
1− [1− ()]
¶(28)
that is smaller than (26) because of the term [1− ()].
Finally, comparing (24) to (25) and (26) reveals that the steady state income of the rich regions is
always lower under Islam because of (i) lower return from public good investments and the dilution of
waqf benefits and (ii) the fraction of gross income transferred to the poor due to a larger zakat rate .
To summarize, in absence of Islamic rules territories characterized by a large share of poorly endowed
regions would be trapped in a state of eternal feuding. So, while the emergence of Islam allowed these
economies to escape a conflict trap and flourish in the pre-industrial world, these very institutions resulted
in negligible capital accumulation shaping the economic trajectory of the Islamic lands. Our findings are
relevant to Galor and Moav (2004), where the authors argue that income inequality in the early stages
of development is growth promoting since it leads to wealth being channeled towards those with higher
propensity to save, fueling the accumulation of physical capital. In the context of the proposed theory,
39 If 1, the income of the rich explodes in the long run when there are no institutions.40 In the contrary case, where the net income of the poor exceeds so that also they can leave bequests, the environment
of conflicting interests may disappear leaving no need for any institutions in the long run.
22
Islamic economic doctrine in pursuit of keeping an already unequal income distribution within bounds,
engineered principles that channeled preindustrial wealth towards public good investments in the form
of religious endowments.41
3.8 Main Theoretical Results and Testable Implications
In this section we have sketched a simple model that shows how the geographical features of a given
economy shape the endogenous emergence of Islamic institutions. To summarize, the precondition of
having access to foreign markets at an attractive price, i.e. , must be met. If gains from trade are
achievable, large inequality 0 is a necessary condition for any kind of institution to go through, be it
simply zakat redistribution or a full Islamic contract. This is because it is crucial that at least some of
the regions are poor enough to not have the possibility to trade their production abroad, no matter how
large are the gains from trade. Conversely, for small values of 0 both rich and poor are able to trade and
accumulate and no institutions arise, irrespectively of the share of poor individuals in the population.
In the presence of large values of 0, the (relative) size of poor population is crucial in determining the
institutional setup. If poor regions’ constitute a small fraction of an economy, i.e., , no institutions
arise, while for intermediate values ( 0) redistribution only is the preferred institution. Once
poor regions’ size increases further ( 0) the threat for the rich to be raided is credible, so that the
Islamic contract is agreed upon.
Both intuitively and under a broad class of inequality measures a distribution characterized by
parameters and 0 is more unequal the larger are and 0.42 Therefore, in the empirical section
we use different indexes of inequality as our main explanatory variable of Muslim representation. Also,
to capture regional access to trade we also use a variety of indicators measuring the proximity to pre-
industrial trade routes.
4 Empirical section
4.1 The Data Sources
The ideal index for capturing the differential gains from trade across regions, could be derived by ex-
amining the regional distribution of productive activities conducive to trade in the eve of the Islamic
expansion. A quest for such detailed data is bound to be an overwhelming endeavor. To overcome this
41Galor et al. (2008) show that inequality in the distribution of land ownership adversely affected the emergence of human
capital promoting institutions during industrialization. This is unlike the case of Islam where the threat posed by those
regions unable to directly benefit from trade, brought forward labor productivity enhancing investments through religious
endowments.42 It is straightforward to demonstrate that for a discrete distribution characterized by and 0 a larger and/or
0 produce a more unequal distribution under the First Order Stochastic Dominance criterion. The Gini Index of this
distribution, (; 0), is increasing in 0, and in except for combinations of large and low 0, i.e. equality. The fact
that in the limit as approaches 1 the Gini Index decreases is due to the fact the distribution becomes degenerate, i.e.,
= 0 or = 1 are both characterized by (; 0) = 0∀ 0.
23

issue we employ an alternative strategy. Given that Islam surfaced at a point in time when land was
the single most important input in the production process and in absence of historical data, we use
contemporary disaggregated data on the suitability of land for agriculture, to proxy for the regional
productive endowments. In a stage of development when land dominates production decisions, the re-
gional agricultural suitability plays a fundamental role in shaping the potential of a region to engage
and profit from trade. Thus, differences in regional land fertility would arguably map into differential
gains from trade across regions. Naturally, fertile areas able to produce a surplus would trade, whereas
poorly endowed ones would not be able to do so.
The global data on current land quality for agriculture were assembled by Ramankutty et al.
(2002) to investigate the effect of the future climate change on contemporary agricultural suitability.
This dataset provides information on land quality characteristics at a resolution of 05 degrees latitude
by 05 degrees longitude. In total there are 64 004 observations. Each observation takes a value between
0 and 1 and represents the probability that a particular grid cell may be cultivated. In Appendix B
details on the exact formulas used in the construction of the land quality index and the data sources
are presented. These raw global data, presented in Figure 1, provide the basis for constructing the
distribution of land quality at the desired level of aggregation, i.e., across countries, ethnic groups and
virtual countries.
Using contemporary geographic data to proxy for historical inequality in agricultural endowments
presents its own potential pitfalls, which merit further discussion. For example, a potential concern is how
representative is land quality of the period when Islam started spreading. This is because precipitation,
temperature and soil properties, which are the basis of this index, may have changed regionally over
the last 1500 years. Hence, this measure of land quality is a noisy index of what might have been the
true distribution of agricultural quality in the past. On the one hand, this measurement error may
be white noise, making it harder to detect a relationship between inequality in agricultural suitability
and Muslim adherence. On the other hand, though, this measurement error could be systematic; the
same forces that engineer religious affiliation (modern statehood) may also be associated with human
interventions that affect the landscape, generating a spurious relationship. This possibility underscores
the need for the analysis to be conducted at a level of aggregation where country fixed effects can be
explicitly incorporated. This is done in the virtual country and ethnic group specifications whereby the
introduction of country fixed effects accounts for any country-level unobserved forces that may have
affected both land’s suitability for agriculture and religious affiliation.
In the cross-country analysis, the dependent variable employed is the fraction of the Muslim pop-
ulation as early as the 1900 at the country level reported at Barrett et al. (2001). With respect to
the cross-ethnic group analysis the dependent variable is the fraction of the Muslim population and of
other religious denominations within an ethnic group. The data come from the World Religion Database
24

(WRD) which provides estimates of Muslim adherence in 2005 for an ethnic group within a country.43
These estimates are derived from the World Christian Database and are subsequently adjusted based on
three sources of data on religious affiliation: census data, demographic and health surveys and population
survey data.44
The theory links the adoption of Islam to the underlying geography. Thus, when testing the theory
across ethnic groups one needs to identify the land endowments of the traditional homeland of an ethnic
group. Information on the location of ethnic groups’ homelands is available from the World Language
Mapping System (WLMS) database. This dataset maps the locations of the language groups covered
in the 15th edition of the Ethnologue (2005) database. The location of each ethnic group is identified by
a polygon. Each of these polygons delineates the traditional homeland of an ethnic group; populations
away from their homelands (e.g. in cities, refugee populations, etc.) are not mapped. Also, the WLMS
(2006) does not attempt to map immigrant languages. Finally, ethnic groups of unknown location,
widespread ethnicities i.e. ethnic groups whose boundaries coincide with a country’s boundaries and
extinct languages are not mapped and, thus, not considered in the empirical analysis.45
The matching between the WLMS (2006) and the WRD is done using the unique Ethnologue
identifier for each ethnic group within a country. For some language groups in WLMS (2006) the WRD
offers information at the subgroup level. For example, in the case of the Akha ethnicity in Laos the
WRD reports religious affiliation for the two subgroups belonging to the Akha, that is, the Pala (Ko
Akha) and the Akha (Kaw, Khako). In this case the religious affiliation of the entire Akha ethnic group
is derived from the data on the subgroups affiliation.
In the virtual country analysis the fraction of Muslims is estimated using information on both the
location of ethnic groups from the WLMS (2006) and their respective population and Muslim adherence
in 2005 from the WRD.
In absence of historical estimates of Muslim representation at an ethnic group or virtual country
level, we are constrained in using contemporary data. Reassuringly, country level estimates of Muslim
representation derived using the WRD estimates of Muslim adherence across ethnic groups within a
country, exhibit a correlation of 093 with the cross-country estimates of Muslim adherence in 1900
AD.46
43WRD classifies as Muslims the followers of Islam, in its 2 main branches (with schools of law, rites or sects): Sunnis or
Sunnites (Hanafite, Hanbalite, Malikite, Shafiite), and Shias or Shiites (Ithna- Ashari, Ismaili, Alawite and Zaydi versions);
also Kharijite and other orthodox sects; reform movements (Wahhabi, Sanusi, Mahdiya), also heterodox sects (Ahmadiya,
Druzes, Yazidis), but excluding syncretistic religions with Muslim elements, and partially-islamized tribal religionists.44Hsu et al. (2008) show that the country level estimates for Muslim representation in WRD are highly correlated (above
0.97) with similar statistics available from World Values Survey, Pew Global Assessment Project, CIA World Factbook,
and the U.S. Department of State. At the ethnic group level there are no comparable statistics.45The only exception for not mapping widespread languages is the case of English language which is mapped for the
United States.46Converting out of Islam by committing apostasy or ridda is subject to punishment in several Islamic countries. Also, the
Qur’an explicitly forbids the forced conversion of other monotheists. Fox and Sandler (2008) find that among 39 countries
with Muslim adherence of at least 50%, 25 have conversion restrictions either out of the majority religion or into a minority
25

4.2 Cross-Ethnic Group Analysis
We start the empirical investigation at the ethnic group level. The spread of Islam and its institutions
is a historical process that took place mainly before the formation of modern states and the emergence
of nationalism. Consequently, using countries as the unit of empirical analysis is subject to the criticism
that what we may identify is not a causal effect of geography on the adoption of Islam, but the fact
that modern political boundaries, for example those imposed by European colonizers after the fall of the
Ottoman empire, shaped the observed unequal distribution of land endowments across Muslim countries.
Also, the very individual histories of modern day countries have largely engineered both their current
borders as well as the composition of religious shares by promoting or demoting religious uniformity.
In order to overcome these critical issues we investigate empirically the role of geography in shaping
Muslim representation across ethnic groups. Establishing that, conditional on country specific character-
istics, ethnic groups residing along unequally distributed agricultural endowments sustain larger Muslim
populations will greatly enhance the validity of the proposed hypothesis and alleviate any concerns
related to the border and country formation inherent to any cross-country analysis.
To capture the conflicting economic interests caused by an unequal geography we use the global
data on the suitability of land for agriculture to estimate the Gini inequality in the climatic potential
for farming across regions.47 The prediction is that ethnicities featuring few pockets of fertile land and
a majority of relatively infertile areas, i.e. a higher in the context of the theory, would find Islam
an attractive solution to mitigating and overcoming the high geographical inequality. An additional
geographical feature that is likely to increase transaction costs for trading activities is the presence of a
variable topography. Conditional on agricultural endowments a more rugged terrain may increase the
probability of raiding the trade caravans because raiders can easily retreat and hide taking advantage
of such geography. As a result a set of rules akin to the Muslim principles that align the interests of
opposing groups, one that benefits from disrupting trade flows and the other whose economic livelihood
depends on the secure passage of goods, is more likely to prevail.
Figure 2 in Appendix shows the traditional homelands of two ethnic groups in Ethiopia. The
Amhara occupy the northern part whereas in the southwestern part of current day Ethiopia the Somali
people are traditionally located. Figure 2 illustrates the regional land quality within these two ethnic
groups. The green colored regions are those with at least 10% of agricultural potential whereas the
yellow colored ones are below this threshold. Amharic areas are characterized by uniformly fertile land
endowments, with an estimated Gini index of land suitability = 013. On the other hand,
72% of Somali’s homeland is dominated by agriculturally poor regions dotted with few fertile pockets,
religion, whereas 18 have both types of restrictions. Also, Barro et al. (2009) show in a sample of 40 countries containing no
predominantly Muslim countries, the larger is the percentage of Muslim adherence the lower are religious-conversion rates.47 In the end of each empirical section we show that the results are qualitatively and quantitatively similar using alternative
indexes of inequality, including the Theil index or the mean logarithmic deviation (MLD).
26
= 062. According to the theory, the highly unequal distribution of agricultural quality within
the Somali group would make the Islamic principles more likely to be accepted, whereas the relatively
uniform fertile endowment within the Amhara would make Islam less likely to emerge. According to the
WRD, Somali were 100% Muslim in 2005 whereas within the Amharic group only 1% was adhering to
Islam with the majority of 99% belonging to Christianity.48
Table 1 presents the summary statistics of the variables employed in the cross-ethnic group analy-
sis.49 An average ethnic group has 19% of its population adhering to Islam in 2005, spans 31 000 square
kilometers and the Gini index of land inequality across its land endowments is 016. There are also
several distance measures that have been constructed to account for the spatial diffusion of Islam. An
average ethnic group is 6 250 kilometers from Mecca, 7 030 kilometers from Rome, and 2 460 kilometers
from trade routes in the 600 AD, that is, in the eve of the Muslim expansion. Table 1 shows the raw cor-
relations among the variables of interest. Muslim representation at an ethnic group is positively related
to the degree of inequality in the regional suitability for farming, negatively related to its distance from
Mecca and its distance from the trade routes in 600 AD and finally positively related to the variation in
elevation. For the cross-ethnic group analysis the following specification is adopted:
Muslim%05 = 0 + 1_ + 2 + (29)
The key theoretical prediction is that ethnicities characterized by more unequal regional agricultural
potential are more likely to have adopted Islamic principles. The main prediction is corroborated across
alternative specifications of Table 2.50 In the first column of Table 2 enters positive
and is statistically significant. Moving from an ethnic group with equally distributed regional farming
suitability to an ethnic group with extremely unequal distribution increases Muslim representation by
33% It is important to note that in all specifications we explicitly control for the country fixed effects each
ethnic group belongs to. Such inclusion of powerful controls, not possible in a cross-country framework,
allows to take into account any systematic element related to the state histories of existing countries
and, thus, produce reliable estimates of the effect of geographic inequality on Muslim adherence.
In Column 2 we add a series of controls to account for alternative hypotheses that have been
proposed in the literature. The negative coefficient on the distance from Mecca is consistent with the
diffusion hypothesis. As Islam originated in the Arabian peninsula and spread from there, regions closer
to Mecca were more likely to receive the expanding Muslim populations. Also, the distance from trade
routes in 600 AD has a strong negative effect. Ethnic groups within countries located further from the
pre-Islamic trade routes have systematically lower Muslim adherence. This is in line with the argument
48Note that the WRD provides estimates for Muslim, Christian, Buddhist, Hindu etc. adherence per ethnicity at the
country level and the WLMS (2006) maps the locations that these groups may be traditionally found within a country.49We focus on ethnic groups with an area of at least 1000 square kilometers. Using all ethnic groups irrespective of the
size does not change the result.50The results presented here are OLS estimates with the standard errors clustered at the country level.
27

that historians of Islam have proposed. Following the demise of the Persian empire in the 7 century
Muslims came to dominate the preexisting trade routes. Hence, local populations had an incentive to
convert to Islam in order to take advantage of the expansive Muslim trade network. This negative
coefficient on distance from trade routes in 600 AD may be then interpreted as evidence of a transaction
effect. Accounting for these important features the coefficient on land inequality reduces by a third but
remains precisely estimated. Conditional on the distance from preexisting trade routes and the distance
from Mecca, ethnic groups with more unequal agricultural potential are more likely to be Muslim.
In Column 2 we also control for a series of geographical characteristics to mitigate any concerns
related to omitted variable’s bias. Ethnicities located in lowland areas are more likely to have higher
Muslim adherence. This is an intuitive finding, given that Muslims controlled the pre-industrial trade
routes between Asia and Europe and the latter were more likely to be found along low elevation territories.
Perhaps, a more important finding from a theoretical point of view, is the positive and significant effect
that variation in elevation exerts on Muslim representation. Conditional on geographic characteristics
and distance from trade routes and Mecca, ethnic groups located in regions with variable terrain are
more likely to adhere to Islam. To the extent that a variable topography makes it easy to disrupt any
trade flow over such territories then the groups in these geographically conflict prone regions would
have an incentive to adopt the conflict reducing principles of Islam. Additional geographical controls
like: average land quality, the area of an ethnic group, the distance from Rome, the distance from the
equator, _, and distance from the coast do not systematically correlate with Muslim adherence.
Finally, we also control for population density in 1990 within an ethnic group. Note that the derived
estimate cannot be causally interpreted since fertility decisions are likely to be affected by religious
beliefs. Nevertheless, we introduce this control to ensure that our results are not driven by systematic
differences in population density between Muslim and non-Muslim groups.
The last two columns of Table 2 divide the sample of ethnic groups between those that belong to the
New World and those to the Old World. The proposed theory focuses on the endogenous adoption from
indigenous populations of the Islamic principles as trade opportunities exacerbated regional geographical
inequalities following the fall of the Roman Empire. These conditions were largely present in the Old
World. However, when countries from the New World joined the transatlantic trade their institutions
were engineered by the colonizers rather than the indigenous populations that were severely disrupted,
see Acemoglu et al. (2002). As a result, within the New World geography should not have an effect on
the adoption and spread of the Islamic religion. Indeed, this is what is shown in column 3 of Table 2,
whereas column 4 shows the strong effect of an unequal geography and a variable topography in bringing
forward and sustaining larger Muslim populations within the Old World.
28

4.2.1 Muslim Empires and Other Religions
The proposed theory identifies the geographic conditions under which Islamic principles would be adopted
from indigenous populations. However, groups of people coming under the direct rule of a Muslim
empire might face other incentives for converting to Islam, see Chaney (2008) and Bulliet (1979). For
example, the lower tax rates granted to Muslims over non-Muslims in Muslim Empires or the status
achieved by switching to the ruler’s religion, might differentially affect conversion rates across types of
land endowments. Similarly, instances of forced conversion or religious persecution during the Muslim
expansion might have shaped the observed religious affiliation. Additionally, one might argue that the
identified relationship between geography and Muslim adherence is not particular to the Muslim religion
but it may either be a feature of all monotheistic religions or an outcome of some other major religion
following the opposite geographic pattern, that is another religion being consistently found in places with
uniformly distributed land endowments. To mitigate such plausible concerns we focus on ethnic groups
that have not been under the direct rule of any Muslim empire and ask whether the "Islamic" geography
is systematically associated with other religious denominations. This is done in the specifications of
Table 3.
We investigate how geography shapes religious affiliation in the Old World across ethnic groups
whose homelands have not been at any point in history under the direct rule of Muslim empires. Following
Black (2005) we identify the regions that have been dominated by the Umayyads, Abassids, Karakhanids,
Ghurids, Ghaznavids, Mughals, Ottomans, Mamluks, Seljuks, Timurids, Fatimids, Almoravids and the
Almohads and exclude them from the analysis, see Figure 3. Such restriction produces a sample of
2 015 ethnic groups. Tables 3 and 3 present the summary and the correlation between geographical
features and adherence rates to various religious denominations for this subset of groups. Reassuringly,
column 1 of table 4 shows that ethnic groups with large Muslim adherence in the Old World and out
of the direct control of a Muslim empire consistently exhibit higher levels of inequality in agricultural
endowments and have more variable topography. Also, distance from the borders of the Muslim empires
of the centroid of each ethnic group enters with the expected negative sign, however it is not precisely
estimated. In contrast, the coefficient on the distance from trade routes is both economically and
statistically significant.
In columns 2 to 4 of Table 4 we use as a dependent variable the percentage of people within an ethnic
group adhering to 3 other major religions i.e. Christianity, Hinduism and Buddhism respectively, whereas
the fraction of people adhering to local animistic, or shamanistic religions, that is ethnoreligionists, is used
in column 5. Neither Christians nor Hindus are systematically found along unequal land endowments
whereas Buddhists like Muslims are more likely to be found along agriculturally unequal territories. It is
interesting to note that the only religious group that follows the opposite geographic pattern compared to
Muslims are the local tribal denominations. Our interpretation is that when Islam started spreading, the
29
ethnic groups that maintained their local tribal religions had exactly the type of geographic endowments
(relatively uniform distribution of agricultural potential) that were not conducive to the adoption of the
Islamic principles, whereas those residing along more unequally endowed regions endogenously adopted
the Islamic economic principles.
4.2.2 Robustness Checks on Cross-Ethnic Group Analysis
This section performs a series of robustness checks to ensure that the results are robust to alternative
measures of Muslim representation, indexes of land inequality and distances from trade routes. Table 5
presents the summary statistics and Table 5 shows that these new statistics are highly correlated with
the measures already used.
In column 1 of Table 6 we use as dependent variable an indicator that takes the value 1 if the
majority of an ethnic group is Muslim. Transforming an ethnic group’s homeland characterized by
perfect equality of agricultural potential to an extremely unequal one increases the probability that the
ethnic group will have a Muslim majority by 33%. In columns 2 and 3 of Table 6 inequality in agricultural
suitability is captured by the mean logarithmic deviation (MLD) and the Theil Index, respectively, with
similar results. Finally, in column 4 we employ the distance from trade routes of each ethnic group
considering major trade routes for the whole period between 600 AD and 1800 AD, see Figure 3
Across all specifications Muslim ethnic groups within countries are systematically found along more
unequally endowed regions and closer to the pre-industrial trade routes, demonstrating the robustness
of the findings to alternative indexes of geographical inequality and trade route proximity measures.
According to the theory it was along these regions that the institutional arrangements of Islam would be
more likely accepted among indigenous populations in the preindustrial world. Considering that inequal-
ity in land endowments is significant in shaping predominantly Muslim adherence, after (i) controlling
for country fixed effects and (ii) focusing on ethnic groups that historically were not subject to the direct
rule of any Muslim empire, enhances the plausibility of the proposed theory.
These findings uncover the so far neglected crucial role of geographical inequality in shaping the
differential adherence to the Muslim religion across ethnic groups and shed new light on the geographical
origins and spatial distribution of Muslims within modern day countries.
4.3 Cross-Virtual Country Analysis
So far, the empirical analysis has focused on the role of geography in shaping Islamic representation
across ethnic groups. The theory’s predictions, however, do not require a specific unit of analysis and in
fact are amenable to understanding the spread of Islamic principles across arbitrary sets of regions. The
decision, for example, to adopt Islam may depend not only on the distribution of land quality within a
group’s homeland but also on the overall distribution of land quality of the larger area to which a group
of people belongs. This is the empirical strategy pursued in this section. We arbitrarily divide the world
30

into geographical entities of a fixed size, called virtual countries and we ask how the distribution of land
quality in these places shapes local Muslim adherence.
The virtual countries are constructed in the following way: we generate a global grid of 25 by 25
decimal degrees that extends from −180 to 180 degrees longitude and from 85 degrees latitude to −65degrees latitude. This global grid is intersected with the territories that are covered linguistically by
the WLMS (2006) database. Since no linguistic groups are mapped for oceans, large lakes and seas, the
virtual countries falling entirely in such places vanish. Each and every part of a virtual country that
remains after the spatial intersection has complete linguistic coverage, and it is across these territories
that geographic and population statistics are constructed. Figure 4 illustrates the resulting virtual
countries with linguistic and religious affiliation. Out of the 64 004 cells in the land quality dataset
18 941 contain no information on languages and are dropped from the analysis. This is mostly due to
the incomplete mapping of regions in the Americas and Australia.
Figure 5 shows one example of a virtual country. This virtual country belongs to 4 modern day
countries. The northern part belongs to Syria, a tiny piece of land in the northwestern part is Lebanese,
the southern part to Jordan and a small part in the East to Iraq. For each artificial country, we construct
the distribution of land quality using information on land agricultural suitability at the regional level
of 05 by 05 decimal degrees. In order to derive an estimate of Muslim adherence within an artificial
country we weigh the Muslim population of each ethnic group found within a virtual country by the
fraction of the area each ethnic group traditionally occupies in this grid.51 The artificial country in
Figure 5 has a Muslim representation of 99% 76% of its regions are poorly endowed for agricultural
activities and has an estimated Gini index of land suitability of 076.
In the regression analysis virtual countries of at least 10 000 square kilometers are included yielding
an average virtual country of 44 000 square kilometers. The resulting sample size is 1902 observations
with a median of 25 regions. A virtual country falls on average into 7 ethnic groups. Descriptive statistics
and the raw correlation between the variables used in the regressions are presented in Tables 7 and 7.
An average virtual country has 22% Muslims.
We now estimate (29) using cross-virtual country data. Column 1 of table 8 shows that conditional
on average land quality a more unequal distribution of agricultural potential across virtual countries con-
51For example, the Muslim adherence in 2005 for the virtual country depicted in Figure 5 is as follows: There are in total
11 ethnic groups in this grid. The dominant one is the Najdi Spoken Arabic group in Syria which is found in 56% of this
virtual country’s area with 99% Muslims, the Najdi Spoken Arabic in Lebanon with 32% area coverage and 99% Muslims,
the North Levantine Spoken Arabic in Syria with 7% area coverage and 93% Muslims, the Levantine Bedawi Spoken Arabic
in Jordan found in 25% of this virtual county with 99% Muslims, the Najdi Spoken Arabic in Iraq with 13% area coverage
and 99%Muslims, the North Levantine Spoken Arabic in Lebanon found in 069% of the virtual country with 58% Muslims,
the Adyghe group in Syria with 04% of territorial coverage and 99% Muslims, the South Levantine Spoken Arabic group in
Jordan covering 01% with 92% Muslims the Western Neo-Aramaic group in Syria covering 001% with 92% Muslims. For
two groups in Syria, i.e. the Mesopotamian Spoken Arabic group with a coverage of 22% and the Levantine Bedawi Spoken
Arabic with a coverage of 47% we do not have data on the religious affiliation so are not included in the analysis. Using
this information on land coverage and Muslim proportions we calculate for each artificial country the probability of picking
a Muslim adherent in 2005. Similar is the procedure followed for calculating adherence to other religious denominations.
31

tributes significantly to the formation of Muslim communities.52 By taking advantage of the arbitrarily
drawn borders of these geographical entities, we control for country fixed effects in all specifications.53
In column 2 we account for a series of controls. Once we do so, the negative effect of average land quality
becomes marginally significant suggesting that Muslim communities are located along poorly endowed
regions. On the other hand, virtual countries featuring a more variable terrain, which presumably has
been historically exposing trade activities in these areas to higher risks of expropriation, also sustain
larger Muslim adherence.
The area of a virtual country is not statistically significant whereas the within country indicator
is negative. This finding may be suggestive of national borders drawn along regions with large Muslim
populations and/or a consequence of modern day Muslim countries being systematically smaller than
a non-Muslim country. The distance from Mecca of each artificial country negatively affects Muslim
intensity. Likewise, virtual countries located at higher altitudes and having more ethnic groups sustain
smaller Muslim populations.
In specifications 3 and 4 of Table 8 we focus on different subsets of the sample. In particular, in
column 3 the sample consists of virtual countries of the Old World. Similar to the ethnic group findings,
an unequal geography significantly increases Muslim intensity across virtual countries in Africa, Asia
and Europe. In column 4, in order to alleviate concerns related to conversion into Islam across places
within a Muslim empire we further restrict the sample into virtual countries of the Old World beyond the
control of any Muslim empire. Doing so we are able to assess the role of geography in shaping Muslim
penetration across territories where religious coercion and tax discrimination in favor of Muslims is a
lesser concern. In this sample geographic inequality systematically increases Muslim adherence at a
virtual country level. Also, now the distance from the borders of a Muslim empire becomes a significant
determinant of religious affiliation. Virtual countries closer to the Muslim borders have higher Muslim
representation.
In the last 4 columns of table 8 we use as dependent variable the adherence in other religious
denominations. Despite the large negative correlation between Muslim and Christian adherence across
virtual countries (−067), column 5 shows that land inequality does not systematically shape Christianshares across virtual countries. Similar non-findings regarding the effect of unequal geography obtain for
the share of Buddhists and Hindus. In the last column of Table 8 the dependent variable is the share
of the population that is ethnoreligionist. Echoing the findings of the cross-ethnic group specifications
ethnoreligionists are concentrated along virtual countries that are characterized by a relatively equal
distribution of agricultural potential following the opposite pattern uncovered for the Muslim adherents.
This reinforces the theoretical argument that Islamic principles were more likely to be adopted by
52The results presented here are OLS estimates with the standard errors clustered at the country level. Adjusting for
spatial autocorrelation following Conley (1999) delivers smaller standard errors.53The virtual countries that fall into more than one country are assigned as a country dummy the country where their
centroid belongs to.
32

indigenous populations in places whose underlying geography was creating conflicting interests that
Islamic principles were engineered to bring together.54
4.3.1 Robustness Checks on Virtual-Country Analysis
In this section we replicate the robustness checks performed in the ethnic group analysis using virtual
country data. Table 9 presents the summary statistics and Table 9 shows that these statistics are
highly correlated with the measure of land inequality already employed.
Table 10 presents the results for virtual countries in the Old World. Exploiting within coun-
try variation, arbitrarily carved territories are more likely to have a Muslim majority when they are
characterized by unequal agricultural endowments, overall poor agricultural suitability and a variable
topography. These geographic characteristics in presence of any trade opportunities would have created
conflicting interests among the indigenous. Hence, granted that Muslim economic doctrine was forged
precisely to overcome these conflict prone geographical environments this would lead to the endogenous
adoption of Islam. In columns 2 and 3 of Table 10 inequality in agricultural suitability is proxied by the
mean logarithmic deviation and the Theil Index, respectively, with similar results. Finally, in column
4 we employ the distance from trade routes of each ethnic group considering major trade routes for
the whole period between 600 AD and 1800 AD. Doing so the estimate on distance from trade routes
becomes precisely estimated.
This section establishes that across sets of contiguous regions those exhibiting both more unequal
and overall poor agricultural potential sustain larger Muslim populations. Considering that these results
(i) obtain at an arbitrary level of aggregation, (ii) are significant only in explaining Muslim adherence,
(iii) hold after controlling for country fixed effects, and (iv) obtain for virtual countries not subject to
any Muslim empire historically, highlight the geographical origins of Islam.
4.4 Cross-Country Analysis
In the last part of the empirical section we investigate the relationship between Islam and land inequality
across modern day countries. Regional observations within a country extend from a single observation
for Monaco to 12279 for Russia. The median is 82. Figure 6 in Appendix shows that existing
countries vary widely in the distribution of agricultural suitability. The descriptive statistics and the
raw correlations between the variables of interest are presented in Tables 11 and 11. A typical country
has a Gini index of land inequality of 035 whereas in 1900 AD an average country had about 22% of
Muslims, see Figure 6. These two variables have a correlation of 048.
54We also attempted to detect whether there is a diminishing effect of land inequality on Muslim adherence for virtual
countries further from the trade routes. Although the interaction entered negatively as expected it was statistically in-
significant. This is presumably because the maps of historic trade routes are drawn with a certain degree of accuracy and
indicate only the major continental routes of the era.
33

To estimate the effect of agricultural inequality on Muslim adherence the following specification is
adopted:
Muslim%1900 = 0 + 1_ + 2 + (30)
where Muslim%1900 is the fraction of the population adhering to Islam in 1900 AD.
The results of the main specification (30) are presented in column 1 of Table 12.55 A one standard
deviation increase in the Gini inequality of agricultural suitability increases the fraction of the Muslim
population in 1900 by 13% and differences in regional inequality account for 23% of the variation in
Muslim representation. The average land quality is insignificant. In column 2 of Table 2 we introduce
a host of geographic controls. Larger countries have lower Muslim representation but the estimate is
insignificant. Countries further from Mecca and further from Rome are also less likely to be Muslim.
The distance from pre-Islamic trade routes is imprecisely estimated whereas countries further from the
equator are less probable to be Muslim. In the same specification a set of continental dummies is
included. As expected countries in Western Europe have fewer Muslims, whereas those in the Middle
East, Northern Africa and Asia have a larger Muslim populace.
The additional geographical controls like mean elevation and variation in elevation within a country
and the mean distance to the nearest coastline or sea-navigable river are not systematically related to
Muslim adherence. These geographical controls do not change the economic and statistical significance
of inequality in agricultural potential, highlighting the robustness of our findings.
Column 3 and 4 of Table 12 split the sample of countries between the Old and the New World
respectively. Consistent with the pattern identified in the cross-ethnicity and cross-virtual country
regressions, geography is a fundamental determinant of Muslim adherence across countries in the Old
World, and plays no role in explaining contemporary Muslim representation across countries in the New
World. Finally, column 5 focuses across countries in the Old World that have not been under a Muslim
empire in order to identify the role of geographical endowments across societies that have not been
subjects of a Muslim imperial power. The sample of countries in this case reduces to 76 observations,
however the estimate on the land inequality remains both economically and statistically significant.
This section corroborates the pattern uncovered in the cross-ethnic and cross-virtual country analy-
sis demonstrating the fundamental role of geographical inequality in determining adherence to Islam
across modern day countries.
55We focus on countries with at least 20 regional observations to ensure that our findings are not driven by countries with
limited regional coverage. Using as dependent variable the Muslim representation as of 2000 the coefficients of interest are
larger and more precisely estimated. Presumably this is because earlier estimates of religious affiliation are bound to be
more noisy.
34
5 Conclusion
This research sheds new light on the economic origins of Islam. The empirical analysis uncovers that the
Muslim lands are characterized by high inequality in the suitability for agriculture across regions and
shows that Muslim adherence is systematically larger along the pre-Islamic trade routes in the Old World.
The theory provided links this particular type of geography to the formation of the Islamic principles
and investigates its impact on the economic performance of the Muslim world in the pre-industrial era.
Constructing detailed data on the distribution of land quality across countries, ethnic groups and
virtual countries, we show that places characterized by high inequality in agricultural potential sustain
larger Muslim communities. The virtual country analysis is of particular significance since the relation-
ship between geographic inequality and Muslim adherence obtains at an arbitrary level of aggregation,
explicitly avoiding the endogeneity of current countries’ borders and after controlling for country fixed
effects. These results are further validated by looking into how the distribution of agricultural suitability
shapes Muslim adherence within ethnic groups. Ethnic groups located on unequal land endowments
closer to pre-Islamic trade routes exhibit a larger Muslim representation. Further evidence shows that
the identified significant impact of unequal agricultural endowments on religious affiliation is unique to
the Muslim denomination and it obtains for virtual countries and ethnic groups that historically have
not been part of any Muslim empire. Overall the empirical analysis highlights the prominent role of an
unequal geography in shaping the spread and persistence of Islam.
These findings are consistent with the theory provided. We argue that geography and trade op-
portunities forged the Islamic economic doctrine affecting the economic performance of Islamic lands.
In particular, the unequal distribution of land endowments conferred differential gains from trade across
regions, fostering predatory behavior from the poorly endowed ones. In such an environment, it was
mutually beneficial to institute a system of income redistribution. However, a higher propensity to
save by the rich would exacerbate wealth inequality rendering redistribution unsustainable, leading to
the demise of the Islamic unity. Consequently, wealth inequality had to remain within limits for Islam
to persist. This was instituted by increasing the costs of physical capital accumulation rendering the
investments on labor productivity enhancing public goods, through religious endowments, increasingly
attractive. The Islamic economic principles allowed the Muslim lands to escape from a state of constant
feuding and flourish in the preindustrial world limiting the potential for growth in the eve of large scale
shipping trade and industrialization.
35

6 Appendix A
Figure 1: Regional Suitability for Agriculture Across the Globe
36

Figure 2: Location and Muslim Representation across Groups in Ethiopia
The Case of the Amharic and Somali Ethnicities
Figure 2: Regional Land Quality across Groups in Ethiopia
The Case of the Amharic and Somali Ethnicities
37

Table 1a - Summary Statistics for the Cross Ethnic Group Analysis - Muslim World in 2005 AD
_statsMuslim
%05
Land Inequality
(Gini)
Average Land
Quality AreaDistance
from Mecca
Distance from Trade Routes in 600 AD
Distance from Rome
Mean Elevation
Variation in
Elevation
Ln(Population Density in
1990)
mean 0.19 0.16 0.44 0.31 6.25 2.46 7.03 0.72 0.21 2.74
sd 0.35 0.15 0.23 2.29 3.58 2.56 3.37 0.81 0.22 1.92
max 1.00 0.97 1.00 80.24 16.51 10.92 18.49 5.42 1.80 7.34
min 0.00 0.00 0.00 0.01 0.44 0.00 0.12 -0.59 0.00 -4.78See Appendix B for variables' definitions
Table 1b - Correlation Matrix for the Cross Ethnic Group Analysis - Muslim World in 2005 AD
Muslim%05
Land Inequality
(Gini)
Average Land
Quality Ln(Area)Ln(Distance from Mecca)
Ln(Distance from Trade Routes in 600 AD)
Ln(Distance from Rome)
Mean Elevation
Variation in
Elevation
Ln(Population Density in
1990)
Muslim%05 1.00
Land Inequality (Gini)
0.24 1.00
Average Land Quality
-0.18 -0.48 1.00
Ln(Area) 0.03 0.19 -0.06 1.00
Ln(Distance from Mecca)
-0.33 -0.14 0.03 -0.01 1.00
Ln(Distance from Trade Routes in 600 AD)
-0.27 -0.09 0.00 -0.01 0.82 1.00
Ln(Distance from Rome)
-0.30 -0.21 0.05 -0.04 0.88 0.55 1.00
Mean Elevation
-0.05 0.36 -0.03 0.00 -0.20 -0.17 -0.18 1.00
Variation in Elevation
0.06 0.26 0.11 0.08 -0.04 -0.10 -0.03 0.54 1.00
Ln(Population Density in 1990)
0.13 -0.09 0.41 -0.01 -0.35 -0.43 -0.28 0.09 0.23 1.00
See Appendix B for variables' definitions

Table 2 - Cross Ethnic Group Analysis - Muslims in 2005 AD
(1) (2) (3) (4)
VARIABLES Muslim%05 Muslim%05 Muslim%05 Muslim%05
Land Inequality (Gini) 0.328*** 0.207*** 0.001 0.233*** (0.070) (0.068) (0.001) (0.087)
Average Land Quality -0.014 -0.123* 0.001 -0.159* (0.124) (0.072) (0.001) (0.095)
Variation in Elevation 0.129*** -0.001 0.160** (0.049) (0.001) (0.062)
Mean Elevation -0.050*** 0.001 -0.059** (0.018) (0.001) (0.026)
Ln(Distance from Mecca) -0.435*** 0.008 -0.474*** (0.164) (0.009) (0.181)
Ln(Distance from Trade Routes in 600AD) -0.057** -0.002 -0.056*** (0.023) (0.004) (0.019)
Ln(Area) 0.002 0.001 0.002 (0.006) (0.001) (0.008)
Ln(Distance from Rome) -0.150 -0.005 -0.136 (0.173) (0.004) (0.192)
Ln(Sea Distance) 0.007 0.001 -0.032 (0.089) (0.001) (0.106)
Absolute Latitude 0.004 0.001 0.008 (0.004) (0.001) (0.006)
Ln(Population Density in 1990) 0.014 0.001 0.018 (0.018) (0.001) (0.027)
Country FE Yes Yes Yes Yes
Observations 2911 2911 572 2339
R² 0.52 0.59 0.12 0.57
Standard errors in parentheses are clustered at the country level, *** p<0.01, ** p<0.05, * p<0.1
Specification (3) focuses within the New World i.e. the Americas and the Pacific, (4) focuses within the
Old World i.e. Asia, Africa and Europe.
See Appendix B for variables' definitions

Figure 3: Regions Dominated by Muslim Empires in the Old World
Figure 3: Pre-industrial Trade Routes in the Old World
Ü Major Trade Routes in the Old World 600 AD - 1800 AD
!( Overland Routes and Major Ports
"/ Ethnic Groups' Homelands
!(!(!(!(!(!(!(!(!(!(!(!(
!(!(!(!(!(!(!(!(!(!(!(!(
!(!(!(!(
!( !(
!(
!(!(!(!(!(!(!(!(!(!(!(!(!(!(!(!(!(!(!(!(!(!(!(
!(!(!(!(!(!(!(!(!(!(!(!(!(!(!(!(!(
!(!(!(!(!(!(!(!(!(!(!(!(!(!(!(!(!(!(!(!(!(!(!(
!(!(!(!(!(!(!(!(!(
!(!(!(!(!(!(!(
!(!(!(!(!(!(!(!(!(!(!(!(!(!(
!(!(!(
!(!(
!(!(!(!(!(!(!(!(!(!(!(!(!(!(!(!(!(
!(!(!(!(
!(!(!(!(!(!(!(
!(!(!(!(!(
!(!(!(!(!(!(!(!(
!(!(!(!(
!(!(!(!(!(!(!(!(!(!(!(!(!(!(!(!(!(
!(!(!(!(!(!(!(
!(!(!(!(!(!(!(
!(!(!(!(!(!(!(!(!(!(!(!(!(!(!(!(!(!(!(!(!(!(
!(!(!(!(!(!(!(!(!(!(!(!(!(!(!(!(!(!(!(!(!(!(!(!(!(!(!(!(!(!(
!(!(!(!(!(!(
!(!(!(!(!(!(!(!(
!(!(!(!(!(!(!(!(!(!(!(!(!(!(!(!(!(!(
!(!( !(!(
!(!(!(!(!(!(!(!(!(!(!(
!(!(!(!(!(!(!(!(!(!(!(!(!(!(!(!(!(
!(!(!(!(!(!(!(!(!(
!(!(!(!(!(!(!(!(!(!(!(!(!(!(!(!(!(!(!(!(!(!(!(!(!(!(!(!(!(!(!(!(!(!(!(!(!(!(!(!(!(!(!(!(!(!(!(!(!(!(!(!(!(!(!(!(!(!(!(!(!(
!(!(
!(!(!(!(
!(!(!(!(!(!(!(!(!(!(!(!(!(!(!(!(!(!(!(!(!(!(!(!(!(!(!(
!(!(!(!(!(!(!(!(!(!(!(!(!(!(!(!(!(!(!(!(!(!(!(!(!(!(!(!(!(!(!(!(!(!(!(
!(!(!(!(!(!(!(!(!(!(!(
!(!(!(
!(!(
!(!(!(!(!(!(!(!(!(!(!(!(!(!(!(
!(!(!(!(!(!(
!(
!(!(!(!(!(!(!(!(!(!(!(!(
!(!(!(!(!(!(!(!(!(!(!(!(!(!(!(!(!(!(!(!(!(
!(
!(
!(!(!(!(
!( !(
!(!(!(!(!(!(!(!(!(!(!(!(!(!(
!(!(
!(
!(!(!(!(!(!(!(!(!(!(!(!(!(
!(!(!(!(!(!(!(
!(
!(
!(!(!(!(!(!(!(!(!(!(!(!(!(!(!(!(
!(!(!(!(
!(!(!(!(!(!(
!(!(
!(
!(!(!(!(!(!(!(!(!(!(!(!(!(!(!(!(!(
!(!(!(!(!(!(!(!(!(!(!(!(!(!(!(!(!(!(!(!(!(!(!( !(!(!(!(!(!(!(!(!(!(!(
!(!(!(!(!(!(!(!(
!(!(!(!(!(!(!(!(!(!(
!(!(!(!(!(!(!(!(!(!(!(!(!(!(!(!(!(
!(!(!(!(!(!(!(
!(
!(
!(!(!(!(!(!(!(!(!(!(!(!(!(!(!(!(!(!(
!(!(!(!(!(!(!(!(!(!(!(!( !(!(!(!(!(
!(!(!(!(!(
!(!(!(!(
!(!(!(!(!(!(!(!(!(!(
!(!(!(!(!(
!(!(!(!(!(!(!(!(
!(!(!(
!(!(!(!(
!(!(!(!(!(!(!(!(!(!(!(!(!(!(!(
!(
!(!(!(!(!(!(!(!(!( !(!(
!(!(!(!(!(!(!(!(!(!(!(!(!(!(!(!(!(!(
!(!(!(!(!(
!(!(!(!(!(!(!(!(!( !(!(!(!(!(!(!(!(!(!(
!(!(!(!(!(!(!(!(!(!(!(!(!(
!(!(!(!(!(!(!(!(
!(
!(!(!(!(!(!(!(!(!(!(!(!(!(!(!(!(!(!(!(!(!(!(!(!(!(!(!(!(
!(!(!(!(!(!(!(!(!(!(!(!(!(!(
!(!(!(!(!(!(!(!(!(!(!(!(!(!(!(!(!(!(!(!(!(!(!(
!(!(!(!(!(!(
!(!(!(!(!(!(!(!(!(!(!(
!(!(!(!(!(
!(!(!(!(
!(!(!(!(!(!(!(!(
!(!(!(!(!(!(!(!(!(!(
!(!(!(!(!(!(
!(!(!(!(!(!(!(!(!(!(!(!(
!(
!(!(!(!(!(!(
!(!(!(!(!(!(!(!(!(
!(!(
!(!(!(!(!(!(!(!(
!(!(!(
!(!(
!(
!(!(
!(!(!(
!(
!(
!(!(!(!(!(!(!(!(!(!(!(!(!(!(!(!(!(!(!(!(!(!(!(!(!(!(!(!(!(!(!(!(!(!(!(!(!(!(!(!(!(
!(!(!(!(!(!(!(!(
!(!(!(!(!(!(!(!(!( !(!(!(!(!(!(!(!(!(!(!(!(!(
!(!(
!(!(!(!(!(!(!(!(!(!(!(
!(!(!(!(!(!(!(!(!(!(!(!(!(!(
!(!(!(!(!(!(!(!(!(!(!(
!(!(!(!(!(
!(!(!(!(
!(!(!(!(!(!(!(!(!(!(!(!(!(!(!(!(!(!(!(
!(!(!(!(!(!(!(
!(!(!(!(!(!(!(!(!(!(!(!(!(!(
!(
!(
!(
!(
!(!(!(!(!(!(!(!(!(!(!(!(!(
!(!(!(!(!(!(!(
!(!(!(!(!(
!(!(!(!(!(!(!(!(!(!(!(!(!(!(!(!(!(!(!(!(!(!(!(!(!(!(!(!(
!(!(!(!(!(!(!(!(!(!(!(!(!(!(!(
!(
!(!(!(!(!(!(!(!(!(!(!(!(!(!(!(!(!(!(!(!(
!(!(!(!(!(!(!(!(!(!(!(!(!(!(!(!(!(!(!(
!(!(!(
!(!(!(!(!(!(!(!(!(!(!(!(!(!(!(!(!(!(!(!(!(!(!(!(!(!(!(!(!(!(!(!(!(!(
!(!(!(!(!(!(!(!(
!(!(!(
!(!(!(!(!(!(!(!(!(!(!(!(!(!(!(!(!(!(!(!(!(!(
!(!(!(!(!(!(!(
!(
!(
!(!(!(
!(!(!(!(!(!(!(!(!(!(!(!(!(!(!(!(!(!(!(
!(!(!(
!(!(!(!(!(!(!(
!(!(!(!(!(!(!(!(!(!(!(!(!(!(
!(
!(!(!(!(!(
!(!(!(
!(!(!(!(
!(
!(
!(
!(
!(
!(!(
!(
!(
!(
!(!(!(!(
!(!(!(!(!(!(!(!(!(!(!(!(!(!(!(!(!(!(!(!(
!(!(!(!(!(!(!(!(!(!(!(!(!(!(!(!(!(!(!(!(!(!(!(!(!(!(!(!(
!(!(!(!(!(!(!(!(!(!(!(!(!(!(!(!(!(!(!(!(!(!(!(
!(!(!(!(!(!(!(
!(
!( !(
!(!(!(!(!(!(
!(!(!(!(!(!(!(
!(!(!(
!(!(!(!(!( !(
!(!(!(
!(!(!(!(!(!(!(!(
!( !(!(!(!(!(
!(!( !(
!(!(!(!(!(!(!(!(!(!(!( !(!(!(!(!(
!(!(!(!(!(!(!(!(!(!(!(!(!(
!(!(!(!(!(!(!(!(!(!(!(!(!(!(!(!(!(!(!(!(!(!(!(!(!(!(!(!(!(
!(!(!(!(!(!(!(!(!(!(
!(!(!(!(!(!(!(!(!(!(!(!(!(!(!(
!(!(!(!(!(!(
!(!(!(!(!(!(!(
!(!(!(!(!(!(!(!(!(!(!(!(!(
!(!(!(!(!(!(!(!(!(!(!(!(!(!(!(!(!(!(!(!(!(!(!(!(!(!(!(!(!(!(!(!(!(!(!(!(
!(
!(!(!(!(!(!(
!(!(!(!(!(!(
!(!(!(!(!(!(!(!(!(
!(!(!(!(!(!(!(!(!(!( !(!(!(!(!(!(!(!(!(
!(!(!(!(!(!(!(!(!(!(!(!(!(
!(!(!(!(
!(!(!(!(!( !(!(!(!(!(!(!(!(!(!(!(!(!(!(!(!(!(!(!(!(!(!(!(!( !(!(!(
!(
!(!(
!(
!(
!(!(!(
!(!(!(!(!(!(!(!(!(!(!(!(
!(!(!(!(!(!(
!( !(
!(
!(!( !(
!(
!(
!(
!(
!(!(
!(!(!(
!(
!(
!(
!(
!(
!(
!(
!(
!(
!(
!(!(!(!(!(!(!(!(!(!(!(
!(
!(!(!(!(!(!(!(!(!(!(!(!(!(!(!(
!(!(!(!(!(!(!(!(!(!(!(!(!(!(!(!(!(
!(!(!(!(!(!(!(!(!(!(!(!(!(!(!(!(!(!(!(!(!(!(!(!(!(!(!(!(!(!(!(!(
!(!(
!(!(!(!(!(!(!(!(!(!(!(!(!(!(!(!(
!(!(!(!(!(!(!(!(!(!(!(!(!(!(!(!(!(!(!(!(!(!(!(!(!(!(!(!(!(!(!(!(!(!(!(
!(!(!(!(!(!(!(!(!(!(!(!(!(!(!(!(!(!(!(!(!(!(!(!(!(!(!(!(!(
!(!(!(!(!(!(!(
!(!(!(!(!(!(!(!(!(
!(!(!(!(!(!(!(!(!(!(!(!(!(!(!( !(!(!(!(!(!(!(!(!(!(!(
!(!(!(!(!(!(!(!(!(!(
!(!(!(!(!(!(!(!(!(!(!(!(!(
!(!(!(!(!(!(!(!(
!(!(!(!(!(!(!(!(!(!(!(!(!(
!(!(!(!(!(!(!(
!(!(!(!(!(!(!(!(
!(!(!(!(!(!(!(!(!(!(!(
!(!(!(!(!(!(
!(!(!(!(!(
!(!(!(!(
!(!(!(!(!(!(!(!(!(!(
!(!(!(
!(!(!(!(!(!(!( !(!(!(!(!(
!(!(!(!(!(!(!(
!(!(!(!(!(!(!(!(!(!(!(!(!(!(!(!(!(!(!(!(!(!(!(!(!(!(!(!(
!(!(!(!(!(!(!(!(!(
!(!(!(!(!(!(!(!(!(!(!(!(!(!(
!(!(!(!(!(!(!(!(!(!(!(!(!(!(
!(!(!(!(
!(!(!(!(!(!(!(!(
!(!(!(
!(!(!(!(!(!(!(!(!(!(!(!(!(!(!(!(!(!(!(
!(!(!(!(!(
!(!(!(!(!(!(!(!(!(!(!(!(!(!(!(!(!(!(!(!(!(!(!(!(!(!(!(!(!(!(!(!(
!(!(!(!(!(!(!( !(!(
!(!(
!(!(!(!(!(!(!(!(
!(!(!(!(!(!(!(!(!(!(!(!(!(!(!(!(!(!(!(!(!(!(!(!(!(!(!(!(!(!(!(!(!(!(!(!(!(!(!(
!(!(!(!(!(!(!(!(!(!(!(!(!(!(!(!(
!(!(!(!(!(!(!(!(!(!(!(!(!(
!(!(!(!(!(!(!(!( !(!(!(!(!(!(!(!(!(!(!(!(
!( !(!(!(!(!(!(!(!(!(!(!(!(!(!(!(!(!(!(!(!(!(!(!(!(!(!(!(!(!(!(!(!(!(!(!(!(!(!(!(!(!(!(!(!(!(!(
!(!(!(!(!(!(!(!(!(!(!(!(!(!(!(!(!(!(!(!(!(!(!(!(!(!(!(!(!(!(!(!(!(!(!(!(!(!(!(!(!(!(!(!(!(!(!(!(!(!(!(!(
!(!(!(!(!(!(!(!(!(!(!(!(!(!(!(!(!(!(!(!(!(!(!(!(!(!(!(!(!(!(
!(!(!(!(!(!(!(!(!(!(!(!(!(!(!(!(!(!(!(!(!(!(!(!(!(!(!(!(!(!(!(!(!(!(!(!(!(!(!(!( !(!(!(
!(!(!(!(
!(!(!(!(!(!(!(!(!(!(!(!(!(!(!(!(!(!(!(!(!(!(!(
!(!(!(!( !(!(!(!(!(!(!(!(!(!(!(!(!(!(!(
!(!(!(!(!(!(!(!(!(!(
!(!(!(!(!(!(!(!(!(!(!(!(!(!(
!(!(!(!(!(!(!(!(!(!(!(
!(!(!(!(!(!(!(!(!(!(!(
!(!(!(!(!(!(!(!(!(!(!(!(!(!(!(!(!(!(!(!(!(!(!(!(!(!(!(!(!(!(
!(!(!(!(!(!(!(!(!(!(!(!(
!(!(!(!(!(!(!(!(!(!(!(!(!(!(!(!(!(!(!(!(!(!(!(!(!(!(!(!(!(!(!(!(!(!(!(!(
!(!(!(!(!(!(!(!(!(!(!(!(!(!(!(!(!(!(!(!(!(!(!(!(!(
!(!(!(!(!(!(!(!(!(!(!(!(!(!(!(!(!(!(!(!(!(!(!(!(!(!(
!(!(!(!(
!(!(!(!(!(!(!(!(
!(!(!(!(!(
!(!(!(
!(!(!(!(!(!(!(!(!(!(!(!(
!(!(!(!(!(!(!(!(!(!(!(!(!(!(!(!(
!(!(!(!(
"/
"/ "/"/"/"/"/
"/"/"/"/
"/"/"/"/"/"/"/
"/"/ "/"/"/"/ "/ "/ "/ "/"/"/ "/"/"/ "/ "/ "/"/ "/ "/"/"/"/ "/"/"/ "/"/"/ "/ "/"/ "/"/"/ "/"/"/ "/"/ "/"/ "/ "/"/"/"/ "/"/ "/"/ "/"/ "/"/
"/ "/"/ "/ "/"/ "/"/ "/"/"/ "/"/"/"/ "/"/"/ "/"/ "/"/ "/ "/"/"/"/ "/"/"/ "/ "/"/"/ "/"/ "/ "/"/ "/"/"/ "/ "/"/ "/"/ "/"/ "/ "/"/"/ "/ "/"/ "/ "/"/"/ "/"/"/ "/"/"/ "/"/"/ "/"/ "/ "/"/"/"/ "/ "/"/"/"/ "/ "/"/"/ "/"/ "/"/ "/"/ "/"/"/"/ "/"/"/"/ "/"/"/ "/"/ "/"/ "/ "/"/"/ "/"/ "/ "/ "/"/"/ "/ "/"/"/ "/ "/ "/"/"/ "/ "/"/"/"/ "/ "/ "/"/"/ "/"/ "/"/"/"/"/ "/"/"/"/"/ "/"/ "/ "/ "/"/"/ "/"/"/"/ "/"/"/ "/"/ "/"/"/ "/ "/"/"/ "/ "/"/"/ "/"/"/ "/"/ "/"/"/ "/ "/"/ "/"/"/"/"/ "/"/"/ "/ "/"/ "/"/ "/"/ "/"/ "/ "/"/"/ "/"/"/ "/"/"/"/ "/"/ "/ "/"/"/ "/ "/"/"/ "/"/ "/"/"/ "/"/ "/"/"/ "/ "/"/ "/"/ "/"/"/ "/"/ "/"/ "/"/"/ "/"/ "/ "/"/ "/"/"/ "/"/"/ "/"/ "/ "/"/"/"/ "/"/ "/"/"/ "/ "/"/ "/ "/ "/"/ "/"/"/ "/"/"/"/ "/ "/"/ "/"/ "/"/"/ "/"/"/"/ "/"/ "/ "/"/ "/"/"/ "/ "/"/ "/"/"/ "/"/ "/"/ "/"/ "/ "/"/ "/ "/"/ "/"/ "/"/ "/"/ "/ "/"/ "/"/ "/"/ "/"/ "/"/ "/"/"/ "/ "/"/ "/"/ "/"/"/"/ "/ "/"/"/ "/ "/"/ "/"/ "/"/ "/"/"/ "/ "/"/"/ "/"/ "/"/ "/"/ "/"/"/"/ "/"/"/ "/"/"/"/"/ "/"/ "/ "/"/"/ "/ "/"/"/ "/ "/"/ "/"/"/ "/"/ "/ "/ "/"/ "/"/ "/ "/"/ "/"/"/ "/"/ "/"/"/"/"/ "/"/"/"/"/ "/ "/ "/ "/ "/"/ "/"/ "/"/"/"/ "/"/ "/ "/"/"/ "/"/"/ "/"/ "/"/ "/"/"/"/"/ "/ "/"/ "/ "/"/ "/"/ "/ "/"/ "/ "/"/ "/"/ "/"/ "/ "/"/ "/ "/"/"/ "/ "/"/"/ "/ "/"/ "/"/"/ "/"/ "/"/ "/"/"/ "/ "/ "/"/ "/"/"/"/"/ "/ "/"/"/ "/ "/"/ "/ "/"/"/ "/ "/"/"/"/ "/ "/"/"/ "/ "/"/"/ "/"/ "/ "/"/"/ "/"/ "/ "/"/"/ "/ "/"/"/ "/"/ "/"/"/ "/"/ "/"/ "/ "/ "/"/"/ "/"/ "/ "/"/"/ "/"/ "/"/ "/"/"/ "/"/"/ "/"/"/ "/"/"/ "/"/ "/"/"/ "/ "/"/"/ "/"/ "/"/ "/"/"/"/ "/ "/ "/"/"/ "/"/"/"/ "/ "/"/"/ "/ "/ "/"/ "/ "/ "/"/"/ "/ "/"/"/ "/ "/"/"/ "/ "/"/ "/"/ "/"/ "/"/"/ "/"/ "/"/ "/"/ "/"/ "/ "/"/"/ "/"/ "/"/ "/"/"/ "/"/"/ "/"/ "/"/ "/"/ "/"/"/ "/"/ "/"/ "/ "/"/ "/ "/ "/"/"/"/ "/ "/ "/"/ "/ "/"/ "/"/ "/ "/"/ "/ "/"/ "/"/ "/ "/"/ "/"/"/"/ "/ "/"/ "/"/ "/ "/"/"/"/ "/"/ "/ "/"/"/"/ "/ "/ "/ "/ "/"/ "/"/ "/"/ "/"/ "/ "/"/"/ "/ "/"/"/ "/"/ "/"/ "/"/"/ "/"/"/ "/"/ "/ "/ "/ "/ "/"/"/ "/"/ "/"/"/"/ "/ "/"/"/ "/"/"/"/ "/"/"/"/"/ "/"/ "/ "/"/ "/"/"/ "/ "/"/"/ "/"/"/"/ "/"/"/ "/"/ "/ "/"/ "/"/"/ "/ "/"/ "/ "/"/"/ "/"/ "/ "/"/ "/ "/"/"/ "/"/"/"/ "/"/ "/"/"/"/ "/"/ "/"/ "/"/ "/"/ "/ "/ "/"/ "/"/"/"/ "/"/"/"/ "/"/ "/ "/"/ "/"/ "/ "/"/ "/"/"/"/ "/"/ "/"/ "/"/ "/"/"/ "/"/"/ "/"/ "/ "/"/"/ "/"/"/"/ "/ "/"/ "/"/ "/"/"/ "/"/ "/"/ "/"/"/"/"/"/ "/"/"/ "/ "/"/ "/"/ "/"/"/"/ "/ "/"/ "/ "/"/ "/"/ "/"/"/ "/ "/"/ "/"/"/"/ "/"/ "/"/ "/ "/ "/"/"/"/"/"/ "/"/ "/"/"/ "/"/ "/"/ "/ "/"/"/ "/ "/"/ "/"/ "/"/ "/ "/"/ "/"/"/ "/"/"/ "/"/ "/ "/"/ "/ "/"/"/ "/"/ "/ "/"/ "/"/ "/"/ "/ "/"/ "/ "/"/"/"/ "/"/ "/"/ "/"/ "/ "/"/"/"/ "/"/ "/"/ "/ "/"/"/ "/"/ "/"/ "/"/"/"/ "/ "/ "/"/ "/"/ "/ "/ "/"/ "/"/ "/"/ "/"/"/ "/ "/"/ "/"/"/ "/ "/"/ "/ "/"/ "/"/ "/"/"/ "/ "/"/ "/ "/"/"/ "/"/ "/ "/"/ "/"/"/ "/ "/"/"/ "/ "/ "/"/ "/"/"/ "/"/ "/"/ "/"/ "/ "/"/ "/"/ "/ "/ "/"/ "/"/ "/ "/ "/"/"/ "/"/"/ "/"/ "/"/"/"/ "/ "/"/ "/"/"/"/ "/"/"/"/ "/ "/"/"/ "/ "/"/"/"/ "/"/ "/"/ "/"/"/"/"/ "/"/ "/"/"/ "/"/ "/ "/ "/"/"/ "/ "/ "/"/ "/"/"/"/ "/"/ "/ "/ "/"/ "/"/ "/ "/"/ "/"/"/ "/"/ "/"/"/ "/"/ "/ "/"/ "/"/ "/ "/ "/"/ "/"/ "/"/ "/"/ "/"/"/ "/"/"/ "/ "/"/"/ "/"/"/ "/"/ "/"/ "/"/ "/ "/ "/"/"/ "/"/ "/ "/"/ "/"/ "/"/ "/"/"/"/ "/ "/ "/"/ "/"/ "/ "/"/"/ "/ "/"/"/ "/ "/"/ "/"/"/ "/ "/"/ "/ "/"/"/ "/"/ "/ "/ "/"/ "/"/ "/"/ "/ "/"/ "/"/"/"/"/ "/"/ "/"/"/ "/"/ "/ "/ "/"/"/"/"/ "/"/ "/"/ "/"/"/"/"/ "/"/ "/"/"/ "/ "/"/ "/ "/ "/ "/ "/"/"/ "/"/ "/ "/"/"/ "/ "/"/ "/"/"/ "/"/ "/"/ "/ "/"/"/"/ "/"/ "/"/ "/ "/ "/"/ "/ "/"/"/"/ "/ "/"/"/"/ "/"/ "/"/ "/ "/"/"/ "/ "/"/"/ "/"/"/ "/"/ "/"/ "/"/"/ "/"/ "/"/"/"/ "/ "/"/ "/"/ "/"/ "/"/"/ "/ "/"/"/ "/ "/"/ "/"/ "/"/"/ "/ "/"/ "/"/"/ "/ "/"/"/ "/"/ "/ "/"/ "/"/"/"/ "/"/ "/ "/"/"/"/ "/"/"/"/"/ "/ "/"/"/ "/"/ "/"/ "/"/ "/ "/"/"/"/ "/ "/ "/ "/ "/"/ "/"/"/ "/ "/ "/"/ "/"/"/"/"/ "/"/ "/"/ "/"/ "/"/"/"/ "/"/"/ "/"/ "/"/ "/"/"/"/ "/"/ "/ "/ "/"/ "/"/ "/"/ "/"/"/"/ "/ "/"/"/"/ "/"/ "/"/"/ "/"/ "/"/"/ "/ "/"/"/ "/"/"/"/ "/"/ "/"/ "/"/ "/"/ "/"/ "/"/ "/"/ "/"/ "/"/ "/"/ "/"/ "/ "/ "/"/"/ "/"/"/ "/"/ "/"/"/ "/"/"/ "/"/ "/"/ "/ "/"/ "/ "/"/ "/"/ "/"/ "/"/ "/"/"/ "/"/"/"/ "/ "/"/ "/"/"/ "/ "/"/ "/"/ "/"/ "/"/"/ "/"/"/"/ "/ "/"/ "/"/ "/"/"/ "/ "/"/ "/"/ "/ "/"/ "/"/"/"/ "/"/ "/ "/"/"/"/ "/"/ "/ "/"/ "/"/"/ "/"/ "/"/ "/"/ "/"/ "/"/"/ "/ "/"/"/"/ "/"/ "/"/"/ "/ "/"/ "/"/ "/ "/ "/"/ "/"/ "/"/"/ "/"/"/ "/ "/"/ "/"/ "/ "/"/"/"/ "/"/"/ "/ "/"/ "/ "/"/"/ "/"/"/"/ "/"/"/"/ "/ "/"/ "/ "/"/"/"/ "/"/"/ "/"/"/"/ "/ "/"/"/"/ "/"/ "/"/ "/"/ "/"/"/ "/"/"/"/ "/ "/"/"/"/ "/"/ "/"/ "/"/ "/"/"/ "/ "/"/"/"/ "/"/ "/ "/"/ "/"/"/"/ "/ "/"/"/ "/ "/"/ "/"/"/ "/"/ "/"/ "/ "/ "/"/"/"/ "/ "/"/"/ "/"/"/ "/"/"/ "/ "/"/"/"/ "/"/"/ "/ "/"/ "/"/"/ "/"/"/ "/"/ "/"/ "/"/"/ "/"/ "/ "/"/"/ "/ "/ "/ "/"/"/ "/"/ "/"/ "/"/"/"/ "/ "/"/ "/"/ "/"/ "/ "/"/"/ "/"/"/"/"/"/ "/"/ "/"/"/"/ "/"/ "/"/"/ "/"/ "/ "/"/ "/"/ "/"/ "/ "/"/ "/"/"/ "/"/ "/ "/"/ "/"/ "/"/"/ "/ "/"/"/"/"/"/ "/"/ "/"/"/"/ "/"/"/ "/"/"/"/"/ "/"/ "/"/"/ "/ "/"/"/"/ "/ "/"/"/ "/"/"/ "/"/ "/"/ "/"/ "/"/"/ "/"/ "/ "/"/ "/"/ "/"/ "/"/"/ "/ "/ "/"/"/ "/ "/"/"/"/ "/"/ "/"/ "/"/ "/"/"/ "/"/"/"/"/ "/"/"/"/ "/ "/"/ "/"/ "/"/ "/"/"/ "/"/"/ "/"/"/ "/ "/"/"/ "/"/ "/"/ "/"/ "/"/"/ "/"/"/"/ "/"/ "/"/ "/"/ "/ "/ "/"/"/ "/"/ "/"/"/"/ "/ "/ "/"/ "/"/ "/"/ "/ "/"/"/ "/"/ "/ "/"/ "/"/"/ "/"/ "/"/ "/"/"/"/"/ "/"/ "/"/"/ "/"/ "/"/ "/"/"/ "/ "/"/"/"/ "/"/ "/"/ "/"/"/ "/"/"/ "/"/ "/ "/ "/"/ "/"/ "/"/ "/ "/"/ "/ "/ "/"/"/"/ "/"/ "/"/"/ "/"/ "/"/ "/"/ "/"/"/ "/ "/"/ "/"/"/ "/"/ "/"/ "/"/"/ "/ "/ "/"/ "/"/ "/"/ "/ "/ "/"/"/ "/"/"/"/ "/"/ "/ "/"/ "/ "/"/ "/"/ "/ "/ "/"/"/ "/ "/ "/"/"/"/ "/"/"/"/"/"/"/ "/"/"/ "/"/"/ "/ "/"/ "/ "/"/ "/"/"/ "/"/"/ "/"/ "/ "/"/"/ "/"/"/"/ "/"/ "/"/ "/ "/"/ "/"/"/ "/"/ "/"/"/ "/ "/ "/"/ "/"/"/"/ "/ "/"/"/ "/"/ "/"/ "/ "/"/"/ "/ "/"/ "/ "/"/ "/ "/"/"/ "/ "/"/ "/ "/"/ "/"/ "/"/ "/ "/"/"/ "/ "/ "/"/ "/ "/"/"/ "/"/"/"/"/ "/ "/"/"/"/ "/"/ "/"/ "/"/ "/ "/"/"/ "/"/ "/"/ "/ "/"/ "/ "/"/"/"/ "/"/ "/ "/ "/"/ "/"/ "/"/"/ "/ "/"/ "/"/ "/"/"/"/ "/"/ "/"/ "/"/ "/"/ "/ "/"/ "/ "/"/ "/"/"/"/ "/"/ "/"/"/"/ "/"/"/"/ "/"/ "/"/ "/"/"/ "/ "/"/"/"/"/"/ "/"/ "/"/ "/"/ "/"/ "/ "/"/ "/"/ "/"/"/ "/"/ "/"/ "/"/ "/ "/ "/"/ "/"/"/ "/"/"/ "/ "/"/"/"/ "/ "/"/"/ "/"/ "/"/"/ "/"/"/ "/ "/ "/"/ "/"/ "/"/ "/ "/ "/"/ "/"/"/"/"/ "/"/ "/ "/"/"/ "/"/ "/"/"/ "/"/"/"/ "/"/ "/ "/"/ "/"/ "/"/"/"/ "/"/ "/"/"/ "/"/"/"/ "/"/"/ "/ "/"/"/ "/ "/"/ "/"/ "/"/ "/"/"/"/ "/ "/"/ "/"/ "/ "/ "/ "/ "/"/ "/ "/"/"/ "/"/ "/ "/"/ "/"/"/ "/ "/"/"/"/"/"/ "/"/ "/"/ "/"/"/ "/ "/"/"/ "/"/ "/ "/ "/"/"/ "/"/ "/"/ "/"/"/"/ "/ "/ "/"/ "/"/ "/"/ "/"/ "/"/"/ "/ "/"/"/ "/"/ "/ "/ "/"/"/"/ "/"/"/"/"/ "/ "/ "/"/ "/ "/"/ "/ "/"/ "/ "/ "/"/ "/"/"/ "/"/"/ "/"/ "/"/ "/"/ "/"/"/"/ "/"/ "/ "/ "/"/ "/ "/"/ "/ "/"/ "/"/ "/"/ "/ "/ "/"/"/ "/"/ "/"/"/"/ "/"/ "/ "/"/ "/"/"/ "/ "/ "/"/ "/"/ "/ "/"/ "/ "/"/"/ "/"/"/ "/ "/"/"/ "/"/ "/ "/"/"/ "/"/"/ "/"/ "/ "/"/"/"/ "/"/ "/"/ "/ "/"/ "/ "/ "/"/ "/"/"/"/ "/"/"/ "/ "/ "/"/"/ "/ "/"/ "/"/"/"/ "/"/"/ "/"/"/"/ "/"/ "/ "/ "/"/ "/"/ "/ "/"/"/ "/"/ "/ "/"/"/ "/"/"/ "/"/ "/"/ "/ "/"/ "/"/"/ "/ "/"/ "/ "/"/ "/"/"/ "/"/ "/"/"/ "/ "/"/"/"/ "/"/"/ "/ "/"/"/"/ "/"/"/ "/ "/"/ "/"/ "/"/"/"/ "/ "/ "/ "/"/"/ "/"/ "/"/"/"/"/"/"/ "/"/ "/ "/ "/"/"/ "/ "/"/ "/ "/ "/"/ "/"/"/ "/"/ "/"/"/ "/"/ "/"/"/ "/"/"/ "/ "/ "/"/"/"/"/ "/ "/"/ "/"/"/"/"/"/ "/"/ "/"/ "/"/"/"/ "/"/"/"/ "/"/"/"/"/ "/"/ "/"/ "/"/ "/"/ "/"/"/"/ "/"/"/ "/ "/"/ "/"/ "/ "/ "/"/"/ "/"/"/ "/"/"/ "/ "/ "/"/ "/"/ "/ "/"/ "/"/ "/"/"/"/ "/ "/"/ "/"/"/ "/ "/"/"/"/ "/"/ "/"/"/ "/"/"/ "/"/ "/"/"/ "/"/"/"/"/ "/"/ "/"/"/"/ "/"/ "/"/ "/"/ "/"/"/"/"/ "/"/"/ "/"/"/"/ "/ "/"/ "/"/"/"/ "/ "/"/"/ "/ "/ "/ "/"/ "/"/ "/ "/"/ "/"/ "/"/ "/"/"/ "/"/ "/"/ "/"/ "/"/ "/"/ "/"/ "/ "/ "/"/"/ "/"/"/"/ "/ "/"/"/"/ "/"/ "/"/ "/"/ "/"/"/ "/"/ "/"/"/ "/ "/"/"/ "/"/"/ "/"/ "/ "/"/ "/"/ "/"/ "/"/ "/ "/"/"/"/ "/"/"/ "/ "/"/"/"/ "/"/"/ "/ "/ "/"/"/ "/"/ "/"/ "/ "/"/ "/"/ "/"/"/"/ "/ "/"/"/ "/ "/"/"/ "/"/"/ "/"/ "/ "/ "/"/ "/ "/ "/"/ "/"/ "/"/"/ "/"/ "/ "/"/ "/"/ "/"/ "/ "/"/ "/"/ "/"/ "/"/"/ "/"/ "/"/ "/"/ "/ "/"/ "/ "/"/ "/ "/"/ "/"/"/ "/"/"/ "/"/ "/ "/"/ "/ "/"/ "/ "/"/ "/ "/"/ "/ "/"/ "/"/"/ "/"/"/"/ "/"/ "/ "/"/ "/"/ "/"/"/ "/"/ "/ "/"/ "/"/"/"/ "/"/"/"/ "/"/ "/"/ "/"/ "/"/ "/"/"/ "/"/"/ "/"/"/ "/"/ "/ "/"/ "/"/"/"/ "/"/ "/"/ "/"/ "/"/ "/"/ "/"/ "/"/"/ "/ "/"/"/ "/"/"/ "/"/ "/"/"/"/ "/"/ "/"/ "/"/ "/ "/"/ "/"/ "/"/ "/"/ "/"/ "/"/"/ "/ "/"/ "/"/"/"/ "/"/ "/"/"/"/ "/"/"/"/"/ "/"/"/"/ "/"/"/ "/"/"/"/"/ "/"/"/"/ "/"/ "/ "/"/"/ "/ "/"/ "/"/ "/"/"/"/ "/ "/"/"/ "/ "/"/"/"/ "/"/"/"/ "/ "/ "/ "/"/ "/"/ "/ "/"/"/ "/"/"/"/"/ "/"/"/ "/ "/"/"/ "/"/ "/"/"/ "/"/"/ "/"/ "/ "/"/"/"/ "/"/"/"/ "/"/ "/"/"/"/ "/"/"/ "/"/ "/ "/"/ "/"/"/"/ "/"/"/ "/"/"/"/ "/"/ "/"/"/"/"/ "/"/ "/"/ "/"/ "/"/ "/"/ "/"/ "/"/"/"/ "/"/ "/"/"/ "/"/"/ "/"/ "/"/ "/"/ "/"/"/ "/"/ "/"/ "/ "/"/ "/"/"/"/ "/ "/"/"/ "/"/"/"/ "/ "/"/"/"/ "/"/ "/ "/ "/"/"/"/ "/"/ "/"/"/ "/ "/"/ "/"/ "/"/ "/"/"/ "/ "/ "/"/ "/"/ "/"/ "/ "/"/"/"/ "/"/ "/"/"/ "/"/"/ "/"/"/ "/"/"/ "/"/ "/"/ "/ "/"/ "/ "/"/ "/ "/"/ "/ "/"/ "/"/"/ "/"/ "/ "/ "/"/ "/"/ "/ "/"/ "/ "/"/ "/ "/"/ "/"/"/ "/"/"/ "/"/ "/"/ "/"/ "/"/ "/ "/"/ "/ "/"/ "/"/"/"/ "/"/ "/ "/"/ "/"/"/"/ "/"/ "/"/ "/"/"/ "/"/ "/"/ "/"/"/ "/"/"/ "/ "/"/ "/"/ "/"/"/ "/"/"/"/ "/"/ "/"/"/"/ "/"/ "/ "/"/"/"/ "/ "/"/ "/ "/"/ "/ "/"/"/ "/"/"/"/ "/ "/ "/"/"/ "/ "/"/ "/ "/ "/"/ "/"/"/ "/"/ "/"/ "/"/"/ "/"/"/ "/"/"/"/"/"/ "/ "/"/"/ "/ "/"/"/ "/ "/ "/"/ "/"/ "/"/"/"/"/ "/"/"/ "/"/"/ "/ "/"/ "/"/"/ "/ "/"/"/"/ "/ "/ "/"/"/"/ "/"/ "/ "/"/ "/ "/"/"/ "/ "/"/ "/ "/"/ "/ "/"/ "/ "/"/ "/"/ "/"/"/"/ "/"/"/ "/ "/"/ "/"/ "/"/ "/ "/ "/"/ "/ "/"/"/ "/ "/"/ "/"/"/ "/ "/"/"/ "/ "/"/ "/ "/"/"/ "/"/"/ "/"/ "/ "/"/ "/ "/ "/"/"/"/"/ "/"/ "/"/ "/"/ "/"/ "/"/"/ "/"/"/ "/"/ "/"/ "/"/ "/"/ "/ "/"/ "/"/ "/"/ "/"/ "/ "/"/ "/"/"/ "/ "/"/ "/"/ "/"/"/ "/"/"/ "/"/"/ "/"/"/"/"/ "/"/ "/"/ "/"/"/ "/"/"/ "/"/ "/"/ "/"/ "/ "/"/ "/"/ "/"/ "/ "/ "/"/ "/"/ "/ "/"/"/"/ "/"/ "/ "/"/"/ "/"/"/"/"/ "/ "/"/ "/ "/ "/"/"/"/ "/ "/"/"/ "/ "/"/ "/"/"/ "/"/ "/"/ "/"/ "/ "/ "/"/ "/"/ "/"/ "/"/ "/"/ "/"/ "/"/"/ "/"/ "/"/ "/ "/"/"/ "/"/ "/"/ "/"/"/ "/"/ "/"/"/"/"/"/ "/"/ "/"/"/ "/"/"/ "/"/"/ "/ "/"/"/"/ "/"/ "/"/"/ "/"/"/"/ "/ "/"/"/ "/"/ "/"/"/"/ "/ "/"/"/ "/ "/ "/"/"/ "/"/ "/"/"/ "/"/ "/"/ "/"/ "/ "/"/"/ "/"/ "/"/ "/"/ "/"/"/ "/"/ "/"/ "/"/"/ "/"/ "/ "/"/"/ "/"/ "/"/ "/"/ "/ "/ "/"/"/ "/"/"/"/ "/"/"/"/ "/"/"/ "/"/"/"/ "/ "/"/"/ "/"/"/"/ "/"/"/"/ "/"/"/ "/ "/ "/"/ "/ "/"/ "/"/ "/"/"/ "/"/ "/ "/"/ "/"/"/ "/"/ "/"/ "/"/ "/ "/"/ "/"/"/ "/ "/"/ "/"/"/ "/ "/ "/"/"/ "/ "/"/"/ "/"/ "/"/"/ "/"/ "/"/ "/"/ "/ "/"/"/"/ "/"/"/ "/"/"/ "/ "/"/"/ "/"/ "/ "/ "/ "/"/ "/ "/"/"/"/ "/"/"/ "/ "/"/ "/"/"/ "/"/"/ "/"/ "/"/ "/"/ "/"/"/ "/"/ "/"/"/"/"/ "/ "/"/ "/"/ "/"/ "/"/ "/"/ "/"/"/"/ "/"/"/ "/ "/"/ "/ "/"/"/"/"/ "/ "/"/ "/"/ "/"/ "/"/"/"/ "/"/ "/ "/"/"/"/ "/ "/"/ "/ "/"/ "/ "/"/ "/"/ "/"/"/"/ "/"/"/ "/ "/"/ "/ "/"/ "/"/"/ "/"/"/ "/"/"/ "/ "/ "/"/ "/ "/"/ "/ "/"/"/ "/ "/"/ "/ "/"/ "/ "/"/"/"/"/"/ "/"/ "/"/"/ "/"/"/ "/ "/"/"/ "/"/"/"/ "/ "/ "/ "/ "/"/"/ "/"/ "/"/ "/"/ "/"/ "/"/"/ "/"/ "/"/"/ "/ "/ "/"/"/ "/"/ "/"/ "/"/ "/"/"/ "/ "/ "/"/ "/ "/ "/"/"/"/ "/"/ "/"/"/ "/"/ "/"/ "/"/"/"/"/ "/ "/"/"/ "/ "/"/ "/"/"/ "/"/ "/"/"/ "/"/"/ "/ "/"/ "/"/ "/"/ "/"/ "/"/ "/"/ "/ "/"/ "/"/ "/"/ "/ "/ "/"/ "/"/ "/"/"/"/"/ "/"/"/ "/"/"/ "/"/"/"/ "/ "/"/"/ "/"/ "/"/ "/ "/"/ "/"/ "/ "/"/"/"/ "/"/ "/ "/"/ "/"/ "/"/ "/"/"/ "/ "/"/"/"/ "/"/"/ "/"/"/"/ "/"/"/ "/"/ "/"/"/"/"/ "/"/ "/"/"/"/ "/"/ "/"/ "/ "/"/"/"/ "/ "/"/"/ "/ "/"/ "/"/"/"/"/ "/"/"/"/"/"/ "/"/ "/ "/"/ "/"/"/ "/"/ "/"/ "/"/"/"/ "/"/ "/ "/"/"/"/ "/"/ "/"/ "/"/"/ "/"/"/"/ "/ "/"/ "/"/ "/"/"/ "/ "/"/"/ "/ "/"/ "/ "/"/ "/"/ "/"/ "/"/"/ "/ "/ "/"/"/ "/"/ "/"/"/ "/"/ "/ "/"/"/"/ "/"/ "/"/"/"/ "/"/ "/"/ "/"/ "/ "/"/ "/"/ "/ "/"/"/ "/"/ "/"/ "/"/ "/ "/"/ "/ "/"/ "/"/ "/"/ "/"/"/ "/"/"/ "/"/ "/"/"/ "/"/ "/"/ "/ "/"/"/"/"/ "/"/"/"/ "/"/"/"/"/ "/"/ "/"/ "/"/"/"/ "/"/ "/ "/"/"/ "/"/ "/ "/"/ "/"/ "/"/ "/ "/"/"/ "/"/ "/ "/"/ "/"/ "/ "/"/"/ "/"/"/ "/ "/"/ "/"/ "/ "/"/"/"/ "/ "/"/ "/"/ "/ "/"/ "/"/"/ "/"/ "/"/"/"/ "/ "/ "/"/"/"/ "/ "/ "/"/ "/ "/"/ "/"/ "/"/"/"/"/ "/"/"/ "/"/"/"/"/"/ "/ "/"/"/ "/"/"/ "/ "/"/"/ "/"/"/"/"/ "/"/ "/ "/"/"/"/ "/"/ "/"/"/ "/"/ "/"/ "/"/ "/"/ "/"/ "/ "/ "/"/"/"/"/ "/"/ "/"/"/ "/"/ "/ "/ "/"/"/"/"/ "/"/ "/ "/"/ "/"/ "/ "/"/"/ "/"/"/ "/ "/"/ "/"/"/ "/"/ "/ "/ "/"/ "/ "/"/ "/"/ "/"/ "/ "/ "/"/"/"/"/"/ "/"/"/ "/"/"/"/ "/ "/ "/"/ "/"/"/"/ "/ "/"/ "/"/ "/ "/"/"/ "/"/ "/ "/"/
"/ "/"/ "/"/ "/ "/
"/"/ "/
"/"/ "/"/ "/
"/"/ "/"/"/ "/ "/ "/"/"/ "/ "/"/"/"/ "/
"/"/ "/"/"/ "/"/"/"/
"/ "/ "/"/ "/"/"/ "/"/"/
"/"/"/ "/"/ "/ "/ "/"/ "/"/ "/"/"/
"/
"/
40

_statsMuslim
%05Christian
%05Hindu%05
Buddhist%05
EthnoRel%05
Land Inequality
(Gini)Average
Land QualityDistance
from Mecca
Distance from Trade Routes in 600 AD
Distance from Muslim Empires
mean 0.18 0.42 0.01 0.04 0.32 0.16 0.43 5.08 1.54 2.04
sd 0.33 0.37 0.08 0.18 0.33 0.14 0.21 2.38 1.11 1.42
max 1.00 1.00 0.99 1.00 1.00 0.97 0.98 11.48 4.78 6.47
min 0.00 0.00 0.00 0.00 0.00 0.00 0.00 0.51 0.01 0.00
See Appendix B for variables' definitions
Muslim%05
Christian%05
Hindu%05
Buddhist%05
EthnoRel%05
Land Inequality
(Gini)Average
Land QualityLn(Distance from Mecca)
Ln(Distance from Trade Routes in 600 AD)
Ln(Distance from Muslim
Empires)
Muslim%05 1.00
Christian%05 -0.49 1.00
Hindu%05 -0.04 -0.11 1.00
Buddhist%05 -0.13 -0.25 -0.01 1.00
EthnoRel%05 -0.35 -0.45 -0.07 -0.15 1.00
Land Inequality (Gini)
0.15 -0.13 0.01 0.24 -0.19 1.00
Average Land Quality
-0.11 0.02 0.08 -0.09 0.11 -0.47 1.00
Ln(Distance from Mecca)
-0.12 -0.15 0.03 0.12 0.19 -0.09 -0.08 1.00
Ln(Distance from Trade Routes in 600 AD)
0.03 0.12 -0.10 -0.25 0.04 -0.08 -0.25 0.52 1.00
Ln(Distance from Muslim Empires)
-0.16 0.25 -0.30 -0.21 0.09 -0.20 -0.07 0.62 0.61 1.00
See Appendix B for variables' definitions
Table 3b - Correlation Matrix for the Cross Ethnic Group Analysis - All Religions in 2005 AD
Table 3a - Summary Statistics for the Cross Ethnic Group Analysis - All Religions in 2005 AD

Table 4: Cross Ethnic Group Analysis - Other Religions in 2005
(1) (2) (3) (4) (5)
VARIABLES Muslim%05 Christian%05 Hindu%05 Buddhist%05 EthnoReligious%05
Land Inequality (Gini) 0.270*** -0.174 -0.015 0.247*** -0.313** (0.078) (0.106) (0.022) (0.076) (0.120)
Average Land Quality -0.229*** 0.052 0.010 0.004 0.135** (0.083) (0.073) (0.018) (0.028) (0.067)
Variation in Elevation 0.123* 0.005 0.050* -0.188*** 0.012 (0.069) (0.065) (0.026) (0.045) (0.116)
Mean Elevation -0.086*** 0.070** -0.028** 0.118*** -0.049 (0.029) (0.032) (0.014) (0.029) (0.032)
Ln(Distance from Mecca) -0.221 0.289 0.024 -0.096 0.002 (0.229) (0.199) (0.024) (0.061) (0.148)
Ln(Distance from Trade 600 AD) -0.085*** 0.071* 0.008* 0.024** -0.018 (0.029) (0.039) (0.005) (0.011) (0.021)
Ln(Distance from Muslim Empires) -0.083 0.036 -0.041** 0.030 0.021(0.055) (0.045) (0.020) (0.023) -0.026
Ln(Area) 0.005 0.010 0.002 0.005 -0.033*** (0.006) (0.009) (0.002) (0.005) (0.009)
Ln(Distance from Rome) -0.074 -0.125 0.070** -0.028 0.237 (0.253) (0.307) (0.034) (0.034) (0.167)
Ln(Sea Distance) 0.030 -0.179 0.037* -0.047 0.201*** (0.110) (0.135) (0.019) (0.034) (0.076)
Absolute Latitude 0.012** -0.006 0.001 -0.002 -0.004 (0.006) (0.005) (0.001) (0.002) (0.005)
Ln(Population Density in 1990) 0.026 0.024 0.005** -0.004 -0.061*** (0.027) (0.024) (0.002) (0.006) (0.013)Country FE Yes Yes Yes Yes YesObservations 2015 2015 2015 2015 2015R² 0.47 0.56 0.32 0.51 0.36
Standard errors in parentheses are clustered at the country level, *** p<0.01, ** p<0.05, * p<0.1
All Specifications focus within the Old World excluding territories that have been subjected to a Muslim Empire in the past.
See Appendix B for variables' definitions

Table 5a - Summary Statistics for the Cross Ethnic Group Analysis - Robustness
_statsMuslim%
05Muslim Majority
Land Inequality
(Gini)
Land Inequality
(MLD)
Land Inequality
(Theil)
Distance from Trade Routes in 600 AD
Distance from Trade Routes in 1800 AD
mean 0.18 0.16 0.16 0.11 0.08 1.54 0.46
sd 0.33 0.37 0.14 0.26 0.17 1.11 0.49
max 1.00 1.00 0.97 2.60 2.02 4.78 4.78
min 0.00 0.00 0.00 0.00 0.00 0.01 0.00
See Appendix B for variables' definitions
Table 5b - Correlation Matrix for the Cross Ethnic Group Analysis - Robustness
Muslim%05
Muslim Majority
Land Inequality
(Gini)
Land Inequality
(MLD)
Land Inequality
(Theil)
Distance from Trade Routes in 600 AD
Distance from Trade Routes in 1800 AD
Muslim%05 1.00
Muslim Indicator
0.94 1.00
Land Inequality (Gini)
0.15 0.17 1.00
Land Inequality (MLD)
0.08 0.10 0.83 1.00
Land Inequality (Theil)
0.12 0.14 0.88 0.93 1.00
Distance from Trade Routes in 600 AD
0.03 0.00 -0.08 -0.14 -0.09 1.00
Distance from Trade Routes in 1800 AD
-0.33 -0.28 -0.06 -0.08 -0.05 0.59 1.00
See Appendix B for variables' definitions

Table 6: Robustness Checks for the Cross-Ethnic Group Analysis
(1) (2) (3) (4)
VARIABLES
Muslim Majority Muslim%05 Muslim%05 Muslim%05
Land Inequality (Gini) 0.334*** 0.247*** (0.095) (0.076)
Land Inequality (MLD) 0.081**-0.036
Land Inequality (Theil) 0.115*(0.064)
Average Land Quality -0.267*** -0.279*** -0.276*** -0.245*** (0.096) (0.091) (0.091) (0.078)
Variation in Elevation 0.141** 0.115* 0.127* 0.109* (0.070) (0.066) (0.065) (0.060)
Mean Elevation -0.099*** -0.081*** -0.081*** -0.077*** (0.034) (0.030) (0.030) (0.026)
Ln(Distance from Mecca) -0.242 -0.217 -0.212 -0.393 (0.250) (0.228) (0.231) (0.262)
Ln(Distance from Trade Routes in 600 AD) -0.083*** -0.087*** -0.088*** (0.030) (0.028) (0.029)
Ln(Distance from Trade Routes in 1800 AD) -0.070***(0.015)
Ln(Distance from Muslim Empires) -0.086 -0.086 -0.086 -0.081(0.059) (0.056) (0.057) (0.054)
Ln(Area) 0.002 0.010 0.009 0.007 (0.006) (0.007) (0.006) (0.007)
Ln(Distance from Rome) -0.050 -0.061 -0.068 0.074 (0.254) (0.255) (0.259) (0.250)
Ln(Sea Distance) 0.001 0.032 0.034 0.050 (0.122) (0.112) (0.112) (0.112)
Absolute Latitude 0.013** 0.013** 0.013** 0.011* (0.006) (0.006) (0.006) (0.006)
Ln(Population Density in 1990) 0.020 0.028 0.028 0.021 (0.025) (0.026) (0.026) (0.029)Country FE Yes Yes Yes YesObservations 2015 2015 2015 2015R² 0.40 0.47 0.47 0.48Standard errors in parentheses are clustered at the country level, *** p<0.01, ** p<0.05, * p<0.1 All Specifications focus within the Old World excluding territories that have been subjected to a MuslimEmpire in the past. Muslim Majority equals 1 if Muslim Representation > 50%.See Appendix B for variables' definitions
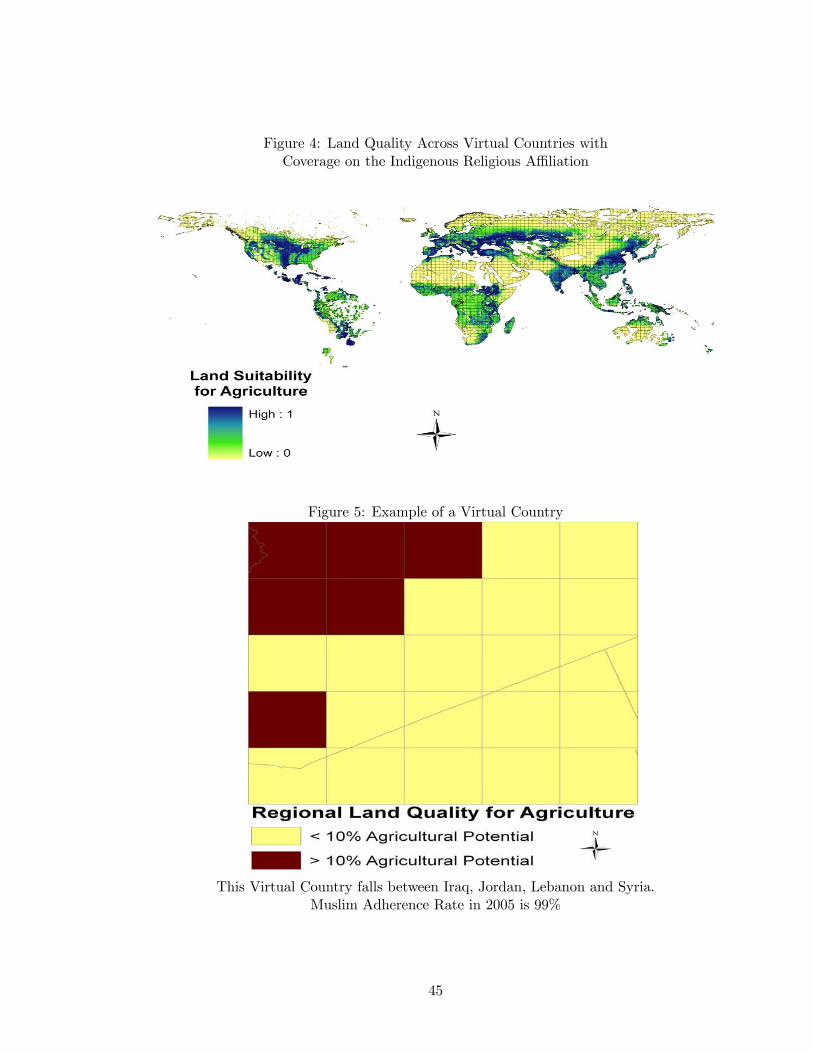
Figure 4: Land Quality Across Virtual Countries with
Coverage on the Indigenous Religious Affiliation
Figure 5: Example of a Virtual Country
This Virtual Country falls between Iraq, Jordan, Lebanon and Syria.
Muslim Adherence Rate in 2005 is 99%
45

_statsMuslim
%05Christian
%05Buddhist
%05EthnoRel
%05Hindu%05
Land Inequality
(Gini)
Average Land
Quality
Number of Ethnic Groups
Variation in
elevation
Distance from Muslim
Empires
mean 0.22 0.48 0.05 0.12 0.02 0.23 0.33 6.74 0.23 2.81
sd 0.38 0.38 0.16 0.19 0.12 0.16 0.30 11.67 0.25 2.63
max 1.00 1.00 1.00 0.93 0.93 0.87 0.98 165 2.23 10.89
min 0.00 0.00 0.00 0.00 0.00 0.00 0.00 1.00 0.00 0.00
See Appendix B for variables' definitions
Muslim%05
Christian%05
Buddhist%05
EthnoRel%05
Hindu%05
Land Inequality
(Gini)
Average Land
Quality
Ln(Number of Ethnic Groups)
Variation in
elevation
Ln(Distance from Muslim
Empires)
Muslim%05 1.00
Christian%05 -0.67 1.00
Buddhist%05 -0.15 -0.32 1.00
EthnoRel%05 -0.28 -0.15 0.01 1.00
Hindu%05 -0.06 -0.20 -0.02 -0.05 1.00
Land Inequality (Gini)
0.14 -0.08 0.15 -0.12 -0.07 1.00
Average Land Quality
-0.21 0.09 -0.02 -0.05 0.15 -0.52 1.00
Ln(Number of Ethnic Groups)
-0.02 -0.03 0.02 0.20 0.07 -0.08 0.18 1.00
Variation in elevation
0.12 -0.16 0.17 -0.03 0.01 0.33 0.06 0.24 1.00
Ln(Distance from Muslim Empires)
-0.46 0.39 -0.20 0.18 -0.17 -0.08 -0.06 -0.06 -0.09 1.00
See Appendix B for variables' definitions
Table 7a - Summary Statistics for the Virtual Countries Analysis
Table 7b - Correlation Matrix for the Virtual Countries Analysis

(1) (2) (3) (4) (5) (6) (7) (8)
VARIABLES Muslim%05 Muslim%05 Muslim%05 Muslim%05 Christian%05 Hindu%05 Buddhist%05 EthnoReligious%05
Land Inequality (Gini) 0.117*** 0.080** 0.068** 0.097** 0.034 0.008 0.119 -0.169*** (0.037) (0.034) (0.032) (0.046) (0.087) (0.012) (0.076) (0.062)
Average Land Quality -0.066 -0.120* -0.202** -0.202** 0.100 0.003 0.083 0.035 (0.080) (0.061) (0.096) (0.088) (0.074) (0.007) (0.056) (0.061)
Variation in Elevation 0.148*** 0.188*** 0.087** 0.085* -0.017 -0.229*** 0.018 (0.055) (0.052) (0.040) (0.045) (0.019) (0.042) (0.041)
Mean Elevation -0.038* -0.044** -0.055** -0.004 0.001 0.168*** -0.014** (0.019) (0.021) (0.023) (0.019) (0.001) (0.022) (0.006)
Ln(Distance from Mecca) -0.165** -0.171* -0.071 0.058 -0.007 -0.080** 0.050 (0.079) (0.092) (0.134) (0.122) (0.007) (0.034) (0.052)
Ln(Distance from Trade Routes in 600 AD) -0.020 -0.022 -0.024 0.029* -0.002 0.026*** 0.001 (0.016) (0.016) (0.023) (0.017) (0.003) (0.007) (0.006)
Ln(Distance from Muslim Empires) -0.104*** 0.043** -0.003 0.001 0.023(0.026) -0.021 (0.002) (0.010) (0.020)
Ln(Number of Ethnicities) -0.042** -0.055** -0.060** 0.008 0.001 -0.008 0.077***-0.018 -0.023 -0.023 -0.025 -0.001 -0.005 -0.016
Within Country Indicator -0.031* -0.041** -0.035** 0.018 0.003 -0.005 0.034***(0.016) (0.018) (0.018) (0.028) (0.003) (0.009) (0.012)
Ln(Area) -0.008 -0.015 -0.026 0.043 -0.004 -0.007 -0.027 (0.016) (0.022) (0.026) (0.036) (0.003) (0.008) (0.025)
Ln(Distance from Rome) -0.005 -0.006 0.138 -0.152* 0.011 0.013 -0.002 (0.067) (0.078) (0.086) (0.087) (0.007) (0.017) (0.030)
Ln(Sea Distance) 0.050 0.033 0.022 0.015 -0.001 -0.070*** 0.011 (0.056) (0.054) (0.035) (0.026) (0.002) (0.023) (0.026)
Absolute Latitude 0.001 0.001 0.004 -0.002 0.001 -0.002 0.002 (0.001) (0.002) (0.003) (0.003) 0.000 (0.001) (0.003)
Ln(Population Density in 1990) 0.005 0.012 0.022 0.013 0.001 -0.007*** -0.040*** (0.008) (0.013) (0.016) (0.015) (0.001) (0.002) (0.005)
Country FE Yes Yes Yes Yes Yes Yes Yes YesObservations 1902 1902 1469 1136 1136 1136 1136 1136R² 0.87 0.89 0.89 0.81 0.81 0.75 0.86 0.55Standard errors in parentheses are clustered at the country level, *** p<0.01, ** p<0.05, * p<0.1 Column (2) focues in the Old World. Specifications (4-8) focus within the Old World excluding territories that have been subjected to a Muslim EmpireSee Appendix B for variables' definitions
Table 8: Cross Virtual Country Analysis
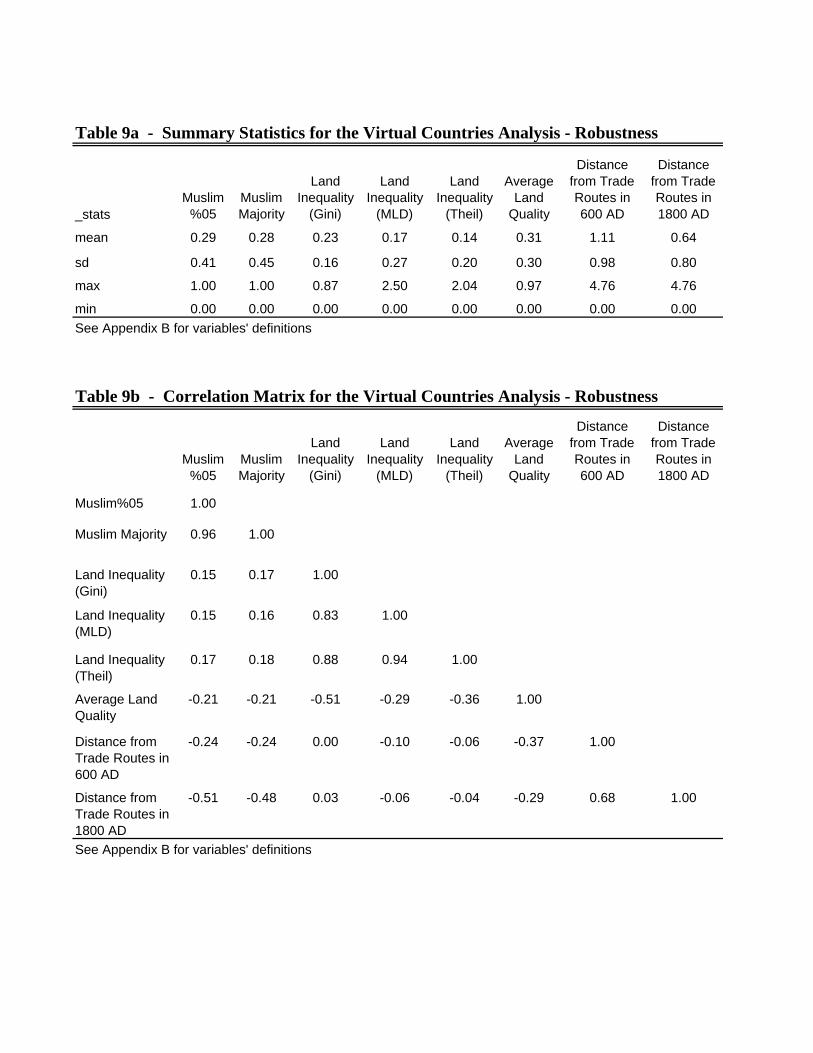
_statsMuslim
%05Muslim Majority
Land Inequality
(Gini)
Land Inequality
(MLD)
Land Inequality
(Theil)
Average Land
Quality
Distance from Trade Routes in 600 AD
Distance from Trade Routes in 1800 AD
mean 0.29 0.28 0.23 0.17 0.14 0.31 1.11 0.64
sd 0.41 0.45 0.16 0.27 0.20 0.30 0.98 0.80
max 1.00 1.00 0.87 2.50 2.04 0.97 4.76 4.76
min 0.00 0.00 0.00 0.00 0.00 0.00 0.00 0.00
See Appendix B for variables' definitions
Muslim%05
Muslim Majority
Land Inequality
(Gini)
Land Inequality
(MLD)
Land Inequality
(Theil)
Average Land
Quality
Distance from Trade Routes in 600 AD
Distance from Trade Routes in 1800 AD
Muslim%05 1.00
Muslim Majority 0.96 1.00
Land Inequality (Gini)
0.15 0.17 1.00
Land Inequality (MLD)
0.15 0.16 0.83 1.00
Land Inequality (Theil)
0.17 0.18 0.88 0.94 1.00
Average Land Quality
-0.21 -0.21 -0.51 -0.29 -0.36 1.00
Distance from Trade Routes in 600 AD
-0.24 -0.24 0.00 -0.10 -0.06 -0.37 1.00
Distance from Trade Routes in 1800 AD
-0.51 -0.48 0.03 -0.06 -0.04 -0.29 0.68 1.00
See Appendix B for variables' definitions
Table 9a - Summary Statistics for the Virtual Countries Analysis - Robustness
Table 9b - Correlation Matrix for the Virtual Countries Analysis - Robustness

(1) (2) (3) (4)
VARIABLES
Muslim Majority Muslim%05 Muslim%05 Muslim%05
Land Inequality (Gini) 0.116** 0.066** (0.055) (0.032)
Land Inequality (MLD) 0.053**-0.022
Land Inequality (Theil) 0.078***(0.028)
Average Land Quality -0.239*** -0.206** -0.199** -0.205** (0.084) (0.096) (0.094) (0.100)
Variation in Elevation 0.236*** 0.179*** 0.188*** 0.180*** (0.055) (0.052) (0.050) (0.050)
Mean Elevation -0.051** -0.045** -0.048** -0.038* (0.022) (0.021) (0.021) (0.020)
Ln(Distance from Mecca) -0.173* -0.169* -0.170* -0.172* (0.099) (0.091) (0.091) (0.091)
Ln(Distance from Trade Routes in 600 AD) -0.039 -0.023 -0.022 (0.024) (0.015) (0.015)
Ln(Distance from Trade Routes in 1800 AD) -0.027***(0.010)
Ln(Number of Ethnicities) -0.067** -0.056** -0.056** -0.052**(0.028) (0.023) (0.023) (0.022)
Within Country Indicator -0.045 -0.041** -0.041** -0.040**(0.028) (0.018) (0.018) (0.018)
Ln(Area) -0.024 -0.015 -0.015 -0.013 (0.028) (0.023) (0.023) (0.021)
Ln(Distance from Rome) 0.017 -0.008 -0.006 0.012 (0.078) (0.078) (0.078) (0.082)
Ln(Sea Distance) 0.017 0.033 0.033 0.030 (0.053) (0.055) (0.054) (0.054)
Absolute Latitude 0.001 0.001 0.001 0.001 (0.003) (0.002) (0.002) (0.002)
Ln(Population Density in 1990) 0.012 0.011 0.011 0.011 (0.016) (0.013) (0.013) (0.013)Country FE Yes Yes Yes YesObservations 1469 1469 1469 1469R² 0.82 0.89 0.89 0.89Standard errors in parentheses are clustered at the country level, *** p<0.01, ** p<0.05, * p<0.1 All Specifications focus within the Old World, i.e. within Africa Europe and Asia.Muslim Majority equals 1 if Muslim Representation > 50%.See Appendix B for variables' definitions
Table 10: Robustness Checks for the Cross-Virtual Country Analysis

Figure 6: Inequality in Regional Suitability for Agriculture Across Countries
Figure 6: % of Muslim Population in 1900 Across Countries
50

Table 11a - Summary Statistics for the Cross Country Analysis - Muslim World in 1900 AD
_stats
Land Inequality
(Gini)
Average Land
Quality AreaDistance
from Mecca
Distance from Trade Routes in 600 AD
Distance from
Rome
Distance from Muslim
EmpiresMean
Elevation
Variation in
ElevationMuslim % in 1900
mean 0.35 0.43 8.98 5.61 2.17 5.23 2.15 0.63 0.42 0.22
sd 0.23 0.25 21.03 3.57 2.85 3.56 2.60 0.57 0.36 0.36
max 0.97 0.95 169.45 15.07 10.65 18.36 10.79 3.08 1.87 1.00
min 0.03 0.00 0.00 0.57 0.21 0.11 0.00 0.01 0.02 0.00See Appendix B for variables' definitions
Table 11b - Correlation Matrix for the Cross Country Analysis - Muslim World in 1900 AD
Land Inequality
(Gini)
Average Land
Quality Ln(Area)Ln(Distance from Mecca)
Ln(Distance from Trade Routes in 600 AD)
Ln(Distance from Rome)
Ln(Distance from Muslim
Empires)Mean
Elevation
Variation in
ElevationMuslim % in 1900
Land Inequality (Gini)
1.00
Average Land Quality
-0.81 1.00
Ln(Area) 0.37 -0.34 1.00
Ln(Distance from Mecca)
-0.23 0.26 -0.01 1.00
Ln(Distance from Trade Routes in 600 AD)
0.00 -0.14 0.16 0.67 1.00
Ln(Distance from Rome)
0.01 -0.14 0.23 0.52 0.60 1.00
Ln(Distance from Muslim Empires)
0.02 -0.06 0.18 0.72 0.73 0.72 1.00
Mean Elevation
0.29 -0.12 0.10 -0.06 -0.14 0.16 0.01 1.00
Variation in Elevation
0.27 -0.05 0.24 0.14 -0.01 0.26 0.11 0.77 1.00
Muslim % in 1900
0.48 -0.43 0.16 -0.56 -0.33 -0.11 -0.28 0.10 0.06 1.00
See Appendix B for variables' definitions
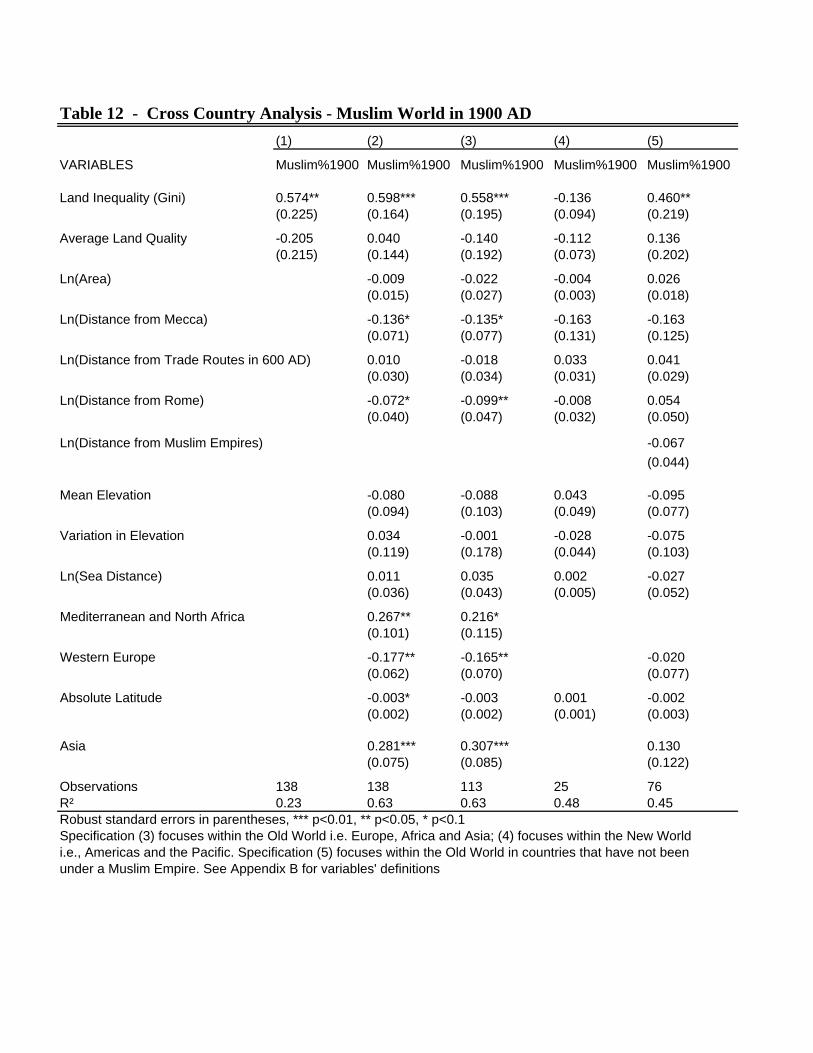
Table 12 - Cross Country Analysis - Muslim World in 1900 AD
(1) (2) (3) (4) (5)
VARIABLES Muslim%1900 Muslim%1900 Muslim%1900 Muslim%1900 Muslim%1900
Land Inequality (Gini) 0.574** 0.598*** 0.558*** -0.136 0.460** (0.225) (0.164) (0.195) (0.094) (0.219)
Average Land Quality -0.205 0.040 -0.140 -0.112 0.136 (0.215) (0.144) (0.192) (0.073) (0.202)
Ln(Area) -0.009 -0.022 -0.004 0.026 (0.015) (0.027) (0.003) (0.018)
Ln(Distance from Mecca) -0.136* -0.135* -0.163 -0.163 (0.071) (0.077) (0.131) (0.125)
Ln(Distance from Trade Routes in 600 AD) 0.010 -0.018 0.033 0.041 (0.030) (0.034) (0.031) (0.029)
Ln(Distance from Rome) -0.072* -0.099** -0.008 0.054 (0.040) (0.047) (0.032) (0.050)
Ln(Distance from Muslim Empires) -0.067
(0.044)
Mean Elevation -0.080 -0.088 0.043 -0.095 (0.094) (0.103) (0.049) (0.077)
Variation in Elevation 0.034 -0.001 -0.028 -0.075 (0.119) (0.178) (0.044) (0.103)
Ln(Sea Distance) 0.011 0.035 0.002 -0.027 (0.036) (0.043) (0.005) (0.052)
Mediterranean and North Africa 0.267** 0.216* (0.101) (0.115)
Western Europe -0.177** -0.165** -0.020 (0.062) (0.070) (0.077)
Absolute Latitude -0.003* -0.003 0.001 -0.002 (0.002) (0.002) (0.001) (0.003)
Asia 0.281*** 0.307*** 0.130 (0.075) (0.085) (0.122)
Observations 138 138 113 25 76R² 0.23 0.63 0.63 0.48 0.45Robust standard errors in parentheses, *** p<0.01, ** p<0.05, * p<0.1 Specification (3) focuses within the Old World i.e. Europe, Africa and Asia; (4) focuses within the New World i.e., Americas and the Pacific. Specification (5) focuses within the Old World in countries that have not been under a Muslim Empire. See Appendix B for variables' definitions
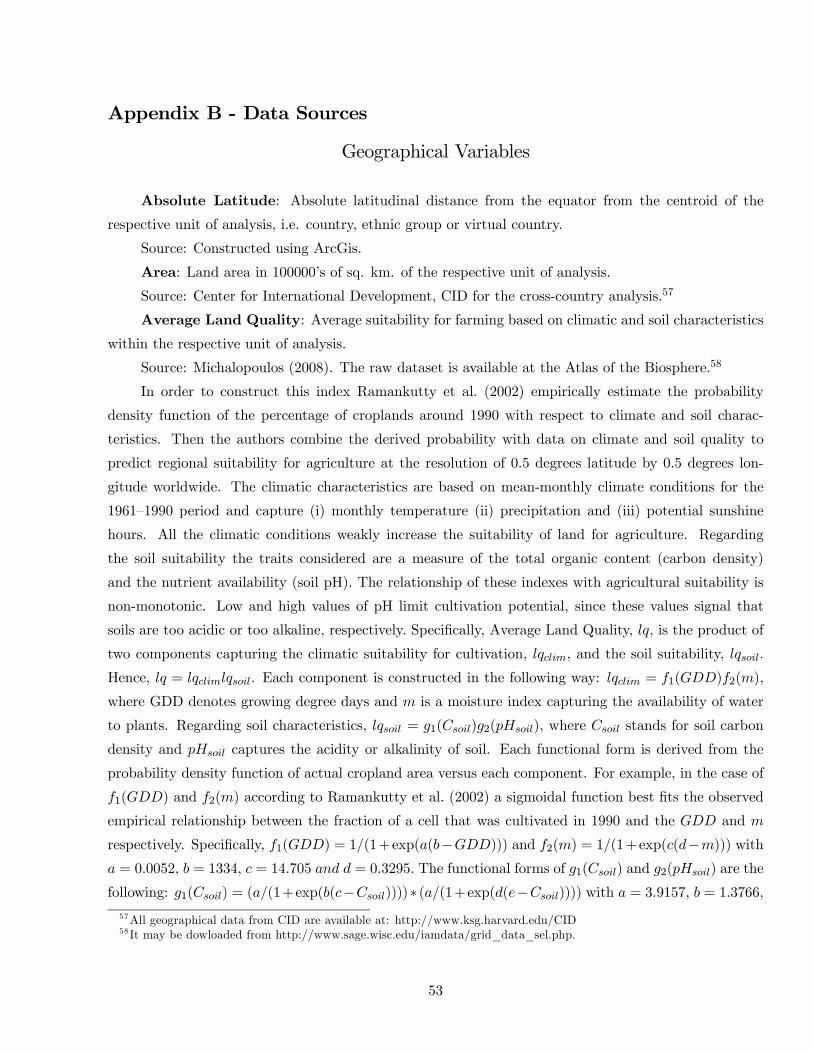
Appendix B - Data Sources
Geographical Variables
Absolute Latitude: Absolute latitudinal distance from the equator from the centroid of the
respective unit of analysis, i.e. country, ethnic group or virtual country.
Source: Constructed using ArcGis.
Area: Land area in 100000’s of sq. km. of the respective unit of analysis.
Source: Center for International Development, CID for the cross-country analysis.57
Average Land Quality: Average suitability for farming based on climatic and soil characteristics
within the respective unit of analysis.
Source: Michalopoulos (2008). The raw dataset is available at the Atlas of the Biosphere.58
In order to construct this index Ramankutty et al. (2002) empirically estimate the probability
density function of the percentage of croplands around 1990 with respect to climate and soil charac-
teristics. Then the authors combine the derived probability with data on climate and soil quality to
predict regional suitability for agriculture at the resolution of 05 degrees latitude by 05 degrees lon-
gitude worldwide. The climatic characteristics are based on mean-monthly climate conditions for the
1961—1990 period and capture (i) monthly temperature (ii) precipitation and (iii) potential sunshine
hours. All the climatic conditions weakly increase the suitability of land for agriculture. Regarding
the soil suitability the traits considered are a measure of the total organic content (carbon density)
and the nutrient availability (soil pH). The relationship of these indexes with agricultural suitability is
non-monotonic. Low and high values of pH limit cultivation potential, since these values signal that
soils are too acidic or too alkaline, respectively. Specifically, Average Land Quality, is the product of
two components capturing the climatic suitability for cultivation, , and the soil suitability, .
Hence, = . Each component is constructed in the following way: = 1()2(),
where GDD denotes growing degree days and is a moisture index capturing the availability of water
to plants. Regarding soil characteristics, = 1()2(), where stands for soil carbon
density and captures the acidity or alkalinity of soil. Each functional form is derived from the
probability density function of actual cropland area versus each component. For example, in the case of
1() and 2() according to Ramankutty et al. (2002) a sigmoidal function best fits the observed
empirical relationship between the fraction of a cell that was cultivated in 1990 and the and
respectively. Specifically, 1() = 1(1+exp((−))) and 2() = 1(1+exp((−))) with = 00052 = 1334 = 14705 = 03295 The functional forms of 1() and 2() are the
following: 1() = ((1+exp((−))))∗ ((1+exp((−)))) with = 39157 = 13766
57All geographical data from CID are available at: http://www.ksg.harvard.edu/CID58 It may be dowloaded from http://www.sage.wisc.edu/iamdata/grid_data_sel.php.
53

= 3468 = −00791 and 2() =
⎧⎪⎪⎨⎪⎪⎩−2085 + 0475 ≤ 65
10 65 8
10− 20 ≥ 8
⎫⎪⎪⎬⎪⎪⎭.Distance from Muslim Empires: Great-circle distance from the borders of the Muslim empires
of the centroid a country, ethnic group or virtual country in thousand kilometers. Muslim empires include
the Umayyads, Abassids, Karakhanids, Ghurids, Ghaznavids, Mughals, Ottomans, Mamluks, Seljuks,
Timurids, Fatimids, Almoravids and the Almohads.
Source: Calculated using the empire maps constructed by Jarle Grøhn based on Black (2005).
Distance from Mecca: Great-circle distance from Mecca of the centroid a country, ethnic group
or virtual country in thousand kilometers.
Source: Calculated using the Haversine Formula.
Distance from Trade Routes in 600 AD: Great-circle distance from the nearest trade route
1800 of the centroid a country, ethnic group or virtual country in thousand kilometers.
Source: Calculated using the trade routes mapped in Brice and Kennedy (2001) in 600 AD.
Distance from Rome: Great-circle distance from Rome of the centroid a country, ethnic group
or virtual country in thousand kilometers.
Source: Calculated using the Haversine Formula.
Distance from Trade Routes in 1800 AD: Great-circle distance from the nearest trade route
in 1800 of the centroid a country, ethnic group or virtual country in thousand kilometers.
Source: Calculated using the trade routes mapped in Brice and Kennedy (2001) between 600 AD
and 1700 AD. This information is supplemented by maps from Brien (1999) which contain information
on trade routes within Europe, SE Asia, West Africa and China during the same time period.
Mean Elevation: Average elevation in kilometers within the unit of analysis, i.e. country or
ethnic group or virtual country.
Source: The Atlas of Biosphere available at http://www.sage.wisc.edu:16080/atlas/.
Asia: Dummy variable equals 1 for countries in Asia.
Source: World Bank social indicators and fixed factors
Western Europe: Dummy variable equals 1 for countries in Western Europe.
Source: World Bank social indicators and fixed factors
Mediterranean and North Africa: Dummy variable equals 1 for countries in the Mediterranean,
Middle East and North Africa.
Source: World Bank social indicators and fixed factors
Population Density in 1990: Population density in 1990 within the respective unit of analysis
in thousand’s of people per sq. km.
Source: Center for International Earth Science Information Network (CIESIN). Available at:
http://www.sage.wisc.edu/iamdata/grid_data_sel.php
54

Land Inequality: Inequality in the regional suitability for agriculture within the unit of analysis.
Three separate measures are used namely the Gini index, the Theil index and the Mean Logarithmic
Deviation.
Source: See Average Land Quality
Sea Distance: Distance from the nearest coastline (1000’s of km.) of the centroid of a country,
an ethnic group or a virtual country.
Source: Center for International Development for the country analysis. For ethnic groups and
virtual countries the distance is constructed using the coastlines of seas, oceans dataset. Publisher:
Global Mapping International, Colorado Springs, Colorado, USA. Series name: Global Ministry Mapping
System. Series issue: Version 3.0
Variation in Elevation: Standard deviation in elevation measured in kilometers within the unit
of analysis, i.e. country or ethnic group or virtual country.
Source: See Mean Elevation.
Historical Variables
Within Country Indicator: Dummy equals 1 if a virtual country falls completely within a real
country; constructed using ArcGis.
Muslim%05: Fraction of Muslim population in 2005 at the respective unit of analysis, i.e. ethnic
group or virtual country in 2005 AD.
Source: World Religion Database, available at: http://www.worldreligiondatabase.org/
Number of Ethnicities: Number of ethnic groups found within a virtual country.
Source: 15th edition of the Ethnologue database of languages obtained from Global Mapping
International’s World Language Mapping System.
Muslim%1900: Fraction of Muslim population in 1900AD.
Source: Religion Adherence Data - McCleary and Barro (2005) available at
http://ksghome.harvard.edu/~rmcclea/data.html
Muslim Majority: Dummy variable equals 1 if Muslim%05 50%
Source: See Muslim%05
55

References
Acemoglu, Daron, Simon Johnson, and James A. Robinson, “The Colonial Origins of Com-
parative Development: An Empirical Investigation,” American Economic Review, 2001, 91 (5),
1369—1401.
, , and , “Reversal Of Fortune: Geography And Institutions In The Making Of The
Modern World Income Distribution,” Quarterly Journal of Economics, 2002, 107 (4), 1231—1294.
Anderson, James E. and Oriana Bandiera, “Traders, Cops and Robbers,” Journal of International
Economics, 2006, 70 (1), 197—215.
Ashraf, Quamrul and Oded Galor, “Dynamics and Stagnation in the Malthusian Epoch: Theory
and Evidence,” 2009. Working Paper, mimeo Brown University.
Aswad, Barbara C., “Social and Ecological Aspects in the Origin of the Islamic State,” Papers of the
Michigan Academy of Science, Arts and Letters, 1963, 48, 419—442.
Bairoch, Paul, Cities and Economic Development: From the Dawn of History to the Present, Chicago:
The University of Chicago Press, 1988.
Barrett, David B., George T. Kurian, and Todd M. Johnson, World Christian Encyclopedia,
2nd Edition, Oxford University Press, 2001.
Barro, Robert and Rachel M. McCleary, “Religion and Economic Growth Across Countries,”
American Sociological Review, 2003, 68, 1.
and , “Religion and Economy,” Journal of Economic Perspectives, 2006, 20 (2), 49—72.
and , “Religion and Political Economy in an International Panel,” Journal for the Scientific
Study of Religion, 2006.
, Jason Hwang, and Rachel M. McCleary, “Conversion in 40 Countries,” 2009. Journal for
the Scientific Study of Religion, forthcoming.
Becker, Sascha O. and Ludger Woessmann, “Was Weber Wrong? A Human Capital Theory of
Protestant Economic History,” The Quarterly Journal of Economics, 2009, 124 (2), 531—596.
Berkey, Jonathan P., The Formation of Islam: Religion and Society in the Near East, 600-1800,
Cambridge: Cambridge University Press, 2003.
Bertocchi, Graziella, “The Law of Primogeniture and the Transition from Landed Aristocracy to
Industrial Democracy,” Journal of Economic Growth, 2006, 11, 41—68.
56
Black, Jeremy, Atlas of World History, London: London, Dorling Kindersley, 2005.
Botticini, Maristella and Zvi Eckstein, “Jewish Occupational Selection: Education, Restrictions,
or Minorities?,” Journal of Economic History, 2005, 65, 922—948.
and , “From Farmers to Merchants, Conversions and Diaspora: Human Capital and Jewish
History,” Journal of the European Economic Association, 2007, 5, 885—926.
Brice, William C. and Hugh Kennedy, An Historical Atlas of Islam, Leiden: Brill Academic
Publishers, 2001.
Brien, Patrick K. O’, Oxford Atlas of World History, Great Britain: Oxford University Press, 1999.
Bulliet, Richard W., Conversion to Islam in the Medieval Period: An Essay in Quantitative History,
Cambridge, MA: Harvard University Press, 1979.
Cervellati, Matteo, Marcel Jansen, and Uwe Sunde, “Religious Norms and Long Term Devel-
opment: Insurance, Human Capital and Technological Change,” 2008. Working Paper, mimeo
University of Bologna.
Chaney, Eric, “Tolerance, Religious Competition and the Rise and Fall of Muslim Science,” 2008.
Working Paper, mimeo Harvard University.
Cohen, Hayyim J., “The Economic Background and the Secular Occupations of Muslim Jurisprudents
and Traditionists in the Classical Period of Islam: (Until the Middle of the Eleventh Century),”
Journal of the Economic and Social History of the Orient, 1970, 13, 16—61.
Conley, Timothy G., “GMM Estimation with Cross Sectional Dependence,” Journal of Econometrics,
1999, 92, 1—45.
Crone, Patricia, Meccan Trade and the Rise of Islam, Princeton, NJ: Princeton University Press, 1987.
Engerman, Stanley L. and Kenneth L. Sokoloff, “Factor Endowments, Institutions, and Differen-
tial Paths of Growth among New World Economies,” in Stephen Haber, ed., How Latin America
Fell Behind, Stanford, CA: Stanford University Press, 1997, pp. 260—304.
and , “Factor Endowments, Inequality, and Paths of Development among New World
Economies,” 2002. Working Paper No. 9259, NBER.
Ethnologue, Languages of the World, SIL International; Fifteenth edition 2005.
Fox, Jonathan and Shmuel Sandler, Religion and the State: A World Survey of Government In-
volvement in Religion, New York: Cambridge University Press, 2008.
57
Galor, Oded and Omer Moav, “From Physical to Human Capital Accumulation: Inequality and the
Process of Development,” Review of Economic Studies, 2004, 71, 1001—1026.
, , and Dietrich Vollrath, “Inequality in Land Ownership, the Emergence of Human Capital
Promoting Institutions, and the Great Divergence,” Review of Economic Studies, 2008, 76 (1), 143—
179.
Greif, Avner, “Cultural Beliefs and the Organization of Society: A History and Theoretical Reflection
on Collectivist and Individualist Societies,” The Journal of Political Economy, 1994, 102 (5), 912—
950.
Hodgson, Marshall G. S. and Edmund Burke, Rethinking World History: Essays on Europe, Islam
and World History, Cambridge, UK: Cambridge University Press, 1993.
Hsu, Becky, James Gibbon, Conrad Hackett, and Amy Reynolds, “Estimating the Religious
Composition of All Nations: An Empirical Assessment of the World Christian Database,” 2008.
Journal for the Scientific Study of Religion, forthcoming.
Iannaccone, Laurence R., “Sacrifice and Stigma: Reducing Free-riding in Cults, Communes, and
other Collectives,” The Journal of Political Economy, 1992, 100 (2), 271—291.
Ibrahim, Mahmood, Merchant Capital and Islam, Austin: University of Texas Press, 1990.
Insoll, Timothy, The Archaeology of Islam in Sub-Saharan Africa, Cambridge and New York: Cam-
bridge University Press, 2003.
Jalili, Ali Reza, “A Descriptive Overview of Islamic Taxation,” Journal of American Acedemy of
Business, 2006, 8 (2), 16—28.
Kuran, Timur, “Provision of Public Goods under Islamic Law: Origins, Impact, and Limitations of
the Waqf System,” Law and Society Review, 2001, 35 (4), 841—897.
, “The Islamic Commercial Crisis: Institutional Roots of Economic Underdevelopment in the Middle
East,” Journal of Economic History, 2003, 63, 414—446.
, Islam and Mammon: The Economic Predicaments of Islamism, Princeton: Princeton University
Press, 2004.
, “Why the Middle East Is Economically Underdeveloped: Historical Mechanisms of Institutional
Stagnation,” Journal of Economic Perspectives, 2004, 18, 71—90.
58

, “Institutional Causes of Underdevelopment in the Middle East: A Historical Perspective,” in János
Kornai, Laszlo Matyas, and Gérard Roland, eds., Institutional Change and Economic Behavior, New
York: Palgrave-Macmillan, 2008, pp. 64—76.
, “Islamic Redistribution Through Zakat: Historical Record and Modern Realities,” in Michael
Bonner, Mine Ener, and Amy Singer, eds., Poverty and Charity in Middle Eastern Contexts, Albany:
State University of New York Press, 2008, pp. 275—293.
La-Porta, Rafael, Florencio Lopez de Silanes, Andrei Shleifer, and Robert Vishny, “Trust
in Large Organizations,” American Economic Review, 1997, 87 (2), 333—338.
Labib, Subhi Y., “Capitalism in Medieval Islam,” The Journal of Economic History, 1969, 29 (1),
79—96.
Lapidus, Ira M., A History of Islamic Societies, Cambridge: Cambridge University Press, 2002.
Lewis, Bernard, The Arabs in History, 6th Edition, Oxford, UK: Oxford University Press, 1993.
, What Went Wrong? Western Impact and Middle Eastern Response, New York: Harper Collins,
2003.
Lewison, Martin, “Conflicts of Interest? The Ethics of Usury,” Journal of Business Ethics, 1999, 22
(4), 327—339.
Martin, Xavier Sala I., Gernot Doppelhofer, and Ronald I. Miller, “Determinants of Long-
Run Growth: a Bayesian Averaging of Classical Estimates (BACE) Approach,” American Economic
Review, 2004, 94 (4), 813—835.
Marx, Karl, Critique of HegelŠs Philosophy of Right, London: Cambridge University Press, Ed. Joseph
OŠMalley, 1833 [1970].
McCleary, Rachel M., “Salvation, Damnation and Economic Incentives,” Journal of Contemporary
Religion, 2007, 22 (1), 49—74.
Michalopoulos, Stelios, “The Origins of Ethnic Diversity,” 2008. Working Paper, mimeo Tufts Uni-
versity.
Platteau, Jean-Philippe, “Religion, Politics, and Development: Lessons from the Lands of Islam,”
Journal of Economic Behavior and Organization, 2008, 68, 329—351.
, “Political Instrumentalization of Islam and Threat of an Obscurantist Deadlock,” 2009. Working
Paper, Department of Economics, University of Namur.
59
Pryor, Frederic L., “The Economic Impact of Islam on Developing Countries,” World Development,
2007, 35 (11), 1815—1835.
Rahman, Fazlur, “Riba and Interest,” Islamic Studies, Karachi, 1964, 3, 1—43.
Ramankutty, Navin, Jonathan A. Foley, John Norman, and Kevin McSweeney, “The Global
Distribution of Cultivable Lands: Current Patterns and Sensitivity to Possible Climate Change,”
Global Ecology and Biogeography, 2002, 11, 377—392.
Ricklefs, M.C., A History of Modern Indonesia since c.1300, 2nd Edition, London: MacMillan, 1991.
Shatzmiller, Maya, “Islamic Institutions and Property Rights: The Case of the Public Waqf,” Journal
of the Economic and Social History of the Orient, 2001, 44 (1), 44—74.
Visser, Wayne A.M. and Alastair Macintosh, “A Short Review of the Historical Critique of
Usuary,” Accounting, Business and Financial History, 1998, 8 (2), 175—189.
Weber, Max, The Protestant Ethic and the Spirit of Capitalism, London: Allen and Unwin, 1905
[1930].
Winder, R.B., “Makka - The Modern City,” in C.E. Bosworth E. Van Donzel P. Bearman, Th. Bianquis
and W.P. Heinrichs, eds., Encyclopaedia of Islam, Leiden: Brill, 2008.
WLMS, World Language Mapping System, Version 3.2 Available on-line at http://www.gmi.org/wlms/
2006.
WRD, World Religion Database, BRILL, Available on-line at http://www.worldreligiondatabase.org/.
60