tracking the patient engagement movement and its impact on clinical research execution ·...
TRANSCRIPT
Tracking the Patient Engagement Movement and its Impact on Clinical Research Execution
Ken Getz, MBA
Director, Sponsored Programs, Associate Professor
CSDD, Tufts University School of Medicine
Founder and Board Chair, CISCRP
MCC Summit
September 4, 2019
Agenda
• Anticipating a Movement
• Rationale
• Primary Execution Areas
– Key takeaways from selected TCSDD studies

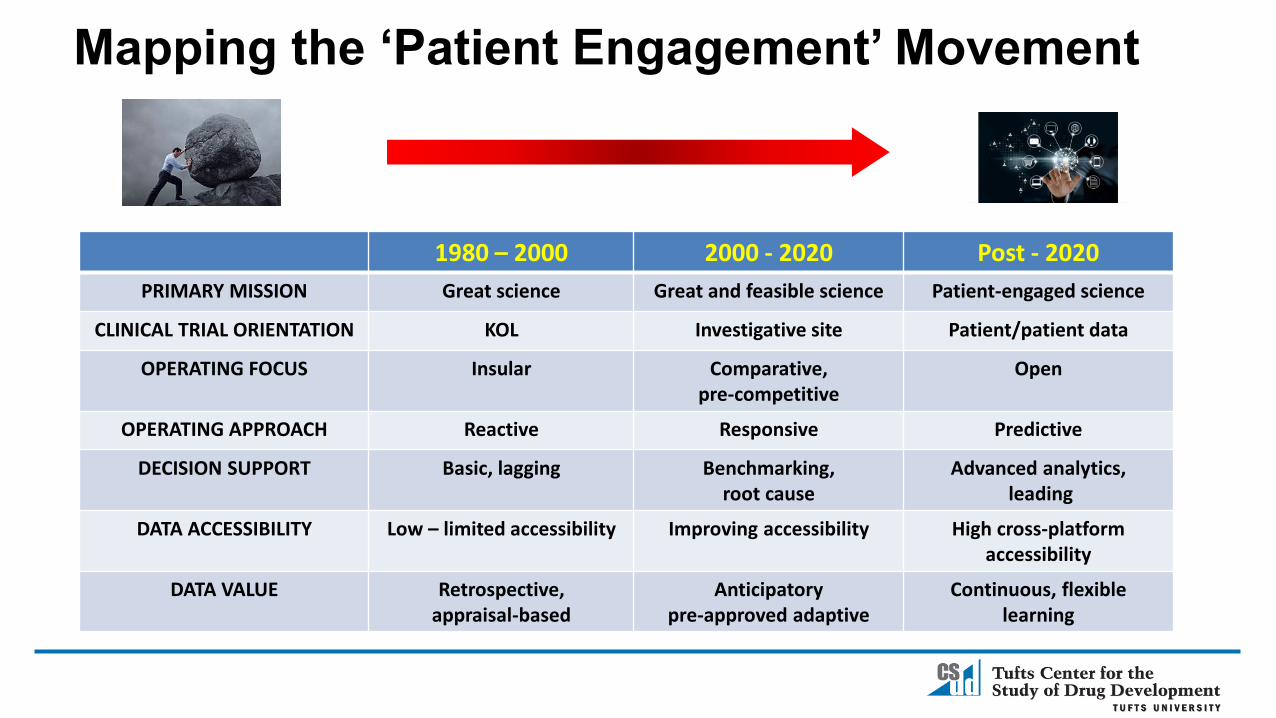
Mapping the ‘Patient Engagement’ Movement
1980 – 2000 2000 - 2020 Post - 2020
PRIMARY MISSION Great science Great and feasible science Patient-engaged science
CLINICAL TRIAL ORIENTATION KOL Investigative site Patient/patient data
OPERATING FOCUS Insular Comparative, pre-competitive
Open
OPERATING APPROACH Reactive Responsive Predictive
DECISION SUPPORT Basic, lagging Benchmarking, root cause
Advanced analytics,leading
DATA ACCESSIBILITY Low – limited accessibility Improving accessibility High cross-platform accessibility
DATA VALUE Retrospective,appraisal-based
Anticipatorypre-approved adaptive
Continuous, flexible learning

A Robust Innovation Engine
4,8855,482
6,4766,531
8,0108,617
9,34910,150
10,75211,166
2000 2002 2004 2006 2008 2010 2012 2014 2016 2018
Number of New NDA and BLA Approvals
Source: Evaluatepharma; FDA
Total Active Drugs in Global R&D Pipeline
25
19
1115
31
18 18 1621 20
15
24
33
2530
33
15
34
42
2
5
6
6
5
2 4
2
3 6
6
6
6
2
11
12
7
12
17
2000 01 02 03 04 05 06 07 08 09 2010 11 12 13 14 15 16 17 18
NDAs BLAs

Growing Focus on Rare Diseases and Personalized Medicine
Percent of Active R&D
Pipeline
Percent of Total Approvals
2000 9% 11%
2005 11% 20%
2010 18% 29%
2015 24% 34%
2018 31% 58%
Source: Tufts CSDD
Rare Disease Pipeline Activity
Percent of Drugs in the Pipeline that Rely on Biomarker and
Genetic Data
Percentage of All Approved NMEs Classified as
Personalized Medicines
2013 23% 9%
2015 42% 21%
2017 51% 27%
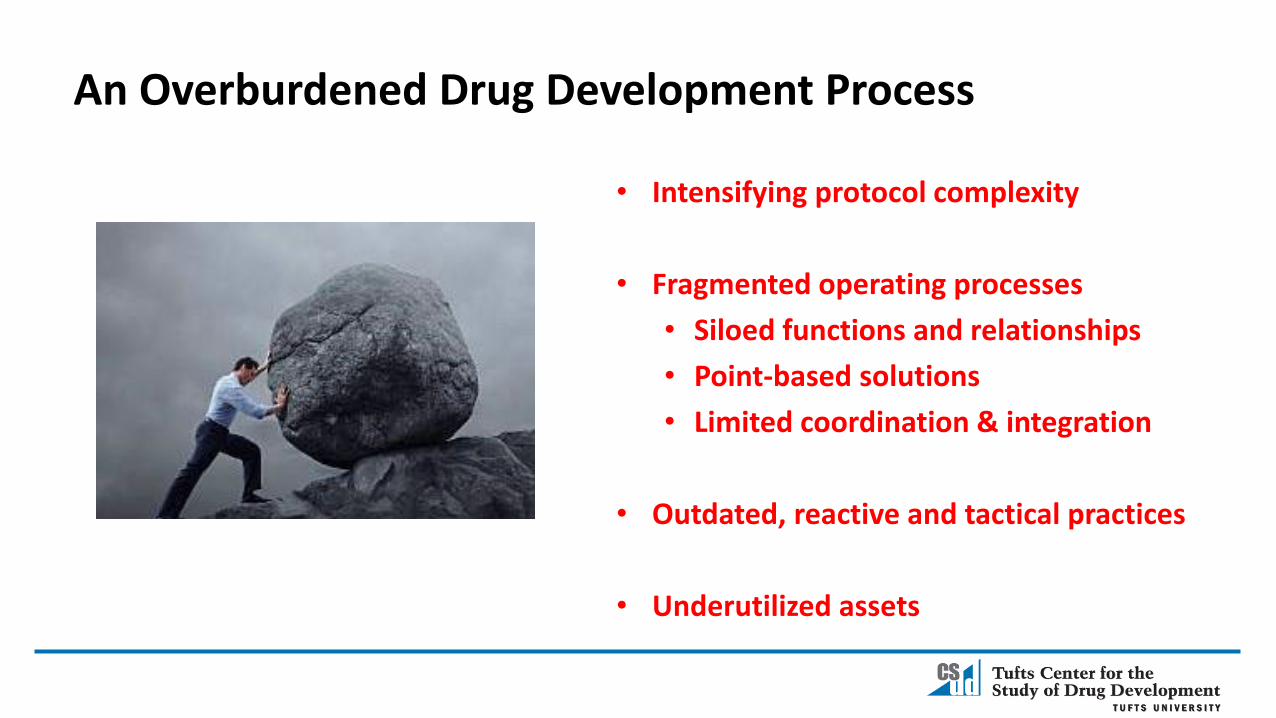
An Overburdened Drug Development Process
• Intensifying protocol complexity
• Fragmented operating processes
• Siloed functions and relationships
• Point-based solutions
• Limited coordination & integration
• Outdated, reactive and tactical practices
• Underutilized assets

Industry Spending on Global R&D
$33.9
$54.6
$94.2
$127.4
$142.2
$159.6
1995 2000 2005 2010 2015 2020P
Source: EvaluatePharma; Tufts CSDD
$ US Billions
Global Spending on Pharma R&D
$1,044
$2,558
2003 2013
$US Millions (2013 dollars)
• 26% Direct Costs• 18% Time-Based• 56% Cost of Failure
Capitalized Cost to Develop a Single Successful Drug

Drug Development Cycle Time(Years from IND Filing to NDA Approval)
6.3 6.8 7.25.9 6.0 6.1 6.3 6.8 6.7 6.8
2.92.6 2
1.4 1.21.75 1.6
1.5 1.4 1.6
87-89 90-92 93-95 96-98 99-01 02-04 05-07 08-10 11-13 14-16
Mean Clinical Time Mean Approval Time
Source: Tufts CSDD
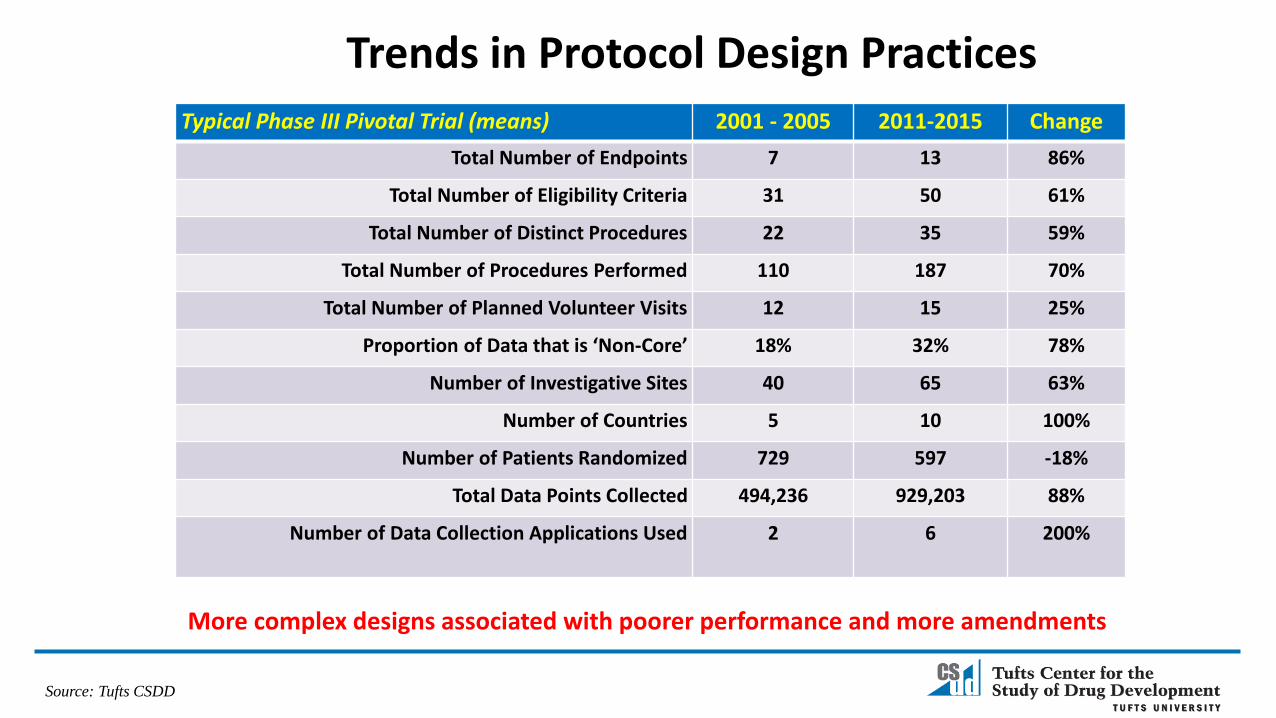
Trends in Protocol Design Practices
Typical Phase III Pivotal Trial (means) 2001 - 2005 2011-2015 Change
Total Number of Endpoints 7 13 86%
Total Number of Eligibility Criteria 31 50 61%
Total Number of Distinct Procedures 22 35 59%
Total Number of Procedures Performed 110 187 70%
Total Number of Planned Volunteer Visits 12 15 25%
Proportion of Data that is ‘Non-Core’ 18% 32% 78%
Number of Investigative Sites 40 65 63%
Number of Countries 5 10 100%
Number of Patients Randomized 729 597 -18%
Total Data Points Collected 494,236 929,203 88%
Number of Data Collection Applications Used 2 6 200%
Source: Tufts CSDD
More complex designs associated with poorer performance and more amendments

Recruitment and Retention Realities
Source: Tufts CSDD, 2015 & 2017
Doubling Planned Timelines
Fail to Enroll a Single
Patient11%
Under Enroll37%
Meet Enrollment
Targets39%
Well Exceed Enrollment
Targets13%
Site Activation and Achievement
Increase in Planned Study Duration to
Reach Target Enrollment
Overall 94%
Cardiovascular 99%
CNS 116%
Endocrine/Metabolic 113%
Oncology 71%
Respiratory 95%

Protocol Amendments
Source: Tufts CSDD, 2016
Percentage of Protocols with
at least one amendment
Mean number of amendments per
protocol
Increase in First Visit
Duration Days(FPFV to LPFV)
Increase in Study Treatment
Duration Days(FPFV to LPLV)
Top Reason for Amending
Direct Cost to
Implement
Phase I 52% 1.8 243 140 New and Modified Safety
Assessment(15.4% of Total)
$98k
Phase II 74% 2.2 197 109 Change in Eligibility Criteria
(17.2%)
$141k
Phase III 69% 2.3 221 239 Change in Eligibility Criteria
(15.2%)
$535k
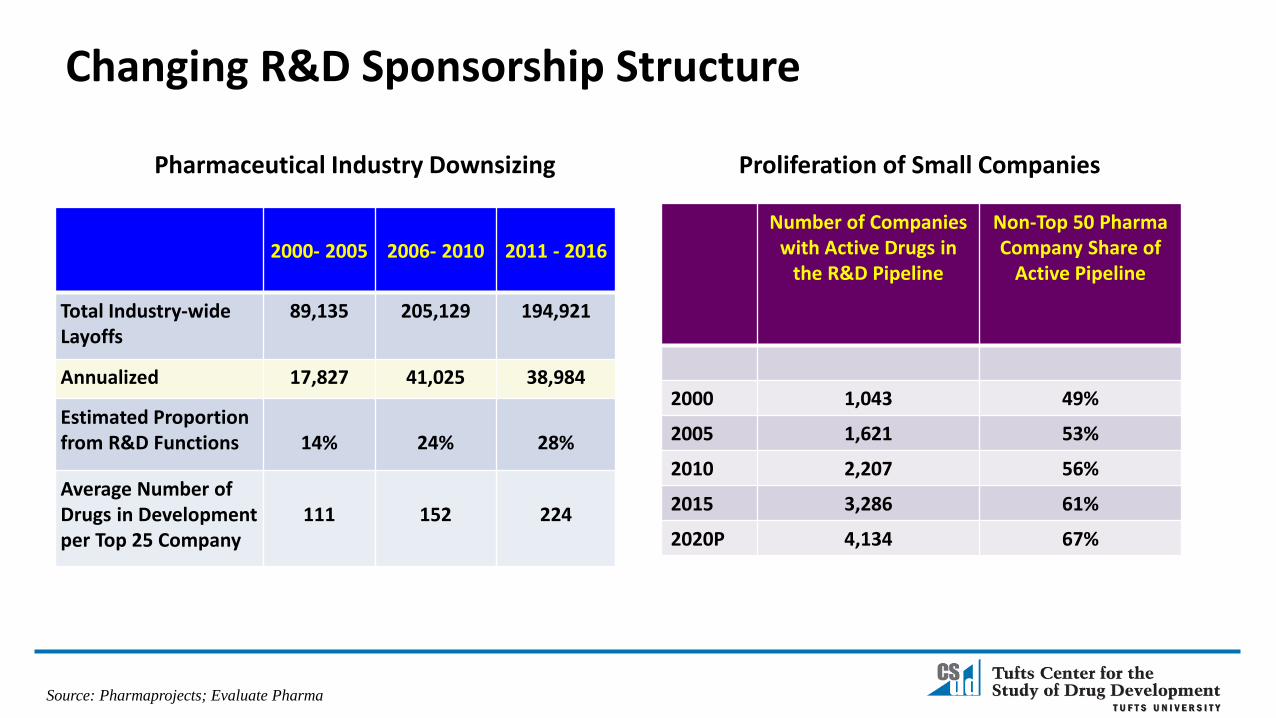
Changing R&D Sponsorship Structure
Source: Pharmaprojects; Evaluate Pharma
Number of Companies with Active Drugs in
the R&D Pipeline
Non-Top 50 Pharma Company Share of
Active Pipeline
2000 1,043 49%
2005 1,621 53%
2010 2,207 56%
2015 3,286 61%
2020P 4,134 67%
2000- 2005 2006- 2010 2011 - 2016
Total Industry-wide Layoffs
89,135 205,129 194,921
Annualized 17,827 41,025 38,984
Estimated Proportion from R&D Functions 14% 24% 28%
Average Number of Drugs in Development per Top 25 Company
111 152 224
Proliferation of Small CompaniesPharmaceutical Industry Downsizing

Distribution of Global R&D Spending(Estimated 3,800 Active Contract Service Providers)
$38.3$60.4 $71.6 $68.6 $65.7
$10.4
$24.3
$43.1 $59.7$78.6
$5.9
$9.5
$12.7$13.7
$15.3
2000 2005 2010 2015 2020P
Internal Staff and Infrastructure CRO Services Investigative Site Services
Source: EvaluatePharma; CenterWatch; William Blair & Wells Fargo Securities
$ US Billions

2008 2009 2010 2011 2012 2013 2014 2015
Multi-year filers First time filers
The Global Community of FDA-Regulated Investigators
Source: Tufts CSDD
33,920
24,805
29,670
27,60428,521 28,872
30,069
32,816
Average Annual Volume
Number of Unique
Investigators
Percent of Total
Proportion Based
OutsideNorth
America
TurnoverRate*
1 Clinical Trial 21,708 64% 53% 49%
2-3 CTs 8,480 25% 39% 20%
4-6 CTs 2,374 7% 20% 5%
7+ CTs 1,358 4% 7% 1%
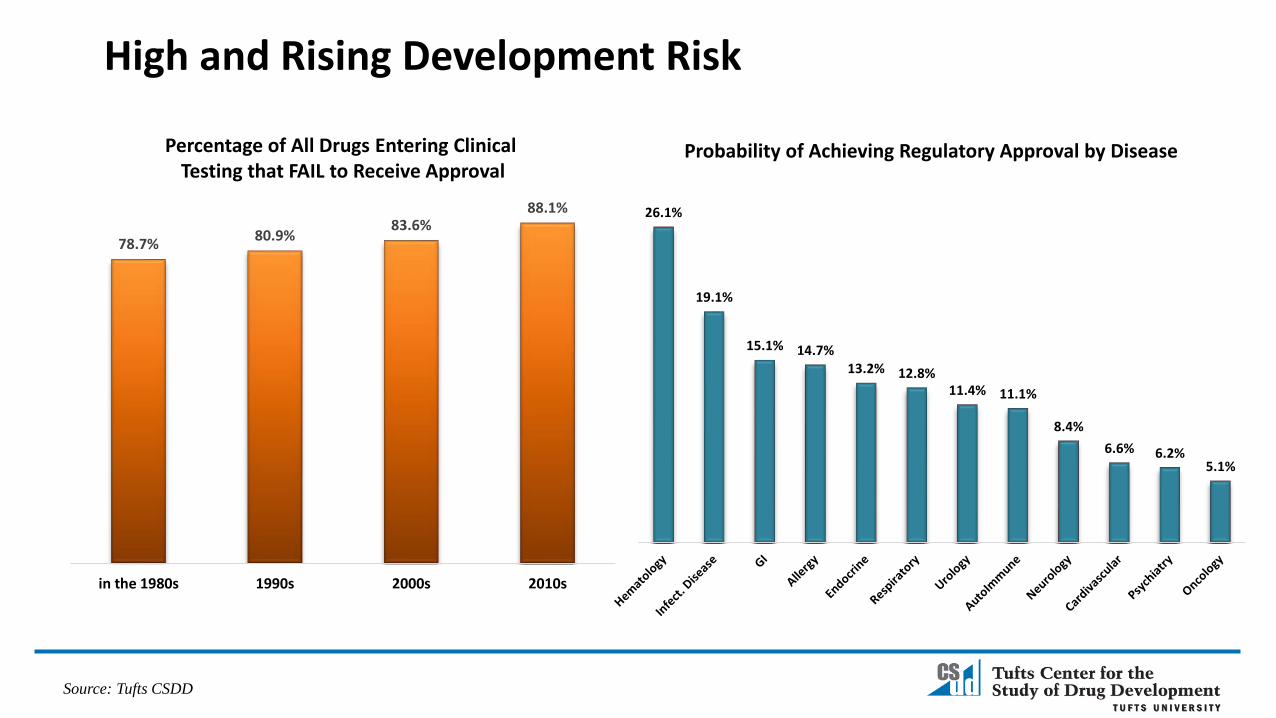
High and Rising Development Risk
Source: Tufts CSDD
Percentage of All Drugs Entering Clinical Testing that FAIL to Receive Approval
78.7%80.9%
83.6%88.1%
in the 1980s 1990s 2000s 2010s
26.1%
19.1%
15.1% 14.7%13.2% 12.8%
11.4% 11.1%
8.4%
6.6% 6.2%5.1%
Probability of Achieving Regulatory Approval by Disease
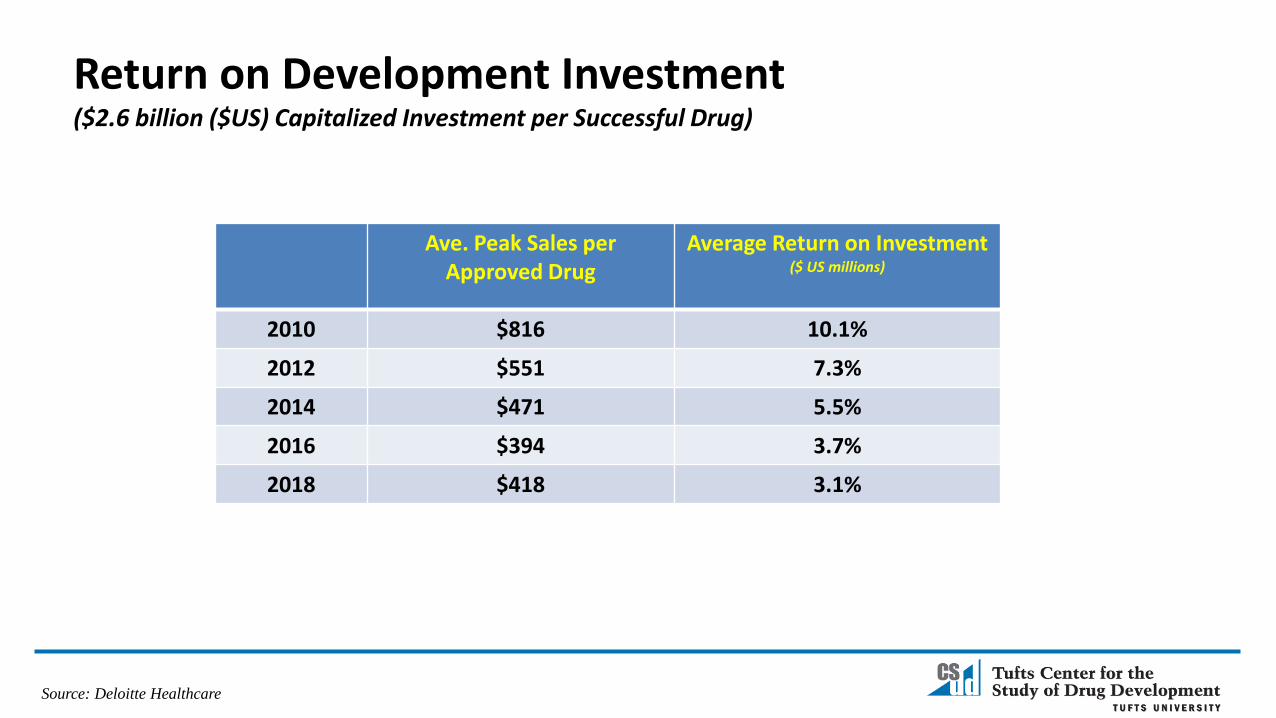
Return on Development Investment($2.6 billion ($US) Capitalized Investment per Successful Drug)
Ave. Peak Sales per Approved Drug
Average Return on Investment($ US millions)
2010 $816 10.1%
2012 $551 7.3%
2014 $471 5.5%
2016 $394 3.7%
2018 $418 3.1%
Source: Deloitte Healthcare

Source: Tufts CSDD;
A Closer Look at Rare Disease Drug Development
Average Direct Cost (Phase III)
IND Filing to FDA
Submission
FDA Submission to Approval
Rare Diseases
$103 MM (US)
131 months 10 months
All Indication
s
$193 MM (US)
78 months 14 months
81%
56%
14%
57%
36%
21%
Screen FailureRates
RandomizationFailure Rates
Drop Out Rates
Rare Diseases Non-Rare Diseases
Mapping the ‘Patient Engagement’ Movement
1980 – 2000 2000 - 2020 Post - 2020
PRIMARY MISSION Great science Great and feasible science Patient-engaged science
CLINICAL TRIAL ORIENTATION KOL Investigative site Patient/patient data
OPERATING FOCUS Insular Comparative, pre-competitive
Open
OPERATING APPROACH Reactive Responsive Predictive
DECISION SUPPORT Basic, lagging Benchmarking, root cause
Advanced analytics,leading
DATA ACCESSIBILITY Low – limited accessibility Improving accessibility High cross-platform accessibility
DATA VALUE Retrospective,appraisal-based
Anticipatorypre-approved adaptive
Continuous, flexible learning

Leveraging Data and Analytics
• Flexible, open, integrated models oriented around patients and patient data
• Can accommodate process customization
• Efficiency and cost reduction through more sophisticated use of data and analytics to optimize decision support and leverage global talent
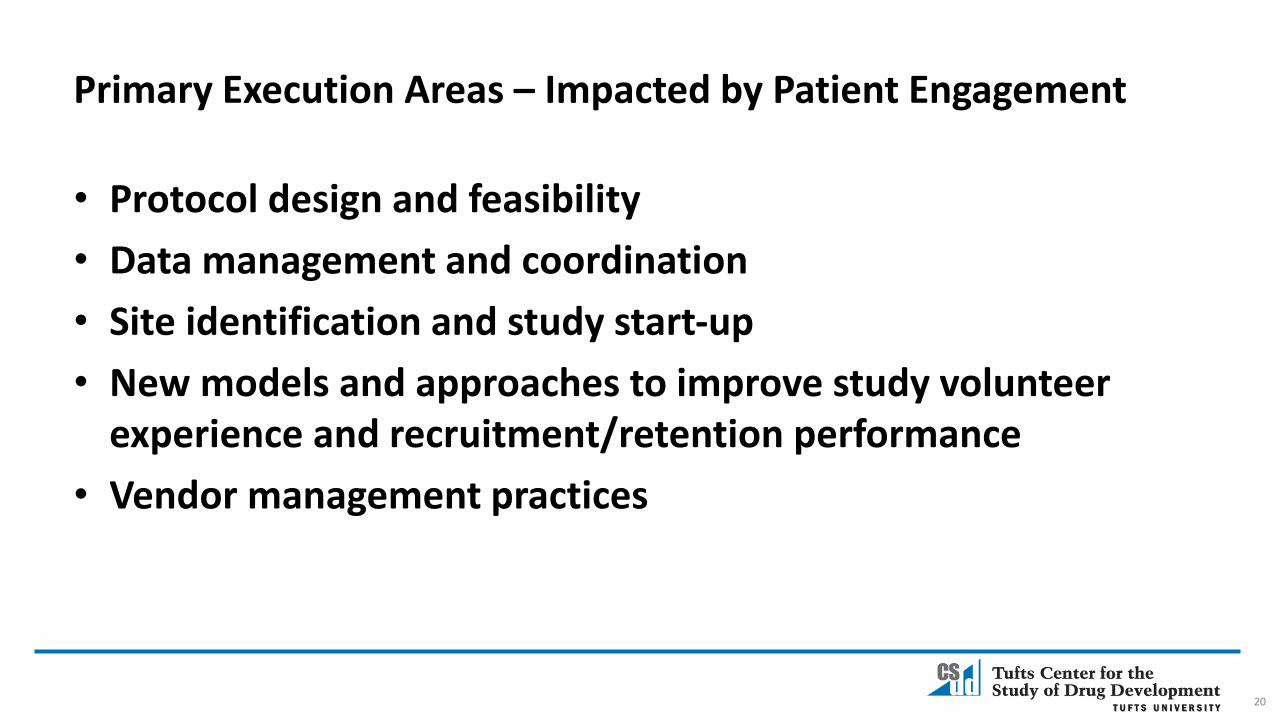
Primary Execution Areas – Impacted by Patient Engagement
• Protocol design and feasibility
• Data management and coordination
• Site identification and study start-up
• New models and approaches to improve study volunteer experience and recruitment/retention performance
• Vendor management practices
20

Top Sponsor Engagement Objectives and Initiatives(Implemented/Piloted/Planned)
Source: Tufts CSDD, 2017 (N=38 sponsor and CRO companies)
77%
70%
47%
40%37%
34%
Patient AdvisoryBoards
ProfessionalAdvisory Panels
CT ResultsSummaries
Home NursingNetworks
WearableDevices
ConciergeServices
Percent of Companies Patient Centric Programs
Phase II – III enrollment timelines 40% Faster
Likelihood of reaching market launch 21% Higher
Percentage accepted by formularies (EU, US, Japan)
10 Point increase
Source: Levitan et al. TIRS 2018; 52(2): 220-229.
“With patient engagement, ENPV increases can exceed 500-fold the investment equivalent to accelerating a phase III product launch by 20-24 months.”
Source: The Economist Intelligence Unit, 2018

Current and Projected Sources of Clinical Research Data
Current Projected in 3 Years
Electronic and Paper Case Report Forms 100% 100%
Local and Central Labs 60% 65%
Smart Phones 45% 92%
Electronic Clinical Outcomes Assessments 21% 93%
Electronic Health and Medical Records 20% 67%
eSource 38% 84%
Mobile Health and Wearable Devices 29% 76%
Social Media 6% 27%
Source: Tufts Center for the Study of Drug Development, 2018; N=257 pharmaceutical, biotech and contract research companies

Use of Real World Data
Large Companies
Small/Mid-Sized
Companies
Have a centralized function 69% 58%
Ave. Number of FTEs 89 13
Ave. Number of contract FTEs 10 13
Expected FTE increase by 2020 35% 20%
29%
29%
38%
46%
50%
63%
75%
Better signal detection for riskmanagement
Assist site identification
Support portfolio managementdecisions
Faster completion of post-marketing requirements
Assist patient identification
Richer effectiveness data
Product positioning
Source: Tufts CSDD, 2017; N=57 pharmaceutical and biotechnology companies
Reported Primary Uses
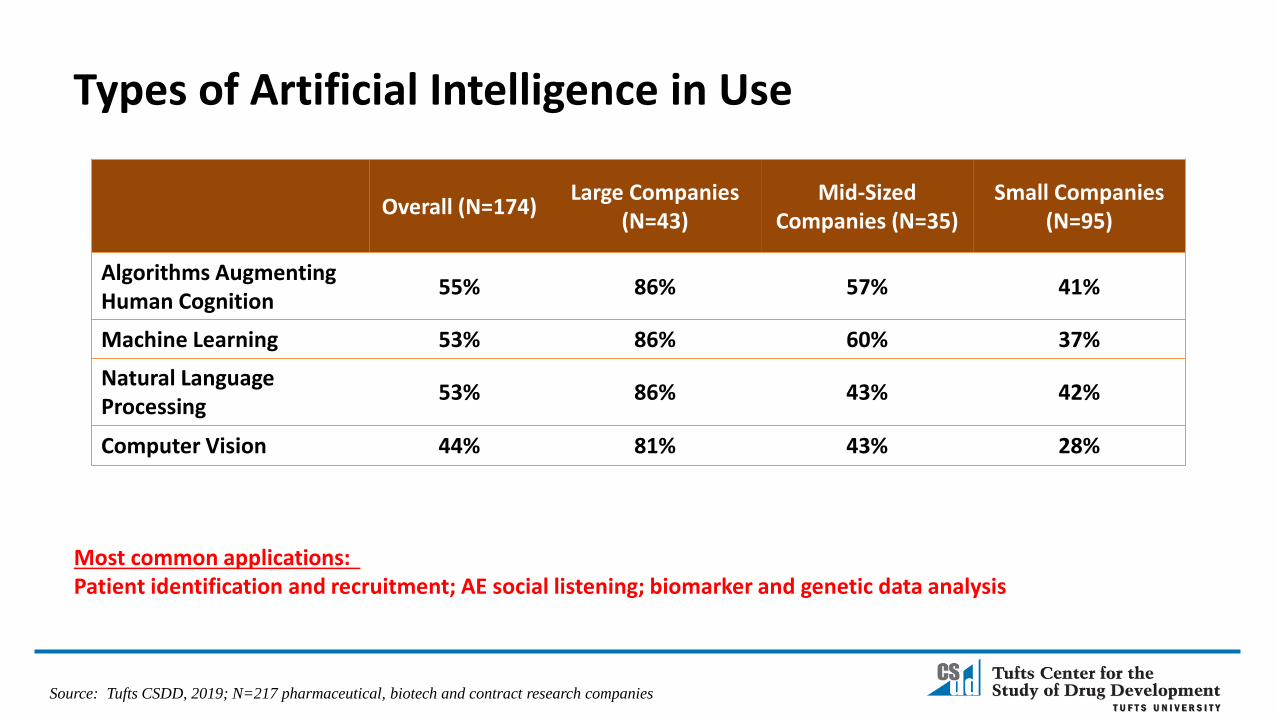
Types of Artificial Intelligence in Use
Overall (N=174)Large Companies
(N=43)Mid-Sized
Companies (N=35)Small Companies
(N=95)
Algorithms Augmenting Human Cognition
55% 86% 57% 41%
Machine Learning 53% 86% 60% 37%
Natural Language Processing
53% 86% 43% 42%
Computer Vision 44% 81% 43% 28%
Source: Tufts CSDD, 2019; N=217 pharmaceutical, biotech and contract research companies
Most common applications: Patient identification and recruitment; AE social listening; biomarker and genetic data analysis

Start-up and Data Management Cycle Times
Typical Phase III Pivotal Trial (means) 2001-2005 2011-2015
Study Start-Up
Total Cycle Time from Site Identification to FPI 25.6 weeks(CoV .63)
29.1 weeks(CoV .76)
Data Management
Time to Build Study Database 65.7 days(CoV .41)
68.3 days(CoV .48)
Time from Patient Visit to Data Entry 6.9 days(CoV .66)
8.1 days(CoV .89)
LPLV to Data Base Lock 33.4 days(CoV .75)
36.1 days(CoV .93)
Source: Tufts CSDD, 2018

111
139
266
245
263254
278269 274
2001 2003 2005 2007 2009 2011 2013 2015 2017
Complaints for Site Non-Compliance and Fraud
Source: FDA CDER Office of Compliance

Health Providers as Engagement Enablers
• 68% of patients rate their HCP as the top preferred source for information about clinical research
• 88% of patients feel it would be ‘very’ and ‘somewhat valuable’ for clinical research options to be presented during regular office visits
• 71% of patients say that they would speak with their physician or nurse prior to deciding to participate
• 83% of patients consider their physician’s recommendation a top factor influencing their decision to participate
• 91% of patients agree that having clinical study procedures conducted during regular doctor visits would be more convenient
• 93% of patients report feeling ‘Very’ and ‘Somewhat Comfortable’ having their medical health records routinely used to identify appropriate studies
Source: CISCRP 2017 Perceptions & Insights Study; N=12,427; ONC/AHA 2017
1.6% 3.6%
16.9%
34.4%43.4%
11.8%15.5%
39.1%
48.7%
52.1%
2008 2010 2012 2014 2016
Comprehensive Functionality
Basic Functionality
EHR Adoption
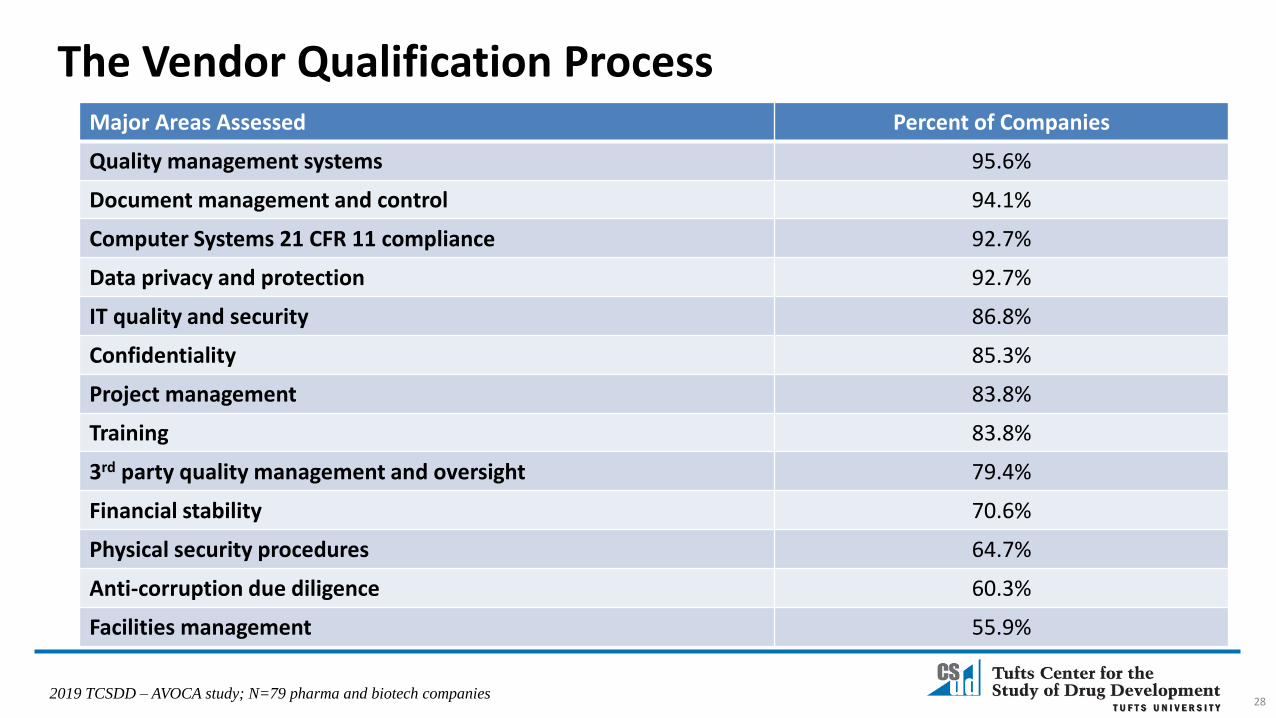
The Vendor Qualification Process
28
Major Areas Assessed Percent of Companies
Quality management systems 95.6%
Document management and control 94.1%
Computer Systems 21 CFR 11 compliance 92.7%
Data privacy and protection 92.7%
IT quality and security 86.8%
Confidentiality 85.3%
Project management 83.8%
Training 83.8%
3rd party quality management and oversight 79.4%
Financial stability 70.6%
Physical security procedures 64.7%
Anti-corruption due diligence 60.3%
Facilities management 55.9%
2019 TCSDD – AVOCA study; N=79 pharma and biotech companies
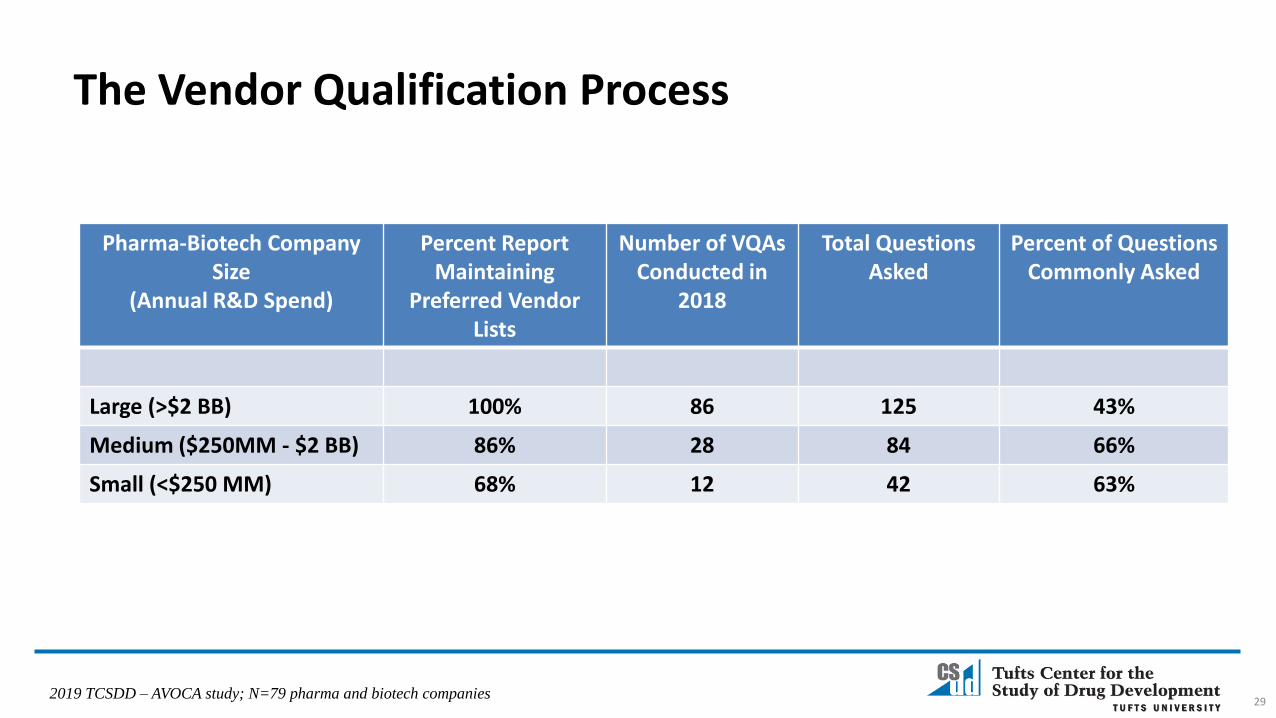
Pharma-Biotech Company Size
(Annual R&D Spend)
Percent Report Maintaining
Preferred Vendor Lists
Number of VQAs Conducted in
2018
Total QuestionsAsked
Percent of Questions Commonly Asked
Large (>$2 BB) 100% 86 125 43%
Medium ($250MM - $2 BB) 86% 28 84 66%
Small (<$250 MM) 68% 12 42 63%
29
The Vendor Qualification Process
2019 TCSDD – AVOCA study; N=79 pharma and biotech companies
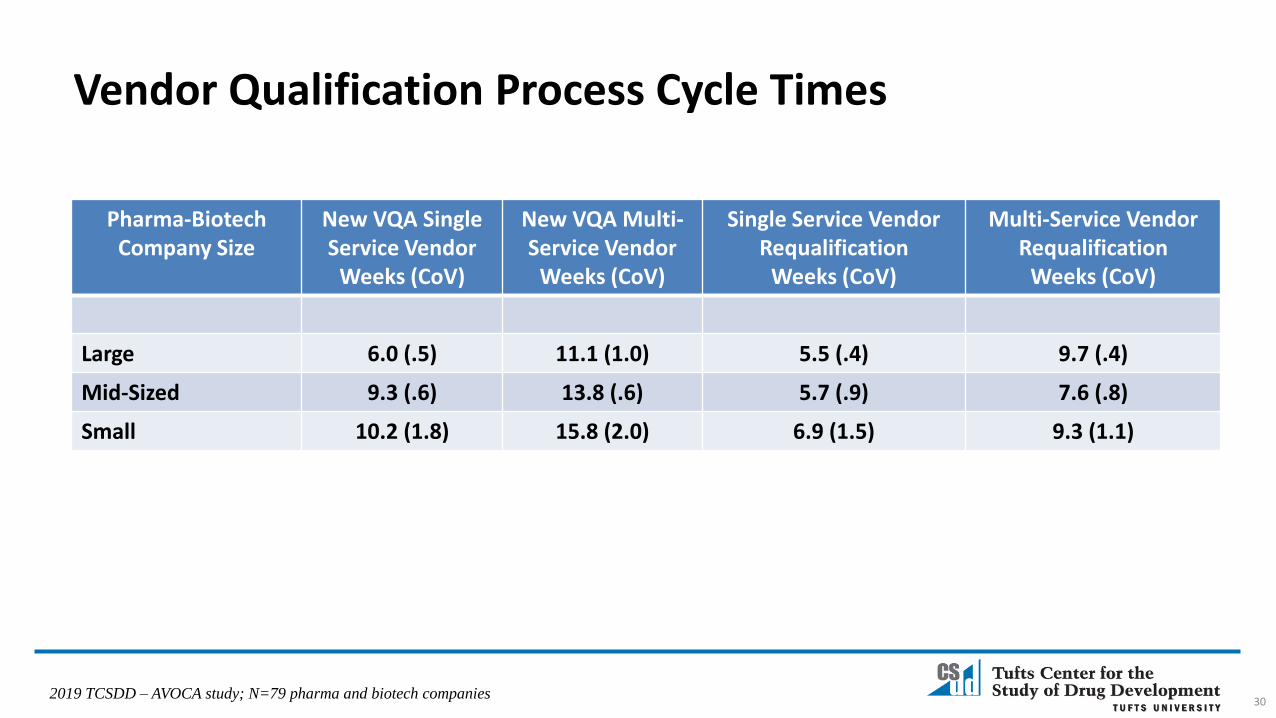
Pharma-Biotech Company Size
New VQA Single Service Vendor
Weeks (CoV)
New VQA Multi-Service Vendor
Weeks (CoV)
Single Service Vendor Requalification
Weeks (CoV)
Multi-Service VendorRequalification
Weeks (CoV)
Large 6.0 (.5) 11.1 (1.0) 5.5 (.4) 9.7 (.4)
Mid-Sized 9.3 (.6) 13.8 (.6) 5.7 (.9) 7.6 (.8)
Small 10.2 (1.8) 15.8 (2.0) 6.9 (1.5) 9.3 (1.1)
30
Vendor Qualification Process Cycle Times
2019 TCSDD – AVOCA study; N=79 pharma and biotech companies
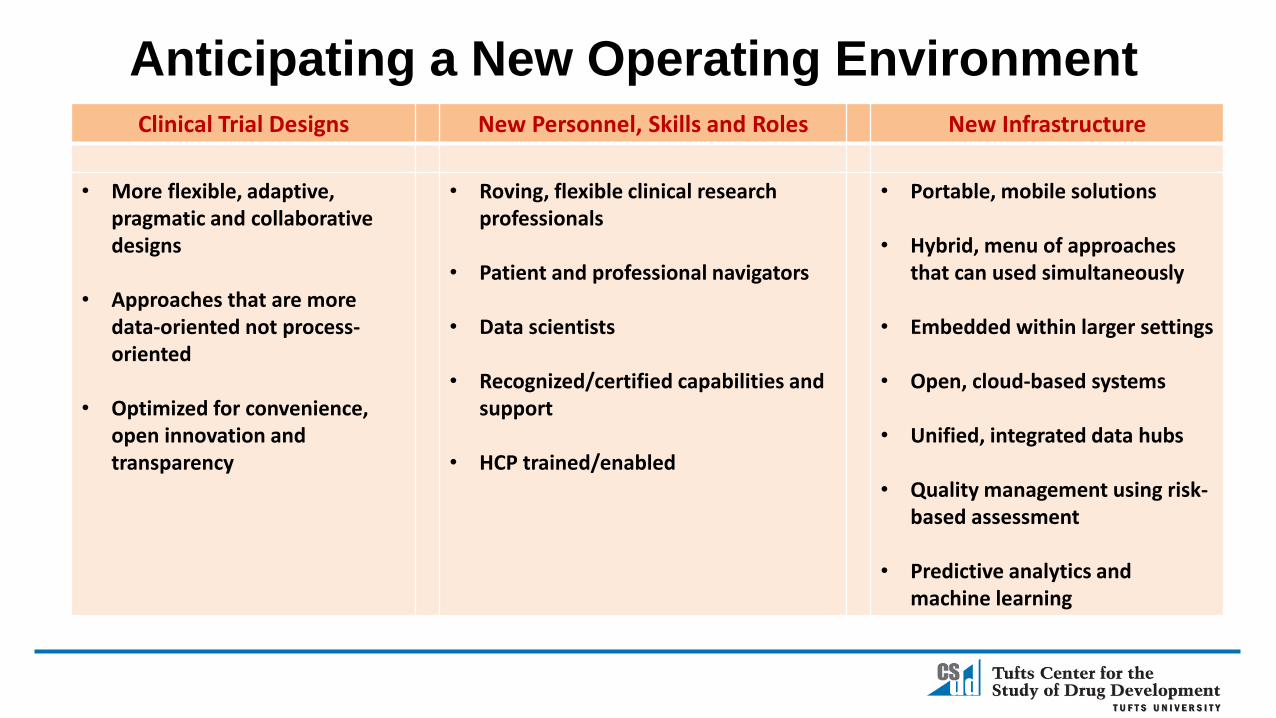
Clinical Trial Designs New Personnel, Skills and Roles New Infrastructure
• More flexible, adaptive, pragmatic and collaborative designs
• Approaches that are more data-oriented not process-oriented
• Optimized for convenience, open innovation and transparency
• Roving, flexible clinical research professionals
• Patient and professional navigators
• Data scientists
• Recognized/certified capabilities and support
• HCP trained/enabled
• Portable, mobile solutions
• Hybrid, menu of approaches that can used simultaneously
• Embedded within larger settings
• Open, cloud-based systems
• Unified, integrated data hubs
• Quality management using risk-based assessment
• Predictive analytics and machine learning
Anticipating a New Operating Environment
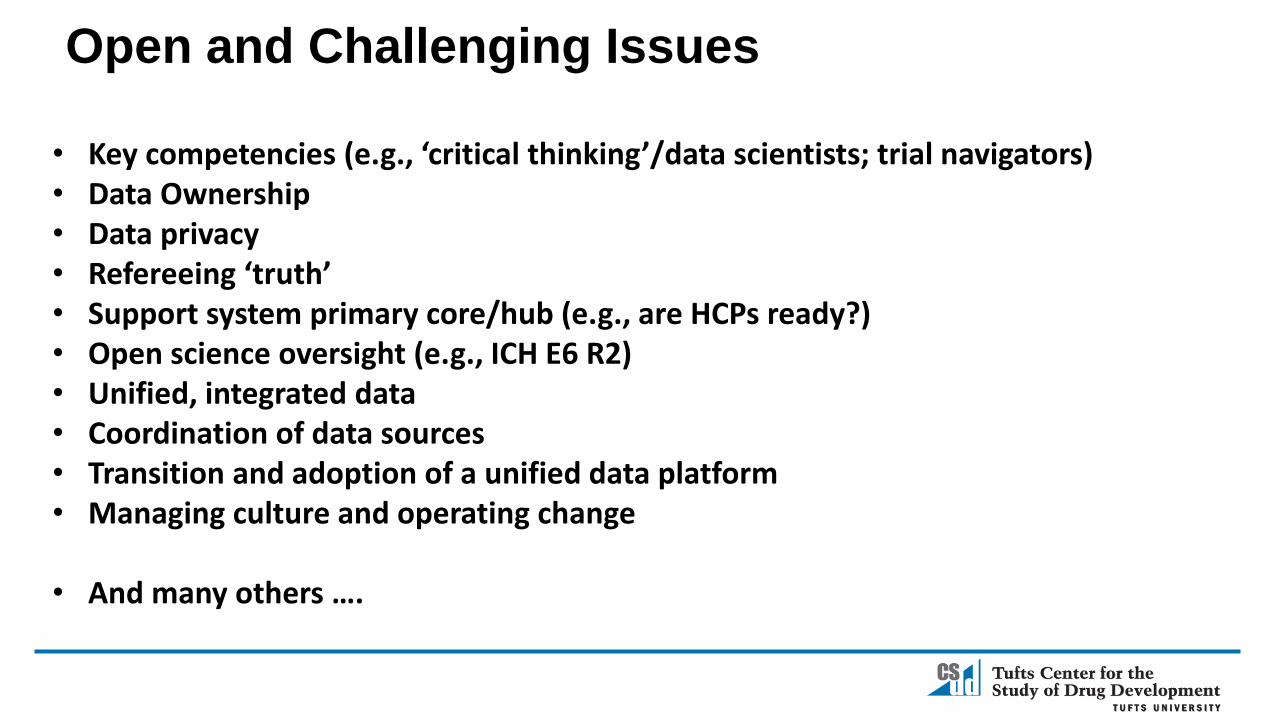
• Key competencies (e.g., ‘critical thinking’/data scientists; trial navigators)• Data Ownership• Data privacy• Refereeing ‘truth’• Support system primary core/hub (e.g., are HCPs ready?)• Open science oversight (e.g., ICH E6 R2)• Unified, integrated data• Coordination of data sources• Transition and adoption of a unified data platform• Managing culture and operating change
• And many others ….
Open and Challenging Issues

Ken Getz
Founder and Board Chair, CISCRP
Director, Sponsored Programs
Associate Professor
CSDD, Tufts University School of Medicine
617-636-3487, [email protected]