biosense: real-time object tracking for animal movement
TRANSCRIPT

BioSense: Real-Time Object Tracking forAnimal Movement and Behavior Research
Jon Patman∗, Sabrina C.J. Michael†, Marvin M.F. Lutnesky§, Kannappan Palaniappan∗∗Department of Electrical Engineering and Computer Science, University of Missouri, Columbia, MO 65203 USA
†Division of Biological Sciences, University of Missouri, Columbia, MO 65203 USA§Department of Science and Mathematics, Texas A&M University-San Antonio, San Antonio, Texas 78224 USA
{jon.patman, sabrina.michael}@mail.missouri.edu; [email protected]; [email protected]
Abstract—Video object tracking has been used with great suc-cess in numerous applications ranging from autonomous vehiclenavigation to medical image analysis. A broad and emergingdomain for exploration is in the field of automatic video-basedanimal behavior understanding. Interesting, yet difficult-to-testhypotheses, can be evaluated by high-throughput processing ofanimal movements and interactions collected from both labora-tory and field experiments. In this paper we describe BioSense,a new standalone software platform and user interface that pro-vides researchers with an open-source framework for collectingand quantitatively analyzing video data characterizing animalmovement and behavior (e.g. spatial location, velocity, regionpreference, etc.). BioSense is capable of tracking multiple objectsin real-time, using various object detection methods suitable fora range of environments and animals. Real-time operation alsoprovides a tactical approach to object tracking by allowing usersthe ability to manipulate the control of the software while seeingvisual feedback immediately. We evaluate the capabilities ofBioSense in a series of video tracking benchmarks representativeof the challenges present in animal behavior research.
Keywords—object-tracking, video analytics, animal behavior,automated data collection, tracking software
I. INTRODUCTION
Traditional approaches to quantifying animal movementand spatial information often relied on researchers manuallyannotating subsequent video frames or images collected atregular sampling intervals using software tools such as Im-ageJ [1]. While this approach allows for animal movementto be discretized, it does so at the cost of increased timeand labor spent annotating images, which ultimately impactshow many images can be processed. To mitigate this issue,automated video tracking systems were introduced as early asthe 1990s which offered more flexibility, and greater spatio-temporal resolution [2]. Due to the advancements of com-puting performance in the years since, video based trackinghas improved considerably with regards to tracking multipleobjects, operating under real-time constraints, and being ableto use state-of-the-art computer vision algorithms such as deepconvolutional neural networks.
Researchers studying animal behavior need software that al-lows them to collect large volumes of data at high resolutions.In particular, researchers need software solutions that allowthem to process their data using standardized techniques in aconsistent and intuitive manner. Prior research has largely been
conducted using proprietary software or algorithms that weredeveloped specifically for a unique problem domain (e.g. celltracking, 3D tracking of fish schools, etc.) and may not be pub-licly available. While some commercial software still remainspopular, the rise of the open-source paradigm has prompteddevelopers and companies alike to share their work with theresearch community for free, which fosters collaboration andgreater accessibility to those technologies [3].
An ideal tracking software for animal behavior research isone that is domain-agnostic, meaning that it can operate for awide range of animal behavior and environmental conditions.Given the broad set of animal movements and experimentalsetups, a single technique for detecting and tracking objectsmay not be optimal for different cases. Moreover, the trade-offbetween algorithmic complexity and the software’s responseto user input needs to be considered as there typically is nota one-size-fits-all setting for optimal tracking parameters. Themajority of experimental footage is usually on the order ofa couple of minutes to several hours, therefore, users shouldreceive feedback on the tracking performance for a given setof parameters and be able to make adjustments accordingly inreal-time.
To address these challenges, we present BioSense, a cross-platform software package, capable of tracking multiple ob-jects in real-time for a variety of experimental circumstances.BioSense provides an intuitive and easy to use graphical userinterface that allows users to experiment with different settingsand discover those most optimal for their experimental setup.We provide different object detection techniques suitable fordifferent tracking environments and use an adaptive KalmanFilter in order to model the movement dynamics of differentanimals that may not be captured under a single process model.We use the Hungarian method to find the optimal assignmentof tracks to detected objects and use a gating technique forrejecting bad measurements that could otherwise cause thefilter to diverge. We evaluate the performance of BioSensefor a variety of tracking challenges present in experimentvideos using standard mutli-object tracking metrics. BioSenseis released for free and is available for download along withsupporting documentation and the supplemental materials usedin this study (e.g. raw and processed videos, trajectory files,etc.) at the Mantis Research Technology website [4].
The rest of the paper is organized as follows: Section II978-1-5386-9306-3/18/$31.00 c©2018 IEEE

discusses the recent tools available for video-based tracking inanimal behavior research. Section III discusses the design andimplementation details of our multi-object tracking software.We provide the details of the tracking datasets and metricsfollowed by the results of the evaluation in Section IV. Lastly,Section V concludes the paper and provides a discussion offuture improvements.
II. RELATED WORK
The technologies enabling the automated tracking of animalbehavior and movement have evolved significantly over thepast two decades. One of the earliest and most prominentcommercial example is Noldus’ EthoVision software [5]. Ini-tially developed for use in behavior experiments with mice,EthoVision has since been extended to track different animalssuch as zebrafish (Danio rerio) and various types of insects [6].The EthoVision software has different commercial packages ormodules, that are tailored towards specific tracking problems(e.g. single-object vs. multi-object, and aquatic vs. terrestrial).Additional modules for advanced behavior analysis such asaction recognition and 3D tracking are also available forpurchase.
Similarly, another commercial only software, AnTracks, wasinitially developed for tracking large numbers of ants but hasbeen used in different studies by several universities [7]. WhileEthoVision and AnTracks have an established presence in theresearch community, it’s commercial only availability maylimit the user audience and flexibility of research that canbe performed. Furthermore, commercial only software makesevaluating and comparing new emerging software difficult andas a result they are usually left out of the evaluation study.
Several free software alternatives have also recently beenproposed. Ctrax is an open-source program initially developedfor tracking positions and orientations of walking flies [8].Some functionality Ctrax of has also been packaged as aMatlab toolbox and can be integrated with existing programs.EthoWatcher is another free tracking software that was initi-nally developed for tracking mice in toxicology studies [9].EthoWatcher, however, is limited to tracking only a singleobject and cannot summarize data from multiple user regionsselected in a video.
Another open-source software, idTracker was developedto address the challenges of tracking multiple interactingobjects such as groups of Zebrafish and some insects, whilespecifically being able to create appearance models or aunique ”fingerprint” for each object and can recognize specificindividuals in different videos [10]. idTracker uses an offlinetracking approach where future images in the video can beused for estimating and fusing trajectories and a profile ortemplate for each object is created to find the correspondingobject in subsequent frames. However, due to the computationcomplexity involved in this approach, the software is unableprocess videos in real-time.
The most recent and freely available tracking softwarefor animal behavior to emerge is ToxTrac, which is capableof tracking multiple objects in both terrestrial and aquatic
environments [11]. ToxTrac uses a second-order Kalman Filterto estimate object trajectories for detected objects and fusesexisting trajectory fragments to generate tracks. ToxTrac wasalso shown to outperform idTracker in terms of detection rateand processing time for a series of different evaluation videos.
III. MULTI-OBJECT TRACKING FRAMEWORK
A. Tracking Problem Formulation
In general, the tracking problem can be defined as theproblem of estimating the trajectory of a target object in theimage plane as it moves around a scene. The goal of a trackeris to assign consistent labels to the detected objects in differentframes of a video usually by using a priori information aboutthe target [12].
The general object tracking problem can be formulated asfollows:
Let I = {Ik : k ∈ N} represent the frames of a videosequence, with Ik ∈ EI being the frame at time k, defined inEI , the space of all possible images. Tracking a single objectcan be formulated as estimating the time-series:
χ = {xk : k ∈ N} (1)
over the set of discrete time instances indexed by k, based oninformation in I . The vectors xk ∈ Es are the states of thetarget and Es is the state space. The time series X is knownas the trajectory of the target in Es.
Information such as the location and shape of each animalcan be encoded into the state vector as xk = (uk, vk, hk, wk),where uk and vk represent the object’s center x and y co-ordinates, and hk and wk represent the width and height ofthe rectangle bounded around the target. The observation (ormeasurement) of a target generated by a sensor is encodedinto the vector zk ∈ E0 where E0 is the observation space.
The task of tracking for multiple objects can be extendedby:
Xk = {xk,1, ..., xk,M(k)} (2)
where the multi-target state vector Xk, contains the con-catenation of the parameters for all of the single-target statesand M(k) is the number of targets in the scene at time k.Similarly, the definition of observation to multiple targets canbe extended by:
Zk = {zk,1, ..., zk,N(k)} (3)
where Zk is the finite collection of the single target observa-tions formed by N(k) observations and each zk,i is the set ofactive observations assigned to the trajectory i up to the timestep k.
The mutli-object tracking pipeline currently implementedin BioSense is shown in Fig 1. Objects are first detectedand then discarded if they are not within a user-defined size.Valid detections are then linked to object trajectories usingdata association methods. This type of tracking is commonlyknown as ”tracking-by-detection” and allows for flexibilityby allowing objects to be segmented based on the detectionmethod most suitable for the given environment.

Fig. 1. The multi-stage, object-tracking pipeline used in BioSense.
B. Detecting objects
The task of object detection involves deciding whether toclassify each pixel in each frame as belonging to either theforeground or background in a process known as segmentation.This operation can be performed on each image independentlyor can make use of temporal information computed from asequence of frames to reduce the number of false detections.Given the regions of detected pixels in a frame, the trackerthen needs to perform object correspondence from one frameto the next. BioSense offers two popular techniques to aid inthe segmentation of foreground objects from their respectivebackground:
1) Greyscale Thresholding: The simplest and often most ef-fective form of segmentation available in BioSense is greyscalethresholding. This technique first takes a greyscale image andperforms segmentation based on relative pixel intensities byassessing whether they are above or below a user definedintensity value [13].
Greyscale thresholding is performed as follows:
ωi,j =
{1, where Ik(i, j) ≥ T0, where Ik(i, j) < T
(4)
where ωi,j is the binary value assigned to the pixel locatedat coordinate (i,j) in image Ik and T is a user-defined thresholdwith an intensity value between 0-255. The end results afterthresholding an image is a resulting binary image consistingof solid black and white pixels which represent detectedbackground and foreground objects, respectively.
2) Background Subtraction: Segmenting an image basedon intensity values alone may be sub-optimal if the objectsgreyscale intensity is not homogeneous or if the intensityvalues between objects varies significantly. Moreover, re-searchers may also wish to record animals in a more naturalsetting which is usually subject to dynamic lighting conditionsthat can alter the color or intensity values of the animals.Background subtraction is one technique that can remedythis problem by comparing the difference between subsequentframes and an initial reference frame or model of a staticbackground.
BioSense uses an advanced background subtraction tech-nique [14] that performs segmentation by modeling each pixelof a frame using a Gaussian Mixture Model in order to
determine if that pixel belongs to the background or fore-ground. When a new frame is considered, each pixel Ik(i, j)is compared to the Gaussian distributions currently modelingthat pixel in order to identify if the pixel belongs to one of thedistributions. If there is no Gaussian distribution within a fewstandard deviations of the average value for the current pixel,then a new distribution is initialized to model that pixel.
Conversely, if the Mahalanobis distance from the pixel tothe distribution is less than three standard deviations then thatdistribution is updated. A pixel is then classified as backgroundor foreground if its associated Gaussian distribution representsthe background or foreground respectively. An upper limit isusually placed on the number of distributions to be consideredfor each pixel, and hence when new distributions have to becreated, the smallest existing distribution has be discarded ifthe limit on the number distributions has been reached.
The Gaussian Mixture Model (GMM) for background sub-traction is defined as:
p(−→x |χT , BG+ FG) =M∑
m=1
πmℵ(−→x ;−→µm, σ2m ∗ I) (5)
where −→µ1, ...,−→µM are the estimates of the means and
−→σ1, ...,−→σM are the estimates of the variances that describe theGaussian components. The covariance matrices are diagonaland the identity matrix I has proper dimensions. The mixingweights denoted by πm are non-negative and add up to one.
Given a new data sample −→x t, at time t, the recursive updateequations are:
π′m = πm + α(Otm − πm) (6)
−→µ ′m = −→µm +Otm(α/πm)
−→δ m (7)
σ2′
m = σ2m +Ot
m(α/πm)(−→δ T
mδm − σ2m) (8)
where−→δ m = −→x t−−→µm. The result is an on-line clustering
algorithm where intruding foreground objects will be repre-sented by some additional clusters with small weight πm. Ifthe distributions are assumed to be sorted to have descendingweights πm, we can approximate the background model bythe first B clusters:
B = argminb
b∑m=1
> (1− cf ) (9)
where cf is a measure of the maximum portion of datathat can belong to foreground objects without influencing thebackground model.
3) Rejecting erroneous detections: Each of the techniquespreviously discussed provide unique advantages to detectingdifferent types of animals in various environments. However,one of drawback of tracking-by-detection involves the as-sumption that detected objects fed into the tracking stage arevalid samples. Noise in the form of unwanted objects (e.g.shadows, lighting changes, etc.) or disjointed regions of pixelson a single object can become problematic if not addressed.Without creating a unique appearance model for each object,we can reduce the false positive error by confidently discarding
detected objects whose area is outside of a user-defined sizeparameter determined at run-time. The challenge of how tohandle cases where the detected number of objects differs fromthe number we expect to observe is discussed in the followingsection.
C. Tracking with the Adaptive Kalman Filter
Once valid detections are retrieved, a Kalman Filter canbe designed to use those measurements in order to createpredictions about object trajectories that can then be usedto find correspondence between new measurements (data as-sociation) and filter predictions when uncertainty about newmeasurements is involved (e.g. disruptions in detection fromobjects colliding or being occluded) [15].
The Kalman Filter addresses the general problem of tryingto estimate the state x ∈ <n of a discrete-time controlledprocess that is governed by the linear stochastic differenceequation:
xk = Axk−1 +Qk (10)
where state transition matrix A relates the state at the previoustime step k−1 to the state at the current step k and Q representsthe process noise matrix. For the case of modeling a kinematicfirst-order system that considers objects with xy position andvelocity in a 2D space, Eq. 10 can be represented in matrixform by:
xyvxvy
T
k
=
1 0 ∆t 00 1 0 ∆t0 0 1 00 0 0 1
·xyvxvy
T
k−1
+Qk (11)
The corresponding measurement z ∈ <m is defined as:
zk = Hxk +R (12)
where z is the pair of centroid coordinates for each objectprovided by the detection algorithm at time step k with Rbeing the measurement noise matrix. The matrix H relatesthe state to the measurement zk and is 1 in this case. Themeasurement equation is represented in matrix form as:
[zxzy
]Tk
=
[1 0 0 00 1 0 0
]·
xyvxvy
T
k−1
+R (13)
Computing an a posteriori state estimate xk as a linearcombination of an a priori estimate xk and a weighteddifference between a actual measurement zk is defined by:
xk = xk +K(zk −Hxk) (14)
where the difference (zk − Hxk) is called the measurementinnovation or residual, and K is the Kalman gain that mini-mizes the a posteriori error covariance. The residual reflectsthe discrepancy between the predicted measurement Hxk andthe actual measurement zk.
The Kalman Filter recursively estimates a process state atsome time and then receives feedback in the form of often
noisy measurements. The Kalman Filter is updated via twosets of equations known as the time update (prediction) andmeasurement update (correction). In the prediction stage, thestate and covariance estimates are projected forward from timestep k-1 to step k. In the correction stage, the first step involvescomputing the Kalman gain K and then using a measurementof the process to generate an a posteriori state estimate. Thefinal step involves computing an a posteriori error covarianceestimate.
Properly initializing the process and measurement noisecovariance matrices Q and R from Eqs. 11 and 13 can have asignificant impact on filter performance [16]. We initialize Ras follows:
R =
[σ2x σyσx
σxσy σ2y
]=
[λ 00 λ
](15)
where we assume x and y are independent Gaussian processesand the variance λ is set to 1×10⁻⁵ to account for fluctuationsin the detection of objects based on lighting and shape changesthat can distort the calculation of the centroid coordinates ofmeasurements throughout the video.
Typically Q is tuned empirically and is assumed to be con-stant once initialized but in the case of general animal tracking,this assumption may lead to sub-optimal filter performancedue to different animal locomotion and behavior. Given ourKalman Filter implementation is a first-order filter based on aconstant velocity (CV) motion model, it works well for objectsthat vary their movement and velocity relatively slowly. Issuescan arise when trying to track quickly maneuvering objectswith the CV model, so sometimes a constant acceleration(CA) motion model is used instead. However, CA models havesome drawbacks as they tend to closely track noise in themeasurements which can be mistaken for object accelerationseven though an object remains stationary, resulting in degra-dation of prediction accuracy. Furthermore, it is reasonableto assume that in animal tracking, stationary positioning isjust as common as continuous movement, therefore, a balancebetween the two systems needs to be explored.
To address this issue, we propose an adaptation strategythat adjusts Q at time step k whenever a maneuver is detectedusing information from the residual. The residual indicateshow much the prediction using the process model matches theactual measurement from the system. We normalize the squareof the residual in order to determine if Qk needs to be scaledusing:
γ = yTS−1y (16)
where y is the residual and S is the measurement covari-ance [17].
At the beginning of tracking, Q0 is initialized as a diagonalmatrix with large values to give preference to the measurementand is then immediately scaled down during the next time stepto give preference back to the prediction output. Detectingmaneuvers using the residual is straight forward as we canchoose a scaling factor (e.g. 1000) to multiply with thecovariance matrix when γ in Eq. 16 exceeds a threshold γmax

(e.g. typically greater than 5 standard deviations). During thenext time step k, the covariance matrix is scaled down usingthe same scaling factor γ.
D. Data association and measurement validation
The process of tracking an object would not complete with-out a way to optimally assign a predicted position (e.g. outputfrom the Kalman Filter) to an actual measured position (outputfrom an object detector) in order to establish a consistent trackfor a given object.
This problem can be represented as a general assignmentproblem and optimally solved using the popular HungarianAlgorithm [18] show below:
min∑
d2ij ·xij with xij ∈ 0, 1∑i
xij = 1 and∑j
xij = 1(17)
where d2ij is a pair of predicted object coordinates to beassigned to a pair of detected (measured) object coordinatesxij such that the cost of each assignment (euclidean distancebetween points) is minimal with no two assignments occurringin the same column or row. This method ensures that eachdetected object has a unique track assigned to it. In the casewhere there are fewer detections than tracks, the current trackis not updated.
The issue of unwanted objects being detected that fall withinallowable size constraints being passed onto the trackingstage is common and needs to be addressed. Measurementvalidation, also known as gating, is a common techniqueused to reject measurements not compatible with the expectedmotion or location of a target. Many tracking approaches useproblem-specific heuristics to determine if a newly detectedposition is well within the physical and temporal capabilitiesof the object’s motion. While this method tends to producegood results for well-defined motions, it typically does notgeneralize well, particularly in the case of animal trackingwhich can include animals of all sizes and environments. Toaddress this challenge, we use a gating approach that employsa large and rectangular gate to discard geometrically unlikelymeasurements.
Fig. 2. Graphical User Interface for BioSense (PC version) illustrating howusers can draw custom masks to remove unwanted disturbances (e.g. movingbackground objects) in the image that may degrade tracking performance.
E. Additional software featuresTo ensure high-quality and accurate measurements for
the tracking stage, several additional tools are available inBioSense for improving object detection:
1) Image pre-processing: Image quality can vary basedon different types of cameras and lighting conditions thatcan result in images being blurry or having too much noise.BioSense offers several tools to help improve image qualityby allowing the user to sharpen the images which can revealmore edge information or by blurring the images which canhelp to removing unwanted noise and artifacts. Histogramequalization can also be performed to enhance the contrastof images.
2) Contour growing/shrinking: Mathematical morphologyis an approach to image processing that performs operationsregions of segmented pixels that can be used to enhanceoverall object detection [19]. BioSense provides four types ofmorphological operations: dilation, erosion, opening (erosionfollowed by dilation), and closing (dilation followed by ero-sion). Each operation can be used in different circumstances toimprove object detection by either growing or shrinking seg-mented regions. The erosion operation may aid in segmentingtouching animals resulting in more distinguishable individuals.Conversely, the opening operation can be used to enlarge thearea of an object in a binary image that may not be properlydetected due to their small size.
3) Regions of Interest and Masking: Users can createcustom Regions of Interest (ROI), which are primitive shapesthat can be drawn on screen that can then be used to monitoranimal activities (e.g. frequency/duration of visits). Addition-ally, noisy and problematic areas (e.g. changes in lighting,movements outside of the observation area, etc.) in the videoframe can be masked out, resulting in greater detection andtracking performance.
4) Conversion of pixel measurements to real-world units:When dealing with spatial coordinates and movement rates it isuseful to be able to represent the quantities in real-world units.BioSense provides a calibration module that allows users torelate a fixed distance in a unit system of choice (e.g. metric)to a number of associated pixels by allowing user to drawa corresponding line on screen across the length of a knownobject (e.g. scale, diameter of tank, etc.) in the video frameresulting in a ratio of pixels to a real-world unit of length.
5) Exporting data and movement statistics: BioSense pro-vides several useful metrics and statistics related to animalmovement that can be exported after processing a video. Userscan export absolute measurements and summary statistics foreach object such as the position, velocity, distance moved,heading, group alignment, and region occupancy durationsfor each time step. Advanced movement statistics are alsocalculated such as the mean nearest neighbor distance (NND)from an object to all of it’s neighbors, and the net-to-gross-displacement (NGDR) ratio. The NGDR metric is used toassess the ”tortuosity” of a trajectory. Ratios close to one cor-respond to rectilinear motion whereas smaller values indicatea more tortuous and complex trajectory [20].

TABLE IANIMAL TRACKING DATASET ATTRIBUTES
Video Video FrameResolution
Framerate(fps)
ObjectCount
Object Size(pixels2)
Occlusion(0-1)
Collision(0-1)
Mobility(1-3)
Contrast(1-3)
DifficultyIndex
Bee [2a] 960 x 720 30 1 3106.4± 120.5 No No Medium Low 3Shiner [2b] 960 x 720 30 4 80.7± 40.8 No Yes High High 7Spider [2c] 1280 x 720 15 1 2411.7± 345.2 Yes No Low Low 3
Termite [2d] 1920 x 1080 60 8 2506.1± 68.9 No Yes High High 7Treehopper [2e] 640 x 480 30 1 287.5± 48.9 Yes No Low Low 3
Tadpole [2f] 928 x 800 600 7 280.7± 23.2 No Yes Medium High 6
Fig. 3. Comparison of the videos (2a-2f) used in the animal tracking dataset. Close-up screenshots and bounding boxes are shown for visualization purposes.Please see supplemental material for information regarding the videos used for evaluation.
6) Software implementation: BioSense was implementedusing the Python programming language. Because Python isan interpreted language as opposed to a purely compiled onesuch as C or Java, it is known to be a slower language.However, we used several highly-optimized libraries suchas Numpy [21] that perform numerical computations usingcode compiled in C which leads to significant speed-ups overusing native Python operations. The OpenCV [22] library wasused extensively for image processing tasks and also usesNumpy for performing complex operations. We made furtheroptimizations to BioSense by vectorizing code where possible.
IV. PERFORMANCE EVALUATION
A. Datasets for animal tracking
The recent advancement in computer vision algorithms hasprompted an increase in the amount of image and videodatasets (e.g. pedestrian, common objects, satellite images,etc.) available for training and evaluating such algorithms.This poses a problem for animal tracking research due to thefact that videos of animal behavior experiments is limited andoften not made public. In order to evaluate the robustnessof BioSense for the generalized case of object tracking, weconstructed an animal tracking dataset, described in Table I,that consists of several videos with attributes reflective of thosetypically encountered in animal behavior research experiments.
We specifically chose videos of various resolution, numberof objects present, and differing levels of contrast between theanimals and backgrounds. Additionally, behavior specific tothe animals were included such as the possibility of objectsto interact (collide), seek refuge (occlusion), and animals thattend to have high velocities and overall displacement werereported. Because the success of a tracking algorithm usedfor animal behavior is highly dependent on the type of video
and visual conditions present, we also report a difficulty indexthat illustrates the level of complexity involved in obtainingoptimal results from a tracking standpoint. The difficulty indexis the summation of points assigned to a video based onattributes present (e.g. (0-1) for collisions or no collisions,(1-3) for mobility type, etc.) We also report the degree towhich there is a low or strong contrast between the animaland the background as this is typically a deciding factor inwhich detection methods are used. Figure 3 shows examplesof the animals we seek to track in each video.
B. Dataset tracking challenges
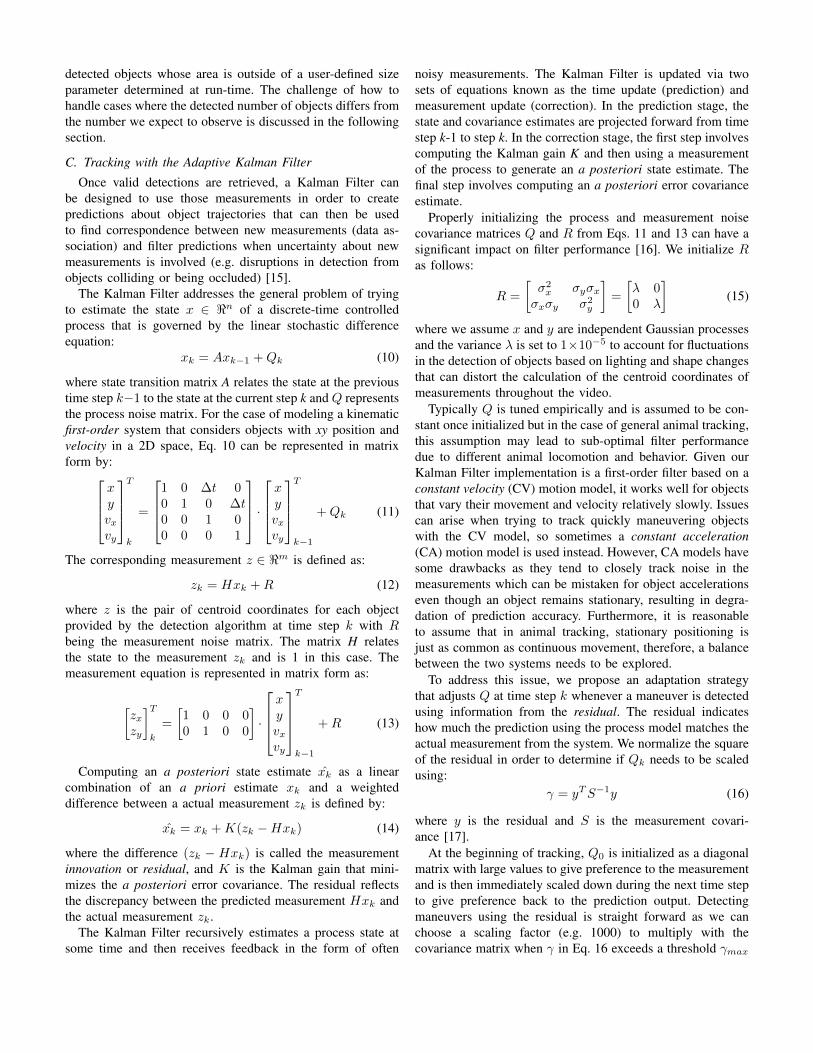
In order to better understand why a particular animal be-havior experiment may result in a given performance measure-ment, we identified several challenging tracking cases relatedto specific animal movement in our video dataset and showhow BioSense handles the various tracking issues encountered.Figure 4 is a sequence of images from the Shiner [s1] videothat shows the case where several fish collide with one anotherand merge into a single object, thereby causing those individ-uals to not be detected which also increases the uncertainty offuture predictions. However, as the individuals merge and aresubsequently detected again, the tracker is able to recover andestimate the new position using the internal constant velocitymotion model where the tracker expects the individual to bebased on the last position and velocity measurement.
C. Tracking performance metrics
Using a single metric to evaluate multi-target trackingperformance of a tracker is typically insufficient, therefore,we utilize a set of powerful Multi-Object Tracking (MOT) [23]metrics used as the standard for tracking benchmarks such as:• CGT: complete number of Ground Truth labels• MOTA (↑): Multi-object tracking accuracy
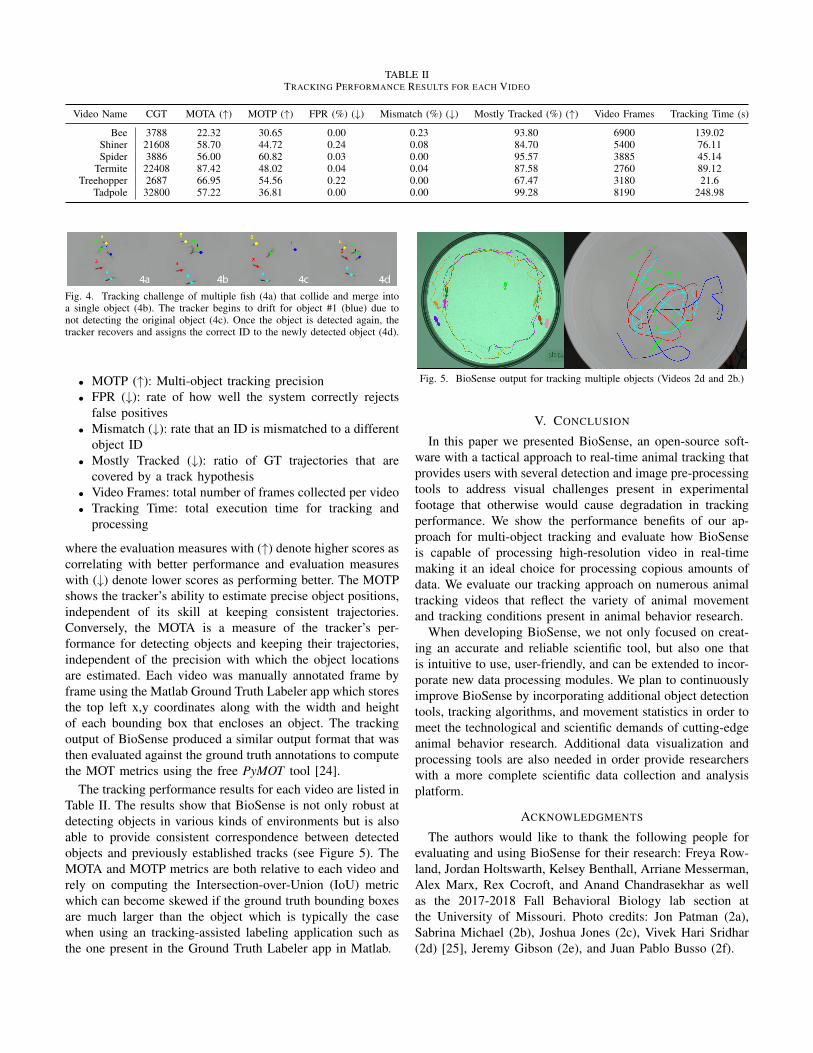
TABLE IITRACKING PERFORMANCE RESULTS FOR EACH VIDEO
Video Name CGT MOTA (↑) MOTP (↑) FPR (%) (↓) Mismatch (%) (↓) Mostly Tracked (%) (↑) Video Frames Tracking Time (s)
Bee 3788 22.32 30.65 0.00 0.23 93.80 6900 139.02Shiner 21608 58.70 44.72 0.24 0.08 84.70 5400 76.11Spider 3886 56.00 60.82 0.03 0.00 95.57 3885 45.14
Termite 22408 87.42 48.02 0.04 0.04 87.58 2760 89.12Treehopper 2687 66.95 54.56 0.22 0.00 67.47 3180 21.6
Tadpole 32800 57.22 36.81 0.00 0.00 99.28 8190 248.98
Fig. 4. Tracking challenge of multiple fish (4a) that collide and merge intoa single object (4b). The tracker begins to drift for object #1 (blue) due tonot detecting the original object (4c). Once the object is detected again, thetracker recovers and assigns the correct ID to the newly detected object (4d).
• MOTP (↑): Multi-object tracking precision• FPR (↓): rate of how well the system correctly rejects
false positives• Mismatch (↓): rate that an ID is mismatched to a different
object ID• Mostly Tracked (↓): ratio of GT trajectories that are
covered by a track hypothesis• Video Frames: total number of frames collected per video• Tracking Time: total execution time for tracking and
processing
where the evaluation measures with (↑) denote higher scores ascorrelating with better performance and evaluation measureswith (↓) denote lower scores as performing better. The MOTPshows the tracker’s ability to estimate precise object positions,independent of its skill at keeping consistent trajectories.Conversely, the MOTA is a measure of the tracker’s per-formance for detecting objects and keeping their trajectories,independent of the precision with which the object locationsare estimated. Each video was manually annotated frame byframe using the Matlab Ground Truth Labeler app which storesthe top left x,y coordinates along with the width and heightof each bounding box that encloses an object. The trackingoutput of BioSense produced a similar output format that wasthen evaluated against the ground truth annotations to computethe MOT metrics using the free PyMOT tool [24].
The tracking performance results for each video are listed inTable II. The results show that BioSense is not only robust atdetecting objects in various kinds of environments but is alsoable to provide consistent correspondence between detectedobjects and previously established tracks (see Figure 5). TheMOTA and MOTP metrics are both relative to each video andrely on computing the Intersection-over-Union (IoU) metricwhich can become skewed if the ground truth bounding boxesare much larger than the object which is typically the casewhen using an tracking-assisted labeling application such asthe one present in the Ground Truth Labeler app in Matlab.
Fig. 5. BioSense output for tracking multiple objects (Videos 2d and 2b.)
V. CONCLUSION
In this paper we presented BioSense, an open-source soft-ware with a tactical approach to real-time animal tracking thatprovides users with several detection and image pre-processingtools to address visual challenges present in experimentalfootage that otherwise would cause degradation in trackingperformance. We show the performance benefits of our ap-proach for multi-object tracking and evaluate how BioSenseis capable of processing high-resolution video in real-timemaking it an ideal choice for processing copious amounts ofdata. We evaluate our tracking approach on numerous animaltracking videos that reflect the variety of animal movementand tracking conditions present in animal behavior research.
When developing BioSense, we not only focused on creat-ing an accurate and reliable scientific tool, but also one thatis intuitive to use, user-friendly, and can be extended to incor-porate new data processing modules. We plan to continuouslyimprove BioSense by incorporating additional object detectiontools, tracking algorithms, and movement statistics in order tomeet the technological and scientific demands of cutting-edgeanimal behavior research. Additional data visualization andprocessing tools are also needed in order provide researcherswith a more complete scientific data collection and analysisplatform.
ACKNOWLEDGMENTS
The authors would like to thank the following people forevaluating and using BioSense for their research: Freya Row-land, Jordan Holtswarth, Kelsey Benthall, Arriane Messerman,Alex Marx, Rex Cocroft, and Anand Chandrasekhar as wellas the 2017-2018 Fall Behavioral Biology lab section atthe University of Missouri. Photo credits: Jon Patman (2a),Sabrina Michael (2b), Joshua Jones (2c), Vivek Hari Sridhar(2d) [25], Jeremy Gibson (2e), and Juan Pablo Busso (2f).

REFERENCES
[1] M. D. Abramoff, P. J. Magalhaes, and S. J. Ram, “Image processing withimagej,” Biophotonics international, vol. 11, no. 7, pp. 36–42, 2004.
[2] C. V. Vorhees, K. D. Acuff-Smith, D. R. Minck, and R. E. Butcher,“A method for measuring locomotor behavior in rodents: contrast-sensitive computer-controlled video tracking activity assessment in rats,”Neurotoxicology and teratology, vol. 14, no. 1, pp. 43–49, 1992.
[3] A. I. Dell, J. A. Bender, K. Branson, I. D. Couzin, G. G. de Polavieja,L. P. Noldus, A. Perez-Escudero, P. Perona, A. D. Straw, M. Wikelskiet al., “Automated image-based tracking and its application in ecology,”Trends in ecology & evolution, vol. 29, no. 7, pp. 417–428, 2014.
[4] Mantis Research Technology, “Biosense: tactical object tracking soft-ware,” https://www.MantisRT.com, 2018.
[5] L. P. Noldus, A. J. Spink, and R. A. Tegelenbosch, “Ethovision: a ver-satile video tracking system for automation of behavioral experiments,”Behavior Research Methods, Instruments, & Computers, vol. 33, no. 3,pp. 398–414, 2001.
[6] L. P. Noldus, A. J. Spink, and R. Tegelenbosch, “Computerised videotracking, movement analysis and behaviour recognition in insects,”Computers and Electronics in agriculture, vol. 35, no. 2-3, pp. 201–227, 2002.
[7] AnTracks Computer Vision Systems, “Antracks,” 2013. [Online].Available: https://sites.google.com/view/antracks/home
[8] K. Branson, A. Robie, J. Bender, P. Perona, and M. Dickinson, “Ctrax,”2015. [Online]. Available: http://ctrax.sourceforge.net/
[9] C. Junior, C. Fernando, C. N. Pederiva, R. C. Bose, V. A. Garcia,C. Lino-de Oliveira, and J. Marino-Neto, “Ethowatcher: validation ofa tool for behavioral and video-tracking analysis in laboratory animals,”Computers in biology and medicine, vol. 42, no. 2, pp. 257–264, 2012.
[10] A. Perez-Escudero, J. Vicente-Page, R. C. Hinz, S. Arganda, and G. G.De Polavieja, “idtracker: tracking individuals in a group by automaticidentification of unmarked animals,” Nature methods, vol. 11, no. 7, p.743, 2014.
[11] A. Rodriguez, H. Zhang, J. Klaminder, T. Brodin, P. L. Andersson,and M. Andersson, “Toxtrac: a fast and robust software for trackingorganisms,” Methods in Ecology and Evolution, vol. 9, no. 3, pp. 460–464, 2018.
[12] E. Maggio and A. Cavallaro, Video tracking: theory and practice. JohnWiley & Sons, 2011.
[13] M. Sezgin and B. Sankur, “Survey over image thresholding techniquesand quantitative performance evaluation,” Journal of Electronic imaging,vol. 13, no. 1, pp. 146–166, 2004.
[14] Z. Zivkovic, “Improved adaptive gaussian mixture model for backgroundsubtraction,” in Pattern Recognition, 2004. ICPR 2004. Proceedings ofthe 17th International Conference on, vol. 2. IEEE, 2004, pp. 28–31.
[15] G. Bishop, G. Welch et al., “An introduction to the kalman filter,” Procof SIGGRAPH, Course, vol. 8, no. 27599-3175, p. 59, 2001.
[16] A. Mohamed and K. Schwarz, “Adaptive kalman filtering for ins/gps,”Journal of geodesy, vol. 73, no. 4, pp. 193–203, 1999.
[17] Y. Bar-Shalom, X. R. Li, and T. Kirubarajan, Estimation with applica-tions to tracking and navigation: theory algorithms and software. JohnWiley & Sons, 2004.
[18] H. W. Kuhn, “The hungarian method for the assignment problem,” Navalresearch logistics quarterly, vol. 2, no. 1-2, pp. 83–97, 1955.
[19] L. Najman and H. Talbot, Mathematical morphology: from theory toapplications. John Wiley & Sons, 2013.
[20] P. Turchin, Quantitative analysis of movement. Sinauer assoc. Sunder-land (mass.), 1998.
[21] “Numpy,” http://www.numpy.org/index.html, accessed: 11-2018.[22] “OpenCV - Open Source Computer Vision Library,” https://opencv.org/,
accessed: 11-2018.[23] K. Bernardin and R. Stiefelhagen, “Evaluating multiple object tracking
performance: the clear mot metrics,” Journal on Image and VideoProcessing, vol. 2008, p. 1, 2008.
[24] M. Roth, M. Buml, M. Fischer, and K. Bernardin, “Pymot,”https://github.com/Videmo/pymot, 2018.
[25] V. H. Sridhar, D. G. Roche, and S. Gingins, “Tracktor: image-basedautomated tracking of animal movement and behaviour,” bioRxiv, p.412262, 2018.