tracing in sap decision service management · 1 tracing in sap decision service management applies...
TRANSCRIPT

1
Tracing in SAP Decision Service Management Applies to SAP Decision Service Management 1.0, Support Package 1 or higher
Business Rule Framework plus in SAP_BASIS 731, Support Package 11 or higher
Summary
The document gives a comprehensive overview about rule tracing in SAP Decision Service Management
and Business Rue Framework plus. It explains user interface, API, and database layout and it gives
background where appropriate.
Author Carsten Ziegler
Company SAP SE Created on 10 August 2014
Author Bio
Carsten Ziegler is the chief product owner of SAP Decision Service Management and Business Rule Framework plus.
He joined SAP in 2000. Since then he has been working in various projects as a developer,
development architect, project lead and product owner.
2
Table of Contents
Prerequisites ....................................................................................................................................................... 2
Why tracing? ....................................................................................................................................................... 2
How retrieving traces? ........................................................................................................................................ 3
Traditional ....................................................................................................................................................... 3
DSM ................................................................................................................................................................ 4
A flexible switch with SET/GET parameters ................................................................................................... 5
How using traces? .............................................................................................................................................. 6
Trace Modes ................................................................................................................................................... 6 Modes for single run inspection ................................................................................................................................... 6
Modes for analytics ...................................................................................................................................................... 7
Database ......................................................................................................................................................... 7
Run inspection ................................................................................................................................................ 8
Analytics ........................................................................................................................................................ 10
API ................................................................................................................................................................. 10 DB .............................................................................................................................................................................. 10
Memory ...................................................................................................................................................................... 11
Assessment ...................................................................................................................................................... 11
Related Content ................................................................................................................................................ 12
Copyright ........................................................................................................................................................... 13
Prerequisites The code examples and UI screenshots used in this document work for the following software components:
SAP_BASIS, 731 Support Package 11 or higher
DECSERMG, 100, Support Packages 1 or higher
For older versions of the software you may check note 1920616 “BRF+: New Lean Trace Functionality”.
Also without implementation of the support packages or the note information contained in this document may
be useful and applicable for older versions, too.
Why tracing? Business experts as well as technical experts need to understand how business rules execute for several
reasons. First, there is the need to understand how exactly a specific result is found. This is important to
relate how the rules work with the expected behavior. Conceptual or logical problems become transparent.
Second, it can be very important not only to understand single runs but to analyze a collection of let’s say the
last 10’000 runs to get answers for questions like
3
What is the result distribution of the decision service?
What is the result distribution of a specific decision table used in my decision service?
Which rows never hit and which rows hit often in a particular decision table?
Which expressions are executed how often?
What can be changed without risk because it is not used or hardly used?
Sometimes, looking with this level of depth into the execution of business rules leads to big surprises. What
was meant to be an exception turns out as standard behavior and vice versa.
How retrieving traces? Whenever executing business rules there is the possibility to have trace data written. This data can then be
used directly or persisted to the database for later use. For the execution of business rules there are two
recommended ways:
1. Traditional BRFplus
2. DSM
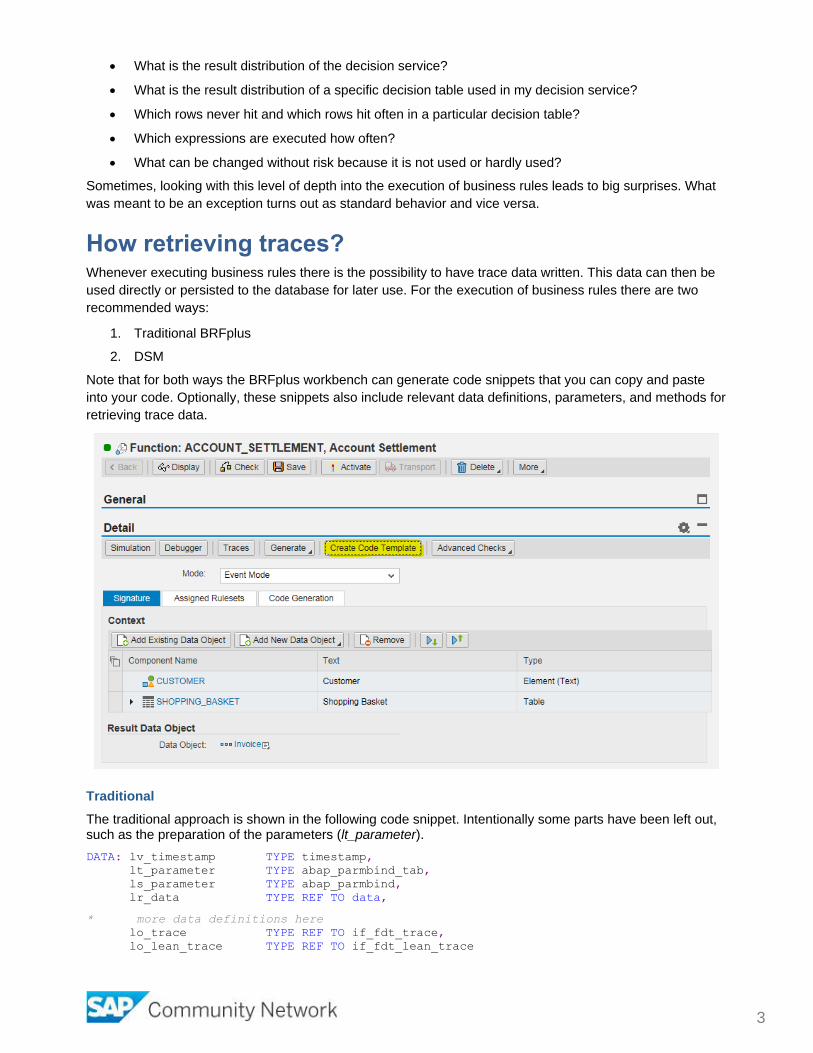
Note that for both ways the BRFplus workbench can generate code snippets that you can copy and paste
into your code. Optionally, these snippets also include relevant data definitions, parameters, and methods for
retrieving trace data.
Traditional
The traditional approach is shown in the following code snippet. Intentionally some parts have been left out, such as the preparation of the parameters (lt_parameter).
DATA: lv_timestamp TYPE timestamp,
lt_parameter TYPE abap_parmbind_tab,
ls_parameter TYPE abap_parmbind,
lr_data TYPE REF TO data,
* more data definitions here
lo_trace TYPE REF TO if_fdt_trace,
lo_lean_trace TYPE REF TO if_fdt_lean_trace
4
Cx_fdt TYPE REF TO cx_fdt.
FIELD-SYMBOLS: <la_any> TYPE any.
GET TIME STAMP FIELD lv_timestamp.
* prepare parameters here
TRY.
cl_fdt_function_process=>process(
EXPORTING iv_function_id = '0050569549411ED485FEA38316FE8F82'
iv_timestamp = lv_timestamp
iv_trace_mode = if_fdt_constants=>gc_trace_mode_lean
IMPORTING ea_result = <la_any>
eo_trace = lo_trace
CHANGING ct_name_value = lt_parameter ).
lo_lean_trace ?= lo_trace.
lo_lean_trace->set_trace_db_table(
iv_trace_db_table = 'FDT_TRACE_0200'
iv_trace_db_table_json_records = ‘FDT_TRACE_0201' ).
lo_lean_trace->save( ).
CATCH cx_fdt.
ENDTRY.
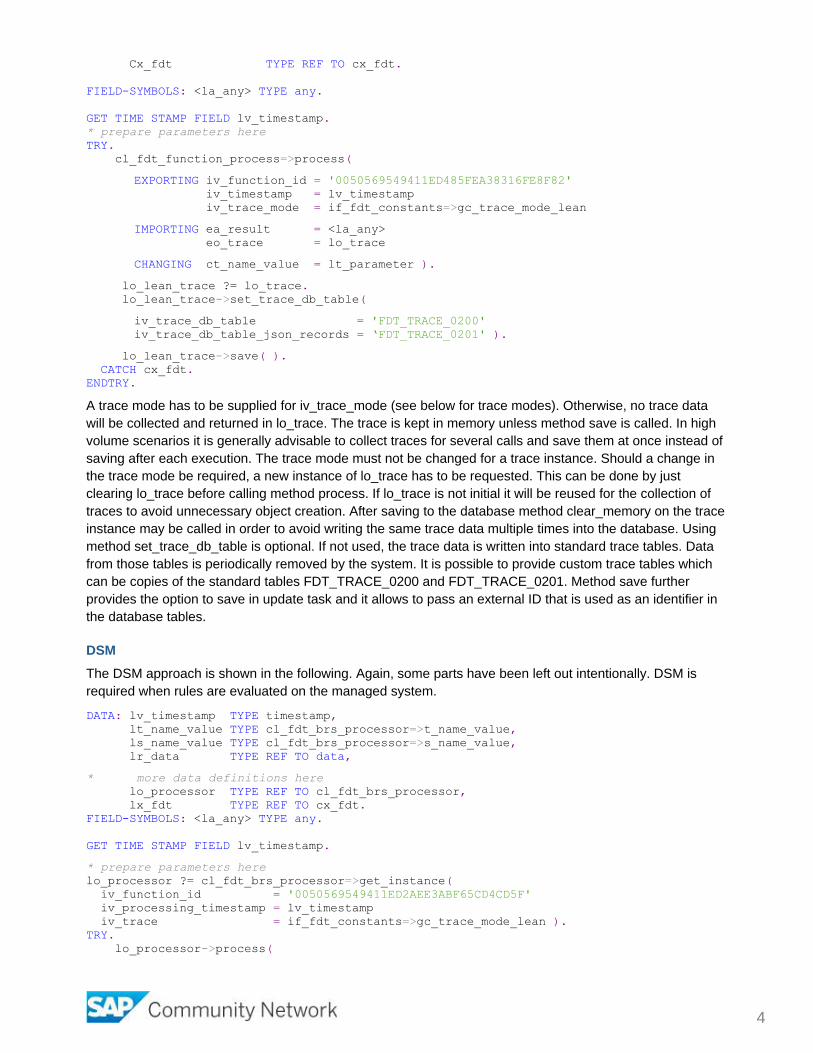
A trace mode has to be supplied for iv_trace_mode (see below for trace modes). Otherwise, no trace data
will be collected and returned in lo_trace. The trace is kept in memory unless method save is called. In high
volume scenarios it is generally advisable to collect traces for several calls and save them at once instead of
saving after each execution. The trace mode must not be changed for a trace instance. Should a change in
the trace mode be required, a new instance of lo_trace has to be requested. This can be done by just
clearing lo_trace before calling method process. If lo_trace is not initial it will be reused for the collection of
traces to avoid unnecessary object creation. After saving to the database method clear_memory on the trace
instance may be called in order to avoid writing the same trace data multiple times into the database. Using
method set_trace_db_table is optional. If not used, the trace data is written into standard trace tables. Data
from those tables is periodically removed by the system. It is possible to provide custom trace tables which
can be copies of the standard tables FDT_TRACE_0200 and FDT_TRACE_0201. Method save further
provides the option to save in update task and it allows to pass an external ID that is used as an identifier in
the database tables.
DSM
The DSM approach is shown in the following. Again, some parts have been left out intentionally. DSM is
required when rules are evaluated on the managed system.
DATA: lv_timestamp TYPE timestamp,
lt_name_value TYPE cl_fdt_brs_processor=>t_name_value,
ls_name_value TYPE cl_fdt_brs_processor=>s_name_value,
lr_data TYPE REF TO data,
* more data definitions here
lo_processor TYPE REF TO cl_fdt_brs_processor,
lx_fdt TYPE REF TO cx_fdt.
FIELD-SYMBOLS: <la_any> TYPE any.
GET TIME STAMP FIELD lv_timestamp.
* prepare parameters here
lo_processor ?= cl_fdt_brs_processor=>get_instance(
iv_function_id = '0050569549411ED2AEE3ABF65CD4CD5F'
iv_processing_timestamp = lv_timestamp
iv_trace = if_fdt_constants=>gc_trace_mode_lean ).
TRY.
lo_processor->process(
5
EXPORTING iv_data_format = cl_fdt_brs_processor=>gc_data_format_abap
it_name_value = lt_name_value
IMPORTING ea_result = <la_any> ).
lo_processor->save_trace( ).
CATCH cx_fdt INTO lx_fdt.
ENDTRY.
Again, a trace mode has to be supplied. However, in the DSM API there is no trace instance to deal with.
Rather, trace data is collected in lo_processor. Unless method save_trace is called no data is written into the
database. lo_processor provides a method for retrieving trace data from memory (get_trace_buffer) and for
clearing the trace buffer (clear_trace_buffer) in order to avoid saving the same data multiple times into the
database in high volume scenarios. In such scenarios it is advisable to collect traces for multiple calls and
not to save after each call. Method save_trace further provides the option to save in update task and it allows
to pass an external ID that is used as an identifier in the database tables.
A flexible switch with SET/GET parameters
Sometimes customers only want to switch on traces for single users and for a limited period in time.
DSM/BRFplus does not provide a user switch or similar but this can be easily implemented in a customer
project with help of SET/GET parameters in a few steps.
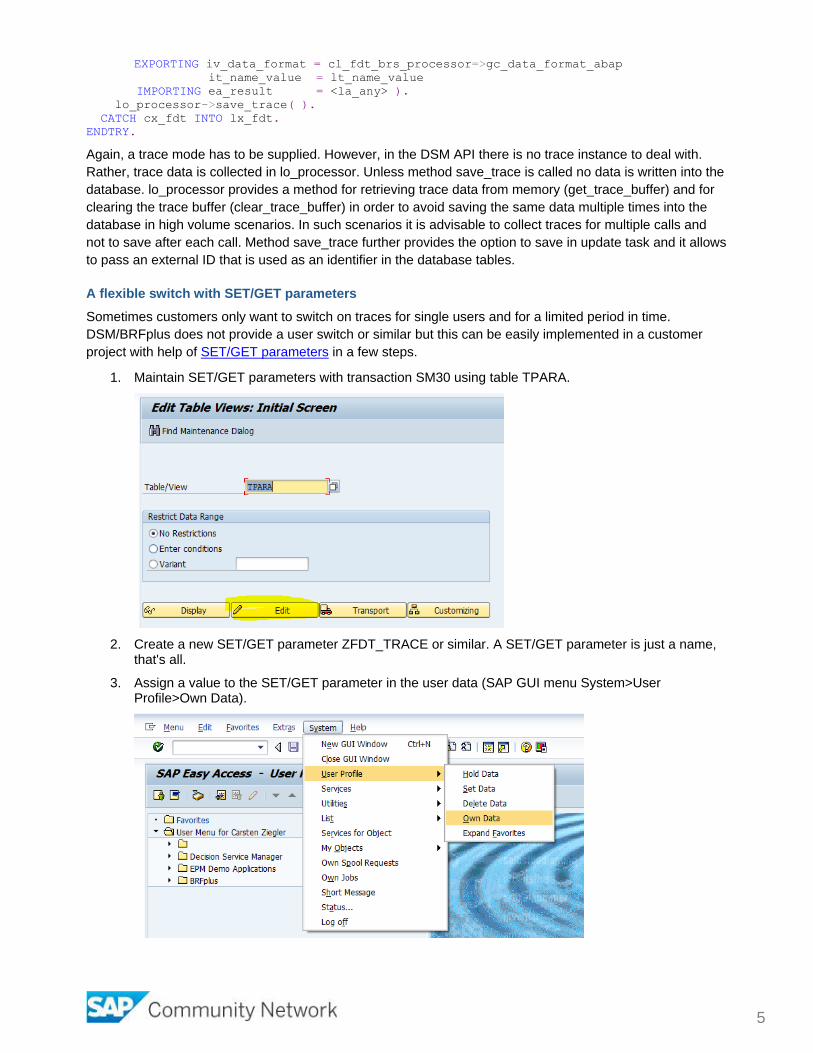
1. Maintain SET/GET parameters with transaction SM30 using table TPARA.
2. Create a new SET/GET parameter ZFDT_TRACE or similar. A SET/GET parameter is just a name, that's all.
3. Assign a value to the SET/GET parameter in the user data (SAP GUI menu System>User Profile>Own Data).
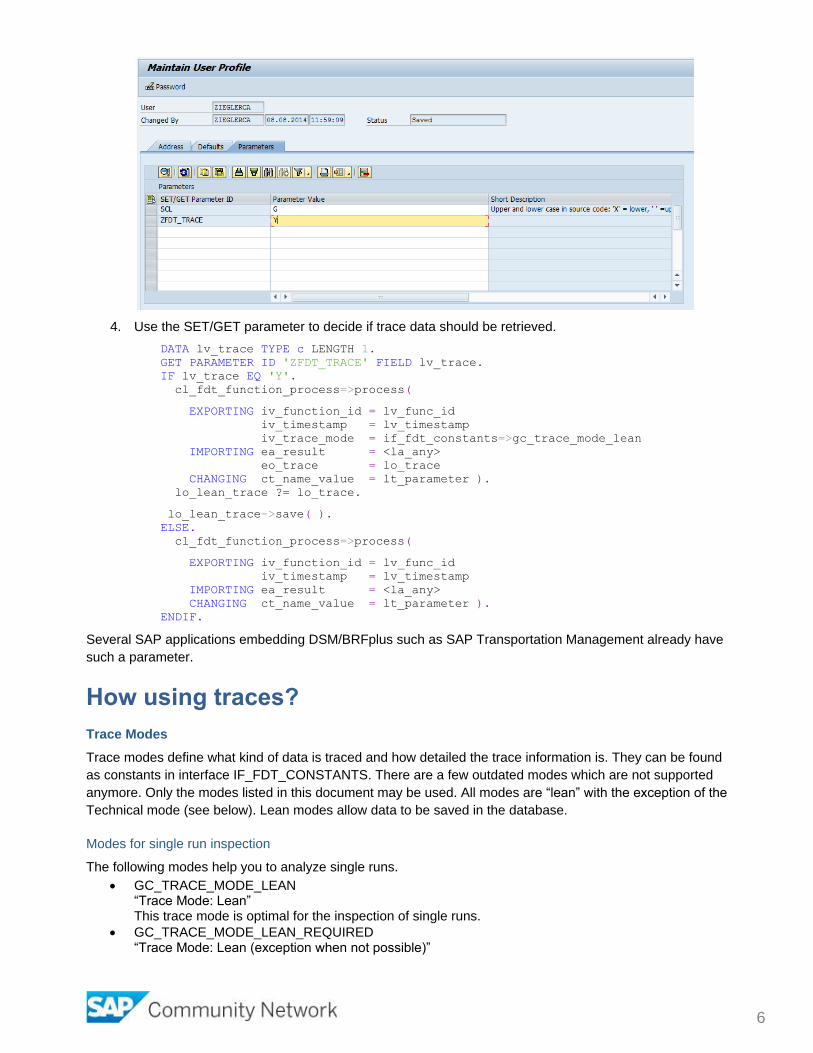
6
4. Use the SET/GET parameter to decide if trace data should be retrieved.
DATA lv_trace TYPE c LENGTH 1.
GET PARAMETER ID 'ZFDT_TRACE' FIELD lv_trace.
IF lv_trace EQ 'Y'.
cl_fdt_function_process=>process(
EXPORTING iv_function_id = lv_func_id
iv_timestamp = lv_timestamp
iv_trace_mode = if_fdt_constants=>gc_trace_mode_lean
IMPORTING ea_result = <la_any>
eo_trace = lo_trace
CHANGING ct_name_value = lt_parameter ).
lo_lean_trace ?= lo_trace.
lo_lean_trace->save( ).
ELSE.
cl_fdt_function_process=>process(
EXPORTING iv_function_id = lv_func_id
iv_timestamp = lv_timestamp
IMPORTING ea_result = <la_any>
CHANGING ct_name_value = lt_parameter ).
ENDIF.
Several SAP applications embedding DSM/BRFplus such as SAP Transportation Management already have
such a parameter.
How using traces?
Trace Modes
Trace modes define what kind of data is traced and how detailed the trace information is. They can be found
as constants in interface IF_FDT_CONSTANTS. There are a few outdated modes which are not supported
anymore. Only the modes listed in this document may be used. All modes are “lean” with the exception of the
Technical mode (see below). Lean modes allow data to be saved in the database.
Modes for single run inspection
The following modes help you to analyze single runs.
GC_TRACE_MODE_LEAN “Trace Mode: Lean” This trace mode is optimal for the inspection of single runs.
GC_TRACE_MODE_LEAN_REQUIRED “Trace Mode: Lean (exception when not possible)”

7
This trace mode is a specialized lean mode. It works like the previous mode but raises an exception when parts of the business rules want to switch to interpretation mode (e.g. dynamic expression, expressions that do not support code generation).
GC_TRACE_MODE_TECHNICAL “Trace Mode: Technical (interpretation only)” This mode is used in simulation (interpretation mode) and in the rules debugger. It is extremely detailed. The mode cannot be used with the APIs shown above but only with a special invocation mode (IF_FDT_FUNCTION~PROCESS) that is used for simulation and debugging. It generally should not be used by customers. Its data cannot be persisted into the database.
Modes for analytics
The following modes are used for rule analytics over many runs. They differ in the level of detail added to the trace. These modes can also be used to inspect single executions. However, the level of detail shown will greatly differ.
GC_TRACE_MODE_ANALYTICS_L0 “Trace Mode: Function , Context, Result”
GC_TRACE_MODE_ANALYTICS_L1 “Trace Mode: Fct., Context, Result, Expr., no DOBJ Tab values”
GC_TRACE_MODE_ANALYTICS_L2 “Trace Mode: Fct., Context, Res., Expr., DOBJ Tab 10 lines”
GC_TRACE_MODE_ANALYTICS_L3 “Trace Mode: Fct., Context, Res., Expr., DOBJ Tab 100 lines”
GC_TRACE_MODE_ANALYTICS_L4 “Trace Mode: Fct., Context, Res., Expr., DOBJ Tab 1000 lines”
GC_TRACE_MODE_ANALYTICS_L5 “Trace Mode: Fct., Context, Res., Expr., DOBJ Tab completely”
Database
Trace data can be analyzed right after execution of the rules. In most cases, however, the trace data is
persisted in the database and analyzed at a later point in time. Therefore, two tables are used if no other
tables are provided (see above).
FDT_TRACE_0200 contains administrative data and FDT_TRACE_0201 contains the trace records.
8
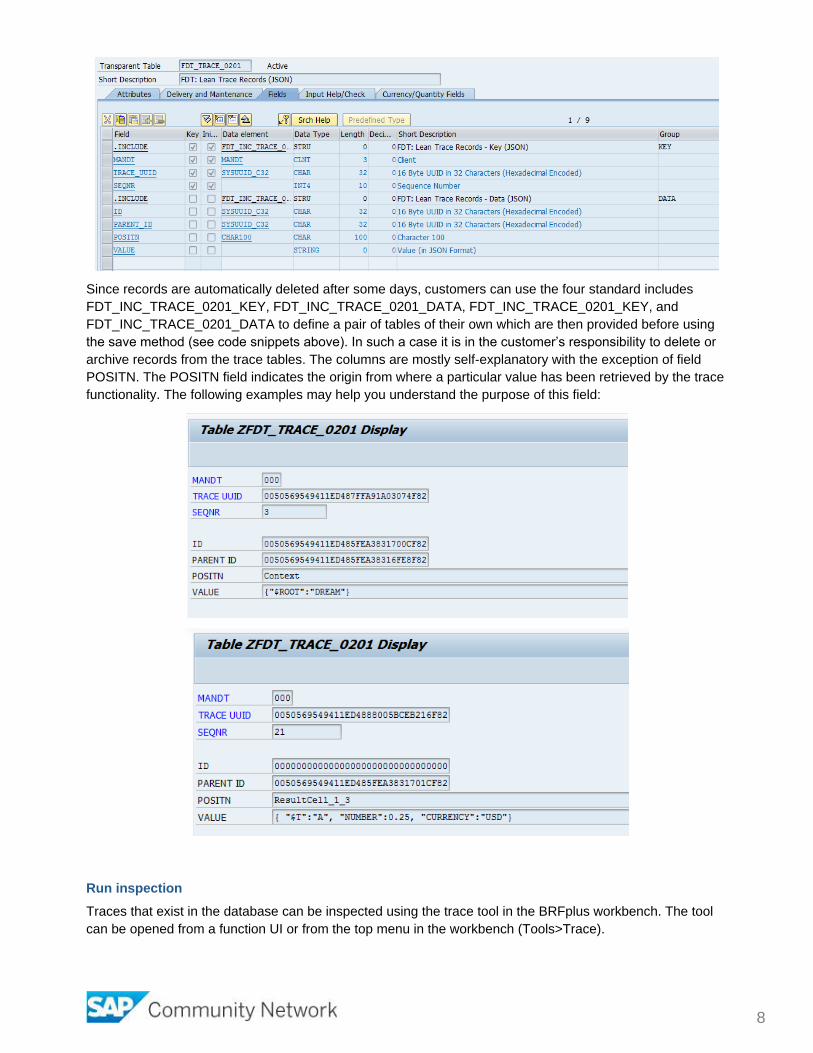
Since records are automatically deleted after some days, customers can use the four standard includes
FDT_INC_TRACE_0201_KEY, FDT_INC_TRACE_0201_DATA, FDT_INC_TRACE_0201_KEY, and
FDT_INC_TRACE_0201_DATA to define a pair of tables of their own which are then provided before using
the save method (see code snippets above). In such a case it is in the customer’s responsibility to delete or
archive records from the trace tables. The columns are mostly self-explanatory with the exception of field
POSITN. The POSITN field indicates the origin from where a particular value has been retrieved by the trace
functionality. The following examples may help you understand the purpose of this field:
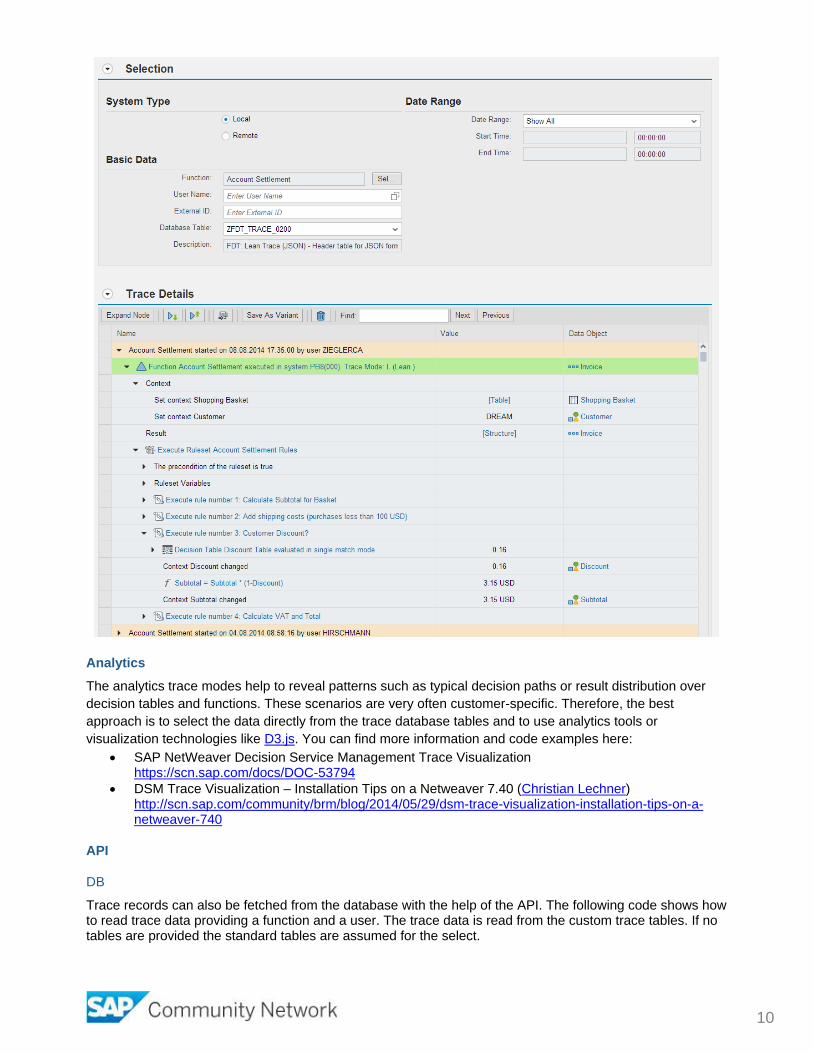
Run inspection
Traces that exist in the database can be inspected using the trace tool in the BRFplus workbench. The tool
can be opened from a function UI or from the top menu in the workbench (Tools>Trace).

9
It is possible to inspect local traces and remote traces from managed systems. Remote traces are only
supported when DSM is installed. By default the list is sorted chronologically descending (i.e., latest results
first) and each trace can be expanded to dive into the details. The trace tool does not only work for the
BRFplus standard tables but also for custom tables when the custom tables reuse the standard includes as
described above. It is also possible to save traces for one function in different database tables. In the
selection area the relevant database table has to be chosen.
10
Analytics
The analytics trace modes help to reveal patterns such as typical decision paths or result distribution over
decision tables and functions. These scenarios are very often customer-specific. Therefore, the best
approach is to select the data directly from the trace database tables and to use analytics tools or
visualization technologies like D3.js. You can find more information and code examples here:
SAP NetWeaver Decision Service Management Trace Visualization https://scn.sap.com/docs/DOC-53794
DSM Trace Visualization – Installation Tips on a Netweaver 7.40 (Christian Lechner) http://scn.sap.com/community/brm/blog/2014/05/29/dsm-trace-visualization-installation-tips-on-a-netweaver-740
API
DB
Trace records can also be fetched from the database with the help of the API. The following code shows how to read trace data providing a function and a user. The trace data is read from the custom trace tables. If no tables are provided the standard tables are assumed for the select.

11
DATA: lo_ltrace TYPE REF TO if_fdt_lean_trace,
lt_trace_header TYPE if_fdt_lean_trace=>t_header,
lt_trace_record TYPE if_fdt_lean_trace=>ts_record,
ltr_user TYPE if_fdt_trace=>tr_user,
lsr_user TYPE LINE OF if_fdt_trace=>tr_user,
ltr_fct_id TYPE if_fdt_trace=>tr_function_id,
lsr_fct_id TYPE LINE OF if_fdt_trace=>tr_function_id.
lo_ltrace ?= cl_fdt_factory=>get_instance( )->get_trace(
if_fdt_constants=>gc_trace_mode_lean ). ”!!! default is technical, not what is needed
lo_ltrace->set_trace_db_table(
iv_trace_db_table = 'ZFDT_TRACE_0200'
iv_trace_db_table_json_records = 'ZFDT_TRACE_0201' ).
lsr_user-option = 'EQ'.
lsr_user-sign = 'I'.
lsr_user-low = 'ZIEGLERCA'.
INSERT lsr_user INTO TABLE ltr_user.
lsr_fct_id-option = 'EQ'.
lsr_fct_id-sign = 'I'.
lsr_fct_id-low = '0050569549411ED485FEA38316FE8F82'.
INSERT lsr_fct_id INTO TABLE ltr_fct_id.
lo_ltrace->read(
EXPORTING
* itr_trace_uuid = " Range of Trace UUIDs
itr_user = ltr_user
itr_function_id = ltr_fct_id
* itr_external_id = " Range of External ID for Trace
* itr_trace_ref_uuid = " Range of Parent Trace UUID. Used to read child traces
* itr_trace_start = " Range of Trace Starting Timestamp
* itr_trace_end = " Range of Trace Ending Timestamp
iv_deep = abap_false "do not read trace for nested functions
iv_auth_check = abap_false "no auth check required
iv_memory_only = abap_false "read from DB
IMPORTING
et_trace_header = lt_trace_header
ets_trace_record = lt_trace_record ).
Memory
The API allows you also to use the trace data directly after the execution of the rules without persisting them to the database. Trace data is collected in attributes MT_HEADER and MTS_RECORD of the trace instance.
cl_fdt_function_process=>process(
EXPORTING iv_function_id = '0050569549411ED485FEA38316FE8F82'
iv_timestamp = lv_timestamp
iv_trace_mode = if_fdt_constants=>gc_trace_mode_lean
IMPORTING ea_result = <la_any>
eo_trace = lo_trace
CHANGING ct_name_value = lt_parameter ).
lo_lean_trace ?= lo_trace.
FIELD-SYMBOLS <ls_record> LIKE LINE OF lo_lean_trace->ms_record.
READ TABLE lo_lean_trace->ms_record ASSIGNING <ls_record> WITH KEY id = '123...'.
IF sy-subrc EQ 0.
"do something
ENDIF.
Assessment The ability to trace the execution of business rules has been part of BRFplus since its very beginning.
However, it took several iterations to find and implement the solution described in this document. In a first
12
attempt the trace was written to a CBLOB in the database as XML (database table FDT_TRACE_0000).
Later a cluster table was used (FDT_TRACE_0100) which was excellent in terms of performance when
saving the data. In both cases reading the data was only possible through an ABAP object (IF_FDT_TRACE)
as the cluster or XML data had to be prepared for consumption by applications. For analytical evaluations, it
used to be necessary to process and convert the data in batch and to write it into another table before the
data could be used by analytics tools. This process was not only time-consuming but also error-prone. To
understand the data it was necessary to read metadata for BRFplus objects like expressions or data objects.
To make things even worse, it was necessary to retrieve the metadata for the timestamp when the trace data
was created. Therefore using trace required objects to be versioned.
The recent improvements provide many advantages:
1. Trace modes help define the level of details and therefore also the amount of data recorded
2. Readable values in the database avoid conversion steps and therefore allow easy consumption with excellent performance by any tools through SQL
3. No versioning required anymore
4. Improved output in the trace UI
Related Content
SAP Decision Service Management
SAP NetWeaver Decision Service Management Trace Visualization
DSM Trace Visualization – Installation Tips on a Netweaver 7.40

13
Copyright
© 2014 SAP SE SE or an SAP SE affiliate company. All rights reserved.
No part of this publication may be reproduced or transmitted in any form or for any purpose without the express permission of SAP SE. The information contained herein may be changed without prior notice.
Some software products marketed by SAP SE and its distributors contain proprietary software components of other software vendors. National product specifications may vary.
These materials are provided by SAP SE and its affiliated companies (“SAP SE Group”) for informational purposes only, without representation or warranty of any kind, and SAP SE Group shall not be liable for errors or omissions with respect to the materials. The only warranties for SAP SE Group products and services are those that are set forth in the express warranty statements accompanying such products and services, if any. Nothing herein should be construed as constituting an additional warranty.
SAP SE and other SAP SE products and services mentioned herein as well as their respective logos are trademarks or registered trademarks of SAP SE in Germany and other countries.
Please see http://www.sap.com/corporate-en/legal/copyright/index.epx#trademark for additional trademark information and notices.