trace metal composition of particulate matter of … metal composition of particulate matter of the...
TRANSCRIPT
Available online at www.sciencedirect.com
1 (2008) 63–76www.elsevier.com/locate/marchem
Marine Chemistry 11
Trace metal composition of particulate matter of the Danube Riverand Turkish rivers draining into the Black Sea
Oğuz Yiğiterhan a,⁎, James W. Murray b,1
a Institute of Marine Sciences, Middle East Technical University, PK: 28, Erdemli, Mersin, 33731, Turkeyb School of Oceanography, Box 355351, University of Washington, Seattle, WA, 98195-5351, USA
Received 21 June 2006; received in revised form 22 April 2007; accepted 25 June 2007Available online 6 July 2007
Abstract
We determined the composition of particles from several rivers entering the Black Sea as part of a broader study of thecomposition of suspended matter and sediments in the Black Sea. Suspended matter and surface sediment samples were collectedfrom the Danube River draining from Europe and from four Turkish rivers (Sakarya, Yenice (Filyos), Kızılırmak and YeşilırmakRivers) in Anatolia. All samples were digested and analyzed by inductively coupled plasma-mass spectrometry and atomicabsorption spectrometry (flame and graphite furnace) instruments. The elements analyzed included Al, Ti, V, Cr, Mn, Fe, Co, Cu,Zn, Mo, Ag, Cd, Ba, Pb and U. The concentrations were compared as solid phase concentrations (ppm) and as Metal to Al (Me/Al)ratios. The compositions of the particulate matter data from Turkish rivers and surface sediment from the Danube River were verysimilar to each other and the average for the world's rivers. Both had slightly higher concentrations than global average crust. Asuspended matter sample from the Danube River had elevated concentrations for some elements (Ag, Pb, Zn, Cd, Cu and Mn) thatwere probably due to anthropogenic contamination suggesting that some hot spots may exist in the Danube that need to be studiedmore thoroughly. We recommend that the best choice for subtracting the terrigenous component from Black Sea particulate andsediment samples is the average of the Turkish rivers suspended matter and Danube River sediment samples.© 2007 Elsevier B.V. All rights reserved.
Keywords: Black Sea; Riverine particulate matter; Trace elements; Heavy metals; Lithogenic end member
1. Introduction
River runoff is one of the main processes deliveringsolutes and particles to coastal and marginal seas. Themajor elements in riverine particulates have been well
⁎ Corresponding author. Present address: Department of MarineSciences, University of Connecticut-Avery Point Campus, 1080Shennecossett Road, Groton, CT, 06340, USA. Tel.: +1 860 4059071; fax: +1 860 405 9153.
E-mail addresses: [email protected] (O. Yiğiterhan),[email protected] (J.W. Murray).1 Tel.: +1 206 543 4730; fax: +1 206 685 3351.
0304-4203/$ - see front matter © 2007 Elsevier B.V. All rights reserved.doi:10.1016/j.marchem.2007.06.019
studied (e.g. Canfield, 1997). Particle chemistry appearsto vary with average rates of runoff, with high runoffrivers transporting the most heavily altered particles.There have been fewer studies of trace elements in riverparticulates, but both natural and anthropogenic sourcescan be important. Many trace metals adsorb strongly onparticles (Balistrieri et al., 1981; Balistrieri and Murray,1981) and thus they are preferentially associated withparticulate matter in rivers (e.g. Guieu et al., 1998; Guieuand Martin, 2002).
Particles from rivers are dominated by aluminosil-icate material that is relatively unreactive. Al and Ti are
64 O. Yiğiterhan, J.W. Murray / Marine Chemistry 111 (2008) 63–76
normally considered to be conserved in the particulatephase during chemical weathering. In order to identifygeochemical anomalies for trace elements arising fromredox processes, researchers either normalize thecomposition to Al or Ti or else subtract the lithogeniccomponent from the total concentration using Al or Tias reference elements. It is usually assumed that litho-genic particles are the source of Al and Ti and have thecomposition of global average shale or crust. However,the best approach is to determine the composition ofterrigenous particles with local samples because con-tinental rocks can vary regionally (e.g. Klump et al.,2000).
The Black Sea is a large depositional basin forrivers discharging waters from Southeastern Europe,CaucasianMountains and Northern Anatolia (Algan et al.,1999). The watershed includes 17 different countries. Thetotal fresh water input to the Black Sea from rivers is353 km3y−1. The five largest rivers are the Danube(203 km3y−1), Dneiper (54 km3y−1), Don (28 km3y−1),Kuban (13 km3y−1) and Dniesta (9.3 km3y−1) (Shimkusand Trimonis, 1974). There are also 28 km3y−1 of freshwater contributions from a large number of smaller rivers
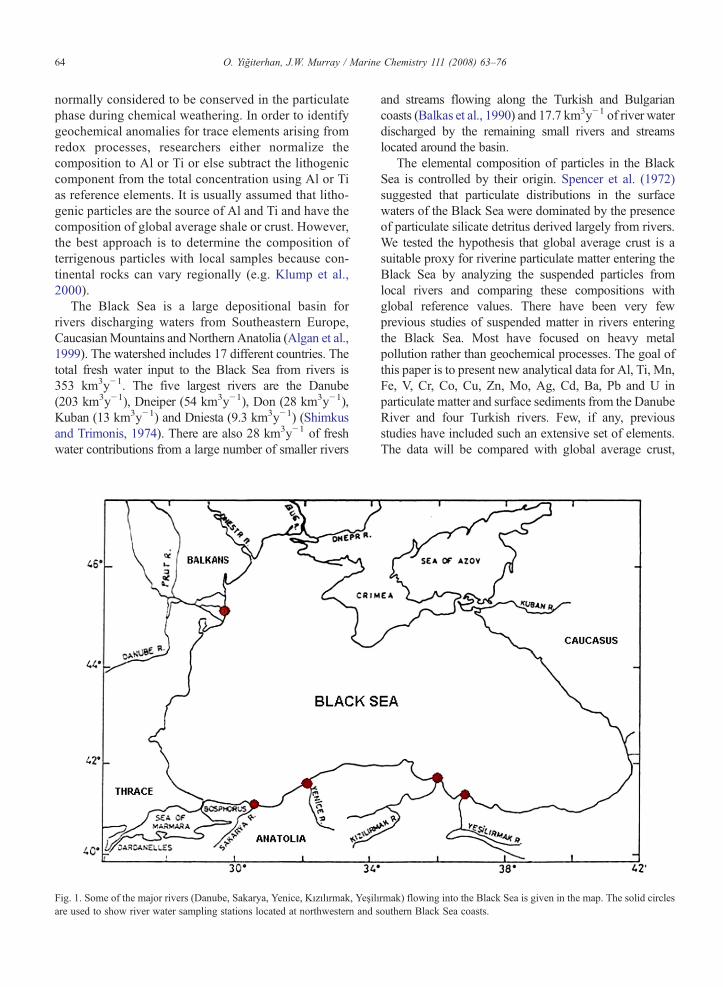
Fig. 1. Some of the major rivers (Danube, Sakarya, Yenice, Kızılırmak, Yeşilare used to show river water sampling stations located at northwestern and s
and streams flowing along the Turkish and Bulgariancoasts (Balkas et al., 1990) and 17.7 km3y−1 of river waterdischarged by the remaining small rivers and streamslocated around the basin.
The elemental composition of particles in the BlackSea is controlled by their origin. Spencer et al. (1972)suggested that particulate distributions in the surfacewaters of the Black Sea were dominated by the presenceof particulate silicate detritus derived largely from rivers.We tested the hypothesis that global average crust is asuitable proxy for riverine particulate matter entering theBlack Sea by analyzing the suspended particles fromlocal rivers and comparing these compositions withglobal reference values. There have been very fewprevious studies of suspended matter in rivers enteringthe Black Sea. Most have focused on heavy metalpollution rather than geochemical processes. The goal ofthis paper is to present new analytical data for Al, Ti, Mn,Fe, V, Cr, Co, Cu, Zn, Mo, Ag, Cd, Ba, Pb and U inparticulate matter and surface sediments from the DanubeRiver and four Turkish rivers. Few, if any, previousstudies have included such an extensive set of elements.The data will be compared with global average crust,
ırmak) flowing into the Black Sea is given in the map. The solid circlesouthern Black Sea coasts.
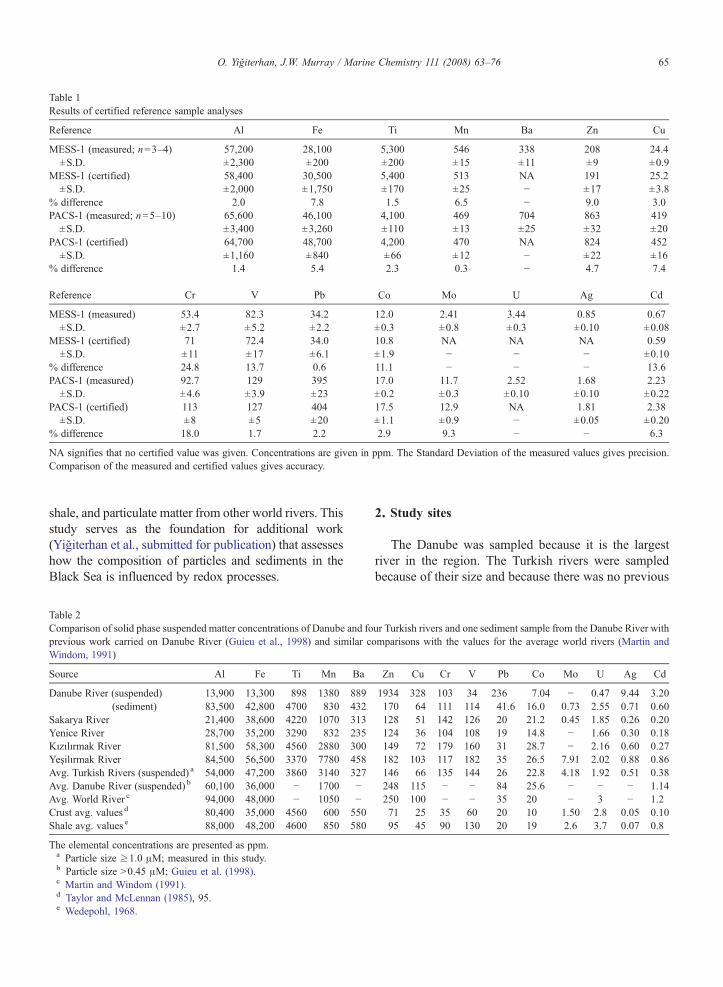
Table 1Results of certified reference sample analyses
Reference Al Fe Ti Mn Ba Zn Cu
MESS-1 (measured; n=3–4) 57,200 28,100 5,300 546 338 208 24.4±S.D. ±2,300 ±200 ±200 ±15 ±11 ±9 ±0.9
MESS-1 (certified) 58,400 30,500 5,400 513 NA 191 25.2±S.D. ±2,000 ±1,750 ±170 ±25 − ±17 ±3.8
% difference 2.0 7.8 1.5 6.5 − 9.0 3.0PACS-1 (measured; n=5–10) 65,600 46,100 4,100 469 704 863 419
±S.D. ±3,400 ±3,260 ±110 ±13 ±25 ±32 ±20PACS-1 (certified) 64,700 48,700 4,200 470 NA 824 452
±S.D. ±1,160 ±840 ±66 ±12 − ±22 ±16% difference 1.4 5.4 2.3 0.3 − 4.7 7.4
Reference Cr V Pb Co Mo U Ag Cd
MESS-1 (measured) 53.4 82.3 34.2 12.0 2.41 3.44 0.85 0.67±S.D. ±2.7 ±5.2 ±2.2 ±0.3 ±0.8 ±0.3 ±0.10 ±0.08
MESS-1 (certified) 71 72.4 34.0 10.8 NA NA NA 0.59±S.D. ±11 ±17 ±6.1 ±1.9 − − − ±0.10
% difference 24.8 13.7 0.6 11.1 − − − 13.6PACS-1 (measured) 92.7 129 395 17.0 11.7 2.52 1.68 2.23
±S.D. ±4.6 ±3.9 ±23 ±0.2 ±0.3 ±0.10 ±0.10 ±0.22PACS-1 (certified) 113 127 404 17.5 12.9 NA 1.81 2.38
±S.D. ±8 ±5 ±20 ±1.1 ±0.9 − ±0.05 ±0.20% difference 18.0 1.7 2.2 2.9 9.3 − − 6.3
NA signifies that no certified value was given. Concentrations are given in ppm. The Standard Deviation of the measured values gives precision.Comparison of the measured and certified values gives accuracy.
65O. Yiğiterhan, J.W. Murray / Marine Chemistry 111 (2008) 63–76
shale, and particulate matter from other world rivers. Thisstudy serves as the foundation for additional work(Yiğiterhan et al., submitted for publication) that assesseshow the composition of particles and sediments in theBlack Sea is influenced by redox processes.
Table 2Comparison of solid phase suspended matter concentrations of Danube and foprevious work carried on Danube River (Guieu et al., 1998) and similar cWindom, 1991)
Source Al Fe Ti Mn Ba
Danube River (suspended) 13,900 13,300 898 1380 889(sediment) 83,500 42,800 4700 830 432
Sakarya River 21,400 38,600 4220 1070 313Yenice River 28,700 35,200 3290 832 235Kızılırmak River 81,500 58,300 4560 2880 300Yeşilırmak River 84,500 56,500 3370 7780 458Avg. Turkish Rivers (suspended) a 54,000 47,200 3860 3140 327Avg. Danube River (suspended) b 60,100 36,000 − 1700 −Avg. World River c 94,000 48,000 − 1050 −Crust avg. values d 80,400 35,000 4560 600 550Shale avg. values e 88,000 48,200 4600 850 580
The elemental concentrations are presented as ppm.a Particle size ≥1.0 μM; measured in this study.b Particle size N0.45 μM; Guieu et al. (1998).c Martin and Windom (1991).d Taylor and McLennan (1985), 95.e Wedepohl, 1968.
2. Study sites
The Danube was sampled because it is the largestriver in the region. The Turkish rivers were sampledbecause of their size and because there was no previous
ur Turkish rivers and one sediment sample from the Danube River withomparisons with the values for the average world rivers (Martin and
Zn Cu Cr V Pb Co Mo U Ag Cd
1934 328 103 34 236 7.04 − 0.47 9.44 3.20170 64 111 114 41.6 16.0 0.73 2.55 0.71 0.60128 51 142 126 20 21.2 0.45 1.85 0.26 0.20124 36 104 108 19 14.8 − 1.66 0.30 0.18149 72 179 160 31 28.7 − 2.16 0.60 0.27182 103 117 182 35 26.5 7.91 2.02 0.88 0.86146 66 135 144 26 22.8 4.18 1.92 0.51 0.38248 115 − − 84 25.6 − − − 1.14250 100 − − 35 20 − 3 − 1.271 25 35 60 20 10 1.50 2.8 0.05 0.1095 45 90 130 20 19 2.6 3.7 0.07 0.8

Fig. 2. Log Me/Al ratios in particulate matter samples from Turkish rivers and the Danube River. The dashed line is average crustal Me/Al ratio.
66O.Yiğiterhan,
J.W.Murray
/Marine
Chem
istry111
(2008)63–76

Fig.2(contin
ued).
67O. Yiğiterhan, J.W. Murray / Marine Chemistry 111 (2008) 63–76

Fig. 3. The concentration of the Danube River and Turkish rivers versus the average Earth's crust (Taylor and McLennan, 1985, 1995) on log–logscales. The Turkish rivers are given individually and the solid dots are the average of the four rivers. Eq. for Avg. of Turkish river water vs. CrustT&M
line is: ln(Y)=0.88⁎ ln(X)+1.15, R2=0.97. Eq. for Danube suspended matter vs. CrustT&M line is: ln(Y)=0.64⁎ ln(X)+2.42, R2=0.73. Eq. forDanube surface sediment vs. CrustT&M line is: ln(Y)=0.89⁎ ln(X)+1.04, R2=0.96.
68 O. Yiğiterhan, J.W. Murray / Marine Chemistry 111 (2008) 63–76
data for riverine particulate matter from this region(Fig. 1).
Danube River is the second longest river in Europe(after the Volga) with a length of 2800 km and acatchment area of 817,000 km2. It represents 64% of theriver runoff to the Black Sea and 80% of the runoffentering the northwestern Black Sea (Popa, 1993). Itprovides essential water resources for a population ofover 70 million people living in the eight countriesalong it's course and six additional countries in theextended catchment area (Literathy and Laszlo, 1995).With such a large population and industrial activity thereare many potential sources of pollution and thus theDanube represents the most significant source of river-borne pollution flowing into the Black Sea. Anthropo-
genic nutrients transported by the Danube are known tobe the major reason for eutrophication and pollution onthe northwestern shelf area (Mee, 1992; Windom et al.,1998; Lancelot et al., 2002).
There are two large dams on the lower Danube (IronGate I and II) that have provided the opportunity to studythe environmental impacts of large dams on river dischargeand coastal eutrophication (Cociasu et al., 1996; Humborget al., 1997; Teodoru et al., 2006). These dams havereduced sediment discharge to 30–40% of it's historicalvalue (Panin and Jipa, 2002; Teodoru et al., 2006).
The Sakarya River is the largest river of northwestAnatolia (length is 824 km) and the third longest river ofTurkey with a drainage basin area of 53,800 km2.Although, two of the largest hydroelectric power plants

Fig. 4. TheMe/Al ratios of the Danube River and Turkish rivers versus the ratios in the average Earth's crust from Taylor andMcLennan (1985, 1995)on Log–Log scales. The Turkish rivers are given individually and the solid dot is the average of the four rivers. The legend lists the letter symbols thatare used for the elements. The 1:1 relationship is given as a solid dark line. The lines represent the best power fits. Eq. for Avg. of Turkish river watervs. CrustT&M line is: ln(Y)=0.91⁎ ln(X)+0.60, R2=0.97. Eq. for Danube suspended matter vs. CrustT&M line is: ln(Y)=0.64⁎ ln(X)+0.09, R2=0.67.Eq. for Danube surface sediment vs. CrustT&M line is: ln(Y)=0.87⁎ ln(X)−0.40, R2=0.95.
69O. Yiğiterhan, J.W. Murray / Marine Chemistry 111 (2008) 63–76
in Turkey exist on this river, it's waters still have largeparticulate loads that are discharged into the surfacewaters of the southwestern Black Sea from the east ofthe Bosporus.
The Yenice River (288 km long) is called by manydifferent names (Ulusu, Gerede Suyu, Soğanlı Çayı,Filyos Irmağı etc.) from it's starting point until it flowsinto the southwestern Black Sea. The Yenice Riverconsists of several branches that combine in theGökçebey–Zonguldak basin. From that point, the riverflows 30 km to the north where it reaches the Black Seawith an enormous particulate load.
The Kızılırmak River originates from central Anato-lia and is the longest river of Turkey (1355 km). Thereare several dams on the river and the suspended matterconcentrations are low. The river enters the southernBlack Sea near Cape Bafa.
The Yeşilırmak River is fairly long (519 km inlength) with a drainage basin area of 2300 km2. It alsohas low suspended matter concentrations and flows intothe southern Black Sea east of Samsun.
Both the Danube River and the rivers flowing fromthe northern coast of Turkey, flow through veryheterogeneous geological terrains. The mineralogical

70 O. Yiğiterhan, J.W. Murray / Marine Chemistry 111 (2008) 63–76
content of the Danube originates from 20–25 differenttypes of igneous, sedimentary and metamorphic rock(Muller and Stoffers, 1974; Bogardi, 1978). TheDanube sediments are mostly composed of quartz,limestone, and crystalline shale. In addition, thesediments contain considerable amounts of amphi-boles, pyroxene and other minerals of granitic origin(Literathy et al., 1994). The rocks along the northerncoast of Turkey are also a mixture of various kinds ofcrustal rock in the Pontic Mountains, which extend allalong the southern coast of the Black Sea (Muller and
Fig. 5. The Me/Al ratios of suspended particulate metals in the Danube Rivrivers from Martin and Windom (1991). Log–Log scales. The Turkish riverivers. The legend lists the letter symbols that are used for the elements. Thother lines represent the best fit equations of: Eq. for Avg. Turkish river watfor Danube suspended matter vs. world's rivers water is: ln(Y) =0.96⁎ ln(X)water is: ln(Y) =1.02⁎ ln(X)−0.03, R2=0.99.
Stoffers, 1974; Algan et al., 1999). The source rocks inTurkey contain less carbonates then those for theDanube. The western region of the coast between theSakarya and Kızılırmak Rivers is mainly composed offlysch deposits of Cretaceous and Eocene ages (Alganet al., 1999). The Pontic Mountains, which extendalong the northern coast of Turkey, rise sharply and donot allow development of large cities along the coast.The fairly small population lives in small settlementsrather than large cities and the region is not heavilyindustrialized.
er and Turkish rivers versus the Me/Al ratios in the average world'srs are given individually and the solid dot is the average of the foure 1:1 relationship is given as a solid dark line through the origin. Theer vs. world's rivers water is: ln(Y) =1.10⁎ ln(X) +1.24, R2=0.98. Eq.+1.90, R2=0.82. Eq. for Danube surface sediment vs. world's rivers
71O. Yiğiterhan, J.W. Murray / Marine Chemistry 111 (2008) 63–76
3. Sampling
Sampling location of the Danube River Delta in July,2002 was on the Sulina branch in Romania (Fig. 1) at45° 05′ N and 29 41′ E, about 8 km before entering theBlack Sea. The Sulina branch is the smallest of the threemain tributaries in the Danube Delta. The water at thissite was totally fresh. Water samples were collected byhand as far from shore as possible in large acid-washedpolyethylene carboys and transported quickly to theInstitute of Marine Research in Constantza, Romania.Suspended matter samples were filtered on QMA filters(25 mm diameter, 1 μm pore size) using an acid rinsedplexiglass filter holder with low vacuum filtration. Atotal of 12 QMA filters were collected. The volumesfiltered ranged from 0.5 to 2.1 L. A surface sedimentsample (0–1 cm) was collected at the same location andstored in a clean zip-lock plastic bag.
Because of their remote location and limited access,sampling of the four Turkish rivers was done in mid-channel, either by hand from the side of a bridge or byfoot when the water was shallow enough (after Canfield,1997). We sampled from sites where significant localbank erosion was not evident. Samples were collectedusing an acid cleaned plastic bucket and transferredpromptly to large acid-washed carboys. Samples werecollected in April, 2002, when the water level washighest due to snow melt and spring rain. Priority wasgiven to sampling as far as possible from point pollutionsources. Well-mixed areas close to outflow points of rivermouths were preferred. A mobile closed-system filtrationsystem, based on vacuum filtration, was used to filterthese samples in local hotels soon after collection.Samples were filtered through 142 mm diameter QMAfilters (∼1 μm pore size) in an acid-washed plexiglassfilter holder. The volumes filtered ranged from 5 to 10 Lfor the Sakarya to 22 to 67 L for the Yeşilırmak. Thefilters were folded and stored in clean zip-lock plasticbags until analyses. A total of sixteen samples werecollected and eight of these were analyzed in this study.
QMA (quartz) filters were cut from rectangular sheetsusing a stainless steel punch. Extensive studies of the filterblanks were conducted (Yigiterhan, 2005). These filterswere usedwithout pre-cleaning due to the large particulateload of river water and the large filtration capacity ofQMA filters. These conditions resulted in sample to blankratios much higher than three for all elements shown here.
We acknowledge that one time point is not repre-sentative of the variability in the annual flux for such riversbut because there is so little data available for this regionand because our goal is to determine the composition of theparticles, rather than the concentrations or fluxes, these data
are a valuable addition. Previous studies (e.g., Kennedy,1965; Martin and Meybeck, 1978; Thomas, 1988) havesuggested that single sampling opportunities are represen-tative of individual drainage basins because of the lowvariability of the composition of riverine suspended matter.
4. Materials and methods
The particulate matter and sediment samples wereanalyzed for a suite of trace metals after microwave diges-tion in a strong acid mixture. The acid mixture used forsample digestion was prepared from 4 ml reagent grade23 M hydrofluoric acid (HF), 1 ml sub-boiled distilled16 M nitric acid (HNO3) and 1 ml sub-boiled 6 Mhydrochloric acid (HCl). Ultrapure reagent grade hydro-gen peroxide (J.T.Baker, Ultrex® Assay W/W 30%) wasadded at the end of digestion to ensure complete oxidationof organicmatter. This methodwasmodified from those ofMurray and Leinen (1993) and Breckel et al. (2005). Totaldigestion was done using high pressure Teflon bombs(Savillex®). Digested samples were taken up to 20 or 40 gfinal weights to ensure the analytical criteria that the totalamount of dissolved solids in the solutions analyzedwouldbe less than 2%.
Three different types of standards were used tocalculate concentrations. A multi-element standard wasprepared in 1% HNO3 (v/v) from 1 ppm single elementstandards to obtain concentration ranges typical of surfaceocean marine particulate material. The standards weremade at concentrations to obtain counts between 100,000to 200,000 as required for best accuracy on the InductivelyCoupled Plasma-Mass Spectrometry (ICP-MS).
A mixture of yield tracers was used for volumetriccorrection of the samples after digestion and to minimizevolumetric errors caused by evaporation or loss of sam-ples. The yield tracer was composed of 4 ppm Indium(In), Yttrium (Yt) and Terbium (Tb) and finalized to50 ppb when the digested samples were diluted to 20 mlfinal volume using 1% HNO3.
The digested filter solutions were analyzed using aPerkin Elmer Sciex ELAN 5000 ICP-MS equippedwith an AS-90 Autosampler and/or Perkin Elmer ELAN5000 Atomic Absorption Spectrophotometry (AAS) orHitachi Z-9000 AAS. An external standard curve meth-od was used for calculating concentrations. No samplematrix problem was observed for these samples.
Certified reference standards were analyzed multipletimes over the course of this research to calculate precisionand to determine accuracy (Yigiterhan, 2005). Twocertified standards, produced by National ResearchCouncil of Canada (PACS-1 andMESS-1), were analyzedto evaluate the accuracy of our analyses. Both samples

72 O. Yiğiterhan, J.W. Murray / Marine Chemistry 111 (2008) 63–76
were chosen because they had trace metal compositionssimilar to our samples. Inmost cases the averagemeasuredvalues were within the 90–95% confidence limits ofcertified values of MESS-1 and PACS-1 (Table 1). Theexception was Cr where our analyses were lower by about20%. Because of this uncertainty we report our Cr dataonly to give some idea about the approximate particulateconcentrations expected to be found in these river waters.A bulk Black Sea sediment sample (dried, ground andhomogenized from 7–8 cm depth in a box core collectedfrom the western basin of the Black Sea during R/V Knorr2001)was run for precision and to ensure therewas no driftin the analyses. One certified and one Black Sea referencestandard were analyzed with each sample set. Precisionwas estimated by triplicate analyses of actual samples andthese standard reference materials. Standard deviations(1σ) of the means were used to estimate precision. Theprecision of most analyses was about 5%. For Ag and Cd(which havemuch lower concentrations) the precision wasabout 10%.
5. Results
The Sakarya and Yenice Rivers had the highest metalconcentrations (μg/l) for all elements because of theirvery high particulate matter concentrations. The DanubeRiver had the lowest particulate concentrations for Al,Ti, V, Mn, Fe, Co, and U while the Kızılırmak andYeşilırmak Rivers had the lowest particulate concentra-tions for Cr, Cu, Zn, Mo, Ag, Cd, Ba, and Pb. Vol-umetric concentrations (μg/l) are not presented here butcan be found in Yigiterhan (2005). These values are afunction of suspended load and water flow and thus arenot a very useful way to compare samples from differenttimes and different rivers.
The results were converted to solid phase concentra-tions (μg metal/g solid or ppm) (Table 2), which isrequired for comparison of these compositions withglobal average crust, shale or world rivers. Not all of theoriginal samples were weighed, thus we weighedreplicate undigested samples that had been collected atthe same time and locations. We calculated the weight ofsolid per liter of water filtered using the recordedvolumes. This ratio was multiplied times the volumefiltered for the analyzed samples to estimate the weightof particulate matter in that sample. We were able tocalculate the particulate matter concentration for 3–5replicates for each river. The average values for theDanube, Kızılırmak and Yeşilırmak Rivers were low(1–3 mg l−1) while the average values for the YeniceRiver (281 mg l−1) and Sakarya River (429 mg l−1)were high. The variability among the replicates was
low and the resulting uncertainties on the particulatematter concentrations were ±10%.
To allow direct comparison with global referencedata we examined the metal to Al ratios. Metal to Alratios are a better way to compare results from differentrivers (calculated using weight ratios in Fig. 2) becausethis ratio is less dependent of suspended matterconcentration. These unitless ratios were all less thanone (except for Fe in the Sakarya and Yenice Rivers).The Me/Al ratios decrease as the amount of total metalconcentration decreases in the sample. The Mo/Al ratiosare not shown for the Danube, Kızılırmak and YeniceRivers due to low Mo concentrations in the samples.
Note that even though the Al and Ti concentrationswere low in the Danube River suspended matter sample,the Ti/Al ratio was similar to the crustal value. The lowconcentrations of Al, Ti and Fe were probably becausethe sample was a combination of lithogenic and someadditional biogenic material. The Me/Al ratios for Cu,Zn and Ba (biogenic elements) and Ag, Cd and Pb(pollution indicators) were especially high in theDanube River suspended matter sample.
6. Discussion
The rivers sampled in this study are representative ofthe total river flux to the Black Sea. Our goal was todefine the lithogenic component entering the Black Seaso that we could identify the geochemical anomalies thatexist under different redox conditions.
6.1. Comparison of metal concentrations
The solid phase compositions (ppm) for the Danubeand Turkish rivers are compared with previous datafrom the Danube River (Guieu et al., 1998; Guieu andMartin, 2002), the world's average rivers (Martin andWindom, 1991) and global average crust and shale inTable 2. The comparison shows that the new data aregenerally in good agreement with historical data, thoughthere was no previous Danube River data for Ti, Ba, Cr,V, Mo, U and Ag. Tuncer et al. (1998) analyzed Cd, Cu,Pb, and Zn in 24 different streams and rivers flowinginto the Turkish Black Sea coast but they reported theirvalues as fluxes rather than concentrations or ratios so itis not possible to compare their results with our data.
The individual and mean values for the Danube andTurkish rivers are plotted versus the average earth's crust(Taylor and McLennan, 1985, 1995) in Fig. 3. We usedcrust rather than shale because the regions where theserivers originate are geologically heterogeneous and areprobably represented better by the crustal average than
73O. Yiğiterhan, J.W. Murray / Marine Chemistry 111 (2008) 63–76
shale. The crust line is shown as a solid black line throughthe origin with a slope of 1. The data for the averageTurkish rivers (individual values = black letters; averagevalues = solid circles) tend to fall slightly higher than thecrust line for elements with lower concentrations (e.g.Mn, Zn, V, Cr, Cu, Co, Mo, Cd and Ag). In many casesthe differences from crust are negligibly small (e.g. Al,Fe, Ti, Ba, Pb, U). The regression fit to the average valuesfor Turkish rivers has a slope less than one (0.88)reflecting the tendency for elements with low concentra-tions to be enriched relative to crust while those with highconcentrations are equal to crust. The values for theDanube suspended matter (open squares), on the otherhand, also have a slope less than one (0.64) but theenrichments for low concentrations are much higher andmore variable. The elements with high concentrations(e.g. Al, Fe, Ti and U) are actually depleted relative tocrust. Al, Fe, Ti, Vand U were anomalously low and Zn,Cu, Pb, Ag and Cd were all anomalously high in thesuspended matter sample but much more normal valuesin the surface sediment sample (open diamonds). Theconcentrations in the Danube River sediment samplewere much more similar to the Turkish rivers and toaverage crust. We expect there would be exchangebetween suspended particles and surface sediment soeither this does not occur or our suspended sample wascontaminated or contained other material with low Al, Feand Ti and high trace metal content.
Guieu and Martin (2002) reported that the Al, Ni, Cd,Co and Mn content of particulate matter in the DanubeRiver and Danube River Plume was similar to uncon-taminated world rivers. Evidence of contamination wasseen for Cu and Pb. We observed low concentrationsrelative to crust for Al, U, Ti, Fe, V, Co (lowest to highest)in the suspended matter sample from the Danube Riverestuary (Fig. 3). The concentrations of Ba, Cu, Pb, Zn, Cdand Ag suggested contamination. Similar low values forAl, Fe and Co were seen by Guieu et al. (1998). Theyattributed these low concentrations to precipitation ofdissolved metals as hydrated metal oxides as aconsequence of relatively high pH (8.03–8.30) in theriver water. The high pH values are due to the high valuesof alkalinity derived from weathering of carbonate richsource rocks (Guieu et al., 1998; Guieu and Martin,2002).
6.2. Metal enrichments and depletions of river waters
Because the total sample can consist of materialsfrom different origins, it is more convenient to comparethe data using Me/Al ratios, rather than metal concen-trations. These ratios are also a better way to compare
results of different rivers because they are probablyindependent of suspended matter concentration. TheMe/Al ratios for the Danube and Turkish river samplesare shown as bar graphs with a log scale in Fig. 2.Horizontal dashed lines are drawn to indicate the ratiofor average crust. The ratios for most elements for boththe Turkish rivers and the Danube River were higherthan the ratios in average crustal material. The values ofBa/Al and U/Al ratios were slightly lower than crust forthe Kızılırmak and Yeşilırmak Rivers. These ratiossuggest that suspended particles in these rivers aremostly enriched with respect to crust as can also be seenin Fig. 4. The enrichments are higher for the Danubesuspended matter while the Danube sediments and theTurkish rivers were lower and in good agreement.
Among the Turkish rivers, the Sakarya and YeniceRivers show the highest enrichments for Fe, Ti, V, Co,and U. Both the Sakarya and Yenice Rivers have veryhigh amounts of particulate matter and they transportthe products of erosion from the Anatolian highlands.Kızılırmak and Yeşilırmak Rivers have the lowest Me/Al ratios for all elements, except slightly higher valuesof Mn, Cu, Mo and Cd. On the other hand, the DanubeRiver suspended matter has the highest Me/Al ratiosrelative to crust and the four Turkish rivers for Pb, Zn,Mn, Ba, Cu, Cr, Ag and Cd (from highest to lowest).The metal ratios in this sample were more than 100times higher than those for crustal material for Ag, Pb,Cd, Zn; and more than 10 times higher than those forcrustal material for Cu, Cr, Mn (Fig. 2).
Comparison of the Me/Al ratios for the Danubesuspended matter and surface sediments and the fourTurkish rivers with the ratios for the average worldrivers (Martin and Windom, 1991) is shown in Fig. 5.The regressions for suspended matter from the Turkishrivers and Danube surface sediment were similar to thatof the world average rivers. High ratios for Mn/Al, Fe/Aland Co/Al result in a regression with a slope slightlygreater than one (1.10). The slope of the regression forthe Danube suspended matter was about the same as forthe average world rivers but is offset to higher concen-trations by about an order of magnitude.
6.3. Anthropogenic effects
It is usually assumed that rivers entering the BlackSea should be polluted with heavy metals becausecountries in this region have few pollution controlmeasures (Windom et al., 1998). Most of the availabledata are for the Danube and have resulted from the GEFBlack Sea Environmental Program (Mee and Topping,1998) and the European Union EROS project (Lancelot

74 O. Yiğiterhan, J.W. Murray / Marine Chemistry 111 (2008) 63–76
et al., 2002). These studies generally found that tracemetal concentrations (especially dissolved) in theDanube River were lower than expected.
Literathy and Laszlo (1995) suggested that the meanconcentrations of Cr, Cu, and Pb in Danube Riverbottom sediments were significantly higher at somelocations because of natural processes. The metalenriched sediments had a higher percentage of theclay–silt size fraction, which has a higher surface area andmetal sorbing capacity. Some indications of contaminationwere observed by Ricking and Tertyze (1999) for DanubeRiver surface sediments. In some cases the sources ofcontamination could be identified. For example, shipyardactivity was a source of Pb and metal processing factorieswere a source for Cd. Literathy and Laszlo (1999) foundthat some elements like Pb, Zn, Cu, Ag and Cd wereespecially high in samples from the three main branches ofthe Danube River delta and tributaries. This result isconsistent with anthropogenic contamination (Gruiz et al.,1998). Guieu and Martin (2002), however, found thatparticulate concentrations of most trace metals were lowand did not show evidence of contamination. Theconcentrations of Pb and Cu were higher than average‘world rivers’ by factors of 3 and 14 respectively,suggesting contamination for those two elements frommining activity upstream and in the delta region.Woitke etal. (2003) suggested that suspended solids and sedimentsof the Danube River were unpolluted for Cr, Cu and onlyslightly polluted for Pb and Zn. However, contaminationwas significant for Cd, especially in the lower stretch of theriver, below the Iron Gate Dam. Relatively constant orslightly decreasing levels of pollution were found in thelower part of the river in the Danube Delta. Unfortunatelysimilar comparison with previous data for the Turkishrivers is not possible because there have been no previousstudies.
Comparisons of individual concentrations (ppm) inour data set (Table 2) suggested that the concentrations ofZn, Cu, Pb, Ag and Cd were high in our Danubesuspended matter sample. The data points for theseelements also stand out as being anomalously high whenthe concentrations are compared with average crust(Fig. 3). While our single Danube sample is probablynot representative of the river as a whole, it does suggestthat hot spots may exist and thus the river merits morethorough study.Most of the average values for the Turkishrivers and our Danube sediment sample fall closer to theaverage crustal line, but the elements with the lowestconcentrations (Ag, Cd,Mo Co, Cu and Cr) fall above thecrustal line.
An indication of anthropogenic effects can be seen alittle more clearly in the plots of Me/Al ratios in river
particles versus the ratios in the crust (Fig. 4) and averageworld rivers (Fig. 5). The slope through the ratios foraverage Turkish rivers andDanube sediments are similar tocrust but shifted to higher values. The ratios for the Danubesuspended sample are significantly higher for all elements(except U), especially those with low concentrations. OurDanube River suspended matter sample was especiallyenriched in Ag, Pb, Zn, Cd, Cu, Cr and Mn. The firstfive elements in particular are well known indicators ofpollution. These high Me/Al ratios in our Danubesuspended matter sample suggests that this sample wasmore contaminated than the samples from the Turkishrivers. Otherwise the Danube sediment and Turkishriver suspendedmatter are in quite good agreement withthe average world's rivers (Martin and Windom, 1991)(Fig. 5).
7. Conclusions
The assumption of using the average crust or shalevalues as a lithogenic reference in the Black Sea wastested. The crust composition, rather than shale, was usedas the reference for most of the data analysis because theBlack Sea catchment area is geologically heterogeneousand is better represented by a more diverse set of sourcerocks which crust represents.
The original question that initiated this study waswhat would be the best way to characterize the lithogeniccomponent of particulate matter in the Black Sea? Shouldwe use average crust, average world's rivers particulatematter or the composition of particulate matter from localrivers entering the Black Sea? The composition of crustand world's rivers is actually quite similar and could beused interchangeably for most elements. The solid phaseconcentrations for Danube River sediments and Turkishrivers suspended matter agree with each other quite welland both have elevated compositions relative to crust,especially for trace elements. These elevated concentra-tions could be due to either natural variability in thesource rocks or to contamination.When viewed asMe/Alratios the Danube sediments and the Turkish riverssuspendedmatter are very similar to both crust and worldrivers. The largest anomalies are for the Danube sus-pended matter and may be of anthropogenic origin.Being as we only had one sample of suspended matterfrom the Danube, and because the surface sedimentsample did not contain the same anomalous values, weconclude that until we knowmore about the compositionof particulate matter from the Danube River, we shouldconsider the average of the Danube sediment and Turkishsuspended matter as the best reference for terrigenouslithogenic material added to the Black Sea.

75O. Yiğiterhan, J.W. Murray / Marine Chemistry 111 (2008) 63–76
Acknowledgements
We are extremely grateful for the laboratory assistanceof B. Paul (UW, Seattle). A. Bologa (NIMR, Constanta,Romania) helped us by collecting the samples from theDanube River. L. Balistrieri (USGS/UW, Seattle),M. Scranton and three anonymous reviewers made valu-able suggestions. This work is a part of two projects:TUBITAK-NSF collaborative research, No: 101Y105 andNSF-INT 0137601. This research was partially funded byNSF OCE00811118, MCB 0132101, NATO SfP 971818(Project YDABÇAG-619/G).
References
Algan, O., Gazioglu, C., Cagatay, N., Yucel, Z., Gonencgil, B., 1999.Sediment and water influxes into the Black Sea by AnatolianRivers. Zeitschrift für Geomorphologie 43 (1), 61–79.
Balistrieri, L.S., Murray, J.W., 1981. The surface chemistry of goethite(alpha-FeOOH) in major ion sea water. American Journal ofScience 281, 788.
Balistrieri, L.S., Brewer, P.G., Murray, J.W., 1981. Scavengingresidence times and surface chemistry. Deep-Sea Research 28,101–121.
Balkas, T., Dechev, G., Mihnea, R., Serbanescu, O., Unluata, U., 1990.The state of marine environment in the Black Sea region. UNEPRegional Seas Reports and Studies 124, 47.
Bogardi, J., 1978. Sediment Transport in Alluvial Streams. AkadémiaiKiadó, Budapest. 825 pp.
Breckel, E.J., Emerson, S., Balistrieri, L.S., 2005. Authigenis of tracemetals in energetic tropical shelf environments. Continental ShelfResearch 25, 1321–1337.
Canfield, D.E., 1997. The geochemistry or river particulates from thecontinental USA: major elements. Geochimica et CosmochimicaActa 61, 3349–3365.
Cociasu, A., Dorogan, L., Humborg, C., Popa, L., 1996. Long-termecological changes in Romanian coastal waters of the Black Sea.Marine Pollution Bulletin 32, 32–38.
Gruiz, K., Murányi, A., Molnár, M., Horvath, B., 1998. Riskassessment of heavy metal contamination in Danube sedimentsfrom Hungary. Water Science and Technology 37 (6–7), 273–281.
Guieu, C.,Martin, J.M., 2002. Level and fate ofmetals in theDanube deltaplume. Estuarine, Coastal and Shelf Science 54 (3), 501–512.
Guieu, C., Martin, J.M., Tankéré, S.P.C., Mousty, F., Trincherini, P.,Bazot, M., Dai, M.H., 1998. On trace metal geochemistry in theDanube River and Western Black Sea. Estuarine, Coastal and ShelfScience 47, 471–485.
Humborg, C., Ittekkot, V., Cociasu, A., Bodungen, B.V., 1997. Effectof Danube River dam on Black Sea biochemistry and ecosystemstructure. Nature 386, 385–388.
Kennedy, V.C., 1965. Mineralogy and Cation-exchange Capacity ofSediments from Selected Streams. USGS Spec. Paper 433-D.
Klump, J., Hebbeln, D., Wefer, G., 2000. The impact of sedimentprovenance on barium-based productivity estimates. MarineGeology 169, 259–271.
Lancelot, C., Martin, J.M., Panin, N., Zaitsev, Y., 2002. The North-western Black Sea: a pilot site to understand the complex inter-action between human activities and the coastal environment.Estuarine, Coastal and Shelf Science 54, 279–283.
Literathy, P., Laszlo, F., 1995. Harmonization of micropollutantmonitoring in large international river: Danube. Water Science andTechnology 32 (5–6), 125–137.
Literathy, P., Laszlo, F., 1999. Micropollutants in the Danube Riverbasin. Water Science and Technology 40 (10), 17–26.
Literathy, P., Laszlo, F., Cyansi, B., 1994. Approaches for sedimentassociated pollutant monitoring in the river Danube. Water Scienceand Technology 30 (5), 157–165.
Martin, J.M., Meybeck, M., 1978. The content of major elements in thedissolved and particulate loads of rivers. Biogeochemistry ofEstuarine Sediments, Unesco/SCOR, pp. 95–110.
Martin, J.M., Windom, H.L., 1991. Present and future roles ofocean margins in regulating marine biogeochemical cycles of traceelements. In: Mantoura, R.F.C., Martin, J.M., Wollast, R. (Eds.),Ocean Margin Processes in Global Change. John Wiley & Sons Ltd.
Mee, L.D., 1992. The Black Sea in a crisis: a need for concentratedinternational action. Ambio 21, 278–285.
Mee, L.D., Topping, G., 1998. Black Sea Pollution Assessment.United Nations, New York. 380 pp.
Muller, G., Stoffers, P., 1974. Mineralogy and Petrology of Black SeaSediments. See Degens & Ross. 200-248 pp.
Murray, R.W., Leinen, M., 1993. Chemical transport to the seafloor ofthe equatorial Pacific Ocean across a latitudinal transect at 135°W:tracking sedimentary major, minor, trace, and rare earth elementfluxes at the Equator and the Intertropical Convergence Zone.Geochimica et Cosmochimica Acta 57, 4141–4163.
Panin, N., Jipa, D., 2002. Danube River sediment input and it'sinteraction with the North-western Black Sea. Estuarine, Coastaland Shelf Science 54, 551–562.
Popa, A., 1993. Liquid and sediment inputs of the Danube Riverinto the north-western Black Sea. Transport of Carbon andNutrients in Lakes and Estuaries, Part 6. SCOPE/UNEP Sonder-band. 137–149 pp.
Ricking, M., Tertyze, K., 1999. Trace metals and organiccompounds in sediment samples from the River Danube inRusse and Lake Srebarna (Bulgaria). Environmental Geology 37(1–2), 40–46.
Shimkus, K.M., Trimonis, E.S., 1974. Modern sedimentation in theBlack Sea. In: Degens, E.T., Ross, D.A. (Eds.), The Black Sea-Geology, Chemistry and Biology. Memoirs of the AmericanAssociation of Petroleum Geologists, vol. 20. Memoir 20, Tulsa,Oklahoma, pp. 249–278.
Spencer, D.W., Brewer, P.G., Sachs, P.L., 1972. Aspects of thedistribution and trace element composition of suspendedmatter in the Black Sea. Geochimica et Cosmochimica Acta 36(1), 71–86.
Taylor, S.R., McLennan, S.M., 1985. In The Continental Crust: It'sComposition and Evolution. Blackwell, Oxford. 312 pp.
Taylor, S.R., McLennan, S.M., 1995. The geochemical evolution ofthe continental crust. Reviews in Geophysics 33, 241–265.
Teodoru, C., McGinnis, D.E., Wuest, A., Wehrli, B., 2006. Nutrientretention in the Danube's Iron Gate Reservoir. EOS 87, 390–391.
Thomas, R.L., 1988. Lake sediments as indicators of changes inland erosion rates. In: Lerman, A., Meybeck, M. (Eds.), Phy-sical and Chemical Weathering in Geochemical Cycles. Kluwer,pp. 143–164.
Tuncer, G., Karakas, T., Balkas, T.I., Gokcay, C.F., Aygun, S., Yurteri,C., Tuncel, G., 1998. Land-based sources of pollution along theBlack Sea Coast of Turkey: concentrations and annual loads to theBlack Sea. Marine Pollution Bulletin 36 (6), 409–423.
Wedepohl, K.H., 1968. Origin and Distribution of the Elements.Pergamon Press, London.

76 O. Yiğiterhan, J.W. Murray / Marine Chemistry 111 (2008) 63–76
Windom, H.L., Tankere, S.P.C., Guieu, C., Coquery, M., Campbell,M., Horvat, M., 1998. Assessment of metal contamination ofthe Black Sea. In: Mee, L.D., Topping, G. (Eds.), Black SeaPollution Assessment. United Nations Publications, New York,pp. 83–102.
Woitke, P., Wellmitz, J., Helm, D., Kube, P., Lepom, P., Litheraty, P.,2003. Analysis and assessment of heavy metal pollution insuspended solids and sediments of the river Danube. Chemosphere51, 633–642.
Yigiterhan, O., 2005. Trace Metal Composition of Particulate Matter inthe Water Column and Sediments of the Black Sea and RegionalRivers. PhD Thesis, Middle East Technical University, 320 pp.
Yiğiterhan, O., Murray, J.W., Tugrul, S., submitted for publication.Trace Metal Composition of Particulate Matter in the WaterColumn of the Black Sea.