town of chapel hill
TRANSCRIPT
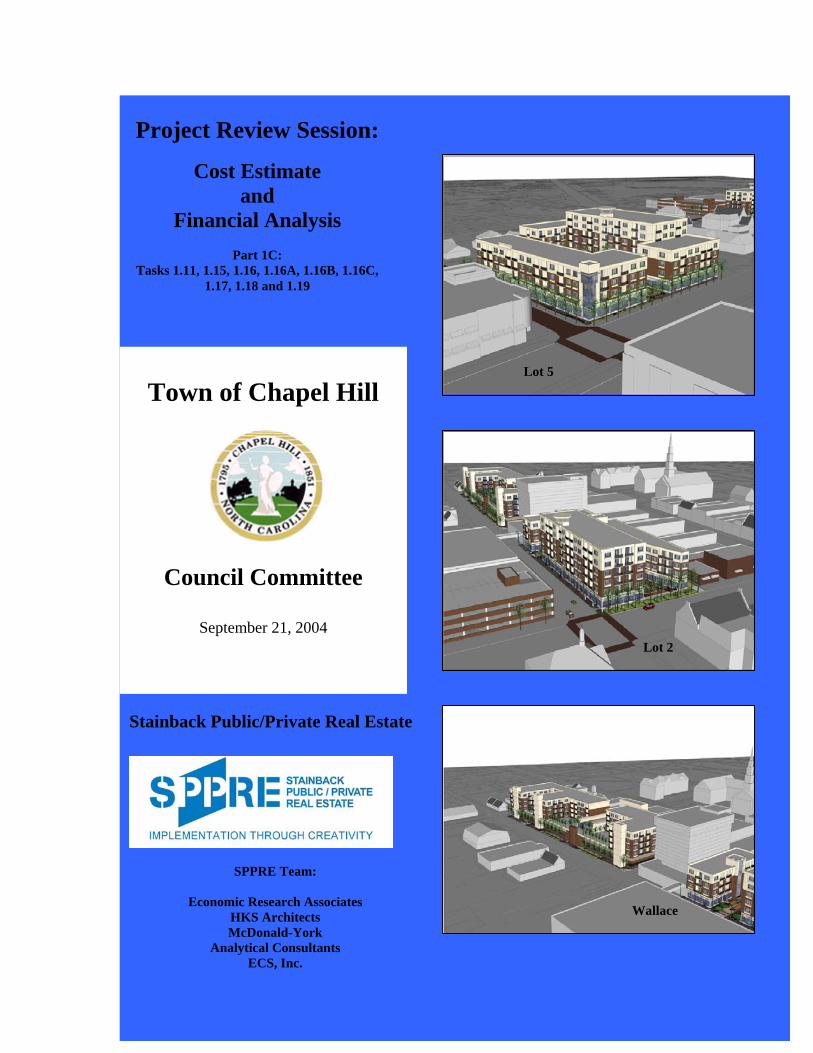
Project Review Session:
Cost Estimate and
Financial Analysis
Part 1C: Tasks 1.11, 1.15, 1.16, 1.16A, 1.16B, 1.16C,
1.17, 1.18 and 1.19
Town of Chapel Hill
Council Committee
September 21, 2004
Stainback Public/Private Real Estate
SPPRE Team:
Economic Research Associates HKS Architects McDonald-York
Analytical Consultants ECS, Inc.
Lot 2
Wallace
Lot 5

Table of Contents Executive Summary 1. The Revised Building Program
Total Building Program Comparative Analysis of Building Programs
2. Summary of Revised Finance Models and Assumptions
Lot 5 Development Wallace Deck Expansion Lot 2 Development RBC Garage Affordable Housing Comparables Commercial Mortgage Rates & Terms 3. Revised Financial Sensitivity Analysis 4. Revised Public/Private Finance Plan
5. Revised Summary of the Nontax Income and
Tax Revenue for the Town and Related Government Entities
6. SPPRE Recommendations to Council Committee Based on the Completed Financial Analysis

Executive Summary of the Revised Financial Analysis September 21, 2004 Council Committee Directives to SPPRE Resulting from September 13, 2004 Project Review The SPPRE Team completed a work session with the Council Committee on September 13, 2004. The following reflects our understanding of the major directives for SPPRE to refine the financial analysis for the four primary development projects: Item 1: Change the building program so that 100% of the proposed 305 housing units are owner-occupied. The mix of housing is 80% Market-Rate Condominium units and 20% Affordable Condominium units. While we revised the finance models to reflect this directive by the Council Committee, SPPRE remains concerned that this shift from 100% market-rate rental housing to 100% condominium housing may reduce the number of proposals submitted by developers in response to the RFQ and/or RFP for these projects. Many developers will be concerned that ERA, a nationally recognized consultant, concluded from their market demand analysis that the most effective building program would include 100% market-rate rental housing and that there appeared to be only “negligible demand for owner-occupied units in multi-unit buildings….” Item 2: The term of Town-issued bonds should be 20 and possibly 25 years, not 30 years as proposed in the initial finance modeling. Item 3: Tax Increment Financing (TIF) – Backed Bonds should be referred to as “Self-Financing Bonds”. Item 4: SPPRE was instructed not to rely on any tax abatements in structuring public/private finance plans. Item 5: Town staff informed SPPRE that the development schedule should allow 5 to 6 months for all project reviews by the Town.
3100 Timmons Lane, Ste. 520 Houston, TX 77027 • t. 713.621.3007 • f. 713.621.3008
Houston • Los Angeles • Washington, DC www.sppre.com
1

Organization of Executive Summary The Executive Summary is organized into the seven (7) tabs included in this report: Tab 1: The Revised Building Program Tab 2: Summary of the Revised Finance Models and Assumptions Tab 3: The Revised Financial Sensitivity Analysis Tab 4: The Revised Public/Private Finance Plan Tab 5: The Revised Summary of the Nontax Income and Tax Revenue for the Town and Related Government Entities Tab 6: SPPRE Recommendations to Council Committee Based on the Completion of the Financial Analysis Tab 1: The Revised Building Program As the Council Committee will see in Tab 4: The Revised Public/Private Finance Plan, the “Overall Project” includes nine (9) public and private components: Three private commercial developments, three public development projects and three public non-building or finance transactions. The Three Private Developer Components:
- Developer Project 1: The Expansion of the Wallace Deck - Developer Project 2: The Commercial Development of Lot 5 - Developer Project 3: The Commercial Development of Lot 2
The Six Public (Town) Building and Non-Building Components:
- Town project 1: Continued Funding of the Revenue Bond for the Wallace Deck
- Town project 2: The Financing of the Town’s Replacement Parking in Lot 5
- Town Project 3: The Financing of the Delta Cost of Below-Grade parking versus Above-Grade parking
- Town Project 4: The Construction of the Transit Transfer Center (TTC)
2 of 2

- Town Project 5: The Development of the RBC Garage
- Town Project 6: The Construction of a Second-Level Pedestrian Bridge connecting Lot 2 to the RBC Garage
The Total Building Program for the Six (6) Public and Private Building Projects includes: As described in detail in Tab 1: The Revised Building Program, the Total Building Program for the Six Developments includes: Retail Space: 62,750 GSF Market-Rate Condominium: 305,440 GSF (244 units) Affordable Condominium: 76,360 GSF (61 units) Subtotal: 444,550 GSF Pedestrian Space: 55,100 GSF Parking Garage Spaces: Private-Use: 696 Public-Use: 593 Total: 1,289 (1,061 new parking spaces plus remaining 228 existing spaces) Transit Transfer Center: 43,560 GSF Second-level Pedestrian Bridge: Approximately 60 Linear Feet Developer Project 1: The Expansion of the Wallace Deck (Phase 1A) Retail Space at Street Level: 4,000 GSF Market-Rate Condominium: 109,120 GSF (87 Units) Affordable Condominium: 27,280 GSF (22 Units) Pedestrian Space: 12,200 GSF Parking Spaces: 400 (320 existing spaces plus 80 new spaces) Developer Project 2: Lot 5 Development (Phase 1B) Retail Space at Street Level: 30,250 GSF Market-Rate Condominium: 128,480 GSF (102 Units) Affordable Condominium: 32,120 GSF (26 Units) Pedestrian Space: 28,300 GSF Parking Spaces: 539
3 of 3

Developer Project 3: Lot 2 Development (Phase 2A) Retail Space at Street Level: 20,100 GSF Market-Rate Condominium: 67,840 GSF (54 Units) Affordable Condominium: 16,960 GSF (14 Units) Pedestrian Space: 14,600 GSF Parking Spaces: 0 Town Project 4: Transit Transfer Center (Phase 2B) Street Level Space: 43,560 GSF Town Project 5: Second-Level Pedestrian Bridge (Phase 2C) The proposed pedestrian bridge connecting the commercial development on Lot 2 and the RBC Garage would span approximately 60 to 65 Linear Feet. This bridge would be approximately 10 to 12 feet wide including structure. The bridge therefore, would include approximately 600 to 780 GSF. Town Project 6: RBC Garage (Phase 2D) Retail Space at Street level: 8,400 GSF Parking Spaces: 342 In Tab 1, we have also included at the request of Town staff, a comparative analysis of the Building Program at three key milestones:
• The Building Program Recommended by ERA
• The Building Program Approved by the Town Council on June 14, 2004
• The Building Program included in this Final Financial Analysis This comparative analysis reveals the following major points:
• The proposed new construction building program is well within the projected market demand determined by ERA
• The parking demand has increased and the supply has been reduced so ultimately there are no surplus parking spaces for the proposed projects. This reduces the Town’s cost and market risk.
4 of 4

Tab 2: Summary of Revised Finance Models and Assumptions Changes in Assumptions Since September 13, 2004 Overview SPPRE recognizes that the costs of construction, interest rates and market-rate condominium and Retail prices and many financial components of the project may fluctuate prior to the finance and development of Lot 5, Wallace Deck, Lot 2 or RBC Garage. However, because this project is a market-rate driven project the costs and revenues will follow the Market Demand. These Financial Proformas represent a ‘snapshot’ of what the current demands and financial returns of a market driven program. This further emphasizes the notion of ‘capturing the market’ by the Town and SPPRE moving in an efficient manner in the continued developments of these projects. Interest Rate The SPPRE Team felt it was beneficial to use a nationally recognized objective third-party source to determine the current interest rate for the various types of proposed developments. Using the Internet, as well as our firm’s national network, we determined that the national average interest rate for commercial apartments is 6.98% and 7.25% for retail development. The primary source for these average rates is RealtyRate.com. RealtyRates.com is a national source used by developers and investors seeking comprehensive commercial real estate, investment, financial and market data. Major Assumptions in ALL Finance Models (Lot 5, Wallace, Lot 2)
Building Program: • It is assumed that there will be a 20% Affordable Housing component that is available
for purchase by residents whose income levels qualifies.
• SPPRE has assumed that the Town does not want to incur the cost of surplus parking and has removed the spaces at each project site.
5 of 5

Development Budget:
• The Land Lease payment to be made to the Town is allocated by use-type (Market-Rate Condos, Affordable Housing, Retail).
• The land valuation for each site is determined by using a 2.5% discount rate over a
30-year period using the projected total land payments at 9% appraised land value at each site.
• The Town pays appraised value for RBC Property. • The Market Rate Condominium units are assumed to have a 10% increase in Hard
Construction Cost and the Affordable Housing Units are assumed to have a 10% decrease. This is due to the interior furnishings and the need to reduce Unit Cost on the Affordable Housing components to meet housing cost guidelines.
Market Rate Condominiums
• The Market Rate Condominiums are assumed to be financed at a 70% LTV Interest Construction Rate of 7.00%, Term: 30 years.
• The Garage spaces in are sold at cost to the end-users where applicable (Lot 5, and 80
spaces in Wallace Deck). • Assume the Town will receive 20% of the Market-Rate Condo Proceeds at sellout in
each development. The Town will not receive proceeds from the Affordable Housing component at sellout.
• Assume Land Lease Payment to town for Market-Rate Condominium portion is paid
in Month 1 of Construction to Town.
Affordable Housing:
• Assume that the Private Partner will be eligible for Grant monies. • Assume Private Partner still pays Land Lease Payment to Town in year 1. • Assume Financing for Affordable Housing using two permanent loans:
1. Senior Mortgage: Interest Rate: 4.25% Term: 20 years 2. Junior Mortgage. Interest Rate: 2.50% Term: 25 years
• Affordable housing Land Lease Payment is grouped into the Financing of the Units because the Equity required at an LTV of 90% does not cover the cost of the Land
6 of 6
Lease Payment. The Town will be paid incrementally from either the Developer or the End-Users as a component of their monthly mortgage.
Retail Component
• Assume that the Private Developer carries the cost of the required Retail Garage spaces on the Retail Proforma (including financing).
• Assume an Interest rate of 7.25%, a term of 25 years, and an LTV of 70%. This is the average for Retail Financing from RealtyRates.com (9/20/04).
• Assume Town will receive 20% of the proceeds at the sellout of the Retail and Retail Garage Component.
Non-Tax Income Worksheet
• Assume Base Rent from Retail component will continue after sale in year 10. (New owner will takeover lease payments to Town).
Major Assumptions Specific to Lot 5 Development Budget:
• The Delta Land Cost to the Private Partner is assumed to be paid by the Town
Retail Component
• Income assumes parking for the 59 required Retail spaces are priced at $1.00 per hour and are free on weekends and holidays.
Major Assumptions Specific to Wallace Deck Building Program/Development Budget
• Assume cost for the 80-space garage will be carried on the Market-Rate Condominium financing package.
7 of 7

• Assume the 80-space garage extension will be sold at cost to end-users during the
sellout period.
• Assume the Wallace St. Garage will provide parking for Residential, Residential Storage and Retail components in the Garage. This demand leaves 119 spaces left in the Wallace St. Garage for public parking. Based on actual demand for Residential Storage from Wallace Development, the amount of spaces available for public parking may be higher. The town will ‘group’ the Retail parking space demand from Wallace Development (8 spaces) with their public parking operations, totaling 127 hourly spaces.
• The developer will privately finance and develop the 80-space extension and the
Town will assume operations for the entire garage at completion.
• The Town will manage monthly/annual-parking leases from Wallace demand and manage hourly parking operations.
Retail Component
• Assume parking rates for these 127 spaces are $1.60 per hour (approximate current rate).
• Opportunity cost on Wallace Deck needs to be determined because cash flow is
negative now, pay off Wallace debt, or leverage land lease payment into future debt service payments at current rates. We should possibly explore the refinance of the Wallace Deck.
Major Assumptions Specific to Lot 2
• No Cost for Garage spaces from Lot 2 Demand to Private Developer. • Assume end-users will lease 140 spaces directly from the Town at RBC Garage. (No
Storage assumed at RBC Garage). These spaces will be either Monthly/Annual or Hourly rates for users.
• Assume an 8% interest rate on the Market Rate Condominium loan because of the
passage for time; there are increased risks for interest rates rising.
• Because the Developer does not carry the cost of Garage Financing, or parking for that matter, the cost of Lot 2 Market Rate Condos and Affordable Housing condominiums are significantly lower in unit price.
8 of 8

Major Assumptions specific to RBC Garage
• Land Valuation at RBC Property is $990,090 or $38/SF. • Assume Hard Cost Construction per SF is equal to Lot 2 costs.
• Assume RBC building will be demolished (the Town will not keep the Garage, HKS
needs to indicate whether keeping the RBC building would constitute an efficient Garage).
• Assume new Retail space will be built in 1st floor of garage and Privately managed for
the Town.
Income Assumptions
Market-Rate Condominium Sales (Owner Occupied): ERA report states: “…condos are selling briskly even at a comparatively high price point of nearly $250 per square foot.” Comparable Market Rate Condominiums: (9/16/04) Development: SF Price Meadowmont Village: 1,532 $399,900 Meadowmont Village: 1,532 $364,900 Rosemary Condominiums: 950 $289,900 Market Street Condominiums: 880 $189,900
SF Without Garage With Garage
Lot 5: 1,255 $225,844 $273,214 Wallace Deck: 1,251 $225,248 $267,271 Lot 2: 1,247 $224,471 N/A
9 of 9

Affordable Housing: SPPRE has done some research in the Chapel Hill area to look for comparable Condo sales units that meet Affordable housing guidelines. SPPRE has used the Orange Community Hosing & Land Trust Website to find comparable units in the Chapel Hill Area. Development SF Sales Price Monthly Pmts* Greenway Condominiums 950 $140,000 $1,175 Vineyard Square (3 BR) 1,223 $115,000 $940+HOA Vineyard Square (2 BR) 1,069 $95,000 $740+HOA
Development SF Sales Price Monthly Pmts (1) Lot 5 (2) 1,255 $135,762(w/Garage) $858.25 Wallace Deck (3) 1,251 $90,099 $569.49 Lot 2 (4) 1,247 $91,035 $575.40
(1)
• Payments at 6.5%, Term: 30 yrs, do not include HOA, TBD. • Lot 5 units are also available without a Garage space for $90,338 • Assume Affordable Units in Wallace and Lot 2 will lease spaces monthly/annually from the Town in
Wallace Garage (Wallace Units) or RBC Garage (Lot 2 Units) Retail Operations: ERA report states: “…ERA estimates rents averaging $25 per square foot for retail space, with rents in the 100 block area of Franklin Street as high as $40 per square foot.” SPPRE has assumed the following Retail Rents: Lot 5: $25.00 Wallace Deck: $23.00 Lot 2: $24.00 RBC: $25.00
10 of 10

Tab 3: Revised Financial Sensitivity Analysis The SPPRE Team focused on the impact to the financial measurements from increases in construction costs and interest rates for Lot 5 Development and the expansion of the Wallace Deck. See Sensitivity Analysis included in Tab 3. Tab 4: Revised Public/Private Finance Plan Overview The primary objectives in structuring the Public/Private Finance Plan are to:
- Optimize private investment - Minimize Town investment - Eliminate Town-issued debt not supported 100% by the proposed projects - Reduce the need for TIF related financing (TIF is on the State Ballot in November 2004) - Reduce Town market, finance and construction risk - Accelerate the development schedule
The SPPRE Team has achieved these objectives. The proposed Public/Private Finance Plan includes private and public financing instruments, all of which are supported 100% by the revenues generated and the nontax income paid to the Town by the private developer. The proposed Public/Private Finance Plan includes one TIF-Backed Revenue Bond, which we used as an option to cover the cost of the Transit Transfer Center (TTC). The TIF Bond is supported solely by 49% of the Property Tax generated by the three developer projects. When the Council Committee changed the housing product from rental units to owner-occupied units, the Land Lease payments paid to the Town changed from annual payment over the term of the Land Lease to one-time payouts based on the sale of condominium units. The Land Lease Payout in Year Two exceeds the Present Value (PV) of the Land Lease payments paid over the term of 30-years. This allowed the SPPRE Team to avoid leveraging the Property Tax generated annually by the proposed commercial developments. In addition, the Base Rent paid to the Town by the private developer as part of the Land Lease structured developed by SPPRE now only applies to the retail space. In other words, the Land Lease Payout was structured by SPPRE to provide the Town with nontax income, which exceeds the PV of the previous Land Lease structure.
11 of 11

Organization of the Proposed Nine-Part Development Project Implemented in Two Phases The SPPRE Team has organized the “overall project” into nine (9) public and private components, including the three (3) private commercial developments and the six (6) public projects and transactions. The Three Private Developer Components:
- Developer Project 1: The Expansion of the Wallace Deck
- Developer Project 2: Commercial Development of Lot 5
- Developer Project 3: Commercial Development of Lot 2
The Six (6) Public (Town) Building and Non-Building Components:
- Town Project 1: The Existing Revenue Bond for the Wallace Deck
- Town Project 2: A Portion of the Lot 5 below-grade garage to Accommodate the 173 Replacement Parking Spaces
- Town Project 3: The Delta Cost of Below-Grade Parking versus the Cost of Above-Grade Parking
- Town Project 4: The Transit Transfer Center (TTC)
- Town Project 5: The RBC Garage
- Town Project 6: Second-Level Pedestrian Bridge
The Proposed Public/Private Finance Plan The SPPRE Team has structured the proposed Public/Private Finance Plan for the overall project so that the nine public and private development components are self-financing. (We strongly recommend that Council Committee members pullout the Public/Private Finance Plan diagram included in Tab 4 so that they can better understand the proposed financing). The three (3) private developer components, excluding the affordable housing, are financially feasible using private equity and debt. The public/private financing for the affordable housing includes four parts: 1) Senior Debt provided by Fannie Mae at an interest rate of 4.25% for a term of 20 years, 2) Subordinated Junior Debt provided by Fannie Mae at an interest rate of 2.5% for a term of 25 years, 3) Grants provided by the Federal Home Loan Bank (FHLB) Affordable
12 of 12

Housing Program (AHP), and 4) Traditional Private Equity equal to 10% of the total retail cost. The proposed financing for the six (6) public, or Town Projects includes some combination of the following sources of financing:
- Land Lease Payouts (A one-time payment paid by the developer to the Town at the closing of the Construction Loan for each developer project)
- The Town’s 20% Share of the Net Proceeds from the Sale of the Market-Rate Condominium units (A one-time payment made by the developer for each project two years after completion of construction).
- Annual Base Rent Payments Indexed to the CPI (Retail space only)
- The Town’s 20% Share of the Net Proceeds from Selling the Retail Space in Year 10.
- Annual Net Income from Parking Operations We recommend that the Town determine whether they can segregate the Property Tax generated and use this new stream of income toward infrastructure improvements related to the projects. The Public/Private Finance of Public (Town) Project 1: The Existing Revenue Bond for the Wallace Deck: The Public/Private Finance Plan for Town Project 1: The Existing Revenue Bond for the Wallace Deck includes two phases and three sources of payments from the developer of the expanded Wallace Deck. Phase 1: When the developer of Lot 5 begins construction, he, or she will demolish the existing Lot 5 Parking Lot. This action causes the loss of $125,000 of annual income to the Town, which is currently applied to the debt service on the existing Wallace Deck. The proposed solution to this loss of income is to use 4.60% of the Land Lease Payout paid to the Town by the developer at the closing of the Construction Loan for the commercial development of Lot 5. Phase 2: When the developer sells the Market-Rate Condominium and corresponding parking spaces on Lot 5, he, or she would pay the Town their 20% share of the Net Sales Proceeds, which is equal to $664,385. This source of funds will be used to cover the loss of the $125,000 in Year 2, as well as the loss of income from the demolition of Lot 2. Phase 3: The long-term solution includes using two annual payments from the developer to the Town to support a Revenue Bond. As the diagram indicates, the two sources of funding for the Revenue Bond include: 1) The developer of Wallace Deck will lease 92 parking spaces from the Town to satisfy the balance of the parking requirement of the housing units, and 2) As part of the
13 of 13

Land Lease between the developer and the Town, the developer will make an annual lease payment (Base Rent) to the Town for the retail Space only. (The developer does not pay annual Land Lease payments on the housing because both the Market-Rate and Affordable housing units are owner-occupied, so in lieu of annual Land Lease payments, the developer pays a Land Lease Payout to the Town. The Revenue Bond will be supported by the annual parking lease payment of $44,712 and the annual Base Rent generated by the Retail Space equal to $7,373. Combining these two annual payments provides the Town with $52,085. This amount of annual income to the Town can support a Revenue Bond in the amount of $497,949 including the following assumptions: Term: 20 Years Coupon Rate: 5.50% Debt Coverage Ratio (DCR): 1.25. While more than likely this small bond amount will be incorporated in one, or more other bonds, we wanted the Town to know that the Wallace Deck could support a Bond, which will cover the long-term loss of income from the commercial development of Lots 2 and 5 . The Public/Private Finance of Town Projects 2 and 3: The Finance of the Replacement Parking in Lot 5 and the Cost Delta of Below-Grade Versus Above-Grade Parking Several months ago, the Council Committee made the decision to replace the 274 parking spaces currently located on Lots 2 and 5 and to finance underground parking to free-up additional street-level space for larger pedestrian space. The estimated development cost to provide the 173 replacement parking spaces on Lot 5 is $3,425,566. As described in the September 13 report, SPPRE has determined that adding the cost of underground parking to the traditional commercial developments are not financially feasible, so we are recommending that the Town incur the difference in cost of underground versus above-grade parking garage. That cost delta is $2,543,074. The total cost covered by the Town is $5,968,640. The recommended public/private finance plan to cover the Town cost of $5,968,640 includes two sources of financing: 1) Revenue Bond, and 2) A Land Lease Payout provided by the developer of Lot 5. 1) The Revenue Bond The proposed Revenue Bond is supported by two sources of income to the Town: a) The Net Income from Operation of the Town’s portion of the Lot 5 Garage, and 2) The Base Rent paid by the developer of the Lot 5 Retail Space. Based on our financial analysis the Town will recognize
14 of 14

$190,397 of Net Income and $76,689 in annual Base Rent. This amount of nontax income to the Town totals $267,086. This amount of annual income can support a Revenue Bond in the amount of $6,226,449 making the following assumptions: Term: 20 years Coupon Rate: 5.50% DCR: 1.25 2) Land Lease Payout Based on the development of Market-Rate Condominium units, we are requiring the developer to pay the Town a one-time payment equal to the Present Value (PV) of a 30-year Land Lease. This payment of $3,673,025 has been incorporated into the Proforma for Lot 5 and will be paid to the town at the closing of the Construction Loan. The combination of the Revenue Bond and the one-time Land Lease Payout totaling $6,226,449 is in excess of the Town’s cost of replacement parking and the “delta cost” totaling $5,968,640. Surplus Nontax Income and Tax Revenue to the Town In addition to covering more than 100% of the Town’s cost for Lot 5, the Town receives annual Property Tax equal to $161,976 and allows the Town to apply their share of the Net Sales Proceeds from the Market-Rate Condominium units totaling $867,111 to cover the cost of a Second Level Pedestrian Bridge from Lot 2 to the RBC Garage. The Optional Finance Plans for the Public (Town) Project 4: Transit Transfer Center (TTC) The estimated cost to construct the Transit Transfer Center (TTC) is $2,141,037. There are three options for the Town to cover the cost of the Transit Transfer Center (TTC). Option 1: Use the Land Lease Payout included in the proposed public/private partnership between the Town and the developer of the Wallace Deck, which amounts to $2,714,489. Option 2: If Tax Increment Financing (TIF) is approved in November, use the annual Property Tax generated by the commercial development of the Wallace Deck, Lot 5 and Lot 2, which totals $345,920 to support a TIF-Backed Revenue Bond. This amount of Property Tax can support a Bond in the amount of $3,049,217 assuming the following:
15 of 15

Term: 20 Years Coupon Rate: 6.50% DCR: 1.25. Option 3: The Town optimizes Federal and State grants and some combination of the financing instruments identified by SPPRE in an earlier report. The Public/Private Finance of Public (Town) Project 5: A Second-Level Pedestrian Bridge (New) The SPPRE Team highly recommends that the Town further explore the finance and design of a second level pedestrian bridge connecting the commercial development of Lot 2 and the RBC Garage. SPPRE took the initiative to obtain a cost estimate from the Spring Valley Construction Company based in Dallas Texas. Our initial description of the bridge is that it spanned 65 feet over Rosemary Street and was 10 to 12 feet wide including the structural system. The total construction cost is estimated to be $457,679. (See Cost Estimate dated September 21, 2004 in Tab 4). The preliminary public/private finance plan includes the use of the Town’s 20% share of the Net Proceeds from selling the Market-Rate Condominium units included in Lot 5 and Lot 2. The Town will receive $867,111 from the sale of the Lot 5 condominium units and $296,701 from the sale of the Condominium units included in the Lot 2 development. We have assumed the developer will complete the sale of all Market-Rate units by the end of year 2 of operations, The Town’s nontax income from these two development components totals $1,163,812, which is more than double the estimated construction cost of the pedestrian bridge. Of course, “soft costs” will need to be added to the “hard” construction cost. The Public/Private Finance of Public (Town) Project 6: The RBC Garage The RBC Garage is a 6-level above-grade garage that includes 342 parking spaces and 8,400 SF of retail space at the street level. The estimated cost of the garage is $4,253,007, excluding the land cost. The assumed cost of the RBC property is $990,090, which reflects a cost of $38 per square foot. The total cost of the RBC Garage is $5,147,911, or $15,052 per parking space. Revenue Bond: The SPPRE Team completed a Proforma for the RBC Garage. Based on our assumptions, the projected income exceeds the operational expenses and the required debt service, so we are recommending to the Town to issue a traditional Revenue Bond to cover the cost of the land and development costs associated with the RBC Garage.
16 of 16

The assumptions for the revenue Bond are as follows: Term: 20 Years Coupon Rate: 5.0% Tab 5: Revised Summary of the Nontax Income and Tax Revenue for the Town and Related Government Entities There are four government entities that will share the economic benefits of the development of Lots 2 and 5 and the Wallace Deck: 1) The Town of Chapel Hill, 2) Orange County, 3) The Chapel Hill/Carrboro School District, and 4) The State of North Carolina. We have organized the economic benefits of this project into Non-Tax Income and Tax Revenue, as follows: The Types of Nontax Income and Tax Revenue Generated by the Proposed Developments Nontax Income:
- Land Lease Payouts (A one-time payment paid by the developer to the Town at the closing of the Construction Loan for each developer project)
- The Town’s 20% Share of the Net Proceeds from the Sale of the Market-Rate Condominium units (A one-time payment made by the developer for each project in Year 2 of operations - two years after completion of construction).
- Annual Base Rent Payments Indexed to the CPI (Retail space only)
- The Town’s 20% Share of the Net Proceeds from Selling the Retail Space in Year 10.
- Annual Net Income from Parking Operations Tax Revenue
- Property Tax (Distributed to four Government Entities)
- Sales Tax (Distributed to two Government Entities)
Nontax Income Realized by the Town of Chapel Hill All of the Nontax Income is paid to the Town of Chapel Hill. The Nontax Income includes:
17 of 17
• Land Lease Payout as part of the Land Lease with the to-be-selected developer As part of the proposed Land Lease Agreement we will require the developer to pay the Present Value (PV) of the total rent that would have been paid in years 1-30 under a traditional Land Lease arrangement. After completing our financial analysis of the Affordable Condominiums, we concluded that it was not financially feasible to include Land Lease Payouts. Therefore, we added the Payouts to the Land Lease Payouts for the Market-Rate Condominium units. - Lot 5 Development: $2,981,105 plus $691,921 equals $3,673,026. - Wallace Deck Expansion: $2,257,383 plus $457,107 equals $2,714,490. - Lot 2 Development: $1,448,968 plus $362,242 equals $1,811,210. The three developer projects (Wallace, Lots 2 and 5) will generate payouts for the Town totaling $8,198,726.
• The Town’s 20% share of the Net Proceeds from the Sale of the Market-Rate Condominium units The developer of the Market-Rate Condominium units should sell the units in two years or less after construction is completed. We have positioned the Town to be paid a 20% share of the Net Sale Proceeds. Because of cost, we did not structure the public/private partnership so that the developer shared the Net Sales Proceeds of the Affordable Condominium units. - Lot 5 Development: $867,111 - Wallace Deck: $560,052. - Lot 2 Development: $296,701. The total Net Proceeds paid to the Town is $1,723,864.
• Base Rent and Indexed Rent as part of the Land Lease with the to-be-selected developer
As part of the proposed Land Lease Agreement we will require the developer to pay a base rent that has been indexed to the 2004 Consumer Price Index (CPI). The only development component not sold by the developer by year 2 is the retail space, so retail space generates the following Base Rent income to the Town from the three proposed projects:
18 of 18

- Lot 5 Development: $2,636,239 - Lot 5 Development: $253,442 - Lot 2 Development: $1,623,359 The total Base Rent paid to the Town from years 1 – 30 is $4,513,040.
• The Town’s 20% Participation in the Net Sales Proceeds of retail Space in Year 10. As part of the proposed Land Lease Agreement we will require the developer to allow the Town to have a 20% position when the retail space is sold to a third party. We have assumed that each retail component will be sold in Year 10. - Lot 5 Development: $756,148. - Wallace Deck: $107,611 - Lot 2 Development: $482,719 The total Net Sales Proceeds for the Town equals $1,346,478. Clearly, at this point in time, no one knows when the buildings will be sold, if ever, but many developers do sell their buildings between Years 5 and 10. This type of Land Lease Payment allows the Town to participate in the appreciation of the development value and the developer’s “upside”.
• The Town’s Net Parking Income from Public Parking in Years 1-30. The Town will own a portion of the Lot 5 garage and own 100% of the RBC and Wallace Deck garages. Therefore, there is the potential that the Town will realize net income from these parking facilities. Based on our Proformas for each garage and the developer lease arrangements, we are projecting that the Town will realize the following net income in years 1-30: - Lot 5 Development: $6,492,439. - Wallace Deck: $14,715,136 - Lot 2 Development: $7,099,249 Based on our financial analysis the Town may receive net income from parking operations totaling $28,306,824 over the first 30 years.
19 of 19
Based on our proposed Public/Private Finance Plan and Land Lease arrangements, the total nontax income generated for the Town from the proposed developments in years 1-30 is $39,874,942. Tax Revenue Tax Revenue generated by the proposed projects has been organized into Property Tax and Sales Tax. Property Tax The proposed three private developments (Lot 5, Lot 2, and the expansion of the Wallace Deck) generate the following amounts of property tax in Years 1 – 30: - Orange County: $16,452,214
- Chapel Hill/Carrboro School District: $3,739,140 - Chapel Hill City Revitalization: $10,750,025 - Downtown Revitalization District: $1,159,133
Because SPPRE leveraged these property taxes on behalf of the Town, we have totaled the taxes into the following categories:
- County and School District: $20,191,354 - Total Town Property Tax: $11,909,158
The total property tax generated by the proposed projects in years 1 – 30 equals $32,100,512. Sales Tax Based on the Retail Building Program and the $330 in sales per S.F. as quoted by the International Council of Shopping Centers (ICSC), we have determined that the proposed development projects will generate Sales Tax in years 1 – 30 as follows:
- State of North Carolina: $22,275,891 - Orange County: $12,375,495
The total Sales Tax generated in years 1 – 30 equals $34,651,386. The total tax revenue generated by the proposed projects over years 1 – 30 equals $66,751,898. The Total Nontax Income and Tax Revenue In summary, during construction and in years 1-30 of operations the Town of Chapel Hill could
20 of 20

realize a total nontax income of $39,874,942 and Property Tax revenue equal to $11,909,158. The total nontax income and tax revenue generated by the proposed projects for the Town may be as much as $51,784,100. Tab 6: SPPRE Recommendations to Council Committee Based on the Completed Financial Analysis Based on our comprehensive financial analysis, the SPPRE Team highly recommends that on October 11, 2004, the Council Committee proceed to the next step in the pre-development process, which is to complete “ Part Two: The Developer Solicitation and Selection Process” as described in the SPPRE Scope of Work. The SPPRE Team believes the design, financial analysis and deal structure include several features, which should provide the Town with a level of comfort to proceed with the solicitation of technical proposals from highly respected national and regional development companies. These design and finance modeling features include:
• Interest rates, which we believe, can be significantly decreased through presentations and negotiations with equity and debt providers.
• Loan-to-Value (LTV) which can be increased, once equity and debt investors better understand the project and market.
• Cost reductions resulting from design refinements based on developer and construction company input.
• The potential approval of Tax Increment Financing (TIF). Although SPPRE completed a Financial Sensitivity Analysis for the Council Committee to better manage their risk, the Town is susceptible to the following:
• Increase in construction costs
• Increase in the cost of financing
• A significant delay could increase market risk by not capturing current market demand as described by ERA in March 2004. The Town must do everything in their power to incorporate and accommodate public input but accelerate the design and finance approval process.
21 of 21

SECTION 1

Total Building Program

Page 1
Total Building ProgramScenario C-3: RBC, Lot 2 and TTC Included (5 Projects)
Type of Use Gross SF Units Efficiency Lease SF Sales SFLot 5 Residential
Market Rate - Condo 128,480 102 1.00 - 128,480 Market Rate - Rental - - 0.92 - - Affordable Housing-Ownership 32,120 26 1.00 - 32,120
Retail 30,250 - 0.92 27,830 - Open Space 28,300 - 0.00 - - Subtotal 219,150 128 27,830 160,600
Lot 5 Garage Private ParkingParking-Residential
Market Rate - Condo 48,960 153 1.00 - 48,960 Market Rate - Rental - - 1.00 - - Affordable Housing-Ownership 8,320 26 1.00 - 8,320
Parking-Residential Storage - - 0.00 - - Market Rate - Condo 32,640 102 1.00 - 32,640 Market Rate - Rental - - 1.00 - - Affordable Housing-Ownership 8,320 26 1.00 - 8,320
Parking-Retail 18,880 59 1.00 18,880 - Subtotal 117,120 366 18,880 98,240
Public ParkingParking-Replacement 55,360 173 1.00 55,360 - Parking Surplus (Public Parking) - - 0.00 - -
Subtotal 55,360 173 55,360 -
Total Parking upon completion 172,480 539 74,240 -
Total GSF 391,630 Parking Space/SF 320 Average SF per Residential Unit 1,255
Wallace ResidentialMarket Rate - Condo 109,120 87 1.00 - 109,120 Market Rate - Rental - - 0.92 - - Affordable Housing-Ownership 27,280 22 1.00 - 27,280
Retail 4,000 - 0.92 3,680 - Open Space 12,200 - 0.00 - - Subtotal 152,600 109 3,680 136,400
Wallace Garage Private ParkingParking-Residential
Market Rate - Condo 41,920 131 1.00 - 41,920 Market Rate - Rental - - 1.00 - - Affordable Housing-Ownership 10,560 33 1.00 - 10,560
Parking-Retail 2,560 8 1.00 2,560 - Subtotal 55,040 172 2,560 52,480
Public ParkingParking-Replacement 72,960 228 1.00 72,960 - Parking Surplus (Public Parking) - - 0.00 - - Subtotal 72,960 228 72,960 -
Total Parking upon completion 128,000 400 75,520 -
Total GSF 280,600 Parking Space/SF 320 Average SF per Residential Unit 1,251
9/22/2004

Page 2
Total Building ProgramScenario C-3: RBC, Lot 2 and TTC Included (5 Projects)
Type of Use Gross SF Units Efficiency Lease SF Sales SF
Lot 2 ResidentialMarket Rate - Condo 67,840 54 1.00 - 67,840 Market Rate - Rental - - 0.92 - - Affordable Housing-Ownership 16,960 14 1.00 - 16,960
Retail 20,100 - 0.92 18,492 - Open Space 14,600 - 0.00 - - Subtotal 119,500 68 18,492 84,800
RBC Retail Space-Ground Level 8,400 0.92 7,728
Parking-Market Rate Condos (Lot 2) 25,920 81 1.00 25,920 Parking-Affordable Housing (Lot 2) 6,720 21 1.00 6720Parking-Retail (Lot2) 12,160 38 1.00 12,160 Parking-Retail (RBC) 3,200 10 1.00 3,200 Parking-Replacement (Wallace) 29,120 91 1.00 29,120 Parking-Replacement (Lot 2) 32,320 101 1.00 32,320 Totals after completion 109,440 342 109,440
Total GSF 117,840 Parking Space/SF 320
Totals ResidentialMarket Rate - Condo 305,440 244 - 305,440 Market Rate - Rental - - - - Affordable Housing-Ownership 76,360 61 - 76,360
Retail 62,750 - 57,730 - Open Space 55,100 - - - Subtotal 499,650 305 57,730 381,800
Private ParkingParking-Residential
Market Rate - Condo 90,880 365 - 90,880 Market Rate - Rental - - - - Affordable Housing-Ownership 25,600 80 6,720 18,880
Parking-Residential StorageMarket Rate - Condo 32,640 102 - 32,640 Market Rate - Rental - - - - Affordable Housing-Ownership 8,320 34 2,560 8,320
Parking-Retail 36,800 115 36,800 - Subtotal 194,240 696 46,080 150,720
Public ParkingParking-Replacement 116,800 365 116,800 Parking Surplus (Public Parking) - - -
Subtotal 116,800 365 116,800
Total Parking Spaces Built 1,061 Wallace Spaces that Remain 228 Total Public Parking (inc. remaining Wallace Parking) 593 Total Parking Spaces Upon Completion 1,289 Total GSF 810,690
9/22/2004

Comparative Analysis of Building Programs

Comparative Analysis of Building ProgramsTown of Chapel HillSeptember 21, 2004
Key Decision PointsERA Final Report Town Council Final Financial AnalysisFebraury 27, 2004 June 14, 2004 September 21, 2004
Building ProgramMarket Rate/Affordable Housing 386 units 381,800 SF/ 305 units 381,800 SF/305 unitsRetail/Dining/Entertainment 112,100 SF 55,600 SF 62,750 SF (3)Open Space NA 55,100 SF 55,100 SFParking Demand 1,077 (1) 1,158 spaces 1,289 spaces (4)Parking Supply NA 1,375 spaces (2) 1,289 spaces Surplus Parking Spaces NA 217 spaces 0
Footnotes
(1) ERA recommended that 100% of the retail demand was for GAFO space, so we applied their parking ratio of 1/225 SF for "retail".We also used 1.5 spaces per DU. ERA stated that parking ratios should range from 0.2 to 2.0 spaces per DU.
(2) Includes 274 replacement parking spaces. Total Parking includes 1,375 spaces (Lot 5: 615 spaces, RBC Garage:360 spaces and and Wallace Deck: 400 spaces).
(3) SPPRE has proposed that 8,400 GSF of retail is included on a portion of the RBC Garage fronting on Columbia and Rosemary Streets.
(4) There are 594 existing parking spaces included in Lot 2, Lot 5 and Wallace Deck. The overall demand for parking is 1,289 spaces. The Town and the developer will develop a total of 1,061 new parking spaces. After demolition there are only 228 existing spaces remaining.The supply was reduced to eliminate surplus parking financed by the Town and additional spaces are required for the additional retail space in the RBC Garage.

Section 2

2. Summary of Revised Finance Models and Assumptions
Lot 5 Development
Wallace Deck Expansion
Lot 2 Development
RBC Garage
Affordable Housing Comparables Condominiums/Townhomes
Commercial Mortgage Rates & Terms

Financial Summary
Summary of Finance Models(Stabilized Year 3)
Lot 5 Wallace Lot 2 RBC Total Private PartnerResidential 1
Market-Rate CondoEquity $6,322,264 $4,853,026 $2,863,450Debt $14,751,949 $11,323,728 $6,681,383
Affordable HousingEquity $91,560 $223,512 $154,682Debt $824,039 $1,508,705 $1,392,137Grants $0 $300,000 $0
RetailEquity $1,398,904 $138,517 $883,370Debt $3,264,109 $323,205 $2,061,198
Public PartnerPublic Investment 3,425,566$ n/a n/a $5,147,911 8,573,478$ Parking Delta Cost 2 2,543,074$ n/a n/a n/a 2,543,074$ Transit Transfer Center n/a n/a $2,141,037 n/a 2,141,037$ Office for Land Swap (RBC) 3 n/a n/a n/a $990,090 990,090$
Total Development CostPublic and Private Investment $30,078,392 $18,670,693 $16,177,257 $6,138,001 $71,064,344
Non-Tax Income to TownPublic Partner
Land Lease PaymentMarket-Rate Condo (yr. 1) 4 $3,673,025 $2,257,383 $1,448,968 n/a $7,379,376Affordable Housing (yr. 1) $0 $457,107 $362,242 n/a $819,349
$3,673,025 $2,714,489 $1,811,210 $0 $8,198,724
Net Proceeds-RBC (yr. 3) $71,279Lease of 92 Parking Spaces $44,712Lease of 140 Parking SpacesReplacement Parking Net Income (yr. 3) 5 190,397$ $431,535 n/a n/aRetail Base Rent (yrr 3) 76,689$ $7,373 $47,224 n/aProperty Tax to Town (yr. 3) 161,976 $104,656 $79,956 n/a 346,589 Proceeds from MR Condo Sale 867,111 $921,496 $296,701 n/a
Stainback Public/Private Real Estate (SPPRE)www.sppre.com Last Updated 9/22/2004

Financial Summary
Sales Performance MeasuresROE (Sales)Market-Rate Condo 54.86% 75.95% 41.45% n/aAffordable Housing 10.28% 9.54% 6.58% n/a
Retail Performance MeasuresInternal Rate of Return (IRR) (yr. 3) 17.21% 25.05% 16.76% n/aDebt Coverage Ratio (DCR)(yr. 3) 1.63 1.98 1.58 1.12Return on Cost (ROC)(yr. 3) 9.91% 12.03% 9.59%
Maximum Loan Amount 0Retail 3,697,745$ $444,546 $2,258,692 n/a 6,400,983$ Required Debt 3,264,109$ $323,205 $2,061,198 n/a 5,648,512$
=Surplus =Surplus =Surplus n/a =Surplus
Gap Financing $0 $0 $0 $0
Sales per SF (yr. 1)Market-Rate Condo $180.00 $180.00 $180.00Affordable Housing $78.00 $78.00 $72.00
Retail Lease Rates psf (yr. 1)Retail 4 $25.00 $23.00 $24.00 $25.00
Years 1-30 Summary Information Lot 5 Wallace Lot 2 RBC Total
Property TaxOrange County $7,695,683 $4,972,341 $3,798,830 n/a $16,466,853Chapel Hill/Carrboro School District $1,749,019 $1,130,077 $863,370 n/a $3,742,467Chapel Hill Revitalization District $5,028,429 $3,248,972 $2,482,190 n/a $10,759,591Downtown Revitalization District $542,196 $350,324 $267,645 n/a $1,160,165Total Property Tax (1-30) $15,015,326 $9,701,714 $7,412,034 n/a $32,129,075
Non-Tax IncomeLand Lease Payment (Condo Units & Garage)( year 1) $2,981,105 $2,257,383 $1,448,968 n/a $6,687,455Town Sale Proceeds (year 4) $867,111 $921,496 $296,701 n/a $2,085,308Land Lease Payment (Affordable Units & Garage)(year 2) $691,921 $457,107 $362,242 n/a $1,511,269Base Rent (Retail Component) $2,636,239 $253,442 $1,623,359 n/a $4,513,040Potential Retail Component Sale Income( year 10) $756,148 $107,425 $482,719 n/a $1,346,292Parking Income $6,492,439 $14,715,136 $2,885,261 n/a $24,092,836
Year 1-30 Total $14,424,962 $18,711,989 $7,099,249 n/a $40,236,200
Net Cash Flow RBC Development (1-30) $8,263,108 $48,499,308
Stainback Public/Private Real Estate (SPPRE)www.sppre.com Last Updated 9/22/2004
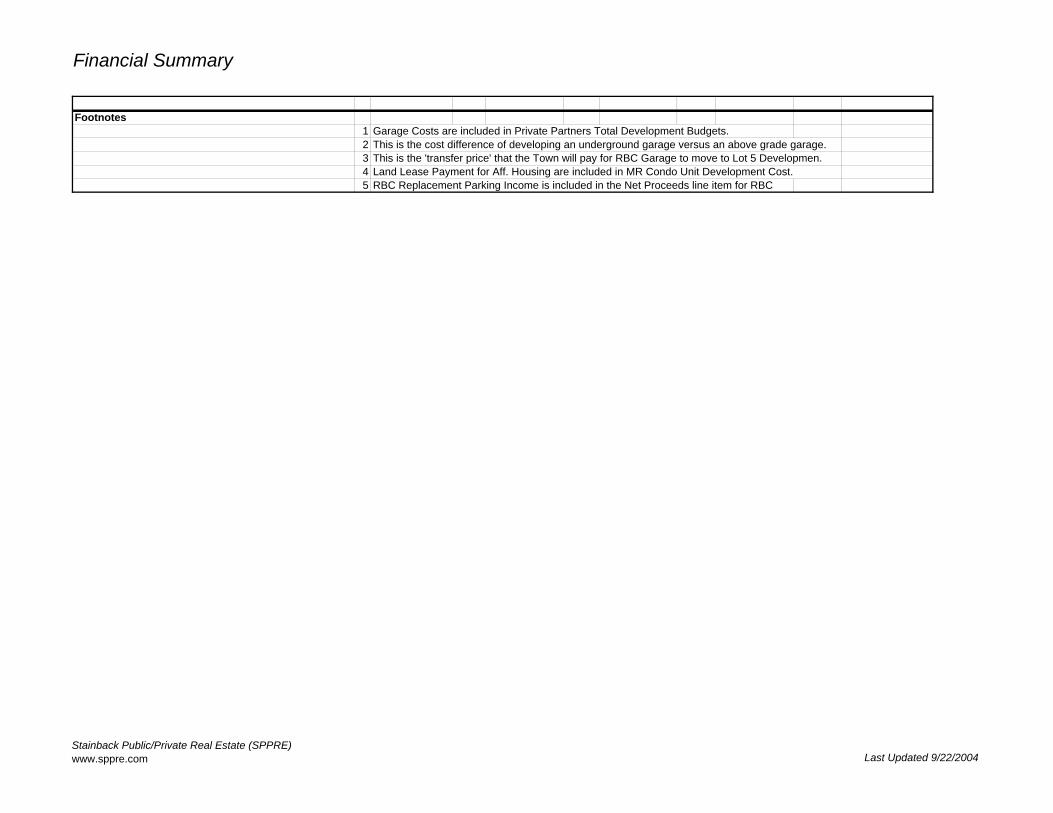
Financial Summary
Footnotes1 Garage Costs are included in Private Partners Total Development Budgets.2 This is the cost difference of developing an underground garage versus an above grade garage. 3 This is the 'transfer price' that the Town will pay for RBC Garage to move to Lot 5 Developmen. 4 Land Lease Payment for Aff. Housing are included in MR Condo Unit Development Cost.5 RBC Replacement Parking Income is included in the Net Proceeds line item for RBC
Stainback Public/Private Real Estate (SPPRE)www.sppre.com Last Updated 9/22/2004
Lot 5 Development

Development Scenario: C-3Lot 5 Development (Phase 1A)
Finance ModelDowntown Chapel Hill ProjectsTown of Chapel Hill, North Carolina
Contents: Page
Building Program 1
Development Budget 2-6
Condominium Sales Proforma (Market-Rate) 7-8
Condominium Construction Loan (Market Rate) 9
Condominium Sales Proforma (Affordable Housing) 10-11
Condominium Construction Loan (Affordable Housing) 12
Proforma (10 years) (Retail and Retail Garage Spaces) 13-15
Reversionary Analysis (Retail and Retail Garage Spaces) 16
Income Assumptions-Garage 17
Town Non-Tax Income/Tax Revenue 18-19
Stainback Public/Private Real Estate (SPPRE)www.sppre.com
Last Updated 9/22/2004

Lot 5 Page 1
Building Program
Type of Use Gross SF Units Efficiency Lease SF Sales SFLot 5 Residential
Market Rate - Condo 128,480 102 1.00 128,480 Market Rate - Rental - - 0.92 - Affordable Housing-Ownership 1 32,120 26 1.00 32,120
Retail 30,250 - 0.92 27,830 Open Space 28,300 - - -
Subtotal 219,150 128 27,830 160,600
Lot 5 GaragePrivate Parking
Parking-ResidentialMarket Rate - Condo 48,960 153 1.00 48,960 Market Rate - Rental - - 1.00 - Affordable Housing-Ownership 8,320 26 1.00 8,320
Parking-Residential StorageMarket Rate - Condo 32,640 102 1.00 32,640 Market Rate - Rental - 1.00 - Affordable Housing-Ownership 8,320 26 1.00 8,320
Parking-Retail 18,880 59 1.00 18,880 Subtotal 117,120 366 18,880 98,240
Public ParkingParking-Replacement 55,360 173 1.00 55,360 Parking Surplus (Public Parking) 2 - - - -
Subtotal 55,360 173 55,360
Total Parking upon completion 172,480 539 - 74,240
Total GSF 391,630 Parking Space/SF 320 Average SF per Residential Unit 1,255
Footnotes1 Allocation of 20% to Affordable Housing. 2 Assume TCH does not want to incur the cost of surplus parking.
Stainback Public/Private Real Estate (SPPRE)www.sppre.com Last Updated 9/22/2004

Lot 5 Page 2
Development BudgetYear 1 Year 2 Year 3 Year 4 Year 5 Year 6 Year 7 Year 8 Year 9 Year 10 Total
Site/Building Data
Total Gross Land Area 1 75,000
Gross Areas (GSF)Market Rate - Condo 128,480 Market Rate - Rental - Affordable Housing 32,120 Retail 30,250
Subtotal 190,850
Private Partner's Parking GSF 117,120 Parking Spaces 366
Public Partner's Parking GSF 55,360 Parking Spaces 173
Sales Area (GSF)Market Rate - Condo 128,480 Affordable Housing 32,120
Subtotal 160,600
Private Parking 2Parking-Residential
Market Rate - Condo 48,960 Market Rate - Rental - Affordable Housing-Ownership 8,320
Parking-Residential Storage - Market Rate - Condo 32,640 Market Rate - Rental - Affordable Housing-Ownership 8,320
Subtotal 98,240
Leaseable Areas (LSF)Market Rate - Rental - Retail 27,830
Subtotal 27,830
Private ParkingParking-Retail 18,880
18,880 Public Parking
Parking-Replacement 55,360 Parking Surplus (Public Parking) 3 -
Subtotal 55,360 Total Garage SF 172,480
Stainback Public/Private Real Estate (SPPRE)www.sppre.com Last Updated 9/22/2004

Lot 5 Page 3
Appraised Land Value 4 $3,150,000Land Valuation @ 2.5% discount rate 5 $4,370,196
Building CostsResidential
Market Rate - Condo 6 11,170,479 Market Rate - Rental - Affordable Housing 7 2,287,929
Retail 8 2,158,947 Retail TI Allowance 695,750
Garage (Private) 9Parking-Residential
Market Rate - Condo 2,448,000 Market Rate - Rental - Affordable Housing-Ownership 416,000
Parking-Residential StorageMarket Rate - Condo 1,632,000 Market Rate - Rental - Affordable Housing-Ownership 416,000
Parking-Retail 944,000 Garage (Public)
TCH Garage Replacement Spaces 2,768,000 Subtotal 27,705,105
Hard Cost Contingency (3.0%) 10 831,153 831,153$
Total Hard CostsMarket Rate - Condo 11,505,593$
Market Rate - Rental -$ Affordable Housing 2,356,567$ Retail 2,940,338$
Garage (Private)Parking-Residential
Market Rate - Condo 2,521,440$ Market Rate - Rental -$ Affordable Housing-Ownership 428,480$
Parking-Residential StorageMarket Rate - Condo 1,680,960$ Market Rate - Rental -$ Affordable Housing-Ownership 428,480$
Parking-Retail 972,320$ Garage (Public)
TCH Garage Replacement Spaces 2,851,040$ Subtotal 25,685,218$ -$ -$ -$ -$ -$ -$ -$ -$ -$ 25,685,218$
Total Hard Costs/Condo Sales GSF 89.55$ Total Hard Costs/Affordable Housing GSF 73.37$ Total Hard Costs/Retail GSF 97.20$
Stainback Public/Private Real Estate (SPPRE)www.sppre.com Last Updated 9/22/2004

Lot 5 Page 4
Soft CostsArchitectural & Engineering 11 1,027,409$ 1,027,409$ A&E Reimburseables 12 102,741$ Consultants & Legal Counsel 110,000$ Performance Bond 13 218,324$ 218,324$ Insurance 14 -$ -$ Marketing 77,056$ 77,056$ Materials Testing & Inspection 38,528$ 38,528$ Soil Analysis 10,000$ Initial Leasing Commissions (Retail) 15 35,483$ 3,977$ 1,993$ 2,053$ 2,114$ 121$ -$ -$ -$ -$ 45,741$
Town FeesPermit Fee 32,907$ Impact Fee 16 -$ Plumbing Fees 17 1,536$ Mechanical Fees 150$ Electrical Fees 18 -$ Development Review Fees 19 20,000$ Site Plan Review 20 34,145$ Traffic Impact Study Fee 21 15,000$ Water Service Availability Fee 22 20,025$ Resd. Sewer Availability Fee 23 1,617$ Non-Resd. Sewer Availability Fee 24 25,678$
Soft Cost Contingency (3%) 53,118$ 53,118$ Total Soft Costs 1,823,716$ 3,977$ 1,993$ 2,053$ 2,114$ 121$ -$ -$ -$ -$ 1,833,974$
Total Hard and Soft Development CostsResidential
Market Rate - Condo 12,147,818$ Market Rate - Rental -$ Affordable Housing 2,550,070$
Retail 3,125,133$ Garage (Private)
Parking-ResidentialMarket Rate - Condo 2,749,434$ Market Rate - Rental -$ Affordable Housing-Ownership 467,224$
Parking-Residential StorageMarket Rate - Condo 1,832,956$ Market Rate - Rental -$ Affordable Housing-Ownership 467,224$
Parking-Retail 1,060,239$ Garage (Public)
TCH Garage Replacement Spaces 3,108,837$ Total: 27,508,934$ 3,977$ 1,993$ 2,053$ 2,114$ 121$ -$ -$ -$ -$ 27,519,192$
Stainback Public/Private Real Estate (SPPRE)www.sppre.com Last Updated 9/22/2004

Lot 5 Page 5
Indirect CostsDevelopment Fee 25 963,172$ Developer Project Overhead 26 206,394$ Title Insurance 26 27,519$ Debt Service Reserve Fund 28 -$
Total: 1,197,085$
Equity and Debt Placement FeesMarket Rate Condos & Parking
Equity Placement Fee: 182,712$ Debt Placement Fee: 213,165$
Affordable Housing & ParkingEquity Placement Fee 12,818$
Retail & Retail ParkingEquity Placement Fee: 45,826$ Debt Placement Fee: 53,464$
Interest During Construction (Public and Private) 29 1,214,369$
Total Development CostResidential
Market Rate - Condo 18,564,457$ Market Rate - Rental -$ Affordable Housing 3,775,335$
Retail 4,663,013$ Garage (Public)
TCH Garage Replacement Spaces 30 3,425,566$ Total: 30,428,372$
Total Dev. Cost per Market-Rate Condo Unit $181,294Total Dev. Cost per Market-Affordable Unit $147,474Total Development Cost/Condo GSF $144.49Total Development Cost/Affordable GSF $117.54Total Development Cost/Retail GSF $154.15Cost Per Underground Parking Space $18,948Total Development Cost/Garage GSF $59.21
Town Cost for Lot 5 Parking Delta ∆ 2,543,074$ (8% of Total Cost)
Total Development Cost:Public Partner 31 5,968,640$ (16% of Total Cost)
Stainback Public/Private Real Estate (SPPRE)www.sppre.com Last Updated 9/22/2004

Lot 5 Page 6
Footnotes
1 Gross Land Area. 2 Assume that Private Parking will be controlled by the Private Partner, including Finance, Development, Construction & Operations3 Assume TCH does not want to finance and develop surplus parking.4 Source of appraised value: Analytical Consultants Inc. (July 22, 2004 Report). 5 Present value of appraised value at a discount rate of 2.5% over 30 years. 6 Assume MR Condos are 83% of the const. estimate provided by McDonald York. Cost for Open Space is allocated to Cost. 7 Assume Affordable Housing Condos are 17% of the const. estimate provided by McDonald York. Cst for Open Space is allocated to Cost. 8 Assume cost for Open Space is allocated in the construction estimate from McDonald-York. 9 McDonald-York specified a $42.16/SF cost. At the request of Town staff, SPPRE incresased to $50.00/SF. (removed surplus parking)
10 The Hard Cost Contingency is 3.0% of the Building Costs.11 The A&E Fee is 4.0% of Total Hard Construction Cost.12 A&E Reimburseables cost covers costs such as reproduction of Construction Documents.13 Performance Bonds are a surety company's guarantee of completion or performance of a General Contractor's contract.14 Insurance is included in the McDonald-York estimate.15 Initial Leasing Commission are accrued in years 1-3 for the Retail component only. 16 Waived for Town permits?17 Inside Town limits: $6 per fixture, assume 2 fixtures per unit.18 TBD-Fee is based on meter/amps.19 All Master Land Use Plans- $5,000 plus $20 per 100sf of land area.20 Site Plan Review Fee: $1,700 plus $17 per 100sf of floor area.21 Town Charges $10-$20k per site for a Consultant to complete a Traffic Impact Study.22 Non-Residential Water service availability fee: $20,025. (Assume 2" meter)23 Residential Sewer Service Availability Fee: $1,617 (5/8" meter multi-family residential)24 Non-Residential Sewer availability fee: $2,568.00. (Assume 2" meter)25 This Development fee is 3.50% of the Total Development Budget for Residential/Retail/Garage.26 Developer Project Overhead is .75% of the Total Development Budget.27 Assume fee of $1.00 per $1,000, plus binder fee.28 DSRF is a fund for 6-months of Debt Service on permanent loan. (Private Partners option to include) 29 This is the sum of varying Interest Rates, Terms, and Financing Instruments per project type.30 Town cost for 173 underground parking spaces in Lot 5 Garage.31 Total Cost for public portion of Garage, including Delta payment to Private Partner for underground spaces.
Stainback Public/Private Real Estate (SPPRE)www.sppre.com Last Updated 9/22/2004
Lot 5 Page 7
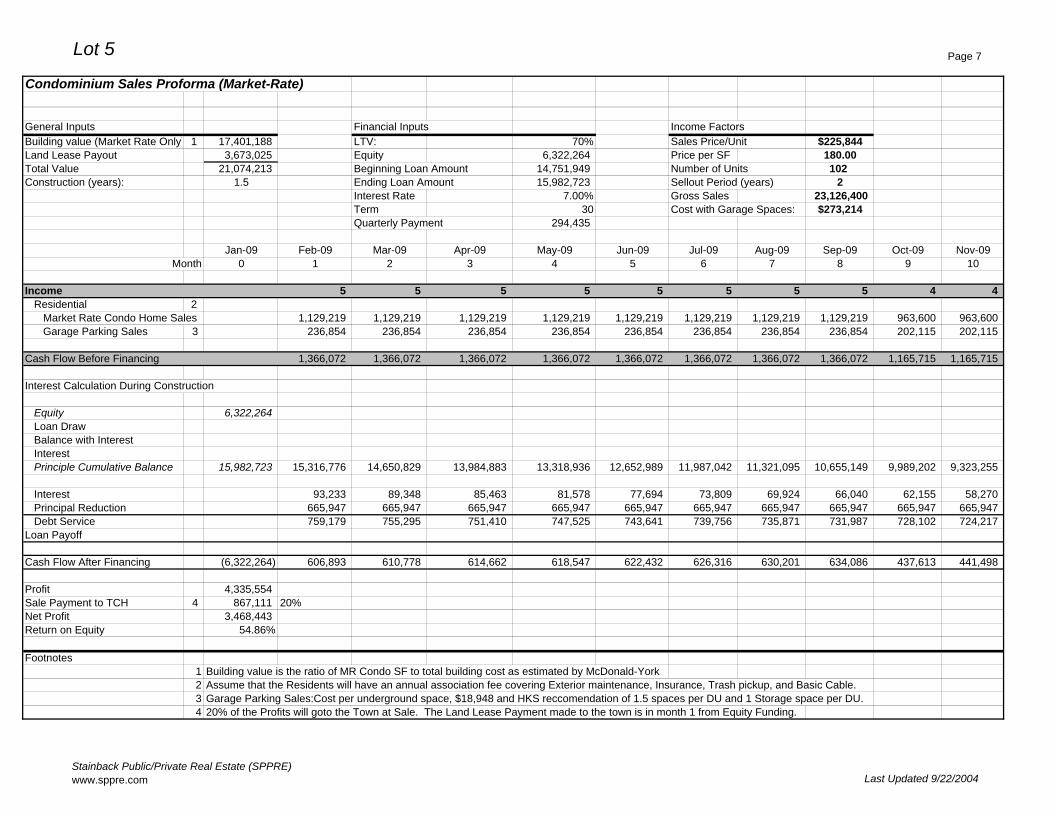
Condominium Sales Proforma (Market-Rate)
General Inputs Financial Inputs Income FactorsBuilding value (Market Rate Only) 1 17,401,188 LTV: 70% Sales Price/Unit $225,844Land Lease Payout 3,673,025 Equity 6,322,264 Price per SF 180.00Total Value 21,074,213 Beginning Loan Amount 14,751,949 Number of Units 102Construction (years): 1.5 Ending Loan Amount 15,982,723 Sellout Period (years) 2
Interest Rate 7.00% Gross Sales 23,126,400Term 30 Cost with Garage Spaces: $273,214Quarterly Payment 294,435
Jan-09 Feb-09 Mar-09 Apr-09 May-09 Jun-09 Jul-09 Aug-09 Sep-09 Oct-09 Nov-09Month 0 1 2 3 4 5 6 7 8 9 10
Income 5 5 5 5 5 5 5 5 4 4 Residential 2
Market Rate Condo Home Sales 1,129,219 1,129,219 1,129,219 1,129,219 1,129,219 1,129,219 1,129,219 1,129,219 963,600 963,600 Garage Parking Sales 3 236,854 236,854 236,854 236,854 236,854 236,854 236,854 236,854 202,115 202,115
Cash Flow Before Financing 1,366,072 1,366,072 1,366,072 1,366,072 1,366,072 1,366,072 1,366,072 1,366,072 1,165,715 1,165,715
Interest Calculation During Construction
Equity 6,322,264 Loan DrawBalance with InterestInterestPrinciple Cumulative Balance 15,982,723 15,316,776 14,650,829 13,984,883 13,318,936 12,652,989 11,987,042 11,321,095 10,655,149 9,989,202 9,323,255
Interest 93,233 89,348 85,463 81,578 77,694 73,809 69,924 66,040 62,155 58,270 Principal Reduction 665,947 665,947 665,947 665,947 665,947 665,947 665,947 665,947 665,947 665,947 Debt Service 759,179 755,295 751,410 747,525 743,641 739,756 735,871 731,987 728,102 724,217
Loan Payoff
Cash Flow After Financing (6,322,264) 606,893 610,778 614,662 618,547 622,432 626,316 630,201 634,086 437,613 441,498
Profit 4,335,554 Sale Payment to TCH 4 867,111 20%Net Profit 3,468,443 Return on Equity 54.86%
Footnotes1 Building value is the ratio of MR Condo SF to total building cost as estimated by McDonald-York2 Assume that the Residents will have an annual association fee covering Exterior maintenance, Insurance, Trash pickup, and Basic Cable. 3 Garage Parking Sales:Cost per underground space, $18,948 and HKS reccomendation of 1.5 spaces per DU and 1 Storage space per DU.4 20% of the Profits will goto the Town at Sale. The Land Lease Payment made to the town is in month 1 from Equity Funding.
Stainback Public/Private Real Estate (SPPRE)www.sppre.com Last Updated 9/22/2004

Lot 5 Page 8
Dec-09 Jan-10 Feb-10 Mar-10 Apr-10 May-10 Jun-10 Jul-10 Aug-10 Sep-10 Oct-10 Nov-10 Dec-10 Jan-1111 12 13 14 15 16 17 18 19 20 21 22 23 24
4 4 4 4 4 4 4 4 4 4 3 3 3 2
963,600 963,600 963,600 963,600 963,600 963,600 963,600 963,600 963,600 867,240 677,531 677,531 677,531 451,688 202,115 202,115 202,115 202,115 202,115 202,115 202,115 202,115 202,115 181,904 142,112 142,112 142,112 94,741
1,165,715 1,165,715 1,165,715 1,165,715 1,165,715 1,165,715 1,165,715 1,165,715 1,165,715 1,049,144 819,643 819,643 819,643 546,429
8,657,308 7,991,361 7,325,415 6,659,468 5,993,521 5,327,574 4,661,628 3,995,681 3,329,734 2,663,787 1,997,840 1,331,894 665,947 (0)
54,386 50,501 46,616 42,732 38,847 34,962 31,078 27,193 23,308 19,423 15,539 11,654 7,769 3,885 665,947 665,947 665,947 665,947 665,947 665,947 665,947 665,947 665,947 665,947 665,947 665,947 665,947 665,947 720,332 716,448 712,563 708,678 704,794 700,909 697,024 693,140 689,255 685,370 681,486 677,601 673,716 669,831
445,383 449,267 453,152 457,037 460,921 464,806 468,691 472,575 476,460 363,773 138,158 142,043 145,927 (123,403)
Stainback Public/Private Real Estate (SPPRE)www.sppre.com Last Updated 9/22/2004

Lot 5 Page 9
Condominium Construction Loan (Market Rate)
Construction Period: 18 mosSellout: 24 mos
Land Costs: (1) 3,673,025 Building Costs: 17,401,188$ Total Costs: 21,074,213$
LTV: 70%Interest Rate: 7.00%Debt 14,751,949$ Equity: 6,322,264$
Date Construction Cost Loan Fees (2) Equity Loan Draw Interest Total Outstanding21,074,213 479,438 6,322,264 15,231,388 751,335 15,982,723
1 Aug-07 4,639,758 479,438 5,119,196 - - - 2 Sep-07 966,733 966,733 - - - 3 Oct-07 966,733 236,335 730,397 4,261 734,658 4 Nov-07 966,733 - 966,733 5,639 1,707,030 5 Dec-07 966,733 - 966,733 5,639 2,679,402 6 Jan-08 966,733 - 966,733 21,269 3,667,404 7 Feb-08 966,733 - 966,733 27,032 4,661,169 8 Mar-08 966,733 - 966,733 32,829 5,660,731 9 Apr-08 966,733 - 966,733 38,660 6,666,124
10 May-08 966,733 966,733 44,525 7,677,382 11 Jun-08 966,733 966,733 50,424 8,694,538 12 Jul-08 966,733 966,733 56,357 9,717,628 13 Aug-08 966,733 966,733 62,325 10,746,686 14 Sep-08 966,733 966,733 68,328 11,781,747 15 Oct-08 966,733 966,733 74,366 12,822,846 16 Nov-08 966,733 966,733 80,439 13,870,018 17 Dec-08 966,733 966,733 86,548 14,923,298 18 Jan-09 966,733 966,733 92,692 15,982,723
Footnotes1 Land costs are included in the Total Development budget and are equal to the percentage of Market Rate Condo use in the building, (80%).2 The Loan Fees are equal to 3.50% of equity and 1.75% of debt.
Stainback Public/Private Real Estate (SPPRE)www.sppre.com Last Updated 9/22/2004

Lot 5 Page 10
Condominium Sales Proforma (Affordable Housing)
General Inputs Financial Inputs Income FactorsBuilding value (Affordable Only) 1 $3,662,396 LTV: 90% Sales Price/Unit $97,866Land Lease Payout 2 $0 Equity 366,240 Price per SF 78.00Grant-FHLB (AHP Grant) $0 Beginning Loan Amount 3,662,396 Number of Units 26Total Value $3,662,396 Ending Loan Amount 3,019,758 Sellout Period (years) 2Construction (years): 1.5 Senior Mortgage-FNMA (75% of debt) Gross Sales 2,505,360
Interest Rate 4.25% Cost with Garage Spaces: $135,762Term (years) 20
Junior Mortgage-FNMA (25% of debt)Interest Rate 2.50%Term (years) 25
Quarterly Payment $63,350
Jan-09 Feb-09 Mar-09 Apr-09 May-09 Jun-09 Jul-09 Aug-09 Sep-09 Oct-09Month 0 1 2 3 4 5 6 7 8 9
Income 2 2 1 1 1 1 1 1 1 Residential 3
Affordable Condo Home Sales 195,731 195,731 97,866 97,866 97,866 97,866 97,866 97,866 97,866 Garage Parking Sales 4 75,793 75,793 37,897 37,897 37,897 37,897 37,897 37,897 37,897
Cash Flow Before Financing 271,524 271,524 135,762 135,762 135,762 135,762 135,762 135,762 135,762
Interest Calculation During Construction
Equity 366,240 Loan DrawBalance with InterestInterestPrinciple Cumulative Balance 3,019,758 2,893,935 2,768,112 2,642,289 2,516,465 2,390,642 2,264,819 2,138,996 2,013,172 1,887,349
Interest 8,493 8,139 7,785 7,431 7,078 6,724 6,370 6,016 5,662 Principal Reduction 125,823 125,823 125,823 125,823 125,823 125,823 125,823 125,823 125,823 Debt Service 134,316 133,962 133,609 133,255 132,901 132,547 132,193 131,839 131,485
Loan Payoff
Cash Flow After Financing (366,240) 137,208 137,562 2,154 2,507 2,861 3,215 3,569 3,923 4,277
Net Profit 37,656 Return on Equity 10.28%
Footnotes1 Building value is proportionate to the percentage of Affordable housing in the building. 2 Assume Land value cost for Affordable Housing is absorbed by the Market-Rate Condo Development (+$691,921)3 Assume that the Residents will have an annual association fee covering Exterior maintenance, Insurance, Trash pickup, and Basic Cable. 4 Reduced parking allocation to 1.0 spaces per DU from (1.5-HKS).
Stainback Public/Private Real Estate (SPPRE)www.sppre.com Last Updated 9/22/2004

Lot 5 Page 11
Nov-09 Dec-09 Jan-10 Feb-10 Mar-10 Apr-10 May-10 Jun-10 Jul-10 Aug-10 Sep-10 Oct-10 Nov-10 Dec-10 Jan-1110 11 12 13 14 15 16 17 18 19 20 21 22 23 24
1 1 1 1 1 1 1 1 1 1 1 1 1 1 1
97,866 97,866 97,866 97,866 97,866 97,866 97,866 97,866 97,866 97,866 97,866 97,866 97,866 97,866 97,866 37,897 37,897 37,897 37,897 37,897 37,897 37,897 37,897 37,897 37,897 37,897 37,897 37,897 37,897 37,897
135,762 135,762 135,762 135,762 135,762 135,762 135,762 135,762 135,762 135,762 135,762 135,762 135,762 135,762 135,762
1,761,526 1,635,703 1,509,879 1,384,056 1,258,233 1,132,409 1,006,586 880,763 754,940 629,116 503,293 377,470 251,647 125,823 0
5,308 4,954 4,600 4,247 3,893 3,539 3,185 2,831 2,477 2,123 1,769 1,416 1,062 708 354 125,823 125,823 125,823 125,823 125,823 125,823 125,823 125,823 125,823 125,823 125,823 125,823 125,823 125,823 125,823 131,131 130,778 130,424 130,070 129,716 129,362 129,008 128,654 128,300 127,947 127,593 127,239 126,885 126,531 126,177
4,631 4,985 5,339 5,692 6,046 6,400 6,754 7,108 7,462 7,816 8,170 8,523 8,877 9,231 9,585
Stainback Public/Private Real Estate (SPPRE)www.sppre.com Last Updated 9/22/2004

Lot 5 Page 12
Condominium Construction Loan (Affordable Housing)
Construction Period: 18 mosSellout: 24 mos
Land Costs: (1) $0Building Costs: $3,662,396Grant-FHLB (AHP Grant) $0Total Costs: 3,662,396$
LTV: 90%
Senior Loan 75%Interest Rate: 4.25%Debt 2,472,117$ Equity: 274,680$
Junior Loan 25%Interest Rate: 2.50%Debt 824,039$ Equity: 91,560$
Combined Construction Loan DrawSenior and Junior Loan
Date Construction Cost Loan Fees (2) Equity (3) Loan Draw Interest Total Outstanding3,296,156 10,415 366,240 2,940,332 79,427 3,019,758
1 Aug-07 183,120 10,415 193,535 - - - 2 Sep-07 183,120 172,705 10,415 36 10,451 3 Oct-07 183,120 - 183,120 583 194,154 4 Nov-07 183,120 - 183,120 679 377,953 5 Dec-07 183,120 - 183,120 775 561,847 6 Jan-08 183,120 - 183,120 2,369 747,337 7 Feb-08 183,120 - 183,120 2,959 933,415 8 Mar-08 183,120 - 183,120 3,551 1,120,086 9 Apr-08 183,120 - 183,120 4,144 1,307,349
10 May-08 183,120 - 183,120 4,740 1,495,209 11 Jun-08 183,120 - 183,120 5,337 1,683,666 12 Jul-08 183,120 183,120 5,936 1,872,722 13 Aug-08 183,120 183,120 6,538 2,062,379 14 Sep-08 183,120 183,120 7,141 2,252,640 15 Oct-08 183,120 183,120 7,747 2,443,507 16 Nov-08 183,120 183,120 8,354 2,634,981 17 Dec-08 183,120 183,120 8,963 2,827,064 18 Jan-09 183,120 183,120 9,575 3,019,758
Footnotes1 Land costs are inlcuded in the Building Cost because the 10% Equity amount does not equal the Land Lease Payment for Affordable Housing.2 The Loan Fees are equal to 3.50% of equity (assume no placment fee for Federal Debt).3 Includes the $200,000 FHLB Grant (AHP Program) for as non-leveraged equity for Affordable Housing.
Stainback Public/Private Real Estate (SPPRE)www.sppre.com Last Updated 9/22/2004

Lot 5 Page 13
Proforma (10 years) Year Year Year Year Year Year Year Year Year YearRetail and Retail Garage Spaces 1 2 3 4 5 6 7 8 9 10
Potential Gross IncomeRetail 1 695,750$ 716,623$ 738,121$ 760,265$ 783,073$ 806,565$ 830,762$ 855,685$ 881,355$ 907,796$ Garage (Retail Spaces) 2 110,625$ 110,625$ 110,625$ 110,625$ 110,625$ 110,625$ 110,625$ 110,625$ 110,625$ 110,625$
Total 806,375$ 827,248$ 848,746$ 870,890$ 893,698$ 917,190$ 941,387$ 966,310$ 991,980$ 1,018,421$
Vacancy/Collections Loss (VCL) 3 120,956$ 82,725$ 59,412$ 60,962$ 62,559$ 64,203$ 65,897$ 67,642$ 69,439$ 71,289$ Vacancy Rate 15% 10% 7% 7% 7% 7% 7% 7% 7% 7%Effective Gross Income (EGI) 685,419 744,523 789,334 809,928 831,139 852,987 875,490 898,668 922,542 947,131
Non-Tax Income to TownLand Lease Payment (Base) 4 76,689$ 76,689$ 76,689$ 78,982$ 78,982$ 78,982$ 81,343$ 81,343$ 81,343$ 83,776$
Total 76,689$ 76,689$ 76,689$ 78,982$ 78,982$ 78,982$ 81,343$ 81,343$ 81,343$ 83,776$
Building MaintenanceElectrical 1,531$ 1,577$ 1,624$ 1,673$ 1,723$ 1,774$ 1,828$ 1,883$ 1,939$ 1,997$ Plumbing 668$ 688$ 709$ 730$ 752$ 774$ 798$ 821$ 846$ 871$ HVAC 4,035$ 4,156$ 4,281$ 4,410$ 4,542$ 4,678$ 4,818$ 4,963$ 5,112$ 5,265$ Roof 222$ 229$ 235$ 242$ 250$ 257$ 265$ 273$ 281$ 289$ Painting 195$ 201$ 207$ 213$ 220$ 226$ 233$ 240$ 247$ 255$ Canopies/Store Fronts 577$ 594$ 612$ 630$ 649$ 669$ 689$ 709$ 731$ 753$ Other 444$ 457$ 471$ 485$ 499$ 514$ 530$ 546$ 562$ 579$
Total 7,672$ 7,902$ 8,139$ 8,383$ 8,634$ 8,893$ 9,160$ 9,435$ 9,718$ 10,010$
Exterior CAMLandscape 3,145$ 3,239$ 3,336$ 3,436$ 3,539$ 3,646$ 3,755$ 3,868$ 3,984$ 4,103$ Trash Removal 2,393$ 2,465$ 2,539$ 2,615$ 2,694$ 2,775$ 2,858$ 2,944$ 3,032$ 3,123$ Sweeping 1,447$ 1,491$ 1,535$ 1,581$ 1,629$ 1,678$ 1,728$ 1,780$ 1,833$ 1,888$ Sidewalk Maintenance 1,278$ 1,316$ 1,356$ 1,396$ 1,438$ 1,481$ 1,526$ 1,572$ 1,619$ 1,667$ Security 10,993$ 11,323$ 11,662$ 12,012$ 12,373$ 12,744$ 13,126$ 13,520$ 13,925$ 14,343$ Lighting 1,252$ 1,290$ 1,329$ 1,368$ 1,410$ 1,452$ 1,495$ 1,540$ 1,586$ 1,634$ Directory/Signs 151$ 155$ 160$ 165$ 170$ 175$ 180$ 186$ 191$ 197$ Electricity 5,260$ 5,418$ 5,580$ 5,748$ 5,920$ 6,098$ 6,281$ 6,469$ 6,663$ 6,863$ Water 1,171$ 1,207$ 1,243$ 1,280$ 1,318$ 1,358$ 1,399$ 1,441$ 1,484$ 1,528$ Other Exterior CAM 781$ 804$ 828$ 853$ 879$ 905$ 932$ 960$ 989$ 1,019$ Fire Monitoring Service 639$ 658$ 678$ 698$ 719$ 741$ 763$ 786$ 809$ 834$
Total 28,510$ 29,366$ 30,247$ 31,154$ 32,089$ 33,051$ 34,043$ 35,064$ 36,116$ 37,200$
Stainback Public/Private Real Estate (SPPRE)www.sppre.com Last Updated 9/22/2004

Lot 5 Page 14
General & AdministrativeManagement Fee 5 41,125$ 42,359$ 42,359$ 42,359$ 42,359$ 42,359$ 42,359$ 42,359$ 42,359$ 42,359$ Leasing Commissions 6 -$ -$ -$ -$ -$ 2,057$ 2,243$ 2,310$ 2,380$ 2,451$ Marketing 1,171$ 1,207$ 1,243$ 1,280$ 1,318$ 1,358$ 1,399$ 1,441$ 1,484$ 1,528$ Property Taxes 7 74,936$ 74,936$ 74,936$ 77,185$ 77,185$ 77,185$ 79,500$ 79,500$ 79,500$ 81,885$ Business & Occupation Tax 8 -$ -$ -$ -$ -$ -$ -$ -$ -$ -$ Insurance 12,885$ 13,272$ 13,670$ 14,080$ 14,503$ 14,938$ 15,386$ 15,847$ 16,323$ 16,812$ Other 532$ 548$ 565$ 582$ 599$ 617$ 636$ 655$ 674$ 695$
Total 130,651$ 132,322$ 132,773$ 135,485$ 135,964$ 138,513$ 141,522$ 142,112$ 142,720$ 145,731$
Town FeesRecycling Fee 9 -$ -$ -$ -$ -$ -$ -$ -$ -$ -$ Storm Water Fees 10 590$ 590$ 590$ 590$ 590$ 590$ 590$ 590$ 590$ 590$ Water Service Fee 11 1,501$ 1,501$ 1,501$ 1,501$ 1,501$ 1,501$ 1,501$ 1,501$ 1,501$ 1,501$
Total 2,091$ 2,091$ 2,091$ 2,091$ 2,091$ 2,091$ 2,091$ 2,091$ 2,091$ 2,091$
Garage O&EOperations & Expenses 32,009$ 32,969$ 33,958$ 34,977$ 36,026$ 37,107$ 38,220$ 39,367$ 40,548$ 41,764$ Benefits 8,730$ 8,992$ 9,261$ 9,539$ 9,825$ 10,120$ 10,424$ 10,736$ 11,058$ 11,390$ Utilities 8,730$ 8,992$ 9,261$ 9,539$ 9,825$ 10,120$ 10,424$ 10,736$ 11,058$ 11,390$ Maintenance 6,547$ 6,744$ 6,946$ 7,154$ 7,369$ 7,590$ 7,818$ 8,052$ 8,294$ 8,543$ Taxes 8,730$ 8,992$ 9,261$ 9,539$ 9,825$ 10,120$ 10,424$ 10,736$ 11,058$ 11,390$ Insurance 5,092$ 5,245$ 5,402$ 5,564$ 5,731$ 5,903$ 6,080$ 6,263$ 6,451$ 6,644$ Supplies 2,182$ 2,248$ 2,315$ 2,385$ 2,456$ 2,530$ 2,606$ 2,684$ 2,765$ 2,848$ Miscellaneous 727$ 749$ 772$ 795$ 819$ 843$ 869$ 895$ 922$ 949$
Total 72,747$ 74,929$ 77,177$ 79,493$ 81,877$ 84,334$ 86,864$ 89,470$ 92,154$ 94,918$
Total Operating Expenses 318,360$ 323,299$ 327,116$ 335,588$ 339,637$ 345,865$ 355,024$ 359,516$ 364,142$ 373,725$ OER 55% 51% 48% 48% 47% 47% 46% 46% 45% 45%
Net Operating Income (NOI) 367,059$ 421,224$ 462,218$ 474,339$ 491,502$ 507,122$ 520,466$ 539,152$ 558,399$ 573,406$
Debt Service 12 283,118$ 283,118$ 283,118$ 283,118$ 283,118$ 283,118$ 283,118$ 283,118$ 283,118$ 283,118$ CFBTD 83,940$ 138,105$ 179,100$ 191,221$ 208,383$ 224,004$ 237,348$ 256,034$ 275,281$ 3,024,590$
IRR Including Reversion Value 14 17.21%
Return on Cost (ROC) 15 9.91%
Debt Coverage Ratio (DCR) 1.30 1.49 1.63 1.68 1.74
Maximum Loan Amount 16 3,697,745$ (Assume 8.75% cap rate, 70% LTV)
Stainback Public/Private Real Estate (SPPRE)www.sppre.com Last Updated 9/22/2004

Lot 5 Page 15
Footnotes1 Assumed Retail lease rate in year 1 of $25.00 per LSF. This includes a CAM Reimburseable in the LSF rate.2 Parking income from 59 spaces. Assume spaces will be designated for Retail Use only, $1.00 per hour, weekends/holidays free.3 Vacancy rate for stabilized year is 7%4 Lease Payment to Town is 11% of appraised value specific to the Retail & Retail Garage portion of bldg program ONLY. (NO Ramp-up)5 Management fee of 6.0% of Effective Gross Income. 6 Rollover Leasing Commission are paid at 5.0% of Initial Leasing Commissions for Retail space. 7 Property Tax is $1.717 per $100 of Assessed Market Value. 8 No Business & Occupation Tax in Chapel Hill9 Recycling Fee: Basic Service($27/unit/yr) (Number of Retail units TBD). 10 $39 per every 2,000 SF of impervious surface (based on Retail GSF only).11 Assume 3" meter size at $125.12 per month12 Debt Service is calculated on the Retail Reversionary Value Worksheet.14 Assume building is sold in year 10 and Town receives 20% of proceeds.15 Use ROC stabilization year 3.16 The required construction loan is $3,264,109 compared with $3,697,745 available using stabilization year: 3, cap rate: 8.75%, LTV: 70%
Stainback Public/Private Real Estate (SPPRE)www.sppre.com Last Updated 9/22/2004

Lot 5 Page 16
Reversionary Analysis Retail and Retail Garage Spaces
Year 1 2 3 4 5 6 7 8 9 10
Permanent Loan : 283,118$ 283,118$ 283,118$ 283,118$ 283,118$ 283,118$ 283,118$ 283,118$ 283,118$ 283,118$ $3,264,109
NOI 367,059$ 421,224$ 462,218$ 474,339$ 491,502$ 507,122$ 520,466$ 539,152$ 558,399$ 573,406$
Reversion Cash Flow 4,194,959$ 4,813,984$ 5,282,493$ 5,421,022$ 5,617,161$ 5,795,680$ 5,948,183$ 6,161,741$ 6,381,706$ 6,553,217$ Cap Rate 8.75%
Selling Expense 125,849$ 144,420$ 158,475$ 162,631$ 168,515$ 173,870$ 178,445$ 184,852$ 191,451$ 196,597$ Fee 3%
Remaining Principal 3,197,113$ 3,145,785$ 3,090,736$ 3,031,696$ 2,968,375$ 2,900,464$ 2,827,629$ 2,749,514$ 2,665,735$ 2,575,882$ Net Proceeds Before Tax 871,998$ 1,523,780$ 2,033,282$ 2,226,695$ 2,480,271$ 2,721,346$ 2,942,108$ 3,227,375$ 3,524,520$ 3,780,738$
Permanent Loan Rate (1) 7.25%Term 25LTV 70%
Town's Non-Tax Income(2) 20.00% $ 174,400 $ 304,756 $ 406,656 $ 445,339 $ 496,054 $ 544,269 $ 588,422 $ 645,475 $ 704,904 $ 756,148
Footnotes1 The Interest Rate, Term and LTV, are based on Realty Rates.com Commercial Mortgage rates and terms sheet included in this binder. 2 Town will receive 20% from Sale of Retail and Retail Garage component, assume year 10.
Stainback Public/Private Real Estate (SPPRE)www.sppre.com Last Updated 9/22/2004

Lot 5 Page 17
Income Assumptions-Garage
Income Assumptions for PRIVATE Portion: Garage Ratio
Retail Parking Operations# of Hourly Spaces 1 59Hourly Parking Rate $1.00Number of Non-work Days per year 115Non-work Days Parking Hours 14Non-work Day Occupancy Factor 2 75%
Subtotal 71,243$
Number of workdays per year 250Workday Parking Hours 10Work Day Occupancy Factor 75%
Subtotal 110,625$
Net Income 181,868$
Income Assumptions for PUBLIC Portion:
Public Parking Operations# of Hourly Spaces 173 Hourly Parking Rate $1.00Number of Non-work Days per year 115Non-work Days Parking Hours 14Non-work Day Occupancy Factor 75%
Subtotal 208,898
Number of workdays per year 250Workday Parking Hours 10Work Day Occupancy Factor 75%
Subtotal $324,375
Annual Income to City from Lot 5 Garage 533,273 Garage Operating Expenses 3 65%Net Income $186,645
Footnotes1 Number of Retail Parking Spaces charged an Hourly Rate. Assume Weekends/Holidays are free. 2 Include a Vacancy factor for income assumptions for both Public and Private Components. 3 Assume a Operating Expense ratio. Private Garages are typically 40% of Gross Income, assume Town is 65% Expenses.
Stainback Public/Private Real Estate (SPPRE)www.sppre.com Last Updated 9/22/2004

Lot 5 Page 18
Town Non-Tax Income/Tax Revenue
Year Year Year Year Year Year Year Year Year Year1 2 3 4 5 6 7 8 9 10
Income To City
Property Taxes 1Market Rate - Condo 298,778 298,778 298,778 307,742 307,742 307,742 316,974 316,974 316,974 326,483 Market Rate - Rental - - - - - - - - - - Affordable Housing-Ownership 62,883 62,883 62,883 64,770 64,770 64,770 66,713 66,713 66,713 68,714 Retail 74,936 74,936 74,936 77,185 77,185 77,185 79,500 79,500 79,500 81,885 Total Property Tax 436,598 436,598 436,598 449,696 449,696 449,696 463,187 463,187 463,187 477,083
Property Tax AllocationsOrange County 223,766 223,766 223,766 230,479 230,479 230,479 237,393 237,393 237,393 244,515 Chapel Hill/Carrboro School District 50,856 50,856 50,856 52,382 52,382 52,382 53,953 53,953 53,953 55,572 Chapel Hill City Revitalization 146,211 146,211 146,211 150,597 150,597 150,597 155,115 155,115 155,115 159,768 Downtown Revitalization District 15,765 15,765 15,765 16,238 16,238 16,238 16,725 16,725 16,725 17,227
Property Tax Income Available 161,976 161,976 161,976 166,835 166,835 166,835 171,840 171,840 171,840 176,996
Non-Tax IncomeLand Lease Payment (Condo Units & Garage) 2 2,981,105$ Town Sale Proceeds (year 4) 3 867,111$ Land Lease Payment (Affordable Units & Garage) 691,921$ Base Rent (Retail Component) 4 76,689$ 76,689$ 76,689$ 78,982$ 78,982$ 78,982$ 81,343$ 81,343$ 81,343$ 83,776$ Potential Retail Component Sale Income 5 756,148$ Parking Income 186,645$ 188,512$ 190,397$ 192,301$ 194,224$ 196,166$ 198,128$ 200,109$ 202,110$ 204,131$ Total Non-Tax Income 3,936,359$ 265,201$ 267,086$ 1,138,393$ 273,206$ 275,148$ 279,471$ 281,452$ 283,454$ 1,044,054$
Total Income to TCH from Lot 5 4,098,335$ 427,177$ 429,062$ 1,305,229$ 440,041$ 441,983$ 451,312$ 453,293$ 455,294$ 1,221,050$
Lot 5 Current Income 125,000$ 125,000$ 125,000$ 128,738$ 128,738$ 128,738$ 132,587$ 132,587$ 132,587$ 136,551$ Town Opportunity Cost for Lot 5 Land Investment 3279% 342% 343% 1014% 342% 343% 340% 342% 343% 894%
Town Cost for Lot 5 Garage Portion 6 3,425,566$
Town Cost for Lot 5 Delta ∆ 7 2,543,074$ Subtotal 5,968,640$
Stainback Public/Private Real Estate (SPPRE)www.sppre.com Last Updated 9/22/2004

Lot 5 Page 19
Footnotes1 $1.717 per $100 of Assessed Value
0.88000 Orange County0.20000 Chapel Hill/Carrboro School District0.57500 Chapel Hill City Revitalization0.06200 Downtown Revitalization District
$1.71700 Total Property Tax:This includes the cost of the Garage in each Use Type (Excludes Debt & Equity Placement Fee and Interest during Construction). Property Taxes increase 3% every 3 years.
2 Land Lease Payment for Developer to build Condo Units and required parking on Lot 5.3 Town will receive 20% of sale proceeds upon Market-Rate Condo sellout.4 Retail Base Rent is increased every 3 yr by the 2004 CPI at 2.99%. (Land lease payment (base rent) would continue after sale). 5 This assumes a possible sale of the Retail and Retail Garage Component in Year 10. 6 This is the Town's portion of the Total Development Cost for the Lot 5 Garage (173 replacement spaces).7 This is the difference the in cost the developer incurs as a result of having to build underground vs. above ground parking at Lot 5.
Stainback Public/Private Real Estate (SPPRE)www.sppre.com Last Updated 9/22/2004

Wallace Deck Expansion

Development Scenario: C-3Wallace Deck Development (Phase 1B)
Finance ModelDowntown Chapel Hill ProjectsTown of Chapel Hill, North Carolina
Contents: Page
Building Program 1
Development Budget 2-6
Condominium Sales Proforma (Market-Rate) 7-8
Condominium Construction Loan (Market Rate) 9
Condominium Sales Proforma (Affordable Housing) 10-11
Condominium Construction Loan (Affordable Housing) 12-13
Proforma (10 years) (Retail and Retail Garage Spaces) 14-16
Reversionary Analysis (Retail and Retail Garage Spaces) 17
Income Assumptions-Garage 18
Town Non-Tax Income/Tax Revenue 19
Stainback Public/Private Real Estate (SPPRE)www.sppre.com
Last Updated 9/22/2004

Wallace Deck Extension Page 1
Building Program
Type of Use Gross SF Units Efficiency Lease SF Sales SFWallace Residential
Market Rate - Condo 109,120 87 1.00 109,120 Market Rate - Rental - - 0.92 - Affordable Housing-Ownership 1 27,280 22 1.00 27,280
Retail 4,000 - 0.92 3,680 Open Space 12,200 - - -
Subtotal 152,600 109 3,680 136,400
Wallace GaragePrivate Parking
Above-Grade Parking-ResidentialMarket Rate - Condo 41,920 131 1.00 41,920 Market Rate - Rental - - 1.00 - Affordable Housing-Ownership 10,560 33 1.00 10,560
Parking-Residential Storage 2Market Rate - Condo - - 1.00 - Market Rate - Rental - 1.00 - Affordable Housing-Ownership - - 1.00 -
Parking-Retail 2,560 8 1.00 2,560 Subtotal 55,040 172 2,560 52,480
Public ParkingParking-Replacement 3 72,960 228 1.00 72,960
Subtotal 72,960 228 72,960
Total Parking upon completion 128,000 400 - 75,520
Total GSF 280,600 Parking Space/SF 320 Average SF per Residential Unit 1,251
Footnotes1 Allocation of 20% to Affordable Housing. 2 Assume that there is not Storage at Wallace Deck. 3 Assume that the 92 space Public Parking Deficit will be transferred to RBC Garage.
Stainback Public/Private Real Estate (SPPRE)www.sppre.com Last Updated 9/22/2004

Wallace Deck Extension Page 2
Development BudgetYear 1 Year 2 Year 3 Year 4 Year 5 Year 6 Year 7 Year 8 Year 9 Year 10 Total
Site/Building Data
Total Gross Land Area 1 52,272
Gross Areas (GSF)Market Rate - Condo 109,120 Market Rate - Rental - Affordable Housing 27,280 Retail 4,000
Subtotal 140,400
Private Partner's Parking GSF 55,040 Parking Spaces 172
Public Partner's Parking GSF 72,960 Parking Spaces 228
Sales Area (GSF)Market Rate - Condo 109,120 Affordable Housing 27,280
Subtotal 136,400
Private Parking 2Parking-Residential
Market Rate - Condo 25,600 Market Rate - Rental -
Subtotal 25,600
Leaseable Areas (LSF)Market Rate - Rental - Retail 3,680
Subtotal 3,680
Private ParkingParking-Residential
Affordable Housing-Ownership 10,560 Parking-Residential Storage
Market Rate - Condo - Market Rate - Rental - Affordable Housing-Ownership -
Parking-Retail 2,560 13,120
Stainback Public/Private Real Estate (SPPRE)www.sppre.com Last Updated 9/22/2004

Wallace Deck Extension Page 3
Public ParkingParking-Replacement 72,960 Parking Surplus (Public Parking) 3 -
Subtotal 72,960 Total Garage SF 111,680
Appraised Land Value 4 1,986,336$ Land Valuation 2,781,514$
Building CostsResidential
Market Rate - Condo 5 10,580,974 Market Rate - Rental - Affordable Housing 6 2,167,188
Retail 7 291,803 Retail TI Allowance 84,640
Garage (Private) 8Parking-Residential
Market Rate - Condo 1,036,835 Subtotal 14,161,440
Hard Cost Contingency (3.0%) 9 424,843 424,843$
Total Hard CostsMarket Rate - Condo 10,898,404$
Market Rate - Rental -$ Affordable Housing 2,232,203$ Retail 387,736$
Garage (Private)Parking-Residential
Market Rate - Condo 1,067,940$ Subtotal 14,586,283$ -$ -$ -$ -$ -$ -$ -$ -$ -$ 14,586,283$
Total Hard Costs/Condo Sales GSF 99.88$ Total Hard Costs/Affordable Housing GSF 81.83$ Total Hard Costs/Retail GSF 96.93$
Soft CostsArchitectural & Engineering 10 583,451$ 583,451$ A&E Reimburseables 11 58,345$ Consultants & Legal Counsel 110,000$ Performance Bond 12 123,983$ 123,983$ Insurance 13 -$ -$ Marketing 43,759$ 43,759$ Materials Testing & Inspection 21,879$ 21,879$
Stainback Public/Private Real Estate (SPPRE)www.sppre.com Last Updated 9/22/2004

Wallace Deck Extension Page 4
Soil Analysis 10,000$ Initial Leasing Commissions (Retail) 14 4,317$ 484$ 242$ 250$ 257$ 15$ -$ -$ -$ -$ 5,565$
Town FeesPermit Fee 19,033$ Impact Fee 15 -$ Plumbing Fees 16 1,308$ Mechanical Fees 150$ Electrical Fees 17 -$ Development Review Fees 18 15,454$ Site Plan Review 19 25,568$ Traffic Impact Study Fee 20 15,000$ Water Service Availability Fee 21 20,025$ Resd. Sewer Availability Fee 22 1,617$ Non-Resd. Sewer Availability Fee 23 25,678$
Soft Cost Contingency (3%) 32,387$ 32,387$ Total Soft Costs 1,111,955$ 484$ 242$ 250$ 257$ 15$ -$ -$ -$ -$ 1,113,203$
Total Hard and Soft Development CostsResidential
Market Rate - Condo 11,629,347$ Market Rate - Rental -$ Affordable Housing 2,414,939$
Retail 414,530$ Garage (Private)
Parking-ResidentialMarket Rate - Condo 1,239,422$ Market Rate - Rental -$ Affordable Housing-Ownership -$
Parking-Residential StorageMarket Rate - Condo -$ Market Rate - Rental -$ Affordable Housing-Ownership -$
Parking-Retail -$ Garage (Public)
TCH Garage Replacement Spaces 1,111,955$ Total: 16,810,193$ 484$ 242$ 250$ 257$ 15$ -$ -$ -$ -$ 16,811,441$
Stainback Public/Private Real Estate (SPPRE)www.sppre.com Last Updated 9/22/2004
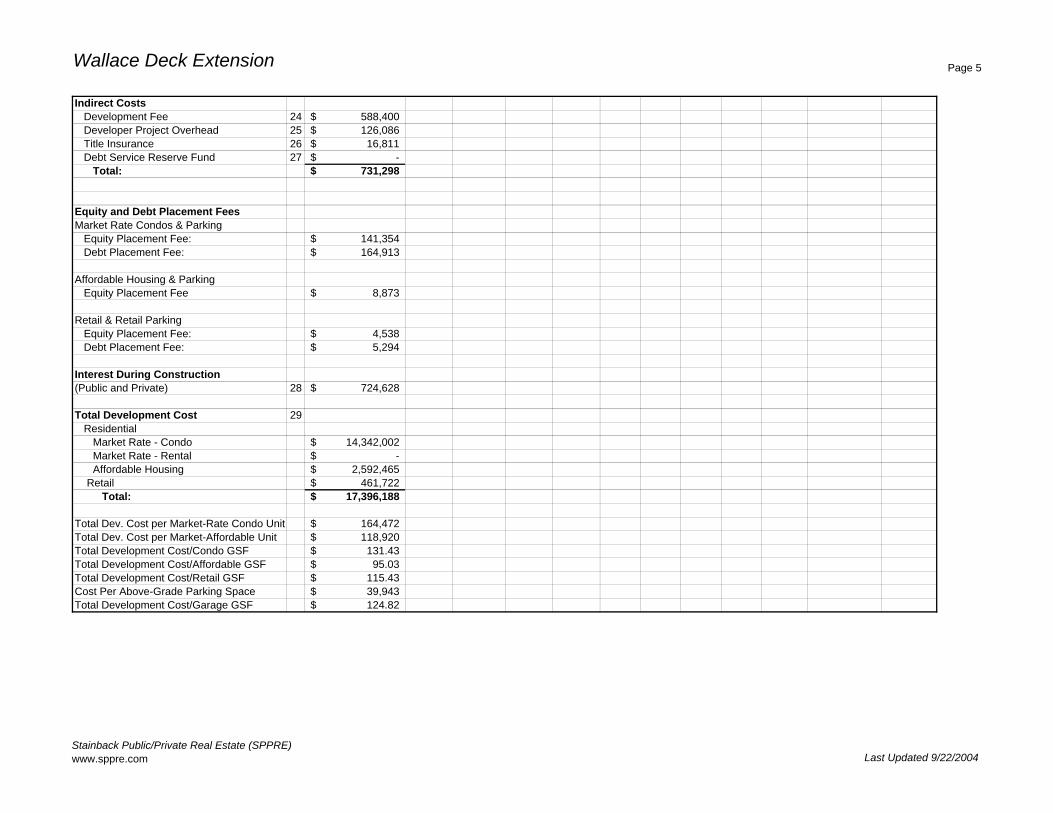
Wallace Deck Extension Page 5
Indirect CostsDevelopment Fee 24 588,400$ Developer Project Overhead 25 126,086$ Title Insurance 26 16,811$ Debt Service Reserve Fund 27 -$
Total: 731,298$
Equity and Debt Placement FeesMarket Rate Condos & Parking
Equity Placement Fee: 141,354$ Debt Placement Fee: 164,913$
Affordable Housing & ParkingEquity Placement Fee 8,873$
Retail & Retail ParkingEquity Placement Fee: 4,538$ Debt Placement Fee: 5,294$
Interest During Construction (Public and Private) 28 724,628$
Total Development Cost 29Residential
Market Rate - Condo 14,342,002$ Market Rate - Rental -$ Affordable Housing 2,592,465$
Retail 461,722$ Total: 17,396,188$
Total Dev. Cost per Market-Rate Condo Unit 164,472$ Total Dev. Cost per Market-Affordable Unit 118,920$ Total Development Cost/Condo GSF 131.43$ Total Development Cost/Affordable GSF 95.03$ Total Development Cost/Retail GSF 115.43$ Cost Per Above-Grade Parking Space 39,943$ Total Development Cost/Garage GSF 124.82$
Stainback Public/Private Real Estate (SPPRE)www.sppre.com Last Updated 9/22/2004

Wallace Deck Extension Page 6
Footnotes
1 Land Area as 1.2 Acres.2 Assume that Private Parking will be controlled by the Private Partner, including Finance, Development, Construction & Operations3 Assume TCH does not want to finance and develop surplus parking.4 Land Value plus Air Rights, have been assumed at $38/SF.5 Land Valuation using a 2.5% discount rate for 30 years, and 9% Land Lease Payment. 5 Assume MR Condos are 83% of the const. estimate provided by McDonald York. Cost or Open Space is allocated to Cost. 6 Assume Aff. Housing Condos are 17% of the const. estimate provided by McDonald York. Cost for Open Space is allocated to Cost. 7 Assume cost for Open Space is allocated in the construction estimate from McDonald-York. 8 $42.16/SF per McDonald-York revised estimate on 9-10-04. (removed surplus parking cost)9 The Hard Cost Contingency is 3.0% of the Building Costs.
10 The A&E Fee is 4.0% of Total Hard Construction Cost.11 A&E Reimburseables cost covers costs such as reproduction of Construction Documents.12 Performance Bonds are a surety company's guarantee of completion or performance of a General Contractor's contract.13 Insurance is included in the McDonald-York estimate.14 Initial Leasing Commission are accrued in years 1-3 for the Retail component only. 15 Waived for Town permits?16 Inside Town limits: $6 per fixture, assume 2 fixtures per unit.17 TBD-Fee is based on meter/amps.18 All Master Land Use Plans- $5,000 plus $20 per 100sf of land area.19 Site Plan Review Fee: $1,700 plus $17 per 100sf of floor area.20 Town Charges $10-$20k per site for a Consultant to complete a Traffic Impact Study.21 Non-Residential Water service availability fee: $20,025. (Assume 2" meter)22 Residential Sewer Service Availability Fee: $1,617 (5/8" meter multi-family residential)23 Non-Residential Sewer availability fee: $2,568.00. (Assume 2" meter)24 This Development fee is 3.50% of the Total Development Budget for Residential/Retail/Garage.25 Developer Project Overhead is .75% of the Total Development Budget.26 Assume fee of $1.00 per $1,000, plus binder fee.27 DSRF is a fund for 6-months of Debt Service on permanent loan. (Private Partners option to include) 28 This is the sum of varying Interest Rates, Terms, and Financing Instruments per project type.29 Total Cost for Project Components including Garage Costs (where applicable)
Stainback Public/Private Real Estate (SPPRE)www.sppre.com Last Updated 9/22/2004

Wallace Deck Extension Page 7
Condominium Sales Proforma (Market-Rate)
General Inputs Financial Inputs Income FactorsBuilding value (Market Rate Only) 1 13,462,266 LTV: 70% Sales Price/Unit $225,248Land Lease Payout 2,714,489 Equity 4,853,026 Price per SF 180.00Total Value 16,176,755 Beginning Loan Amount 11,323,728 Number of Units 87Construction (years): 1.5 Ending Loan Amount 12,265,219 Sellout Period (years) 2
Interest Rate 7.00% Gross Sales 19,641,600Term 30 Cost with Garage Spaces: $325,106Quarterly Payment 226,011 (where available)
Jan-09 Feb-09 Mar-09 Apr-09 May-09 Jun-09 Jul-09 Aug-09 Sep-09 Oct-09 Nov-09Month 0 1 2 3 4 5 6 7 8 9 10
Income 4 4 4 4 4 4 4 4 4 4 Residential 2
Market Rate Condo Home Sales 900,991 900,991 900,991 900,991 900,991 900,991 900,991 900,991 818,400 818,400 Garage Parking Sales 3 399,432 399,432 399,432 399,432 399,432 399,432 399,432 399,432 0 0
Cash Flow Before Financing 1,300,423 1,300,423 1,300,423 1,300,423 1,300,423 1,300,423 1,300,423 1,300,423 818,400 818,400
Interest Calculation During Construction
Equity 4,853,026 Loan DrawBalance with InterestInterestPrinciple Cumulative Balance 12,265,219 11,754,168 11,243,117 10,732,067 10,221,016 9,709,965 9,198,914 8,687,864 8,176,813 7,665,762 7,154,711
Interest 71,547 68,566 65,585 62,604 59,623 56,641 53,660 50,679 47,698 44,717 Principal Reduction 511,051 511,051 511,051 511,051 511,051 511,051 511,051 511,051 511,051 511,051 Debt Service 582,598 579,617 576,636 573,655 570,673 567,692 564,711 561,730 558,749 555,768
Loan Payoff
Cash Flow After Financing (4,853,026) 717,825 720,806 723,787 726,768 729,749 732,730 735,711 738,693 259,651 262,632
Profit 4,607,480 Sale Payment to TCH 4 921,496 20%Net Profit 3,685,984 Return on Equity 75.95%
Footnotes1 Building value is the ratio of SF to total building cost as estimated by McDonald-York2 Assume that the Residents will have an annual association fee covering Exterior maintenance, Insurance, Trash pickup, and Basic Cable. 3 Garage Parking Sales:Cost per underground space, $39,943 and HKS reccomendation of 1.5 spaces per DU and 1 Storage space per DU (Only sells 80 spaces). 4 20% of the Profits will goto the Town at Sale. The Land Lease Payment made to the town is in month 1 from Equity Funding.
Stainback Public/Private Real Estate (SPPRE)www.sppre.com Last Updated 9/22/2004

Wallace Deck Extension Page 8
Dec-09 Jan-10 Feb-10 Mar-10 Apr-10 May-10 Jun-10 Jul-10 Aug-10 Sep-10 Oct-10 Nov-10 Dec-10 Jan-1111 12 13 14 15 16 17 18 19 20 21 22 23 24
4 4 4 4 4 4 4 4 4 3 3 3 3 2
818,400 818,400 818,400 818,400 818,400 818,400 818,400 818,400 818,400 736,560 675,743 675,743 675,743 450,495 0 0 0 0 0 0 0 0 0 0 0 0 0 0
818,400 818,400 818,400 818,400 818,400 818,400 818,400 818,400 818,400 736,560 675,743 675,743 675,743 450,495
6,643,660 6,132,610 5,621,559 5,110,508 4,599,457 4,088,406 3,577,356 3,066,305 2,555,254 2,044,203 1,533,152 1,022,102 511,051 (0)
41,736 38,755 35,774 32,792 29,811 26,830 23,849 20,868 17,887 14,906 11,925 8,943 5,962 2,981 511,051 511,051 511,051 511,051 511,051 511,051 511,051 511,051 511,051 511,051 511,051 511,051 511,051 511,051 552,787 549,805 546,824 543,843 540,862 537,881 534,900 531,919 528,938 525,956 522,975 519,994 517,013 514,032
265,613 268,595 271,576 274,557 277,538 280,519 283,500 286,481 289,462 210,604 152,768 155,749 158,730 (63,537)
Stainback Public/Private Real Estate (SPPRE)www.sppre.com Last Updated 9/22/2004

Wallace Deck Extension Page 9
Condominium Construction Loan (Market Rate)
Construction Period: 18 mosSellout: 24 mos
Land Costs: (1) 2,714,489 Building Costs: 13,462,266$ Total Costs: 16,176,755$
LTV: 70%Interest Rate: 7.00%Debt 11,323,728$ Equity: 4,853,026$
Date Construction Cost Loan Fees (2) Equity Loan Draw Interest Total Outstanding16,176,755 368,021 4,853,026 11,691,749 573,470 12,265,219
1 Aug-07 3,462,393 368,021 3,830,414 - - - 2 Sep-07 747,904 747,904 - - - 3 Oct-07 747,904 274,709 473,195 2,760 475,955 4 Nov-07 747,904 - 747,904 4,363 1,228,222 5 Dec-07 747,904 - 747,904 4,363 1,980,488 6 Jan-08 747,904 - 747,904 15,916 2,744,307 7 Feb-08 747,904 - 747,904 20,371 3,512,582 8 Mar-08 747,904 - 747,904 24,853 4,285,339 9 Apr-08 747,904 - 747,904 29,361 5,062,603
10 May-08 747,904 747,904 33,895 5,844,401 11 Jun-08 747,904 747,904 38,455 6,630,760 12 Jul-08 747,904 747,904 43,042 7,421,706 13 Aug-08 747,904 747,904 47,656 8,217,265 14 Sep-08 747,904 747,904 52,297 9,017,466 15 Oct-08 747,904 747,904 56,965 9,822,334 16 Nov-08 747,904 747,904 61,660 10,631,897 17 Dec-08 747,904 747,904 66,382 11,446,183 18 Jan-09 747,904 747,904 71,132 12,265,219
Footnotes1 Land costs are paid in month one and are equal to the percentage of Market Rate Condo use in the building, (80%) and Garage use.2 The Loan Fees are equal to 3.50% of equity and 1.75% of debt.
Stainback Public/Private Real Estate (SPPRE)www.sppre.com Last Updated 9/22/2004

Wallace Deck Extension Page 10
Condominium Sales Proforma (Affordable Housing)
General Inputs Financial Inputs Income FactorsBuilding value (Affordable Only) 1 2,535,118 LTV: 90% Sales Price/Unit $97,607Land Lease Payout 2 - Equity 223,512 Price per SF 78.00Grant-FHLB (AHP Grant) 300,000 Beginning Loan Amount 2,235,118 Number of Units 22Total Value 2,235,118 Ending Loan Amount 1,842,924 Sellout Period (months) 22Construction (years): 1.5 Senior Mortgage-FNMA (75% of debt) Gross Sales 2,127,840
Interest Rate 4.25% Cost with Garage Spaces: 97,607Term (years) 20
Junior Mortgage-FNMA (25% of debt)Interest Rate 2.50%Term (years) 25
Quarterly Payment $38,662
Jan-09 Feb-09 Mar-09 Apr-09 May-09 Jun-09 Jul-09 Aug-09 Sep-09Month 0 1 2 3 4 5 6 7 8
Income 1 1 1 1 1 1 1 1 Residential 3
Affordable Condo Home Sales 97,607 97,607 97,607 97,607 97,607 97,607 97,607 97,607 Garage Parking Sales 4 0 0 0 0 0 0 0 0
Cash Flow Before Financing 97,607 97,607 97,607 97,607 97,607 97,607 97,607 97,607
Interest Calculation During Construction
Equity 223,512 Loan DrawBalance with InterestInterestPrinciple Cumulative Balance 1,842,924 1,759,155 1,675,386 1,591,616 1,507,847 1,424,078 1,340,308 1,256,539 1,172,770
Interest 5,183 4,948 4,712 4,476 4,241 4,005 3,770 3,534 Principal Reduction 83,769 83,769 83,769 83,769 83,769 83,769 83,769 83,769 Debt Service 88,953 88,717 88,481 88,246 88,010 87,774 87,539 87,303
Loan Payoff
Cash Flow After Financing (223,512) 8,655 8,890 9,126 9,362 9,597 9,833 10,068 10,304
Net Profit 21,318 Return on Equity 9.54%
Footnotes1 Building value is proportionate to the percentage of Affordable housing in the building. 2 Land Value is absorbed by the Market Rate Condo Units at Wallace. 3 Assume that the Residents will have an annual association fee covering Exterior maintenance, Insurance, Trash pickup, and Basic Cable. 4 Assume that Residents will Lease required spaces, including storage spaces, from Town in Wallace Garage.
Stainback Public/Private Real Estate (SPPRE)www.sppre.com Last Updated 9/22/2004

Wallace Deck Extension Page 11
Oct-09 Nov-09 Dec-09 Jan-10 Feb-10 Mar-10 Apr-10 May-10 Jun-10 Jul-10 Aug-10 Sep-10 Oct-10 Nov-109 10 11 12 13 14 15 16 17 18 19 20 21 22
1 1 1 1 1 1 1 1 1 1 1 1 1 1
97,607 97,607 97,607 97,607 97,607 97,607 97,607 97,607 97,607 97,607 97,607 97,607 97,607 97,607 0 0 0 0 0 0 0 0 0 0 0 0 0 0
97,607 97,607 97,607 97,607 97,607 97,607 97,607 97,607 97,607 97,607 97,607 97,607 97,607 97,607
1,089,001 1,005,231 921,462 837,693 753,924 670,154 586,385 502,616 418,846 335,077 251,308 167,539 83,769 0
3,298 3,063 2,827 2,592 2,356 2,120 1,885 1,649 1,414 1,178 942 707 471 236 83,769 83,769 83,769 83,769 83,769 83,769 83,769 83,769 83,769 83,769 83,769 83,769 83,769 83,769 87,068 86,832 86,596 86,361 86,125 85,890 85,654 85,418 85,183 84,947 84,712 84,476 84,240 84,005
10,540 10,775 11,011 11,246 11,482 11,718 11,953 12,189 12,424 12,660 12,896 13,131 13,367 13,602
Stainback Public/Private Real Estate (SPPRE)www.sppre.com Last Updated 9/22/2004

Wallace Deck Extension Page 12
Condominium Construction Loan (Affordable Housing)
Construction Period: 18 mosSellout: 24 mos
Land Costs: (1) - Building Costs: 2,535,118$ Grant-FHLB (AHP Grant) 300,000$ Total Costs: 2,235,118$
LTV: 90%
Senior Loan 75%Interest Rate: 4.25%Debt 1,508,705$ Equity: 167,634$
Junior Loan 25%Interest Rate: 2.50%Debt 502,902$ Equity: 55,878$
Combined Construction Loan DrawSenior and Junior Loan
Date Construction Cost Loan Fees (2) Equity (3) Loan Draw Interest Total Outstanding2,011,607 6,356 223,512 1,794,451 48,473 1,842,924
1 Aug-07 111,756 6,356 118,112 - - - 2 Sep-07 111,756 105,400 6,356 22 6,378 3 Oct-07 111,756 - 111,756 356 118,490 4 Nov-07 111,756 - 111,756 414 230,660 5 Dec-07 111,756 - 111,756 473 342,889 6 Jan-08 111,756 - 111,756 1,446 456,091 7 Feb-08 111,756 - 111,756 1,806 569,653 8 Mar-08 111,756 - 111,756 2,167 683,575 9 Apr-08 111,756 - 111,756 2,529 797,860
10 May-08 111,756 - 111,756 2,892 912,509 11 Jun-08 111,756 - 111,756 3,257 1,027,522 12 Jul-08 111,756 111,756 3,623 1,142,901 13 Aug-08 111,756 111,756 3,990 1,258,647 14 Sep-08 111,756 111,756 4,358 1,374,761 15 Oct-08 111,756 111,756 4,728 1,491,244 16 Nov-08 111,756 111,756 5,098 1,608,099 17 Dec-08 111,756 111,756 5,470 1,725,325 18 Jan-09 111,756 111,756 5,843 1,842,924
Stainback Public/Private Real Estate (SPPRE)www.sppre.com Last Updated 9/22/2004
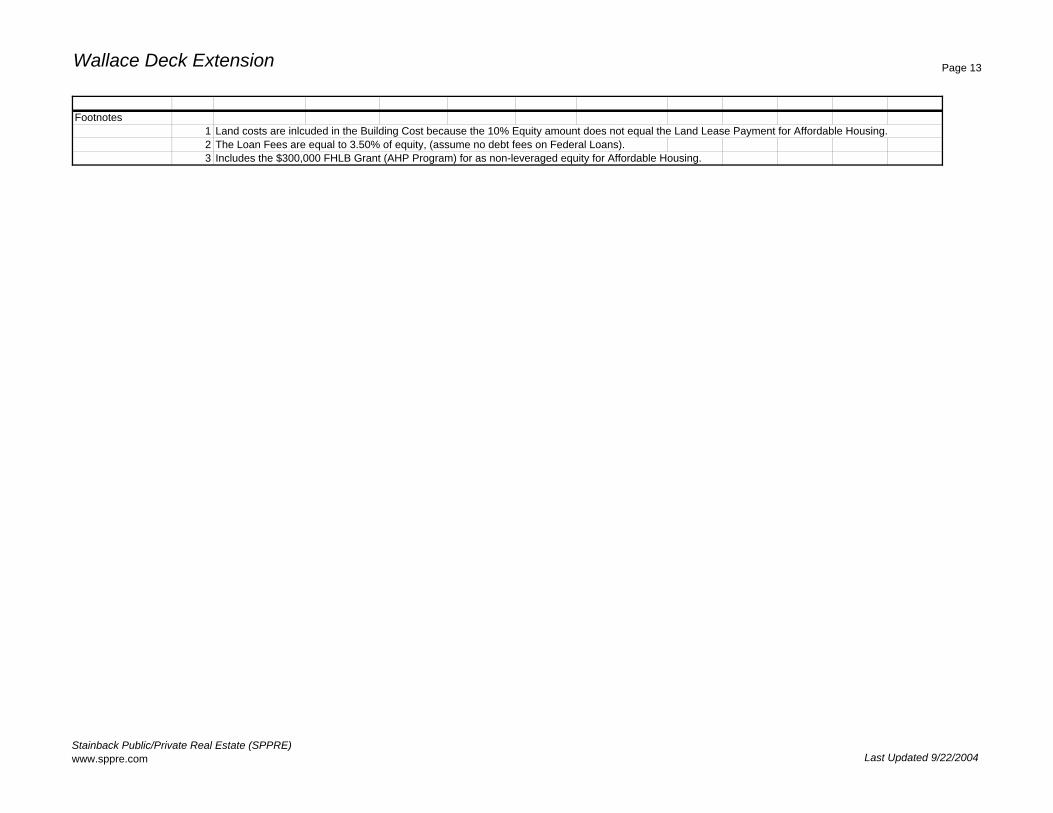
Wallace Deck Extension Page 13
Footnotes1 Land costs are inlcuded in the Building Cost because the 10% Equity amount does not equal the Land Lease Payment for Affordable Housing.2 The Loan Fees are equal to 3.50% of equity, (assume no debt fees on Federal Loans).3 Includes the $300,000 FHLB Grant (AHP Program) for as non-leveraged equity for Affordable Housing.
Stainback Public/Private Real Estate (SPPRE)www.sppre.com Last Updated 9/22/2004

Wallace Deck Extension Page 14
Proforma (10 years) Year Year Year Year Year Year Year Year Year YearRetail and Retail Garage Spaces 1 2 3 4 5 6 7 8 9 10
Potential Gross IncomeRetail 1 84,640$ 87,179$ 89,795$ 92,488$ 95,263$ 98,121$ 101,065$ 104,097$ 107,219$ 110,436$ Garage (Retail Spaces) 2 -$ -$ -$ -$ -$ -$ -$ -$ -$ -$
Total 84,640$ 87,179$ 89,795$ 92,488$ 95,263$ 98,121$ 101,065$ 104,097$ 107,219$ 110,436$
Vacancy/Collections Loss (VCL) 3 12,696$ 8,718$ 6,286$ 6,474$ 6,668$ 6,868$ 7,075$ 7,287$ 7,505$ 7,731$ Vacancy Rate 15% 10% 7% 7% 7% 7% 7% 7% 7% 7%Effective Gross Income (EGI) 71,944 78,461 83,509 86,014 88,595 91,252 93,990 96,810 99,714 102,705
Non-Tax Income to TownLand Lease Payment (Base) 4 7,373$ 7,373$ 7,373$ 7,593$ 7,593$ 7,593$ 7,820$ 7,820$ 7,820$ 8,054$
Total 7,373$ 7,373$ 7,373$ 7,593$ 7,593$ 7,593$ 7,820$ 7,820$ 7,820$ 8,054$
Building MaintenanceElectrical 202$ 208$ 215$ 221$ 228$ 235$ 242$ 249$ 256$ 264$ Plumbing 88$ 91$ 94$ 97$ 99$ 102$ 105$ 109$ 112$ 115$ HVAC 534$ 550$ 566$ 583$ 601$ 619$ 637$ 656$ 676$ 696$ Roof 29$ 30$ 31$ 32$ 33$ 34$ 35$ 36$ 37$ 38$ Painting 26$ 27$ 27$ 28$ 29$ 30$ 31$ 32$ 33$ 34$ Canopies/Store Fronts 76$ 79$ 81$ 83$ 86$ 88$ 91$ 94$ 97$ 100$ Other 59$ 60$ 62$ 64$ 66$ 68$ 70$ 72$ 74$ 77$
Total 1,014$ 1,045$ 1,076$ 1,108$ 1,142$ 1,176$ 1,211$ 1,248$ 1,285$ 1,324$
Exterior CAMLandscape 416$ 428$ 441$ 454$ 468$ 482$ 497$ 511$ 527$ 543$ Trash Removal 316$ 326$ 336$ 346$ 356$ 367$ 378$ 389$ 401$ 413$ Sweeping 191$ 197$ 203$ 209$ 215$ 222$ 228$ 235$ 242$ 250$ Sidewalk Maintenance 169$ 174$ 179$ 185$ 190$ 196$ 202$ 208$ 214$ 220$ Security 1,454$ 1,497$ 1,542$ 1,588$ 1,636$ 1,685$ 1,736$ 1,788$ 1,841$ 1,897$ Lighting 166$ 171$ 176$ 181$ 186$ 192$ 198$ 204$ 210$ 216$ Directory/Signs 20$ 21$ 21$ 22$ 22$ 23$ 24$ 25$ 25$ 26$ Electricity 696$ 716$ 738$ 760$ 783$ 806$ 830$ 855$ 881$ 907$ Water 155$ 160$ 164$ 169$ 174$ 180$ 185$ 191$ 196$ 202$ Other Exterior CAM 103$ 106$ 110$ 113$ 116$ 120$ 123$ 127$ 131$ 135$ Fire Monitoring Service 84$ 87$ 90$ 92$ 95$ 98$ 101$ 104$ 107$ 110$
Total 3,770$ 3,883$ 4,000$ 4,120$ 4,243$ 4,370$ 4,502$ 4,637$ 4,776$ 4,919$
Stainback Public/Private Real Estate (SPPRE)www.sppre.com Last Updated 9/22/2004

Wallace Deck Extension Page 15
General & AdministrativeManagement Fee 5 4,317$ 4,446$ 4,446$ 4,446$ 4,446$ 4,446$ 4,446$ 4,446$ 4,446$ 4,446$ Leasing Commissions 6 -$ -$ -$ -$ -$ 250$ 273$ 281$ 289$ 298$ Marketing 155$ 160$ 164$ 169$ 174$ 180$ 185$ 191$ 196$ 202$ Property Taxes 7 7,420$ 7,420$ 7,420$ 7,643$ 7,643$ 7,643$ 7,872$ 7,872$ 7,872$ 8,108$ Business & Occupation Tax 8 -$ -$ -$ -$ -$ -$ -$ -$ -$ -$ Insurance 1,704$ 1,755$ 1,808$ 1,862$ 1,918$ 1,975$ 2,034$ 2,096$ 2,158$ 2,223$ Other 70$ 73$ 75$ 77$ 79$ 82$ 84$ 87$ 89$ 92$
Total 13,666$ 13,853$ 13,913$ 14,197$ 14,260$ 14,575$ 14,894$ 14,972$ 15,051$ 15,370$
Town FeesRecycling Fee 9 -$ -$ -$ -$ -$ -$ -$ -$ -$ -$ Storm Water Fees 10 78$ 78$ 78$ 78$ 78$ 78$ 78$ 78$ 78$ 78$ Water Service Fee 11 1,501$ 1,501$ 1,501$ 1,501$ 1,501$ 1,501$ 1,501$ 1,501$ 1,501$ 1,501$
Total 1,579$ 1,579$ 1,579$ 1,579$ 1,579$ 1,579$ 1,579$ 1,579$ 1,579$ 1,579$
Total Operating Expenses 27,402$ 27,733$ 27,941$ 28,597$ 28,818$ 29,294$ 30,007$ 30,256$ 30,512$ 31,245$ OER 38% 35% 33% 33% 33% 32% 32% 31% 31% 30%
Net Operating Income (NOI) 44,542$ 50,728$ 55,568$ 57,417$ 59,777$ 61,958$ 63,983$ 66,554$ 69,202$ 71,460$
Debt Service 12 28,034$ 28,034$ 28,034$ 28,034$ 28,034$ 28,034$ 28,034$ 28,034$ 28,034$ 28,034$ CFBTD 16,508$ 22,694$ 27,534$ 29,383$ 31,743$ 33,924$ 35,949$ 38,520$ 41,169$ 429,701$
IRR Including Reversion Value 14 25.05%
Return on Cost (ROC) 15 12.03%
Debt Coverage Ratio (DCR) 1.59 1.81 1.98 2.05 2.13
Maximum Loan Amount 16 444,546$ (Assume 8.75% cap rate, 70% LTV)
Stainback Public/Private Real Estate (SPPRE)www.sppre.com Last Updated 9/22/2004
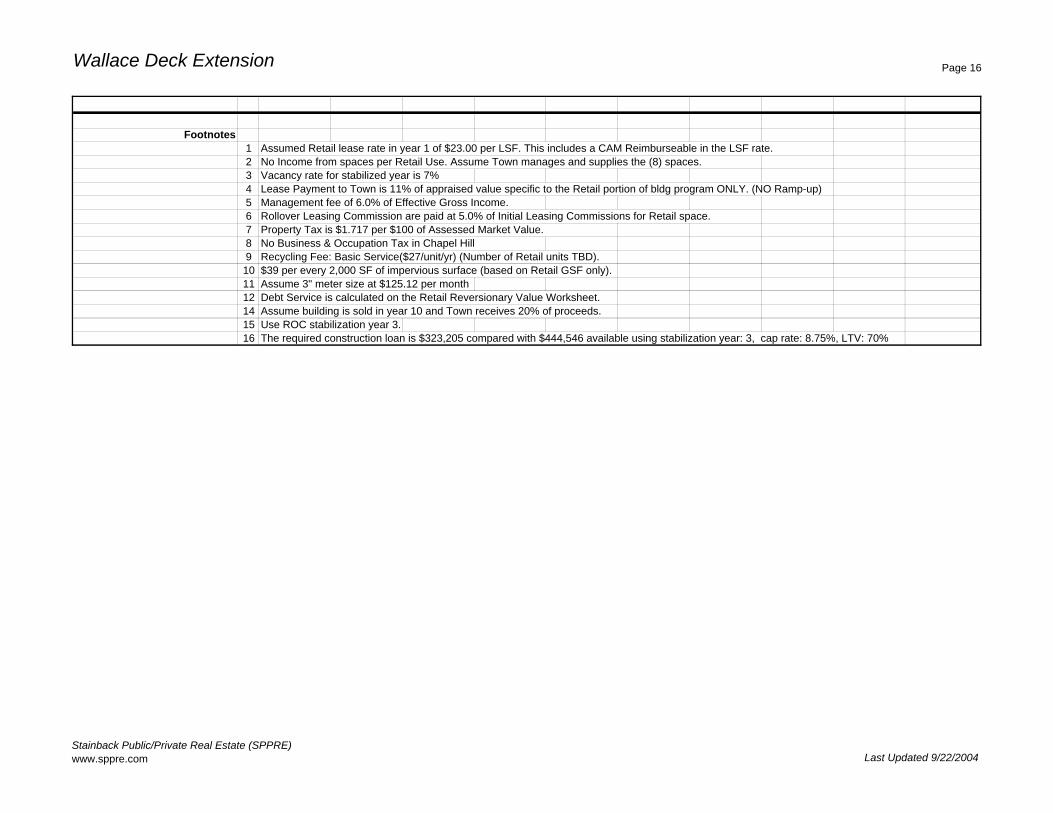
Wallace Deck Extension Page 16
Footnotes1 Assumed Retail lease rate in year 1 of $23.00 per LSF. This includes a CAM Reimburseable in the LSF rate.2 No Income from spaces per Retail Use. Assume Town manages and supplies the (8) spaces. 3 Vacancy rate for stabilized year is 7%4 Lease Payment to Town is 11% of appraised value specific to the Retail portion of bldg program ONLY. (NO Ramp-up)5 Management fee of 6.0% of Effective Gross Income. 6 Rollover Leasing Commission are paid at 5.0% of Initial Leasing Commissions for Retail space. 7 Property Tax is $1.717 per $100 of Assessed Market Value. 8 No Business & Occupation Tax in Chapel Hill9 Recycling Fee: Basic Service($27/unit/yr) (Number of Retail units TBD). 10 $39 per every 2,000 SF of impervious surface (based on Retail GSF only).11 Assume 3" meter size at $125.12 per month12 Debt Service is calculated on the Retail Reversionary Value Worksheet.14 Assume building is sold in year 10 and Town receives 20% of proceeds.15 Use ROC stabilization year 3.16 The required construction loan is $323,205 compared with $444,546 available using stabilization year: 3, cap rate: 8.75%, LTV: 70%
Stainback Public/Private Real Estate (SPPRE)www.sppre.com Last Updated 9/22/2004
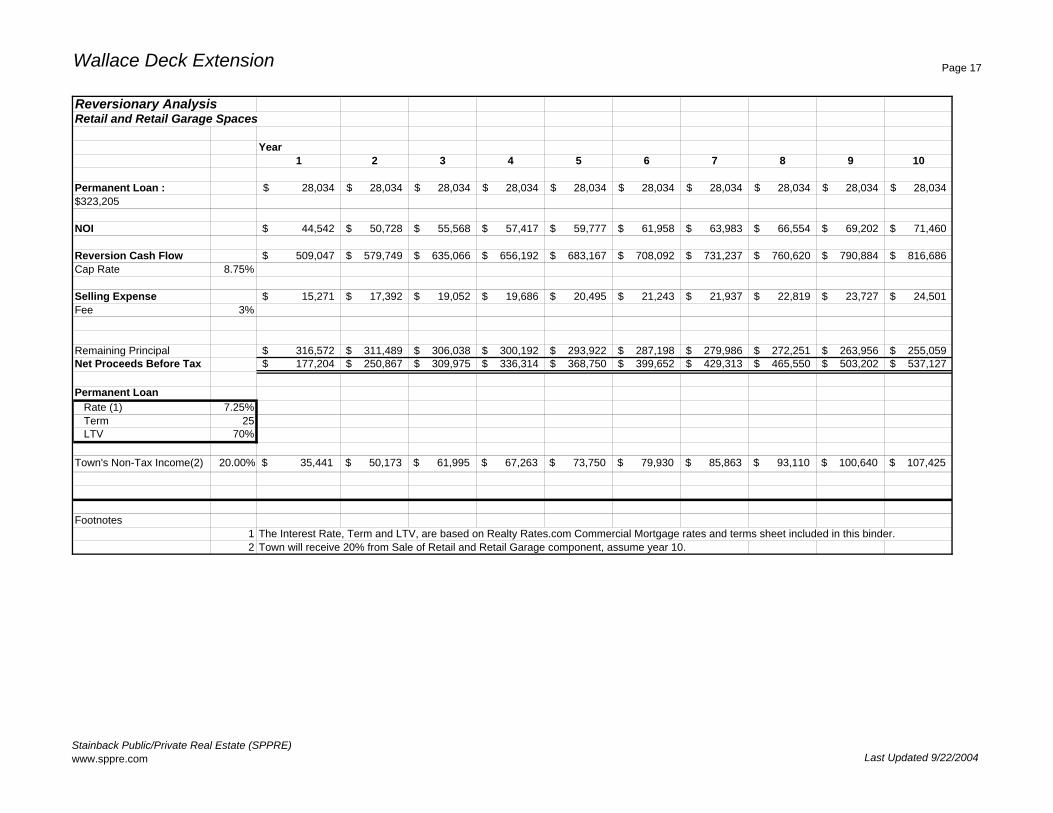
Wallace Deck Extension Page 17
Reversionary Analysis Retail and Retail Garage Spaces
Year 1 2 3 4 5 6 7 8 9 10
Permanent Loan : 28,034$ 28,034$ 28,034$ 28,034$ 28,034$ 28,034$ 28,034$ 28,034$ 28,034$ 28,034$ $323,205
NOI 44,542$ 50,728$ 55,568$ 57,417$ 59,777$ 61,958$ 63,983$ 66,554$ 69,202$ 71,460$
Reversion Cash Flow 509,047$ 579,749$ 635,066$ 656,192$ 683,167$ 708,092$ 731,237$ 760,620$ 790,884$ 816,686$ Cap Rate 8.75%
Selling Expense 15,271$ 17,392$ 19,052$ 19,686$ 20,495$ 21,243$ 21,937$ 22,819$ 23,727$ 24,501$ Fee 3%
Remaining Principal 316,572$ 311,489$ 306,038$ 300,192$ 293,922$ 287,198$ 279,986$ 272,251$ 263,956$ 255,059$ Net Proceeds Before Tax 177,204$ 250,867$ 309,975$ 336,314$ 368,750$ 399,652$ 429,313$ 465,550$ 503,202$ 537,127$
Permanent Loan Rate (1) 7.25%Term 25LTV 70%
Town's Non-Tax Income(2) 20.00% $ 35,441 $ 50,173 $ 61,995 $ 67,263 $ 73,750 $ 79,930 $ 85,863 $ 93,110 $ 100,640 $ 107,425
Footnotes1 The Interest Rate, Term and LTV, are based on Realty Rates.com Commercial Mortgage rates and terms sheet included in this binder. 2 Town will receive 20% from Sale of Retail and Retail Garage component, assume year 10.
Stainback Public/Private Real Estate (SPPRE)www.sppre.com Last Updated 9/22/2004
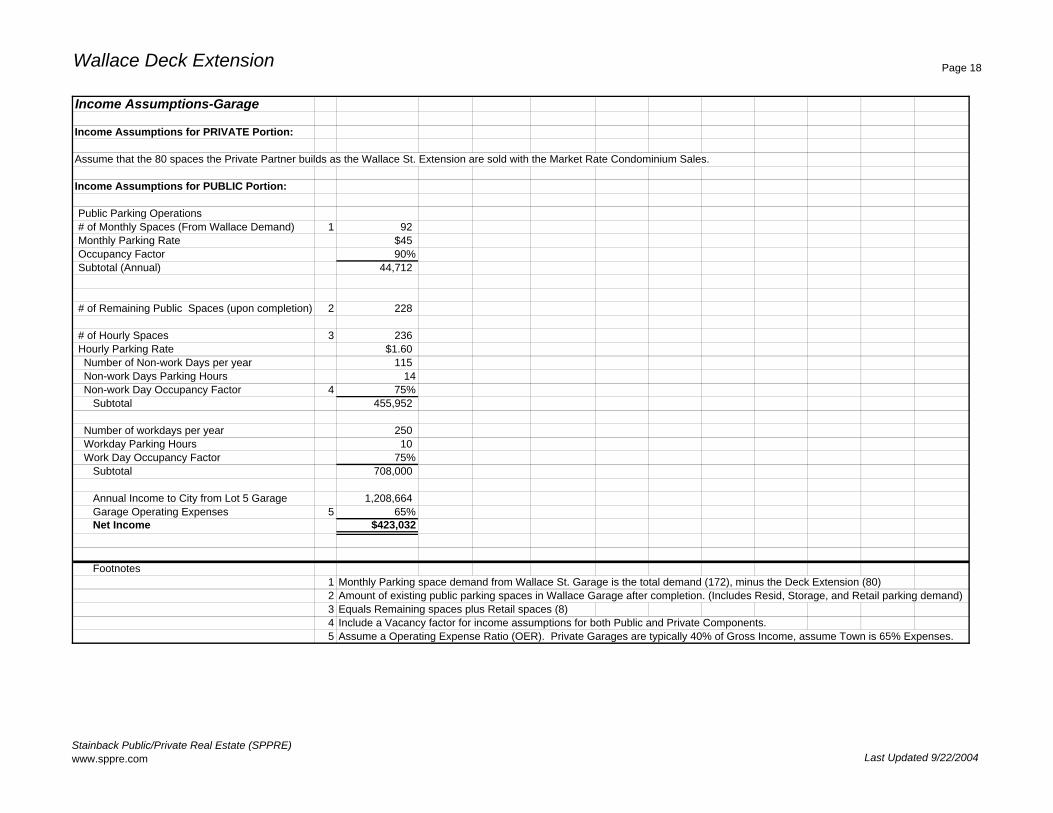
Wallace Deck Extension Page 18
Income Assumptions-Garage
Income Assumptions for PRIVATE Portion:
Assume that the 80 spaces the Private Partner builds as the Wallace St. Extension are sold with the Market Rate Condominium Sales.
Income Assumptions for PUBLIC Portion:
Public Parking Operations# of Monthly Spaces (From Wallace Demand) 1 92 Monthly Parking Rate $45Occupancy Factor 90%Subtotal (Annual) 44,712
# of Remaining Public Spaces (upon completion) 2 228
# of Hourly Spaces 3 236 Hourly Parking Rate $1.60Number of Non-work Days per year 115Non-work Days Parking Hours 14Non-work Day Occupancy Factor 4 75%
Subtotal 455,952
Number of workdays per year 250Workday Parking Hours 10Work Day Occupancy Factor 75%
Subtotal 708,000
Annual Income to City from Lot 5 Garage 1,208,664 Garage Operating Expenses 5 65%Net Income $423,032
Footnotes1 Monthly Parking space demand from Wallace St. Garage is the total demand (172), minus the Deck Extension (80)2 Amount of existing public parking spaces in Wallace Garage after completion. (Includes Resid, Storage, and Retail parking demand)3 Equals Remaining spaces plus Retail spaces (8)4 Include a Vacancy factor for income assumptions for both Public and Private Components. 5 Assume a Operating Expense Ratio (OER). Private Garages are typically 40% of Gross Income, assume Town is 65% Expenses.
Stainback Public/Private Real Estate (SPPRE)www.sppre.com Last Updated 9/22/2004

Wallace Deck Extension Page 19
Town Non-Tax Income/Tax Revenue
Year Year Year Year Year Year Year Year Year Year1 2 3 4 5 6 7 8 9 10
Income To City
Property Taxes 1Market Rate - Condo 231,147 231,147 231,147 238,082 238,082 238,082 245,224 245,224 245,224 252,581 Market Rate - Rental - - - - - - - - - - Affordable Housing-Ownership 43,528 43,528 43,528 44,834 44,834 44,834 46,179 46,179 46,179 47,564 Retail 7,420 7,420 7,420 7,643 7,643 7,643 7,872 7,872 7,872 8,108 Total Property Tax 282,095 282,095 282,095 290,558 290,558 290,558 299,275 299,275 299,275 308,253
Property Tax AllocationsOrange County 144,580 144,580 144,580 148,917 148,917 148,917 153,385 153,385 153,385 157,986 Chapel Hill/Carrboro School District 32,859 32,859 32,859 33,845 33,845 33,845 34,860 34,860 34,860 35,906 Chapel Hill City Revitalization 94,470 94,470 94,470 97,304 97,304 97,304 100,223 100,223 100,223 103,230 Downtown Revitalization District 10,186 10,186 10,186 10,492 10,492 10,492 10,807 10,807 10,807 11,131
Property Tax Income Available 104,656 104,656 104,656 107,796 107,796 107,796 111,030 111,030 111,030 114,361
Non-Tax IncomeLand Lease Payment (Condo Units & Garage) 2 2,257,383$ Town Sale Proceeds (year 4) 3 921,496$ Land Lease Payment (Affordable Units & Garage) 457,107$ Land Lease Payment (Retail Component) 4 7,373$ 7,373$ 7,373$ 7,593$ 7,593$ 7,593$ 7,820$ 7,820$ 7,820$ 8,054$ Potential Retail Component Sale Income 5 107,425$ Parking Income 423,032$ 427,263$ 431,535$ 435,851$ 440,209$ 444,611$ 449,057$ 453,548$ 458,083$ 462,664$ Total Non-Tax Income 3,144,894$ 434,635$ 438,908$ 1,364,940$ 447,802$ 452,204$ 456,878$ 461,368$ 465,904$ 578,144$
Total Income to TCH from Wallace 3,249,550$ 539,292$ 543,564$ 1,472,736$ 555,598$ 560,000$ 567,907$ 572,398$ 576,933$ 692,504$
Footnotes1 $1.717 per $100 of Assessed Value
0.88000 Orange County0.20000 Chapel Hill/Carrboro School District0.57500 Chapel Hill City Revitalization0.06200 Downtown Revitalization District
$1.71700 Total Property Tax:This includes the cost of the Garage in each Use Type. Property Taxes increase 3% every 3 years.
2 Land Lease Payment for Developer to build Condo Units and required parking on Wallace.3 Town will receive 20% of sale proceeds upon sellout of the Market-Rate Condos.4 Retail Base Rent is increased every 3 yr by the 2004 CPI at 2.99%. (Land lease payment (base rent) would continue after sale). 5 This assumes a possible sale of the Retail and Retail Garage Component in Year 10. 6 Wallace Deck is currently operating in a deficit, so the revenue above debt service is the opportunity cost.
Stainback Public/Private Real Estate (SPPRE)www.sppre.com Last Updated 9/22/2004

Lot 2 Development

Development Scenario: C-3Lot 2 Development (Phase 2A)
Finance ModelDowntown Chapel Hill ProjectsTown of Chapel Hill, North Carolina
Contents: Page
Building Program 1
Development Budget 2-8
Condominium Sales Proforma (Market-Rate) 9-10
Condominium Construction Loan (Market Rate) 11
Condominium Sales Proforma (Affordable Housing) 12-13
Condominium Construction Loan (Affordable Housing) 14
Proforma (10 years) (Retail and Retail Garage Spaces) 15-17
Reversionary Analysis (Retail and Retail Garage Spaces) 18
Income Assumptions-Garage 19
Town Non-Tax Income/Tax Revenue 20-21
Stainback Public/Private Real Estate (SPPRE)www.sppre.com
Last Updated 9/22/2004
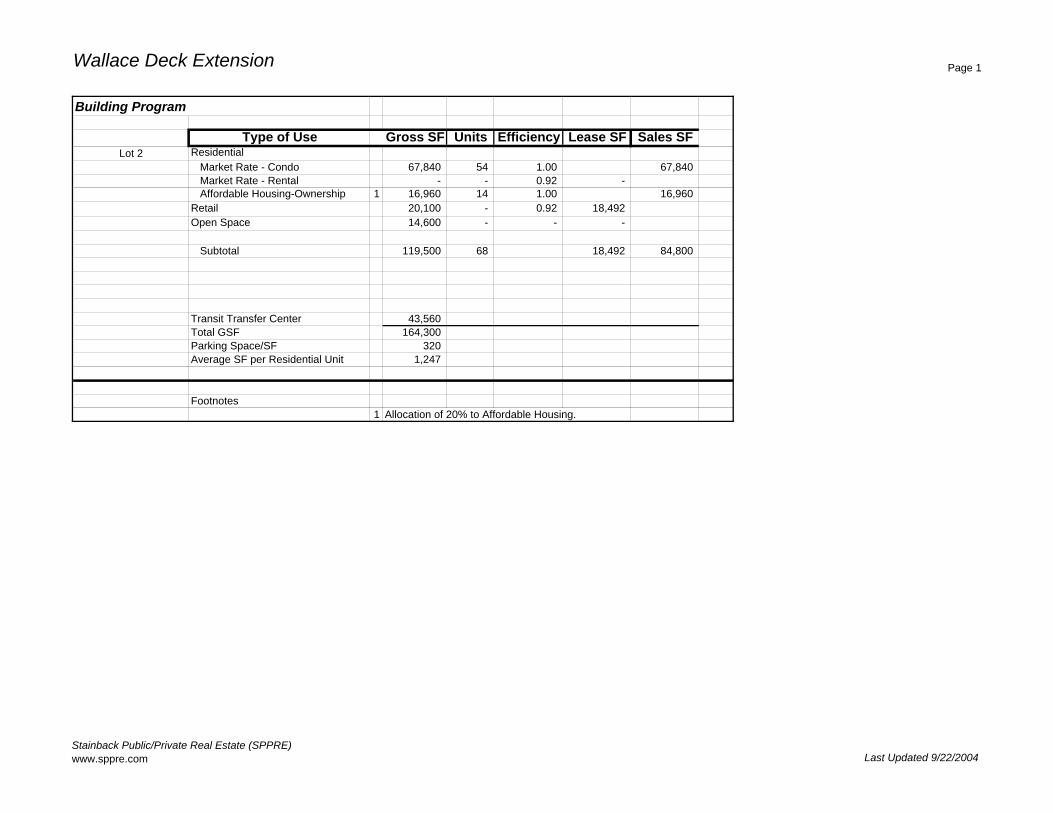
Wallace Deck Extension Page 1
Building Program
Type of Use Gross SF Units Efficiency Lease SF Sales SFLot 2 Residential
Market Rate - Condo 67,840 54 1.00 67,840 Market Rate - Rental - - 0.92 - Affordable Housing-Ownership 1 16,960 14 1.00 16,960
Retail 20,100 - 0.92 18,492 Open Space 14,600 - - -
Subtotal 119,500 68 18,492 84,800
Transit Transfer Center 43,560 Total GSF 164,300 Parking Space/SF 320 Average SF per Residential Unit 1,247
Footnotes1 Allocation of 20% to Affordable Housing.
Stainback Public/Private Real Estate (SPPRE)www.sppre.com Last Updated 9/22/2004

Wallace Deck Extension Page 2
Development Budget
Year 1 Year 2 Year 3 Year 4 Year 5 Year 6 Year 7 Year 8 Year 9 Year 10 TotalSite/Building Data
Total Gross Land Area 1 42,000
Gross Areas (GSF)Market Rate - Condo 67,840 Market Rate - Rental - Affordable Housing 16,960 Retail 20,100
Subtotal 104,900
Private Partner's Parking GSF 44,800 Parking Spaces 140
Public Partner's Parking GSF - Parking Spaces -
Sales Area (GSF)Market Rate - Condo 67,840 Affordable Housing 16,960
Subtotal 84,800
Private ParkingParking-Residential
Market Rate - Condo - Market Rate - Rental -
Subtotal -
Leaseable Areas (LSF)Market Rate - Rental - Retail 18,492
Subtotal 18,492
Stainback Public/Private Real Estate (SPPRE)www.sppre.com Last Updated 9/22/2004

Wallace Deck Extension Page 3
Appraised Value 2 1,600,000$ Land Valuation 3 2,240,518$
Building CostsResidential
Market Rate - Condo 4 6,957,663 Market Rate - Rental - Affordable Housing 5 1,425,064
Retail 6 1,964,542 Retail TI Allowance 443,808
Garage (Private)Parking-Residential
Market Rate - Condo - Market Rate - Rental - Affordable Housing-Ownership -
Parking-Residential StorageMarket Rate - Condo - Market Rate - Rental - Affordable Housing-Ownership -
Parking-Retail - Garage (Public)
TCH Garage Replacement Spaces - Subtotal 10,791,077
Hard Cost Contingency (3.0%) 7 323,732 323,732$
Total Hard CostsMarket Rate - Condo 7,166,393$
Market Rate - Rental -$ Affordable Housing 1,467,815$ Retail 2,480,601$
Garage (Private)Parking-Residential
Market Rate - Condo -$ Market Rate - Rental -$ Affordable Housing-Ownership -$
Parking-Residential StorageMarket Rate - Condo -$ Market Rate - Rental -$ Affordable Housing-Ownership -$
Parking-Retail -$ Garage (Public)
TCH Garage Replacement Spaces -$ Subtotal 11,114,809$ -$ -$ -$ -$ -$ -$ -$ -$ -$ 11,114,809$
Stainback Public/Private Real Estate (SPPRE)www.sppre.com Last Updated 9/22/2004

Wallace Deck Extension Page 4
Total Hard Costs/Condo Sales GSF 105.64$ Total Hard Costs/Affordable Housing GSF 86.55$ Total Hard Costs/Retail GSF 123.41$
Soft CostsArchitectural & Engineering 8 444,592$ 444,592$ A&E Reimburseables 9 44,459$ Consultants & Legal Counsel 110,000$ Performance Bond 10 94,476$ 94,476$ Insurance 11 -$ -$ Marketing 33,344$ 33,344$ Materials Testing & Inspection 16,672$ 16,672$ Soil Analysis 10,000$ Initial Leasing Commissions (Retail) 12 22,634$ 2,537$ 1,271$ 1,309$ 1,349$ 77$ -$ -$ -$ -$ 29,178$
Town FeesPermit Fee 14,694$ Impact Fee 13 -$ Plumbing Fees 14 816$ Mechanical Fees 150$ Electrical Fees 15 -$ Development Review Fees 16 13,400$ Site Plan Review 17 19,533$ Traffic Impact Study Fee 18 15,000$ Water Service Availability Fee 19 20,025$ Resd. Sewer Availability Fee 20 1,617$ Non-Resd. Sewer Availability Fee 21 25,678$
Soft Cost Contingency (3%) 26,613$ 26,613$ Total Soft Costs 913,704$ 2,537$ 1,271$ 1,309$ 1,349$ 77$ -$ -$ -$ -$ 920,247$
Total Hard and Soft Development CostsResidential
Market Rate - Condo 7,757,296$ Market Rate - Rental -$ Affordable Housing 1,615,541$
Retail 2,655,676$ Garage (Private)
Parking-ResidentialMarket Rate - Condo -$ Market Rate - Rental -$ Affordable Housing-Ownership -$
Parking-Residential StorageMarket Rate - Condo -$ Market Rate - Rental -$ Affordable Housing-Ownership -$
Stainback Public/Private Real Estate (SPPRE)www.sppre.com Last Updated 9/22/2004

Wallace Deck Extension Page 5
Parking-Retail -$ Garage (Public)
TCH Garage Replacement Spaces -$ Total: 12,028,513$ 2,537$ 1,271$ 1,309$ 1,349$ 77$ -$ -$ -$ -$ 12,035,056$
Stainback Public/Private Real Estate (SPPRE)www.sppre.com Last Updated 9/22/2004

Wallace Deck Extension Page 6
Indirect CostsDevelopment Fee 22 421,227$ Developer Project Overhead 23 90,263$ Title Insurance 24 12,035$ Debt Service Reserve Fund 25 -$
Total: 523,525$
Equity and Debt Placement FeesMarket Rate Condos & Parking
Equity Placement Fee: 85,007$ Debt Placement Fee: 99,174$
Affordable Housing & ParkingEquity Placement Fee 5,951$
Retail & Retail ParkingEquity Placement Fee: 28,938$ Debt Placement Fee: 33,761$
Interest During Construction (Public and Private) 26 #REF!
Total Development CostResidential
Market Rate - Condo 8,613,667$ Market Rate - Rental -$ Affordable Housing 1,750,862$
Retail 2,944,568$ Total: #REF!
Total Dev. Cost per Market-Rate Condo Unit 158,339$ Total Dev. Cost per Market-Affordable Unit 128,740$ Total Development Cost/Condo GSF 126.97$ Total Development Cost/Affordable GSF 103.23$ Total Development Cost/Retail GSF 146.50$ Total Development Cost:
Public Partner-Transit Transfer Center 0 2,141,037$
Stainback Public/Private Real Estate (SPPRE)www.sppre.com Last Updated 9/22/2004

Wallace Deck Extension Page 7
Footnotes
1 Land Area as 1.1 Acres.2 Source of appraised value: Analytical Consultants Inc. (July 22, 2004 Report). SPPRE has increased the price by %3 Assume a discount rate of 2.5% on the estimated Land Lease payments at 9% of appraised value. 4 Assume MR Condos are 83% of the const. estimate provided by McDonald York. Cost for Open Space is allocated to Cost. 5 Assume Aff. Housing Condos are 17% of the const. estimate provided by McDonald York. Cost for Open Space is allocated to Cost. 6 Assume cost for Open Space is allocated in the construction estimate from McDonald-York. 7 The Hard Cost Contingency is 3.0% of the Building Costs.8 The A&E Fee is 4.0% of Total Hard Construction Cost.9 A&E Reimburseables cost covers costs such as reproduction of Construction Documents.
10 Performance Bonds are a surety company's guarantee of completion or performance of a General Contractor's contract.11 Insurance is included in the McDonald-York estimate.12 Initial Leasing Commission are accrued in years 1-3 for the Retail component only. 13 Waived for Town permits?14 Inside Town limits: $6 per fixture, assume 2 fixtures per unit.15 TBD-Fee is based on meter/amps.16 All Master Land Use Plans- $5,000 plus $20 per 100sf of land area.17 Site Plan Review Fee: $1,700 plus $17 per 100sf of floor area.18 Town Charges $10-$20k per site for a Consultant to complete a Traffic Impact Study.19 Non-Residential Water service availability fee: $20,025. (Assume 2" meter)20 Residential Sewer Service Availability Fee: $1,617 (5/8" meter multi-family residential)21 Non-Residential Sewer availability fee: $2,568.00. (Assume 2" meter)22 This Development fee is 3.50% of the Total Development Budget for Residential/Retail/Garage.23 Developer Project Overhead is .75% of the Total Development Budget.24 Assume fee of $1.00 per $1,000, plus binder fee.25 DSRF is a fund for 6-months of Debt Service on permanent loan. (Private Partners option to include) 26 This is the sum of varying Interest Rates, Terms, and Financing Instruments per project type.
Stainback Public/Private Real Estate (SPPRE)www.sppre.com Last Updated 9/22/2004

Wallace Deck Extension Page 8
Condominium Sales Proforma (Market-Rate)
General Inputs Financial Inputs Income FactorsBuilding value (Market Rate Only) 1 8,095,865 LTV: 70% Sales Price/Unit $224,471Land Lease Payout 1,448,968 Equity 2,863,450 Price per SF 180.00Total Value 9,544,833 Beginning Loan Amount 6,681,383 Number of Units 54Construction (years): 1.5 Ending Loan Amount 7,232,149 Sellout Period (years) 2
Interest Rate 7.00% Gross Sales 12,211,200Term 30Quarterly Payment 133,354
Jan-06 Feb-06 Mar-06 Apr-06 May-06 Jun-06 Jul-06 Aug-06 Sep-06 Oct-06 Nov-06Month 0 1 2 3 4 5 6 7 8 9 10
Income 3 3 3 3 3 3 3 3 2 2 Residential 2
Market Rate Condo Home Sales 673,412 673,412 673,412 673,412 673,412 673,412 673,412 673,412 508,800 508,800 Garage Parking Sales 3 0 0 0 0 0 0 0 0 0 0
Cash Flow Before Financing 673,412 673,412 673,412 673,412 673,412 673,412 673,412 673,412 508,800 508,800
Interest Calculation During Construction
Equity 2,863,450 Loan DrawBalance with InterestInterestPrinciple Cumulative Balance 7,232,149 6,930,810 6,629,470 6,328,131 6,026,791 5,725,452 5,424,112 5,122,773 4,821,433 4,520,093 4,218,754
Interest 42,188 40,430 38,672 36,914 35,156 33,398 31,641 29,883 28,125 26,367 Principal Reduction 301,340 301,340 301,340 301,340 301,340 301,340 301,340 301,340 301,340 301,340 Debt Service 343,527 341,769 340,011 338,254 336,496 334,738 332,980 331,222 329,465 327,707
Loan Payoff
Cash Flow After Financing (2,863,450) 329,885 331,642 333,400 335,158 336,916 338,674 340,432 342,189 179,335 181,093
Profit 1,483,503 Sale Payment to TCH 4 296,701 20%Net Profit 1,186,803 Return on Equity 41.45%
Footnotes1 Building value is the ratio of SF to total building cost as estimated by McDonald-York2 Assume that the Residents will have an annual association fee covering Exterior maintenance, Insurance, Trash pickup, and Basic Cable. 3 Parking Spaces will be leased from the Town and located at RBC Garage for Lot 2 Demand. Total (140)4 20% of the Profits will goto the Town at Sale. The Land Lease Payment made to the town is in month 1 from Equity Funding.
Stainback Public/Private Real Estate (SPPRE)www.sppre.com Last Updated 9/22/2004

Wallace Deck Extension Page 9
Dec-06 Jan-07 Feb-07 Mar-07 Apr-07 May-07 Jun-07 Jul-07 Aug-07 Sep-07 Oct-07 Nov-07 Dec-07 Jan-0811 12 13 14 15 16 17 18 19 20 21 22 23 24
2 2 2 2 2 2 2 2 2 1 1 1 1 1
508,800 508,800 508,800 508,800 508,800 508,800 508,800 508,800 508,800 224,471 224,471 224,471 224,471 224,471 0 0 0 0 0 0 0 0 0 0 0 0 0 0
508,800 508,800 508,800 508,800 508,800 508,800 508,800 508,800 508,800 224,471 224,471 224,471 224,471 224,471
3,917,414 3,616,075 3,314,735 3,013,396 2,712,056 2,410,716 2,109,377 1,808,037 1,506,698 1,205,358 904,019 602,679 301,340 (0)
24,609 22,852 21,094 19,336 17,578 15,820 14,063 12,305 10,547 8,789 7,031 5,273 3,516 1,758 301,340 301,340 301,340 301,340 301,340 301,340 301,340 301,340 301,340 301,340 301,340 301,340 301,340 301,340 325,949 324,191 322,433 320,676 318,918 317,160 315,402 313,644 311,886 310,129 308,371 306,613 304,855 303,097
182,851 184,609 186,367 188,124 189,882 191,640 193,398 195,156 196,914 (85,658) (83,900) (82,142) (80,385) (78,627)
Stainback Public/Private Real Estate (SPPRE)www.sppre.com Last Updated 9/22/2004

Wallace Deck Extension Page 10
Condominium Construction Loan (Market Rate)
Construction Period: 18 mosSellout: 24 mos
Land Costs: (1) 1,448,968 Building Costs: 8,095,865$ Total Costs: 9,544,833$
LTV: 70%Interest Rate: 7.00%Debt 6,681,383$ Equity: 2,863,450$
Date Construction Cost Loan Fees (3) Equity Loan Draw Interest Total Outstanding9,544,833 217,145 2,863,450 6,898,528 333,621 7,232,149
1 Jul-04 1,898,738 217,145 2,115,883 - - - 2 Aug-04 449,770 449,770 - - - 3 Sep-04 449,770 297,796 151,974 887 152,860 4 Oct-04 449,770 - 449,770 2,624 605,254 5 Nov-04 449,770 - 449,770 2,624 1,057,648 6 Dec-04 449,770 - 449,770 8,793 1,516,212 7 Jan-05 449,770 - 449,770 11,468 1,977,450 8 Feb-05 449,770 - 449,770 14,159 2,441,379 9 Mar-05 449,770 - 449,770 16,865 2,908,015
10 Apr-05 449,770 449,770 19,587 3,377,372 11 May-05 449,770 449,770 22,325 3,849,467 12 Jun-05 449,770 449,770 25,079 4,324,317 13 Jul-05 449,770 449,770 27,849 4,801,936 14 Aug-05 449,770 449,770 30,635 5,282,341 15 Sep-05 449,770 449,770 33,437 5,765,549 16 Oct-05 449,770 449,770 36,256 6,251,575 17 Nov-05 449,770 449,770 39,091 6,740,436 18 Dec-05 449,770 449,770 41,943 7,232,149
Footnotes1 Land costs are included in the Total Development budget and are equal to the percentage of Market Rate Condo use in the building, (80%).3 The Loan Fees are equal to 3.50% of equity and 1.75% of debt.
Stainback Public/Private Real Estate (SPPRE)www.sppre.com Last Updated 9/22/2004

Wallace Deck Extension Page 11
Condominium Sales Proforma (Affordable Housing)
General Inputs Financial Inputs Income FactorsBuilding value (Affordable Only) 1 1,700,183 LTV: 90% Sales Price/Unit $89,788Land Lease Payout 2 362,242 Equity 206,243 Price per SF 72.00Grant-FHLB (AHP Grant) - Beginning Loan Amount 2,062,425 Number of Units 14Total Value 2,062,425 Ending Loan Amount 1,700,533 Sellout Period (months) 22Construction (years): 1.5 Senior Mortgage-FNMA (75% of debt) Gross Sales 1,221,120
Interest Rate 4.25%Term (years) 20
Junior Mortgage-FNMA (25% of debt)Interest Rate 2.50%Term (years) 25
Quarterly Payment $35,675
Jan-06 Feb-06 Mar-06 Apr-06 May-06 Jun-06 Jul-06 Aug-06 Sep-06Month 0 1 2 3 4 5 6 7 8
Income 1 1 1 1 1 1 1 1 Residential 3
Affordable Condo Home Sales 89,788 89,788 89,788 89,788 89,788 89,788 89,788 89,788 Garage Parking Sales 4 0 0 0 0 0 0 0 0
Cash Flow Before Financing 89,788 89,788 89,788 89,788 89,788 89,788 89,788 89,788
Interest Calculation During Construction
Equity 206,243 Loan DrawBalance with InterestInterestPrinciple Cumulative Balance 1,700,533 1,623,236 1,545,939 1,468,643 1,391,346 1,314,049 1,236,752 1,159,455 1,082,158
Interest 4,783 4,565 4,348 4,131 3,913 3,696 3,478 3,261 Principal Reduction 77,297 77,297 77,297 77,297 77,297 77,297 77,297 77,297 Debt Service 82,080 81,862 81,645 81,428 81,210 80,993 80,775 80,558
Loan Payoff
Cash Flow After Financing (206,243) 7,709 7,926 8,143 8,361 8,578 8,795 9,013 9,230
Net Profit 13,564 Return on Equity 6.58%
Footnotes1 Building value is proportionate to the percentage of Affordable housing in the building. 2 Land Value is the amount proportioned for Affordable Housing including required parking.3 Assume that the Residents will have an annual association fee covering Exterior maintenance, Insurance, Trash pickup, and Basic Cable. 4 Assume that Residents will Lease required spaces, including storage spaces, from Town in RBC Garage.
Stainback Public/Private Real Estate (SPPRE)www.sppre.com Last Updated 9/22/2004

Wallace Deck Extension Page 12
Oct-06 Nov-06 Dec-06 Jan-07 Feb-07 Mar-07 Apr-07 May-07 Jun-07 Jul-07 Aug-07 Sep-07 Oct-07 Nov-079 10 11 12 13 14 15 16 17 18 19 20 21 22
1 1 1 1 1 1 1 1 1 1 1 1 1 1
89,788 89,788 89,788 89,788 89,788 89,788 89,788 89,788 89,788 89,788 89,788 89,788 89,788 89,788 0 0 0 0 0 0 0 0 0 0 0 0 0 0
89,788 89,788 89,788 89,788 89,788 89,788 89,788 89,788 89,788 89,788 89,788 89,788 89,788 89,788
1,004,861 927,564 850,267 772,970 695,673 618,376 541,079 463,782 386,485 309,188 231,891 154,594 77,297 (0)
3,044 2,826 2,609 2,391 2,174 1,957 1,739 1,522 1,304 1,087 870 652 435 217 77,297 77,297 77,297 77,297 77,297 77,297 77,297 77,297 77,297 77,297 77,297 77,297 77,297 77,297 80,341 80,123 79,906 79,688 79,471 79,254 79,036 78,819 78,601 78,384 78,167 77,949 77,732 77,514
9,448 9,665 9,882 10,100 10,317 10,535 10,752 10,969 11,187 11,404 11,622 11,839 12,056 12,274
Stainback Public/Private Real Estate (SPPRE)www.sppre.com Last Updated 9/22/2004
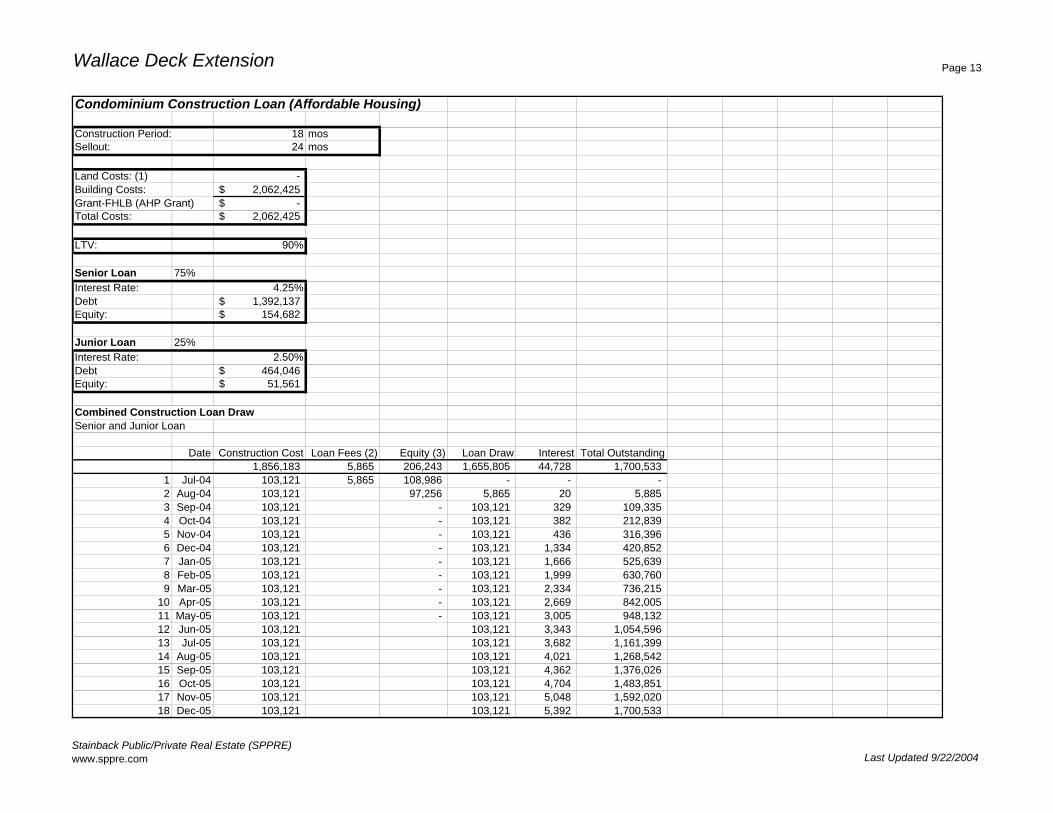
Wallace Deck Extension Page 13
Condominium Construction Loan (Affordable Housing)
Construction Period: 18 mosSellout: 24 mos
Land Costs: (1) - Building Costs: 2,062,425$ Grant-FHLB (AHP Grant) -$ Total Costs: 2,062,425$
LTV: 90%
Senior Loan 75%Interest Rate: 4.25%Debt 1,392,137$ Equity: 154,682$
Junior Loan 25%Interest Rate: 2.50%Debt 464,046$ Equity: 51,561$
Combined Construction Loan DrawSenior and Junior Loan
Date Construction Cost Loan Fees (2) Equity (3) Loan Draw Interest Total Outstanding1,856,183 5,865 206,243 1,655,805 44,728 1,700,533
1 Jul-04 103,121 5,865 108,986 - - - 2 Aug-04 103,121 97,256 5,865 20 5,885 3 Sep-04 103,121 - 103,121 329 109,335 4 Oct-04 103,121 - 103,121 382 212,839 5 Nov-04 103,121 - 103,121 436 316,396 6 Dec-04 103,121 - 103,121 1,334 420,852 7 Jan-05 103,121 - 103,121 1,666 525,639 8 Feb-05 103,121 - 103,121 1,999 630,760 9 Mar-05 103,121 - 103,121 2,334 736,215
10 Apr-05 103,121 - 103,121 2,669 842,005 11 May-05 103,121 - 103,121 3,005 948,132 12 Jun-05 103,121 103,121 3,343 1,054,596 13 Jul-05 103,121 103,121 3,682 1,161,399 14 Aug-05 103,121 103,121 4,021 1,268,542 15 Sep-05 103,121 103,121 4,362 1,376,026 16 Oct-05 103,121 103,121 4,704 1,483,851 17 Nov-05 103,121 103,121 5,048 1,592,020 18 Dec-05 103,121 103,121 5,392 1,700,533
Stainback Public/Private Real Estate (SPPRE)www.sppre.com Last Updated 9/22/2004

Wallace Deck Extension Page 14
Footnotes1 Land costs are inlcuded in the Building Cost because the 10% Equity amount does not equal the Land Lease Payment for Affordable Housing.2 The Loan Fees are equal to 3.50% of debt and .00% of equity.3 Includes the $200,000 FHLB Grant (AHP Program) for as non-leveraged equity for Affordable Housing.
Stainback Public/Private Real Estate (SPPRE)www.sppre.com Last Updated 9/22/2004

Wallace Deck Extension Page 15
Proforma (10 years) Year Year Year Year Year Year Year Year Year YearRetail and Retail Garage Spaces 1 2 3 4 5 6 7 8 9 10
Potential Gross IncomeRetail 1 443,808$ 457,122$ 470,836$ 484,961$ 499,510$ 514,495$ 529,930$ 545,828$ 562,203$ 579,069$ Garage (Retail Spaces) 2 -$ -$ -$ -$ -$ -$ -$ -$ -$ -$
Total 443,808$ 457,122$ 470,836$ 484,961$ 499,510$ 514,495$ 529,930$ 545,828$ 562,203$ 579,069$
Vacancy/Collections Loss (VCL) 3 66,571$ 45,712$ 32,959$ 33,947$ 34,966$ 36,015$ 37,095$ 38,208$ 39,354$ 40,535$ Vacancy Rate 15% 10% 7% 7% 7% 7% 7% 7% 7% 7%Effective Gross Income (EGI) 377,237 411,410 437,877 451,014 464,544 478,480 492,835 507,620 522,849 538,534
Non-Tax Income to TownLand Lease Payment (Base) 4 47,224$ 47,224$ 47,224$ 48,636$ 48,636$ 48,636$ 50,090$ 50,090$ 50,090$ 51,588$
Total 47,224$ 47,224$ 47,224$ 48,636$ 48,636$ 48,636$ 50,090$ 50,090$ 50,090$ 51,588$
Building MaintenanceElectrical 1,017$ 1,048$ 1,079$ 1,111$ 1,145$ 1,179$ 1,214$ 1,251$ 1,288$ 1,327$ Plumbing 444$ 457$ 471$ 485$ 500$ 514$ 530$ 546$ 562$ 579$ HVAC 2,681$ 2,762$ 2,845$ 2,930$ 3,018$ 3,108$ 3,202$ 3,298$ 3,397$ 3,499$ Roof 147$ 152$ 156$ 161$ 166$ 171$ 176$ 181$ 187$ 192$ Painting 130$ 134$ 138$ 142$ 146$ 150$ 155$ 160$ 164$ 169$ Canopies/Store Fronts 383$ 395$ 407$ 419$ 431$ 444$ 458$ 471$ 486$ 500$ Other 295$ 304$ 313$ 322$ 332$ 342$ 352$ 363$ 373$ 385$
Total 5,097$ 5,250$ 5,408$ 5,570$ 5,737$ 5,909$ 6,087$ 6,269$ 6,457$ 6,651$
Exterior CAMLandscape 2,090$ 2,152$ 2,217$ 2,283$ 2,352$ 2,422$ 2,495$ 2,570$ 2,647$ 2,726$ Trash Removal 1,590$ 1,638$ 1,687$ 1,738$ 1,790$ 1,844$ 1,899$ 1,956$ 2,015$ 2,075$ Sweeping 962$ 990$ 1,020$ 1,051$ 1,082$ 1,115$ 1,148$ 1,183$ 1,218$ 1,255$ Sidewalk Maintenance 849$ 875$ 901$ 928$ 956$ 984$ 1,014$ 1,044$ 1,076$ 1,108$ Security 7,304$ 7,523$ 7,749$ 7,982$ 8,221$ 8,468$ 8,722$ 8,983$ 9,253$ 9,531$ Lighting 832$ 857$ 883$ 909$ 937$ 965$ 994$ 1,023$ 1,054$ 1,086$ Directory/Signs 100$ 103$ 106$ 110$ 113$ 116$ 120$ 123$ 127$ 131$ Electricity 3,495$ 3,600$ 3,708$ 3,819$ 3,934$ 4,052$ 4,173$ 4,298$ 4,427$ 4,560$ Water 778$ 802$ 826$ 851$ 876$ 902$ 929$ 957$ 986$ 1,016$ Other Exterior CAM 519$ 534$ 551$ 567$ 584$ 602$ 620$ 638$ 657$ 677$ Fire Monitoring Service 425$ 437$ 450$ 464$ 478$ 492$ 507$ 522$ 538$ 554$
Total 18,944$ 19,512$ 20,098$ 20,701$ 21,322$ 21,961$ 22,620$ 23,299$ 23,998$ 24,718$
Stainback Public/Private Real Estate (SPPRE)www.sppre.com Last Updated 9/22/2004

Wallace Deck Extension Page 16
General & AdministrativeManagement Fee 5 22,634$ 23,313$ 23,313$ 23,313$ 23,313$ 23,313$ 23,313$ 23,313$ 23,313$ 23,313$ Leasing Commissions 6 -$ -$ -$ -$ -$ 1,312$ 1,431$ 1,474$ 1,518$ 1,563$ Marketing 778$ 802$ 826$ 851$ 876$ 902$ 929$ 957$ 986$ 1,016$ Property Taxes 7 47,320$ 47,320$ 47,320$ 48,740$ 48,740$ 48,740$ 50,202$ 50,202$ 50,202$ 51,708$ Business & Occupation Tax 8 -$ -$ -$ -$ -$ -$ -$ -$ -$ -$ Insurance 8,562$ 8,819$ 9,083$ 9,356$ 9,636$ 9,926$ 10,223$ 10,530$ 10,846$ 11,171$ Other 354$ 364$ 375$ 387$ 398$ 410$ 422$ 435$ 448$ 462$
Total 79,649$ 80,618$ 80,918$ 82,646$ 82,964$ 84,603$ 86,521$ 86,911$ 87,313$ 89,233$
Town FeesRecycling Fee 9 -$ -$ -$ -$ -$ -$ -$ -$ -$ -$ Storm Water Fees 10 392$ 392$ 392$ 392$ 392$ 392$ 392$ 392$ 392$ 392$ Water Service Fee 11 1,501$ 1,501$ 1,501$ 1,501$ 1,501$ 1,501$ 1,501$ 1,501$ 1,501$ 1,501$
Total 1,893$ 1,893$ 1,893$ 1,893$ 1,893$ 1,893$ 1,893$ 1,893$ 1,893$ 1,893$
Total Operating Expenses 152,807$ 154,498$ 155,541$ 159,446$ 160,552$ 163,003$ 167,212$ 168,463$ 169,752$ 174,083$ OER 41% 38% 36% 35% 35% 34% 34% 33% 32% 32%
Net Operating Income (NOI) 224,429$ 256,912$ 282,336$ 291,568$ 303,992$ 315,477$ 325,623$ 339,157$ 353,097$ 364,451$
Debt Service 12 178,782$ 178,782$ 178,782$ 178,782$ 178,782$ 178,782$ 178,782$ 178,782$ 178,782$ 178,782$ CFBTD 45,648$ 78,130$ 103,555$ 112,786$ 125,210$ 136,696$ 146,841$ 160,375$ 174,315$ 1,930,876$
IRR Including Reversion Value 14 16.76%
Return on Cost (ROC) 15 9.59%
Debt Coverage Ratio (DCR) 1.26 1.44 1.58 1.63 1.70
Maximum Loan Amount 16 2,258,692$ (Assume 8.75% cap rate, 70% LTV)
Stainback Public/Private Real Estate (SPPRE)www.sppre.com Last Updated 9/22/2004

Wallace Deck Extension Page 17
Footnotes1 Assumed Retail lease rate in year 1 of $24.00 per LSF. This includes a CAM Reimburseable in the LSF rate.2 No Income from spaces per Retail Use. Assume Town manages and supplies the (38) spaces. 3 Vacancy rate for stabilized year is 7%4 Lease Payment to Town is 11% of appraised value specific to the Retail portion of bldg program ONLY. (NO Ramp-up)5 Management fee of 6.0% of Effective Gross Income. 6 Rollover Leasing Commission are paid at 5.0% of Initial Leasing Commissions for Retail space. 7 Property Tax is $1.717 per $100 of Assessed Market Value. 8 No Business & Occupation Tax in Chapel Hill9 Recycling Fee: Basic Service($27/unit/yr) (Number of Retail units TBD). 10 $39 per every 2,000 SF of impervious surface (based on Retail GSF only).11 Assume 3" meter size at $125.12 per month12 Debt Service is calculated on the Retail Reversionary Value Worksheet.14 Assume building is sold in year 10 and Town receives 20% of proceeds.15 Use ROC stabilization year 3.16 The required construction loan is $2,061,198 compared with $2,258,692 available using stabilization year: 3, cap rate: 8.75%, LTV: 70%
Stainback Public/Private Real Estate (SPPRE)www.sppre.com Last Updated 9/22/2004

Wallace Deck Extension Page 18
Reversionary Analysis Retail and Retail Garage Spaces
Year 1 2 3 4 5 6 7 8 9 10
Permanent Loan : 178,782$ 178,782$ 178,782$ 178,782$ 178,782$ 178,782$ 178,782$ 178,782$ 178,782$ 178,782$ $2,061,198
NOI 224,429$ 256,912$ 282,336$ 291,568$ 303,992$ 315,477$ 325,623$ 339,157$ 353,097$ 364,451$
Reversion Cash Flow 2,564,908$ 2,936,132$ 3,226,703$ 3,332,200$ 3,474,194$ 3,605,455$ 3,721,408$ 3,876,078$ 4,035,389$ 4,165,150$ Cap Rate 8.75%
Selling Expense 76,947$ 88,084$ 96,801$ 99,966$ 104,226$ 108,164$ 111,642$ 116,282$ 121,062$ 124,954$ Fee 3%
Remaining Principal 2,018,891$ 1,986,479$ 1,951,717$ 1,914,435$ 1,874,449$ 1,831,565$ 1,785,572$ 1,736,244$ 1,683,340$ 1,626,601$ Net Proceeds Before Tax 469,069$ 861,569$ 1,178,185$ 1,317,800$ 1,495,519$ 1,665,726$ 1,824,194$ 2,023,552$ 2,230,987$ 2,413,595$
Permanent Loan Rate (1) 7.25%Term 25LTV 70%
Town's Non-Tax Income(2) 20.00% $ 93,814 $ 172,314 $ 235,637 $ 263,560 $ 299,104 $ 333,145 $ 364,839 $ 404,710 $ 446,197 $ 482,719
Footnotes1 The Interest Rate, Term and LTV, are based on Realty Rates.com Commercial Mortgage rates and terms sheet included in this binder. 2 Town will receive 20% from Sale of Retail and Retail Garage component, assume year 10.
Stainback Public/Private Real Estate (SPPRE)www.sppre.com Last Updated 9/22/2004
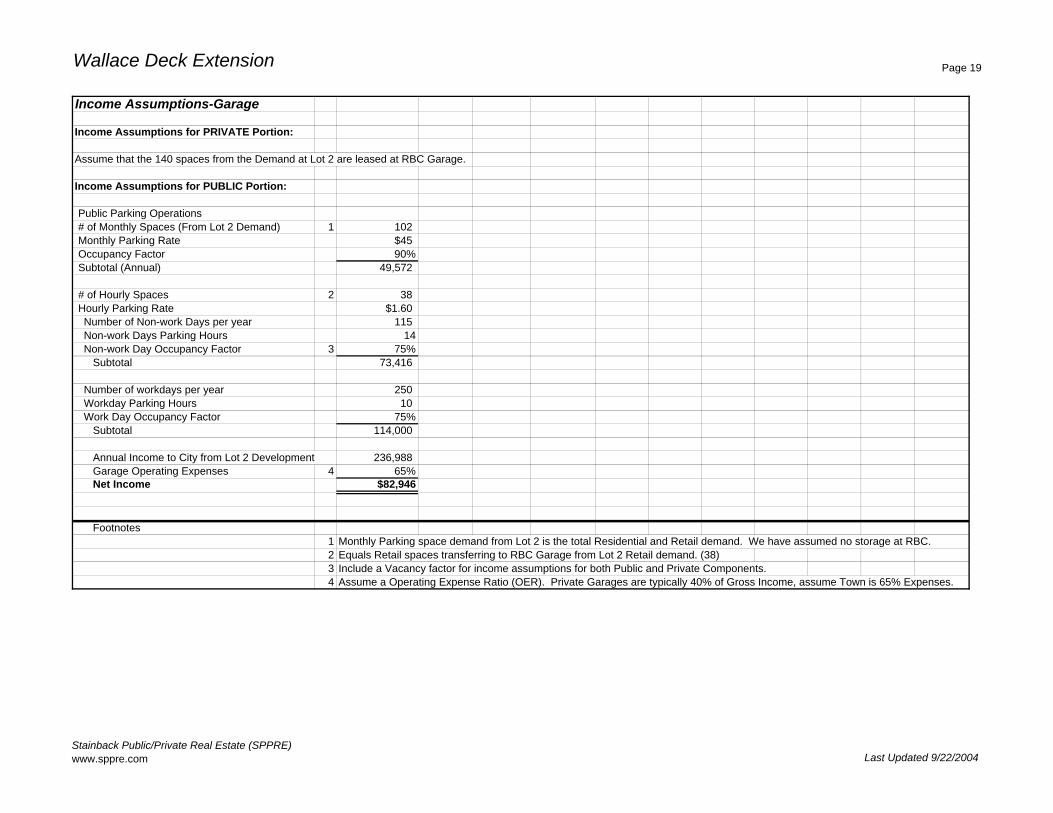
Wallace Deck Extension Page 19
Income Assumptions-Garage
Income Assumptions for PRIVATE Portion:
Assume that the 140 spaces from the Demand at Lot 2 are leased at RBC Garage.
Income Assumptions for PUBLIC Portion:
Public Parking Operations# of Monthly Spaces (From Lot 2 Demand) 1 102 Monthly Parking Rate $45Occupancy Factor 90%Subtotal (Annual) 49,572
# of Hourly Spaces 2 38 Hourly Parking Rate $1.60Number of Non-work Days per year 115Non-work Days Parking Hours 14Non-work Day Occupancy Factor 3 75%
Subtotal 73,416
Number of workdays per year 250Workday Parking Hours 10Work Day Occupancy Factor 75%
Subtotal 114,000
Annual Income to City from Lot 2 Development 236,988 Garage Operating Expenses 4 65%Net Income $82,946
Footnotes1 Monthly Parking space demand from Lot 2 is the total Residential and Retail demand. We have assumed no storage at RBC.2 Equals Retail spaces transferring to RBC Garage from Lot 2 Retail demand. (38)3 Include a Vacancy factor for income assumptions for both Public and Private Components. 4 Assume a Operating Expense Ratio (OER). Private Garages are typically 40% of Gross Income, assume Town is 65% Expenses.
Stainback Public/Private Real Estate (SPPRE)www.sppre.com Last Updated 9/22/2004

Wallace Deck Extension Page 20
Town Non-Tax Income/Tax Revenue
Year Year Year Year Year Year Year Year Year Year1 2 3 4 5 6 7 8 9 10
Transit Transfer Center (2,141,037)$
Income To City
Property Taxes 1Market Rate - Condo 139,006 139,006 139,006 143,176 143,176 143,176 147,471 147,471 147,471 151,896 Market Rate - Rental - - - - - - - - - - Affordable Housing-Ownership 29,192 29,192 29,192 30,068 30,068 30,068 30,970 30,970 30,970 31,899 Retail 47,320 47,320 47,320 48,740 48,740 48,740 50,202 50,202 50,202 51,708 Total Property Tax 215,518 215,518 215,518 221,984 221,984 221,984 228,644 228,644 228,644 235,503
Property Tax AllocationsOrange County 110,458 110,458 110,458 113,772 113,772 113,772 117,185 117,185 117,185 120,700 Chapel Hill/Carrboro School District 25,104 25,104 25,104 25,857 25,857 25,857 26,633 26,633 26,633 27,432 Chapel Hill City Revitalization 72,174 72,174 72,174 74,339 74,339 74,339 76,570 76,570 76,570 78,867 Downtown Revitalization District 7,782 7,782 7,782 8,016 8,016 8,016 8,256 8,256 8,256 8,504
Property Tax Income Available 79,956 79,956 79,956 82,355 82,355 82,355 84,826 84,826 84,826 87,371
Non-Tax IncomeLand Lease Payment (Condo Units & Garage) 2 1,448,968$ Town Sale Proceeds MR-Condo (year 4) 3 296,701$ Land Lease Payment (Affordable Units & Garage) 362,242$ -$ Base Rent (Retail Component) 4 47,224$ 47,224$ 47,224$ 48,636$ 48,636$ 48,636$ 50,090$ 50,090$ 50,090$ 51,588$ Potential Retail Component Sale Income 5 482,719$ Parking Income (From Lot 2 Demand to RBC) 82,946$ 83,775$ 84,613$ 85,459$ 86,314$ 87,177$ 88,049$ 88,929$ 89,818$ 90,717$ Total Non-Tax Income 1,941,380$ 130,999$ 131,837$ 430,796$ 134,950$ 135,813$ 138,139$ 139,019$ 139,909$ 625,023$
Total Income to TCH from Wallace 2,021,336$ 210,956$ 211,793$ 513,151$ 217,305$ 218,168$ 222,965$ 223,845$ 224,734$ 712,394$
Lot 2 Current Current Income 6 285,000$ 285,000$ 285,000$ 293,522$ 293,522$ 293,522$ 302,298$ 302,298$ 302,298$ 311,336$ Town Opportunity Cost for Lot 2 Land Investment 709% 74% 74% 175% 74% 74% 74% 74% 74% 229%
Footnotes1 $1.717 per $100 of Assessed Value
0.88000 Orange County0.20000 Chapel Hill/Carrboro School District0.57500 Chapel Hill City Revitalization0.06200 Downtown Revitalization District
$1.71700 Total Property Tax:This includes the cost of the Garage in each Use Type. Property Taxes increase 3% every 3 years.
Stainback Public/Private Real Estate (SPPRE)www.sppre.com Last Updated 9/22/2004
Wallace Deck Extension Page 21
2 Land Lease Payment for Developer to build Condo Units and required parking on Lot 2.3 Town will receive 20% of sale proceeds upon sellout of the Market-Rate Condos.4 Retail Base Rent is increased every 3 yr by the 2004 CPI at 2.99%. (Land lease payment (base rent) would continue after sale) 5 This assumes a possible sale of the Retail and Retail Garage Component in Year 10. 6 Lot 2 Current Revenues
Stainback Public/Private Real Estate (SPPRE)www.sppre.com Last Updated 9/22/2004
RBC Garage
Development Scenario: C-3RBC Garage (Phase 2B)
Finance ModelDowntown Chapel Hill ProjectsTown of Chapel Hill, North Carolina
Contents: Page
Building Program 1Total Development Budget 2-3Proforma (20 Years) 4-5Finance 6Income Assumptions 7Town Non-Tax/Tax Income 8
Stainback Public/Private Real Estate LLC (SPPRE)
Last Updated: 9/22/2004

RBC Garage Page 1
Building Program
Type of Use Gross SF Units Efficiency Lease SFRBC Retail Space-Ground Level 1 8,400 0.92 7,728
Parking-Market Rate Condos (Lot 2) 2 25,920 81 1.00 25,920 Parking-Affordable Housing (Lot 2) 6,720 21 1.00 6,720 Parking-Retail (Lot2) 12,160 38 1.00 12,160 Parking-Retail (RBC) 3,200 10 1.00 3,200 Parking-Replacement (Wallace) 29,120 91 1.00 29,120 Parking-Replacement (Lot 2) 32,320 101 1.00 32,320 Totals after completion 109,440 342 109,440
Total GSF 117,840 Parking Space/SF 3 320
Footnotes 1 Retail Space on Ground Level. (6 level garage / 5.5 levels of parking)2 Replacement spaces from Lot 2.3 Parking SF used by McDonald York
Stainback Public/Private Real Estate (SPPRE)www.sppre.com Last Updated: 9/22/2004

Page 2
Total Development Budget Total
Site/Building Data
Total Land Area GSF 26,055 Value of Opinion 1 990,090$
McDonald York Cost EstimatesRBC Garage per SF 2 35.00$ Lot 2 Retail per SF 3 72.95$
Building CostsRBC Garage Cost 3,830,400$ Retail 4 612,780$
Retail TI 5 193,200$ Total 4,636,380$
Hard Cost Contingency (3.0%) 139,091$
RBC Garage Cost 3,945,312$ Retail 631,163$ Retail TI 198,996$
Total Hard Costs 4,775,471$
Total Hard Construction Costs/Garage GSF 43.64$
Soft CostsArchitectural & Engineering 100,000$ A&E Reimburseables 10,000$ Bonds 80,000$ Materials Testing & Inspection 50,000$ Leasing Commissions 11,592$ Demolition & Sitework 100,000$ Soil Analysis 10,000$ Soft Cost Contingency (3%) 10,848$
Total 372,440$
RBC Garage Cost 4,253,007$ Retail 894,904$ Total Hard and Soft Development Costs 5,147,911$
Total Development Cost (Inc. Land) 6,138,001$
Cost per Parking Space 12,436$
Last Updated: 9/22/2004

Page 3
Footnotes1 Value of Opinion from CBRE not yet obtained. Assumed $38/sf. SPPRE assumes TCH and RBC can structure a lease/swap at Lot 5.2 From McDonald York Cost estimate for RBC Garage.3 Used Lot 2 Retail SF costs to estimate RBC Retail Cost.4 Assume the garage at RBC will be built around the current RBC Building. 5 Retail LSF at $25.00
Last Updated: 9/22/2004
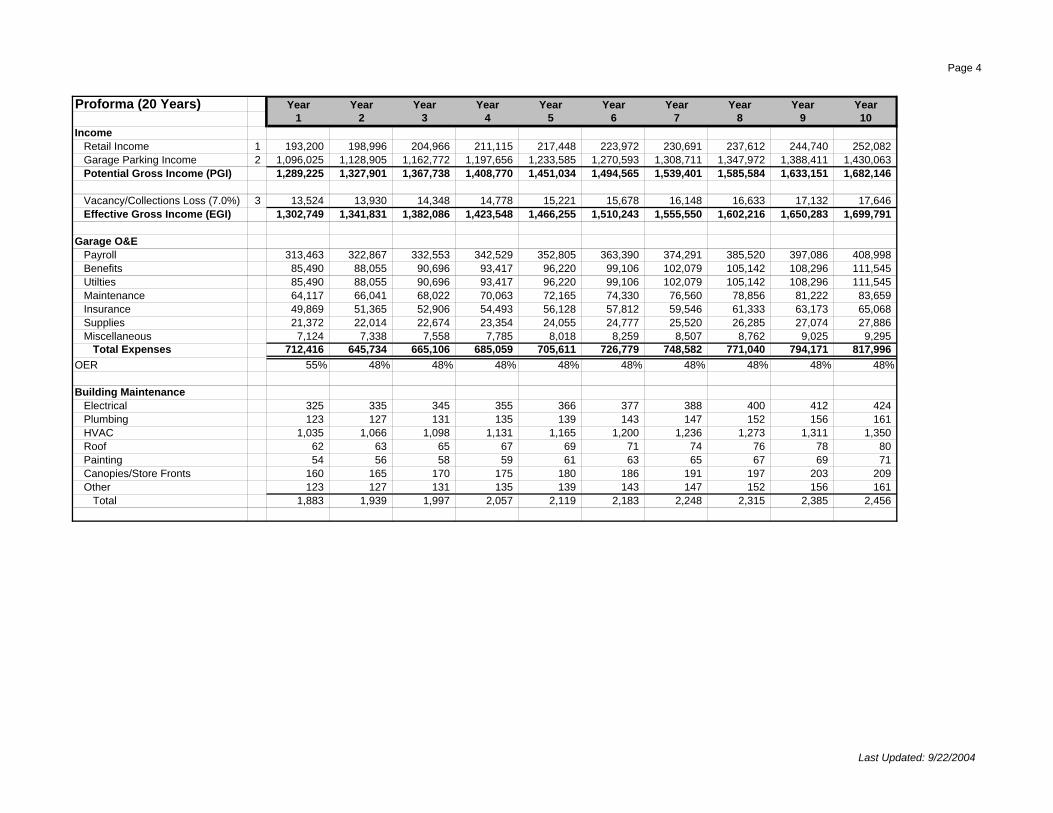
Page 4
Proforma (20 Years) Year Year Year Year Year Year Year Year Year Year1 2 3 4 5 6 7 8 9 10
IncomeRetail Income 1 193,200 198,996 204,966 211,115 217,448 223,972 230,691 237,612 244,740 252,082 Garage Parking Income 2 1,096,025 1,128,905 1,162,772 1,197,656 1,233,585 1,270,593 1,308,711 1,347,972 1,388,411 1,430,063 Potential Gross Income (PGI) 1,289,225 1,327,901 1,367,738 1,408,770 1,451,034 1,494,565 1,539,401 1,585,584 1,633,151 1,682,146
Vacancy/Collections Loss (7.0%) 3 13,524 13,930 14,348 14,778 15,221 15,678 16,148 16,633 17,132 17,646 Effective Gross Income (EGI) 1,302,749 1,341,831 1,382,086 1,423,548 1,466,255 1,510,243 1,555,550 1,602,216 1,650,283 1,699,791
Garage O&EPayroll 313,463 322,867 332,553 342,529 352,805 363,390 374,291 385,520 397,086 408,998 Benefits 85,490 88,055 90,696 93,417 96,220 99,106 102,079 105,142 108,296 111,545 Utilties 85,490 88,055 90,696 93,417 96,220 99,106 102,079 105,142 108,296 111,545 Maintenance 64,117 66,041 68,022 70,063 72,165 74,330 76,560 78,856 81,222 83,659 Insurance 49,869 51,365 52,906 54,493 56,128 57,812 59,546 61,333 63,173 65,068 Supplies 21,372 22,014 22,674 23,354 24,055 24,777 25,520 26,285 27,074 27,886 Miscellaneous 7,124 7,338 7,558 7,785 8,018 8,259 8,507 8,762 9,025 9,295
Total Expenses 712,416 645,734 665,106 685,059 705,611 726,779 748,582 771,040 794,171 817,996 OER 55% 48% 48% 48% 48% 48% 48% 48% 48% 48%
Building MaintenanceElectrical 325 335 345 355 366 377 388 400 412 424 Plumbing 123 127 131 135 139 143 147 152 156 161 HVAC 1,035 1,066 1,098 1,131 1,165 1,200 1,236 1,273 1,311 1,350 Roof 62 63 65 67 69 71 74 76 78 80 Painting 54 56 58 59 61 63 65 67 69 71 Canopies/Store Fronts 160 165 170 175 180 186 191 197 203 209 Other 123 127 131 135 139 143 147 152 156 161
Total 1,883 1,939 1,997 2,057 2,119 2,183 2,248 2,315 2,385 2,456
Last Updated: 9/22/2004

Page 5
Exterior CAMLandscape 873 899 926 954 983 1,012 1,043 1,074 1,106 1,139 Trash Removal 665 685 705 726 748 770 794 817 842 867 Sweeping 402 414 426 439 452 466 480 494 509 524 Sidewalk Maintenance 355 365 376 388 399 411 424 436 450 463 Security 177 183 188 194 200 206 212 218 225 232 Lighting 348 358 369 380 391 403 415 428 441 454 Directory/Signs 42 43 44 46 47 49 50 52 53 55 Electricity 951 979 1,008 1,039 1,070 1,102 1,135 1,169 1,204 1,240 Water 325 335 345 355 366 377 388 400 412 424 Other Exterior CAM 217 223 230 237 244 251 259 267 275 283 Fire Monitoring Service 177 183 188 194 200 206 212 218 225 232
Total 4,532 4,668 4,808 4,952 5,101 5,254 5,411 5,573 5,741 5,913
General & AdministrativeManagement Fee 52,110 53,673 55,283 56,942 58,650 60,410 62,222 64,089 66,011 67,992 Marketing 325 335 345 355 366 377 388 400 412 424 Other 148 152 157 162 166 171 177 182 187 193
Total 52,583 54,161 55,785 57,459 59,183 60,958 62,787 64,671 66,611 68,609
Total Retail Operating Expenses 58,998 60,767 62,590 64,468 66,402 68,394 70,446 72,560 74,736 76,978
Total Expenses(Retail & Garage) 771,413 706,501 727,696 749,527 772,013 795,173 819,029 843,599 868,907 894,975
Net Operating Income (NOI) 531,335$ 635,330$ 654,390$ 674,021$ 694,242$ 715,069$ 736,521$ 758,617$ 781,375$ 804,817$
Debt Service 613,800$ 598,455$ 583,110$ 567,765$ 552,420$ 537,075$ 521,730$ 506,385$ 491,040$ 475,695$ Net Cash Flow to Town 4 (82,465)$ 36,875$ 71,279$ 106,256$ 141,822$ 177,994$ 214,791$ 252,232$ 290,335$ 329,122$
Debt Coverage Ratio: 0.87 1.06 1.12 1.19 1.26
Footnotes1 Refer to Income Assumptions sheet. Lease Rate includes Reimburseable CAM allocation.2 See Income Assumptions worksheet. 3 Retail Vacancy of (7.0% stabilized), Occupancy factor for Garage is built into Income Assumptions.3 Assume Operating Expenses are 65% of Potential Gross income. 4 Financial Performance Measure to the town.
Last Updated: 9/22/2004

Page 6
RBC Garage Finance
Permanent Loan Debt Year Principal Interest Payment Balance6,138,001$ 1 306,900 306,900 613,800 5,831,101
2 306,900 291,555 598,455 5,524,201 3 306,900 276,210 583,110 5,217,301 4 306,900 260,865 567,765 4,910,401
Rate 5.00% 5 306,900 245,520 552,420 4,603,501 Term (yrs) 20 6 306,900 230,175 537,075 4,296,601
7 306,900 214,830 521,730 3,989,701 8 306,900 199,485 506,385 3,682,801 9 306,900 184,140 491,040 3,375,901
10 306,900 168,795 475,695 3,069,001 11 306,900 153,450 460,350 2,762,101 12 306,900 138,105 445,005 2,455,200 13 306,900 122,760 429,660 2,148,300 14 306,900 107,415 414,315 1,841,400 15 306,900 92,070 398,970 1,534,500 16 306,900 76,725 383,625 1,227,600 17 306,900 61,380 368,280 920,700 18 306,900 46,035 352,935 613,800 19 306,900 30,690 337,590 306,900 20 306,900 15,345 322,245 (0)
Last Updated: 9/22/2004

Page 7
Income Assumptions
Retail Income Year Year Year Year Year Year Year Year Year Year 1 2 3 4 5 6 7 8 9 10
Rate per SF $25.00 $25.75 $26.52 $27.32 $28.14 $28.98 $29.85 $30.75 $31.67 $32.62
Parking Income 1 Type Effective Income (Yr. 1) NotesParking-Market Rate Condos (Lot 2) 81 Monthly/Yearly 49,572 *From Lot 2 Garage Income worksheet.Parking-Affordable Housing (Lot 2) 21 Monthly/YearlyParking-Retail (Lot2) 38 Hourly 236,988 *From Lot 2 Garage Income worksheet.Parking-Retail (RBC) 10 HourlyParking-Replacement (Wallace) 91 Hourly $809,465Parking-Replacement (Lot 2) 101 Hourly 1,096,025
Totals after completion 342
# of Hourly Spaces 3 202 Hourly Parking Rate 1.30$ Number of Non-work Days per year 115Non-work Days Parking Hours 14Non-work Day Occupancy Factor 75%
Subtotal 317,090
Number of workdays per year 250Workday Parking Hours 10Work Day Occupancy Factor 75%
Subtotal 492,375
Annual Income to City from Lot 5 Garage 809,465 Effective Income $809,465
Footnotes 1 Assume that there are no Lot 2 Residential Storage Spaces in RBC Garage2 Because of the elimination of Residential Storage, the RBC Garage can be 5 levels, 300 spaces, with one floor of Retail.3 118 spaces are charged an hourly parking rate.
Last Updated: 9/22/2004

Wallace Deck Extension Page 8
Town Non-Tax/Tax Income
Year Year Year Year Year Year Year Year Year Year1 2 3 4 5 6 7 8 9 10
Income To City
Cost of RBC Property (990,090)$
Sales Tax at RBC
Non-Tax IncomeNet Income from Parking and Retail Operations (82,465)$ 36,875$ 71,279$ 106,256$ 141,822$ 177,994$ 214,791$ 252,232$ 290,335$ 329,122$ Total Non-Tax Income (82,465)$ 36,875$ 71,279$ 106,256$ 141,822$ 177,994$ 214,791$ 252,232$ 290,335$ 329,122$
Total Income to TCH from RBC (82,465)$ 36,875$ 71,279$ 106,256$ 141,822$ 177,994$ 214,791$ 252,232$ 290,335$ 329,122$
Stainback Public/Private Real Estate (SPPRE)www.sppre.com Last Updated 9/22/2004

Affordable Housing Condominiums/Townhomes

GREENWAY
CONDOMINIUMS
West Barbee Chapel Road
(behind Harris Teeter)
Conveniently located in the heart of Meadowmont Village!
• 2 bedroom, 1.5 bath , 950 s.f. (approximate s.f.)
• 9' ceilings
• sprinkler system
• automated lobby entry for security
• W/D hook-up

• stove, fridge, DW
• beautiful maple cabinetry
• private patio w/ fan
• Chapel Hill schools
Ready for Closing!
Now available to students
$140,000
for 2 bedroom corner units (available to families earning up to 100% AMI)
( see chart )
Monthly payments @ 6.5% interest will be approximately $1,175.00, includes principle, interest, taxes, insurance, COA dues, ground lease fees and water bill!
TOWNHOMES Located off Homestead Rd., on Weaver Dairy Extension Chapel Hill, NC 27516

click here for floor plans
click here for specs
Property features
• Townhome • Area: Northern Chapel HillSubdivision: Vineyard Square County: Orange • 2 story • Vinyl Siding • Slab foundation • Whirlpool Range, DW included • 2-3 BR, 2.5 bath • W/D connections • Oak cabinets • Schools: Seawell Ele., Smith Middle, East Chapel Hill High
Price: $115,000 for 3BR, 1223 s.f.: monthly PITI payment @ 6.5 % = appr. $940 + $130 HOA dues Several of these will be available for closing this summer!

$95,000 for 2 BR, 1069 s.f.: monthly PITI payment @ 6.5 % = appr. $740 + $130 HOA dues Due to be completed in January/February 2005 Qualifications apply: must earn at or below 80% AMI (see chart )
Under contract
1749 LEGION ROAD, Chapel Hill
$94,000
Townhome, Area: Chapel Hill Subdivision: Legion Road Townhomes 2 story, central heat/air conditioning (electric) Property Features:

• 1117 s.f. • 2 BR, 2.5 bath • W/D hook-ups • 9' ceilings • automated sprinkler system • alarm system installed • quality construction, built 2001 • close to bus stop • easy access to 15-501, I-40 • Chapel Hill Schools: Ephesus, Phillips, East • HOA dues: $115/mo (includes HO insurance, grounds maintenance, structural
maintenance, garbage/recycling pick-up, community garden/picnic/playground area, automated sprinkler system)
Estimated monthly mortgage payment (@ 6.5% interest) : $700 (+ HOA dues)
Qualifications apply: must earn < 80% AMI ( see chart )

Commercial Mortgage Rates & Terms
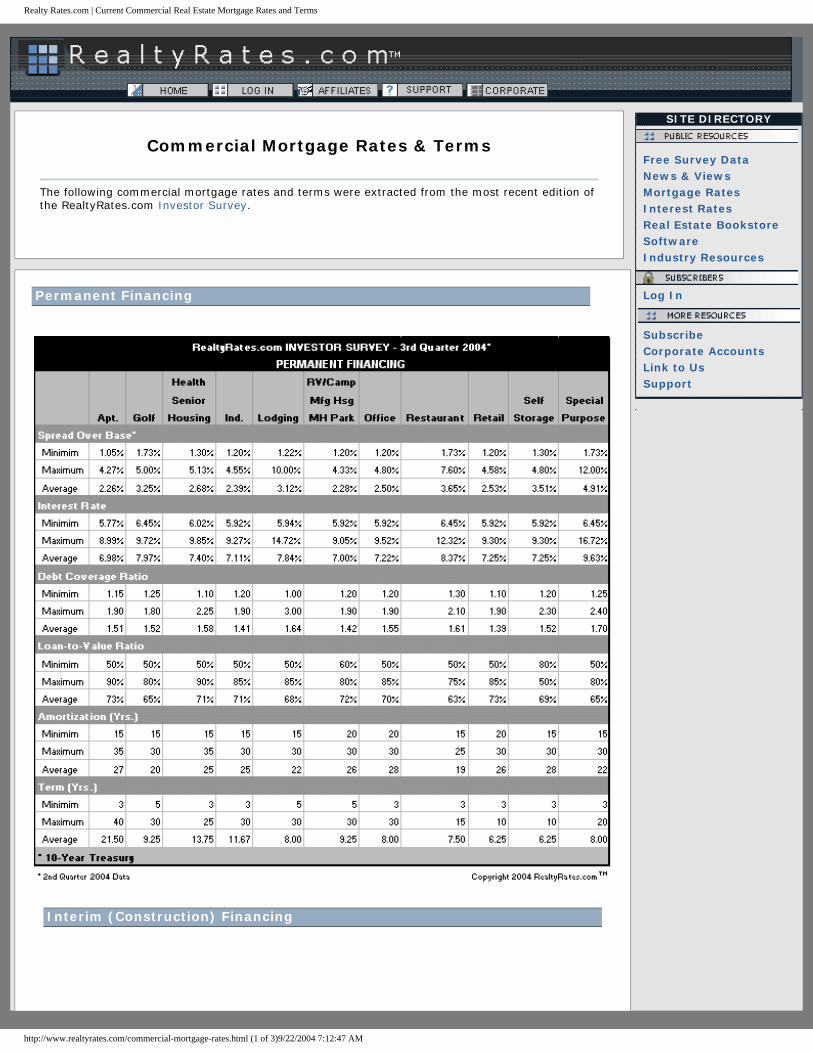
Realty Rates.com | Current Commercial Real Estate Mortgage Rates and Terms
Commercial Mortgage Rates & Terms
The following commercial mortgage rates and terms were extracted from the most recent edition of the RealtyRates.com Investor Survey.
Permanent Financing
Interim (Construction) Financing
SITE DIRECTORY
Free Survey DataNews & ViewsMortgage RatesInterest RatesReal Estate BookstoreSoftwareIndustry Resources
Log In
SubscribeCorporate AccountsLink to UsSupport
http://www.realtyrates.com/commercial-mortgage-rates.html (1 of 3)9/22/2004 7:12:47 AM

Realty Rates.com | Current Commercial Real Estate Mortgage Rates and Terms
http://www.realtyrates.com/commercial-mortgage-rates.html (2 of 3)9/22/2004 7:12:47 AM

Section 3

Page 1
Financial Sensitivity Analysis*red indicates Current Financial Proforma returns
Lot 5
Loan to Value (LTV)
The Loan to Value Ratio in Market Rate Rentals and Retail Components are both 70%. With the returns being accpetable to the Captial Markets, decrease, or a larger requirement by the lending company would only increase the Developers cash-on-cash return.
Interest Rate Use Type ROE NOI (yr. 3) Debt Service IRR ROC Max. Loan Amt DCR Yr. 3
6.50% Market Rate Condos 56.66% n/a n/a n/a n/a n/a n/aRetail n/a $462,218 $263,304 18.44% 9.96% $3,697,745 1.76
6.75% Market Rate Condos 55.76% n/a n/a n/a n/a n/a n/aRetail n/a $462,218 $269,827 18.04% 9.94% $3,697,745 1.71
7.00% Market Rate Condos 54.86% n/a n/a n/a n/a n/a n/a7.25% Retail n/a $462,218 $283,118 17.21% 9.91% $3,697,745 1.63
7.50% Market Rate Condos 53.05% n/a n/a n/a n/a n/a n/aRetail n/a $462,218 $289,884 16.80% 9.90% $3,697,745 1.59
7.75% Market Rate Condos 52.15% n/a n/a n/a n/a n/a n/aRetail n/a $462,218 $296,729 16.38% 9.88% $3,697,745 1.56
Construction Cost increases will effect Affordable housing. SPPRE assumes that Federal and State Assistance will enable the development of this component regardless of increase.Construction Cost Use Type ROE Total Dev. Cost Construction Draw Debt Service IRR ROC Max. Loan Amt DCR Yr. 3
-5.00% Market Rate Condos 66.63% $16,541,539 $918,974 n/a n/a n/a n/aRetail n/a $4,471,113 $271,467 18.99% 10.41% $3,722,416 1.71
0.00% Market Rate Condos 54.86% $17,401,188 $966,733 n/a n/a n/a n/aRetail n/a $4,663,013 $283,118 17.21% 9.91% $3,697,745 1.63
5.00% Market Rate Condos 44.02% $18,260,837 $1,014,491 n/a n/a n/a n/aRetail n/a $4,854,914 $294,770 15.51% 9.46% $3,673,074 1.56
10.00% Market Rate Condos 33.99% $19,120,487 $1,062,249 n/a n/a n/a n/aRetail n/a $5,046,814 $306,421 13.87% 9.04% $3,648,402 1.49
15.00% Market Rate Condos 24.69% $19,980,136 $1,110,008 n/a n/a n/a n/aRetail n/a $5,238,715 $318,073 12.28% 8.65% $3,623,731 1.42
Stainback Public/Private Real Estate (SPPRE)www.sppre.com Last Updated 9/22/2004

Page 2
Wallace
Loan to Value (LTV)
The Loan to Value Ratio in Market Rate Rentals and Retail Components are both 70%. With the returns being accpetable to the Captial Markets, decrease, or a larger requirement by the lending company would only increase the Developers cash-on-cash return.
Interest Rate Use Type ROE NOI Debt Service IRR ROC Max. Loan Amt DCR Yr. 3
6.50% Market Rate Condos 48.07% n/a n/a n/a n/a n/a n/aRetail n/a $55,588 $26,002 26.33% 12.13% $444,706 2.14
6.75% Market Rate Condos 47.17% n/a n/a n/a n/a n/a n/aRetail n/a $55,588 $26,646 25.94% 12.11% $444,706 2.09
7.00% Market Rate Condos 46.27% n/a n/a n/a n/a n/a n/a7.25% Retail n/a $55,588 $27,958 25.16% 12.07% $444,706 1.99
7.50% Market Rate Condos 44.47% n/a n/a n/a n/a n/a n/aRetail n/a $55,588 $28,626 24.77% 12.05% $444,706 1.94
7.75% Market Rate Condos 43.56% n/a n/a n/a n/a n/a n/aRetail n/a $55,588 $29,302 24.37% 12.04% $444,706 1.90
Construction Cost increases will effect Affordable housing. SPPRE assumes that Federal and State Assistance will enable the development of this component regardless of increase.Construction Cost Use Type ROE Total Dev. Cost Construction Draw Debt Service IRR ROC Max. Loan Amt DCR Yr. 3
-5.00% Market Rate Condos 87.81% $12,798,099 $711,005 n/a n/a n/a n/a n/aRetail n/a n/a n/a $26,932 26.77% 12.59% $446,879 2.07
0.00% Market Rate Condos 75.95% $13,462,266 $747,904 n/a n/a n/a n/a n/aRetail n/a n/a n/a $28,034 25.05% 12.03% $444,546 1.98
5.00% Market Rate Condos 65.16% $14,126,586 $784,810 n/a n/a n/a n/a n/aRetail n/a n/a n/a $29,136 23.41% 11.52% $442,213 1.90
10.00% Market Rate Condos 55.31% $14,791,060 $821,726 n/a n/a n/a n/a n/aRetail n/a n/a n/a $30,238 21.84% 11.04% $439,878 1.82
15.00% Market Rate Condos 46.30% $15,455,688 $858,649 n/a n/a n/a n/a n/aRetail n/a n/a n/a $31,341 20.35% 10.60% $437,544 1.75
Stainback Public/Private Real Estate (SPPRE)www.sppre.com Last Updated 9/22/2004

Section 4

Public/PrivateFinance Plan
for Scenario C-3Town Of Chapel Hill
September 21, 2004
Prepared By SPPREwww.sppre.com
Lot 5173 ReplacementParking Spaces
Cost: $3,425,566
Existing Wallace Deck
Existing Revenue Bond:Est.: $460,000
Revenue Bond: $2,553,424
Land Lease Payout: $3,673,025
Existing Lot 2 Income: $285,000
Wallace Income: $570,000
Town Parking Net Income: $190,397
Existing Lot 5 Income: $125,000
Property Tax: $79,596
Base Rent (Retail - Lot 2): $47,224
Sale of M-R Condo & Prkg:$296,701
Assumptions and Footnotes
1) All Revenue Bonds assume a Term: 20years, Coupon Rate: 5.50%, Debt coverageratio (DCR): 1.25.
2) Land Lease Payout will be paid to theTown by the developer at closing of theConstruction Loan. The payout is based onthe Present Value (PV) of a 30-year LandLease with a Discount Rate of 2.50%.
3) The “Sale of M-R Condo & Prkg” :Represents the Town's 20% share of the NetProceeds from the sale of the Market-RateCondominium units. The one-time paymentwill be paid to the Town two years aftercompletion of construction.
In order to reduce the cost of AffordableCondominium units, the Town will not sharein the marginal Net Sale Proceeds of theseUnits.
TOWN’S PORTION OF COST SOURCES OF NONTAX INCOMEBONDS
Property Tax (Private): $104,348
Developer Leases 92 Spaces: $44,712
Property Tax: $161,976
FOOTNOTES
Base Rent (Retail): $7,373
Cost Delta of Underground vs.Above-grade Parking
$2,543,074
$5,968,640 $6,226,449
Base Rent (Retail Space & Prkg): $76,689
©
TOTAL DEVELOPMENT COSTCOMPONENTS A-F:
$70,881,083
Operating Expenses:$531,000
Sale of M-R Condo & Prkg: $664,385
Sale of M-R Condo & Prkg: $867,111
Loss of Income:1) Demo of Lot 5: $125,0002) Demo of Lot 2: $285,000
Town Project 1
Town Projects 2 & 3
Term: 20 yrs / Interest: 5.5% / DCR: 1.25
Land Lease Payout: $2,714,489
Revenue Bond: $497,949
Net Sale Proceeds: $1,163,812
Wallace Deck Non-Tax Income & Tax Revenue
Lot 5 Non-Tax Income & Tax Revenue
Lot 2 Non-Tax Income & Tax Revenue
Land Lease Payout: $2,714,489Lot 2 Development
Retail / Housing / GarageCost: $16,177,257
Developer Project 3
C
Lot 5 DevelopmentRetail / Housing / Garage
Cost: $30,078,392 .
Developer Project 2
B
Wallace ExpansionRetail / Housing
Cost: $18,453,683
Developer Project 1
A
Pedestrian Bridge: $457,679
Town Project 6RBC Garage: $5,147,911RBC Land Cost: $990,090
Total: $6,138,001
Town Project 5
E
Transit Transfer CenterCost: $2,141,037
Town Project 4
D
RBC Net Cash Flow after Debt Service:$126,522
(Year 3 Stabilization; Retail and ParkingOperations includes RBC Land Cost &
Garage Cost)
RBC Garage Non-Tax Income & Tax Revenue
F
Surplus Non-Tax Income& Tax Revenue to Town:
$393,144 Annuallywith Sale of Retail
(yr. 10):$1,739,622
Retail Sale Proceeds (yr. 10): $107,611
Retail Sale Proceeds (yr. 10):$756,148
Retail Sale Proceeds (yr. 10): $482,719
Revenue Bond: $6,138,001

~ESJOH :IJ!IQJSll~JV W!r00
S8JnSOlQua
Bu!~eW!~S3 - ~uep!SeJdaA!~n~8X3,'3 Auuea
'G-75"~ .. ~ q'd'1 'AN'idVIJOQ NOIlOn~lSNO~ A311'iA EJNICjdS
, AleJi9:JU!S
'sn l~elUO~ 8Seeld 'SUJe~UO~JO SUO!lSsnb /iue eJe eJeljl!! 'JaA8MO4 'speeu Jnof.. ~eew II!M UO!lewJoJu! S!4~ ~elj~ ~snJl eM
'ou!a!Jd Jno o~ pe~eleJ ')fjoM-!o-edoas pe~ed!~!~ue eljl !Ouo!~d!J:)sep Jelj~n! e sep,AoJd ~e4l SNOrl'v'QI.:IIHV1~!O OU!~5!1 Jno pe4~e~e eAe4 gM 'uO!~!PPE ul
'S!SAleue pUB M8,AeJ JnOA JO!le~o~ ~elj~ !O UMOp)fE8Jq E ep,AoJd "!M ~eeljs 6u!aIJd pe4:)eue elji '(6L9' LSP$) S'd'v'110a 3NIN
-A1N3/\3S 03HONnH XIS ONvsnOHi N3/\3S-Al,::II.::! 03HONnH t;;Ino.::l Sl ~SO~ uo!~~nJlSUoaAJEU!W!IeJd le~o~ e4~ 'peqlJasep )fESJOH U!/Q ~eljl UO!~EWJOJU! elj~ uodn pasE8 'e5P!Jqt\)js
,0 ~ )( ,59 pesodoJd e JO! pelEd!al~UE eq PlnoljS lSljt S~SOO uo!~~nJ~suoa !O e~BW!~Se liJeU!WI!eJd ep8JBdeJd seLl f..uedwo~ uoll:)ru~sUOQ f..eIIE/\ 6u!JdS 'Aepo~ Je!IJEe J84aJ\f W!r lj~!M pessnas!p S'v'
'u~or JE80
atBW!IS3 a6PIJqA>lS:8't:1
LGOLL Xl'uolsnoHOG9 8l!ns
eu~ SUOWW!.i OO~~e~elS3 IBeij a~e!\!Jd/~!lqnd >I~eqU!EIS
JeU~ed 5u!5BUel/lJ)f~EqU!BIS u40r .J~
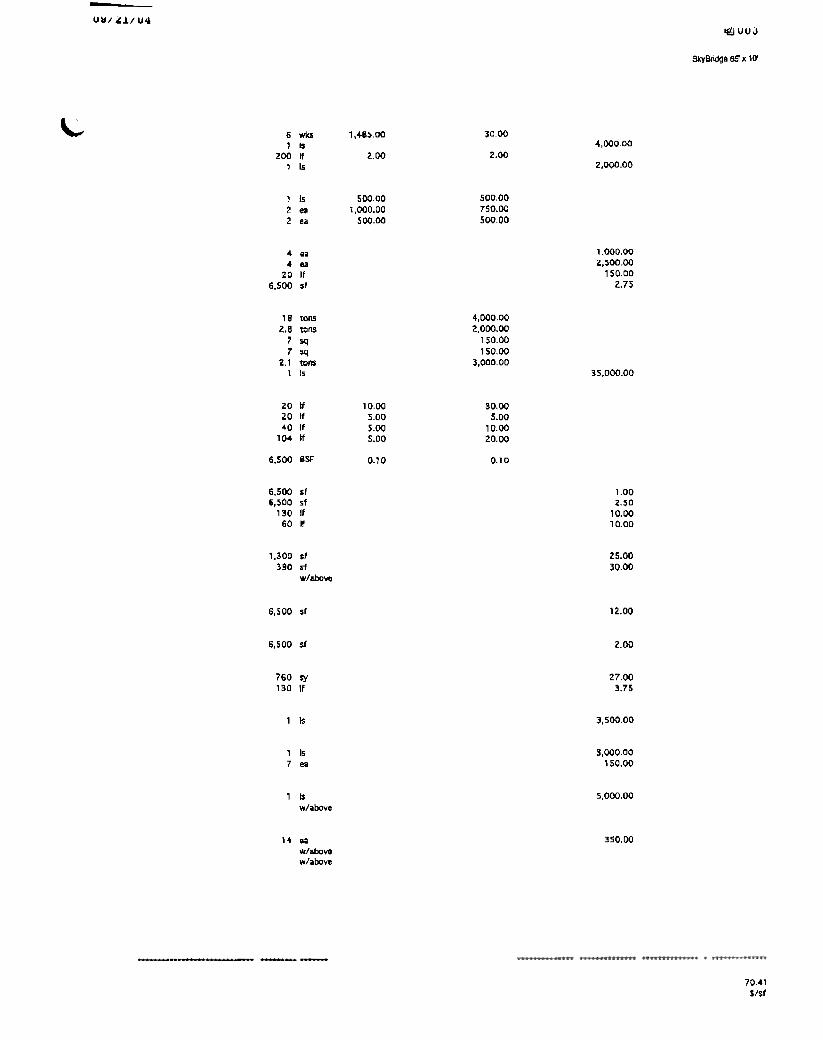
-U~/~J./U4
~UUJ
Si(yBiidga 6S' x 111
~ 3000
2.00
6wn, Is
ZOO If, Is
1,48$.00
2.004,00000
2,000.00
500.00750.00500.00
1 152 ~2 sa
500.001,000.00
500.00
1,000.00Z.~OO-OO
, 50.00Z.7~
4 &~4 sa
ZO If6,500 $/
,S2.8
77
1..'1
4,000.002.000.00
15000150.00
3,000.0035,000.00
202040
104
6,500
10,005.005.005.00
0.10
30.005.00
10.0020.00
0.10
6.500 sf6.500 sf
130 It60 If
1.00~.~O
10.0010.00
25.0030.00
1,300 $1390 ri
~/aOOve
6,500 $f 12.00
6,500 $I LOO
760 sy130 If
27.003.75
3,500.001 Is
1 Is7 ea
3,000.00150.00
, 1$w/.!X)ve
5,000,00
14 saw/alXlvew/aoove
350.00
70.41S/$I
tOIlS
tOn$
sq~qtQMIs
IfItItIf
SSF

~UU~
'- CLARIFICATIONSSkybridge (66' x 10') September 21, 2004Spring Valley Construction Company
This Preliminary Pricing is based upon the following scope-of-work:
1 Drilled piers at each end of Skybridge trusses.
2 Cast-in-place concrete columns & beams at each end.
3. Steel tube trusses with steel floor & roof framing.
4. EreCtion of Skybridge structure will occur during weekend with street barricaded/closed.
5 Concrete floor slab on metal floor deck.
6. Insulated membrane roofing on metal roof deck.
7 Continuous, prefinished gutters with downspouts at each end.
8. Aluminum window-wall system with vision glass and sprandrel glass.
9. Suspended lath & plaster soffit below Skybridge structure.
10. Acoustical ceiling (2><2) in Skybridge at 10' above floor.
l' Direct-glue carpet.
12. Exposed, painted steel truss members.
13 Extend existing sprinkler system into Skybridge with additional heads.
14. Extend existing HVAC system into Skybridge with additional mixing box/duct/grilles
15. Extend circuiting and breaker for 14 new 2'x4' lay-in fight fixtures in Skybridge ceiling.

Section 5

Non-Tax Income andTax Revenue for Town
Generated from ProposedDevelopments
Town Of Chapel HillSeptember 21, 2004
Prepared By SPPRE ©
www.sppre.com
Total Non-Tax Income:
$39,874,942
Lot 5$756,148
Lot 2$482,719
Lot 5:$2,981,105
County & School District:
$20,191,354
Total Town Property Tax:
$11,909,158
Chapel Hill / Carrboro SchoolDistrict: $3,739,140
Chapel Hill City Revitalization:$10,750,025
Orange County:
$12,375,495
Orange County: $16,452,214
Wallace Deck Expansion$253,442
Downtown Revitalization District:$1,159,133
State of North Carolina:
$22,275,891
TAX REVENUE
NON-TAX INCOME
Lot 2$1,623,359
Total Sales Tax:
$34,651,386
Land Lease Payouts(MR Condo & Garage)(Construction closing) Base Rent - Retail (Yrs.1-30)
Lot 5$2,636,239
Wallace Deck Expansion$107,611
Participation in Net SaleProceeds- Retail
(assumed Sale in Yr. 10)
Non-Tax IncomeTown: $39,874,942
Total Tax Revenue:
$66,751,898
Property and Sales Tax:
Town: $11,909,158
State: $22,275,891
County: $32,566,849
SchoolDistrict: $3,739,140
Property Tax (Yrs: 1 - 30)
Sales Tax (Yrs: 1 - 30)
Town: $51,784,100
Wallace Deck Extension:$2,257,383
Lot 2:$1,448,968
Lot 5$867,111
Lot 2$296,701
Wallace Deck Expansion$560,052
Participation in Net SaleProceeds- MR Condos
(assumed Sale in Yr. 2)
Lot 5:$6,492,439
Parking Income (1-30)
Wallace Deck Extension:$14,715,136
Lot 2:$7,099,249
Lot 5:$691,921
Affordable Housing LandLease Payout (yr. 1)
Wallace Deck Extension:$457,107
Lot 2:$362,242
Land Lease Payout absorbed by MRCondominiums
Total Property Tax:
$32,100,512
$106,626,840

Section 6

Tab 6: SPPRE Recommendations to Council Committee Based onthe Completed Financial Analysis
'---
Based on our comprehensive financial analysis, the SPPRE Team highly recommends that onOctober 11, 2004, the Council Committee proceed to the next step in the pre-developmentprocess, which is to complete" Part Two: The Developer Solicitation and Selection Process" asdescribed in the SPPRE Scope of Work.
The SPPRE Team believes the design, financial analysis and deal structure include severalfeatures, which should provide the Town with a level of comfort to proceed with the solicitationof technical proposals from highly respected national and regional development companies.These design and finance modeling features include:
Interest rates which we believe can be significantly decreased through presentations andnegotiations with equity and debt providers.
.
Loan-to- Value (L TV) which can be increased, once equity and debt investors betterunderstand the proj ect and market.
.
Cost reductions resulting from design refinements based on developer and constructioncompany input.
.The potential approval of Tax Increment Financing (TIF).
Although SPPRE completed a Financial Sensitivity Analysis for the Council Committee to bettermanage their risk, the Town is susceptible to the following:
Increase in construction costs.
Increase in the cost of financing.
A significant delay could increase market risk by not capturing current market demand asdescribed by ERA in March 2004.
.The Town must do everything in their power to incorporate and accommodate publicinput but accelerate the design and finance approval process.

ID Task Name Duration
1 Council Decision on wether to proceed 1 day
2 Option C-3 87.1 mons
3 Lot 5 & Wallace Development 55.3 mons
4 Identify which RFQ/RFP process to use 3 wks
5 RBC Public/Private Partnership 3.25 mons
6 Develop PPP Plan for RBC w/TCH 3 wks
7 Negotiate PPP plan with RBC 3 wks
8 Negotiate acquisition of RBC property 3 wks
9 RBC Letter of Intent 1 wk
10 Town Review RBC Letter of Intent 3 wks
11 Developer RFQ Process 3 mons
12 Town Review RFQ Process 3 wks
13 Developer RFP Process 5 mons
14 Town Review RFP Process 3 wks
15 Developer Negotiate preleasing deal with RBC at Lot 5 1 mon
16 Development Agreement 2 mons
17 Town Plan Review 3 mons
18 Complete SD (Lot 5 & Wallace) 2 mons
19 Town Design Review 3 wks
20 Obtain new cost estimate/refine finance model 2 wks
21 Design Development (Lot 5 & Wallace) 2 mons
22 Town Design Review 3 wks
23 Special Use Permit 8 mons
24 Town prepare bond offering for Lot 5 Garage & Delta 1 mon
25 Town Review Bond Offering 3 wks
26 Obtain Debt & Equity (Lot 5 & Wallace) 3 mons
27 TCH Issue bond for Lot 5 Garage & Delta cost 2 mons
28 Construction Documents (Lot 5 & Wallace) 5 mons
29 Town moves 173 parking spaces to temporary site(s) 1 mon
30 Lot 5 Development 18.05 mons
31 Lot 5 Construction 18 mons
32 Move 173 spaces to new Lot 5 Garage 1 day
33 Wallace Deck Extension Development 14 mons
34 Wallace Deck Extension Construction 14 mons
35 Lot 2/RBC/TTC Development 49.85 mons
36 Lot 2/RBC/TTC PreDevelopment 33.75 mons
37 Implement PPP plan with RBC 3 wks
38 Structure TCH Finance of Town Garage on RBC Property 2 wks
39 Structure TCH finance of TTC (Fed. Funds Distribution) 6 wks
40 Design Garage 2 mons
41 Town Review Garage Design 3 wks
42 Update Cost Estimates for RBC Garage 2 wks
43 Developer RFP Process (Lot 2/RBC/TTC) 5 mons
44 Town Review RFP Process 3 wks
45 Development Agreement (Lot 2/RBC/TTC) 2 mons
46 Town Plan Review 3 mons
47 Complete SD (Lot 2 & TTC & RBC) 2 mons
48 Town Design Review 3 wks
49 Obtain new cost estimate/refine finance model 2 wks
50 Design Development (Lot 2 & TTC & RBC) 2 mons
51 Town Design Review 3 wks
52 Special Use Permit 8 mons
53 Prepare bond offering for RBC Garage 1 mon
54 Town Review Bond Offering 3 wks
55 Obtain Debt & Equity (Lot 2 & TTC & RBC) 3 mons
56 TCH Issue Bond for RBC Garage 2 mons
57 Construction Documents (Lot 2 & TTC & RBC) 31.85 mons
58 RBC executes preleasing commitment at Lot 5 (RBC moves) 3 mons
59 TCH acquires RBC property 1 day
60 Demolish RBC building 1 mon
61 101 spaces from Lot 2 move to temporary site(s) 1 mon
62 Lot 2/TTC Development 15 mons
63 Lot 2/TTC Construction 15 mons
64 RBC Garage Development 6.05 mons
65 RBC Garage Construction 6 mons
66 Move 101 replacement spaces to new RBC Garage 1 day
S O N D J F M A M J J A S O N D J F M A M J J A S O N D J F M A M J J A S O N D J F M A M J J A S O N D J F M A M J J A S O N D J F M A M J J A S O N D J F M A M J J2005 2006 2007 2008 2009 2010 2011
Task Split Progress Milestone Summary Project Summary External Tasks External Milestone Deadline
Town of Chapel Hill Schedule Option C-3
Stainback Public/Private Real Estate (SPPRE)www.sppre.com
Page 1 Last Updated Wed 9/22/04
Project: Schedule 9-6-04Date: Wed 9/22/04