towards dispersal or congregation? the spatial distribution of smaller cultural groups in england...
TRANSCRIPT
Towards Dispersal or
Congregation? The Spatial
Distribution of Smaller
Cultural Groups in England and Wales
Philip Sapiro
• England and Wales Census – ethnic group
question 1991; religion question 2001.
• ‘a widespread recognition that religion is
an important element of ethnicity and a
cultural marker of difference’ (Aspinall
2000, p589).
• ‘cultural group’ refers to sub-populations
defined by either religion or ethnic group
or both.
Introducing Cultural Groups
2

• Socio-economic progress – increasing levels of education, employment, and income (Park, 1926); and
• Cultural assimilation – behavioural, structural, identificational, and marital assimilation (Gordon, 1964); lead to
• Migration from settlement areas and dispersal into host community (Massey, 1985).
Traditional Assimilation Theory
3

• Socio-economic progress and cultural
assimilation – dispersed among wider
population? No!
• US studies: three major National Jewish Population Surveys
(NJPS); repeated local studies (examples: New York, San
Francisco, Nashville, Philadelphia, Cleveland).
• UK studies: qualitative and semi-quantitative national
studies; local studies of Redbridge, Sheffield, Leeds, and the
London area.
Jewish Distribution in USA & UK
4

• Newman (1985) - distribution of Jews in Britain:
– migrated from areas of original settlement
– with a pattern of strong congregation in particular suburbs
• Waterman & Kosmin (1987, p245) describe as ‘creating ethnic clusters but avoiding segregation, while at the same time integrating functionally into the host society’ .
• Their key question (p255): ‘What implications does this phenomenon carry for understanding similar processes amongst other … groups in Britain?’
Key Issue under Investigation
5

• Are other (small) groups following the
spatial distribution trajectory established
by Anglo-Jewry; are Jews acting as path-
finders?
• Can we, a generation later, with census
questions on religion and ethnic group,
now provide a definitive answer?
Key Research Question
6

Jews as forerunners
Source: Author assessment based on Census data; Labour Force Survey; and Bluck
2006; Rees and Butt 2004; Schmool and Cohen 1998; Peach and Gale 2003
7
Group Population Profiles 1931-2011 (England and Wales)
0%
50%
100%
150%
1931 1951 1971 1991 2011
Pop
ula
tio
n a
s Pe
rcen
tage
of
2011
po
pu
lati
on Jewish
Sikh
Chinese
Buddhist
Arab

Socio-economic comparison
Source: 2011 census tables DC2101EW, LC2107EW, DC2202EW, DC2204EW, DC2205EW, DC2207EW, LC2404EWls, LC2405EWls, DC4202EW, LC4204EW, LC4207EW, LC4208EW, LC5204EW, DC5209EWla, DC6201EW, LC6205EW, DC6206EW, LC6207EW, DC6216EW, DC6217EW.)
8
All Usual Residents
White British
Arab Chinese Jewish Sikh
Demographic / Cultural
Age 0 to 15 18.9 22.7 37.8 16.1 20.1 20.5
Age 65 and over 16.4 18.8 3.4 5.0 21.0 8.3
United Kingdom born 86.6 97.9 27.6 23.7 81.1 56.6
With only non-British identity 7.3 0.3 43.2 48.0 8.6 16.8
Areas of Employment
Manufacturing 8.9 9.4 5.0 4.2 3.8 9.9
Wholesale and retail trade 15.9 16.1 15.5 12.0 14.1 22.2
Transport and storage 4.9 4.7 5.9 2.3 2.7 8.5
Accommodation and food services 5.6 4.7 11.3 26.7 2.8 5.2
Professional, scientific and technical 6.6 6.5 7.1 10.7 15.9 5.8
Education 9.9 10.2 9.1 8.2 13.3 7.1
Human health and social work 12.5 12.2 14.8 10.1 11.2 9.8
Social/Educational
Professional/ managerial positions 35.4 35.1 44.4 43.6 54.6 31.8
Living in Owned or shared ownership 64.3 68.1 26.8 50.8 73.3 78.1
2 or more cars or vans available 32.2 34.2 15.5 21.5 35.7 46.6

Maturity – Year of Arrival
Source: analysed from the 2011 Census Microdata Individual Safeguarded Sample (Regional) file
9
UK
born
Year of arrival in UK
Total
Sample
size Group before
1971
1971-
1990
1991-
2000
2001-
2006
2007-11
non-
student student
Arab 28% 2% 11% 17% 17% 16% 9% 100% 11431
Chinese 24% 5% 15% 11% 16% 17% 12% 100% 19647
Jewish 81% 4% 4% 3% 3% 3% 1% 100% 13135
Sikh 56% 15% 12% 5% 6% 4% 1% 100% 21135
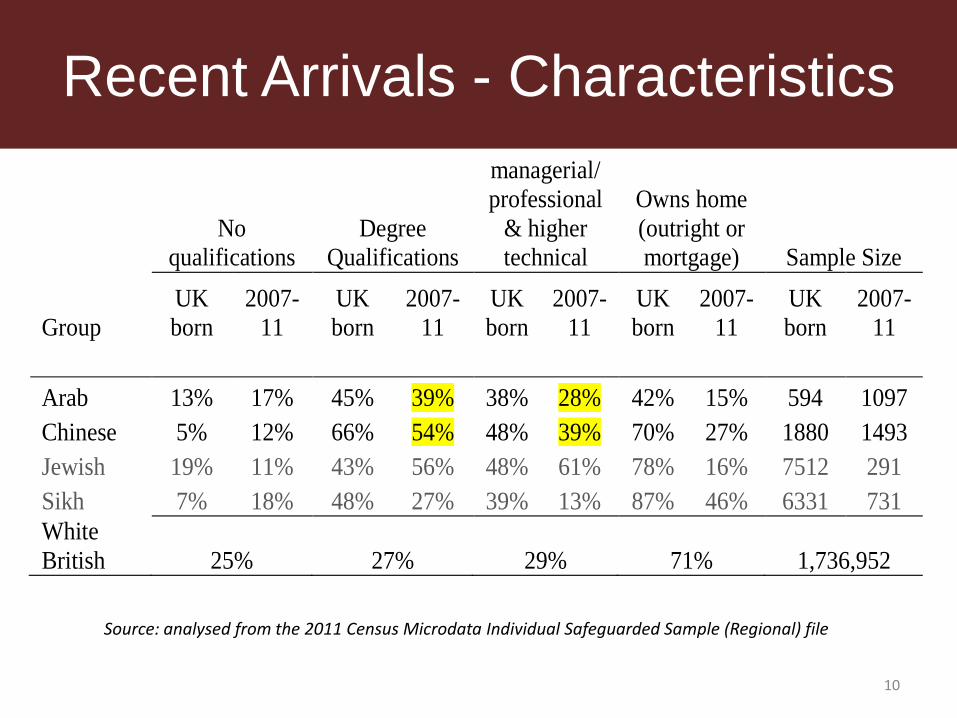
Recent Arrivals - Characteristics
Source: analysed from the 2011 Census Microdata Individual Safeguarded Sample (Regional) file
10
No
qualifications
Degree
Qualifications
managerial/
professional
& higher
technical
Owns home
(outright or
mortgage) Sample Size
Group
UK
born
2007-
11
UK
born
2007-
11
UK
born
2007-
11
UK
born
2007-
11
UK
born
2007-
11
Arab 13% 17% 45% 39% 38% 28% 42% 15% 594 1097
Chinese 5% 12% 66% 54% 48% 39% 70% 27% 1880 1493
Jewish 19% 11% 43% 56% 48% 61% 78% 16% 7512 291
Sikh 7% 18% 48% 27% 39% 13% 87% 46% 6331 731
White
British 25% 27% 29% 71% 1,736,952

Marital Assimilation
Source: 2001 tables C0400, C0629, C0056, C0849; 2011 tables CT0458,CT0459, CT0460, CT0461, and 2011 un-numbered tables from ‘What does the 2011 Census tell us about inter-ethnic relationships’: http://www.ons.gov.uk/ons/publications/re-reference-tables.html?edition=tcm%3A77-365449 Note that 2011 data include same-sex civil partnerships in the married column
11
Married
All partnerships
2001 total non-group
partner
total non-group
partner
Jewish 108,984 23,610 22%
119,626 31,232 26%
Sikh 141,607 6,583 5%
146,563 9,137 6%
Chinese 79,712 17,608 22%
87,610 21,820 25%
2011 Jewish 107,734 24,240 22%
119,953 32,551 27%
Chinese 119,982 32,844 27%
145,772 45,448 31%
Arab 71,423 22,455 31%
79,173 28,049 35%

Spatial Distribution of Groups (2011)
Source: 2011 census tables DC2201EW, DC6201EW and DC6205EW. 12
0.0%
0.5%
1.0%
1.5%
2.0%
2.5%
1 10 100 1000
Pro
po
rtio
n o
f 20
11 E
ngl
and
an
d W
ales
gro
up
p
op
ula
tio
n in
eac
h M
SOA
MSOAs ordered by reducing proportion of E&W population for each group (log scale)
Jewish
Sikh
Arab
Chinese
Asian Buddhist
White British

Change in Spatial Distribution 2001-11
Source: 2001 census tables CAST03 and CAST10; 2011 census tables DC6201EW and DC6205EW. 13

• Proportion in the London Area:
– White British : 10%
– Sikhs and Chinese: one third
– Asian Buddhists: 2 in 5
– Arabs: almost half
– Jews: over 3 in 5 Source – 2011 census tables KS201EW, KS208EW, LC2201EW and RUC11_OA11_EW.
London Focus of Groups
14

15

• Jewish – primarily suburban (and beyond);
highly concentrated in one or two corridors
• Sikh – very similar to Jewish (congregated
in suburbs); some inner area presence
• Arab – overlap of inner and outer suburbs,
but suburbanising
• Chinese – inner and outer suburbs (skilled
and less-appropriately skilled waves?)
Summary of Group Locations
16

• Are other (small) groups following the
spatial distribution trajectory established
by Anglo-Jewry; are Jews acting as path-
finders?
Conclusions
17

• Are other (small) groups following the
spatial distribution trajectory established
by Anglo-Jewry; are Jews acting as path-
finders?
YES!
Conclusions
18
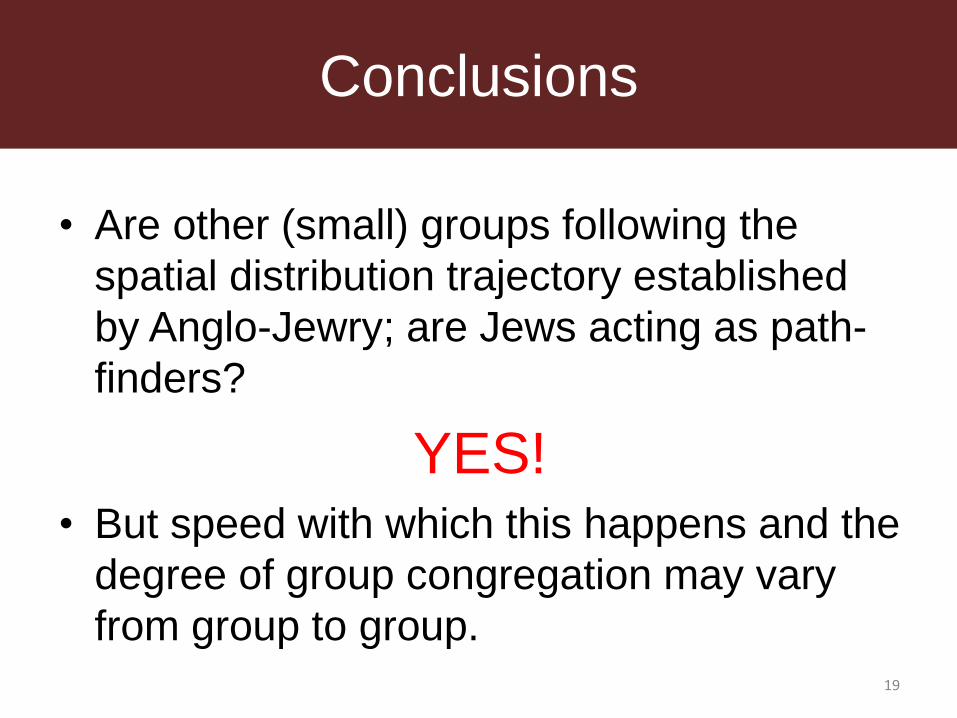
• Are other (small) groups following the
spatial distribution trajectory established
by Anglo-Jewry; are Jews acting as path-
finders?
YES! • But speed with which this happens and the
degree of group congregation may vary
from group to group.
Conclusions
19
• Aspinall, P. J. (2000). Should a Question on 'Religion' be Asked in the 2001 British Census? A Public Policy Case in Favour. Social Policy & Administration, 34(5), 584-600.
• Bluck, R. (2006). British Buddhism : teachings, practice and development: New York : Routledge, 2006.
• Gordon, M. M. (1964). Assimilation in American life : the role of race, religion, and national origins: New York : Oxford University Press, 1964.
• Massey, D. S. (1985). Ethnic residential segregation: a theoretical synthesis and empirical review. Sociology and Social Research, 69(3), 315-350.
• Newman, D. (1985). Integration and Ethnic Spatial Concentration: The Changing Distribution of the Anglo-Jewish Community. Transactions of the Institute of British Geographers, 10(3), 360-376
• Park, R. E. (1926). The urban community as a spatial pattern and a moral order. In E. W. Burgess (Ed.), The urban community (pp. 3-18). Chicago: University of Chicago Press.
• Peach, C., & Gale, R. (2003). Muslims, Hindus, and Sikhs in the New Religious Landscape of England. Geographical Review, 93(4), 469-490.
• Rees, P., & Butt, F. (2004). Ethnic change and diversity in England, 1981-2001. Area, 36(2), 174-186.
• Schmool, M., & Cohen, F. A. (1998). A profile of British Jewry: Patterns and trends at the turn of a century: Board of Deputies of British Jews London.
• Simpson, L. (2012). More segregation or more mixing? The Dynamics of Diversity: evidence from the 2011 Census. Manchester: Centre on Dynamics of Ethnicity (CoDE).
• Waterman, S., & Kosmin, B. (1987). Ethnic identity, residential concentration and social welfare: the Jews of London. In P. Jackson (Ed.), Race and racism (pp. 254-271). Hemel Hempstead: Allen & Unwin.
All census data used in this presentation are Crown Copyright and reproduced or adapted from data from ONS (the Office for National Statistics) licensed under the Open Government Licence v.2.0, and all 2011 census tables referred to can be accessed via http://www.nomisweb.co.uk/census/2011/data_finder
References
20