towards an india wage report - international labour … asia-pacific working paper series towards an...
TRANSCRIPT
I LO As ia - Pa c i f i c Wor k i n g Pa per Se r i es
Towards an India Wage Report
T S Papola and K P Kannan
October 2017
DWT for South Asia and Country Off ice for India


ILO Asia-Pacific Working Paper Series
TS Papola and KP Kannan
October 2017
DWT for South Asia and Country Office for India
Towards an India Wage Report

Copyright © International Labour Organization 2017
First published 2017
Publications of the International Labour Office enjoy copyright under Protocol 2 of the Universal Copyright
Convention. Nevertheless, short excerpts from them may be reproduced without authorization, on condition that the
source is indicated. For rights of reproduction or translation, application should be made to ILO Publications (Rights
and Permissions), International Labour Office, CH-1211 Geneva 22, Switzerland, or by email: [email protected]. The
International Labour Office welcomes such applications.
Libraries, institutions and other users registered with reproduction rights organizations may make copies in accordance
with the licences issued to them for this purpose. Visit www.ifrro.org to find the reproduction rights organization in
your country.
178 pages (ILO Asia-Pacific working paper series)
ISSN: 2227-4391; 2227-4405 (web pdf)
ILO Regional Office for Asia and the Pacific
The designations employed in ILO publications, which are in conformity with United Nations practice, and the
presentation of material therein do not imply the expression of any opinion whatsoever on the part of the International
Labour Office concerning the legal status of any country, area or territory or of its authorities, or concerning the
delimitation of its frontiers.
The responsibility for opinions expressed in signed articles, studies and other contributions rests solely with their
authors, and publication does not constitute an endorsement by the International Labour Office of the opinions
expressed in them.
Reference to names of firms and commercial products and processes does not imply their endorsement by the
International Labour Office, and any failure to mention a particular firm, commercial product or process is not a sign
of disapproval.
ILO publications and electronic products can be obtained through major booksellers or ILO local offices in many
countries, or direct from ILO Publications, International Labour Office, CH-1211 Geneva 22, Switzerland, or ILO
Regional Office for Asia and the Pacific, 11th Floor, United Nations Building, RajdamnernNok Avenue, Bangkok
10200, Thailand, or by email: [email protected]. Catalogues or lists of new publications are available free of
charge from the above address, or by email: [email protected].
Visit our website: www.ilo.org/publns or www.ilo.org/asia.
Printed in India

iv ILO DWT for South Asia and Country Office for India
Preface and acknowledgements
A number of scholarly studies as well as official committee and commission reports have dealt with one or
more aspects of wages in India. However, there has not been a comprehensive report on the question of
wages, their distribution and implications for standard of living. This is the first such report. Responding
to the need for such a report from the Ministry of Labour and Employment within the Government of India,
the International Labour Organization Office for India took the initiative.
The late Professor TS Papola, a veteran economist of repute especially in the area of labour studies, was
entrusted with the work. He began in early 2015 but could not see it through to completion; he passed away
on 23 November 2015, sadly. Subsequently, the work was entrusted to me and I greatly benefitted from
the framework as well as a few draft chapters Professor Papola left behind. I have had a long professional
and personal association with Professor Papola, first as one of his students at the University of Bombay
(now Mumbai) in the early 1970s, and then as an active member of the Indian Society of Labour Economics
(ISLE), of which he was the President until recently. I had also the privilege to work closely with him as a
fellow Member of the erstwhile National Commission for Enterprises in the Unorganized Sector (2004-09).
Such a long association was a great advantage to my ability to carry on the work on this report and complete
it in its present form.
The initiation and completion of this report would not have been possible but for the support, assistance
and contributions in various ways of a number of persons. At the ILO Office in India, Panudda Boonpala,
Director, provided leadership and constant support. Sher Verick, Deputy Director, besides monitoring the
progress, gave useful suggestions, organized consultations and provided leadership in conducting a
workshop to discuss a draft of this report. Catherine Saget, who was in the ILO India Office for a brief
period, provided useful comments on some of the earlier draft chapters. Noman Majeed and Xavier
Gonzalo Estupinan Serrano provided useful inputs during consultations.
During the initial stages of the preparation of this report, Professor Papola had a number of consultations
with me as well as other academic scholars. DN Reddy provided a detailed background paper on minimum
wages and collective bargaining scenario in the state of Andhra Pradesh (undivided). Srinatha Jagannathan
prepared a detailed note based on field studies on the implementation of minimum wages as well as the
collective bargaining situation in Maharashtra. Rajendra Mamgain provided inputs on minimum wage
implementation and related issues based on field investigations in selected locations in Delhi and UP
Manisha Bera provided excellent research assistance to Professor Papola.
Besides continuing my consultations with DN Reddy and Rajendra Mamgain, I also relied on extensive
consultations with G Raveendran, former Additional Director General of Central Statistical Organization
and currently Honorary Fellow, Laurie Baker Centre for Habitat Studies (LBC) and S Madheswaran,
Professor, Institute of Social and Economic Change, Bangalore whose professional comments and
suggestions were helpful in finalizing the econometric exercises in Chapters 5 and 6. Imran Khan, Research
Associate (LBC) provided excellent assistance in data analysis and prepared a background note on wage
trends and wage determination. Shalini Rajesh, Administrative Assistant (LBC), provided excellent
secretarial assistance.
At the workshop held on 11 November 2016 to discuss the draft report, I benefitted greatly from the
comments provided by PP Mitra, former Principal Advisor, and Debashish Chakrabarty, Deputy Director
General (Labour and Employment), both of the Ministry of Labour and Employment, Government of India.
SK Sasikumar, Senior Fellow at the VV Giri National Institute for Labour, Noida also provided useful
comments and suggestions. A number of academic scholars, representatives of national trade unions and
employers’ associations provided comments and suggestions.

ILO DWT for South Asia and Country Office for India v
This final report reflects the issues and concerns raised by a number of persons mentioned above. Out of
all the issues and trends documented here, two of them stand out — wage disparity along socio-spatial and
gender lines, and the need to ensure, at the very least, a national minimum wage for the bottom fifth of the
working population.
KP Kannan
Chairman, Laurie Baker Centre for Habitat Studies and
Honorary Fellow, Centre for Development Studies,
Thiruvananthapuram

vi ILO DWT for South Asia and Country Office for India

ILO DWT for South Asia and Country Office for India vii
Table of contents Preface and acknowledgements ................................................................................................................... iv
Abbreviations ............................................................................................................................................. xvi
1. Introduction .......................................................................................................................................... 1
1.1. Background ........................................................................................................................................ 1
1.2. Objectives .......................................................................................................................................... 2
1.3. Methodology ...................................................................................................................................... 2
1.4. Organization of the report .................................................................................................................. 4
2. Wages in India: A review of literature ................................................................................................. 5
2.1. Introduction ....................................................................................................................................... 5
2.2. Trends in wages ................................................................................................................................. 5
2.3. Focus on wages of agricultural workers ............................................................................................ 6
2.4. Wage trends in organized manufacturing .......................................................................................... 7
2.5. Gender-based wage disparities and their association with discrimination ........................................ 9
2.6. Wage discrimination due to social identity...................................................................................... 11
2.7. Discrimination based on religious identity ...................................................................................... 12
2.8. Wage disparity due to other factors ................................................................................................. 12
2.9. Wage inequality ............................................................................................................................... 13
2.10. Trends in wage inequality between skilled and unskilled labour .................................................. 14
2.11. Trends in wage share ..................................................................................................................... 16
2.12. Trends in wage share for broad sectors of the economy ................................................................ 17
2.13. Analysis of trends in wage share in organized manufacturing ...................................................... 17
2.14. Summing up ................................................................................................................................... 18
3. Sources of statistics on wages ............................................................................................................ 20
3.1. Introduction ..................................................................................................................................... 20
3.2. Survey-based sources ...................................................................................................................... 20
3.2.1. Employment and Unemployment Surveys (EUS), NSSO ....................................................... 20
3.2.2. Employment and Unemployment Survey (EUS), Labour Bureau ........................................... 21
3.2.3. Agricultural Wages in India (AWI) .......................................................................................... 21
3.2.4. Survey on Wage Rates in Rural India ...................................................................................... 22
3.2.5. Rural Labour Enquiry (RLE) ................................................................................................... 23
3.2.6. Cost of cultivation studies (Commission on Agricultural Costs and Prices-CACP) ................ 23
3.2.7. Occupational Wages Surveys ................................................................................................... 24
3.2.8. Annual Survey of Industries (ASI) ........................................................................................... 24

viii ILO DWT for South Asia and Country Office for India
3.3. Sources based on annual returns under labour laws ........................................................................ 25
3.3.1. Annual return under Payment of Wages Act, 1936 .................................................................. 25
3.3.2. Returns on Minimum Wages Act, 1948 ................................................................................... 26
3.3.3. Annual return on Mines Act, 1952 ........................................................................................... 27
3.4. Overall assessment and recommendations ...................................................................................... 27
4. Structure, trends and disparities: What can we learn from descriptive statistics? .............................. 29
4.1. Introduction ..................................................................................................................................... 29
4.2. Employment structure ...................................................................................................................... 29
4.3. Wage levels and growth trends ........................................................................................................ 31
4.4. Wages across different education levels .......................................................................................... 34
4.5. Wage rates by socio-religious category ........................................................................................... 36
4.6. Wages by industry ........................................................................................................................... 38
4.7. Occupations ..................................................................................................................................... 43
4.8. Summing up ..................................................................................................................................... 44
4.8.1. Growth in wages....................................................................................................................... 45
4.8.2. Disparities................................................................................................................................. 47
5. Wage determination and wage income .............................................................................................. 49
5.1. Introduction ..................................................................................................................................... 49
5.2. Methodology .................................................................................................................................... 49
5.3. Results from wage regression .......................................................................................................... 50
5.4. Results for the regular labour market .............................................................................................. 51
5.5. Results for casual labour market...................................................................................................... 54
5.6. Wage income as a share of household Income ................................................................................ 56
5.7. Summing up ..................................................................................................................................... 58
6. Measuring wage inequality ................................................................................................................ 63
6.1. Introduction ..................................................................................................................................... 63
6.2. Inter-quantile dispersion ratio .......................................................................................................... 63
6.3. Gini coefficient ................................................................................................................................ 65
6.4. Decomposition of wage inequality .................................................................................................. 65
6.5. Wage inequality: Some insights from a disaggregation of wage workers ....................................... 69
7. Wages in India: A brief state-level analysis ....................................................................................... 82
7.1. Introduction ..................................................................................................................................... 82
7.2. Trends and disparities ...................................................................................................................... 82
7.3. Toppers, middlers and laggards in wage growth ............................................................................. 87
7.4. Wage levels and disparities: Regular workers ................................................................................. 88
7.5. Wage levels and disparities: Casual workers ................................................................................... 90

ILO DWT for South Asia and Country Office for India ix
7.6. Regional dimension of gender disparity in wages ........................................................................... 94
7.7. Wage inequality ............................................................................................................................... 96
7.8. Summing up ................................................................................................................................... 101
8. Wage policy I - Legislations and institutions on minimum wages .................................................. 102
8.1. Introduction ................................................................................................................................... 102
8.2. Concepts and approaches ............................................................................................................... 103
8.2.1. Constitutional mandate ........................................................................................................... 103
8.2.2. Committee on fair wages ........................................................................................................ 104
8.2.3. ILO Conventions and India .................................................................................................... 104
8.2.4. Planning and wage policy in India ......................................................................................... 105
8.2.5. National Commissions on Labour .......................................................................................... 106
8.3. The Minimum Wages Act, 1948: An important legislative measure ............................................ 107
8.3.1. Objectives, evolution and enactment ...................................................................................... 107
8.3.2. Salient Provisions, schedule, machinery for fixation and revision......................................... 107
8.3.3. Coverage................................................................................................................................. 108
8.4. Selected state-level experiences .................................................................................................... 112
8.4.1. State of Andhra Pradesh (Undivided) .................................................................................... 112
8.4.2. Maharashtra ............................................................................................................................ 114
8.4.3. Kerala ..................................................................................................................................... 116
8.5. A National Minimum Wage .......................................................................................................... 119
8.6. Issues in implementation ............................................................................................................... 119
9. Wage policy II - Other legislations and wage setting institutions .................................................... 126
9.1. Introduction ................................................................................................................................... 126
9.2. Payment of Wages Act, 1936 ........................................................................................................ 126
9.2.1. Objectives and salient provisions ........................................................................................... 126
9.2.2. Coverage and extension over the years .................................................................................. 126
9.2.3. Implementation machinery and experience ............................................................................ 127
9.3. Equal Remuneration Act, 1976...................................................................................................... 127
9.3.1. Objective ................................................................................................................................ 128
9.3.2. Coverage................................................................................................................................. 128
9.3.3. Implementation....................................................................................................................... 128
9.4. Payment of Bonus Act, 1965 ......................................................................................................... 128
9.4.1. Concept: Deferred wage/profit sharing .................................................................................. 128
9.4.2. Coverage: Enterprise/ workers ............................................................................................... 129
9.5. Wage setting institutions and practices .......................................................................................... 129
9.5.1. Historical developments ......................................................................................................... 129

x ILO DWT for South Asia and Country Office for India
9.5.1.1. Collective bargaining ...................................................................................................... 129
9.5.2. Dispute settlement machinery under the Industrial Dispute Act, 1947 .................................. 131
9.5.3. Wage Boards .......................................................................................................................... 132
9.5.3.1. Constitution and functioning ........................................................................................... 132
9.5.3.2. Present status of Wage Boards ........................................................................................ 133
9.6. Collective bargaining at industry/ enterprise level ........................................................................ 134
9.7. Wage fixing practices at the enterprise level: State level experiences .......................................... 135
9.7.1. Andhra Pradesh (Undivided) .................................................................................................. 135
9.7.1.1. Some Basic Characteristics ............................................................................................. 135
9.7.1.2. Type of employment and range of wages of permanent and temporary workers ........... 136
9.7.1.3. Methods of fixation of wages.......................................................................................... 137
9.7.1.4. Role of unions in the fixation of wages .......................................................................... 138
9.7.1.5. Role of government in wage fixation .............................................................................. 138
9.7.1.6. Role of comparing wages in other enterprises in the area .............................................. 138
9.7.1.7. Role of qualifications, skills and experience in fixing wages ......................................... 139
9.7.1.8. Statutory minimum wages and the actual wages ............................................................ 139
9.8. Maharashtra ................................................................................................................................... 140
9.9. West Bengal ................................................................................................................................... 144
9.10. Concluding observations ............................................................................................................. 146
10. Conclusion: Summary of findings, some explanations and recommendations ............................ 147
10.1. The larger picture ......................................................................................................................... 147
10.2. Importance of strengthening the statistical system ...................................................................... 147
10.3. Trends in wages ........................................................................................................................... 148
10.4. Continuing wage disparities ........................................................................................................ 149
10.5. Inter-state variations .................................................................................................................... 149
10.6. Wage determination ..................................................................................................................... 151
10.7. Wage inequality ........................................................................................................................... 152
10.8. Linking wage Inequality to income inequality ............................................................................ 153
10.9. Wage policy ................................................................................................................................. 153
10.10. Recommendations ..................................................................................................................... 155
References ................................................................................................................................................. 157

ILO DWT for South Asia and Country Office for India xi
List of figures Figure 4.1: Real Daily wages of regular casual workers in India (in INR) ................................................ 32
Figure 6.1: Wage inequality: Percentile ratios ............................................................................................ 64
Figure 6.2: Daily wages of rural women in different social and educational groups (in INR) ................... 67
Figure 6.3: Money wages of workers differentiated by location, labour status, gender, social group and
education (in INR) ..................................................................................................................................... 70
Figure 6.4: Money wages of workers differentiated by location, labour status, gender, social group and
education, 2011-12 (in INR) ....................................................................................................................... 71
Figure 7.1: Annual growth rates in wages of Male Regular Workers (1993-94 to 2011-12) ..................... 83
Figure 7.2: Annual growth rates in wages of Female Regular Workers (1993-94 to 2011-12) .................. 84
Figure 7.3: Annual growth rates in real wages of Male Casual Workers (1993-94 to 2011-12) ................ 85
Figure 7.4: Annual growth rates in real wages of Female Casual Workers 1993-94 to 2011-12) .............. 86
Figure 7.5: State-wise real wage rates C as % of R for Male worker ......................................................... 92
Figure 7.6: Real wages of casual as % of Regular for Female workers ...................................................... 93
List of tables Table 4.1: Distribution of workers and their annual growth rates .............................................................. 30
Table 4.2: Percentage share of employment by location, gender and labour status.................................... 30
Table 4.3: Employment elasticity in the Indian economy ........................................................................... 31
Table 4.4: Real wage rates (INR Per day) and their annual growth rates ................................................... 32
Table 4.5: Wage (INR per day) trends from 1993-94 to 2011-12 .............................................................. 33
Table 4.6: Wage elasticity with respect to income growth ......................................................................... 33
Table 4.7: Real wage rates and their growth by location, labour status, gender and education (in INR/day)
.................................................................................................................................................................... 35
Table 4.8: Real wages and its disparity by social group ............................................................................. 36
Table 4.9: Disparity in real wage rates (INR per day) by location, labour status, gender and social group37
Table 4.10: Access to employment by social group and labour status (percentage share) ......................... 38
Table 4.11: Real wage rates (INR per day) of workers by economic sector ............................................. 39
Table 4.12: Growth rates in real wage rates of workers by economic sector ............................................ 40
Table 4.13: Percentage share of casual workers by industry and organized/unorganized sector (non-
agricultural only) ......................................................................................................................................... 41
Table 4.14: Real wage rates of workers by economic sector and formal-informal ................................... 42

xii ILO DWT for South Asia and Country Office for India
Table 4.15: Wage disparity by industry and labour status (wages in organized casual (OC), unorganized
regular (UR) and unorganized casual (UC) as % of OR)............................................................................ 43
Table 4.16: Percentage of casual workers by occupation ........................................................................... 43
Table 4.17: Real wages and wage disparity by gender and occupation ..................................................... 44
Table 4.18: Annual growth rate in real wages ............................................................................................ 45
Table 4.19: Three main types of wage disparity ......................................................................................... 47
Table 5.1. Selectivity corrected wage equation for Regular and Casual Workers (2012): Summary of
results .......................................................................................................................................................... 52
Table 5.2: Regional factor in wage determination: [Reference group: Gujarat] Summary of results for
regular work, 2011-12 ................................................................................................................................. 53
Table 5.3: Regional factor in wage determination: [Reference Group: Gujarat] Summary of results for
casual work survey, 2011-12 ...................................................................................................................... 55
Table 5.4: Wage income of households in 1993-94 and 2011-12 ............................................................... 57
Table 5.5: Wage income (INR) and its share as percentage of per household GDP by Social Group ....... 58
Table 5. A1:Selectivity corrected wage equation for Regular and Casual wage workers: log daily wage
(2012) .......................................................................................................................................................... 60
Table 6.1: Wage inequality (inter-quantile dispersion ratio) ...................................................................... 64
Table 6.2: Wage inequality (Gini coefficient) trends.................................................................................. 65
Table 6.3: Construction of groups for decomposing inequality .................................................................. 66
Table 6.4: Inequality decomposition (Theil) ............................................................................................... 68
Table 6.5: Inequality decomposition (Theil): ............................................................................................. 69
Table 6.6: Groups of workers receiving daily wages below the National Minimum Wage (INR 66) 2004-
05 ................................................................................................................................................................ 72
Table 6.7: Groups receiving daily wages less than 1.25 times the National Minimum Wage (Rs.83) 2004-
05 ................................................................................................................................................................ 73
Table 6.8: Groups of workers not getting the National Minimum Wage of INR122 in 2011-12 .............. 74
Table 6.9: Workers not getting 1.25 times the NMW i.e. INR 153 in 2011-12 .......................................... 74
Table 6.A1: Daily earnings of wage workers by location, labour status, gender, social group and
education (INR per day). Real wages at constant prices (2004-05) – (larger group).................................. 76
Table 6.A2: Daily earnings of wage workers by location, labour status, gender, social group and
education (INR per day). Real wages at constant prices (2004-05) - smaller group .................................. 79
Table 7.1: Annual average growth rates in real wages during 1993-94 to 2011-12 ................................... 87
Table 7.2: State-wise real wage rates of regular workers (INR per day) .................................................... 89
Table 7.3: State-wise real wage rates (INR per day) of casual workers (2004-05 constant prices) ............ 90
Table 7.4: Gender disparity in wages (wages of women as % of men) ...................................................... 94
Table 7.5 : Wage inequality among regular workers .................................................................................. 96
Table 7.6 : Wage inequality among regular workers .................................................................................. 98
Table 7.7: Wage inequality - casual workers .............................................................................................. 99
Table 7.8: Wage inequality among casual workers .................................................................................. 100

ILO DWT for South Asia and Country Office for India xiii
Table 8.1: Coverage of employments under the Minimum Wages Act of 1948 as on 2013 .................... 109
Table 8.2: Percentage of casual workers in agricultural (rural) receiving less than the National Minimum
Wage Rate of INR 66 in 2004-05 and INR 122.08 in 2011-12 ................................................................ 110
Table 8.3: Percentage Share of casual workers not receiving the National Minimum Wage rate of INR
122.08 in 2011-12 in India’s states ........................................................................................................... 111
Table 8. A1: Percentage of casual workers in Agricultural sector receiving less than National Minimum
Wage (INR 122.08) (2011-12) Rural ........................................................................................................ 122
Table 8.A2: Percentage of casual workers in agricultural sector receiving less than National Minimum
Wage (INR 122.08) (2011-12) Urban ....................................................................................................... 123
Table 8. A3: Percentage of casual workers in non-agricultural sector receiving less than National
Minimum Wage (INR 122.08) (2011-12) Rural ....................................................................................... 124
Table 8. A4: Percentage of casual workers in non-agricultural sector receiving less than National
Minimum Wage (INR 122.08) (2011-12) Urban ...................................................................................... 124
Table 9.1: Type of enterprises and range of wages for permanent and contract Workers (in INR) ......... 136
Table 9.2: Type of enterprises and method of fixation of wages .............................................................. 137
Table 9.3: Type of enterprises and wages in comparison with other units ............................................... 139
Table 9.4: Type of enterprises and basis for fixing wages for individual worker ..................................... 139
Table 9.5: Type of enterprises and wages compared to minimum wages................................................. 140
Table 9.6: Standard occupational wage rates used in industrial enterprises in Maharashtra .................... 141
xiv ILO DWT for South Asia and Country Office for India
About the authors
The late TS Papola was a renowned economist in India especially in the area of labour, employment and
development. He held several positions including Director, Giri Institute of Development Studies (IDS),
Lucknow; Advisor (Employment), Planning Commission, Government of India; Member, National
Commission for Enterprises in the Unorganized Sector; and Director, Institute for Studies in Industrial
Development (ISID), New Delhi. He was a National Fellow of the Indian Council of Social Science
Research.
KP Kannan, a development economist, has worked extensively in the area of labour, employment and
development. Currently, he is an Honorary Fellow at the Centre for Development Studies, Trivandrum and
Chairman of the Laurie Baker Centre for Habitat Studies (LBCHS), Trivandrum, Kerala. He is a Member
of the International Panel on Social Progress, a collective of social scientists across the globe, and is
engaged in preparing a report on Society in the Twenty First Century. Earlier, he was a Professorial Fellow
and Director at the Centre for Development Studies (CDS), Trivandrum. He was also a Member of the
erstwhile National Commission for Enterprises in the Unorganized Sector.

ILO DWT for South Asia and Country Office for India xv
xvi ILO DWT for South Asia and Country Office for India
Abbreviations
ASI Annual Survey of Industries
AWI Agriculture Wages in India
CDS Centre for Development Studies
CEDAW Convention on the Elimination of all forms of Discrimination Against Women
CPI Consumer Price Index
CWS Current Weekly Status
CW Casual Workers
DES Directorate of Economics and Statistics
DGMS Directorate of General Mines Safety
DESMOA Directorate of Economics and Statistics in the Ministry of Agriculture
EUS Employment and Unemployment Survey
FDI Foreign Direct Investment
GDP Gross Domestic Product
GSDP Gross State Domestic Product
ICDS Integrated Child Development Services
ICT Information and Communication Technology
ICSSR Indian Council of Social Science Research
IDA Industrial Dispute Act
IDS Giri Institute of Development Studies
ILO International Labour Organization
IHD Institute of Human Development
ISID Institute for Studies in Industrial Development
ILSE Indian Society of Labour Economics
IT Information Technology
JWNC Joint Wage Negotiating Committee
LBCHS Laurie Baker Centre for Habitat Studies
MGNREG Mahatma Gandhi National Rural Employment Guarantee
MGNREGS Mahatma Gandhi National Rural Employment Guarantee Scheme
MNC Multi-National Corporations
MoA Ministry of Agriculture
MOSPI Ministry of Statistics and Programme Implementation
MWAB Minimum Wage Advisory Board

ILO DWT for South Asia and Country Office for India xvii
NMW National Minimum Wage
NCEUS National Commission for Enterprises in the Unorganized Sector
NSSO National Sample Survey Organization
RLE Rural Labour Enquiry
RSBY Rashtriya Swasthya Bhima Yojana
RIF Recentered Influence Function
RW Regular Workers
SSA Sarva Shiksha Abhiyan
UPS Usual Principal Status
UPSS Usual Principal and Subsidiary Status
VDA Variable Dearness Allowance

xviii ILO DWT for South Asia and Country Office for India
ILO DWT for South Asia and Country Office for India 1
1. Introduction
1.1. Background
The level of wages are of fundamental importance for the living standards of wage earners and their
families, irrespective of the level of economic development. They are also important indicators of economic
progress and social justice. In recent years, many countries saw a revival of interest in wage policies and
policy tools such as minimum wages, after a period of relative neglect during the 1980s and 1990s. In
developed countries, this revival is due to the financial crisis of 2008 and its after-effects on the standard
of living of a majority of the population. It was realized that trends in both employment and wages are such
that they have contributed to an increase in income inequality. In developing countries, especially those
that are referred to as emerging economies, the high growth rate in the economy has also led to an increase
in real wages but at a lower speed; with the result that there has been an increase in income inequality.
Some countries have indeed experienced a reduction in income inequality but some others, like China and
India, have experienced an increase in income inequality and along with a reduction in absolute poverty. It
is, thus, critical for policymakers to better understand the nature of wage policies and strategies for wage
setting to ensure prevention of increasing income inequality.
In India, there has been considerable debate on both the trends in real wages and wage policy, especially
on the question of setting a national floor level minimum wage as well as the implementation of a large set
of minimum wages in different states. Despite being labelled as an emerging economy and its status as a
member of the G20, India presents a rather different picture when it comes to employment and wages. The
share of population in the labour force is lower than other emerging Asian economies and the percentage
of wage labour in the total work force is also quite low. Wage workers constitute only a little less than half
the work force (48 per cent) in the economy. This, however, does not reduce the importance of wages and
wage setting, while it does call for a consideration of those who are self-employed. Of the other half of the
workforce, classified as self-employed, an overwhelming majority eke out a living, either based in their
homes or outside, by engaging in activities characterized as ‘Own Account Work’; nothing but disguised
wage labour engaged in putting out/piece rate systems of work or in petty trading such as street-vending.
Therefore, any change in the wages of wage workers will have an impact on the earnings of these workers
who get paid for the labour they put in.
While trends in wages are an important indicator of the welfare of the wage-dependent population, there
are other, equally important dimensions to investigate. The dual nature of the economy has led to a
segmentation of the labour market, with the consideration of additional characteristics. Therefore, trends
in wages will have to be examined in terms of type of employment or labour status, rural-urban location as
well as gender. These will have to be further examined in terms of economic sectors and industries as well
as occupation. Regional dimension of wage is an important area of investigation, given the large size of
the country and the variation in economic development. While a number of studies have examined these
aspects within different time-frames, it is important to place them in a comprehensive manner with a longer
time-span.
Then, there is the question of wage determination in the Indian labour markets and the factors influencing
such a process. The question of wage disparity—between gender, location and social identity—are of
importance from balanced growth as well as social justice points of view. Whether wage inequality has

2 ILO DWT for South Asia and Country Office for India
increased or decreased is a question of paramount importance, especially in the larger context of increasing
income inequality. From a distributional point of view, inequality also needs to be examined from the point
of wage share in national income to find out whether or not wage workers have gained or lost in a relative
sense.
Finally, there is a revival of interest in the role of labour market institutions--particularly in the areas of
minimum wages and collective bargaining--in affecting wage levels and the distribution of wages. In India,
the main legislative instruments regulating wages are: the Minimum Wages Act, 1948; the Payment of
Wages Act, 1936; the Payment of Bonus Act, 1965; and the Equal Remuneration Act, 1976. The policy
debates have included the question of whether India should enact a national minimum wage floor (it was
adopted as a policy of the previous government but does not enjoy statutory status) and, more recently, on
the consolidation of the above Acts into a single Labour Code on Wages (an ongoing process). In 2016, all
the national trade unions have mounted a campaign for a statutory national minimum floor wage at a higher
threshold than the currently non-statutory national minimum wage. Beyond these legislative steps, there
are a range of challenges to implementing an effective wage policy, including some level of consensus on
the need to ensure broader coverage of minimum wages, simplification of minimum wage structure, and
measures to improve implementation.
1.2. Objectives
Against this background, this report, the first of its kind for India, seeks to provide a stock-taking of the
issues thrown up by existing literature, an assessment of the sources of wage data, a fresh analysis of issues
based on unit level data (unless otherwise specified), and an assessment of the effectiveness of wage policy
and wage setting institutions. Although the main thrust of this report is on country-wide analysis, we have
been alert to the importance of the regional dimension, which involves a state-level assessment and analysis
of important issues. Therefore, the objectives of this report are:
1. Highlight major issues on the question of wages in India;
2. Catalogue all the key wage data sources including their limitations and the gaps;
3. Discussion and interpretation of wage trends, determinants and inequalities based on new data
analysis;
4. Analyse the state of affairs in the implementation of wage policy in India with specific reference
to the implementation of the Minimum Wage Act, 1948; and
5. Outline a concise but actionable set of recommendations on data, research and legislative/policy
response.
1.3. Methodology
This study report is an outcome of a combination of approaches adopted to suit the requirements of
collection of information and analysis of data. These are mainly (a) a review of the literature on select
issues relating to wages, (b) computations based on unit level data as well as administrative data, (c) field
reports on implementation of minimum wages and collective bargaining practices, (d) interactions with
scholars, representatives of trade unions and employers’ associations, and administrators, as well as experts
from the International Labour Organization based both in New Delhi and headquarter (Geneva). The period
of analysis is 1993-94 to 2011-12, in which the initial year coincides with the implementation of a series of
new economic reforms in India aimed at the liberalization of the economy launched in 1991. The period
covered is the economic reform period of roughly two decades.
ILO DWT for South Asia and Country Office for India 3
On the basis of an examination of data sources, it was decided to use the unit level data of the Employment
and Unemployment Survey (EUS) of the National Sample Survey Organization (NSSO). This source is the
most comprehensive one for employment, unemployment and wages, and a host of related socio-economic
characteristics. Five rounds of EUS were available for this period, and we selected the three time points of
1993-94, 2004-05 and 2011-12 to cover two long intervals as well as to cover the whole period.
Given the dual character of the Indian economy, including both organized and unorganized or formal and
informal labour, it is not appropriate to talk about a single wage. However, wages are not worked out on
the basis of this duality but rather, in terms of type of employment or labour status. Workers are referred
to as ‘regular workers’ and ‘casual workers’. Dualism in the Indian economy refers not only to the sector
denoting the enterprises but also to employment. Formal employment is related to workers with
employment and/or social security provided by the employer, while informal employment refers to its
absence. Informal employment refers to employment without any employment or social security provided
by the employer. The formal or organized sector consists largely of regular workers, although the trend is
to employ them on an informal basis that includes both regular and casual workers. The informal sector
consists overwhelmingly of casual employment. Viewed in this way, the regular and casual worker
categories broadly correspond to the formal-informal types of employment. In the EUS, the definition
adopted for these two types of employment are as follows.
‘Regular wage/salaried employee: These are persons who work in others’ farm or non-farm enterprises
(both household and non-household) and, in return, receive salary or wages on a regular basis (i.e. not on
the basis of daily or periodic renewal of work contract). This category includes not only persons getting
time wages but also persons receiving piece wages or salary and paid apprentices, both full-time and part-
time.
Casual labour: A person who is casually engaged in others’ farm or non-farm enterprises (both household
and non-household) and, in return, receives wages according to the terms of the daily or periodic work
contract, was considered as casual labour (NSSO 2014: 17).
Employment and unemployment in the EUS are measured using alternative concepts called Usual Principal
and Subsidiary Status (UPSS), Usual Principal Status (UPS) and Current Weekly Status (CWS). The
broadest measure is that of UPSS, widely used in official documents as well as most academic studies. The
employment measure we have used is the first one viz. UPSS. It is defined in the EUS as follows. Under
this category, all persons who worked for a major part of the year were included as employed under
principal status. In addition, those who pursued some economic activity for less than six months but more
than 30 days in the reference year were included as subsidiary workers (for details see NSSO 2014: 18-19).
It is important to note what is recorded as wages. This not only includes monetary remuneration received
at specified intervals, but also all other monetary and non-monetary benefits arising out of work excluding
over-time payments. The definition adopted in the EUS is worthy of reproduction here.
“Wage and salary earnings: Information on wage and salary earnings was collected separately for each of
the wage/salaried work recorded for a person in a day. Here, earnings referred to the wage/salary income

4 ILO DWT for South Asia and Country Office for India
(and not total earnings taking into consideration of all other activities done) received/receivable for the
wage/salaried work done during the reference week by a wage/salaried employee and casual labourer.
The wage/ salary received or receivable may be in cash or kind or partly in cash and partly in kind. While
recording the earnings following conventions were followed: i) The wages in kind were evaluated at the
current retail price; ii) Bonus and perquisites such as free accommodation, reimbursement of expenditure
for medical treatment, free telephones, etc. evaluated at the cost of the employer or at retail prices and duly
apportioned for the reference week were also included in earnings; and iii) Amount receivable as 'over-
time' for the additional work done beyond normal working time was excluded. It may be noted that in the
survey, at most two activities could be recorded for a person in a day. Therefore, it is possible that a person
might have carried out two or more wage/salaried activities in a day, but only one activity or two activities
at the most, depending upon the time spent on those activities, was recorded. In that case, the wage/salary
income only from that activity(s) was collected and recorded separately, and not the total income of the
person from all the activities done for the entire day” (NSSO 2014: 23).
1.4. Organization of the report
Chapter 2 of this study report sets the larger context by a brief review of the literature on wages focusing
on trends in rates, disparities, discrimination and the overall question of inequality. The many pieces of
writing on this subject have thrown up a number of issues some of which have been further investigated
through our data analysis and commented upon. Chapter 3 is both a cataloguing and an assessment of the
key sources of statistics on wages in India, and provides the rationale for our selection of the unit level data
from the EUS of the NSSO for data analysis while the administrative data, with its severe limitations, was
used for analysing wage policies and their implementation. Chapter 4 reports and analyses the results of the
data analysis on the structure and trends in wages. The trends in two major types of wages – regular and
casual – have been examined from different angles such as location, gender, education, social group,
economic sector and occupation. In the process the results also bring out levels and disparities that have
great significance from the point of economic performance as well as social justice. Chapter 5 deals with
testing a standard equation for wage determination and then goes on to discuss the issue of wage shares in
national income from the point of the worker households in the two types of employment or labour status.
Chapter 6 takes up the issue of wage inequality by deploying alternative measurements. Chapter 7 is
devoted to the regional dimension i.e. state-wise analysis of selected issues such as trends, disparities,
determination and inequality. Chapters 8 and 9 are devoted to a discussion of wage policies, legislations
and their implementation, focusing on minimum wages as well as collective bargaining. Chapter 10
summarizes the findings, discusses the possible explanatory factors and provides a set of recommendations.

ILO DWT for South Asia and Country Office for India 5
2. Wages in India: A review of literature
2.1. Introduction
There exists a large amount of literature on various aspects of the wage question in India. Here we review
a select few pieces of research to find out what they have to say on (a) trends in wages in the economy as
well as in particular sectors, (b) wage disparities especially with regard to gender, (c) discrimination based
on social identity, (d) wage inequalities of various kinds, and (e) trends in wage share especially that in
relation to trend in labour productivity. Excepting a few studies, most studies do not make the distinction
between regular and casual wages since their purpose is to measure the overall direction of change in wages
or its relationship with other variables such as productivity or income.
2.2. Trends in wages
The evidence of wage growth for regular and casual workers in rural and urban areas has shown a positive
trend at the aggregate level (Karan and Sakthivel, 2008; Sarkar and Mehta, 2010), but the wage growth has
been slower in the post-reform period (1993-94 to 2004-05) than pre-reform period (1983 to 1993-94)
(Karan and Sakthivel, 2008). There was a difference in the growth rates of regular and casual workers both
in rural and urban areas. Wage rates of casual workers grew at a slower rate in the same period even when
the regular workers earned wages which were several times higher than that of casual workers (Sarkar and
Mehta, 2010). There is a substantial wage gap between regular and casual workers both within and between
rural and urban areas. Casual workers in both rural and urban areas earn little over one third of the wages
of regular workers (Karan and Sakthivel, 2008). However, the rural and urban disparity in wage rates has
declined both among regular and casual workers from 1983 to 2004 (Sarkar and Mehta, 2010). Evidence
also shows that there is an overall reduction of wage gap between rural and urban areas even though the
wage gaps are substantial (Hnatkovska and Lahiri, 2012).
Many studies have distinguished workers into regular and casual workers, as proxies for formal and
informal employment. This is a rough approximation but, as the National Commission for Enterprises
(NCEUS 2007 and 2009) reported, the situation has changed since the initiation of neoliberal economic
reforms. There is now an increasing divide between workers in the informal sector and informal workers.
While an overwhelming majority of workers in the informal sector are informal workers (e.g. casual), the
share of informal workers in the formal sector (e.g. contract, temporary, and casual workers) has increased
to such an extent that they now constitute the majority in the latter i.e. 51 per cent in 2009-10 (see Kannan
2014: 231) and, according to our computations, 56 per cent in 2011-12. But all the regular workers are not
formal workers, although all the casual workers are informal workers. Regular workers in formal sector
earn more than double the weekly wage earnings of regular workers in informal sector. However, among
the casual workers, wage differentials are not significant. In some cases, wage earnings of casual workers
in the informal sector are higher than that of casual workers in the formal sector (Unni 2005). Recent data
analysed here also confirm this outcome (see Ch.4, Table 4.15).
6 ILO DWT for South Asia and Country Office for India
2.3. Focus on wages of agricultural workers
Ever since the launch of a strategy for a green revolution in Indian agriculture in the early 1960s, studies of
trends in wages of agricultural labourers assumed a particular significance. This was because a rise in the
wages of agricultural workers, one of the poorest sections in the Indian economy, held out the possibility
of a change in their standard of living. In addition, structural transformation in employment in the Indian
economy—i.e. a shift of labour from agricultural and related primary activities to secondary and tertiary
activities—was at a slow pace, such that an overwhelming majority continued to be trapped in the primary
sector of the economy. Since 2004, there has been a slightly faster pace in the employment transition, such
that the agricultural sector of the economy accounted, in 2011-12, for about half the labour force. One may
say India is on the verge of a structural transformation as the income share from the primary sector declined
much earlier. It is, therefore, important to focus on the plight of agricultural workers in terms of trends in
wages, as it constitutes one of the important variables determining their income along with employment.
Since most of them are asset-less or asset-poor, employment and wages assume an added significance.
Notable studies can be traced to Bardhan (1970), Krishnaji (1971), and Jose (1974 and 1988). Bardhan
(1970) studied wage rates up to 1964-65 and Krishnaji (1971) studied wages of Intensive Agricultural
Development Programme (IADP) districts up to the period of 1968-69, and both the studies reported a
decline in real wages in agriculture except in Punjab and Kerala. Jose (1974), extending the analysis of
trends in agricultural wages from 1956-57 to 1971-72, found that agricultural wages in real terms have not
only increased in Punjab and Kerala but also in states like Tamil Nadu , Uttar Pradesh and Gujarat. It was
also found that the period from 1964-65 to 1971-72 had witnessed an increase in agricultural productivity
due to the introduction of new technology of large-scale, high-yielding varieties; which could have been
one of the main reasons for wage increase in the same time period. The real wages showed a further increase
in 1984-85 and was higher for women workers, even though the gender disparity in wage persisted (Jose,
1988). According to the Mid-Term Appraisal of the Nineth Five Year Plan (Government of India 2001),
the trend in the growth of wages reversed after the 1990s, and the growth of agricultural wages decelerated.
Sharma (2001) and Sundaram (2001) rejected this view. The problem seems to have risen because of the
use of different secondary data sources, whose credibility and comparability were later in question
(Himanshu, 2005). Srivastava and Singh (2006) re-estimated rural wages using all the available data sources
and did not find any acceleration in agricultural wages in the post-reform period. They found that the manual
casual agricultural wages declined during the post-reform period, and that manual non-agricultural wages
showed no such decline. Analysing the determinants of agricultural wages using demand and supply
framework, Srivastava and Singh (2005) found that the key agricultural growth variables such as area under
irrigation, area under non-food grains and agricultural productivity per worker, all had significantly smaller
impact on agricultural wages in the post-reform period than in the pre-reform period. Even though there
was a decline in public investment in agriculture in the post reform period, this had a smaller impact on the
agricultural wage. The authors found that the main determinant of agricultural wages after reforms has been
the diversification of workforce away from agriculture and that responsiveness to this diversification has
increased after the reforms initiated in 1991.
Jose (2016) has examined the levels and trends in agricultural wages of men and women in major Indian
states over a period of four decades, from 1970-71 to 2010-11. The wage data used in the study was
compiled from Agricultural Wages in India. The main thrust of discussion in the paper is to explain spatial,
temporal and gender-wise variations in nominal and real wages in major Indian states. The author argues
that agro-climatic conditions and the resultant crop pattern in different states of India are key determinants
of the gender structure of employment, in particular wage employment, within agriculture. The evidence
given in the paper shows that inter-state differences in wages for men and women is widening over the

ILO DWT for South Asia and Country Office for India 7
years. On the other hand, the increase in money wages during the period from 1984-85 to 2010-11 is due
to the impressive growth of the production, area and yield of principal crops and the periodic revision of
mean support prices. The three major factors that explain the differential growth of real wages are: (i)
demographic transition and the net impact of migration; (ii) Impact of national rural employment guarantee
programme, and (iii) overall effect of social spending on rural wages.
2.4. Wage trends in organized manufacturing
A large number of studies on trends in wages, as well as employment, in the organized manufacturing sector
in India, have been carried out. This is understandable given the expectation, based on both theory and
history, that the organized or formal manufacturing sector will act as a leading sector in the Indian economy,
thereby releasing a process of structural transformation resulting in the overall economic development of
the country. Such an expectation is yet to be realized and the impediments and challenges seem to be much
larger than expected by theory and history. Focusing on trends in wages and wage share, we survey the
findings based on a selection of the vast literature.
While the decade of the 1980s was marked by decline in the growth of employment in the manufacturing
sector—in particular the fall in the number of workers in registered manufacturing--there was an
improvement in the growth rates in real net value added per worker (i.e. labour productivity) and real
earnings per worker in the sector. Isher Ahluwalia (1992) attributed policy-induced rigidities in the labour
market as the principal reason for the decline in employment and argued that “The sharp increase in the
capital-labour ratio in the first half of the 80s was associated with a sharp increase in the real wage rate
during this period”. The World Bank (1989) also reported that the real wage rate increased at 7.2 per cent
per annum in the first half of the 80s and, as the Bank argued, “employers responded (to the increase in
wage rate) by virtually stopping new hiring and retrenching existing workers to the extent possible".
A number of studies challenged these findings. Papola (1994) pointed out that the increase in labour
productivity during the 1980s was much faster than the growth in real wages and, that therefore, it could
not be a reason for stagnation in employment. He argued that the decline in employment in cotton textiles
and food products, which accounted for a sizeable part of factory employment, was caused by the closure
of mills due to sickness and rationalization due to obsolescence. Kannan (1994) demonstrated that the
increase in product wage in organized manufacturing was lower than labour productivity during 1973 to
1988, although the difference declined since the early 1980s. The decline in this dynamic efficiency in some
industries could have been due to other factors, such as industrial sickness, supply constraints with regard
to certain inputs or problems in capacity utilization. Nagaraj (1994), however, contradicted the findings of
Ahluwalia and the World Bank and argued that in the decade beginning 1979-80, employment growth
turned negative along with an increase in the total person days (or man-days) worked in registered
manufacturing, which suggested that the observed increase in earnings per worker could, at least partly,
represent his (or her) compensation for greater effort and may not necessarily imply an increase in the wage
rate, as has been argued. With the help of the data, Nagaraj also argued that while earnings per worker in
registered manufacturing increased at 3.2 percent in the decade beginning 1979-80, earnings per man-day
increased at only 1.6 per cent per annum, which was less than the corresponding real per capita GDP growth
rate during the same period (2.7 percent).
Ajit Ghose (2005), citing four striking facts about India’s organized manufacturing in comparison to select
Asian countries (Indonesia, Korea Republic, Malaysia, Taiwan, and Thailand), argued that the sector
8 ILO DWT for South Asia and Country Office for India
happens to stand out as a ‘high-wage/ low-productivity’ sector (on the basis of the UNIDO’s industrial
Statistics Database of the year 1994). Both the ratio of average wage in organized manufacturing to per
capita GDP and the employment content of value added were much higher in India than in other Asian
countries. One implication of such a trait was that while the organized manufacturing sector in India
employs mainly semi-skilled and high-skilled labour, this labour is less productive than the industrially
advancing Asian countries mentioned above. Ghose further stated that the movements in wages and prices
were favourable to employment growth in the 1970s and adverse in the 1980s and the 1990s, since
employment elasticity was high in the 1970s, zero in the 1980s and positive but low in the 1990s. It is also
to be noted that the sensitivity of employment growth to movements in the relative price of manufactures
(and hence to movement in product wage) increased sharply over time; this was insignificant in the 1970s,
significant but weak in the 1980s and very strong in the 1990s.
In a study on the impact of economic liberalization on employment and wages in Indian industry, Bhalotra
(2002) finds important inter-state differentials in wages. In the 1980s, nominal earnings in Andhra Pradesh
were almost 50 per cent below the Indian average, and those in Maharashtra almost 50 per cent above. And,
these wage differentials were remarkably stable, showing no tendency to narrow between 1979 and 1989.
The state-wise variation in earnings was re-computed after controlling for differences in industrial
composition. The pure state effects thus identified were still found to be very large. This indicates large
dispersion of earnings within each industry across states in India. Thus, despite considerable migration
across states, there appears to be state-specific labour markets.
Goldar and Banga (2005) in their analysis of assessing the extent of gains in labour productivity that got
translated into higher wages used time-series data on real wage rate and labour productivity for the
organized manufacturing sector of different states, as well as such time-series data at the all-India level.
They have concluded that between 1975-76 and 1999-2000, labour productivity (gross value added per
employee deflated by manufacturing price index) in organized manufacturing grew at a trend rate of 5.8
per cent per annum. The trend growth rate in real product wage (emoluments per employee deflated by
manufacturing price index) in this period was much lower, at about 1.3 per cent per annum.
In the period mid-1970s to mid-1980s, growth rate in real wages by and large maintained parity with growth
rate in labour productivity. However, since the mid-1980s, wage growth has been lagging behind
productivity growth. The gap between productivity growth and real wages growth was more than 3
percentage point per annum in the period 1985 to 1999. This may be attributed to weakening of the
bargaining strength of labour. The decline of the public sector may have been a contributing factor since
the wage setting in public sector plays an important role on the wage setting in the private sector.
With regard to the observed gap between growth rates in labour productivity and real wages at the all-India
level during the period 1975-76 to 1999-2000, they have found that in Gujarat, Himachal Pradesh,
Maharashtra and Uttar Pradesh, the growth rate of labour productivity during 1980-81 to 1999-2000 was
relatively higher. In all these cases, the growth rate of real wages lagged well behind the growth rate in
labour productivity. On the other hand, in Assam, Kerala, Tamil Nadu and West Bengal, the growth rate of
labour productivity was relatively low. In all these cases, the gap between labour productivity growth and
real wages growth was relatively small. Among the rest, there was a significant gap between growth rates
in labour productivity and wage rate in Andhra Pradesh, Bihar, Odisha, and Rajasthan. By contrast, the gap
was relatively small in Haryana and Punjab, which might have something to do with the agricultural
development in these states.

ILO DWT for South Asia and Country Office for India 9
Across states, there was a significant positive correlation (r=0.5) between growth rates of labour
productivity and real wages, indicating that labour productivity exerts an important influence in wage
setting. But, the regression coefficient is found to be 0.25, significantly lower than one. The implication is
that a hike in labour productivity would lead to a much less than proportionate hike in real wages. It has
been noted above that the growth rate in real wages by and large maintained parity with the growth rate in
labour productivity in the period from the mid-1970s to mid-1980s. But, since the mid-1980s, wage growth
has been lagging behind productivity growth.
In a nutshell, the analysis presented by Goldar and Banga brings out that in the period since the mid-1980s,
the growth in real wages in India’s organized manufacturing has been lagging behind the growth in labour
productivity. The analysis of time-series data for states and cross section data for three-digit industries of
different states revealed a positive relationship between labour productivity and wage rate, but the marginal
effect of labour productivity on wage rate as well as the elasticity was found to be low. The implication is
that only a small part of the gain in labour productivity gets translated into wage increase. Further, results
of a detailed econometric analysis of determinants of wage rate presented in their study clearly indicate that
labour market conditions matter a lot in wage setting. The stronger the trade unions, the higher the wages
earned by industrial workers. Greater labour market flexibility tends to push wages down. On the other
hand, a good investment climate raises the industrial wages.
Goldar, in another paper (2013), presented a detailed analysis of trends in wages in organized manufacturing
at the two-digit level based on the Annual Survey of Industries (ASI) for the period 1993-94 to 2007-08.
Much of these findings in this study were similar for previous periods in the study discussed (Goldar and
Banga 2005).
2.5. Gender-based wage disparities and their association with
discrimination
Labour markets in India are characterized by gender-based disparities in wages, irrespective of labour
status, region, sector or occupation. Despite some decline over time the disparity continues, more so in
rural areas than urban areas. Rustagi (2005) finds substantial wage disparity between male and female
workers across levels of education, type of employment, different industries and locations that place women
workers in an disadvantaged position. Female workers earned 40 percent lower wages in rural areas and 25
percent lower wages in urban areas than their male counterparts in regular work in 2004-05. The wage
differentials over the years have largely declined owing to the higher wage growth of female workers as
compared to that of male workers (Karan and Sakthivel, 2008). Some studies such as Duraisamy (1995,
1998, 1999), Divakaran (1996), Glinskaya and Lokshin (2005), Kingdon (1997), Kingdon and Unni (1997),
Jacob (2006), Mukherjee and Majumdar (2011), Chakraborty and Mukherjee (2014) have estimated earning
functions of male and female workers, and broken up earning differentials into two parts: one reflecting
difference in productive characteristics or ‘endowment effect’, and the rest, an unexplained component
often attributed to ‘discrimination effect’. The significant proportion of the wage gap is not explained by
the productive characteristics, hence it remains unexplained; this is often attributed to discrimination against
female workers in the Indian labour markets.

10 ILO DWT for South Asia and Country Office for India
Bhattacharjee and Hnatkovska (2015) examine the evolution of gender gaps in education, occupation
choices, and wages in India using NSSO data for the year 1983 and 2010. The study applied OLS-based
Blinder-Oaxaca decomposition method and Recentered Influence Function (RIF) regressions for
decompositions at different quantiles of the wage distribution. The results show that the gaps have shrunk
quite sharply between men and women, in most indicators. The gender wage gaps have declined across
most percentiles of income groups, including the 90th percentile. While convergence in measured attributes
like education accounts for most of the decline in the gap in other income groups, the decline in the gender
wage gap of the 90th percentile is unexplained—with measured attributes predicting that the gap should
have widened. The gaps have narrowed most sharply for the youngest cohorts in the workforce, suggesting
that measured gaps will decline even more sharply over the next two decades.
Madheswaran and Khasnobis (2007) have estimated the extent of gender wage discrimination using NSSO
data for the year 1983 to 1999-00. By using the decomposition method, the study finds that in regular labour
market, the extent of the gender wage differential has declined from 0.40 in 1983 to 0.26 in 1999-2000.
From 1983 to 1999-2000, the contribution of endowment difference to the raw wage differentials is reduced,
while the extent of discrimination was found to be widening —but the reverse happened in the casual labour
market.
Khanna (2012) has estimated gender wage discrimination among regular workers in India by using NSS
(2009-10) data. The quantile regression decomposition method was used to break up the wage gap at
different quantiles of the wage distribution. The findings of the study reveal the existence of a ‘Sticky Floor’
in the regular labour market.
Duraisamy and Duraisamy (2014) have estimated occupational segregation and gender wage discrimination
among wage workers using NSSO data for the year 1983 to 2011-12. By using Oaxaca and Ransom
methods, and the Duncan and IP index, the study finds that occupational segregation has increased during
the study period. There is considerable variation across the states and employment type. On the other hand,
there is a remarkable increase in wages in the past decade and female wage growth has been faster than
male wage growth. The gender wage gap has declined over the years. The estimates of wage functions not
controlling for industry and occupation suggest that about 81 percent of the wage differences are
unaccounted for and could stem from discrimination; part of this may be due to difference in the choice of
occupation and industry.
Deshpande, Goel and Khanna (2015) have explored gender wage gaps among regular wage/salaried
workers in India using NSSO data for the year 1999-2000 and 2009-10. The Blinder-Oaxaca decomposition
method and quantile regression decomposition method were used to break up the gender wage gap at the
mean and several different quantiles of the wage distribution. The findings of the study show that the
average wage gap for regular workers, expressed as a percentage of female average wages, has declined
from 30 percent to 26 percent during the study period.
ILO DWT for South Asia and Country Office for India 11
2.6. Wage discrimination due to social identity
Caste discrimination
Similarly, discrimination against socially and economically backward sections of society has been a major
concern while studying Indian labour markets. Studies based on field surveys for urban areas by Banerjee
and Knight (1985) observed that, “There is indeed discrimination by caste, particularly job discrimination—
discrimination is the greatest in operative jobs, in which contacts are more important for recruitment,
compared with white-collar jobs in which recruitment involves formal methods”. The question arises: Do
Indian labour markets continue to discriminate against SCs/STs, especially while recruiting workers in
regular wage and salaried jobs? According to Das and Dutta (2007), based on the NSSO data for 2004-05,
while chances of securing a regular job were 21.5 per cent in the case of higher caste Hindus, they were
only 12.4 per cent and 6.7 per cent in the case of SCs and STs, respectively.
Madheswaran and Atewell (2007) studied caste discrimination in Indian urban labour markets, both in terms
of earnings and the nature of occupations. They calculated that SC/ST workers received, on an average,
wages that were 15 per cent lower than those of non-SC/ST workers. This led them to conclude that SC/STs
are discriminated against in both the public and private sectors. The discrimination component was higher
in the private sector than in the public sector, but between the two time periods — from 1993-94 and 1999-
2000 — it has decreased in both. This decline is sharper in the public sector, it should be noted. Importantly,
the major part of the wage gap is due to differences in human capital endowments. Authors also found that
occupational discrimination (access to high paying occupations) is more pronounced than wage
discrimination within a given occupation.
In the first major correspondence study in India, Thorat et.al (2007) sent out identical resumes to private
companies, both domestic companies and multinational corporations (MNCs), in response to newspaper
advertisements in New Delhi during 2005-06. The only difference in the resumes was the easily identifiable
names of applicants: Hindu upper caste, Hindu Dalit, and Muslims, respectively. The study revealed
significant differences between call-backs to the Hindu upper castes and the other two categories. These
findings are confirmed by Siddique (2009) in a study of Chennai. She tested, additionally, for the interaction
between caste and gender, and finds that the lowest call-backs are received by Dalit women.
There are studies of hiring practices which emphasize the role of networks and that of informal and
personalized recruitment, where who you know is often more important than what you know. In a college-
to-work study, which tried to uncover the exact pathways through which discrimination manifests itself,
Deshpande and Newman (2007) tracked a group of students from the three premier Indian universities in
Delhi for two years in an effort to understand what jobs they got, how they got them, and what their
interview experiences were. It turned out that employers were extremely conscious of the social identity of
the applicant, all the while professing deep allegiance only to the merit of the candidate. In an employer
attitude survey, Jodhka and Newman (2007) find that employers, including MNCs, universally use the
language of merit. However, managers are blind to the unequal playing field which produces ‘merit’.
Commitment to merit is voiced alongside convictions that merit is distributed by caste and region.
Interestingly, Chakravarty and Somanathan (2008) carried out a study of IIM-Ahmedabad’s 2006 batch of
MBA graduates; they find that graduates belonging to Scheduled Castes or Scheduled Tribes get

12 ILO DWT for South Asia and Country Office for India
significantly lower wages than those in the general category. This difference disappears once their lower
Grade Point Averages are taken into account, suggesting that the large wage difference is due to the weaker
(on average) academic performance of SC/ST candidates. Banerjee, Bertrand, Datta, Mullainathan (2008)
have shown the role of caste and religion in India’s new economy sectors—software and call-centers—by
sending 3160 fictitious resumes in response to 371 job openings in and around Delhi that were advertised
in major city papers and online job sites. Contrary to Attewell and Thorat (2007), Banerjee, et al. (2008)
study shows that those applicants’ caste identities do not significantly affect the callback decisions of firms
in these rapidly growing sectors of the Indian economy, at this stage.
Singhari and Madheswaran (2016) have estimated the extent of caste discrimination in the regular salaried
urban labour market in India; they have carried out a separate study for public and private sector workers
using NSSO data for the years 1993-94 to 2011-12. The findings of the study show that the contribution of
endowment difference to raw wage gap is more than that of discrimination. Discrimination causes 19.4 and
31.7 percent lower wages for SCs in the public and private sectors respectively, as compared to equally
qualified people belonging to what are usually seen as ‘forward castes’. But occupational discrimination—
unequal access to jobs—seem considerably more important than wage discrimination in both public and
private sectors in India. The authors argue a case for the extension of affirmative action policy to the private
sector.
2.7. Discrimination based on religious identity
Economists have traditionally viewed economic class divisions as a source of social conflict. There is,
however, an increasing perception that living standards of groups divided along ethnic or religious lines
may be a bigger source of conflicts than traditional divisions along class lines (e.g., Stewart, 2001;
Varshney, 2001). Despite the importance of inter-ethnic groups and inter-religious differences in economic
conditions, however, there are relatively few studies which focus on this issue.
The only three papers, till date, which use micro level data in the Indian context to examine inter-religious
differences are by Borooah and Iyer (2005) on school enrollment rates across religious groups; and by
Borooah, Dubey and Iyer (2006) on categories of employment status across different caste/religion groups.
Recently, Bhaumik and Chakarabarty (2007) used Oaxaca-Blinder decomposition methods to study the
wage gap between religious groups. The results indicate that educational differences between Hindu and
Muslim wage earners, especially differences in the proportion of wage earners with tertiary education, are
largely responsible for the differences in the average (log) earnings of the two religious groups across the
years.
2.8. Wage disparity due to other factors
Apart from wage differences across gender, type of employment and location, differences also exist
between private and public sectors and between informal and formal sectors, the main characteristics of a
labour market in a developing economy like India. Studies such as Duraiswamy and Duraiswamy, 1995;
Madheswaran, 1998; Madheswaran and Shroff, 20001, using the Blinder Decomposition analysis, found
that workers in the private sector earn higher wages than those in the public sector. The major portion of
1 These studies are based on small sample surveys.

ILO DWT for South Asia and Country Office for India 13
the wage difference is attributed to differences in endowments. The returns to productive characteristics
were not found to be higher in the private sector for workers belonging to socially disadvantageous groups
(SC and ST) and female workers. In contrast to the above-mentioned studies, Glinskaya and Lokshin
(2007), using nationally representative samples, show that the public sector wage premium ranges between
62 per cent and 102 per cent over the private-formal sector, on average, and between 164 per cent and 259
per cent over the informal-casual sector, depending on the choice of methodology. The wage differentials
in India tend to be higher in rural as compared to urban areas, and are higher amongst women than men,
says the study. Not unexpectedly, wage differentials also tend to be higher for low-skilled workers. There
is considerable evidence of an increase in the wage differential between 1993-1994 and 1999-2000.
Analysing the wage differentials across the wage distribution, Azam and Prakash (2015) found that public
sector workers earn more than private sector workers across the entire distribution irrespective of gender
and location.
2.9. Wage inequality
The Indian economy, after the economic reforms of the 1980s and 1990s, witnessed higher growth rates in
GDP than in the previous period, which seems to have witnessed increased income inequality after the
1990s (Acharya and Marjit (2000); Deaton and Dreze, 2002; Cain, Hasan, Magsombol, & Tandon, 2010).
Overall, wage inequality also increased after the 1980s and 1990s (Kijma, 2006; Mehta and Hasan, 2012;
Dutta, 2005; Sarkar and Mehta, 2010; Abraham, 2007). Increasing wage inequality has not been uniform
across different types of employment. Wage inequality among casual workers both in rural and urban areas
has consistently decreased from 1983 to 2004-05 (Sarkar and Mehta, 2010; Abraham, 2007). Wage
inequality among regular workers has increased (Dutta 2005) both in rural and urban areas (Sarkar and
Mehta, 2010).
Galbraith et al. (2004) compute inequality measures using grouped data (grouped by industry and state)
relating to earnings (calculated as the annual wage bill divided by the number of workers) in the organized
manufacturing sector. The study found that manufacturing pay inequality in India has risen both across
sectors and across regions, though more strongly across sectors.
Examining the causes of wage inequality, Kijima (2006) found that increased wage inequality during the
1980s was due to observed skills such as education and work experience, while in the 1990s an increase in
wage inequality was due to returns to observed skills in higher education, particularly. These changes had
occurred at the upper half of the wage distribution, as evidenced by Azam (2012), who analysed the change
in the returns and the composition of workforce across the entire distribution from the early 1980s to 2004-
05. Kijima (2006) speculated that the increase in wage inequality had to do with the trade liberalization of
the 1990s. Mehta and Hasan (2012), examining the effect of trade and service liberalization on wage
inequality in India, found that labour relocations and wage shifts attributable to liberalization account for
only one third of the increase in wage inequality between 1993 and 2004; the rest is due to change in
industry wages and skill premiums that are not empirically attributed to liberalization.
Recent work on wage inequality by Rodgers and Soundararajan (2016) has covered a larger canvas as well
as a longer period. The larger canvas takes into account wage inequality as well as income inequality (by
taking household consumption expenditure as a proxy). The longer period covers almost three decades,
from 1983 to 2011-12 using data for four rounds: namely, 1983, 1993-94, 2004-05 and 2011-12. Some
significant results have emerged. First, wage inequality decreased during 1983-1993-94, the latter marking

14 ILO DWT for South Asia and Country Office for India
the initial period of economic reforms. During the first ten years (1983-1994), it increased but subsequently
(1993-94 to 2004-05), it increased—and then declined again during 2004-05 to 2011-12. Of course, this
overall pattern is the result of a set of varying patterns based on location, gender, education, social group
identity, occupation and so on. In general, rural wage inequality has been declining not just during the last
period but since 1983; however, the urban wage inequality has been showing a secular increase. The authors
suggest that this could be a sign of growing integration of the rural-urban labour market. We would agree
with this with the proviso that it is more discernible for the casual labour market and more for male workers.
The work of Rodgers and Soundararajan (2016), which reached us when we had almost completed the data
analysis, confirms many of our own findings in this study report. They report a decline in the disparity
between wages for casual workers and those of regular workers, as well as between the wages of male and
female workers. Results of the factors contributing to wage inequality include age, gender, and location,
type of employment, education, social group, region, occupation and industry of employment. The
contribution of education emerges as the largest but the authors argue, rightly in our view, that education
cannot be treated as an exogenous variable but as an endogenous one, given its close link with gender,
social group identity and region. The comparison of wage inequality with income (or consumption)
inequality revealed that they seem to move in the opposite direction. A cautious interpretation of results is
the strength of this monograph, which leads the authors to conclude that “the picture that emerges is
complex. Inequalities take many forms and affect groups of the population in different ways. Nor are the
relationships consistent in different parts of India, so what is observed at the national level may be an
amalgam of different patterns in different regions” (p.133).
2.10. Trends in wage inequality between skilled and unskilled labour
Over the last few decades, in the wake of globalization, the growing wage inequality of skilled and unskilled
labour groups has been a global phenomenon, occurring in both developed and developing countries. The
theme has attracted a great deal of attention in India, and there have been a number of studies in recent
years which have discussed it. According to the Heckscher-Ohlin model and the Stopler-Samuelson
theorems, when a developing country gets increasingly integrated with the world economy through trade,
it should experience an increase in the wage of unskilled labour and, therefore, a reduction in the wage gap
between skilled and unskilled labour. However, the reality of this experience has been otherwise.
There are several possible explanations. These include: (a) protection being relatively greater for unskilled
labour-intensive products before the initiation of trade reforms; (b) trade in intermediate product or
outsourcing by developed countries causing average skill intensity of production to go up in both the
developed and developing countries; (c) increased capital flow to developing countries and such capital
requiring the use of more skilled labour; and (d) trade-induced skill-biased technological change (Goldberg
and Pavcnik, 2007; Hanson, 2009). The bulk of the research carried out on the issue of wage inequality
between skilled and unskilled labour in the Indian context has considered the situation in manufacturing.
Roy (2012) has presented estimates of the skill premium in different major sectors of the Indian economy
during the years 1993-94, 1999-2000, 2004-05 and 2009-10. Workers with secondary education or a higher
level of education are regarded as skilled, and those with a lower than secondary level of education are
regarded as unskilled. The ratio of the daily earnings of skilled workers to unskilled workers, as defined
above, is taken as the skill premium. The estimates indicate that the skill premium declined between 1993-
94 and 2009-10 in the following cases: (a) rural male workers in agriculture; (b) rural male workers in
ILO DWT for South Asia and Country Office for India 15
construction; (c) rural male workers engaged in various services sectors, including financial intermediation,
insurance and business services; (d) urban female workers engaged in the electricity sector, and trade, hotels
and restaurants; and (e) urban male workers in mining, and trade, hotels and restaurants. Evidently, the
upward trend in wage inequality between skilled and unskilled workers does not hold universally true in all
sectors of the Indian economy; it did not occur in certain components of the major sectors. In contrast, the
manufacturing sector seems to have experienced a significant increase in the skill premium over time.
This increase in skill premium in the manufacturing sector could be put down to several factors.
Chamarbagwala (2006) found that relative demand shifts contributed to relative wage shifts, and that
increases in the demand for skilled labour were mostly due to skill upgrading within industries. On the basis
of the findings of her analysis, she comes to the conclusion that international trade in manufactures
benefited skilled men (in terms of wages) but hurt skilled women. For the same period of 1988-2000 using
NSS data, Kumar and Mishra (2008) found a robust relationship between trade policy changes and changes
in industry wage premiums overtime. Their econometric results indicated that a lowering of tariff rates
leads to an improvement in productivity, which, in turn, raises wages. They argued that reductions in tariff
were disproportionately higher in industries which employ a large share of unskilled labour. Liberalization
induced wage increases in these sectors, which implies a reduction in wage inequality. At the time, this was
perhaps the only study undertaken for India which comes to the conclusion that trade liberalization has
reduced wage inequality in industries. In a recent study, Mishra and Das (2012) came out with similar
results.
However, some other studies reported a different set of results. Combining ASI data with the Prowess
database of CMIE, Banga (2005) found that Foreign Direct Investment (FDI), trade and technology have a
differential impact on wage inequality. Higher FDI increases wage inequality, while the higher export
intensity of an industry is associated with lower wage inequality. Technological progress is found to be
skill-biased. Hence, the higher the extent of technology acquisition in an industry, the higher the degree of
wage inequality. In a subsequent study using industry-level ASI data for the period 1998-99 to 2004-05,
Hashim and Banga (2009) came to the conclusion that trade increases wage inequality, since it raises the
wages of skilled labour more than that of unskilled labour.
Sen (2008) used industry level ASI data for the period 1973-74 to 1997-98. His database is similar to that
of Banga (2005), but it covers a longer period. He tested for two alternative explanations for the increase
in wage inequality between skilled and unskilled labour: one based on the Hecksher-Ohlin model, and the
other based on skill-biased technical change. In line with the findings of Chamarbagwala (2006), he found
that much of the increase in wage inequality in India was due to within-industry shifts in favour of skilled
labour. He found empirical support for both the hypotheses that he tested. He concluded that trade-induced
technological progress has led to an increase in relative skill intensity and wage inequality within industries.
Also, according to him, the decline in protection during the post-reform period was relatively higher in the
unskilled labour-intensive industries, which led to a relative fall in the economy-wide return to unskilled
labour relative to skilled labour. Abraham (2010), using ASI data for the period 1998-99 to 2004-05,
focused on the effect of Information Technology (IT) investment on wage inequality. Two alternative
hypotheses are considered in his study: (a) wage inequality being caused by an inter-sectoral shift in demand
structure; and (b) it being caused by an intra-sectoral shift in production technology. He finds that inter-
sector shifts in demand structure explain only a small part of the increase in the wage share of skilled
workers. Rather, the main cause is intra-sector shift in production technology. He concludes that while the
scale effect and capital-skill complementarities tend to give partial explanations for the increasing share of
the skilled worker in wages, the most consistent and quantitatively large explanation is given by the effect
of the intensity of IT application in the production process.

16 ILO DWT for South Asia and Country Office for India
Ramaswamy (2008), using ASI data for the period 1981-82 to 2004-05, reported that changes in output
(scale effect), capital-output ratio and the contract worker intensity contributed positively to wage
inequality in Indian manufacturing. In a similar study for the period 1973-2008, Srivastava and Mathur
(2011) concluded that trade in manufacturing, as well as technology, has contributed towards rising wage
inequality between skilled and unskilled labour in Indian industries.
Taking five measures of wage inequality (the skilled–unskilled wage ratio, the Gini coefficient, the ratio of
the 90th percentile to the median income, the ratio of the median income to the 10th percentile, and the ratio
of the 90th percentile to the 10th percentile income), Sadhukhan (2012), who makes use of both NSS and
ASI data, finds that the contractualization of industrial labour has been responsible for the increase in the
wage gap between skilled and unskilled labour. However, it has had a negative effect on the 50–10 wage
ratio and the 90–10 wage ratio. By way of explanation, Sadhukhan argues that skill-biased technological
change reduces the wages for unskilled labour (around the median wage earners), and that there is a
possibility of a downward wage rigidity of the 10th percentile wage, which causes the negative effect of
skill-biased technological change on the 50–10 wage ratio.
While the studies mentioned above provide an indication of the direction of effect, there is also a need to
assess the quantum of the effect. The question which arises is whether the entire increase in wage inequality
between skilled and unskilled labour observed for Indian manufacturing can be attributed to trade
liberalization. Mehta and Hasan (2011) address this question in their study and come to the conclusion that
about 90 per cent of the increase in wage inequality is attributable to non-tradeables rather than tradeables.
The portion of the increase in wage inequality, which can be traced to liberalization relating to trade, is only
about 13 per cent. Also, the effect of services liberalization in causing wage inequality is greater than the
effect of trade liberalization. They are of the view that if liberalization did, in fact, contribute significantly
to increased inequality, the bulk of its effects arose from the general equilibrium effects.
To sum up, there has been a significant increase in wage inequality between skilled and unskilled workers
in India’s manufacturing during the post-reform period. Inter-industrial changes explain only a small part
of the observed increase in wage inequality; there are intra-industry effects. These intra-industry effects
seem to be attributable to trade-induced skill-biased technological change and the growing use of contract
workers in manufacturing, among other causes. While trade liberalization is definitely responsible for the
increase in wage inequality, there are probably other explanatory factors unconnected with trade, which
explain a major part of the increase in inequality that has taken place (Goldar 2013).
2.11. Trends in wage share
It is by now well acknowledged that the recent experience of liberalization and globalization has led to a
shift of economic power away from labour and in favour of capital. One of the powerful measures of this
distribution is the wage share in output that has decreased in most countries of the world (Rodriguez and
Jayadev, 2010). India is no exception. The relevant literature suggests that trade openness could be an
important factor influencing the labour income share. The impact of import competition on profit margins
may enhance the wage share. The trade-induced changes in the composition of production may have an
impact on the overall labour income share depending on whether the industries with a high wage share go
up or go down in importance. The trade openness may impact the union strength, which, in turn, may affect
ILO DWT for South Asia and Country Office for India 17
the labour income share. The enhanced availability of the imported input may encourage off-shoring, and
thus impact the wage share. Analysing cross-country data, Rodrik (1998) and Harrison (2002) have found
a negative connection between the share of trade in GDP and labour’s income share. Carrying out a similar
analysis for manufacturing, Onaran (2007) finds that increasing export intensity led to a decline in the wage
share in Turkey and Mexico, but no significant effect was seen in Korea. Evidently, going by the available
literature, it is not unreasonable to expect an adverse effect of trade liberalization on the wage share in
Indian manufacturing.
2.12. Trends in wage share for broad sectors of the economy
Goldar (2013) presents estimates of the wage share for the periods 1993-94 to 1995-95 and 2007-08 to
2009-10 in broad sectors of the Indian economy. The main limitation of this exercise is that it is confined
only to the organized component of each sector, to avoid the issue of splitting the mixed income of
unorganized enterprises. The wage share in value added has gone down during the post-reform period in
most sectors. The decline in the case of manufacturing was about 10 percentage points between the periods
1993-94 to 1994-95, and 2007-08 to 2009-10. The decline is much greater in construction, hotels and
restaurants; storage; and transport other than railways. Taking all the sectors together, the fall in wage share
was 10 percentage points between the periods 1993-94 to 1994-95 and 2007-08 to 2009-10. A limitation of
this estimate is that it keeps most of the agricultural sector out of the computation, since only a small
component of the agricultural sector is organized. Hence, Goldar attempts to make an estimate of the wage
share at the economy level by taking into account the unorganized sector enterprises. He has adopted a
simple approach suggested and implemented by Krueger (1999): out of the mixed income of the
unorganized sector enterprises, two-thirds may be taken as labour income and one-third as capital income.
Taking this approach, the estimated wage share in the economy was found to be 61 per cent during the
period 1993-94 to 1995-95, which came down to 43 per cent during the period 2007-08 to 2009-10. It seems
that the wage share in GDP in India has declined by approximately 1.3 percentage points per year during
the post-reform period. He further reveals that this fall is not due to inter-sectoral shifts in production.
Rather, the reason for the fall in the wage share at the economy level is that the wage share has declined in
most sectors.
2.13. Analysis of trends in wage share in organized manufacturing
In a study to examine the ‘jobless growth’ in India’s organized manufacturing sector during a long period
of nearly a quarter century (1981-2005), Kannan and Raveendran (2009, reproduced in Kannan 2014: Ch.4)
reported a secular decline in wage share in gross value added. In 1981-82 the wage share was close to 42
per cent, which declined to 32 per cent during 1990-93 when the economic reforms were initiated. In the
very next year i.e. 1993-94, the wage share dropped to 28.7 per cent, setting in motion another phase of
secular decline that saw the wage share to close to 21 per cent in 2004-05. The study found that despite no
cheapening of the cost of capital, there has been an increase in capital intensity overall, as well as in what
was identified as ‘job creating’ and ‘job displacing’ groups of industries. There has in fact been acceleration
in capital intensity since the early 1990s compared to the 1980s. An explanation to this phenomenon was
sought in the changing nature and composition of demand for manufactured products both in the domestic
and foreign markets. Such demands came from the economically well-off classes of the society. Trade
policies, credit policies, technology acquisition policies and fiscal policies—all favoured capital-intensive
projects producing such goods. Politically speaking, the period also witnessed a decline in the power of
trade unions.
18 ILO DWT for South Asia and Country Office for India
Later studies extended the period of analysis when data became available and confirmed the findings on
trends in wages in organized manufacturing. For example, Goldar (2015) calculated the share of wages in
the gross value added in different two-digit industries of organized manufacturing for the time period: 1993-
94 to 1995-95 and 2005-06 to 2007-08. A clear downward trend in the wage share was noted for the
organized manufacturing sector as a whole as well as many of the two-digit industries within it. Changes
in the production composition as well as capital intensity seemed to explain a part of the observed decline
in wage share. The implication is that the increase in capital intensity could be connected with the reforms.
Decline in the bargaining power of trade unions was also put forward as an additional factor (Goldar, 2004a;
Goldar and Aggarwal, 2005), but the increasing capital intensity of production was quite evident from an
earlier study as well (Goldar, 2004b). (Shastry and Ramana Murty (2003) reported an increase in the mark-
up, coupled with an increase in the ratio of materials to wages. However, Virmani and Hashim (2009)
reported labour-saving technical change as an important explanatory factor.
2.14. Summing up
The main points that emerge from the review are as follows: (a) There has been a significant increase in
wage inequality between skilled and unskilled workers in India’s manufacturing sector during the post-
reform period; (b) Inter-industrial changes explain only a small part of the observed increase in wage
inequality; there are intra-industry effects; (c) These intra-industry effects seem to be attributable to trade-
induced skill-biased technological change and the growing use of contract workers in manufacturing,
among other causes; and (d) While trade liberalization is definitely responsible for the increase in wage
inequality, there are probably other explanatory factors unconnected with trade, which explain a major part
of the increase in inequality that has taken place.
An analysis of the trends in the wage share revealed a downward trend in the wage share in value added in
most sectors of the Indian economy and in most industries constituting the manufacturing sector. The
factors that explain the downward trend in the wage share in manufacturing include the reduced bargaining
power of trade unions, increasing capital intensity of production, an increase in mark-up coupled with an
increase in the ratio of materials to wages, and labour-saving technical change. Studies indicate that
increases in export intensity had a depressing effect on the wage share.
The recent wage trends in India’s organized manufacturing reveal that the rate of wage increase in the sector
has slowed down since the early years of the last decade, primarily due to the growth in informality and
corresponding rise in vulnerability in the manufacturing sector. A number of studies have confirmed that
the casualization of jobs in India’s organized sector has increased since the early years of the 1990s, jobs
that are not backed by any form of job security or social protection (NCEUS, 2009; Sharma and Sasikumar,
1996; Bhandari and Heshmati, 20062, Papola and Sahu, 2012). The employment generation that took place
in the organized sector post economic reforms has been largely informal in nature. Surveys by and large
have shown that employment expansion in the manufacturing sector during the early 1990s took place
mostly through a non-permanent workforce. Since informal workers in organized enterprises are more often
than not excluded from the scope of regulations stipulating conditions of work, retrenchment and minimum
2 Bhandari and Heshmati (2006) concur, stating that the share of contract as well as temporary workers in the Indian manufacturing
sector, excluding administrative and managerial workers, has doubled over the period 1992-2001.

ILO DWT for South Asia and Country Office for India 19
wages that are applicable to their formal counterparts, there has been an overall decline in the rate of
increase of wages in the sector.
The shift from wages to profits, and, to a lesser degree, from rent and interest to profits, is large, and is
obviously closely connected with the acceleration of growth in the last few years, though direction of cause
to consequence is not clear. In any case, it amounts to a substantial shift in income towards capital, thus
contributing to the overall increase in income inequality. Another way of looking at the same data is by
converting it into per employee terms.
There are many possible reasons for the increase in the profit share. One obvious possibility is an increase
in the capital intensity of production. The data shows that there is some increase in capital intensity, in the
sense that fixed capital per employee rises faster than the wage bill per employee, but the relative increase
is modest, and certainly not enough to explain the substantial increase in the profit share (Sood et al 2014).
A distinct shift in labour practices has been observed in the last couple of decades where enterprises in the
organized/formal sector of the economy are showing greater proclivity to hiring workers under casual or
other flexible contracts which are comparatively cheap, versus regular formal workers. This has enabled
the employers to reduce the labour cost in production (ILER 2014).

20 ILO DWT for South Asia and Country Office for India
3. Sources of statistics on wages
3.1. Introduction
Wage statistics in India are available from several official sources. They can be broadly divided into two
categories: surveys and returns, under various labour laws. Scope, coverage, details and periodicity vary
from one source to another. We present in the following sections a brief account of these sources.
3.2. Survey-based sources
3.2.1. Employment and Unemployment Surveys (EUS), NSSO
The most comprehensive database on employment and unemployment including wages is the quinquennial
Employment-Unemployment Surveys (EUS) carried out by the National Sample Survey Office (NSSO)
under the Ministry of Statistics and Programme Implementation (MOSPI), Government of India. These
surveys collect information from all the states and Union Territories in India. Data is collected on daily
wage and salary earnings by casual labourers and regular wage/salaried employees for the work done for
each of the seven days of the reference week. The wage data from this source has been widely used for
research purposes to assess the changes in wages of different category of workers in different sectors and
economic activities, particularly because it is the only set of data on the subject which covers all categories
of workers in the economy and is amenable to disaggregation by rural/urban regions, gender, social groups
and States. Since the unit level data set is released after every round, a large number of independent studies
have been carried out by researchers on several aspects of employment and unemployment, including
wages.
The first such survey was carried out during October 1972 - September 1973 (27th round of NSSO).
Including the last employment and unemployment survey of NSS 68th round (July 2011 - June 2012), nine
such comprehensive surveys on the employment and unemployment situation in India have so far been
conducted by NSSO. The 68th round survey covered 1.02 lakh households (59,700 in rural areas and 42,024
in urban areas) enumerating 4.57 lakh persons (280,763 in rural areas and 176,236 in urban areas).
Data is collected with components of wage and salary earnings received in cash and kind, and also according
to whether the same are received on a piece rate or non-piece rate basis. The industrial activity the individual
is engaged in and his/her occupation code are also recorded. Particulars of age, sex, educational level (both
general and technical education) of the wage/salary earners are also available. For regular wage/salaried
employees, the bonus and perquisites such as free accommodation, reimbursement of expenditure for
medical treatment, free telephones, etc., received are evaluated as the cost to the employer at retail prices
and duly apportioned for the reference week and included in their earnings. The wage rates are estimated
from these data on wage and salary earnings.
Average wage/ salary earnings per day received by the following categories of persons of age 15-59 years
are regularly published by the NSSO for each State/UT:
(i) regular wage/ salaried employees;

ILO DWT for South Asia and Country Office for India 21
(ii) casual labourers engaged in works other than public works;
(iii) casual labourers engaged in public works other than Mahatma Gandhi National Rural
Employment Guarantee (MGNREG) public works; and
(iv) casual labourers of age 15-59 years engaged in MGNREG public works.
Further disaggregated tabulations can be done as per requirements, as raw data can be classified by various
parameters mentioned above. The adoption of uniform concepts and definitions allows for comparability
over time and space. Usually processing takes around one and a half years. The main limitation of this data
set is that the surveys are conducted at five year intervals (though there are exceptions wherein the survey
is conducted before or after five years).
We understand that a major decision has been taken this year (2016) to conduct annual surveys, beginning
perhaps with 2017-18. This marks an important and positive development since data on several aspects of
employment and unemployment will now be available on an annual basis.
3.2.2. Employment and Unemployment Survey (EUS), Labour Bureau
The Labour Bureau, under the Ministry of Labour & Employment, has started conducting Annual
Employment and Unemployment Surveys (EUS) from 2009-10. The schedule canvassed in these surveys
has a provision for collecting data on wage and salary, in cash or kind. Till now four rounds of such surveys
have been conducted, the last being the Annual Employment-Unemployment Survey 2013-14.The field
work of fifth Annual Employment-Unemployment Survey is in progress. The survey is conducted in all
districts of the States/UTs covering more than one lakh households. In the last round survey (in 2013-14) a
sample of 1.37 lakh households, 6.80 lakh persons were covered. All the labour force estimates derived and
presented in the report are based on persons aged 15 years and above only. The survey results are presented
in five volumes. The concepts and definitions adopted by the Labour Bureau are similar to those used by
the NSSO. However, no tables on wage rates based on this data are available in the reports released by the
Labour Bureau.
One could say that these surveys are akin to the quinquennial EUS of the NSSO but carried out by an
organization which does not have the required and trained statistical staff at its disposal at the field level.
Therefore the issue has received the attention of the Statistical Commission of India, which has proposed
that the NSSO will henceforth conduct the EUS on an annual basis. This proposal has now been accepted
by the Government of India (referred to earlier in Section 2.1).
3.2.3. Agricultural Wages in India (AWI)
The Directorate of Economics and Statistics (DES) in the Ministry of Agriculture (MoA), Government of
India, collects data on wages of selected agricultural and non-agricultural occupations through the state
governments. Data are collected by the local officials, patwaris, primary teachers, etc. and are transmitted
through district and state authorities to DES. Wage data is collected and compiled for the following
operations: (a) skilled labour – carpenter, blacksmith and cobbler, (b) Field labour - ploughing, sowing,
weeding reaping & harvesting, (c) other agricultural labour – watering, carrying load, cleaning silt, digging
well embarkation, tilling, plucking etc. and (d) Herdsman. DES publishes data in the form of simple
averages of daily and monthly wage rates, in its annual publication titled ‘Agricultural Wages in India’
(AWI). Wage data from AWI has been widely used by MoA officials and researchers, particularly to
construct long-term time series of agricultural wages, as this is the only source of data for this purpose.

22 ILO DWT for South Asia and Country Office for India
Its coverage has, however, been found to be limited. Though the state governments are expected to cover
all the districts, failing which at least one in five districts, actual coverage is much smaller in many states.
The small size of the sample — only one village in a district — is also seen as another limitation of this
data. It also needs to be noted that the list of occupations is not revised to include new occupations since
the beginning of the survey in 1952.
These limitations are now being addressed by the introduction of a new series for data on rural wages that
we discuss below.
3.2.4. Survey on Wage Rates in Rural India
The Labour Bureau has been regularly publishing Wage Rates in Rural India on the basis of data collected
by the National Sample Survey Office (NSSO), regarding 18 agricultural and non-agricultural occupations
involving manual work. Following the recommendations of a Working Group, set up by the Central
Statistical Office on the advice of the National Statistical Commission, wage rate data is now being
collected for 25 occupations (12 agricultural and 13 non-agricultural) w.e.f. November, 2013. The
occupations selected for compilation of daily wage rates collected every month are as follows:
Agricultural Occupations Non-agricultural Occupations
1 Ploughing/Tilling workers 1 Carpenter
2 Sowing (including Planting/Transplanting/Weeding)
workers
2 Blacksmith
3 Harvesting/Winnowing/Threshing workers 3 Mason
4 Picking workers (including tea, cotton, tobacco and
other commercial crops)
4 Weavers
5 Horticulture workers (including nursery growers) 5 Beedi makers
6 Fishermen - inland 6 Bamboo, cane basket weavers
7 Fishermen - coastal/deep-sea 7 Handicraft workers
8 Loggers and wood cutters 8 Plumbers
9 Animal husbandry workers (including poultry
workers, dairy workers and herdsman)
9 Electrician
10 Packaging labourers, agriculture 10 Construction workers (for roads, dams, industrial &
project construction work well diggers)
11 General agricultural labourers (including watering/irrigation workers, etc.)
11 LMV & Tractor drivers
12 Plant protection workers (applying pesticides, treating
seeds, etc.)
12 Non-agricultural labourers (including porters, loaders)
13 Sweeping/ cleaning workers
The wage rate data is collected along with rural retail prices from 600 sample villages spread over 20 States.
Data is collected through regular all-India surveys conducted annually. Data collection from these sample
villages is staggered over the four weeks of a month, with one-fourth of the villages covered every week.
The days of canvassing are fixed. The village functionaries like the panchayat secretary, patwari and other
village or block officials are the primary informants for collection of data on wage rates. The data on normal
working hours and the prevailing wage rates in cash and kind are collected gender-wise (Labour Bureau,
2015a). The month-wise average wage rates are worked out at state level and also at all-India level. At the
first stage, the data received from the different villages for duration of less or more than the normal working

ILO DWT for South Asia and Country Office for India 23
hours are adjusted for eight hours working day. Similarly, payments in kind such as food-grains, cooked
food, tea, fodder, etc. are converted in cash at the prevailing local retail prices. In the next stage, a simple
arithmetic average of these normalized daily wage rates is worked out occupation-wise and gender-wise for
each State. State-wise averages are restricted only to those occupations where the number of quotations is
five or more in order to avoid apparent inconsistency in wages paid to different categories of workers on
account of differences in number of quotations. However, for working out all-India averages, all those
neglected quotations are taken into account to arrive at total number of quotations at all-India level. At the
all-India level also, the number of quotations for working out occupation-wise averages are restricted to
five or more (Labour Bureau, 2015a). The month-wise average daily wage rates thus worked out at State
level and at all-India level are released regularly to the users through various sources. Though the data
collected provides a regular source of information on wages in different occupations, they relate only to
selected occupations.
The critical point here is the role of investigators who collect the data. While they are local persons expected
to have knowledge of the local area, the crucial points are that: (a) statistical data collection is not their
main job, and (b) the training required for such data collection might be a limited one. At the same time,
the expansion of the list of occupations covered as well as the number of sample villages are certainly an
improvement over the AWI. Over a period of time, this source may constitute an important source of data
on wages in rural India.
3.2.5. Rural Labour Enquiry (RLE)
Labour Bureau also publishes quinquennial Rural Labour Enquiry (RLE) reports based on the data collected
in the NSSO surveys of Employment and Unemployment covering all India. The Labour Bureau has been
conducting all-India enquiries on agricultural/rural labourers through NSSO since 1950-51. The first and
second rounds of agricultural labour enquiry were conducted in 1950-51 and 1956-57 respectively. Later,
it was extended to cover all Rural Labour Households, including agricultural labour households. First RLE
was conducted during 1963-64. Subsequent RLEs were conducted during 1974-75; 1977-78; 1983; 1987-
88; 1993-94, 1999-2000, 2004-05 and 2009-10. Data on demographic structure, employment and
unemployment, wages and earnings, consumption expenditure, indebtedness and general characteristics is
collected and reported from the survey. Information on wage rates relate to 18 agricultural and non-
agricultural occupations. Other objectives of Rural Labour Enquiries are following:
1. Collection of basic data required for revision/construction of new series of CPI numbers for
Agricultural and Rural Labourers.
2. Derivation of reliable estimates on important socioeconomic characteristics of rural labour in
general and agricultural labour in particular.
3. Analysis of the trends in the socioeconomic conditions of rural labour households.
RLE reports are the most important official source of statistics on agricultural and rural workers in India.
However, data processing and dissemination takes around five years, which restricts the usefulness of the
information for policy purposes. Since the unit level data of the EUS is released with a shorter time-lag,
independent studies on the condition of rural labour are not dependent on these reports.
3.2.6. Cost of cultivation studies (Commission on Agricultural Costs and Prices-CACP)
Directorate of Economics and Statistics in the Ministry of Agriculture (DESMOA) collects data on cost of
production of crops through cost of cultivation studies for a class of cultivators belonging to a particular
region. The costs of cultivation studies, which are an extension of earlier Farm Management Studies, also
provide data on wages. The data collected under the Farm Management Studies lacked consistency and

24 ILO DWT for South Asia and Country Office for India
uniformity in terms of concepts and definitions and data availability at regular time intervals. Due to this,
these studies were discontinued and a new scheme entitled ‘Comprehensive scheme for cost of cultivation
of principal crops’ was launched in 1970-71. It was meant to collect continuous and representative data on
cost structure of crops.
The wage rates obtained through these studies are based on a better sampling and estimation technique, and
are considered as superior to other data sources. However, costs of cultivation studies do not publish the
wage estimates on a regular basis. Moreover, there have been changes over time with respect to the number
of crops included in the cost of cultivation studies (it started with two crops viz., wheat and bajra; at present,
29 crops are included). Though, several studies tried to work out the wage rates using the CACP data,
mostly by government agencies and policy makers, lack of data in a published format is a deterrent in using
these to analyse the trends in wages, as has already been pointed out by some scholars (e.g. Nadhanael,
2012).
3.2.7. Occupational Wages Surveys
The Occupational Wages Surveys carried out by the Labour Bureau provide occupation-wise data on
employment structure, wage rates and earnings in selected manufacturing, mining and plantation and
service sector industries. The information is available by sex, age, system of wage payment, industry and
stratum. The Labour Bureau has already completed five rounds of Occupational Wage Surveys and a sixth
round is in progress. It would cover 56 industries (consisting of 45 in the manufacturing sector, four in
mining, three in plantations and four in the service sector).
Occupational Wage Surveys have the potential of being a comprehensive source of wages in non-
agricultural sector; but the coverage and non-regularity of survey constrain their use for that purpose. For
example, only four activities are covered under the service sector, when that sector has emerged as a leading
sector in the Indian economy in terms of growth.
3.2.8. Annual Survey of Industries (ASI)
Data on worker’s earnings in the organized manufacturing (establishments covered under Factories Act,
1948) sector is collected annually through the Annual Survey of Industries (ASI) under the Collection of
Statistics Act, 1953. This includes basic wages, dearness allowances, house rent, other allowances and
regular bonuses. The statistics of wages/salaries of employees in establishments covered under ASI are thus
available annually for all the States/U.Ts as well as for all-India. These are compiled separately for male
workers, female workers and contract workers. Data is also separately available for production workers,
supervisory and managerial staff and other employees. ASI data enables analysis of wages in relation to
productivity, capital intensity, share of wages in value added etc., as ASI collects data on production-related
variables besides wages. ASI data has been extensively used for computing certain averages and ratios for
the organized manufacturing sector. Data processing and dissemination takes around two years. Based on
the ASI data a large number of studies are being carried out to understand the trend in earnings, wage share,
profit share and so on.
Given the importance given to the organized manufacturing sector in state policies and programmes, it is
important to reduce the time lag in processing and dissemination of data. There have been reports that the
compliance rate is also coming down despite the mandatory obligation of covered enterprises. Efforts will
have to be made to ensure compliance by all covered enterprises.

ILO DWT for South Asia and Country Office for India 25
3.3. Sources based on annual returns under labour laws
3.3.1. Annual return under Payment of Wages Act, 1936
The Labour Bureau collects and compiles data annually on average daily employment, gross wage bill, per
capita annual/daily earnings of workers etc., from the annual statutory returns submitted by the State
Governments/Union Territories under the Payment of Wages Act, 1936. This Act is applicable to workers
employed in the construction industry, civil and transport services, motor transport services, mines,
plantations, oil fields, docks, wharfs, jetties and establishments declared as factories under the Factories
Act, 1948. Over the years, various amendments have been carried out under the Act, widening its scope
and coverage. Earlier, the Act applied to workers earning less than Rs. 1600 per month. This ceiling was
raised to INR 6500 in 2005, to INR 10,000 in 2007 and further to INR 18000 in September, 2012. In some
states, it has also been made applicable to enterprises registered under the Shops and Commercial
Establishment Act. In some, its applicability has also been extended to all workers in the covered
establishments.
Various States and Union Territories collect statistics of earnings of factory workers on an annual basis
under the Payment of Wages Act, 1936. The returns received by the Labour Bureau from the States/Union
Territories contain industry-wise information on the following items:
(a) number of factories covered under the Act and submitting returns;
(b) average daily employment during the year;
(c) total man-days worked during the year; and
(d) total gross wage bill, before deductions, broken up into components like basic wages, cash
allowances, bonus, arrears and money value of concessions, etc.
The Act defines wages as all remuneration (whether by way of salary, allowances or other-wise) expressed
in terms of money or capable of being so expressed which would, if the terms of employment, expressed
or implied, were fulfilled, be payable to a person employed in respect of his employment or of work done
in such employment.
Average daily employment in an industry is derived by dividing total attendance during the year by the
number of working days observed by that industry. The total gross wage bill for an industry, when divided
by the corresponding average daily employment, yields the per capita annual earnings. The per capita daily
earnings are derived by dividing the gross wage bill for a year by total man-days worked in that year (Labour
Bureau, 2015c).
Data compiled by the Labour Bureau are published state-wise and industry-wise, at a two digit level for
manufacturing industries, in the Indian Labour Year Book. The percentage distribution of annual earnings
of employees in these industries over components like basic wages, allowances, money value of
concessions, bonus, etc. is also presented. Statistics of per capita annual earnings of plantation workers
collected under the Payment of Wages Act, 1936 are also published by the Labour Bureau in the Indian
Labour Year Book.

26 ILO DWT for South Asia and Country Office for India
Though the information collected is quite extensive in its coverage and could have provided a relatively
comprehensive source of data on earnings in different activities in the non-agricultural establishment sector,
there is a serious deficiency in the actual receipt of returns. For example, for the figures published, for 2009
and 2010, information was received only from eight States /U.Ts; and, even in these states, only 23% and
15% of the factories submitted returns for 2009 and 2010 respectively. This highly incomplete information
has been published in 2015. Usually, processing and dissemination of the data takes around three years.
Therefore, a high percentage of non-compliance and considerable delay in processing and dissemination of
information has considerably reduced the value of this source of data. If these two issues are addressed
effectively this could emerge as an important source of information on the earnings of low wage workers
in the non-agricultural sector of the economy. This could then help shape appropriate policy responses by
the government.
3.3.2. Returns on Minimum Wages Act, 1948
The Minimum Wages Act, 1948 empowers both Central and State Governments to fix/revise the minimum
rates of wages for the scheduled employments under their respective jurisdiction. The minimum rates of
wages also include Special Allowance i.e. Variable Dearness Allowance (VDA) linked to Consumer Price
Index Number, which is revised twice a year effective from April and October (Labour Bureau, 2015b).
The Labour Bureau brings out an annual report on the working of Minimum Wages Act, 1948 on the basis
of returns/reports received from various State/U.T. governments containing information inter alia on
employments added, employments in which the minimum wages were fixed for the first time, the minimum
wages in different scheduled employments prevalent during the year, the range of minimum wages and
comparative minimum wage rates prevailing in scheduled employments, etc.
As the data on minimum wages are supplied by the state governments as and when they are fixed and
revised, it can safely be assumed that the information on the rates of minimum wages fixed for different
employments/ activities in different states/ regions is complete and up to date. However, the reports on
implementation of minimum wages released by the Labour Bureau show that only a minority of States/
UTs (often less than 12 out of a total of 35) submit returns to the Labour Bureau. Further, in respect of the
reporting States/ UTs, the response rate (percentage of number of establishments which submitted returns
out of the total establishments covered under the Act) was very low, being less than 15% for most, if not
all, reporting States/UTs. It is also to be noted that this source does not provide information on whether the
minimum wages fixed for any category of workers are actually paid, except when cases of non-compliance
are detected and acted upon. Also, processing and dissemination takes around 15 months to be completed.
Given the high rate of non-compliance in submitting returns, both by state governments and Union
Territories as well as establishments covered by the Act, the information disseminated is not very useful.
Administrative measures such as increasing the staff size and instituting more inspections are likely to be
an effective solution. Periodic surveys provide an alternative to the present highly ineffective administrative
system that should receive the consideration of the Ministry of Labour, Government of India and be
revisited.

ILO DWT for South Asia and Country Office for India 27
3.3.3. Annual return on Mines Act, 1952
The directorate, of General Mines Safety (DGMS) collects and maintains statistics, under the Mines Act,
1952, on earnings of employees in mines. For mines other than coal, statutory returns showing the above
data are also collected by the DGMS. Based on these statistics the DGMS compiles index numbers of
money earnings for workers employed in different mining industries. For coal mines, such statistics relate
to per capita weekly earnings and are available on monthly basis. The monthly returns on coal mines give
average daily attendance, total wages and other payments made in cash for work completed on any complete
working week of the month. The per capita weekly cash earnings are then computed by dividing the total
payments by average daily employment during the week.
Though these data are considered to be complete and reliable and used by the official agencies and by
researchers, it may, however, be noted that a large part of the unorganized mining is outside the purview of
the Mines Act. Dissemination of data takes around four years. Here again, periodic surveys might be a more
effective option to collect the relevant information by including the organized sector of this industry.
3.4. Overall assessment and recommendations
Collection, processing and dissemination of labour statistics should be recognized as an integral part of the
system of data collection and dissemination pertaining to any economy. India is endowed with an
institutional system with adequate supply of trained statisticians. The system works more effectively at the
national level and there is considerable scope to strengthen the system at the level of the states.
The most comprehensive source for statistics relating to wages is the EUS of the NSSO. The decision to
conduct annual EUS is an important development that could prove to be quite valuable in monitoring the
employment and unemployment situation including wages. Efforts to collect earnings data from the self-
employed segment of the employed labour force will go a long way in plugging a loophole. The recently
initiated Survey on Wage Rates in Rural India is another important source of information for the rural
economy, whose development will determine India’s ability to absorb the surplus labour and improve
productivity and earning capacity of such labour. Once this survey is well in place and the time-lag in
processing and dissemination of data are improved, the system of collection of data under Agricultural
Wages in India may be discontinued.
Rural Labour Enquiry reports are prepared by the Labour Bureau based on data from the EUS of NSSO.
The major recommendation in this respect is to reduce the time-lag in releasing the reports.
Occupational wage data is another important area now covered by Labour Bureau through its surveys. Here
again the major recommendation is to minimize the time-lag in releasing the reports. The number of
occupations covered should reflect the changing nature of occupations and sub-sectors in the economy,
especially in the service sector.
Costs of cultivation studies contain wage data that is likely to be quite useful. What is required is the release
of this data in a published format with minimum time-lag.

28 ILO DWT for South Asia and Country Office for India
Collection of administrative statistics under the Payment of Wages Act and The Minimum Wages Act has
been found to be quite ineffective and hardly useful for meaningful policy responses by the government.
Replacing this system with a system of periodic surveys may be considered.

ILO DWT for South Asia and Country Office for India 29
4. Structure, trends and disparities: What can we
learn from descriptive statistics?
4.1. Introduction
Wage rate is a critical variable in determining the income of workers and their households especially those
who are dependent on wage employment as the principal means of livelihood. The share of wage
employment is expected to rise with the structural transformation of an economy from an agrarian one with
a predominance of self-employment to a non-agrarian one, with higher productivity in agriculture and non-
agriculture requiring increasing share of wage employment. India continues to be a low income developing
country3 but has moved away from its dependence on agriculture and related activities in the primary sector,
which currently contribute only about one-fifth of the GDP. However, this structural transformation in
income is not matched by a proportionate transformation in employment. The primary sector continues to
employ half the workforce in 2012. This has implications for the share of wage employment. Wage
employment continues to account for less than half the workforce; in fact it is 48 per cent in 2012. Self-
employment accounts for the remaining 52 per cent. What is striking in the Indian situation is the stubborn
nature of the structure of employment in terms of what may be called labour status i.e. as between self-
employed and wage workers. In 1993-94 it was 55:45 and nearly two decades later it is at 52:48.
Therefore, wage employment and self-employment occupy more or less equal space in India. The share of
wage employment is expected to increase as the economy takes off from a low middle income country to
an upper middle income country. The main reason for this expectation is that the self-employment category
has at least three distinct sub-groups. The biggest sub-group is what is called Own Account Workers. These
are single persons engaged in some kind of earning activities such as street-vending, rickshaw pulling,
home-based activities for the sale of food and other products or those involved in a putting-out system of
employment (such as beedi-making, handloom weaving, chikan work, etc.). As the National Commission
for Enterprises in the Unorganized Sector (NCEUS) remarked, they are ’nothing but disguised wage
workers’ for the lack of wage employment or inability to engage in fixed-time wage work outside their
residence as for example, for women with household responsibilities. Then there are those who are officially
classified as ’unpaid family workers‘. These are family members who help their self-employed Own
Account Workers in their farm and non-farm enterprises. Most of the unpaid family workers are women.
Then, there are employers who hire workers to run their enterprises.
4.2. Employment structure
This background about the employment structure is highly relevant while discussing the question of wages
in the Indian economy. Even the three percent decline in the share of self-employment means an addition
of 14 million workers in the wage employment category, given the size of the workforce. To get a picture
3 Despite a high rate of growth of the economy since the mid-1980s India’s per capita income as a percentage of the per capita
income of high income developed countries in 2013was lower than what it was in 1970 i.e. from xx per cent to xx per cent. In
comparison China’s per capita income position increased from xx to xx per cent during this period.

30 ILO DWT for South Asia and Country Office for India
of the employment structure since the early 1990s, see the statistics in Table 4.1 disaggregated by gender,
location for the three principal labour status groups.
Within the wage employed, there are two distinct groups in India: Regular Workers (RW) and Casual
Workers (CW). Regular wage employment has long been associated with jobs in the formal or, what in
India is called the organized sector of the economy, whereas the casual wage employment is largely, if not
only, associated with work in the informal or unorganized sector. However, since the initiation of economic
reforms in the early 1990s, an increasing share of regular workers, even in the formal sector, is faced with
informal work conditions as recent reports and studies have brought out (see NCEUS: 2007 and 2009,
Kannan 2014, Ravi Srivastava 2016). Regular work in the formal sector with employment and social
security is the most desired and approximates to the concept of ‘decent work’ enunciated by the ILO
followed by regular work and then casual work. There has been an increase in the share of regular work in
the economy — from 13 to close to 18 percent between 1993 and 2012 — but the pace has been extremely
slow despite the country’s remarkable acceleration in its GDP growth rate of more than five per cent per
annum during this period. In fact, this has been part of a general trend of decreasing employment elasticity
with respect to growth in the economy; i.e. for every one per cent growth in output, the employment growth
is not only less than one but declining over time. This scenario (given in Table 3) is also applicable to wage
employment, both regular and casual. Casual employment elasticity has declined considerably and this
could have been interpreted as a positive development given the relatively higher employment elasticity in
regular employment. But the reality is such that overall increase in employment between 2004 and 2012
was quite marginal compared to the earlier period (see Table 4.1).
Total workers (in million)
1993-94 2004-05 2011-12
M F Total F M Total M F Total
Self-employed 134.07 68.42 202.49 166.32 89.48 255.80 174.05 72.22 246.27
Regular 42.93 7.72 50.64 55.79 13.33 69.13 69.92 17.06 86.98
Casual 73.08 43.69 116.77 83.57 43.80 127.36 99.16 38.94 138.10
Total 250.08 119.82 369.91 305.68 146.61 452.29 343.13 128.22 471.34
Annual growth rate in number of workers
1993-94 to 2004-05 2004-05 to 2011-12 1993-94 to 2011-12
Male Female Total Male Female Total Male Female Total
Self-employed 1.96 2.44 2.12 0.65 -3.06 -0.54 1.45 0.30 1.09
Regular 2.38 4.97 2.83 3.22 3.52 3.28 2.71 4.41 3.00
Casual 1.22 0.02 0.79 2.44 -1.68 1.16 1.70 -0.64 0.93
Total 1.82 1.83 1.83 1.65 -1.91 0.59 1.76 0.38 1.35 Note: Unless otherwise stated, all tables in this report are based on the computation of unit-level data from the Employment-Unemployment Surveys of the NSS.
Table 4.1: Distribution of workers and their annual growth rates
Table 4.2: Percentage share of employment by location, gender and labour status
1993-94 2004-05 2011-12
Male F Total Male Female Total Male Female Total
Rural
Self-employed 57.8 58.8 58.2 58.1 63.7 60.2 54.5 59.3 55.9
Regular 8.5 2.7 6.4 9.0 3.7 7.6 10.1 5.6 8.7
Casual 33.7 38.5 35.4 32.9 32.6 32.8 35.5 35.1 35.4
Total 100.0 100.0 100.0 100.0 100.0 100.0 100.0 100.0 100.0
Urban
Self-employed 42.2 45.0 42.7 44.78 47.7 45.4 41.7 42.8 41.9
Regular 41.5 29.0 38.9 40.63 35.6 39.5 43.4 42.8 43.3
Casual 16.3 26.0 18.4 14.58 16.7 15.1 14.9 14.4 14.8
Total 100 100 100 100 100.0 100.0 100.0 100.0 100.0

ILO DWT for South Asia and Country Office for India 31
While women more than doubled their share of regular wage employment in the economy (a six percentage
point change from 6.1 to 12.7 per cent) men registered a small change of close to 3.5 percentage points, but
at a higher share of 16.4 to 19.8. This statement needs to be tempered, of course, with the fact that women’s
workforce participation at 30 per cent is only half that of men; with the result that they account for only
one-fifth of the total regular work force. Women in India have just started making their presence visible in
regular employment; this is more so for the economically and socially disadvantaged, as we shall see later.
Rural-urban differences are quite sharp. Much of the regular employment is concentrated in urban areas.
As for casual employment, there has been a marginal
reduction in its share but this has been mainly in the
urban areas. Since 2004, there has been only a small
rise in the incidence of casual employment amongst
men and women. Women have a greater incidence of
self-employment at 56 per cent in 2012; only slightly
lower than in the early 1990s. For men, the decline is
about three percentage points. The small increase in
wage employment in the Indian economy is largely due to a fall in the share of self-employment among
men workers.
4.3. Wage levels and growth trends
For purposes of capturing the macro trends, it would have been useful if one were to talk about a single
average wage rate for India. Although such a wage can be constructed by a weighted average of casual and
regular wages, it would not be appropriate to talk about such a single wage rate because these two rates
represent different sets of workers. Firstly, wages of casual workers do not definitionally refer to any idea
of quantum of employment because they are irregular, compensated only for days of labour whereas wages
of regular workers refer to those who have full employment. Secondly, casual workers mostly consist of
poor workers, with very little education and/or skill, and the incidence of casual work is high among socially
disadvantaged sections. For these reasons, we present two overall wage rates.
The most striking feature of the difference between the wages of regular and casual workers is the huge
disparity in terms of payment (see Table 4.4). Those of casual workers was less than one-third (30 per cent
of the wages of regular workers) in 1993 and remained at that level for the next ten years, then marginally
increased to just above one-third (35 per cent of the wages of regular workers) by 2012. This is evident in
the higher growth rate during the second period. To a large extent, this reflects the low educational and
other capabilities of the casual workers as well as the low productivity character of the industries in which
they work. However, as this report will reveal in greater detail, not all casual workers work in the low
productivity sectors. By 2012, one-third of the non-agricultural casual workers of around 60.2 million were
employed in the high productivity organized or formal sector of the economy. That works out to a little
more a quarter of the total organized sector non-agricultural workers. One of the highlights of this report is
to point to the emergence of a class of highly exploited workers in the high productivity organized sector
of the economy.
Total
Self Employed 54.0 57.0 55.01 54.67 61.4 56.9 50.7 56.1 52.2
Regular 16.4 6.1 13.05 17.2 8.3 14.3 19.8 12.7 17.9
Casual 29.6 36.9 31.95 28.13 30.3 28.9 29.4 31.2 29.9
Total 100 100 100 100 100 100 100 100 100
Table 4.3: Employment elasticity in the Indian economy
Category P1 P2 P3
Overall employment 0.30 0.07 0.20
Wage employment 0.43 0.09 0.26
Regular employment 0.66 0.49 0.57
Casual employment 0.19 0.17 0.18 Note: In all tables in this report P1 refers to the first period i.e. 1993-94 to 2004-05; P2 refers to the second period I.e. 2004-05 to 2011-12; and P3 refers to the whole period i.e. 1993-94 to 2011-12.
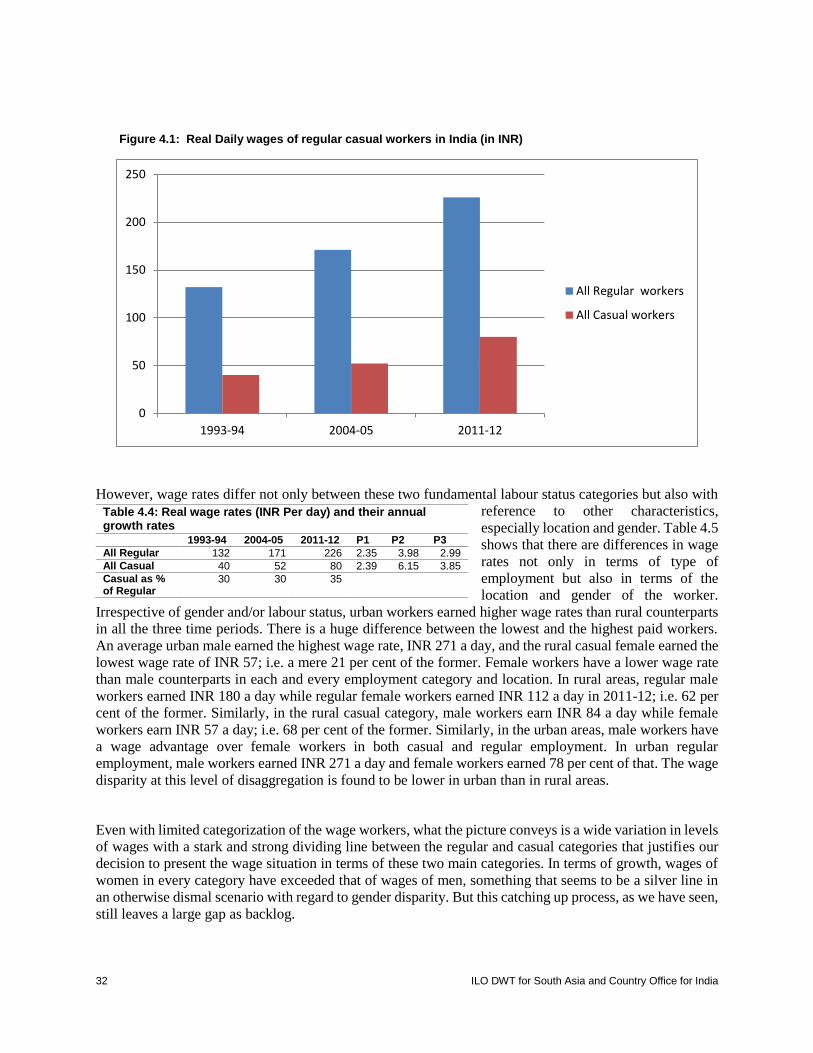
32 ILO DWT for South Asia and Country Office for India
Figure 4.1: Real Daily wages of regular casual workers in India (in INR)
However, wage rates differ not only between these two fundamental labour status categories but also with
reference to other characteristics,
especially location and gender. Table 4.5
shows that there are differences in wage
rates not only in terms of type of
employment but also in terms of the
location and gender of the worker.
Irrespective of gender and/or labour status, urban workers earned higher wage rates than rural counterparts
in all the three time periods. There is a huge difference between the lowest and the highest paid workers.
An average urban male earned the highest wage rate, INR 271 a day, and the rural casual female earned the
lowest wage rate of INR 57; i.e. a mere 21 per cent of the former. Female workers have a lower wage rate
than male counterparts in each and every employment category and location. In rural areas, regular male
workers earned INR 180 a day while regular female workers earned INR 112 a day in 2011-12; i.e. 62 per
cent of the former. Similarly, in the rural casual category, male workers earn INR 84 a day while female
workers earn INR 57 a day; i.e. 68 per cent of the former. Similarly, in the urban areas, male workers have
a wage advantage over female workers in both casual and regular employment. In urban regular
employment, male workers earned INR 271 a day and female workers earned 78 per cent of that. The wage
disparity at this level of disaggregation is found to be lower in urban than in rural areas.
Even with limited categorization of the wage workers, what the picture conveys is a wide variation in levels
of wages with a stark and strong dividing line between the regular and casual categories that justifies our
decision to present the wage situation in terms of these two main categories. In terms of growth, wages of
women in every category have exceeded that of wages of men, something that seems to be a silver line in
an otherwise dismal scenario with regard to gender disparity. But this catching up process, as we have seen,
still leaves a large gap as backlog.
0
50
100
150
200
250
1993-94 2004-05 2011-12
All Regular workers
All Casual workers
Table 4.4: Real wage rates (INR Per day) and their annual growth rates 1993-94 2004-05 2011-12 P1 P2 P3
All Regular 132 171 226 2.35 3.98 2.99
All Casual 40 52 80 2.39 6.15 3.85
Casual as % of Regular
30 30 35

ILO DWT for South Asia and Country Office for India 33
Real Daily Wage Annual growth rate
1993-94 2004-05 2011-12 P1 P2 P3
Urban Regular Male 158 204 271 2.32 4.06 3.00
Urban Regular Female 125 152 211 1.78 4.69 2.91
Rural Regular Male 103 147 180 3.23 2.89 3.10
Rural Regular Female 61 86 112 3.12 3.77 3.38
Urban Casual Male 67 76 106 1.15 4.75 2.55
Urban Casual Female 38 45 64 1.54 5.03 2.90
Rural Casual Male 42 56 84 2.62 5.79 3.85
Rural Casual Female 27 35 57 2.36 6.97 4.15
Urban Regular 153 194 259 2.16 4.13 2.92
Rural Regular 97 135 167 3.01 3.04 3.02
Urban Casual 59 70 99 1.55 4.95 2.88
Rural Casual 37 49 77 2.55 6.46 4.07
Urban Men (R+C) 134 172 232 2.27 4.27 3.05
Urban Women (R+C) 89 123 180 2.94 5.44 3.91
Rural Men (R+C) 56 79 108 3.13 4.47 3.65
Rural Women (R+C) 30 42 68 3.06 6.88 4.55
All Urban (M+F) 126 163 222 2.34 4.41 3.15
All Rural (M+F) 48 68 98 3.17 5.22 3.97
All Regular workers 132 171 226 2.35 3.98 2.99
All Casual workers 40 52 80 2.39 6.15 3.85
All Wage Workers 72 98 142 2.80 5.30 3.77
Growth rate in aggregate GDP 6.08 8.12 6.88
Growth rate in per capita GDP 4.27 6.71 5.22
Note: Real wages and GDP are calculated with base as 2004-05 prices.
However, from a macroeconomic perspective of relating growth to growth in wages, the scenario has been
one loaded against wage earners. During the first period, the overall annual per capita economic growth
was 4.27 per cent while the growth in wages was just 2.8 per cent, yielding a wage elasticity of 0.66.
Acceleration of per capita income growth to 6.7 per cent per annum during the second period also witnessed
growth in wages of 5.3 per cent per annum, resulting in an increase in wage elasticity to 0.79. That is to say
that the wage growth was equivalent to 62 per cent of the economic growth in the first period, and that it
increased to 79 per cent during the second period. The lowest growth in wages is for the urban male casual
workers followed by the urban casual female. In that sense, there is some catching up of rural wages with
urban wages although the gap remains significant. The highest growth in female and male wages for casual
employment in rural areas since 2005 needs to be read in the light of the introduction of the National Rural
Employment Scheme (NREGS) and many other initiatives, such as the National Rural Health Mission, and
a national health insurance scheme (Rashtriya Swastha Bhima Yojana) although their implementation was
below potential.
Despite these recent developments, growth in wages for the whole period was significantly lower than
economic growth, indicating a declining trend in the share of wages in national income. One way to examine
this is to find out the elasticity in wage rates with respect to per capita growth in national income (GDP).
These are given in Table 4.6. If the wage
elasticity is one, it means that wage increase is
in proportion to the increase in income. It
would then maintain the initial level of income
inequality as between wage income and non-
wage income. If it is less than one, even with
an increase in wages, income inequality would
Table 4.5: Wage (INR per day) trends from 1993-94 to 2011-12
Table 4.6: Wage elasticity with respect to income growth Category P1 P2 P3
Rural Casual Female 0.55 1.04 0.80
Rural Casual Male 0.61 0.86 0.74
Rural Regular Female 0.73 0.56 0.65
Rural Regular Male 0.76 0.43 0.59
Urban Regular Male 0.54 0.61 0.57
Urban Regular Female 0.42 0.70 0.56
Urban Casual Male 0.27 0.71 0.49
34 ILO DWT for South Asia and Country Office for India
increase. If it is greater than one, then the wage share in national income would increase leading to a
reduction in inequality between wage income and non-wage income.
4.4. Wages across different education levels
From a theoretical point of view, education is expected to play a crucial role in determining the wages of
workers in the labour markets. This general theoretical statement is amply demonstrated by a number of
studies across countries as well as in India — some of which were referred to in Chapter 2. We would like
to examine this in a summary fashion for the whole country but differentiating workers according to gender,
location and labour status.
We defined education levels into four categories. The lowest level is called ‘low education’ and refers to
those who have not had more than five years of schooling, or less. Many studies take illiterates as a category
but we find that illiteracy has been declining fast while low levels of education remain; with the result that
it hardly makes any difference in negotiating issues in the labour market or applying any skill. The second
level is called ‘middle’, to refer to those above the primary level who have not successfully completed the
secondary level. The third level refers to those with at least a secondary level pass but not graduates, and
this category would include those with 12 years of schooling as well as all those with certificates, diplomas,
etc. The last level is called ‘graduate and above’, to refer to those with at least a bachelor level degree. This
would include all those with additional degrees and/or professional qualifications.
The descriptive statistics that are presented in Table 4.7 confirm the well-established fact that higher
education levels are associated with a higher level of earning. Inequality in wages depends upon the
educational endowment of workers. For all workers, the disparity between the highest level of education
and the lowest level has been around five times. This pattern of disparity is quite widespread among most
categories of workers, both male and female as well as rural and urban. The only exceptions are a couple
of categories within the ranks of the casual workers. In fact, the disparity is the least among the casual
workers and this is understandable given the fact that most casual work is of an unskilled nature and mostly
concentrated in the primary sector as well as in construction in both rural and urban areas. But there are
some indications that even within this category some segments show an increasing inequality. This is in the
urban casual female category, and could partly be due to educated women finding themselves involved in
casual employment — even if it involves some level of skill and knowledge as in the cases of data entry,
guest lecturers (who are paid by the hour) and in financial and other establishments where the employment
of ‘temps’ (temporary workers) has been gaining ground.
The second finding in this exercise is the fact the disparity has been increasing for some sub-groups
although the overall disparity has remained more or less the same. Disparity increased for most groups in
the first decade followed by a marginal decline in some. This is an indication of the increasing demand for
workers with higher educational qualifications, as most sectors of the economy are experiencing
technological changes with the introduction of computer-based skills (IT, ICT, etc.), and changes in
marketing.
Thirdly, high inequality has been found among regular women workers, perhaps indicating the higher
absorption of a low overall share of educated women in the labour market than in the past, as seen in
education and health as well as in the knowledge economy sectors such as IT, banking, media, etc.
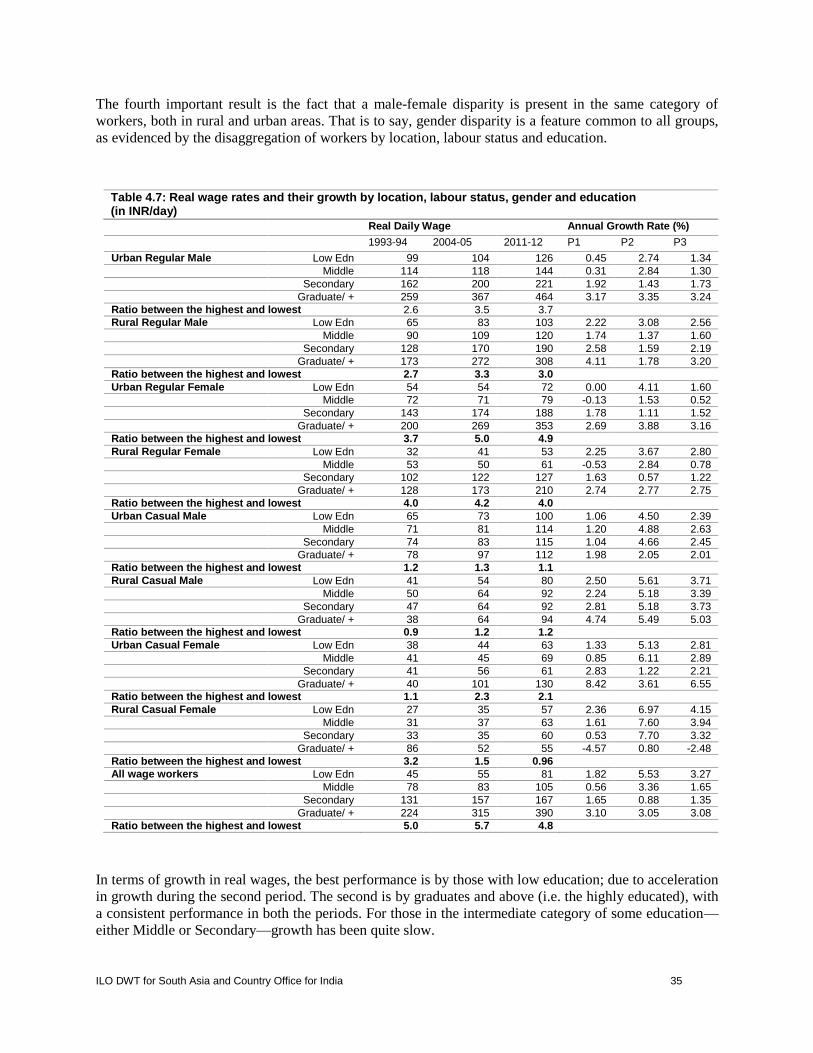
ILO DWT for South Asia and Country Office for India 35
The fourth important result is the fact that a male-female disparity is present in the same category of
workers, both in rural and urban areas. That is to say, gender disparity is a feature common to all groups,
as evidenced by the disaggregation of workers by location, labour status and education.
Real Daily Wage Annual Growth Rate (%)
1993-94 2004-05 2011-12 P1 P2 P3
Urban Regular Male Low Edn 99 104 126 0.45 2.74 1.34
Middle 114 118 144 0.31 2.84 1.30
Secondary 162 200 221 1.92 1.43 1.73
Graduate/ + 259 367 464 3.17 3.35 3.24
Ratio between the highest and lowest 2.6 3.5 3.7
Rural Regular Male Low Edn 65 83 103 2.22 3.08 2.56
Middle 90 109 120 1.74 1.37 1.60
Secondary 128 170 190 2.58 1.59 2.19
Graduate/ + 173 272 308 4.11 1.78 3.20
Ratio between the highest and lowest 2.7 3.3 3.0
Urban Regular Female Low Edn 54 54 72 0.00 4.11 1.60
Middle 72 71 79 -0.13 1.53 0.52
Secondary 143 174 188 1.78 1.11 1.52
Graduate/ + 200 269 353 2.69 3.88 3.16
Ratio between the highest and lowest 3.7 5.0 4.9
Rural Regular Female Low Edn 32 41 53 2.25 3.67 2.80
Middle 53 50 61 -0.53 2.84 0.78
Secondary 102 122 127 1.63 0.57 1.22
Graduate/ + 128 173 210 2.74 2.77 2.75
Ratio between the highest and lowest 4.0 4.2 4.0
Urban Casual Male Low Edn 65 73 100 1.06 4.50 2.39
Middle 71 81 114 1.20 4.88 2.63
Secondary 74 83 115 1.04 4.66 2.45
Graduate/ + 78 97 112 1.98 2.05 2.01
Ratio between the highest and lowest 1.2 1.3 1.1
Rural Casual Male Low Edn 41 54 80 2.50 5.61 3.71
Middle 50 64 92 2.24 5.18 3.39
Secondary 47 64 92 2.81 5.18 3.73
Graduate/ + 38 64 94 4.74 5.49 5.03
Ratio between the highest and lowest 0.9 1.2 1.2
Urban Casual Female Low Edn 38 44 63 1.33 5.13 2.81
Middle 41 45 69 0.85 6.11 2.89
Secondary 41 56 61 2.83 1.22 2.21
Graduate/ + 40 101 130 8.42 3.61 6.55
Ratio between the highest and lowest 1.1 2.3 2.1
Rural Casual Female Low Edn 27 35 57 2.36 6.97 4.15
Middle 31 37 63 1.61 7.60 3.94
Secondary 33 35 60 0.53 7.70 3.32
Graduate/ + 86 52 55 -4.57 0.80 -2.48
Ratio between the highest and lowest 3.2 1.5 0.96
All wage workers Low Edn 45 55 81 1.82 5.53 3.27
Middle 78 83 105 0.56 3.36 1.65
Secondary 131 157 167 1.65 0.88 1.35
Graduate/ + 224 315 390 3.10 3.05 3.08
Ratio between the highest and lowest 5.0 5.7 4.8
In terms of growth in real wages, the best performance is by those with low education; due to acceleration
in growth during the second period. The second is by graduates and above (i.e. the highly educated), with
a consistent performance in both the periods. For those in the intermediate category of some education—
either Middle or Secondary—growth has been quite slow.
Table 4.7: Real wage rates and their growth by location, labour status, gender and education (in INR/day)

36 ILO DWT for South Asia and Country Office for India
4.5. Wage rates by socio-religious category
We categorized workers by socio-religious categories: Schedule Tribe (ST), Schedule Caste (SC), Muslims,
Other Backward Caste (OBC) and Others. Scheduled Tribes (ST), Scheduled Castes (SC), and Other
Backward Castes (OBC) are identified as the socially disadvantaged groups, receiving the benefits of
affirmative action in the form of reservation policy in education and employment. The government-
appointed committee to study the socio-economic and educational status of the Muslim community in India,
known as Sachar Committee (2006), found that Muslims rank somewhat above STs/SCs but below Hindu
OBCs in almost all the development indicators. This was confirmed by the NCEUS (2008) when it reported
the situation relating to poverty, informal work status, education and so on. Therefore, in this study, we
take Muslims as a socially disadvantaged group along with the OBC group, while ST and SC are the most
disadvantaged.
The category ‘Others’ is a residual one consisting of Hindu upper castes, Jains, Sikhs, Christians,
Zorastrians and a few others who may be considered the socially privileged group. These categories belong
to the top level in terms of per capita net worth followed by OBC, Muslims, SC and ST. The same ranking
applies when a host of indicators of development and well-being are measured across these broad social
categories (see Kannan 2016b). This socio-religious grouping therefore emerges as a broad approximation
to the social hierarchy obtaining in the Indian society. Since the data on OBCs is not available for 1993-94
NSS Round, the comparison here is confined to the latest two EUS 61st (2004-05) and 68th (2011-12)
rounds.
Table 4.8 summarizes wages according to these five social groups. First, there is a sharp difference in the
wages of regular and casual workers, as has already been demonstrated for other alternative categorizations.
Therefore, the ability to get a regular job is also a transition from low wage labour market to a high wage
labour market, in general. Secondly, there is a hierarchy in wages in each category when we take wages
for all workers. This is because the socially disadvantaged groups have a much lower share in regular work
as compared to the socially privileged group of Others (see Table 4.10). But the higher ranking of STs
above that of SCs and Muslims in terms of regular wages needs to be seen in the context of a small share
of regular ST workers arising largely out of affirmative action. For SCs this has to be seen as a combination
of affirmative action as well as low wage regular jobs. Thirdly, casual work does not present significant
wage differentials for all except STs. Everyone is leveled here, given the unskilled manual nature of work.
But here again, STs are seen at a disadvantage for both the years. Lastly, wage disparity has narrowed for
all social groups except for Muslims. But the gains are such that significant ‘social’ disparity continues to
challenge the Indian labour market.
Social Group
Wage rate (in INR) Wage Disparity (Others =100)
2004-05 2011-12 2004-05 2011-12
RW CW All RW CW All RW CW All RW CW All
Others 227 56 177 306 83 246 100 100 100 100 100 100
OBC 140 53 86 194 83 129 62 95 49 63 100 52
Muslim 131 57 86 153 84 112 58 102 49 50 101 46
SC 124 51 70 169 79 105 55 91 40 55 95 43
ST 147 42 62 203 64 98 65 75 35 66 77 40
Table 4.9 reports daily wage rates by categorizing workers on the basis of type of employment, location
and gender across different socio-religious categories. There is wide variation of wage rates across socio-
Table 4.8: Real wages and its disparity by social group
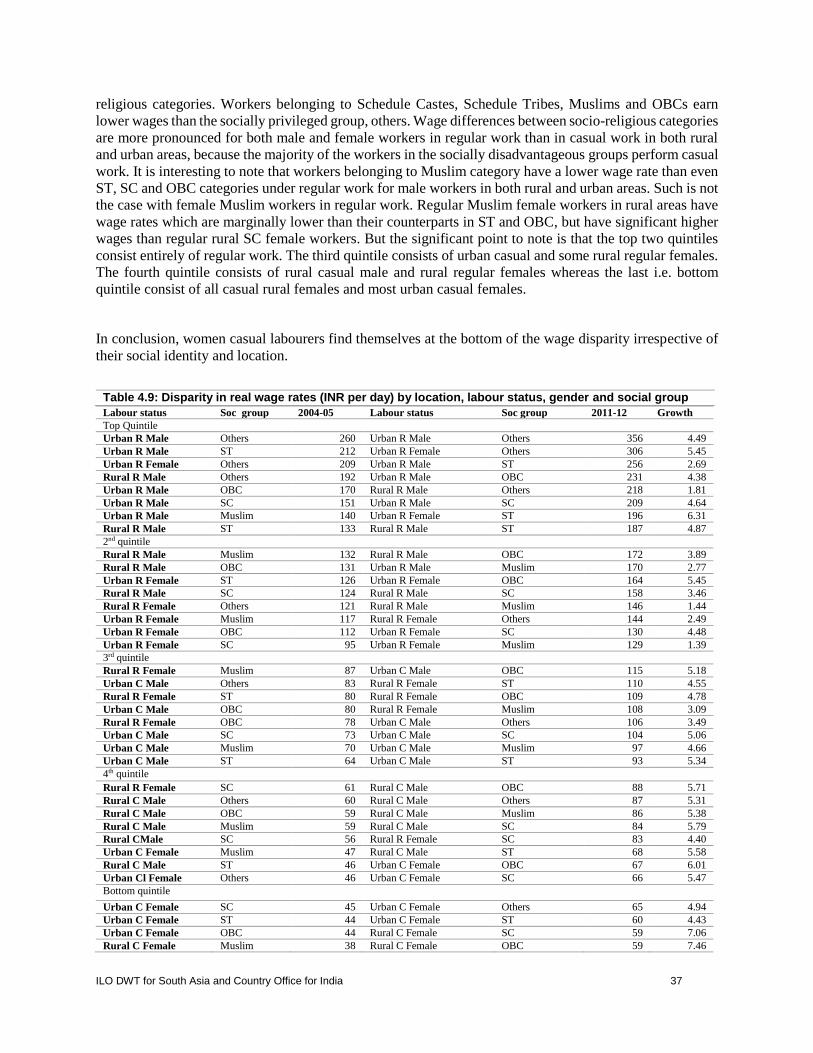
ILO DWT for South Asia and Country Office for India 37
religious categories. Workers belonging to Schedule Castes, Schedule Tribes, Muslims and OBCs earn
lower wages than the socially privileged group, others. Wage differences between socio-religious categories
are more pronounced for both male and female workers in regular work than in casual work in both rural
and urban areas, because the majority of the workers in the socially disadvantageous groups perform casual
work. It is interesting to note that workers belonging to Muslim category have a lower wage rate than even
ST, SC and OBC categories under regular work for male workers in both rural and urban areas. Such is not
the case with female Muslim workers in regular work. Regular Muslim female workers in rural areas have
wage rates which are marginally lower than their counterparts in ST and OBC, but have significant higher
wages than regular rural SC female workers. But the significant point to note is that the top two quintiles
consist entirely of regular work. The third quintile consists of urban casual and some rural regular females.
The fourth quintile consists of rural casual male and rural regular females whereas the last i.e. bottom
quintile consist of all casual rural females and most urban casual females.
In conclusion, women casual labourers find themselves at the bottom of the wage disparity irrespective of
their social identity and location.
Labour status Soc group 2004-05 Labour status Soc group 2011-12 Growth
Top Quintile
Urban R Male Others 260 Urban R Male Others 356 4.49
Urban R Male ST 212 Urban R Female Others 306 5.45
Urban R Female Others 209 Urban R Male ST 256 2.69
Rural R Male Others 192 Urban R Male OBC 231 4.38
Urban R Male OBC 170 Rural R Male Others 218 1.81
Urban R Male SC 151 Urban R Male SC 209 4.64
Urban R Male Muslim 140 Urban R Female ST 196 6.31
Rural R Male ST 133 Rural R Male ST 187 4.87
2nd quintile
Rural R Male Muslim 132 Rural R Male OBC 172 3.89
Rural R Male OBC 131 Urban R Male Muslim 170 2.77
Urban R Female ST 126 Urban R Female OBC 164 5.45
Rural R Male SC 124 Rural R Male SC 158 3.46
Rural R Female Others 121 Rural R Male Muslim 146 1.44
Urban R Female Muslim 117 Rural R Female Others 144 2.49
Urban R Female OBC 112 Urban R Female SC 130 4.48
Urban R Female SC 95 Urban R Female Muslim 129 1.39
3rd quintile
Rural R Female Muslim 87 Urban C Male OBC 115 5.18
Urban C Male Others 83 Rural R Female ST 110 4.55
Rural R Female ST 80 Rural R Female OBC 109 4.78
Urban C Male OBC 80 Rural R Female Muslim 108 3.09
Rural R Female OBC 78 Urban C Male Others 106 3.49
Urban C Male SC 73 Urban C Male SC 104 5.06
Urban C Male Muslim 70 Urban C Male Muslim 97 4.66
Urban C Male ST 64 Urban C Male ST 93 5.34
4th quintile
Rural R Female SC 61 Rural C Male OBC 88 5.71
Rural C Male Others 60 Rural C Male Others 87 5.31
Rural C Male OBC 59 Rural C Male Muslim 86 5.38
Rural C Male Muslim 59 Rural C Male SC 84 5.79
Rural CMale SC 56 Rural R Female SC 83 4.40
Urban C Female Muslim 47 Rural C Male ST 68 5.58
Rural C Male ST 46 Urban C Female OBC 67 6.01
Urban Cl Female Others 46 Urban C Female SC 66 5.47
Bottom quintile
Urban C Female SC 45 Urban C Female Others 65 4.94
Urban C Female ST 44 Urban C Female ST 60 4.43
Urban C Female OBC 44 Rural C Female SC 59 7.06
Rural C Female Muslim 38 Rural C Female OBC 59 7.46
Table 4.9: Disparity in real wage rates (INR per day) by location, labour status, gender and social group

38 ILO DWT for South Asia and Country Office for India
Rural C Female SC 36 Rural C Female Others 57 6.97
Rural C Female OBC 35 Urban C Female Muslim 55 2.25
Rural C Female Others 35 Rural C Female ST 54 6.61
Rural C Female ST 34 Rural C Female Muslim 53 4.75
The growth rates of wages in the two time periods (1993-2004-05 and 2004-05 to 2011-12) shows that
wages grew faster on an average in the later period than the former, particularly among the low education
worker category as reported in the earlier sections.
This evidence is further strengthened by the higher
growth rate of real wages among socially
disadvantaged groups such as ST, SC and OBCs —
except for Muslims, whose growth rates were the
lowest among all other social groups.
4.6. Wages by industry
Wages differ according to the industry in which workers are employed. While we find a distinct disparity
in wages between regular and casual workers, there is a need to examine the broad industry group. This is
presented in Table 4.11. Overall, there is a decline in disparity between 1993-94 and 2011-12 with wages
in casual employment rising from 30 per cent of the regular employment to 36 per cent. But this has come
with an industry-wise mixed picture, wherein the disparity increased sharply in the primary sector, mining
and quarrying, electricity, et.al., construction, transport, banking and education.
Table 4.10: Access to employment by social group and labour status (percentage share)
Social
Group
2004-05 2011-12
RW CW RW CW
Others 83.7 16.3 82.6 17.4
OBC 61.1 38.9 56.8 43.2
Muslim 54.1 45.9 48.9 51.1
SC 49.2 50.8 42.5 57.5
ST 48.9 59.1 37.9 72.1
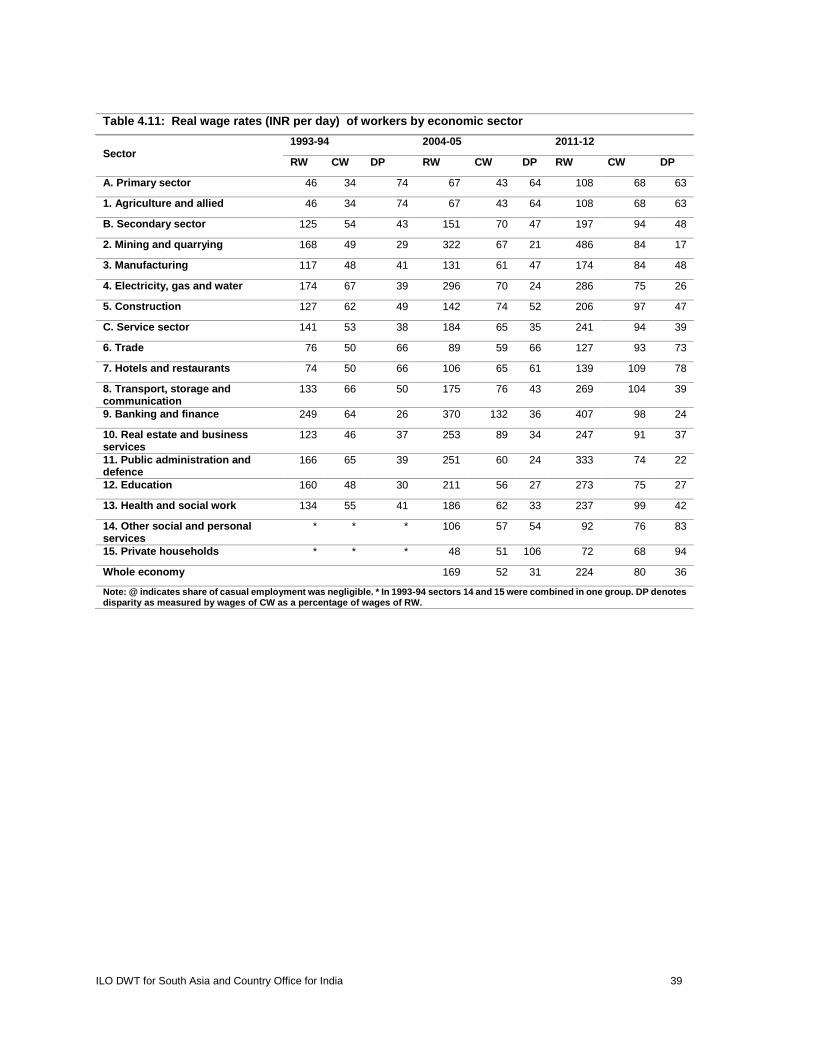
ILO DWT for South Asia and Country Office for India 39
Sector
1993-94 2004-05 2011-12
RW CW DP RW CW DP RW CW DP
A. Primary sector 46 34 74 67 43 64 108 68 63
1. Agriculture and allied 46 34 74 67 43 64 108 68 63
B. Secondary sector 125 54 43 151 70 47 197 94 48
2. Mining and quarrying 168 49 29 322 67 21 486 84 17
3. Manufacturing 117 48 41 131 61 47 174 84 48
4. Electricity, gas and water 174 67 39 296 70 24 286 75 26
5. Construction 127 62 49 142 74 52 206 97 47
C. Service sector 141 53 38 184 65 35 241 94 39
6. Trade 76 50 66 89 59 66 127 93 73
7. Hotels and restaurants 74 50 66 106 65 61 139 109 78
8. Transport, storage and communication
133 66 50 175 76 43 269 104 39
9. Banking and finance 249 64 26 370 132 36 407 98 24
10. Real estate and business services
123 46 37 253 89 34 247 91 37
11. Public administration and defence
166 65 39 251 60 24 333 74 22
12. Education 160 48 30 211 56 27 273 75 27
13. Health and social work 134 55 41 186 62 33 237 99 42
14. Other social and personal services
* * * 106 57 54 92 76 83
15. Private households * * * 48 51 106 72 68 94
Whole economy 169 52 31 224 80 36
Note: @ indicates share of casual employment was negligible. * In 1993-94 sectors 14 and 15 were combined in one group. DP denotes disparity as measured by wages of CW as a percentage of wages of RW.
Table 4.11: Real wage rates (INR per day) of workers by economic sector

40 ILO DWT for South Asia and Country Office for India
Sector P1 P2 P3
Regular Casual Regular Casual Regular Casual
Primary Sector 3.42 2.13 6.82 6.55 4.74 3.85
Agriculture and allied 3.42 2.13 6.82 6.55 4.74 3.85
Secondary Sector 1.72 2.36 3.80 4.21 2.53 3.08
Mining and quarrying 5.91 2.84 5.88 3.23 5.90 2.99
Manufacturing 1.03 2.18 4.06 4.57 2.20 3.11
Electricity, gas and water 4.83 0.40 -0.49 0.99 2.76 0.63
Construction 1.01 1.61 5.31 3.87 2.69 2.49
Service Sector 2.42 1.86 3.86 5.27 2.98 3.18
Trade 1.44 1.50 5.08 6.50 2.85 3.45
Hotels and restaurants 3.27 2.39 3.87 7.39 3.50 4.33
Transport, storage and communication 2.49 1.28 6.14 4.48 3.91 2.53
Banking and finance 3.60 6.58 1.36 -4.25 2.73 2.37
Real estate and business services 6.56 6.00 -0.34 0.32 3.87 3.79
Public administration & defence 3.76 -0.73 4.04 3.00 3.87 0.72
Education 2.52 1.40 3.68 4.17 2.97 2.48
Health and social work 2.98 1.09 3.46 6.69 3.17 3.27
Other SPS and private households 1.38 1.90 3.19 4.38 2.08 2.86
Whole economy 2.39 2.62 4.02 6.15 3.02 3.99
Industry-wise classification in a way represents the demand side, hence one can see the close association
of some industries/activities with regular work and some with casual work. Till the early 1990s, the division
between regular and casual wage workers could approximate employment in the organized/formal and
unorganized/informal sectors. With increasing informalization of employment in the formal sector this
situation has changed, as was already brought out by the NCEUS (2007 and 2009). Therefore, the dualism
in the economy is not only between sectors but also between types of employment. It is therefore only
appropriate to introduce here the division between organized/formal and unorganized/informal sector into
regular and casual classification by industry.
Table 4.12: Growth rates in real wage rates of workers by economic sector

ILO DWT for South Asia and Country Office for India 41
Organized/Formal Sector
Unorganized/Informal Sector
Sector 2004-05 2011-12 2004-05 2011-12
Secondary sector 42.60 48.68 75.73 83.99
Mining and quarrying 43.36 47.40 96.49 92.11
Manufacturing 27.61 21.54 45.80 50.04
Electricity, gas and water 4.47 3.90 18.81 32.12
Construction 88.98 89.79 97.32 97.28
Service sector 4.94 76.88 44.48 50.46
Trade 21.54 12.72 23.50 24.72
Hotels and restaurants 14.29 7.20 38.38 37.33
Transport, storage and communication. 12.76 6.97 38.16 32.74
Banking and finance 1.62 1.28 0.92 1.95
Real estate and bus services 3.57 5.91 16.87 17.60
Public administration and defence 1.71 0.76 4.95
Education 0.84 0.35 1.54 3.76
Health and social work 3.44 3.29 4.33 27.32
Other social and personal services 10.79 9.10 47.29 37.85
Private households and ETOs 54.86 0.00 27.91 20.52
total non-agricultural wage workers 21.56 25.79 53.02 60.61
When workers are classified into regular and casual in the organized and unorganized sectors separately,
as we do in Table 4.13, there is an interesting pattern that emerges. As expected, regular workers in the
organized sector receive considerably higher wages. But the wages of casual workers in the organized sector
as well as regular and casual workers in the unorganized sector are more or less on par — with a marginal
advantage — with those of the regular workers in the unorganized sector. What is more surprising yet is
that the wages of casual workers in the unorganized sector and organized sector do not present any disparity
in 2012. In 1993, there was significant disparity in the sense that the casual workers in the unorganized
sector received wages that came to only 22 per cent of that of the regular workers in the organized sector;
compared to 30 per cent for the casual workers in the organized sector. This difference has now
disappeared. However, a detailed examination would reveal that, in 2004-05, five out of the 14 industry
sectors reported higher wage rates for the casual unorganized sector workers compared to the casual
organized sector workers. This has now increased to a majority of nine out of 14 ignoring ‘private
households’ where the organized sector concept is absent. Researchers had reported this interesting
difference by analysing the data for 1999-2000 (see, e.g., Unni 2005). Yet the share of casual workers in
organized sector employment has gone up by three percentage points i.e. from 21.5 to 25.3. It is not difficult
to explain this because the sectors with a higher wage advantage are the ones which have attracted more
casual workers in 2012, and the sectors with a declining advantage have lost out in terms of the share of
casual workers.
Nevertheless, the fact remains that the organized non-agricultural sector employs a quarter of its workers
as casual workers. This is in addition to those regular workers who are informally employed because they
Table 4.13: Percentage share of casual workers by industry and organized/unorganized sector (non-agricultural only)
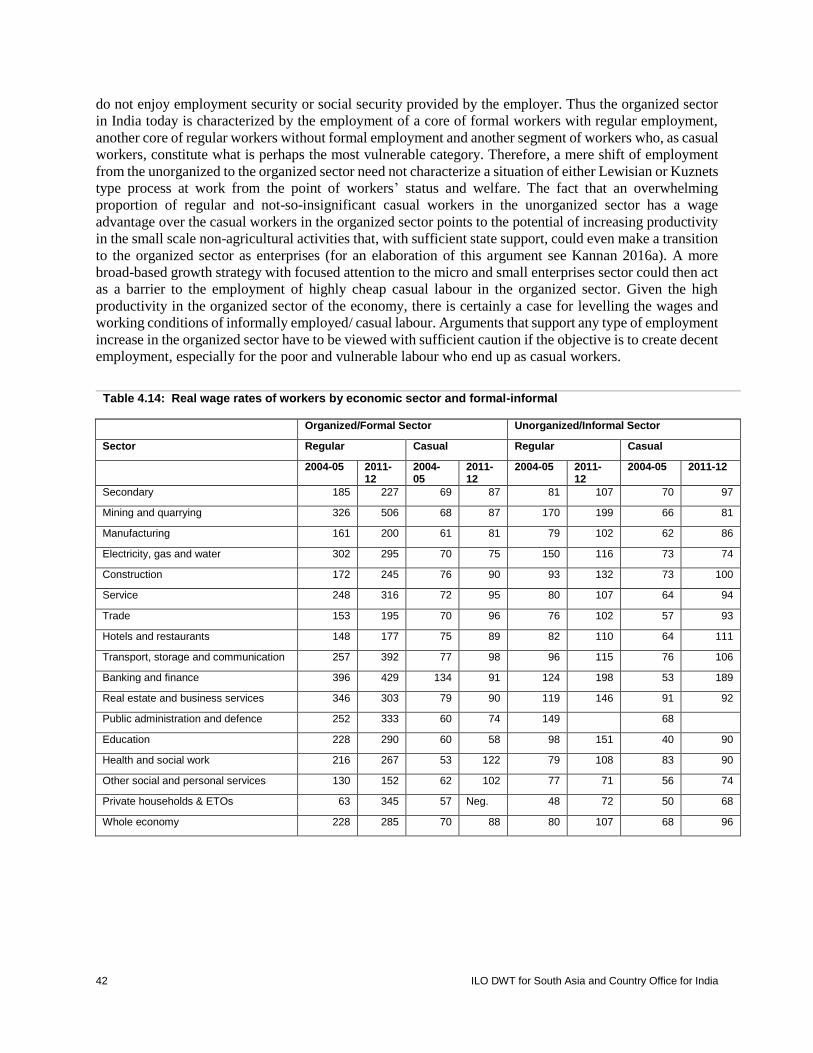
42 ILO DWT for South Asia and Country Office for India
do not enjoy employment security or social security provided by the employer. Thus the organized sector
in India today is characterized by the employment of a core of formal workers with regular employment,
another core of regular workers without formal employment and another segment of workers who, as casual
workers, constitute what is perhaps the most vulnerable category. Therefore, a mere shift of employment
from the unorganized to the organized sector need not characterize a situation of either Lewisian or Kuznets
type process at work from the point of workers’ status and welfare. The fact that an overwhelming
proportion of regular and not-so-insignificant casual workers in the unorganized sector has a wage
advantage over the casual workers in the organized sector points to the potential of increasing productivity
in the small scale non-agricultural activities that, with sufficient state support, could even make a transition
to the organized sector as enterprises (for an elaboration of this argument see Kannan 2016a). A more
broad-based growth strategy with focused attention to the micro and small enterprises sector could then act
as a barrier to the employment of highly cheap casual labour in the organized sector. Given the high
productivity in the organized sector of the economy, there is certainly a case for levelling the wages and
working conditions of informally employed/ casual labour. Arguments that support any type of employment
increase in the organized sector have to be viewed with sufficient caution if the objective is to create decent
employment, especially for the poor and vulnerable labour who end up as casual workers.
Organized/Formal Sector Unorganized/Informal Sector
Sector Regular Casual Regular Casual
2004-05 2011-12
2004-05
2011-12
2004-05 2011-12
2004-05 2011-12
Secondary 185 227 69 87 81 107 70 97
Mining and quarrying 326 506 68 87 170 199 66 81
Manufacturing 161 200 61 81 79 102 62 86
Electricity, gas and water 302 295 70 75 150 116 73 74
Construction 172 245 76 90 93 132 73 100
Service 248 316 72 95 80 107 64 94
Trade 153 195 70 96 76 102 57 93
Hotels and restaurants 148 177 75 89 82 110 64 111
Transport, storage and communication 257 392 77 98 96 115 76 106
Banking and finance 396 429 134 91 124 198 53 189
Real estate and business services 346 303 79 90 119 146 91 92
Public administration and defence 252 333 60 74 149 68
Education 228 290 60 58 98 151 40 90
Health and social work 216 267 53 122 79 108 83 90
Other social and personal services 130 152 62 102 77 71 56 74
Private households & ETOs 63 345 57 Neg. 48 72 50 68
Whole economy 228 285 70 88 80 107 68 96
Table 4.14: Real wage rates of workers by economic sector and formal-informal

ILO DWT for South Asia and Country Office for India 43
Sector 2004-05 2011-12
OC UR UC OC UR UC
Secondary sector 37 44 38 38 47 43
Mining and quarrying 21 52 20 13 39 16
Manufacturing 38 49 39 41 51 43
Electricity, gas and water 23 50 24 25 39 25
Construction 44 54 42 37 54 41
Service sector 29 25 26 30 34 30
Trade 46 50 37 49 52 48
Hotels and restaurants 51 55 43 50 62 63
Transport, storage and communication 30 37 30 25 29 27
Banking and finance 34 31 13 21 46 44
Real estate and business services 23 34 26 30 48 30
Public administration and defence 23 59 16 22 NR NR
Education 26 43 18 29 52 31
Health and social work 25 37 38 46 40 34
Other social and personal Services 48 59 43 67 47 49
Private households 90 76 79 NA 21 20
Whole economy 31 35 35 31 38 34
4.7. Occupations
An occupational classification system is a pre-requisite for comparing wages across occupations. The
official occupational classification system has undergone changes over time. For the National Classification
of Occupations-1968 (NCO-68) was used during EUS-50th (1993-94) and 61st round (2004-05) of the
National Sample Surveys. Since 2007-08 (i.e. 64th Round) NCO-2004 was used and same was applied to
68th round (2011-12). For comparability between 68th round and other two previous rounds, the
occupational classification NCO-68 is regrouped and reclassified according to NCO-2004 at one digit
level.4 The occupational classification presented in Table 4.16 represents skill levels of the workers in both
rural and urban areas separately. The high-skill occupations (Div. 1 to Div. 3) include corporate managers,
professionals and associate professionals; medium-skill occupations (Div. 4 to Div. 8) include clerks,
service workers, shop and market sale workers, agricultural and fishery workers, craft and related trades
workers, and plant and machine operators and assemblers; low-skilled occupations (Div. 9) include sales
and service elementary occupations and labourers in agriculture, fishery, mining, construction,
manufacturing and transport. Occupational divisions, apart from representing wage rates to different skilled
workers, also represent the labour market segmentation in Indian labour market. The wage differential
between the lowest paid occupation and the highest paid occupation is higher in urban areas than in rural
areas. Female workers earn lower wages than men even in the same occupational division, indicating gender
discrimination across all occupations both in rural and urban areas.
Occupational category CW as % of RW Wages of CW as % of RW
1993-94 2011-12 1993-94 2011-12
Div 1 Legislators, senior officials and managers
7.46 1.72 25.5 18.2
4NSSO provides occupational details at three digit level while the occupational concordance between NCO 68 and NCO 2004 is
provided at five digit level, which makes it difficult to make a meaningful concordance between the two classifications at three
digit level. We have made an attempt to make a concordance at broader occupational divisions using five digit concordance
provided by NSSO which may have some errors and shall not be considered in a stricter sense.
Table 4.15: Wage disparity by industry and labour status (wages in organized casual (OC), unorganized regular (UR) and unorganized casual (UC) as % of OR)
Table 4.16: Percentage of casual workers by occupation

44 ILO DWT for South Asia and Country Office for India
Div 2 Professionals 2.36 1.21 28.8 24.2
Div 3 Technicians and associate professionals
5.62 2.62 30.7 43.7
Div 4 Clerks 1.55 1.43 32.5 35.0
Div 5 Service, shop and market sales workers
18.82 12.14 52.8 60.4
Div 6 Skilled agricultural and fishery workers
86.76 82.98 88.7 62.7
Div 7 Craft and related trades workers 51.91 64.85 51.4 66.0
Div 8 Plant, machine operators and assemblers
26.06 19.59 55.2 69.1
Div 9 Elementary Occupations 91.48 89.53 52.9 70.5
All wage workers 68.7 61.21 30.0 35.4
4.8. Summing up
By carrying out a fresh analysis of data for three rounds of EUS of the NSSO, this chapter has laid down a
framework for formulating certain key issues with regard to the nature of the Indian labour market and the
structure, trends and disparities in wages. Arising out of the dualistic nature of the economy, the wage
labour market accounts for roughly only half of the total employment in the Indian economy, the rest being
characterized by what is officially classified as ‘self-employment’. This is largely, if not only, due to the
preponderance of marginal and small farmer households in the economy. Even if we take the non-
agricultural sector of the economy wage, labour constitutes only around 62 per cent of total employment.
However, we are not in a position to talk about the Indian labour market in the singular. The main dividing
line in terms of the nature of employment, which carries over to wages, is the fundamental divide between
the market for regular work and the market for casual work. The casual labour market largely consists of
people from economically poorer households, with low education as well as low skill levels. The incidence
of such labour is high among what we call socially disadvantaged groups.
Table 4.17: Real wages and wage disparity by gender and occupation
Male (INR per day) Female (INR per day) F wage as % of M)
Occupations 1993-94 2011-12 1993-94 2011-12 1993-94 2011-12
Div 1 306 596 207 534 68 90
Div 2 227 460 190 354 84 77
Div 3 172 313 123 196 72 63
Div 4 157 261 152 232 97 89
Div 5 88 157 56 82 64 52
Div 6 55 90 36 56 65 62
Div 7 91 127 35 71 38 56
Div 8 106 148 44 71 42 38
Div 9 45 85 28 58 62 68
Total 81 152 42 103 52 68
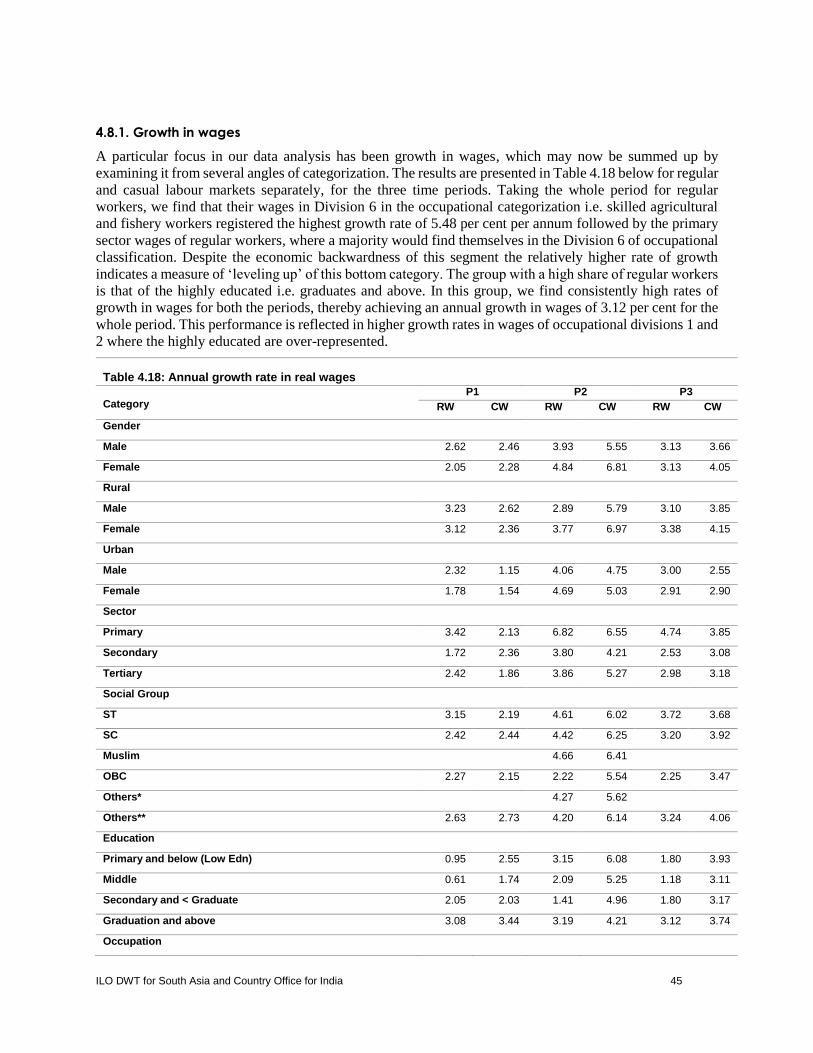
ILO DWT for South Asia and Country Office for India 45
4.8.1. Growth in wages
A particular focus in our data analysis has been growth in wages, which may now be summed up by
examining it from several angles of categorization. The results are presented in Table 4.18 below for regular
and casual labour markets separately, for the three time periods. Taking the whole period for regular
workers, we find that their wages in Division 6 in the occupational categorization i.e. skilled agricultural
and fishery workers registered the highest growth rate of 5.48 per cent per annum followed by the primary
sector wages of regular workers, where a majority would find themselves in the Division 6 of occupational
classification. Despite the economic backwardness of this segment the relatively higher rate of growth
indicates a measure of ‘leveling up’ of this bottom category. The group with a high share of regular workers
is that of the highly educated i.e. graduates and above. In this group, we find consistently high rates of
growth in wages for both the periods, thereby achieving an annual growth in wages of 3.12 per cent for the
whole period. This performance is reflected in higher growth rates in wages of occupational divisions 1 and
2 where the highly educated are over-represented.
Table 4.18: Annual growth rate in real wages
Category
P1 P2 P3
RW CW RW CW RW CW
Gender
Male 2.62 2.46 3.93 5.55 3.13 3.66
Female 2.05 2.28 4.84 6.81 3.13 4.05
Rural
Male 3.23 2.62 2.89 5.79 3.10 3.85
Female 3.12 2.36 3.77 6.97 3.38 4.15
Urban
Male 2.32 1.15 4.06 4.75 3.00 2.55
Female 1.78 1.54 4.69 5.03 2.91 2.90
Sector
Primary 3.42 2.13 6.82 6.55 4.74 3.85
Secondary 1.72 2.36 3.80 4.21 2.53 3.08
Tertiary 2.42 1.86 3.86 5.27 2.98 3.18
Social Group
ST 3.15 2.19 4.61 6.02 3.72 3.68
SC 2.42 2.44 4.42 6.25 3.20 3.92
Muslim 4.66 6.41
OBC 2.27 2.15 2.22 5.54 2.25 3.47
Others* 4.27 5.62
Others** 2.63 2.73 4.20 6.14 3.24 4.06
Education
Primary and below (Low Edn) 0.95 2.55 3.15 6.08 1.80 3.93
Middle 0.61 1.74 2.09 5.25 1.18 3.11
Secondary and < Graduate 2.05 2.03 1.41 4.96 1.80 3.17
Graduation and above 3.08 3.44 3.19 4.21 3.12 3.74
Occupation

46 ILO DWT for South Asia and Country Office for India
Legislators, Sr. Officials and Managers (D1) 4.91 -3.74 1.65 10.43 3.64 1.77
Professionals (D2) 3.66 2.69 3.79 2.85 3.71 2.75
Technicians & Associate Professionals (D3) 2.64 3.13 3.16 7.42 2.84 4.80
Clerks (D4) 3.07 2.88 2.22 3.59 2.74 3.16
Workers in Service, Shops & Markets (D5) 1.84 2.52 4.47 5.32 2.86 3.61
Skilled Agriculture & Fishery Workers (D6) 2.40 3.22 10.31 4.06 5.48 3.55
Workers in Crafts & Related Trades (D7) 0.66 3.29 4.08 3.51 1.99 3.38
Plant and Machine Operators and Assemblers (D8) 1.24 1.91 1.91 4.06 1.50 2.75
Elementary Occupations (D9) 1.48 2.23 3.88 6.79 2.41 4.00
All wage Workers 2.35 2.39 3.98 6.15 2.99 3.85
Growth in Per Capita GDP (at 2004-05 prices) 4.27 6.71 5.22
Growth in the wages of male and female regular workers shows no difference for the whole period.
However, the gender gap that is heavily loaded against women workers is quite significant and continuing.
Geographically speaking, rural wages of regular workers have improved for both men and women,
suggesting a small reduction in the spatial gap but, here again, the disparity is significant.
Casual employment is the largest category of workers among all wage workers in the Indian economy. Of
the total 225 million wage workers in 2011-12, casual workers constituted 61 per cent. But in the non-
agricultural sector, casual work constitutes only 42 per cent of total wage work. Here we should remember
that within the category of regular workers there is a segment of informal workers (without any employment
and/or social security provided by the employer). The best performance here is that of occupational division
3 of technicians and associate professionals. The category that has the second highest growth rate is that of
rural female workers, which we have already noted.
From a sector-wise view of wages, high growth rate in the primary sector has understandably favoured the
low wage workers and this could partly be due to the outflow of surplus labour from this sector to the
secondary and tertiary sectors. In general, the wages of casual workers have grown faster than those of
regular workers for the whole period; however, the wide disparity continues.
Two more observations are perhaps in order at this stage, with regard to growth in real wages and their
macroeconomic context for future policies. One is that in an overwhelming number of categories, growth
in wages during the second period is seen as faster than during the first period. This is especially so for
rural areas, primary sector and socially most disadvantaged groups. This is especially so for casual workers.
Here it would be in order to record several national level state interventions in the form of programmes and
schemes to improve the livelihood security of the rural poor, if not the inequality between the rich and the
poor. These are the National Rural Employment Scheme (NREGS) under the National Rural Employment
Guarantee Act (NREGA), the National Rural Health Mission, the Sarva Shiksha Abhayan (SSA) for
improving the elementary education and the rural housing schemes of the central government (e.g. Indira
Awas Yojana) and schemes by the state governments. All these put together must have helped in raising
the consumption level as well as establishing a measure of social security that could have helped in raising
the reserve price of labour. In addition, the accelerated growth in the economy increased the demand for
labour in the construction sector in urban areas leading to increased migration of labour from the primary
sector of the economy. Therefore, the higher growth rate in the wages of rural casual workers could be
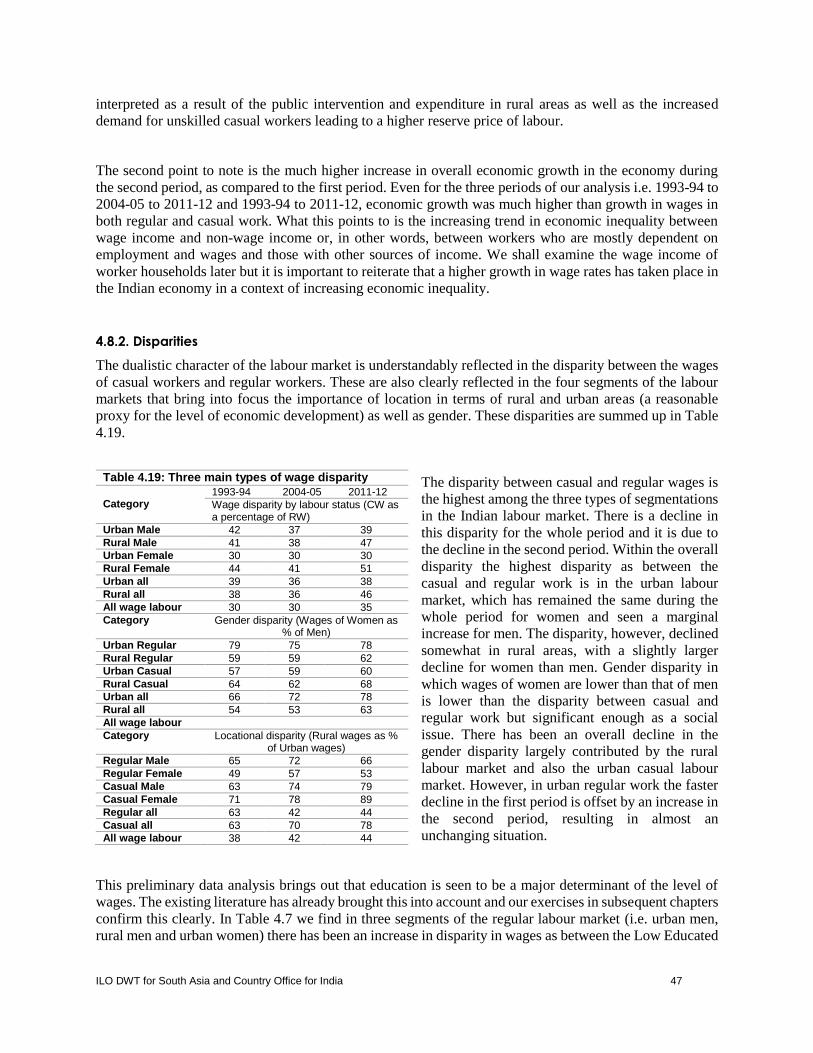
ILO DWT for South Asia and Country Office for India 47
interpreted as a result of the public intervention and expenditure in rural areas as well as the increased
demand for unskilled casual workers leading to a higher reserve price of labour.
The second point to note is the much higher increase in overall economic growth in the economy during
the second period, as compared to the first period. Even for the three periods of our analysis i.e. 1993-94 to
2004-05 to 2011-12 and 1993-94 to 2011-12, economic growth was much higher than growth in wages in
both regular and casual work. What this points to is the increasing trend in economic inequality between
wage income and non-wage income or, in other words, between workers who are mostly dependent on
employment and wages and those with other sources of income. We shall examine the wage income of
worker households later but it is important to reiterate that a higher growth in wage rates has taken place in
the Indian economy in a context of increasing economic inequality.
4.8.2. Disparities
The dualistic character of the labour market is understandably reflected in the disparity between the wages
of casual workers and regular workers. These are also clearly reflected in the four segments of the labour
markets that bring into focus the importance of location in terms of rural and urban areas (a reasonable
proxy for the level of economic development) as well as gender. These disparities are summed up in Table
4.19.
The disparity between casual and regular wages is
the highest among the three types of segmentations
in the Indian labour market. There is a decline in
this disparity for the whole period and it is due to
the decline in the second period. Within the overall
disparity the highest disparity as between the
casual and regular work is in the urban labour
market, which has remained the same during the
whole period for women and seen a marginal
increase for men. The disparity, however, declined
somewhat in rural areas, with a slightly larger
decline for women than men. Gender disparity in
which wages of women are lower than that of men
is lower than the disparity between casual and
regular work but significant enough as a social
issue. There has been an overall decline in the
gender disparity largely contributed by the rural
labour market and also the urban casual labour
market. However, in urban regular work the faster
decline in the first period is offset by an increase in
the second period, resulting in almost an
unchanging situation.
This preliminary data analysis brings out that education is seen to be a major determinant of the level of
wages. The existing literature has already brought this into account and our exercises in subsequent chapters
confirm this clearly. In Table 4.7 we find in three segments of the regular labour market (i.e. urban men,
rural men and urban women) there has been an increase in disparity in wages as between the Low Educated
Table 4.19: Three main types of wage disparity
Category
1993-94 2004-05 2011-12
Wage disparity by labour status (CW as a percentage of RW)
Urban Male 42 37 39
Rural Male 41 38 47
Urban Female 30 30 30
Rural Female 44 41 51
Urban all 39 36 38
Rural all 38 36 46
All wage labour 30 30 35
Category Gender disparity (Wages of Women as % of Men)
Urban Regular 79 75 78
Rural Regular 59 59 62
Urban Casual 57 59 60
Rural Casual 64 62 68
Urban all 66 72 78
Rural all 54 53 63
All wage labour
Category Locational disparity (Rural wages as % of Urban wages)
Regular Male 65 72 66
Regular Female 49 57 53
Casual Male 63 74 79
Casual Female 71 78 89
Regular all 63 42 44
Casual all 63 70 78
All wage labour 38 42 44
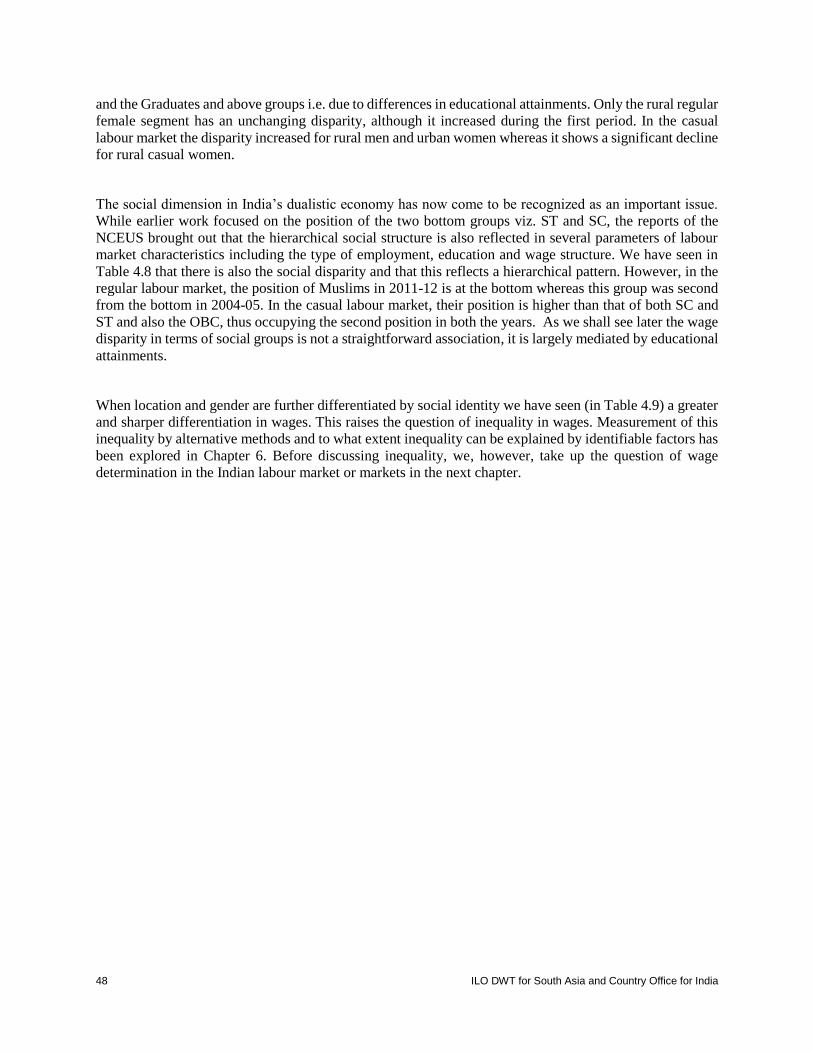
48 ILO DWT for South Asia and Country Office for India
and the Graduates and above groups i.e. due to differences in educational attainments. Only the rural regular
female segment has an unchanging disparity, although it increased during the first period. In the casual
labour market the disparity increased for rural men and urban women whereas it shows a significant decline
for rural casual women.
The social dimension in India’s dualistic economy has now come to be recognized as an important issue.
While earlier work focused on the position of the two bottom groups viz. ST and SC, the reports of the
NCEUS brought out that the hierarchical social structure is also reflected in several parameters of labour
market characteristics including the type of employment, education and wage structure. We have seen in
Table 4.8 that there is also the social disparity and that this reflects a hierarchical pattern. However, in the
regular labour market, the position of Muslims in 2011-12 is at the bottom whereas this group was second
from the bottom in 2004-05. In the casual labour market, their position is higher than that of both SC and
ST and also the OBC, thus occupying the second position in both the years. As we shall see later the wage
disparity in terms of social groups is not a straightforward association, it is largely mediated by educational
attainments.
When location and gender are further differentiated by social identity we have seen (in Table 4.9) a greater
and sharper differentiation in wages. This raises the question of inequality in wages. Measurement of this
inequality by alternative methods and to what extent inequality can be explained by identifiable factors has
been explored in Chapter 6. Before discussing inequality, we, however, take up the question of wage
determination in the Indian labour market or markets in the next chapter.

ILO DWT for South Asia and Country Office for India 49
5. Wage determination and wage income
5.1. Introduction
In Chapter 4 we examined statistics relating to wages in India in terms of daily wage earnings in two types
of employment or labour status, i.e. regular and casual. The descriptive statistics brought into focus the
association of wages with a number of factors; principally in terms of gender, education, location, industry
and occupation. These are valuable in themselves in the sense that they give us an idea of the factors that
are associated with low and high wages. However, these associated factors are not in a position to inform
us about the relative importance of one factor as against another. That calls for a systematic analysis of data
in an inter-related framework or what is called ‘covariant matrix’. A widely used model is the ‘Mincer
earnings function’, which is a single-equation model that explains wage income as a function of education
and experience, named after Jacob Mincer (1958 and 1974). We apply this equation to the Indian labour
markets—regular and casual work—in terms of the four segments of Rural Male, Rural Female, Urban
Male, and Urban Female—by incorporating a number of additional explanatory variables mentioned below.
5.2. Methodology
We used a log of real daily wage as a dependent variable and the covariate matrix included age as proxy
for experience, level of education, social group identity, industry and state dummies to capture the variation
across regions. The construction of variables and descriptive statistics are presented in Appendix Table 5
A1.
A common limitation with this type of wage equation is that it does not account for what is called ‘selection
bias’. This arises because the wage equation is applied to a sample set of currently employed men and
women whose participation in the labour market is not random. This is because we do not have the
(expected) wage data of those who are not currently participating in the wage labour market. It is reasonable
to hypothesize that the wage rates of those who are employed are higher than what it would have been had
those who are currently not in the labour market been employed. The reason for the current non-
participation of some of those in the working age group could be due to several factors such as their high
reserve price or factors leading to lack of motivation. The exclusion of such persons leads to the omission
of such unobservable factors.
Since these unobserved variables are likely to be correlated with some of the observed factors in the wage
equation, there is a risk that the estimated coefficients will be biased either upwards or downwards.
In order to overcome this kind of sample selection bias5 we used the two steps in the Heckman selection
model (Heckman, 1979). Under this model, the first step involves the estimation of selection equation with
the participation decision as a dependent variable and the second step involves the estimation of wage
5 An argument has been made in the literature that working women are not a randomly selected sample of all females in the
population. This is the familiar ‘selectivity bias’ problem. Heckman (1979) developed a solution to this problem; this solution
variable (Inverse Mill’s ratio) added as an additional explanatory variable in the earnings function.
50 ILO DWT for South Asia and Country Office for India
equation, conditional on employment. In the selection model, we calculated inverse Mills ratio6 using the
predicted probability of participation in labour force that is included in the standard wage equation of the
second stage to correct the selection bias.
Identification of the selection equation requires the inclusion of variables (at least one) in the selection
equation, which are (is) not included in the wage equation. If it happens that the variables in the wage
equation and the selection are the same, it usually results in the collinearity between the predicted inverse
Mills ratio and the determinant variable of the wage equation. So we need one variable that affects the
participation choice and not the wages. The most appropriate identifying variable suggested by theory is
the non-labour income of individual or household. In the absence of such variable, we used number of
dependents including children 0-4 years, 5-8 years and 9-14 years of age and number of elderly members
in the household greater than 60 years of age which are commonly used in the literature. These variables
are assumed to affect the probability of participation in labour force, but not to affect wage determination.
It is reasonable to assume that the number of dependents in a household is unlikely to affect the wage rate
in the Indian labour markets.
5.3. Results from wage regression
The results of the selectivity corrected wage regression for the two distinct labour markets are presented in
Table 5.A1.7 As mentioned in the beginning we had selected several explanatory variables from the
descriptive statistics that influence the determination of wages. To help with interpretation of the results,
we present in Tables 5.1 and 5.2 a summary of what they mean so as to make some economic sense out of
this econometric exercise. The results are to be interpreted in terms of a wage advantage or disadvantage
or a neutral situation in relation to a reference group for each of the variable. The letter ‘A’ signifies a wage
advantage to the concerned group; letter ‘D’ refers to a wage disadvantage; whereas ‘NS’ means the
statistical regression coefficient is not significant, which means there exists neither a wage advantage nor a
disadvantage to the group concerned. Where there are no markings with a star (*) it means the results are
robust at 1% level of confidence; where there is a double star (**) it means 5% level of confidence; and
one star (*) means a 10% level of confidence. Figures in brackets indicate the percentage advantage or
disadvantage as the case may be.
6 Named after John P. Mills, it is the ratio of the probability density function over the cumulative distribution function of a
distribution. 7 The sample selection bias as shown by Lambda (λ) in Appendix 1, table 1 has a statistically significant negative coefficient for
urban males in the regular worker category and rural males and urban males in the casual worker category. This implies that the
expected wages of selected men in respective employment is lower than that of the men selected at random from the population
given similar characteristics. Lambda shows a positive coefficient for urban females in regular work which implies that the women
who select urban regular work secure higher wages than a woman drawn at random from the population. Care must be taken while
interpreting the results since the coefficient is weakly significant at 10% level of significance. Lambda shows a statistically
insignificant coefficient for all other groups such as rural male and female workers in the regular wage category and rural and urban
females in casual wage category. This implies that the workers in these groups earn no more than what would have been expected
if drawn at random from population.

ILO DWT for South Asia and Country Office for India 51
5.4. Results for the regular labour market
Age: We first discuss the market for regular work. This first variable is a proxy for experience and it bestows
some wage advantage upon all four groups of workers. Every one year of age means a wage advantage of
0.1 percent increase for rural men, while for the other three groups it commands a 0.2 percent increase.
Education: Levels of education play an important role in the wages of regular workers, as we have noted.
The estimated rate of return to achievement in education increases. Wage workers in the urban sample
experience higher returns at the same level of education in comparison with their counterparts in rural areas.
This may be interpreted as an urban location offering a distinct advantage over a rural location. Moreover,
it is interesting to note that the returns to education are higher among female wage workers in rural areas
than that of their male counterparts across all levels of education. What this result conveys is that educated
women workers have a distinct advantage over the least educated group among the women. This does not
refer to the disparity between the wages of men and women in several categories. In urban areas, regular
men workers enjoy a higher premium with higher levels of education. But in general, the educational
premium in the urban labour market is significantly higher than that of those in rural areas for men. This
could be due to the diversified nature of job opportunities in urban areas.
The higher returns to women’s education in rural areas compared to rural men and close to that of men in
urban areas along with lower female labour force participation give an indication that there is an
underinvestment in female education in India. The higher returns to educated women would strengthen the
argument for greater investment in the education of women which will, inter alia, also facilitate the
generation of positive social and economic externalities.
Social group identity: Here we have categorized workers into five socio-religious groups that are found to
experience hierarchical inequality (sometimes referred to as ‘graded inequality’) in the Indian society. The
results seem to be group-specific. Since the regular labour market is one wherein affirmative action — in
terms of reservation of government and public sector jobs for socially disadvantaged groups — operates,
the results have to be interpreted with this factor in mind. Among the ST workers there seems to be an
advantage for rural women, but only at 5% level of confidence. For the other groups, the results do not
show any wage advantage or disadvantage. Here we need to keep in mind that access to regular job is the
lowest for the ST group (see Table 4.10). For SC workers, there is wage disadvantage in all four segments
although the results for rural women and urban men are valid only at 5% and 10% levels of confidence
respectively. OBC workers also exhibit a wage disadvantage except for rural men. For Muslim workers,
the wage disadvantage is confined to urban women only.
The descriptive statistics showed much sharper variations in wages across social groups than the results
obtained in the wage equation. We should note here that while social group identity has some association
with wage disadvantage, it usually works through the educational factor. The question then shifts to the
ability to secure higher levels of education by the socially disadvantaged group. This could be due to
economic poverty along with other social barriers. Access to education then leads to the next stage of access
to jobs where the socially disadvantaged often encounter what may be called discrimination. As there are
two kinds of barriers, it is instructive to examine the statistics relating to access to education in terms of
educational achievements and access to quality jobs in terms of the broad categorization of regular and
casual.

52 ILO DWT for South Asia and Country Office for India
Regular wage workers Casual wage workers
Variables Rural male
Rural female
Urban male
Urban female
Rural male
Rural female
Urban male
Urban female
Age A(0.1) A (0.2) A(0.2) A (0.2) A(0.1) NS A(0.1) NS
Education levels
Middle A (2.0) A (6.0) A* (8.1) A (7.2) NS NS NS NS
Secondary A (1.7) A (5.0) A (7.2) A (6.3) A(2.1) NS A*(3.4) NS
Graduate & above A(1.9) A (5.9) A (7.5) A (6.9) A(6.5) NS NS A (13.3)
Socio-religious category [Reference group: Others]
ST NS A**(5.7) NS NS D(2.8) NS NS D*(5.7)
SC D(1.8) D*(5.0) D**(7.3) D (5.7) NS A(2.2) NS NS
OBC NS D(4.3) D**(6.0) D 4.9) NS A*(2.2) NS NS
Muslim
A* (0.022)
A* (0.066)
NS D (0.068)
NS NS NS D** (0.058)
Industry [Reference Group: Public administration and defence]
Agriculture and allied D(3.5) NS D*(24.0) D(19.3) D (0.225)
D* (0.182)
NS D** (0.185)
Mining and quarrying A (0.058)
A* (0.325)
A* (0.192)
NS D* (0.232)
NS A* (0.224)
D** (0.216)
Manufacturing D (0.022)
NS D (0.082)
D (0.084)
D** (0.226)
D** (0.183)
NS D (0.185)
Electricity, gas and water NS A(0.175) NS NS NS NS NS D** (0.274)
Construction
D NS D*(14.6) NS D*(22.5) NS A**(20.1) NS
Trade
D (0.027)
D (0.113)
D (0.090)
D (0.099)
D (0.231)
D (0.213)
NS D (0.194)
Hotels and restaurants D (0.048)
NS D (0.142)
D (0.152)
D** (0.242)
NS NS D* (0.216)
Transport, storage and communication
D (0.021)
A** (0.134)
D** (0.085)
NS D** (0.227)
NS NS D (0.241)
Banking and finance D (0.038)
NS NS NS D* (0.389)
NS NS NS
Real Estate and business services
D (0.039)
NS D (0.118)
D (0.108)
D** (0.257)
NS NS NS
Education
NS D* (0.057)
D (0.088)
D (0.064)
D *(0.370)
D* (0.205)
NS D* (0.295)
Health and social work NS NS NS D (0.077)
D** (0.262)
D** (0.223)
NS NS
Other community and, social and personal services
D (0.048)
D (0.118)
D (0.187)
D (0.095)
D (0.240)
D (0.191)
NS D (0.190)
Private households D (0.076)
D (0.098)
D (0.196)
D (0.083)
D** (0.238)
D (0.190)
NS D (0.188)
Economic sector: The type of industry is the next variable that would represent the demand side as well as
the productivity differences. Here we have taken Public Administration i.e. a job in government/public
sector service, as the reference group. The overall picture is one wherein a regular employment in Public
Table 5.1. Selectivity corrected wage equation for Regular and Casual Workers (2012): Summary of results

ILO DWT for South Asia and Country Office for India 53
Administration emerges as the one with a greater wage advantage than most, if not all, industrial groups.
The groups that show an unambiguous advantage (at 1% level of confidence) are mining and quarrying for
rural workers and electricity-gas-water supply for rural women. These two are largely in the domain of
public sector enterprises. Transport, storage and communication show some advantage (at 5% level of
confidence) for rural women. The industries that show a distinct disadvantage for all four groups of workers
(wherein the percentage of disadvantage is quite high) are trade, health and social work and other
community services and private households where domestic workers are employed. In agriculture, the
disadvantage is quite high but for rural women the results neither show an advantage nor disadvantage.
Manufacturing also shows wage disadvantage except for in the case of rural women. This could be due to
the fact that employment of rural women in Public Administration is a small share of their total employment
with low wages as in the case of teachers in ICDS centres (anganawadis), rural health schemes or as
cleaners in government offices. For construction workers, the results show a clear disadvantage for rural
men and urban men but in a weak sense (10% level of confidence). For reasons cited earlier, there is neither
advantage nor disadvantage for women in both rural and urban areas. For banking and finance, rural men
report a disadvantage whereas women do not show any significant result. Urban men are on par with Public
Administration. Workers in real estate are at a disadvantage compared to their counterparts in Public
Administration — except for rural women. Except for rural men, those in education are also at a
disadvantage compared to their counterparts in public administration. Most of the NS results are for women
and they reinforce our explanation that the average quality of employment for women in the Public
Administration might be more in the nature of low-paying jobs.
Regional factor: The regional variation in wages is measured by using state dummy in the wage regression.
We have used Gujarat as a reference category. Most of the regional dummy coefficients are positive and
significant among male and female workers both in rural as well as in urban areas. What this means is that
a majority of states show significantly higher wages than Gujarat for most categories of workers. In such
states, the categories which do not show a wage advantage over Gujarat show NS results, meaning that in
net terms they show a wage advantage over Gujarat. That is to say there is at least one segment with a wage
advantage and no segment with a wage disadvantage viz-a-viz Gujarat. As shown in Table 5.2, there are 16
such states (out of the 23 taken here) and Union Territories combined. There are 7 states wherein one or
two segments show a wage disadvantage compared to Gujarat; in the remaining segments the results are
not statistically significant. Out of these 7, five belong to the group with low economic and human
development indicators; the remaining two — undivided Andhra Pradesh and Karnataka — are middling
states with a reasonable record in both.
Wage advantage in relation to Gujarat - regular Neither wage advantage or disadvantage
Jammu & Kashmir: Rural Male RF, UM and UF
Himachal Pradesh: Rural Male RF, UM and UF
Punjab: Rural Male* RF, UM and UF
Uttarakhand: Rural Male RF, UM and UF
Haryana: Rural Male, Urban Male*, Urban Female RF
Sikkim: Rural Male and Rural Female, Urban Female UM
Arunachal: Rural Male and Rural F, UF UM
Nagaland: Rural Male, Rural Female** UM and UF
Manipur: Rural Male, Rural Female** UM and UF
Mizoram: Rural Male, Rural Female**, Urban Female UM
Tripura: Nil All four segments
Meghalaya: Rural Male**, Rural Female** UM and UF
Assam: Nil All four segments
Goa: Rural Male, Rural Female*, Urban Female UM
Kerala: Rural Male RF, UM and UF
Tamil Nadu: Rural Female** RM, UM and UF
Union Territories: All four segments (Urban Male*) Nil
Table 5.2: Regional factor in wage determination: [Reference group: Gujarat] Summary of results for regular work, 2011-12
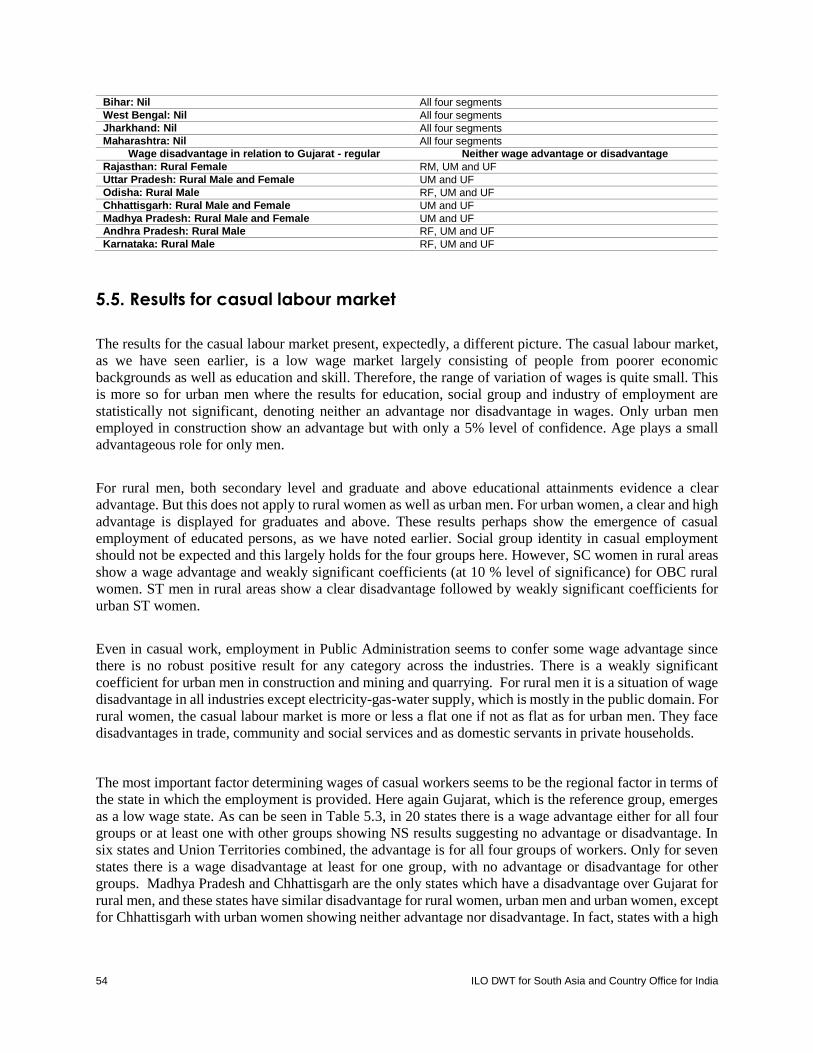
54 ILO DWT for South Asia and Country Office for India
Bihar: Nil All four segments
West Bengal: Nil All four segments
Jharkhand: Nil All four segments
Maharashtra: Nil All four segments
Wage disadvantage in relation to Gujarat - regular Neither wage advantage or disadvantage
Rajasthan: Rural Female RM, UM and UF
Uttar Pradesh: Rural Male and Female UM and UF
Odisha: Rural Male RF, UM and UF
Chhattisgarh: Rural Male and Female UM and UF
Madhya Pradesh: Rural Male and Female UM and UF
Andhra Pradesh: Rural Male RF, UM and UF
Karnataka: Rural Male RF, UM and UF
5.5. Results for casual labour market
The results for the casual labour market present, expectedly, a different picture. The casual labour market,
as we have seen earlier, is a low wage market largely consisting of people from poorer economic
backgrounds as well as education and skill. Therefore, the range of variation of wages is quite small. This
is more so for urban men where the results for education, social group and industry of employment are
statistically not significant, denoting neither an advantage nor disadvantage in wages. Only urban men
employed in construction show an advantage but with only a 5% level of confidence. Age plays a small
advantageous role for only men.
For rural men, both secondary level and graduate and above educational attainments evidence a clear
advantage. But this does not apply to rural women as well as urban men. For urban women, a clear and high
advantage is displayed for graduates and above. These results perhaps show the emergence of casual
employment of educated persons, as we have noted earlier. Social group identity in casual employment
should not be expected and this largely holds for the four groups here. However, SC women in rural areas
show a wage advantage and weakly significant coefficients (at 10 % level of significance) for OBC rural
women. ST men in rural areas show a clear disadvantage followed by weakly significant coefficients for
urban ST women.
Even in casual work, employment in Public Administration seems to confer some wage advantage since
there is no robust positive result for any category across the industries. There is a weakly significant
coefficient for urban men in construction and mining and quarrying. For rural men it is a situation of wage
disadvantage in all industries except electricity-gas-water supply, which is mostly in the public domain. For
rural women, the casual labour market is more or less a flat one if not as flat as for urban men. They face
disadvantages in trade, community and social services and as domestic servants in private households.
The most important factor determining wages of casual workers seems to be the regional factor in terms of
the state in which the employment is provided. Here again Gujarat, which is the reference group, emerges
as a low wage state. As can be seen in Table 5.3, in 20 states there is a wage advantage either for all four
groups or at least one with other groups showing NS results suggesting no advantage or disadvantage. In
six states and Union Territories combined, the advantage is for all four groups of workers. Only for seven
states there is a wage disadvantage at least for one group, with no advantage or disadvantage for other
groups. Madhya Pradesh and Chhattisgarh are the only states which have a disadvantage over Gujarat for
rural men, and these states have similar disadvantage for rural women, urban men and urban women, except
for Chhattisgarh with urban women showing neither advantage nor disadvantage. In fact, states with a high
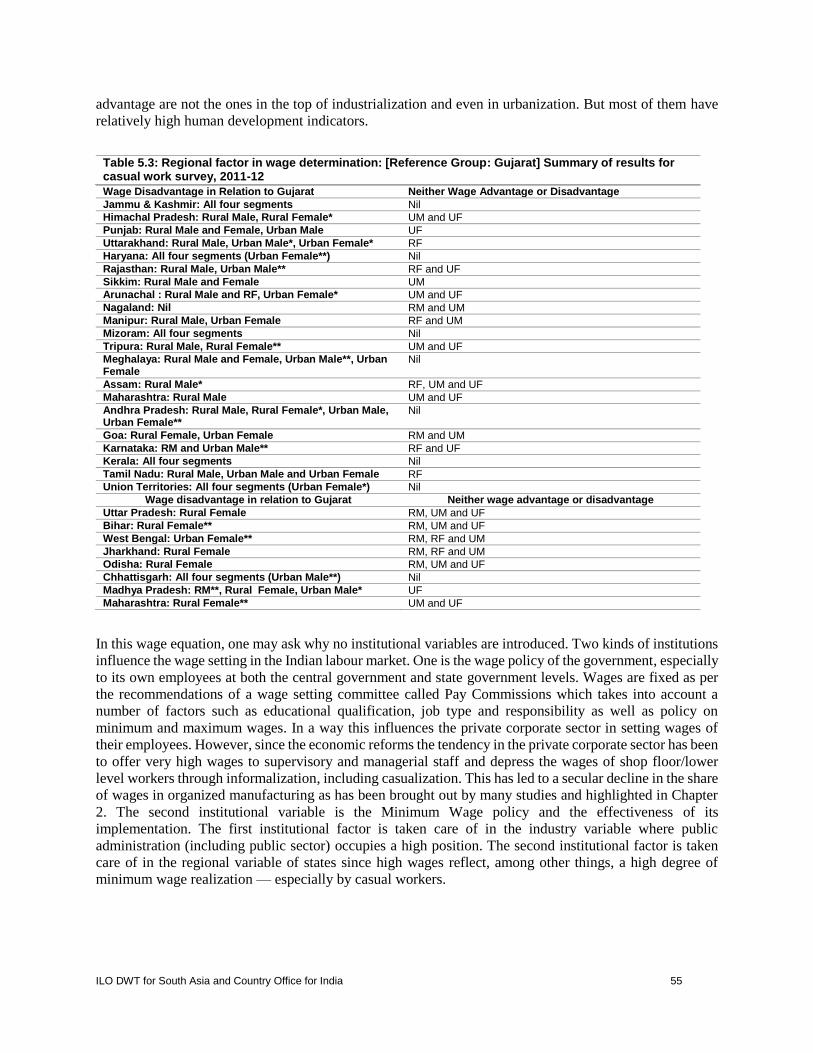
ILO DWT for South Asia and Country Office for India 55
advantage are not the ones in the top of industrialization and even in urbanization. But most of them have
relatively high human development indicators.
Wage Disadvantage in Relation to Gujarat Neither Wage Advantage or Disadvantage
Jammu & Kashmir: All four segments Nil
Himachal Pradesh: Rural Male, Rural Female* UM and UF
Punjab: Rural Male and Female, Urban Male UF
Uttarakhand: Rural Male, Urban Male*, Urban Female* RF
Haryana: All four segments (Urban Female**) Nil
Rajasthan: Rural Male, Urban Male** RF and UF
Sikkim: Rural Male and Female UM
Arunachal : Rural Male and RF, Urban Female* UM and UF
Nagaland: Nil RM and UM
Manipur: Rural Male, Urban Female RF and UM
Mizoram: All four segments Nil
Tripura: Rural Male, Rural Female** UM and UF
Meghalaya: Rural Male and Female, Urban Male**, Urban Female
Nil
Assam: Rural Male* RF, UM and UF
Maharashtra: Rural Male UM and UF
Andhra Pradesh: Rural Male, Rural Female*, Urban Male, Urban Female**
Nil
Goa: Rural Female, Urban Female RM and UM
Karnataka: RM and Urban Male** RF and UF
Kerala: All four segments Nil
Tamil Nadu: Rural Male, Urban Male and Urban Female RF
Union Territories: All four segments (Urban Female*) Nil
Wage disadvantage in relation to Gujarat Neither wage advantage or disadvantage
Uttar Pradesh: Rural Female RM, UM and UF
Bihar: Rural Female** RM, UM and UF
West Bengal: Urban Female** RM, RF and UM
Jharkhand: Rural Female RM, RF and UM
Odisha: Rural Female RM, UM and UF
Chhattisgarh: All four segments (Urban Male**) Nil
Madhya Pradesh: RM**, Rural Female, Urban Male* UF
Maharashtra: Rural Female** UM and UF
In this wage equation, one may ask why no institutional variables are introduced. Two kinds of institutions
influence the wage setting in the Indian labour market. One is the wage policy of the government, especially
to its own employees at both the central government and state government levels. Wages are fixed as per
the recommendations of a wage setting committee called Pay Commissions which takes into account a
number of factors such as educational qualification, job type and responsibility as well as policy on
minimum and maximum wages. In a way this influences the private corporate sector in setting wages of
their employees. However, since the economic reforms the tendency in the private corporate sector has been
to offer very high wages to supervisory and managerial staff and depress the wages of shop floor/lower
level workers through informalization, including casualization. This has led to a secular decline in the share
of wages in organized manufacturing as has been brought out by many studies and highlighted in Chapter
2. The second institutional variable is the Minimum Wage policy and the effectiveness of its
implementation. The first institutional factor is taken care of in the industry variable where public
administration (including public sector) occupies a high position. The second institutional factor is taken
care of in the regional variable of states since high wages reflect, among other things, a high degree of
minimum wage realization — especially by casual workers.
Table 5.3: Regional factor in wage determination: [Reference Group: Gujarat] Summary of results for casual work survey, 2011-12

56 ILO DWT for South Asia and Country Office for India
5.6. Wage income as a share of household Income
For a large majority of households without adequate assets, wage income would constitute the principal
source of household income. A pertinent question in this context is: How do wages of workers stand in
comparison to certain other indicators of income? Here the challenge is to calculate the wage income of
households and compare it with other variables such as per capita national income or income required to
cross the poverty line. To calculate wage income of a household we need to know the average number of
workers per household, its composition in terms of casual and regular status, the wage rates for these two
groups and the number of days of work in a given year. The wage income may then be calculated using the
following formula:
Yw = [(Rn x Rd x Rw) + (Cn x Cd x Cw)]
Where Yw stands for the annual wage income of a household;
Rn stands for the average number of regular workers in a household;
Rd stands for the number of paid days in a year;
Rw stands for the money wage rate in the given year.
Similarly Cn, Cd and Cw stand for the above variables for casual workers.
In order to find out the proportions of regular and casual workers in a wage labour household, we first
identified such households as ‘Regular wage households’ and ‘Casual wage households’ by using the
majority criterion i.e. if more than 50 per cent of the working members are in the regular category such a
household was classified as ‘Regular wage household’. Then the proportions of regular and casual wage
workers were recorded to calculate Rn and Cn. Rw and Cw were calculated from the wage data. For
employment, we assumed that regular wage workers were being paid on a monthly basis including holidays
and therefore the total was taken as 365. For casual workers, we assumed an average work-day of five per
week or 260 days per year. This is somewhat less than full employment days and excludes days not paid
since they are ‘casual’ in labour status.
The wage incomes for the urban and rural households for the two labour status groups are presented in
Table 5.4. Of course, these are average income for the respective groups and therefore would not show the
wage income of highly paid employees such as professionals and managers and administrators. However,
given the very low wages of rural casual labour (who incidentally are either asset-poor or asset-less and
dependent overwhelmingly on wage income) we are in a position to gauge their income in relation to the
national income. Per household GDP is calculated by multiplying per capita income in 2011-12 with that
of the household size. As per the Population Census of 2011, the average household size in India was 4.9.
As such we find the per household GDP was Rs. 342,087 in 2011-12.
So, we can say that wage earners, particularly the casual workers, are highly disadvantageously placed vis-
à-vis those depending on non-wage income, in both rural and urban areas, but more particularly in rural
areas. Take the situation in 2011-12. With the major share of income coming from casual employment,
which is less than one-fifth of the per capita national income for rural casual labour households and about
30 per cent for urban casual labour households, these households are vulnerable to economic shocks and
may find it difficult to achieve and sustain a decent standard of living. Even for rural regular labour
households, wage income is only two-fifths of per household GDP. Increasing casualization and
informalization of employment despite the continuing relatively high growth of incomes are likely to further
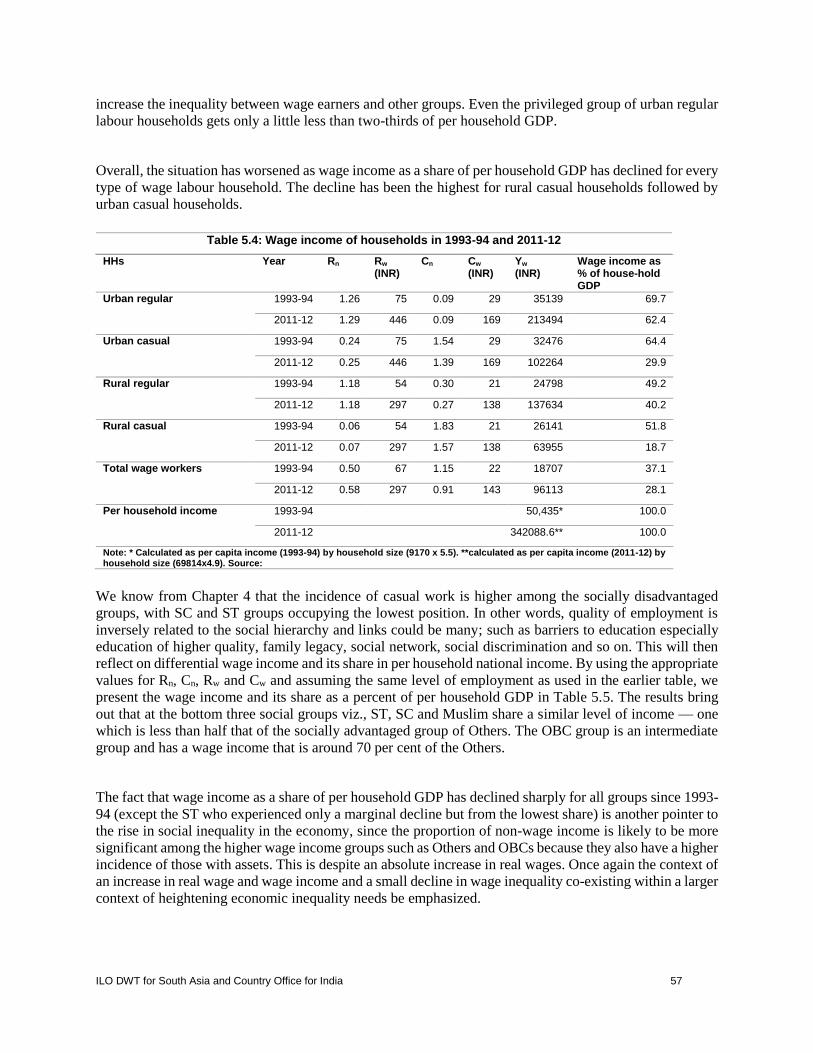
ILO DWT for South Asia and Country Office for India 57
increase the inequality between wage earners and other groups. Even the privileged group of urban regular
labour households gets only a little less than two-thirds of per household GDP.
Overall, the situation has worsened as wage income as a share of per household GDP has declined for every
type of wage labour household. The decline has been the highest for rural casual households followed by
urban casual households.
HHs Year Rn Rw (INR)
Cn Cw
(INR)
Yw
(INR) Wage income as % of house-hold GDP
Urban regular 1993-94 1.26 75 0.09 29 35139 69.7
2011-12 1.29 446 0.09 169 213494 62.4
Urban casual 1993-94 0.24 75 1.54 29 32476 64.4
2011-12 0.25 446 1.39 169 102264 29.9
Rural regular 1993-94 1.18 54 0.30 21 24798 49.2
2011-12 1.18 297 0.27 138 137634 40.2
Rural casual 1993-94 0.06 54 1.83 21 26141 51.8
2011-12 0.07 297 1.57 138 63955 18.7
Total wage workers 1993-94 0.50 67 1.15 22 18707 37.1
2011-12 0.58 297 0.91 143 96113 28.1
Per household income 1993-94 50,435* 100.0
2011-12 342088.6** 100.0
Note: * Calculated as per capita income (1993-94) by household size (9170 x 5.5). **calculated as per capita income (2011-12) by household size (69814x4.9). Source:
We know from Chapter 4 that the incidence of casual work is higher among the socially disadvantaged
groups, with SC and ST groups occupying the lowest position. In other words, quality of employment is
inversely related to the social hierarchy and links could be many; such as barriers to education especially
education of higher quality, family legacy, social network, social discrimination and so on. This will then
reflect on differential wage income and its share in per household national income. By using the appropriate
values for Rn, Cn, Rw and Cw and assuming the same level of employment as used in the earlier table, we
present the wage income and its share as a percent of per household GDP in Table 5.5. The results bring
out that at the bottom three social groups viz., ST, SC and Muslim share a similar level of income — one
which is less than half that of the socially advantaged group of Others. The OBC group is an intermediate
group and has a wage income that is around 70 per cent of the Others.
The fact that wage income as a share of per household GDP has declined sharply for all groups since 1993-
94 (except the ST who experienced only a marginal decline but from the lowest share) is another pointer to
the rise in social inequality in the economy, since the proportion of non-wage income is likely to be more
significant among the higher wage income groups such as Others and OBCs because they also have a higher
incidence of those with assets. This is despite an absolute increase in real wages. Once again the context of
an increase in real wage and wage income and a small decline in wage inequality co-existing within a larger
context of heightening economic inequality needs be emphasized.
Table 5.4: Wage income of households in 1993-94 and 2011-12
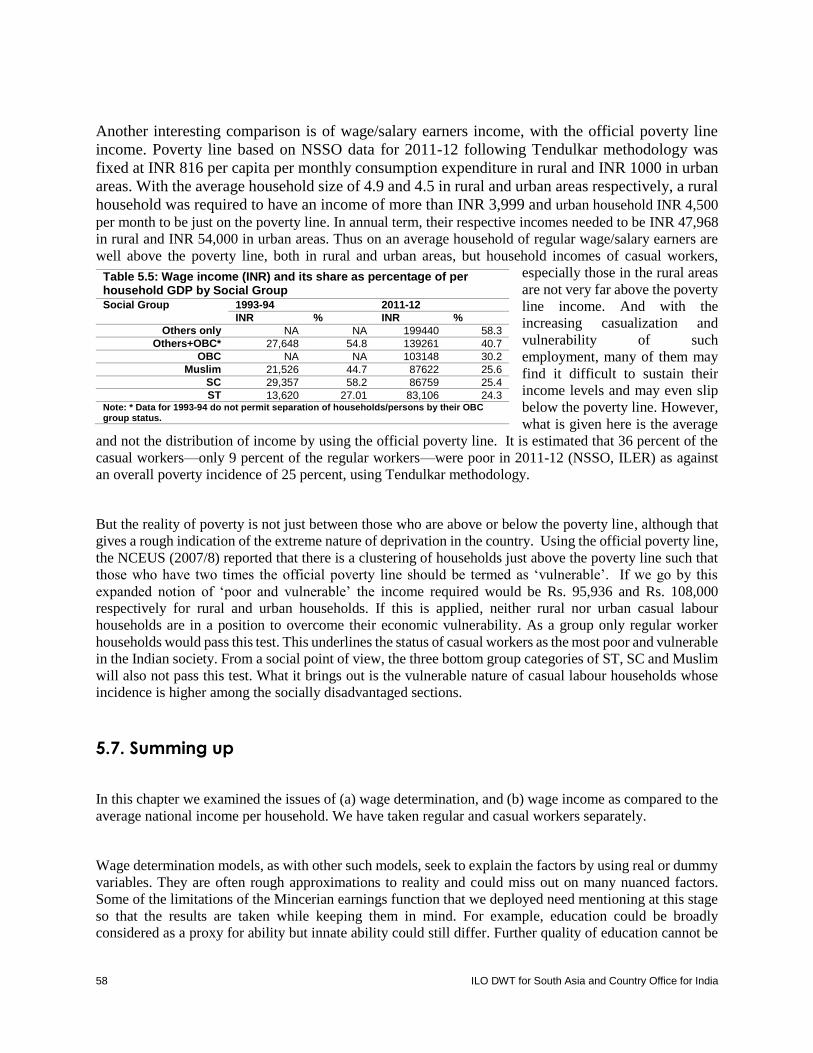
58 ILO DWT for South Asia and Country Office for India
Another interesting comparison is of wage/salary earners income, with the official poverty line
income. Poverty line based on NSSO data for 2011-12 following Tendulkar methodology was
fixed at INR 816 per capita per monthly consumption expenditure in rural and INR 1000 in urban
areas. With the average household size of 4.9 and 4.5 in rural and urban areas respectively, a rural
household was required to have an income of more than INR 3,999 and urban household INR 4,500
per month to be just on the poverty line. In annual term, their respective incomes needed to be INR 47,968
in rural and INR 54,000 in urban areas. Thus on an average household of regular wage/salary earners are
well above the poverty line, both in rural and urban areas, but household incomes of casual workers,
especially those in the rural areas
are not very far above the poverty
line income. And with the
increasing casualization and
vulnerability of such
employment, many of them may
find it difficult to sustain their
income levels and may even slip
below the poverty line. However,
what is given here is the average
and not the distribution of income by using the official poverty line. It is estimated that 36 percent of the
casual workers—only 9 percent of the regular workers—were poor in 2011-12 (NSSO, ILER) as against
an overall poverty incidence of 25 percent, using Tendulkar methodology.
But the reality of poverty is not just between those who are above or below the poverty line, although that
gives a rough indication of the extreme nature of deprivation in the country. Using the official poverty line,
the NCEUS (2007/8) reported that there is a clustering of households just above the poverty line such that
those who have two times the official poverty line should be termed as ‘vulnerable’. If we go by this
expanded notion of ‘poor and vulnerable’ the income required would be Rs. 95,936 and Rs. 108,000
respectively for rural and urban households. If this is applied, neither rural nor urban casual labour
households are in a position to overcome their economic vulnerability. As a group only regular worker
households would pass this test. This underlines the status of casual workers as the most poor and vulnerable
in the Indian society. From a social point of view, the three bottom group categories of ST, SC and Muslim
will also not pass this test. What it brings out is the vulnerable nature of casual labour households whose
incidence is higher among the socially disadvantaged sections.
5.7. Summing up
In this chapter we examined the issues of (a) wage determination, and (b) wage income as compared to the
average national income per household. We have taken regular and casual workers separately.
Wage determination models, as with other such models, seek to explain the factors by using real or dummy
variables. They are often rough approximations to reality and could miss out on many nuanced factors.
Some of the limitations of the Mincerian earnings function that we deployed need mentioning at this stage
so that the results are taken while keeping them in mind. For example, education could be broadly
considered as a proxy for ability but innate ability could still differ. Further quality of education cannot be
Table 5.5: Wage income (INR) and its share as percentage of per household GDP by Social Group
Social Group 1993-94 2011-12
INR % INR %
Others only NA NA 199440 58.3
Others+OBC* 27,648 54.8 139261 40.7
OBC NA NA 103148 30.2
Muslim 21,526 44.7 87622 25.6
SC 29,357 58.2 86759 25.4
ST 13,620 27.01 83,106 24.3 Note: * Data for 1993-94 do not permit separation of households/persons by their OBC group status.
ILO DWT for South Asia and Country Office for India 59
captured by taking levels of education. Another limitation is the exclusion of the non-wage employed (i.e.
self-employed) because we do not have data on their earnings. This could also lead to some bias in the
return to education. We would therefore urge that the results in the wage equation should be read along
with the descriptive statistics presented in Chapter 4.
Wage determination exercises indeed bring out the importance of education. This is more so for women
than men. The regional variable brings out important lessons in that urbanization and industrialization per
se in a region need not result in wage advantage than other areas. This is an area of inquiry that needs to
be pursued further by scholars and others interested. From a logical point of view this calls for strong
enforcement of minimum wages since workers in the casual labour category constitute the majority in all
regions among the universe wage workers. Equally important could be the role of collective bargaining,
especially for regular workers in the organized sector. The regional state also represents the overall level of
economic development and that seems to come out clearly in the case of states with wage disadvantage
compared to Gujarat.
The analysis of wage income as a share of national income per household brings out the increasing
importance of non-wage income. The fact that wage income share has declined also points to the increasing
economic inequality, thus adversely affecting the casual worker households the most. In that sense there
could be a sense of greater relative deprivation.

60 ILO DWT for South Asia and Country Office for India
Appendix to Chapter 5
Regular wage workers Casual wage workers
Variables Rural male Rural female Urban male Urban female
Rural male Rural female Urban male Urban female
Age 0.025*** 0.024*** 0.021*** 0.026*** 0.002*** -0.000 0.004*** 0.000
(0.001) (0.002) (0.002) (0.002) (0.001) (0.001) (0.001) (0.001)
Education levels [Reference group: Low educated]
Middle 0.152*** 0.214*** 0.147* 0.228*** 0.017 0.004 0.030 -0.001
(0.020) (0.060) (0.081) (0.072) (0.017) (0.019) (0.029) (0.045)
Secondary 0.451*** 0.751*** 0.468*** 0.769*** 0.044** -0.024 0.063* 0.004
(0.017) (0.050) (0.072) (0.063) (0.021) (0.026) (0.034) (0.054)
Graduate and above
0.733*** 1.327*** 0.962*** 1.267*** 0.124* -0.108 0.080 0.373***
(0.019) (0.059) (0.075) (0.069) (0.065) (0.107) (0.092) (0.133)
Socio-religious category [Reference group: Socially advantaged group of ‘Others’]
ST -0.028 0.137** -0.077 -0.054 -0.082*** -0.016 -0.065 -0.097*
(0.021) (0.057) (0.112) (0.088) (0.028) (0.024) (0.060) (0.057)
SC -0.054*** -0.096* -0.164** -0.178*** -0.000 0.067*** -0.041 -0.024
(0.018) (0.050) (0.073) (0.057) (0.024) (0.022) (0.040) (0.048)
OBC -0.025 -0.113*** -0.148** -0.214*** 0.009 0.036* -0.036 -0.038
(0.016) (0.043) (0.060) (0.049) (0.024) (0.022) (0.040) (0.045)
Muslim 0.037* 0.118* -0.120 -0.196*** 0.041 0.020 -0.061 -0.123**
(0.022) (0.066) (0.081) (0.068) (0.027) (0.030) (0.042) (0.058)
Industry [Reference group: Public administration and defence]
Agriculture and allied
-0.456*** 0.006 -0.397* -0.540*** -0.640*** -0.328* 0.201 -0.436**
(0.035) (0.098) (0.240) (0.193) (0.225) (0.182) (0.204) (0.185)
Mining and quarrying
0.336*** 0.563* 0.329* 0.247 -0.413* -0.017 0.390* -0.499**
(0.058) (0.325) (0.192) (0.330) (0.232) (0.193) (0.224) (0.216)
Manufacturing -0.397*** 0.006 -0.382*** -0.543*** -0.487** -0.403** 0.257 -0.610***
(0.022) (0.080) (0.082) (0.084) (0.226) (0.183) (0.202) (0.185)
Electricity, gas and water
0.020 0.814*** 0.026 -0.086 -0.411 -0.018 0.330 -0.638**
(0.033) (0.175) (0.146) (0.141) (0.279) (0.410) (0.282) (0.274)
Construction -0.247*** 0.222 -0.248* -0.122 -0.403* -0.119 0.453** -0.088
(0.035) (0.185) (0.146) (0.184) (0.225) (0.183) (0.201) (0.184)
Trade -0.648*** -0.252** -0.699*** -0.687*** -0.564** -0.454** 0.181 -0.709***
(0.027) (0.113) (0.090) (0.099) (0.231) (0.213) (0.205) (0.194)
Hotels and restaurants
-0.458*** -0.231 -0.522*** -0.455*** -0.571** -0.256 0.299 -0.409*
(0.048) (0.144) (0.142) (0.152) (0.242) (0.235) (0.215) (0.216)
Transportation, storage and
communication
-0.267*** 0.329** -0.211** 0.040 -0.473** -0.131 0.284 -0.655***
(0.021) (0.134) (0.085) (0.100) (0.227) (0.211) (0.205) (0.241)
Banking and finance
-0.100*** 0.125 -0.120 -0.001 -0.645* 0.639 0.110
(0.038) (0.135) (0.122) (0.111) (0.389) (0.405) (0.491)
Real estate and Business Services
-0.236*** -0.242 -0.377*** -0.298*** -0.539** -0.052 0.365 -0.203
(0.039) (0.169) (0.118) (0.108) (0.257) (0.245) (0.233) (0.257)
Education -0.020 -0.096* -0.250*** -0.430*** -0.635* -0.397* 0.220 -0.508*
(0.018) (0.057) (0.088) (0.064) (0.370) (0.205) (0.344) (0.295)
Health and social work
-0.037 -0.012 -0.223 -0.256*** -0.541** -0.467** 0.342 -0.289
(0.037) (0.067) (0.139) (0.077) (0.262) (0.223) (0.250) (0.208)
Other community,
social and
-0.786*** -0.454*** -0.701*** -0.893*** -0.683*** -0.706*** 0.191 -0.639***
Table 5. A1:Selectivity corrected wage equation for Regular and Casual wage workers: log daily wage (2012)

ILO DWT for South Asia and Country Office for India 61
personal services
(0.048) (0.118) (0.187) (0.095) (0.240) (0.191) (0.222) (0.190)
Private households
-0.724*** -0.581*** -0.605*** -0.941*** -0.581** -0.644*** 0.251 -0.664***
(0.076) (0.098) (0.196) (0.083) (0.238) (0.190) (0.242) (0.188)
Region [Reference Group: State of Gujarat]
Jammu & Kashmir
0.144*** -0.148 0.101 0.076 0.387*** 0.616*** 0.339*** 0.442***
(0.040) (0.123) (0.159) (0.135) (0.051) (0.153) (0.096) (0.111)
Himachal Pradesh
0.109*** -0.156 0.046 0.020 0.224*** 0.114* 0.141 0.170
(0.041) (0.113) (0.244) (0.184) (0.058) (0.064) (0.149) (0.195)
Punjab 0.075* -0.075 -0.013 -0.019 0.430*** 0.485*** 0.274*** -0.030
(0.042) (0.156) (0.146) (0.129) (0.051) (0.087) (0.092) (0.123)
Uttaranchal 0.169*** 0.141 0.077 0.178 0.284*** 0.151 0.233* 0.325*
(0.053) (0.168) (0.199) (0.181) (0.069) (0.142) (0.138) (0.171)
Haryana 0.249*** 0.233 0.269* 0.394*** 0.382*** 0.431*** 0.267*** 0.342**
(0.045) (0.166) (0.161) (0.139) (0.054) (0.076) (0.098) (0.158)
Rajasthan 0.064 -0.387*** -0.030 0.132 0.226*** 0.048 0.190** -0.068
(0.042) (0.139) (0.152) (0.143) (0.048) (0.047) (0.089) (0.110)
Uttar Pradesh -0.244*** -0.508*** -0.074 -0.064 0.035 -0.174*** -0.017 -0.019
(0.037) (0.118) (0.134) (0.130) (0.042) (0.048) (0.076) (0.098)
Bihar -0.047 0.016 -0.086 -0.039 0.049 -0.141** -0.046 -0.123
(0.045) (0.149) (0.204) (0.224) (0.044) (0.056) (0.090) (0.146)
Sikkim 0.314*** 0.697*** 0.254 0.584*** 0.373*** 0.507*** 0.178 omitted
(0.047) (0.123) (0.342) (0.222) (0.122) (0.099) (0.276)
Arunachal P 0.448*** 0.816*** 0.257 0.668*** 0.395*** 0.433*** 0.175 0.254*
(0.051) (0.155) (0.204) (0.199) (0.098) (0.070) (0.138) (0.149)
Nagaland 0.225*** 0.439** 0.058 0.115 0.348 omitted 0.177 omitted
(0.049) (0.184) (0.252) (0.244) (0.271) (0.290)
Manipur 0.186*** 0.328** 0.083 0.166 0.267*** -0.007 0.121 0.706***
(0.042) (0.133) (0.195) (0.169) (0.095) (0.069) (0.122) (0.197)
Mizoram 0.384*** 0.842*** 0.207 0.528*** 0.483*** 0.825*** 0.406*** 0.500***
(0.053) (0.147) (0.198) (0.158) (0.145) (0.267) (0.122) (0.187)
Tripura -0.028 0.006 -0.247 -0.118 0.236*** 0.126** 0.137 0.191
(0.050) (0.139) (0.243) (0.168) (0.052) (0.056) (0.120) (0.126)
Meghalaya 0.115** 0.283** -0.034 0.179 0.592*** 0.342*** 0.300** 0.392***
(0.052) (0.116) (0.243) (0.174) (0.076) (0.054) (0.127) (0.115)
Assam -0.019 0.031 0.081 0.239 0.098* 0.009 0.004 0.162
(0.040) (0.113) (0.203) (0.190) (0.053) (0.049) (0.123) (0.146)
West Bengal -0.011 -0.145 -0.030 -0.103 0.002 -0.070 -0.127 -0.216**
(0.039) (0.104) (0.136) (0.139) (0.044) (0.043) (0.079) (0.088)
Jharkhand 0.019 -0.162 0.053 -0.096 -0.024 -0.328*** -0.010 -0.124
(0.050) (0.136) (0.194) (0.183) (0.050) (0.060) (0.093) (0.128)
Odisha -0.259*** -0.152 -0.088 -0.138 -0.018 -0.181*** -0.024 -0.161
(0.041) (0.118) (0.175) (0.152) (0.047) (0.043) (0.097) (0.103)
Chhattisgarh -0.343*** -0.358*** -0.276 -0.105 -0.250*** -0.219*** -0.257** -0.403***
(0.046) (0.114) (0.193) (0.147) (0.059) (0.038) (0.107) (0.081)
Madhya Pradesh -0.335*** -0.556*** -0.203 -0.196 -0.100** -0.066* -0.142* -0.101
(0.043) (0.126) (0.149) (0.134) (0.047) (0.037) (0.081) (0.087)
Maharashtra 0.021 0.040 0.149 0.163 0.127*** -0.073** 0.073 -0.073
(0.035) (0.106) (0.118) (0.109) (0.045) (0.030) (0.077) (0.068)
Andhra Pradesh -0.139*** -0.040 0.029 -0.021 0.318*** 0.057* 0.235*** 0.165**
(0.038) (0.111) (0.130) (0.113) (0.045) (0.030) (0.079) (0.068)
Karnataka -0.143*** -0.094 0.036 0.190 0.297*** -0.024 0.197** 0.011
(0.041) (0.114) (0.143) (0.122) (0.049) (0.035) (0.078) (0.072)
Goa 0.262*** 0.286* 0.052 0.382** 0.297 0.640*** 0.226 0.857***
(0.073) (0.164) (0.250) (0.177) (0.198) (0.100) (0.199) (0.236)
Kerala 0.160*** 0.051 0.179 0.105 0.953*** 0.447*** 0.811*** 0.463***
(0.043) (0.099) (0.171) (0.117) (0.047) (0.038) (0.078) (0.077)
Tamil Nadu 0.053 0.218** 0.057 0.185 0.466*** 0.020 0.421*** 0.233***
(0.037) (0.104) (0.133) (0.114) (0.044) (0.032) (0.073) (0.067)
Union Territories 0.329*** 0.388*** 0.230* 0.465*** 0.492*** 0.239*** 0.368*** 0.169*
(0.041) (0.117) (0.128) (0.115) (0.078) (0.062) (0.089) (0.103)
Constant 4.557*** 3.675*** 4.906*** 4.124*** 5.239*** 4.826*** 4.474*** 4.946***

62 ILO DWT for South Asia and Country Office for India
(0.045) (0.139) (0.166) (0.166) (0.230) (0.185) (0.216) (0.199)
Observations 12,549 2,869 18,629 4,933 15,969 6,745 6,656 1,483
Wald chi2 10412 1755 691.6 1545 2128 1233 646.8 601
lambda 0.0851 0.147 -3.036* 1.187* -0.801*** 0.0420 -0.929** 0.110

ILO DWT for South Asia and Country Office for India 63
6. Measuring wage inequality
6.1. Introduction
We have seen the role of different factors in the determination of wages in the four segments of the Indian
labour market. Several factors were found to be highly significant in influencing the determination of
wages. In general, those who come from socially disadvantaged backgrounds, casual workers and from
economically lagging regions (states) are less favourably positioned than others. But the model was not
meant to measure inequality — although the unequal nature of the outcomes is quite evident in the results
presented. Independent measures are warranted to determine the overall inequality and the contribution of
identifiable factors to explain the inequality. There is a class of inequality measures ranging from the simple
to more complex ones. We first discuss the results using a simple measure which is called ‘inter-quantile
dispersion ratio’ and then move to two complex measures viz., the Gini coefficient and the Theil Index.
Earlier studies have reported an increase in wage inequality in the period from 1993-94 to 2004-05
particularly in regular employment in urban areas (see Ch 2). We are now in a position to extend the analysis
to 2011-12 using EUS data from the NSS 68th Round so that changes in the wage inequality, if any, can be
captured for the recent period for all the wage workers as well as in the four segments of the Indian labour
market.
6.2. Inter-quantile dispersion ratio
In Figure 6.1, we present the inter-quantile dispersion ratios for all the wage workers for the top and bottom
percentiles (P90/P10), the top and the middle percentile (P90/P50) and the middle and the bottom
percentiles (P50/P10). The trends in wage inequality using inter-quantile dispersion ratio show that for all
workers the inequality between P90/P10 has shown some decrease without interruption. This means that
the average wage in the top was 10.3 times higher (i.e. 1030 per cent) than the average wage in the bottom
in 1993-94 but has now declined to 9 times.
A somewhat different picture emerges for the top to middle percentile workers. This ratio (P90/P50) for all
workers has registered only a marginal increase between 1993 and 2012 but after a greater increase during
the first period. One may say that the inequality ratio between 1993 and 2012 has more or less the same.
As for the lower half of the distribution the inter-quantile dispersion ratio between P50/P10 has shown a
decline for the whole period but the decline was due to a decline in the first period which subsequently
increased somewhat but remained below the initial i.e. 1993-94 level. The lower values of the ratios also
show that the dispersion at the lower half of the distribution is the least. Given the fact that it is the casual
segments which have registered a higher wage increase, there is some leveling up of the bottom wages in
the Indian economy.

64 ILO DWT for South Asia and Country Office for India
Figure 6.1: Wage inequality: Percentile ratios
Quantile ratio as a measure of inequality
The trends in wage inequality among a different group of workers are measured by using percentile ratio and Gini coefficient. Quantile ratio A simple and widely used measure of inequality is the quantile dispersion ratio, which represents the ratio of average wage earnings of the top wage earners (90th percentile) divided by the low wage earners (10th percentile). This ratio can be calculated for other percentiles too. The dispersion ratio is easily interpretable and can be interpreted as the wage earning of top earners as a multiple times the low wage earners or median wage earners (50th percentile). The quantile ratio (𝑄𝑅) is estimated by
𝑄�̂�(𝑃1, 𝑃2) =�̂�(𝑃1)
�̂�(𝑃2)
Where 𝑄(𝑃) is the quantile and 𝑃1 and 𝑃2 are the percentiles, quantile ratio measures the dispersion of wage across distribution. The inequality among workers is measured by taking the percentile ratios of average daily wages at three distinct points of the wage distribution i.e. Top to Bottom (90th to 10th percentile ratio), Top to Middle (90th to 50th percentile ratio) and Middle to Bottom (50th to 10th percentile ratio). The quantile ratio ignores the information between the two percentiles which are taken into consideration.
Category
Inter-quantile range (90-10)
Inter-quantile range (90-50)
Inter-quantile range (50-10)
P1 P2 P3 P1 P2 P3 P1 P2 P3
Rural Regular Male 7.49 9.00 8.33 2.03 3.46 2.81 3.68 2.60 2.97
Rural Regular Female 11.26 14.96 14.29 3.57 5.83 5.00 3.16 2.56 2.86
Rural Casual Male 3.33 2.89 2.86 1.90 1.73 1.81 1.75 1.67 1.58
Rural Casual Female 2.92 2.75 2.67 1.67 1.83 1.60 1.75 1.50 1.67
Urban Regular Male 7.34 8.57 9.13 2.27 3.22 3.00 3.23 2.67 3.04
Urban Regular Female 13.33 18.67 17.33 2.22 5.60 4.33 6.00 3.33 4.00
Urban Casual Male 3.90 3.13 3.00 1.95 1.79 1.82 2.00 1.75 1.65
Urban Casual Female 3.60 3.50 4.00 1.76 1.75 2.00 2.04 2.00 2.00
This overall and recent reduction in wage inequality by means of this measure may be understood better by
examining the inter-quantile dispersion ratios for the labour markets differentiated by gender, location and
labour status (given in Table 6.1). In terms of P90/P10, out of the four casual labour groups three have
reported a reduction in inequality for both the periods, resulting in a decline in inequality for the whole
period. However, what is significant to note is the rise in inequality among all regular worker categories
for the whole period. In the case of regular urban male workers, both the periods are characterized by a rise
in inequality. This pattern is more or less repeated for P90/P50, too. In contrast, the inequality ratios
between the middle and the bottom (P50/P10) show a decline for the whole period for all the categories.
0
2
4
6
8
10
12
1993-94 2004-05 2011-12
rati
o o
f re
al d
aily
wag
es
P90/P10
P90/P50
P50/P10
Table 6.1: Wage inequality (inter-quantile dispersion ratio)
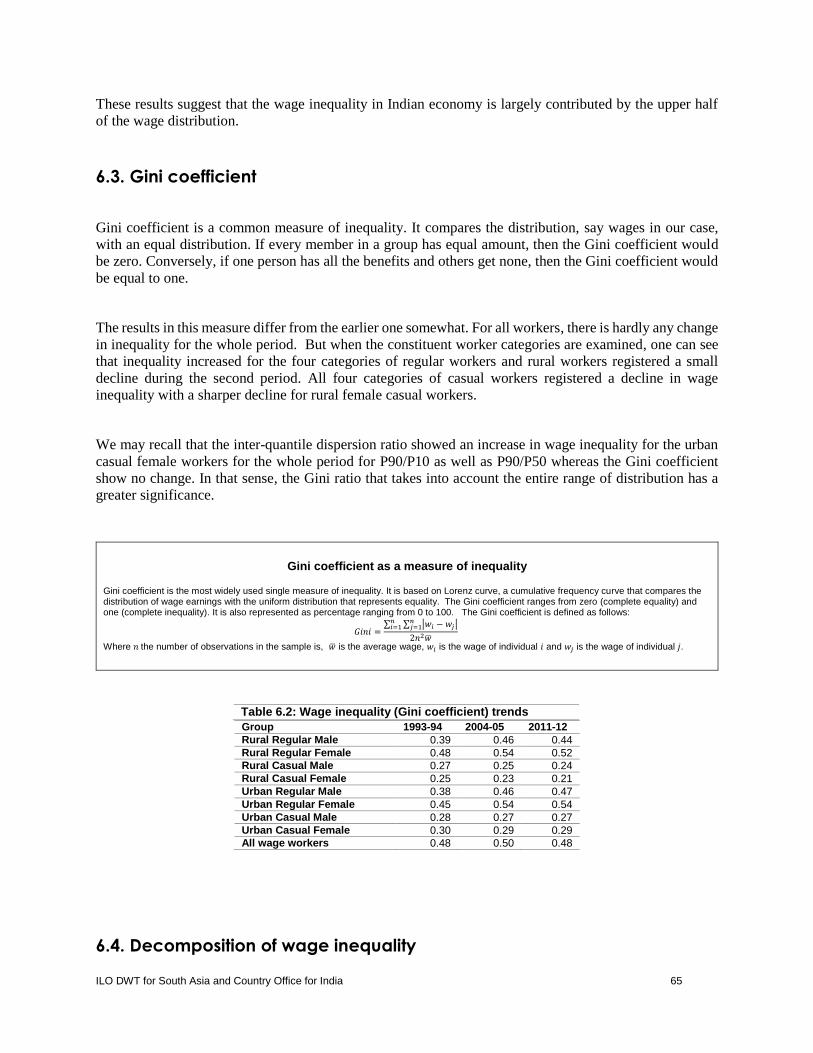
ILO DWT for South Asia and Country Office for India 65
These results suggest that the wage inequality in Indian economy is largely contributed by the upper half
of the wage distribution.
6.3. Gini coefficient
Gini coefficient is a common measure of inequality. It compares the distribution, say wages in our case,
with an equal distribution. If every member in a group has equal amount, then the Gini coefficient would
be zero. Conversely, if one person has all the benefits and others get none, then the Gini coefficient would
be equal to one.
The results in this measure differ from the earlier one somewhat. For all workers, there is hardly any change
in inequality for the whole period. But when the constituent worker categories are examined, one can see
that inequality increased for the four categories of regular workers and rural workers registered a small
decline during the second period. All four categories of casual workers registered a decline in wage
inequality with a sharper decline for rural female casual workers.
We may recall that the inter-quantile dispersion ratio showed an increase in wage inequality for the urban
casual female workers for the whole period for P90/P10 as well as P90/P50 whereas the Gini coefficient
show no change. In that sense, the Gini ratio that takes into account the entire range of distribution has a
greater significance.
Gini coefficient as a measure of inequality
Gini coefficient is the most widely used single measure of inequality. It is based on Lorenz curve, a cumulative frequency curve that compares the distribution of wage earnings with the uniform distribution that represents equality. The Gini coefficient ranges from zero (complete equality) and one (complete inequality). It is also represented as percentage ranging from 0 to 100. The Gini coefficient is defined as follows:
𝐺𝑖𝑛𝑖 =∑ ∑ |𝑤𝑖 − 𝑤𝑗|𝑛
𝑗=1𝑛𝑖=1
2𝑛2�̅�
Where 𝑛 the number of observations in the sample is, �̅� is the average wage, 𝑤𝑖 is the wage of individual 𝑖 and 𝑤𝑗 is the wage of individual 𝑗.
Group 1993-94 2004-05 2011-12
Rural Regular Male 0.39 0.46 0.44
Rural Regular Female 0.48 0.54 0.52
Rural Casual Male 0.27 0.25 0.24
Rural Casual Female 0.25 0.23 0.21
Urban Regular Male 0.38 0.46 0.47
Urban Regular Female 0.45 0.54 0.54
Urban Casual Male 0.28 0.27 0.27
Urban Casual Female 0.30 0.29 0.29
All wage workers 0.48 0.50 0.48
6.4. Decomposition of wage inequality
Table 6.2: Wage inequality (Gini coefficient) trends

66 ILO DWT for South Asia and Country Office for India
In order to understand the contribution of different factors affecting wage inequality, we decompose wage
inequality to ‘within’ and ‘between’ group inequality components by using Theil index (A brief description
of Theil index is given in the Box). The first task was to decide on the number of categories within the
universe of wage workers in the country.
Decomposition of inequality
To assess the contribution different sub groups on inequality, we used Theil decomposition in our analysis. It decomposes overall inequality (𝐼) into within group inequality (𝐼𝑊) and between group inequality (𝐼𝐵).
𝐼 = 𝐼𝑊 + 𝐼𝐵
To decompose Theil measure of inequality (𝐼), let 𝑤 be total wage earnings of the total wage workers, 𝑤𝑗 is the wage earnings of a sub group, 𝑁 is
total wage worker population and 𝑁𝑗 is the population in the subgroup. Theil index (𝐼) is defined as:
𝐼(𝑇ℎ𝑒𝑖𝑙) = ∑𝑤𝑖
𝑁�̅�
𝑁
𝑖=1𝑙𝑛 (
𝑤𝑖𝑁
�̅�𝑁) = ∑
𝑤𝑖
𝑊
𝑁
𝑖=1𝑙𝑛 (
𝑤𝑖𝑁
𝑊)
= ∑ (𝑤𝑗
𝑤)
𝑗𝐼𝑗 + ∑ (
𝑤𝑗
𝑤) 𝑙𝑛 (
𝑤𝑗 𝑤⁄
𝑁𝑗 𝑁⁄)
= (𝐼𝑊) + (𝐼𝐵)
The first component measures within group inequality (𝐼𝑊) and the second component measures between group inequality (𝐼𝐵). It can be seen in percentage terms such as 𝑅𝑊 = (𝐼𝑊 𝐼⁄ )*100 which explains the percentage of inequality explained by between group differences and (100 − 𝑅𝑊) is the percentage of inequality explained by within group differences. By increasing the number of mutually exclusive subgroups, one can account for the effect of wider range of structural factors.
Starting with some basic characteristics, the following six groups were formed. The details are given below:
Our analysis based on these groupings relates to two time points i.e. 2004-05 and 2011-12 since the five
social group-wise data are not available for 1993-94 (due to clubbing of the Others and OBC in one group).
As one can see, the largest set is Group 4 where the workers with the first three characteristics (rural-urban,
male-female, regular-casual) are further differentiated by social group and education that gives 160
mutually exclusive worker groups. Once the classification is introduced the stark differences in wage rates
are experienced between the high paid and the lowest paid in the Indian labour market. Appendix Table
6.A1 reports real daily wage rates in a descending order. It shows that urban regular male workers in socially
advantageous category having graduate and above level of education earn the highest wages at an average
daily wage rate of 548 rupees a day in 2011-12. The lowest paid is the urban casual female Muslim with
secondary education who earns 41 rupees a day which gives a ratio of 13.4 meaning that the highest paid
in this grouping received a wage equivalent to 13.4 times the wages of the lowest paid in 2011-12. Two
diagrams (Figure 3 and 4) depicting this range in terms of money wages in the Indian labour market are
instructive to note.
Group Description of specification No. of worker groups
Group 1 1. Location (Rural and Urban), Gender (Male and Female) and Labour status (Regular and Casual) (2x2x2)
8
Group 2 1. Location, Gender and employment type and education (Low Education, Middle, Secondary and Graduate and above) (2x2x2x4)
32
Group 3 2. Location, Gender, employment type and social group 40
Table 6.3: Construction of groups for decomposing inequality
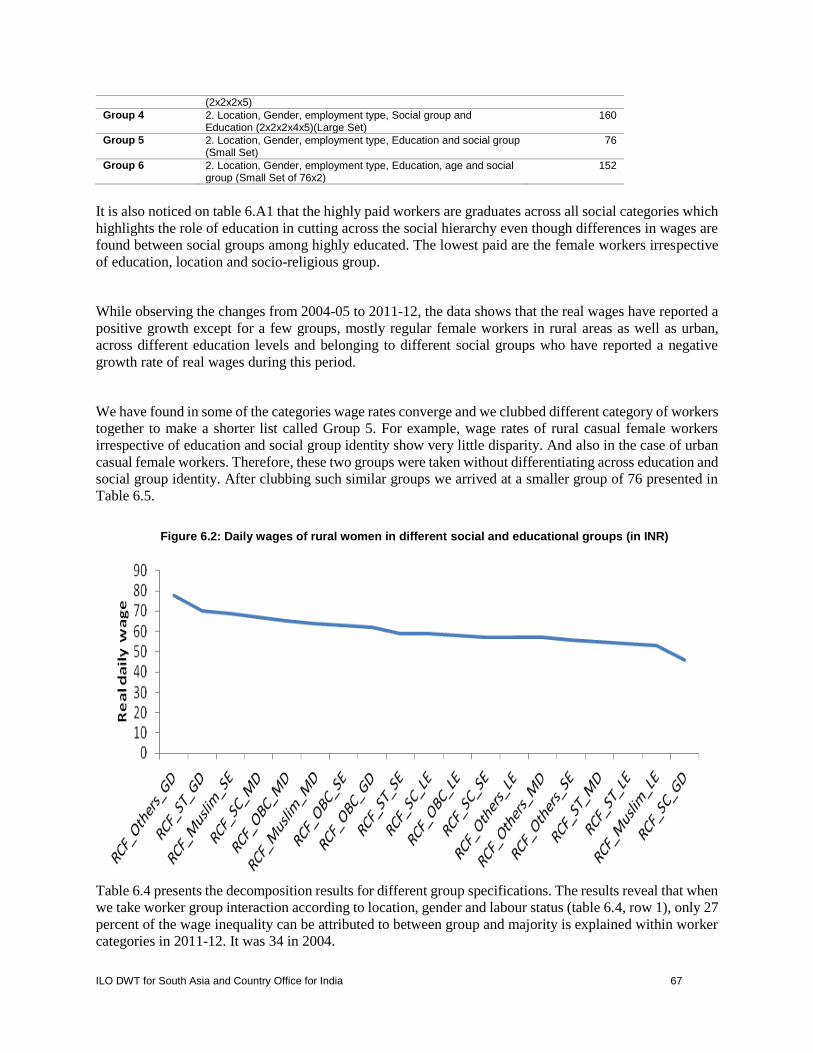
ILO DWT for South Asia and Country Office for India 67
(2x2x2x5)
Group 4 2. Location, Gender, employment type, Social group and Education (2x2x2x4x5)(Large Set)
160
Group 5 2. Location, Gender, employment type, Education and social group (Small Set)
76
Group 6 2. Location, Gender, employment type, Education, age and social group (Small Set of 76x2)
152
It is also noticed on table 6.A1 that the highly paid workers are graduates across all social categories which
highlights the role of education in cutting across the social hierarchy even though differences in wages are
found between social groups among highly educated. The lowest paid are the female workers irrespective
of education, location and socio-religious group.
While observing the changes from 2004-05 to 2011-12, the data shows that the real wages have reported a
positive growth except for a few groups, mostly regular female workers in rural areas as well as urban,
across different education levels and belonging to different social groups who have reported a negative
growth rate of real wages during this period.
We have found in some of the categories wage rates converge and we clubbed different category of workers
together to make a shorter list called Group 5. For example, wage rates of rural casual female workers
irrespective of education and social group identity show very little disparity. And also in the case of urban
casual female workers. Therefore, these two groups were taken without differentiating across education and
social group identity. After clubbing such similar groups we arrived at a smaller group of 76 presented in
Table 6.5.
Table 6.4 presents the decomposition results for different group specifications. The results reveal that when
we take worker group interaction according to location, gender and labour status (table 6.4, row 1), only 27
percent of the wage inequality can be attributed to between group and majority is explained within worker
categories in 2011-12. It was 34 in 2004.
Figure 6.2: Daily wages of rural women in different social and educational groups (in INR)

68 ILO DWT for South Asia and Country Office for India
We elaborate the base group by adding education as a differentiating variable. When that is done, the
explanatory power of the between group inequality increases significantly from 34 to 52 per cent in 2004-
05 and 27 to 43 per cent in 2011-12. There is a significant reduction in the explanatory over time signifying
that other factors may have played a bigger role in inequality in 2011-12.
From the descriptive statistics in Chapter 4 we know that social group identity is also an important
differentiating factor in wages. This could play a role in itself in the form of social discrimination in wages.
Or this could interact with education since access to education has a social dimension due to historical
exclusion and contemporary barriers that works through other factors such as income. Therefore, we first
introduce social group identity as a differentiating variable without education and then introduce both of
them.
When social group is added to Group 2 without taking into account educational levels, the explanatory
power increases only by four per cent in both the years. It could therefore be surmised that social group
identity may be playing an indirect role in wage inequality through access to education. And it is well
established that educational backwardness is higher the more socially disadvantaged a group is. However,
when both education and social group identity are introduced, as in Group specification 4, the explanatory
power enhances considerably. In 2004-05 it increased by 16.5 per cent and in 2011-12 it increased by almost
the same of around 14.6 per cent.
Group specification 1: Location, gender and labour status
Description 2004-05 2011-12
Overall wage inequality 0.445 0.438
Within group inequality 0.296 0.320
Contribution (%) 66.46 73.04
Between group inequality 0.149 0.118
Contribution (%) 33.53 26.96
Group specification 2: Location, gender, labour status and education.
Description 2004-05 2011-12
Overall wage inequality 0.4452 0.43816
Within group inequality 0.215 0.2482
Contribution (%) 48.38 56.65
Between group inequality 0.230 0.190
Contribution (%) 51.62 43.35
Group specification 3: Location, gender, labour status, and social group
Description 2004-05 2011-12
Overall wage inequality 0.445 0.438
Within group inequality 0.277 0.302
Contribution (%) 62.25 68.99
Between group inequality 0.168 0.136
Contribution (%) 37.75 31.00
Group specification 4: Location, gender, labour status, social group and educational levels
Description 2004-05 2011-12
Overall wage inequality 0.445 0.438
Within group inequality 0.208 0.238
Contribution (%) 46.78 54.42
Between group inequality 0.237 0.200
Contribution (%) 53.22 45.59
Table 6.4: Inequality decomposition (Theil)
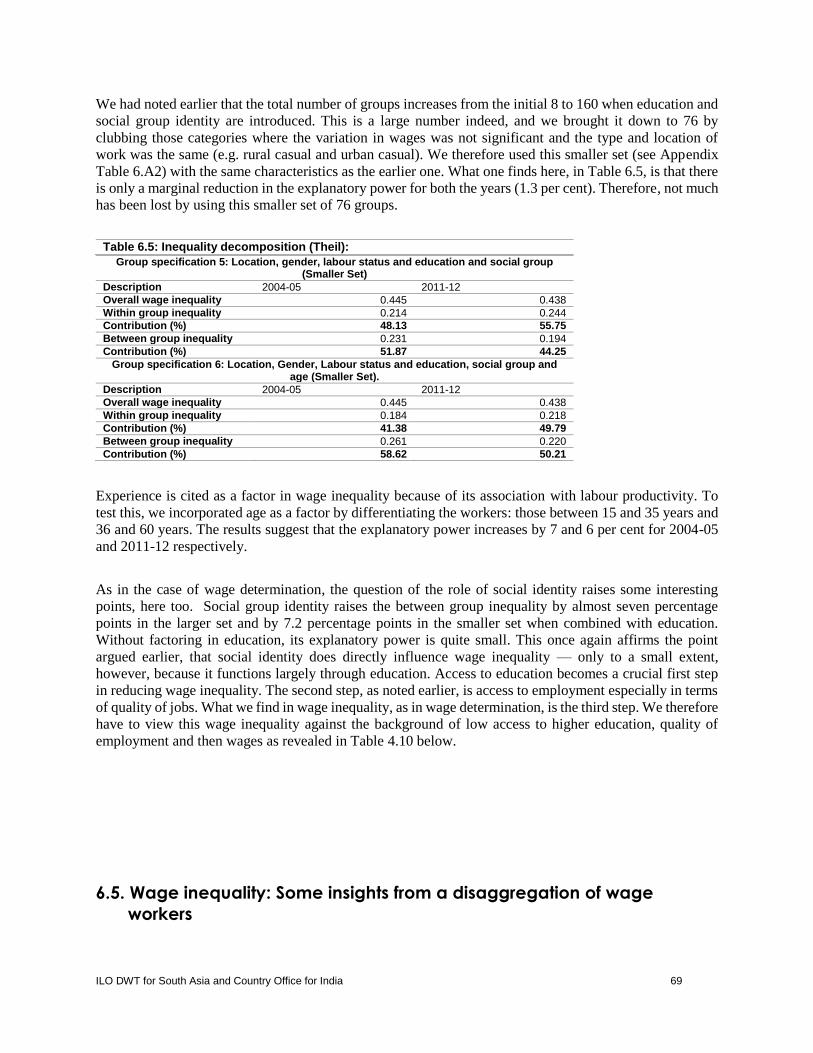
ILO DWT for South Asia and Country Office for India 69
We had noted earlier that the total number of groups increases from the initial 8 to 160 when education and
social group identity are introduced. This is a large number indeed, and we brought it down to 76 by
clubbing those categories where the variation in wages was not significant and the type and location of
work was the same (e.g. rural casual and urban casual). We therefore used this smaller set (see Appendix
Table 6.A2) with the same characteristics as the earlier one. What one finds here, in Table 6.5, is that there
is only a marginal reduction in the explanatory power for both the years (1.3 per cent). Therefore, not much
has been lost by using this smaller set of 76 groups.
Group specification 5: Location, gender, labour status and education and social group (Smaller Set)
Description 2004-05 2011-12
Overall wage inequality 0.445 0.438
Within group inequality 0.214 0.244
Contribution (%) 48.13 55.75
Between group inequality 0.231 0.194
Contribution (%) 51.87 44.25
Group specification 6: Location, Gender, Labour status and education, social group and age (Smaller Set).
Description 2004-05 2011-12
Overall wage inequality 0.445 0.438
Within group inequality 0.184 0.218
Contribution (%) 41.38 49.79
Between group inequality 0.261 0.220
Contribution (%) 58.62 50.21
Experience is cited as a factor in wage inequality because of its association with labour productivity. To
test this, we incorporated age as a factor by differentiating the workers: those between 15 and 35 years and
36 and 60 years. The results suggest that the explanatory power increases by 7 and 6 per cent for 2004-05
and 2011-12 respectively.
As in the case of wage determination, the question of the role of social identity raises some interesting
points, here too. Social group identity raises the between group inequality by almost seven percentage
points in the larger set and by 7.2 percentage points in the smaller set when combined with education.
Without factoring in education, its explanatory power is quite small. This once again affirms the point
argued earlier, that social identity does directly influence wage inequality — only to a small extent,
however, because it functions largely through education. Access to education becomes a crucial first step
in reducing wage inequality. The second step, as noted earlier, is access to employment especially in terms
of quality of jobs. What we find in wage inequality, as in wage determination, is the third step. We therefore
have to view this wage inequality against the background of low access to higher education, quality of
employment and then wages as revealed in Table 4.10 below.
6.5. Wage inequality: Some insights from a disaggregation of wage
workers
Table 6.5: Inequality decomposition (Theil):
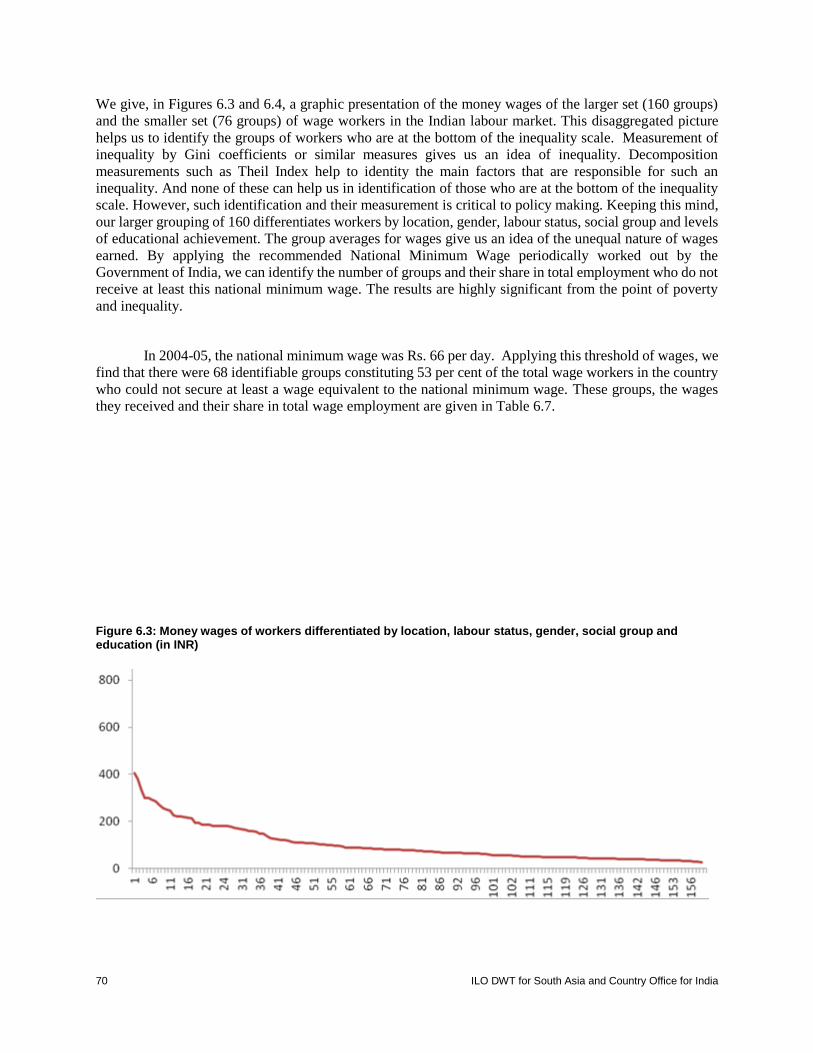
70 ILO DWT for South Asia and Country Office for India
We give, in Figures 6.3 and 6.4, a graphic presentation of the money wages of the larger set (160 groups)
and the smaller set (76 groups) of wage workers in the Indian labour market. This disaggregated picture
helps us to identify the groups of workers who are at the bottom of the inequality scale. Measurement of
inequality by Gini coefficients or similar measures gives us an idea of inequality. Decomposition
measurements such as Theil Index help to identity the main factors that are responsible for such an
inequality. And none of these can help us in identification of those who are at the bottom of the inequality
scale. However, such identification and their measurement is critical to policy making. Keeping this mind,
our larger grouping of 160 differentiates workers by location, gender, labour status, social group and levels
of educational achievement. The group averages for wages give us an idea of the unequal nature of wages
earned. By applying the recommended National Minimum Wage periodically worked out by the
Government of India, we can identify the number of groups and their share in total employment who do not
receive at least this national minimum wage. The results are highly significant from the point of poverty
and inequality.
In 2004-05, the national minimum wage was Rs. 66 per day. Applying this threshold of wages, we
find that there were 68 identifiable groups constituting 53 per cent of the total wage workers in the country
who could not secure at least a wage equivalent to the national minimum wage. These groups, the wages
they received and their share in total wage employment are given in Table 6.7.
Figure 6.3: Money wages of workers differentiated by location, labour status, gender, social group and education (in INR)

ILO DWT for South Asia and Country Office for India 71
Figure 6.4: Money wages of workers differentiated by location, labour status, gender, social group and education, 2011-12 (in INR)

72 ILO DWT for South Asia and Country Office for India
Group Emp % Wage (INR/day)
UR Female_SC_LE 0.59 65
UR Female_Others_LE 0.35 57
UR Female_OBC_MD 0.15 54
UR Female_ST_LE 0.08 51
UR Female_Muslim_LE 0.13 44
UR Female _OBC_LE 0.51 43
Sub-total 1.81
UC Male_ST_LE 0.20 64
UC Male_ST_SE 0.02 51
Sub-total 0.22
UC Female_Others_MD 0.03 49
UC Female_Others_LE 0.18 44
UC Female_Others_SE 0.01 44
UC Female_OBC_GD 0.00 40
UC Female _OBC_SE 0.01 56
UC Female _OBC_MD 0.08 49
UC Female__Muslim_GD nil na
UC Female_Muslim_SE 0.00 33
UC Female _Muslim_MD 0.02 26
UC Female_ Muslim_LE 0.11 51
UC Female _SC_GD 0.00 30
UC Female _SC_SE 0.01 38
UC Female _SC_MD 0.03 49
UC Female_SC_LE 0.46 45
UC Female _OBC_LE 0.57 44
UC Female_ST_MD 0.01 31
UC Female_ST_LE 0.14 42
Sub-total 1.66
RR Female_Others_MD 0.07 56
RR Female_Muslim_MD 0.02 49
RR Female_ST_LE 0.16 48
RR Female_Others_LE 0.15 47
RR Female_OBC_MD 0.12 44
RR Female _SC_MD 0.07 43
RR Female _OBC_LE 0.48 37
Sub-total 1.07
RC Male_Others_GD 0.02 50
RC Male_Others_MD 0.78 65
RC Male_Others_LE 2.30 56
RC Male_OBC_GD 0.06 65
RC Male_OBC_SE 0.86 64
RC Male_OBC_LE 9.07 56
RC Male _Muslim_LE 3.20 56
RC Male _SC_GD 0.04 59
RC Male_SC_SE 0.79 61
RC Male_SC_MD 1.94 61
RC Male_SC_LE 9.77 54
RC Male_ST_GD 0.01 47
RC Male_ST_SE 0.15 48
RC Male_ST_MD 0.49 47
RC Male_ST_LE 4.00 46
Sub-total 30.60
RC Female _Muslim_GD 0.00 50
RC Female _Others_GD 0.00 50
RC Female _ST_SE 0.01 48
RC Female_Muslim_MD 0.03 45
RC Female _Others_SE 0.05 41
RC Female SC_LE 0.36 40
RC Female _Muslim_LE 0.04 40
RC Female _ST_GD 0.00 40
RC Female SC_MD 0.32 40
RC Female _Muslim_SE 0.00 40
RC Female_Others_MD 0.11 40
RC Female _Muslim_LE 0.71 37
RC Female _SC_LE 5.43 36
RC Female _ST_MD 0.13 35
RC Female _OBC_LE 5.73 35
RC Female _Others_LE 1.35 35
RC Female _ST_LE 2.72 34
RC Female _SC_SE 0.12 34
RC Female_OBC_MD 0.41 34
RC Female _OBC_SE 0.13 33
RC Female _SC_GD 0.00 30
Sub-total 17.65
Grand Total 53.01
Table 6.6: Groups of workers receiving daily wages below the National Minimum Wage (INR 66) 2004-05
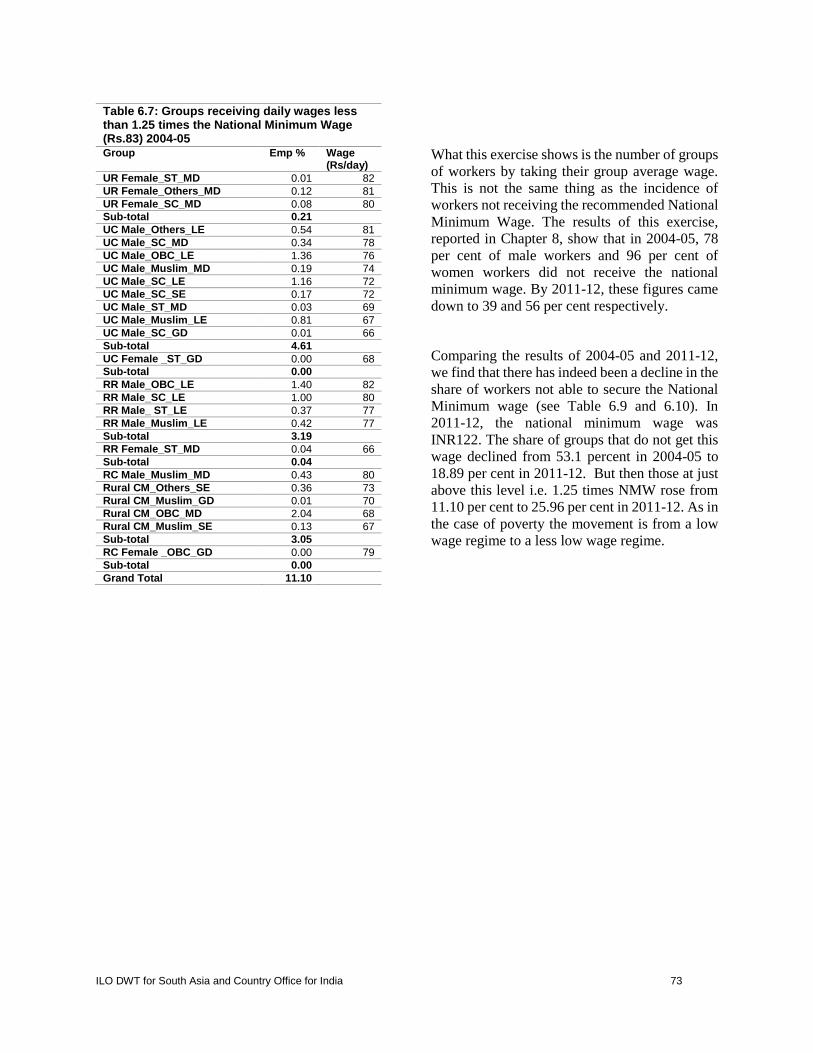
ILO DWT for South Asia and Country Office for India 73
What this exercise shows is the number of groups
of workers by taking their group average wage.
This is not the same thing as the incidence of
workers not receiving the recommended National
Minimum Wage. The results of this exercise,
reported in Chapter 8, show that in 2004-05, 78
per cent of male workers and 96 per cent of
women workers did not receive the national
minimum wage. By 2011-12, these figures came
down to 39 and 56 per cent respectively.
Comparing the results of 2004-05 and 2011-12,
we find that there has indeed been a decline in the
share of workers not able to secure the National
Minimum wage (see Table 6.9 and 6.10). In
2011-12, the national minimum wage was
INR122. The share of groups that do not get this
wage declined from 53.1 percent in 2004-05 to
18.89 per cent in 2011-12. But then those at just
above this level i.e. 1.25 times NMW rose from
11.10 per cent to 25.96 per cent in 2011-12. As in
the case of poverty the movement is from a low
wage regime to a less low wage regime.
Table 6.7: Groups receiving daily wages less than 1.25 times the National Minimum Wage (Rs.83) 2004-05 Group Emp % Wage
(Rs/day)
UR Female_ST_MD 0.01 82
UR Female_Others_MD 0.12 81
UR Female_SC_MD 0.08 80
Sub-total 0.21
UC Male_Others_LE 0.54 81
UC Male_SC_MD 0.34 78
UC Male_OBC_LE 1.36 76
UC Male_Muslim_MD 0.19 74
UC Male_SC_LE 1.16 72
UC Male_SC_SE 0.17 72
UC Male_ST_MD 0.03 69
UC Male_Muslim_LE 0.81 67
UC Male_SC_GD 0.01 66
Sub-total 4.61
UC Female _ST_GD 0.00 68
Sub-total 0.00
RR Male_OBC_LE 1.40 82
RR Male_SC_LE 1.00 80
RR Male_ ST_LE 0.37 77
RR Male_Muslim_LE 0.42 77
Sub-total 3.19
RR Female_ST_MD 0.04 66
Sub-total 0.04
RC Male_Muslim_MD 0.43 80
Rural CM_Others_SE 0.36 73
Rural CM_Muslim_GD 0.01 70
Rural CM_OBC_MD 2.04 68
Rural CM_Muslim_SE 0.13 67
Sub-total 3.05
RC Female _OBC_GD 0.00 79
Sub-total 0.00
Grand Total 11.10

74 ILO DWT for South Asia and Country Office for India
Group Emp %
INR/day
Urban Regular Female_Others_LE 0.32 121
Urban Regular Female_ST_LE 0.06 115
Urban Regular Female_SC_MD 0.14 114
Urban Regular Female_Muslim_LE 0.16 99
Sub-total 0.68
Urban Casual Female_SC_LE 0.28 115
Urban Casual Female_OBC_LE 0.48 114
Urban Casual Female_Others_SE 0.03 114
Urban Casual Female_ST_LE 0.12 106
Urban Casual Female_OBC_SE 0.05 106
Urban Casual Female_ST_MD 0.01 104
Urban Casual Female_SC_SE 0.02 103
Urban Casual Female_Others_LE 0.12 102
Urban Casual Female_Others_MD 0.03 92
Urban Casual Female_Muslim_LE 0.14 91
Urban Casual Female_Muslim_SE 0 72
Urban Casual Female_ST_SE 0 71
Sub-total 1.28
Rural Regular Female_Others_LE 0.12 88
Rural Regular Female_SC_LE 0.26 84
Sub-total 0.38
Rural Casual Male_ST_LE 3.27 120
Sub-total 3.27
Rural Casual Female_SC_MD 0.32 120
Rural Casual Female_Muslim_MD 0.04 116
Rural Casual Female_OBC_MD 0.49 115
Rural Casual Female_OBC_SE 0.33 112
Rural Casual Female_OBC_GD 0 111
Rural Regular Female_ST_MD 0.05 108
Rural Regular Female_OBC_LE 0.36 105
Rural Casual Female_ST_SE 0.03 105
Rural Casual Female_SC_LE 3.54 104
Rural Casual Female_OBC_LE 3.99 104
Rural Regular Female_OBC_MD 0.18 103
Rural Casual Female_Others_MD 0.13 102
Rural Casual Female_Others_LE 0.81 101
Rural Casual Female_Others_SE 0.06 101
Rural Casual Female_SC_SE 0.2 100
Rural Regular Female_ST_LE 0.12 99
Rural Casual Female_ST_MD 0.15 98
Rural Casual Female_ST_LE 1.89 97
Rural Regular Female_Muslim_LE 0.1 95
Rural Regular Female_Others_MD 0.09 95
Rural Casual Female_Muslim_LE 0.66 93
Rural Casual Female_SC_GD 0.01 83
Sub-total 13.28
Grand Total 18.89
Group Emp % INR/day
Rural Casual Male_OBC_LE 8.43 151
Rural Casual Male_Others_LE 2.00 148
Rural Casual Male_SC_LE 8.49 147
Rural Casual Male_Muslim_LE 3.53 145
Rural Casual Male_ST_SE 0.35 128
Rural Casual Male_ST_MD 0.66 125
Sub-total 23.46
UR Female_Muslim_MD 0.04 145
UR Female_SC_LE 0.53 141
UR Female_ST_MD 0.01 134
UR Female_OBC_MD 0.17 131
UR Female_OBC_LE 0.52 124
Sub-total 1.27
UC Female_SC_GD 0 140
UC Female_OBC_GD 0 135
UC Female_Muslim_MD 0.01 133
UC _Female_OBC_MD 0.07 130
UC Female_SC_MD 0.02 122
Sub-total 0.10
RR Female_SC_MD 0.07 136
RR Female_Muslim_MD 0.03 129
Sub-total 0.10
RC Female_Others_GD 0 140
RC Female_ST_GD 0 126
RC Female_Muslim_SE 0.03 123
Sub-total 0.03
Grand Total 25.96
Note: 0 values indicate employment share is less than 0.05
per cent.
Table 6.8: Groups of workers not getting the National Minimum Wage of INR122 in 2011-12
Table 6.9: Workers not getting 1.25 times the NMW i.e. INR 153 in 2011-12
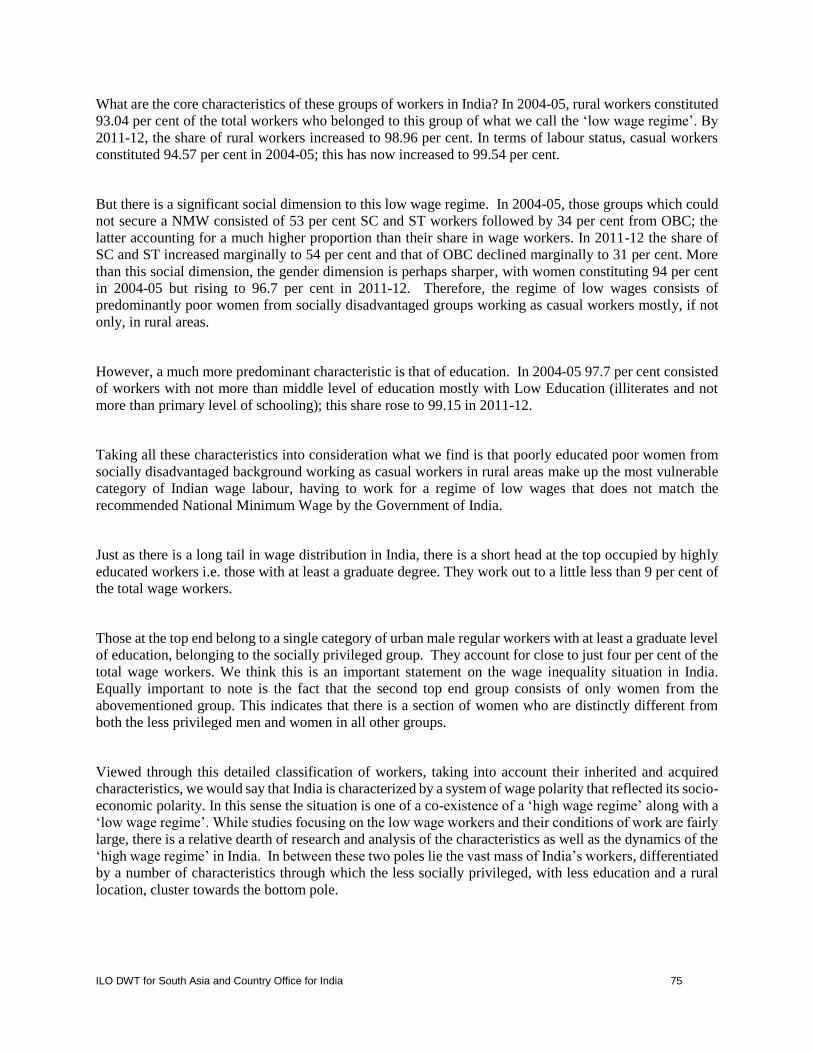
ILO DWT for South Asia and Country Office for India 75
What are the core characteristics of these groups of workers in India? In 2004-05, rural workers constituted
93.04 per cent of the total workers who belonged to this group of what we call the ‘low wage regime’. By
2011-12, the share of rural workers increased to 98.96 per cent. In terms of labour status, casual workers
constituted 94.57 per cent in 2004-05; this has now increased to 99.54 per cent.
But there is a significant social dimension to this low wage regime. In 2004-05, those groups which could
not secure a NMW consisted of 53 per cent SC and ST workers followed by 34 per cent from OBC; the
latter accounting for a much higher proportion than their share in wage workers. In 2011-12 the share of
SC and ST increased marginally to 54 per cent and that of OBC declined marginally to 31 per cent. More
than this social dimension, the gender dimension is perhaps sharper, with women constituting 94 per cent
in 2004-05 but rising to 96.7 per cent in 2011-12. Therefore, the regime of low wages consists of
predominantly poor women from socially disadvantaged groups working as casual workers mostly, if not
only, in rural areas.
However, a much more predominant characteristic is that of education. In 2004-05 97.7 per cent consisted
of workers with not more than middle level of education mostly with Low Education (illiterates and not
more than primary level of schooling); this share rose to 99.15 in 2011-12.
Taking all these characteristics into consideration what we find is that poorly educated poor women from
socially disadvantaged background working as casual workers in rural areas make up the most vulnerable
category of Indian wage labour, having to work for a regime of low wages that does not match the
recommended National Minimum Wage by the Government of India.
Just as there is a long tail in wage distribution in India, there is a short head at the top occupied by highly
educated workers i.e. those with at least a graduate degree. They work out to a little less than 9 per cent of
the total wage workers.
Those at the top end belong to a single category of urban male regular workers with at least a graduate level
of education, belonging to the socially privileged group. They account for close to just four per cent of the
total wage workers. We think this is an important statement on the wage inequality situation in India.
Equally important to note is the fact that the second top end group consists of only women from the
abovementioned group. This indicates that there is a section of women who are distinctly different from
both the less privileged men and women in all other groups.
Viewed through this detailed classification of workers, taking into account their inherited and acquired
characteristics, we would say that India is characterized by a system of wage polarity that reflected its socio-
economic polarity. In this sense the situation is one of a co-existence of a ‘high wage regime’ along with a
‘low wage regime’. While studies focusing on the low wage workers and their conditions of work are fairly
large, there is a relative dearth of research and analysis of the characteristics as well as the dynamics of the
‘high wage regime’ in India. In between these two poles lie the vast mass of India’s workers, differentiated
by a number of characteristics through which the less socially privileged, with less education and a rural
location, cluster towards the bottom pole.
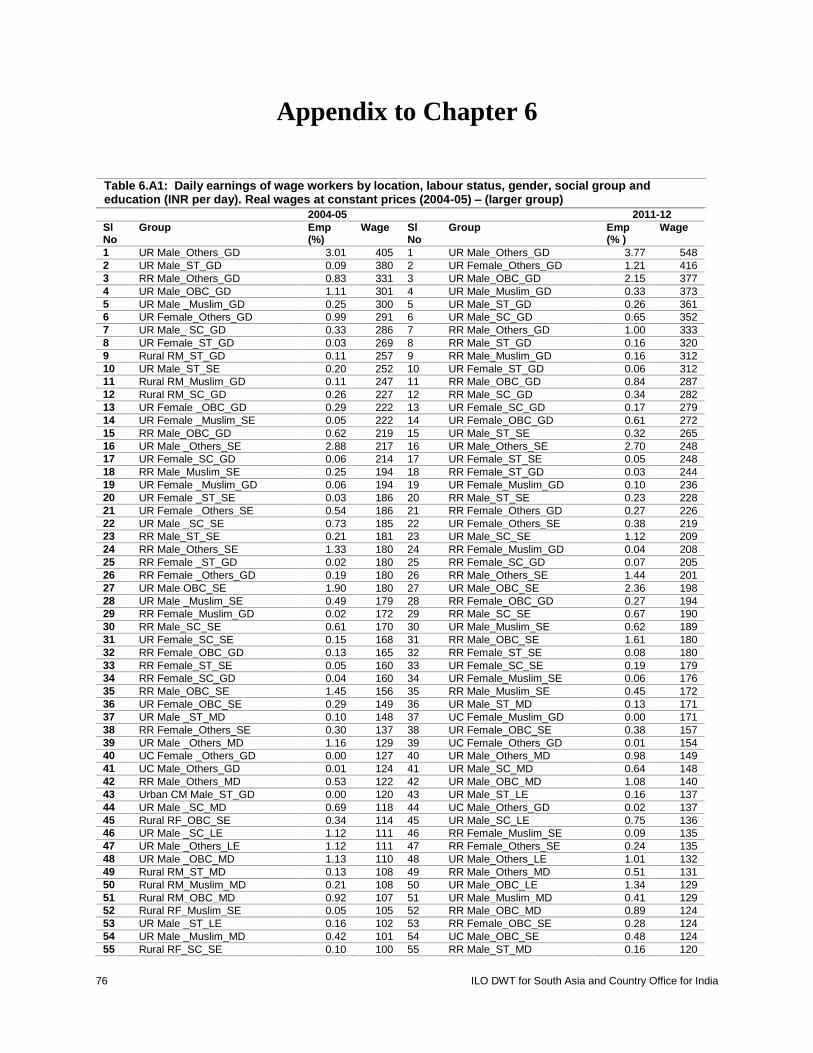
76 ILO DWT for South Asia and Country Office for India
Appendix to Chapter 6
2004-05 2011-12
Sl No
Group Emp (%)
Wage Sl No
Group Emp (% )
Wage
1 UR Male_Others_GD 3.01 405 1 UR Male_Others_GD 3.77 548
2 UR Male_ST_GD 0.09 380 2 UR Female_Others_GD 1.21 416
3 RR Male_Others_GD 0.83 331 3 UR Male_OBC_GD 2.15 377
4 UR Male_OBC_GD 1.11 301 4 UR Male_Muslim_GD 0.33 373
5 UR Male _Muslim_GD 0.25 300 5 UR Male_ST_GD 0.26 361
6 UR Female_Others_GD 0.99 291 6 UR Male_SC_GD 0.65 352
7 UR Male_ SC_GD 0.33 286 7 RR Male_Others_GD 1.00 333
8 UR Female_ST_GD 0.03 269 8 RR Male_ST_GD 0.16 320
9 Rural RM_ST_GD 0.11 257 9 RR Male_Muslim_GD 0.16 312
10 UR Male_ST_SE 0.20 252 10 UR Female_ST_GD 0.06 312
11 Rural RM_Muslim_GD 0.11 247 11 RR Male_OBC_GD 0.84 287
12 Rural RM_SC_GD 0.26 227 12 RR Male_SC_GD 0.34 282
13 UR Female _OBC_GD 0.29 222 13 UR Female_SC_GD 0.17 279
14 UR Female _Muslim_SE 0.05 222 14 UR Female_OBC_GD 0.61 272
15 RR Male_OBC_GD 0.62 219 15 UR Male_ST_SE 0.32 265
16 UR Male _Others_SE 2.88 217 16 UR Male_Others_SE 2.70 248
17 UR Female_SC_GD 0.06 214 17 UR Female_ST_SE 0.05 248
18 RR Male_Muslim_SE 0.25 194 18 RR Female_ST_GD 0.03 244
19 UR Female _Muslim_GD 0.06 194 19 UR Female_Muslim_GD 0.10 236
20 UR Female _ST_SE 0.03 186 20 RR Male_ST_SE 0.23 228
21 UR Female _Others_SE 0.54 186 21 RR Female_Others_GD 0.27 226
22 UR Male _SC_SE 0.73 185 22 UR Female_Others_SE 0.38 219
23 RR Male_ST_SE 0.21 181 23 UR Male_SC_SE 1.12 209
24 RR Male_Others_SE 1.33 180 24 RR Female_Muslim_GD 0.04 208
25 RR Female _ST_GD 0.02 180 25 RR Female_SC_GD 0.07 205
26 RR Female _Others_GD 0.19 180 26 RR Male_Others_SE 1.44 201
27 UR Male OBC_SE 1.90 180 27 UR Male_OBC_SE 2.36 198
28 UR Male _Muslim_SE 0.49 179 28 RR Female_OBC_GD 0.27 194
29 RR Female_Muslim_GD 0.02 172 29 RR Male_SC_SE 0.67 190
30 RR Male_SC_SE 0.61 170 30 UR Male_Muslim_SE 0.62 189
31 UR Female_SC_SE 0.15 168 31 RR Male_OBC_SE 1.61 180
32 RR Female_OBC_GD 0.13 165 32 RR Female_ST_SE 0.08 180
33 RR Female_ST_SE 0.05 160 33 UR Female_SC_SE 0.19 179
34 RR Female_SC_GD 0.04 160 34 UR Female_Muslim_SE 0.06 176
35 RR Male_OBC_SE 1.45 156 35 RR Male_Muslim_SE 0.45 172
36 UR Female_OBC_SE 0.29 149 36 UR Male_ST_MD 0.13 171
37 UR Male _ST_MD 0.10 148 37 UC Female_Muslim_GD 0.00 171
38 RR Female_Others_SE 0.30 137 38 UR Female_OBC_SE 0.38 157
39 UR Male _Others_MD 1.16 129 39 UC Female_Others_GD 0.01 154
40 UC Female _Others_GD 0.00 127 40 UR Male_Others_MD 0.98 149
41 UC Male_Others_GD 0.01 124 41 UR Male_SC_MD 0.64 148
42 RR Male_Others_MD 0.53 122 42 UR Male_OBC_MD 1.08 140
43 Urban CM Male_ST_GD 0.00 120 43 UR Male_ST_LE 0.16 137
44 UR Male _SC_MD 0.69 118 44 UC Male_Others_GD 0.02 137
45 Rural RF_OBC_SE 0.34 114 45 UR Male_SC_LE 0.75 136
46 UR Male _SC_LE 1.12 111 46 RR Female_Muslim_SE 0.09 135
47 UR Male _Others_LE 1.12 111 47 RR Female_Others_SE 0.24 135
48 UR Male _OBC_MD 1.13 110 48 UR Male_Others_LE 1.01 132
49 Rural RM_ST_MD 0.13 108 49 RR Male_Others_MD 0.51 131
50 Rural RM_Muslim_MD 0.21 108 50 UR Male_OBC_LE 1.34 129
51 Rural RM_OBC_MD 0.92 107 51 UR Male_Muslim_MD 0.41 129
52 Rural RF_Muslim_SE 0.05 105 52 RR Male_OBC_MD 0.89 124
53 UR Male _ST_LE 0.16 102 53 RR Female_OBC_SE 0.28 124
54 UR Male _Muslim_MD 0.42 101 54 UC Male_OBC_SE 0.48 124
55 Rural RF_SC_SE 0.10 100 55 RR Male_ST_MD 0.16 120
Table 6.A1: Daily earnings of wage workers by location, labour status, gender, social group and education (INR per day). Real wages at constant prices (2004-05) – (larger group)

ILO DWT for South Asia and Country Office for India 77
56 UR Male _OBC_LE 1.38 100 56 UC Male_Others_MD 0.25 118
57 Rural RM_SC_MD 0.48 98 57 UC Male_OBC_MD 0.59 117
58 Rural RM_Others_LE 0.67 98 58 UC Male_OBC_GD 0.05 114
59 Urban CM_OBC_GD 0.02 95 59 RR Male_Others_LE 0.44 112
60 UR Male _Muslim_LE 0.84 90 60 UC Male_SC_MD 0.43 112
61 Urban RF_Muslim_MD 0.02 89 61 RC Male_Muslim_MD 0.63 111
62 Urban CM_OBC_SE 0.30 88 62 UC Male_SC_SE 0.25 111
63 Urban CM_Others_SE 0.16 88 63 UC Male_OBC_LE 1.33 110
64 Urban CF_ST_SE 0.01 88 64 UC Male_Muslim_MD 0.26 110
65 Urban CM_Muslim_SE 0.08 86 65 RC Others_GD 0.03 108
66 Urban CM_OBC_MD 0.59 85 66 UC Male_Muslim_SE 0.14 108
67 Urban CM_Muslim_GD 0.01 85 67 UC Male_Others_SE 0.16 108
68 Urban CM_Others_MD 0.29 83 68 RR Male_SC_MD 0.46 107
69 Rural RM_OBC_LE 1.40 82 69 RR Male_Muslim_MD 0.23 107
70 Urban RF_ST_MD 0.01 82 70 RR Male_SC_LE 0.75 106
71 Urban RF_Others_MD 0.12 81 71 UR Male_Muslim_LE 0.97 106
72 Urban CM_Others_LE 0.54 81 72 RR Male_OBC_LE 1.01 105
73 Rural RM_SC_LE 1.00 80 73 UC Male_ST_MD 0.07 105
74 Rural CM_Muslim_MD 0.43 80 74 UC ST_GD 0.00 103
75 Urban RF_SC_MD 0.08 80 75 RR ST_LE 0.22 101
76 RC Female _OBC_GD 0.00 79 76 RC Male_Muslim_SE 0.32 100
77 Urban CM_SC_MD 0.34 78 77 UR Female_Others_MD 0.11 100
78 Rural RM_ ST_LE 0.37 77 78 UC Male_SC_LE 1.03 99
79 Rural RM_Muslim_LE 0.42 77 79 RC Male_Others_MD 0.73 98
80 Urban CM_OBC_LE 1.36 76 80 RC Male_OBC_SE 1.94 96
81 Urban CM_Muslim_MD 0.19 74 81 RC Male_OBC_GD 0.13 96
82 Rural CM_Others_SE 0.36 73 82 RC Male_OBC_MD 2.40 95
83 Urban CM_SC_LE 1.16 72 83 UC Male_Others_LE 0.41 95
84 Urban CM_SC_SE 0.17 72 84 UC Male_SC_GD 0.02 93
85 Rural CM_Muslim_GD 0.01 70 85 UC Male_Muslim_LE 1.01 92
86 Urban CM_ST_MD 0.03 69 86 UC Male_ST_SE 0.04 91
87 Rural CM_OBC_MD 2.04 68 87 RR Female_SC_SE 0.16 90
88 UC Female _ST_GD 0.00 68 88 RC Male_SC_SE 1.24 90
89 Rural CM_Muslim_SE 0.13 67 89 RC Male_Muslim_GD 0.01 90
90 Urban CM_Muslim_LE 0.81 67 90 RC Male_Others_SE 0.68 90
91 Rural RF_ST_MD 0.04 66 91 UC Male_ST_LE 0.25 90
92 Urban CM_SC_GD 0.01 66 92 UC Male_Muslim_GD 0.01 90
93 Rural CM_OBC_GD 0.06 65 93 RC Male_ST_GD 0.03 88
94 Rural CM_Others_MD 0.78 65 94 RC Male_SC_GD 0.07 88
95 Urban RF_SC_LE 0.59 65 95 RR Male_Muslim_LE 0.51 87
96 Rural CM_OBC_SE 0.86 64 96 RC Male_SC_MD 2.13 86
97 Urban CM_ST_LE 0.20 64 97 RC Male_OBC_LE 8.43 84
98 Rural CM_SC_MD 1.94 61 98 UR Female_Muslim_MD 0.04 84
99 Rural CM_SC_SE 0.79 61 99 RC Male_SC_LE 8.49 82
100 Rural CM_SC_GD 0.04 59 100 RC Male_Others_LE 2.00 82
101 Urban RF_Others_LE 0.35 57 101 RC Male_Muslim_LE 3.53 81
102 Rural RF_Others_MD 0.07 56 102 UR Female_SC_LE 0.53 81
103 Rural CM_OBC_LE 9.07 56 103 UC Female_SC_GD 0.00 81
104 Rural CM_Muslim_LE 3.20 56 104 RC Female_Others_GD 0.00 78
105 Rural CM_Others_LE 2.30 56 105 UC Female_OBC_GD 0.00 78
106 UC Female _OBC_SE 0.01 56 106 UR Female_ST_MD 0.01 77
107 Rural CM_SC_LE 9.77 54 107 UC Female_Muslim_MD 0.01 77
108 Urban RF_OBC_MD 0.15 54 108 RR Female_SC_MD 0.07 76
109 Urban RF_ST_LE 0.08 51 109 UR Female_OBC_MD 0.17 75
110 Urban CM_ST_SE 0.02 51 110 UC Female_OBC_MD 0.07 75
111 UC Female_ Muslim_LE 0.11 51 111 RR Female_Muslim_MD 0.03 72
112 Rural CM_Others_GD 0.02 50 112 RC Male_ST_SE 0.35 71
113 RC Female _Muslim_GD 0.00 50 113 UR Female_OBC_LE 0.52 71
114 RC Female _Others_GD 0.00 50 114 RC Female_ST_GD 0.00 70
115 Rural RF_Muslim_MD 0.02 49 115 UR Female_Others_LE 0.32 70
116 UC Female _SC_MD 0.03 49 116 UC Female_SC_MD 0.02 70
117 UC Female _OBC_MD 0.08 49 117 RC Male_ST_MD 0.66 69
118 Urban CF_Others_MD 0.03 49 118 RC Female_Muslim_SE 0.03 69
119 Rural RF_ST_LE 0.16 48 119 RC Male_ST_LE 3.27 67
120 Rural CM_ST_SE 0.15 48 120 RC Female_SC_MD 0.32 67
121 RC Female _ST_SE 0.01 48 121 UR Female_ST_LE 0.06 66

78 ILO DWT for South Asia and Country Office for India
122 Rural RF_Others_LE 0.15 47 122 UR Female_SC_MD 0.14 66
123 Rural CM_ST_MD 0.49 47 123 UC Female_SC_LE 0.28 66
124 Rural CM_ST_GD 0.01 47 124 UC Female_OBC_LE 0.48 66
125 Rural CM_ST_LE 4.00 46 125 UC Female_Others_SE 0.03 66
126 Rural CF_Muslim_MD 0.03 45 126 RC Female_OBC_MD 0.49 64
127 UC Female_SC_LE 0.46 45 127 RC Female_Muslim_MD 0.04 64
128 Rural RF_OBC_MD 0.12 44 128 RC Female_OBC_SE 0.33 62
129 Urban R_Muslim_LE 0.13 44 129 RC Female_OBC_GD 0.00 62
130 UC Female _OBC_LE 0.57 44 130 UC Female_ST_LE 0.12 61
131 UC Female_Others_LE 0.18 44 131 UC Female_OBC_SE 0.05 61
132 UC Female_Others_SE 0.01 44 132 RR Female_ST_MD 0.05 60
133 Rural RF _SC_MD 0.07 43 133 UC Female_ST_MD 0.01 60
134 Urban RF _OBC_LE 0.51 43 134 RR Female_OBC_LE 0.36 59
135 UC Female_ST_LE 0.14 42 135 RC Female_ST_SE 0.03 59
136 RC Female _Others_SE 0.05 41 136 UC Female_SC_SE 0.02 59
137 RC Female SC_LE 0.36 40 137 UC Female_Others_LE 0.12 59
138 RC Female _Muslim_LE 0.04 40 138 RC Female_SC_LE 3.54 58
139 RC Female _ST_GD 0.00 40 139 RC Female_OBC_LE 3.99 58
140 RC Female SC_MD 0.32 40 140 RR Female_OBC_MD 0.18 57
141 RC Female _Muslim_SE 0.00 40 141 RC Female_Others_MD 0.13 57
142 RC Female_Others_MD 0.11 40 142 UR Female_Muslim_LE 0.16 57
143 UC Female_OBC_GD 0.00 40 143 RC Female_SC_SE 0.20 56
144 UC Female _SC_SE 0.01 38 144 RC Female_Others_LE 0.81 56
145 Rural RF _OBC_LE 0.48 37 145 RC Female_Others_SE 0.06 56
146 Rural CF _Muslim_LE 0.71 37 146 RR Female_ST_LE 0.12 55
147 Rural CF _SC_LE 5.43 36 147 RC Female_ST_MD 0.15 55
148 Rural CF _ST_MD 0.13 35 148 RC Female_ST_LE 1.89 54
149 Rural CF _OBC_LE 5.73 35 149 RR Female_Muslim_LE 0.10 53
150 Rural CF _Others_LE 1.35 35 150 RR Female_Others_MD 0.09 53
151 Rural CF _ST_LE 2.72 34 151 UC Female_Others_MD 0.03 53
152 Rural CaF _SC_SE 0.12 34 152 RC Female_Muslim_LE 0.66 52
153 Rural CF _OBC_MD 0.41 34 153 UC Female_Muslim_LE 0.14 52
154 Rural CF _OBC_SE 0.13 33 154 RR Female_Others_LE 0.12 49
155 Urban CF_Muslim_SE 0.00 33 155 RR Female_SC_LE 0.26 47
156 Urban CF_ST_MD 0.01 31 156 RC Female_SC_GD 0.01 46
157 Rural CF _SC_GD 0.00 30 157 UC Female_ST_SE 0.00 41
158 UrbanC Female _SC_GD 0.00 30 158 UC Female_Muslim_SE 0.00 41
159 UC Female _Muslim_MD 0.02 26 159 RC Female_Muslim_GD na na
160 UC Female__Muslim_GD na na 160 UC Female_ST_GD na na
Total 100 98 Total 100 142

ILO DWT for South Asia and Country Office for India 79
2004-05 2011-12
Group Emp (% ) Wage Group Emp (%) Wage
UR Male_Others_GD 3.01 405 UR Male_Others_GD 3.77 548
UR Male_ST_GD 0.09 380 UR Male_OBC_GD 2.15 377
RR Male_Others_GD 0.83 331 UR Male_Muslim_GD 0.33 373
UR Male_OBC_GD 1.11 301 UR Male_ST_GD 0.26 361
UR Male_Muslim_GD 0.00 300 UR Male_SC_GD 0.65 352
UR Male_SC_GD 0.00 286 RR Male_Others_GD 1.00 333
RR Male_ST_GD 0.11 257 RR Male_ST_GD 0.16 320
UR Male_ST_SE 0.00 252 RR Male_Muslim_GD 0.16 312
RR Male_Muslim_GD 0.00 247 RR Male_OBC_GD 0.84 287
RR Male_SC_GD 0.00 227 UR Female_OSD_OED 3.07 285
RR Male_OBC_GD 0.62 219 RR Male_SC_GD 0.34 282
UR Male_Others_SE 2.88 217 UR Male_ST_SE 0.32 265
UR Female_OSD_OED 3.00 215 UR Female_ST_OED 0.13 261
UR Female_ST_OED 0.07 214 UR Male_Others_SE 2.7 248
RR Male_Muslim_SE 0.00 194 RR Female_ST_GD 0.03 244
UR Male_SC_SE 1.00 185 RR Male_ST_SE 0.23 228
RR Male_ST_SE 0.00 181 RR Female_Others_GD 0.27 226
RR Male_Others_SE 1.33 180 UR Male_SC_SE 1.12 209
RR Female_ST_GD 0.02 180 RR Female_Muslim_GD 0.04 208
RR Female_Others_GD 0.00 180 RR Female_SC_GD 0.07 205
UR Male_OBC_SE 1.90 180 RR Male_Others_SE 1.44 201
UR Male_Muslim_SE 0.00 179 UR Male_OBC_SE 2.36 198
RR Female_Muslim_GD 0.02 172 RR Female_OBC_GD 0.27 194
RR Male_SC_SE 1.00 170 RR Male_SC_SE 0.67 190
RR Female_OBC_GD 0.13 165 UR Male_Muslim_SE 0.62 189
RR Female_ST_SE 0.05 160 UR Female_SC_OED 0.5 182
RR Female_SC_GD 0.04 160 RR Male_OBC_SE 1.61 180
RR Male_OBC_SE 1.45 156 RR Female_ST_SE 0.08 180
UR Female_SC_OED 0.00 154 RR Male_Muslim_SE 0.45 172
UR Male_ST_MD 0.10 148 UR Male_ST_MD 0.13 171
RR Female_Others_SE 0.00 137 UR Male_Others_MD 0.98 149
UR Male_Others_MD 1.00 129 UR Male_SC_MD 0.64 148
UR Male_SC_MD 0.69 118 UR Male_OBC_MD 1.08 140
RR Female_OBC_SE 0.34 114 UR Male_ST_LE 0.16 137
UR Male_SC_LE 1.12 111 UR Male_SC_LE 0.75 136
UR Male_Others_LE 1.00 111 RR Female_Muslim_SE 0.09 135
UR Male_OBC_MD 1.00 110 RR Female_Others_SE 0.24 135
RR Male_Others_LEMD 1.00 109 UR Male_Others_LE 1.01 132
RR Female_Muslim_SE 0.05 105 UR Male_OBC_LE 1.34 129
UR Male_ST_LE 0.16 102 UR Male_Muslim_MD 0.41 129
UR Male_Muslim_MD 0.42 101 RR Female_OBC_SE 0.28 124
RR Female_SC_SE 0.10 100 RR Male_Others_LEMD 0.95 122
UR Male_OBC_LE 1.00 100 UC Male_OBC 2.45 115
RR Male_OBC_LEMD 2.32 92 RR Male_OBC_LEMD 1.90 114
UR Male_Muslim_LE 0.84 90 RR Male_ ST_LEMD 0.39 109
RR Male_Muslim_LEMD 0.63 87 RR Male_SC_LEMD 1.21 106
RR Male_SC_LEMD 1.48 86 UR Male_Muslim_LE 0.97 106
RR Male_ ST_LEMD 0.50 85 UC Male_Others 0.84 106
UC Male_Others 0.99 83 UC Male_SC 1.73 104
UC Male_OBC 2.00 80 UC Male_Muslim 1.42 97
UC Male_SC 2.00 73 RR Male_Muslim_LEMD 0.74 93
UC Male_Muslim 1.00 70 UC Male_ST 0.37 93
RR Female_ST_MD 0.04 66 RR Female_SC_SE 0.16 90
UR Female_SC_LE 1.00 65 RC Male_OBC 12.9 88
UC Male_ST 0.00 64 RC Male_Others 3.45 87
RC Male_Others 3.46 60 RC Male_Muslim 4.48 86
RC Male_OBC 12.0 59 RC Male_SC 11.93 84
RC Male_Muslim 4.00 59 UR Female_SC_LE 0.53 81
Table 6.A2: Daily earnings of wage workers by location, labour status, gender, social group and education (INR per day). Real wages at constant prices (2004-05) - smaller group

80 ILO DWT for South Asia and Country Office for India
RR Female_Others_MD 0.07 56 RR Female_SC_MD 0.07 76
RC Male_SC 13.00 56 RR Female_Muslim_MD 0.03 72
UR Female_ST_LE 0.08 51 RC Male_ST 4.32 68
RR Female_Muslim_MD 0.02 49 UR Female_OSD_LE 1.00 68
RR Female_ST_LE 0.16 48 UR Female_ST_LE 0.06 66
UR Female_OSD_LE 0.99 48 UC Female 1.40 64
RR Female_Others_LE 0.15 47 RR Female_ST_MD 0.05 60
RC Male_ST 5.00 46 RR Female_OBC_LE 0.36 59
UC Female 1.66 45 RR Female_OBC_MD 0.18 57
RR Female_OBC_MD 0.12 44 RC Female 12.66 57
RR Female_SC_MD 0.07 43 RR Female_ST_LE 0.12 55
RR Female_SC_LE 0.36 40 RR Female_Muslim_LE 0.10 53
RR Female_Muslim_LE 0.04 40 RR Female_Others_MD 0.09 53
RR Female_OBC_LE 0.48 37 RR Others_LE 0.12 49
RC Female 17.27 35 RR Female_SC_LE 0.26 47
Total 100 98 Total 100 142

ILO DWT for South Asia and Country Office for India 81
Appendix 6.A3 to Chapter 6
Data and variables used in the regression equation
The study uses individual-level data from employment and unemployment surveys (July 2011- June 2012)
administered by National Sample Survey Organization (NSSO), the government of India. The data contains
detailed information on socio-economic and demographic characteristics of households such as household
size and composition, social group, religion, monthly consumption, landholdings, demographic variables
such as age, gender and marital status, education, along with detailed information on employment and
unemployment and wage earnings (both industry and occupation wise). The sample is drawn through the
stratified sampling method. The 68th round of data surveyed 1, 01,724 households (59,700 in rural areas
and 42,024 in urban areas) and enumerated 456,999 persons (280,763 in rural areas and 176,236 in urban
areas). The study covers the geographical area of all states in India except a few regions.8 The weekly wage
data is available only to regular wage/salaried and casual workers.9 We are analysing the wage workers,
which restricts our final pooled sample (the working age group of 15-60 years) to 74,604, of which 30,972
are rural male, 10,905 are rural female, 26,037 are urban male and 6,690 are urban female after dropping
those workers who reported zero wages.
Regarding the factors influencing wage, we used linear specifications of age variables as a proxy for work
experience. We also experimented with quadratic specification of age; the quadratic term is significant in
some cases but often close to zero. However, the coefficients did not change as compared to linear
specification. Hence, we only reported the most parsimonious (linear) specification. Data on education is
defined by the level of completed years of schooling. Dummy variables are constructed by defining
education levels into these four categories; low education describes those who have completed five years
of schooling or less including illiterates, middle education refers to those having completed eight years of
schooling, secondary education refers to those with 10 or 12 years of schooling and graduate and above
have completed 15 years of schooling or above. The reference category is that of low education. Socio-
religious affiliations of the households are captured by categorizing workers into five socio-religious
categories; i.e. Schedule Caste (SC), Schedule Tribe (ST), Muslim, Other Backward Caste (OBC) and
Others. Others is the reference category which consisting of Hindu upper castes, Jains, Sikhs, Christians,
Zoroastrians and a few others. We define employment type by regular and casual workers. Casual dummy
takes value as one if a worker is working as a casual employment and zero if in a regular employment. The
variables for industry affiliations were constructed using NIC 2008 five digit industrial classification and
fifteen broad industries were generated. Public administration and defence is the reference category.
Furthermore, we used state dummies which constitute 29 states and union territories were clubbed together.
Gujarat is the reference category.
8 The survey covered the whole of the Indian Union except (i) interior villages of Nagaland situated beyond five kilometres of the
bus route and (ii) villages in Andaman and Nicobar Islands which remained inaccessible throughout the year.
9 NSS does not provide income earnings of self-employed workers, hence our analysis is restricted to wage workers only.

82 ILO DWT for South Asia and Country Office for India
7. Wages in India: A brief state-level analysis
7.1. Introduction
Given the size of the country and its regional variations in economic performance, it is important to look at
the state level picture with regard to wages just as one does for any other important economic variable. We
take the nearly two decade period between 1993-94 and 2011-12. For the sake of brevity, we focus on the
two labour status groups or type of employment as well as gender differences. While rural-urban differences
are also important at the state level, we know that there is an increasing tendency towards rural-urban
integration of labour markets due to several factors such as the flow of labour from the primary economy
to the urban construction sector, trade, transport and a few other activities.
7.2. Trends and disparities
Starting with trends in the growth of real wages, we present, in Figures 7.1 to 7.4, the annual growth rates
for regular as well as casual workers, for men and women separately. A number of observations can be
made from these figures. First, there is considerable variation in growth in wages for both regular and casual
workers and for men and women across states. It varies from 1.4 in Gujarat to 6.6 for Arunachal Pradesh
for regular men workers, and the range is still higher for the woman counterparts, ranging from 0.9 in
Himachal Pradesh to 8.7 in Arunachal Pradesh. For casual workers, the growth rate ranges from 2.8 in
Mizoram to 5.9 in Andhra Pradesh for men and from -2.7 in Delhi to 7.7 in Jammu and Kashmir for women.
Second, the uneven growth in wages is somewhat lower for men than for women in both regular and casual
work. As is the case all over India, wages of women casual workers in most states have grown faster than
that of their male counterparts in both casual and regular work, especially if we ignore the states at the tail
ends. Of course this wide variation reflects the structural and institutional factors at the level of the regional
economy represented by states. Policy and programme interventions are also equally relevant. But what is
surprising is the mismatch between aggregate economic growth and the growth in wage rates. For example,
Gujarat is by now well known for the high growth performance of the economy during this period but shows
one of the lowest growth rates in the wages of casual workers — both men and women — who are the most
vulnerable sections among the working households. Similarly with Himachal Pradesh. In the case of
Gujarat, the growth in wages for regular workers is also quite low, if not as low as that of the casual workers.

ILO DWT for South Asia and Country Office for India 83
Figure 7.1: Annual growth rates in wages of Male Regular Workers (1993-94 to 2011-12)
1.4
2.0
2.1
2.2
2.3
2.5
2.5
2.7
2.8
2.8
3.0
3.1
3.3
3.3
3.4
3.4
3.4
3.5
3.6
3.7
4.0
4.1
4.4
4.8
5.2
5.5
6.6
0.0 1.0 2.0 3.0 4.0 5.0 6.0 7.0
Gujarat
Tripura
Punjab
Himachal Pradesh
Orissa
Karnataka
Rajasthan
West Bengal
Goa
Madhya Pradesh
Uttar Pradesh
Meghalaya
Tamil Nadu
Jammu & Kashmir
Maharashtra
Bihar
Kerala
Andhra Pradesh
Pondicherry
Nagaland
Assam
Delhi
Manipur
Sikkim
Mizoram
Haryana
Arunachal Pradesh
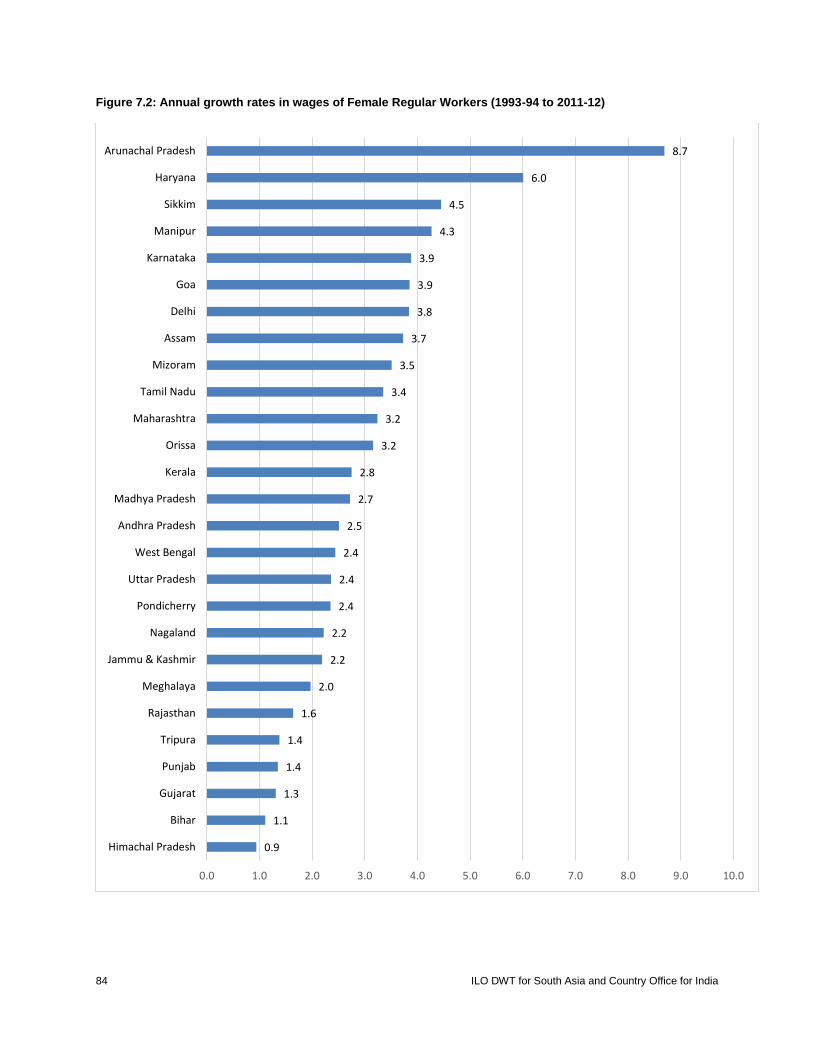
84 ILO DWT for South Asia and Country Office for India
Figure 7.2: Annual growth rates in wages of Female Regular Workers (1993-94 to 2011-12)
0.9
1.1
1.3
1.4
1.4
1.6
2.0
2.2
2.2
2.4
2.4
2.4
2.5
2.7
2.8
3.2
3.2
3.4
3.5
3.7
3.8
3.9
3.9
4.3
4.5
6.0
8.7
0.0 1.0 2.0 3.0 4.0 5.0 6.0 7.0 8.0 9.0 10.0
Himachal Pradesh
Bihar
Gujarat
Punjab
Tripura
Rajasthan
Meghalaya
Jammu & Kashmir
Nagaland
Pondicherry
Uttar Pradesh
West Bengal
Andhra Pradesh
Madhya Pradesh
Kerala
Orissa
Maharashtra
Tamil Nadu
Mizoram
Assam
Delhi
Goa
Karnataka
Manipur
Sikkim
Haryana
Arunachal Pradesh

ILO DWT for South Asia and Country Office for India 85
Figure 7.3: Annual growth rates in real wages of Male Casual Workers (1993-94 to 2011-12)
0.28
0.59
1.22
1.93
2.06
2.28
2.42
2.45
2.55
2.58
2.61
2.94
2.98
2.99
2.99
3.14
3.18
3.64
3.8
3.95
4.52
4.58
4.58
4.67
4.68
5.09
0 1 2 3 4 5 6
Mizoram
Nagaland
Manipur
Goa
Punjab
Tripura
Gujarat
West Bengal
Delhi
Himachal Pradesh
Assam
Haryana
Uttar Pradesh
Arunachal Pradesh
Madhya Pradesh
Rajasthan
Jammu & Kashmir
Maharashtra
Meghalaya
Sikkim
Tamil Nadu
Bihar
Kerala
Karnataka
Orissa
Andhra Pradesh
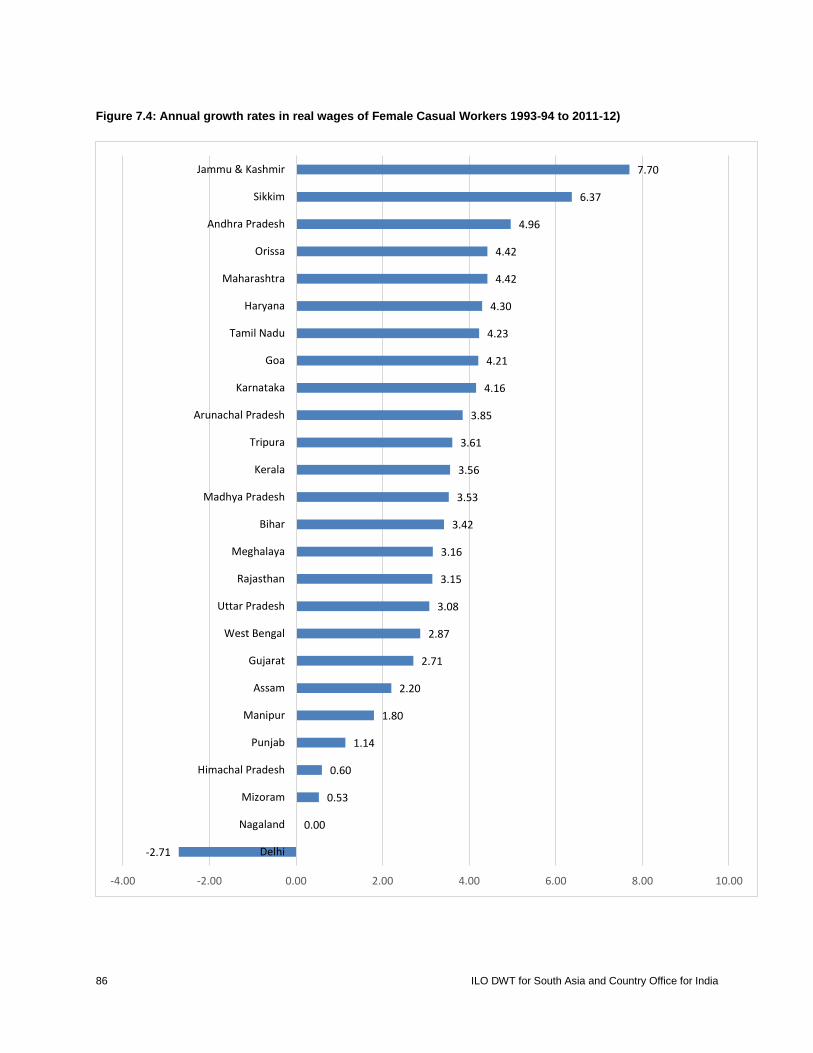
86 ILO DWT for South Asia and Country Office for India
Figure 7.4: Annual growth rates in real wages of Female Casual Workers 1993-94 to 2011-12)
-2.71
0.00
0.53
0.60
1.14
1.80
2.20
2.71
2.87
3.08
3.15
3.16
3.42
3.53
3.56
3.61
3.85
4.16
4.21
4.23
4.30
4.42
4.42
4.96
6.37
7.70
-4.00 -2.00 0.00 2.00 4.00 6.00 8.00 10.00
Delhi
Nagaland
Mizoram
Himachal Pradesh
Punjab
Manipur
Assam
Gujarat
West Bengal
Uttar Pradesh
Rajasthan
Meghalaya
Bihar
Madhya Pradesh
Kerala
Tripura
Arunachal Pradesh
Karnataka
Goa
Tamil Nadu
Haryana
Maharashtra
Orissa
Andhra Pradesh
Sikkim
Jammu & Kashmir

ILO DWT for South Asia and Country Office for India 87
7.3. Toppers, middlers and laggards in wage growth
While ranking in terms of growth performance gives an idea of performance, we noted that it has to be
judged against the overall economic growth performance. One can also determine the level of performance
in terms of those in the top, middle and bottom segments. While there are several ways of doing it, one
method is to generate levels of performance based on the comparative performance of the participants, in
this case states. Here we classify the states into four levels based on the performance of growth rate in real
wages paid to male workers for the period 1993-94 to 2011-12. The difference between the states with the
highest and lowest growth rate is calculated and then divided by four (to get four divisions). This numerical
i.e. the first one-fourth of the difference is deducted from the highest growth rate to get the Top Level range,
then the second one-fourth is added and deducted to get the Upper Middle Level, the third one-fourth is
then added and deducted to get the Lower Middle Level and the rest belongs to the Bottom Level. The
growth rates in wages of women are then allocated according to this classification to see whether they
belong to the same level of performance of male wages or not. If they do, they have a similar position as
defined by the range. A vertical comparison would tell us the nature of vertical inequality across states and
a horizontal comparison would tell us the nature of horizontal inequality with respect to men and women
and also between regular and casual workers. The results of this exercise are presented in Table 7.1.
Real wage rate Casual wage rate
Male Female Male Female
Top level [5.33 to 6.64]
AR (6.64), HR (5.51)
AR (8.69), HR (6.01)
Nil JK (7.70), SK (6.37)
Upper middle [4.02 to 5.32]
MZ (5.24), SK (4.78) MN (4.44), DL (4.11)
SK (4.45), MN (4.27)
AP_U (5.09), BH (4.58), OD (4.68), KR (4.67), KE (4.58), TN (4.52)
AP-U (4.96), HR (4.30), GO (4.21) MH (4.42), OD (4.42) TN (4.23), KR (4.16)
Lower middle [2.71 to 4.01]
AS (3.99), NG (3.70) PO (3.63), AP-U (3.54) KE (3.39), BH (3.39), MH (3.35), JK (3.28) TN (3.27), MG (3.08) UP (3.00), MP (2.80) WB (2.71)
DL (3.84), KR (3.88) GO (3.85), AS (3.73), MZ (3.51), TN (3.35), MH (3.24), OD (3.16) KE (2.75), MP (2.72)
SK (3.95), MG (3.80), MH (3.64), JK (3.18), RJ (3.14), MP (2.99) AR (2.99), UP (2.98) HR (2.94)
AR (3.85), TR (3.61) KE (3.56), MP (3.53) BH (3.42), MG (3.16) RJ (3.15), UP (3.08) WB (2.87), GJ (2.71)
Bottom level [Less than 2.71]
GO (2.70), RJ (2.50) KR (2.46), OD (2.30) HP (2.24), PJ (2.05) TR (2.04), GJ (1.41)
AP-U (2.51), UP (2.36) WB (2.44), PO (2.35) JK (2.19), NG (2.22), MG (1.97), RJ (1.64) TR (1.38), PJ (1.35) GJ (1.31), BH (1.11) HP (0.94)
AS (2.61), HP (2.58) DL (2.55), WB (2.45) GJ (2.42), TR (2.28) PJ (2.06), GO (1.93) MN (1.22), NG (0.59) MZ (0.28),
AS (2.20), MN (1.80), PJ (1.14), HP (0.60), MZ (0.53), DL (-2.71)
The results tell us that growth in wages in both regular and causal labour markets across the Indian states
has been quite uneven. For men in regular work, the growth rate during the 1993-94 and 2011-12 period of
nearly two decades has been the lowest in Gujarat despite the state being one of the fastest growing in terms
Table 7.1: Annual average growth rates in real wages during 1993-94 to 2011-12
88 ILO DWT for South Asia and Country Office for India
of state income or Gross State Domestic Product (GSDP). The best performance has come from Arunachal
Pradesh, with an annual growth in wages of regular workers at 6.64 per cent per annum followed by Haryana
at 5.51. In fact, these are the only two states at the top level. Mizoram, Manipur, Sikkim and Delhi are in
the Upper Middle level. Another 13 states are at the Lower Middle level. Note that Bihar, MP, and UP, all
have growth rates higher than the relatively more advanced states such as Gujarat, Punjab, Himachal
Pradesh and Karnataka. Comparing the growth rates of wages of women in this regular category, it is seen
that half the states are at the bottom including Gujarat, Punjab and Himachal Pradesh. Bihar is second from
the bottom, suggesting a huge disadvantage for women in regular work in comparison to men in Bihar.
As for wages in the casual labour market, the growth in wages for women has been somewhat better than
that for men. The number of states at the bottom level for men is 11 as against 6 for women. Of course,
such a scenario was also suggested at the all India level (see Chapter 4) but what is significant here is the
regional differentiation. Punjab and Himachal occupy the bottom level in terms of growth in wages for
women, although Mizoram and Delhi present a bleak picture.
7.4. Wage levels and disparities: Regular workers
However, we need to contextualize these growth rates in terms of levels of wages so that whether this is a
case of greater convergence or divergence will be known. We may also compare the levels for both men
and women. Therefore, a similar exercise combining the vertical and horizontal dimensions of
disparity/inequality has been attempted. Instead of growth rates, we take here the wages of male regular
workers as the basis for classification according to the four levels. The results are presented in Table 7.2
for men and women, regular workers, at two points: 1993-94 and 2011-12. In addition, we have also
calculated the coefficient of variation that summarizes whether the inter-state disparity has increased or
decreased.
The results reveal some small surprises. For example, in 1993-94, three states are at the Top Level for
regular male and female workers. Two of them are common for both men and women indicating their wage
parity; in fact, Mizoram’s women show a higher wage than men by around five percent. However, by 2011-
12 only two states are at the Top Level for men and none for women. Among the two states, Mizoram
retained its position while Arunachal Pradesh has emerged as a top performer with the second highest wage
rate for regular male workers. There is no state at this level for women, indicating a decline in their ability
to remain at the top along with the men at this point. In the Upper Middle Level, the number of states
declined from seven to five whereas for women it increased from 3 to 4. There is a reduction in the number
of states at the Lower Middle level for both men and women. What is significant to note is that in the
Bottom Level, the number of states increased for both men and women, indicating the increasing disparity
for the both the categories during the period 1993 to 2012. Gujarat, which registered one of the lowest
growth rates, is also at the Bottom Level for both women and men, regular and casual workers, during both
periods — except for men in 1993-94. This indicates a worsening of the relative position of male regular
workers in Gujarat compared to their counterparts in other states. Punjab and Himachal Pradesh, which
were not at the Bottom Level in 1993-94, are now at this level, suggesting a fall in their ranking as far as
wages of regular workers are concerned. Another notable point is that Kerala is also at the Bottom Level as
far as women are concerned in both 1993-94 and 2011-12. At the same time, men have also joined the
Bottom Level in 2011-12.

ILO DWT for South Asia and Country Office for India 89
1993-94 1993-94 2011-12 2011-12
Male Female Male Female
Top Level [INR 161.5 to 178] [INR 387.25 to 457]
MN (178), NG (168) HP (163) [3]
MZ (186), DL (184) NG (167) [3]
MZ (457), AR (393) [2]
Nil [0]
Upper Middle [INR 145.0 to 161.4] [INR 317.5 to 387.24]
MG (159), MN (157) DL (155), KR (154) MH (152), BH (150) JK (148) [7]
MG (157) MN (152) PJ (145) [3]
HR (356), MN (349) NG (327), DL (325) SK (317) [5]
DL (367), MZ (350) HR (336), MN (328) [4]
Lower Middle (INR 128.5 to 144.9] [INR 247.75 to 317.4]
GO (143), TR (142) WB (140), GJ (138) UP (138), RJ (137) SK (134), KE (133) HR (132), MP (131) PJ (130) [11]
JK (141) BH (131) RJ (131) HP (130) [4]
JH (314) MH (278) MG (277) BH (276) JK (267) UK (259) [3]
AR (306) SK (274) UK (252) NG (249) [3]
Bottom [INR less than 128.5] [INR less than 247.75]
OD (127) TN (120) AR (119) AS (117) PO (117) AP-U (112) [6]
SK (123), TR (117) MH (116), HR (114) GJ (109), KE (106) UP (104), GO (100) MP (92), KR (89) WB (87), AP-U (86) OD (81), TN (81) PO (74), AS (72) AR (64) [17]
KE (245), HP (244) AS (240), KR (240) UP (237), GO (235) WB (228), PO (225) MP (217), RJ (215) AP-U (212), TR (205) OD (192), PJ (188) CH (183) GJ (178) [15]
MG (224), JK (209) MH (208), GO (200) JH (192), PJ (185), KR (179), RJ (176), KE (174),BH (160), UP (159),CH (158) HP (154), MP (150), TR (150), TN (148), OD (143), AS (141), GJ (138), AP-U (135), WB (135), PO (113) [20]
CV: 0.12 0.29 0.21 0.37
Note: Real wages are calculated by taking 2004-05 as the base. Names of states are given in abbreviated form. For full names see Abbreviations.
A word of explanation is necessary regarding the top two levels occupied by most of the north-eastern
states, especially Mizoram, Meghalaya, Nagaland, Manipur in the early 1990s, and these four plus
Arunachal and Sikkim in the recent period. This could possibly be due to a very low share of regular workers
dominated by employees in public administration.
The main message coming out of this exercise is that as far as wages in the labour market for regular
employment are concerned, the two decades of economic reforms with high economic growth are
characterized by an increasing regional (inter-state) disparity in wages for both men and women. That the
relative position of women in this labour market has worsened during this period adds an additional gender
dimension to this scenario. For example, while 60 per cent of the states were at the Bottom Level (17 out
of 27) in 1993-94, it increased to close to 75 per cent (20 out of 27) in 2011-12.
Table 7.2: State-wise real wage rates of regular workers (INR per day)

90 ILO DWT for South Asia and Country Office for India
7.5. Wage levels and disparities: Casual workers
The regional dimension for casual workers is perhaps more important than it is for regular workers given
the fact that more than 60 per cent (61 per cent in 2011-12) of wage workers in the country belong to this
category. But it has a greater relevance to the rural economy because 52 per cent of the total wage workers
are rural casual workers in 2011-12. In other words, of the total casual workers 85 per cent are in rural
areas. Among ST wage workers, 75 per cent were rural casual workers in 2011-12. This is 66 per cent for
SC and 54 per cent for Muslim. For OBC and the socially advantage group of Others the shares are 47 and
24 per cent respectively.
For casual workers, the picture is quite different, as given in Table 7.3. The regional disparity based on the
performance of male workers show there is no state at the Top Level for women for the time periods that
we have detailed. For male workers, the top level position of Mizoram and Delhi in 1993-93 has been
replaced by Kerala in 2011-12. The number of states for men at the Upper Middle Level came down from
five to two during the period, while for the Lower Middle level it increased from eight to 14. The number
of states at the Bottom Level increased by one for men. For women there was no state at the top during both
the years. In 2011-12, there was none at the Upper Middle level compared to two states in 1993-93. The
number of states at the Lower Middle level declined from 14 to two, resulting in a majority of 24 states
clustering at the Bottom Level. Clearly women casual workers, despite a higher overall growth rate at the
national level, lost out to men in terms of their regional performance. The lowest real wage rate for men in
1993-94 was in Odisha (INR31) but there were seven states with wage rates lower than this for women. In
2011-12, the lowest wage was for MP (INR 60) for men but there were 10 states with wage rates lower than
this for women.
1993-94 2011-12
Male Female Male Female
Top level [INR 94 to 115] [INR 162 to 196.0]
MZ (115), DL (98) [2]
Nil [0]
KE (196) [1]
Nil [0]
Upper middle [INR 73 to 93.9] [INR 128 to 161.9]
NG (90), KE (86) PJ (78), GO (77), MN (73) [5]
DL (88) MZ (80) [2]
DL (155) PO (128) [2]
Nil [0]
Lower middle [Rs. 52 to 72.9] [INR 94 to 127.9]
AR (66), HR (66), JK (66), HP (61) TR (61), PO (58) MG (57), RJ (54) [8]
PJ (66) HP (61) MN (55) [3]
MZ (121), JK (117) TN (115), AR (113) MG (113), PJ (113) HR (112), SK (110) UK (101), GO (109), NG (100), HP (97), AP-U (95), KR (95), RJ (95) [14]
SK (126) JK (124) [2]
Bottom level [Less than INR 52] [Less than INR 94]
TN (51), AS (50) UP (45), WB (45) GJ (44), KR (41) MH (41), AP-U (38) MP (35), BH (32) OD (31)
KE (49), MG (43) AR (42), HR (42) SK (40), AS (39) RJ (38), GO (37) PO (36), GJ (35) TR (35), WB (34)
TR (92), MN (91) AS (80), MH (79) JH (78), UP (77), BH (73), OD (72), WB (70), GJ (68), MP (60), CH (54)
KE (93), HR (91) MZ (88), AR (84) PJ (81), GO (79) MN (76), MG (76) UK (73), PO (70), HP (68), RJ (67),
Table 7.3: State-wise real wage rates (INR per day) of casual workers (2004-05 constant prices)

ILO DWT for South Asia and Country Office for India 91
[11]
JK (31), UP (31) TN (28), BH (27) MP (27), KR (26) AP-U (25), MH (23) OD (23) [21]
[10]
TR (67), AP-U (61), TN (60), AS (58), GJ (57), WB (57), KR (55), UP (54), DL (54), MP (51), MH (51), OD (51), BH (50), CH (46), JH (44) [24]

92 ILO DWT for South Asia and Country Office for India
Figure 7.5: State-wise real wage rates C as % of R for Male worker
0.0
21.3
24.4
26.6
26.7
27.0
31.9
32.1
32.6
33.9
35.8
37.4
39.4
40.3
42.5
42.7
43.0
44.6
46.5
50.0
53.6
53.8
55.5
60.0
63.2
64.6
64.7
0.0
26.1
26.4
26.5
27.6
28.4
28.8
30.6
30.7
31.5
32.5
33.3
34.7
37.5
38.2
39.6
39.8
40.8
43.8
44.2
44.8
44.9
46.4
47.7
53.2
60.1
80.0
0.0 10.0 20.0 30.0 40.0 50.0 60.0 70.0 80.0 90.0
Pondicherry
Bihar
Orissa
Karnataka
MP
Maharashtra
Gujarat
West Bengal
Uttar Pradesh
AP
Meghalaya
HP
Rajasthan
Sikkim
Tamil Nadu
Assam
Tripura
J & K
Manipur
Haryana
Nagaland
Goa
Arunachal Pr
Punjab
Delhi
Mizoram
Kerala
2011-12
1993-94

ILO DWT for South Asia and Country Office for India 93
Figure 7.6: Real wages of casual as % of Regular for Female workers
0.0
0.0
19.8
20.6
22.0
27.4
28.4
29.0
29.1
29.2
29.3
29.8
29.9
32.1
32.5
34.6
36.2
36.8
37.0
39.1
43.0
45.5
46.2
46.9
47.8
54.2
65.6
0.0
0.0
14.7
23.2
24.5
25.1
27.1
27.5
30.7
31.3
33.9
34.0
34.0
35.7
38.1
39.5
40.5
41.1
41.3
42.2
43.8
44.2
44.7
45.2
46.0
53.4
59.3
0.0 10.0 20.0 30.0 40.0 50.0 60.0 70.0
Nagaland
Pondicherry
Maharashtra
Bihar
J & K
Meghalaya
Orissa
Rajasthan
AP
Karnataka
MP
Uttar Pradesh
Tripura
Gujarat
Sikkim
Tamil Nadu
Manipur
Haryana
Goa
West Bengal
Mizoram
Punjab
Kerala
HP
Delhi
Assam
Arunachal Pr
2011-12
1993-94

94 ILO DWT for South Asia and Country Office for India
7.6. Regional dimension of gender disparity in wages
Wage disparity between men and women workers across states is another marked feature of the Indian
labour market. In Table 7.4, we present them in a descending order in the initial period of 1993-94. Wages
of women regular workers varied from 119 per cent of men in Delhi to 58 per cent in Karnataka in 1993.
By 2012, this has changed to 113 per cent of men in Delhi to just 50 per cent in Pondicherry followed by
58 per cent in Bihar. For casual workers in 1993, the disparity varied between 100 per cent for women in
Himachal Pradesh to 47 per cent in Jammu and Kashmir. But by 2012, this changed dramatically to 106
per cent in Jammu and Kashmir to a mere 35 per cent in Delhi.
A few findings warrant highlighting. In 1993, women regular workers in Delhi, Punjab and Mizoram
showed a wage advantage over men in regular employment by receiving a higher wage than men. By 2012,
only Delhi retained this advantage. Between 1993 and 2012, women regular workers in 18 states
experienced a decline in the share of wages as compared to men. This includes the high wage states of
Mizoram, Nagaland, Meghalaya and Manipur. Only in five states (Haryana, Goa, Tamil Nadu, Odisha and
Karnataka), there was an increase in the share of women’s wages compared to men in this regular category.
As for casual workers, the top position occupied by Himachal Pradesh (with equal wages for men and
women) and Delhi in 1993 was replaced by Sikkim and Jammu and Kashmir. In 13 states, women
experienced a decline in the share of their wages compared to men. But in 11 other states, women
experienced an increase in the share of their wages compared to men. This includes the high wage states of
Kerala and Punjab. In the high wage state of Haryana, women improved their position viz-a-viz men. It is
the large states where the women have improved their position that have contributed to a faster increase in
casual wages of women workers for the country as a whole.
Regular wage workers Casual wage workers
state 1993-94 2011-12 state 1993-94 2011-12
Disparity increased but not disadvantageous to women
Disparity decreased and advantageous to women
Delhi 118.7 112.9 Jammu & Kashmir 47.0 106.0
Punjab 111.5 98.4 Sikkim 74.1 114.5
Increasing disparity and increasing disadvantage to women
Increasing disparity and increasing disadvantage to women
Mizoram 104.5 76.6 Himachal Pradesh 100.0 70.1
Nagaland 99.4 76.1 Delhi 89.8 34.8
Meghalaya 98.7 80.9 Punjab 84.6 71.7
Manipur 96.8 94.0 Bihar 84.4 68.5
Rajasthan 95.6 81.9 Assam 78.0 72.5
Jammu & Kashmir 95.3 78.3 Meghalaya 75.4 67.3
Sikkim 91.8 86.4 Odisha 74.2 70.8
Bihar 87.3 58.0 Andhra Pradesh 65.8 64.2
Tripura 82.4 73.2 Karnataka 63.4 57.9
Himachal Pradesh 79.8 63.1 Pondicherry 62.1 54.7
Kerala 79.7 71.0 Tripura 57.4 72.8
Table 7.4: Gender disparity in wages (wages of women as % of men)

ILO DWT for South Asia and Country Office for India 95
Gujarat 79.0 77.5 Kerala 57.0 47.4
Maharashtra 76.3 74.8 Tamil Nadu 54.9 52.2
Uttar Pradesh 75.4 67.1 Decreasing disparity and decreasing disadvantage to women
Madhya Pradesh 70.2 69.1 Gujarat 79.5 83.8
Pondicherry 63.2 50.2 Madhya Pradesh 77.1 85.0
West Bengal 62.1 59.2 West Bengal 75.6 81.4
Assam 61.5 58.8 Manipur 75.3 83.5
Decreasing disparity and increasing advantage to women
Rajasthan 70.4 70.5
Haryana 86.4 94.4 Mizoram 69.6 72.7
Goa 69.9 85.1 Uttar Pradesh 68.9 70.1
Tamil Nadu 67.5 68.5 Haryana 63.6 81.3
Odisha 63.8 74.5 Arunachal Pradesh 63.6 74.3
Karnataka 57.8 74.6
Maharashtra 56.1 64.6
Goa 48.1 72.5
Note: Nagaland is omitted due to non-availability of data.
[Enter UK, JH and CH by taking figures from real wages tables]
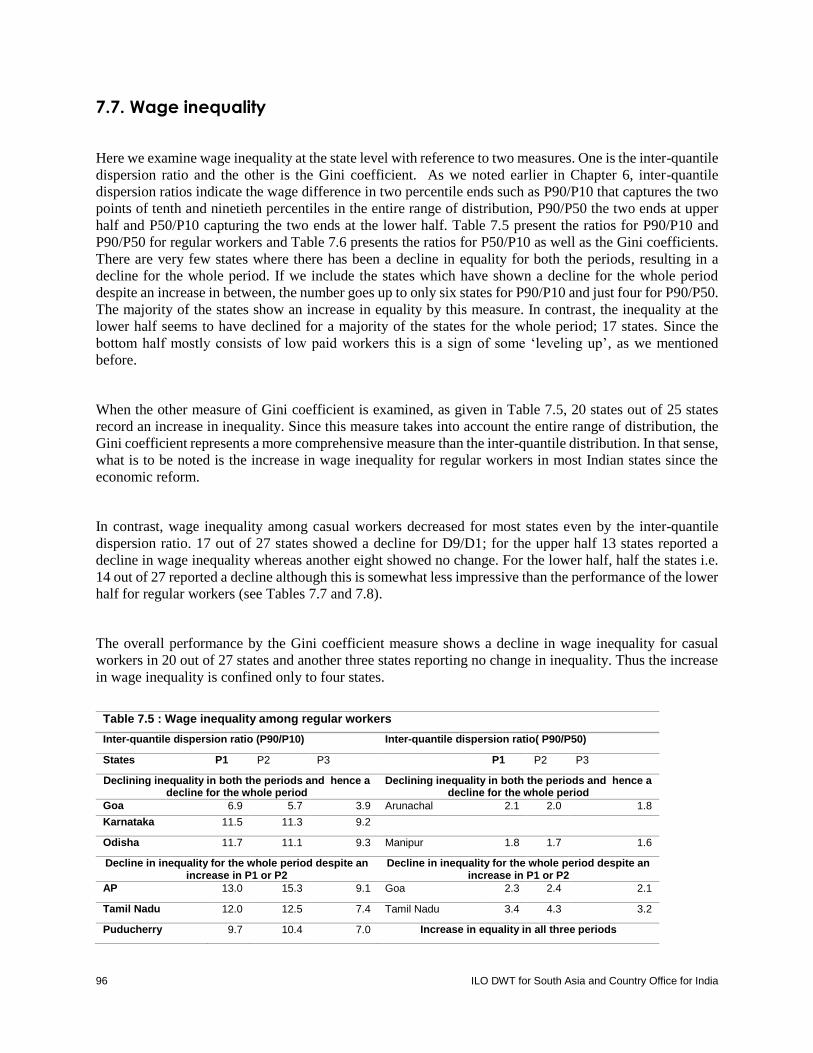
96 ILO DWT for South Asia and Country Office for India
7.7. Wage inequality
Here we examine wage inequality at the state level with reference to two measures. One is the inter-quantile
dispersion ratio and the other is the Gini coefficient. As we noted earlier in Chapter 6, inter-quantile
dispersion ratios indicate the wage difference in two percentile ends such as P90/P10 that captures the two
points of tenth and ninetieth percentiles in the entire range of distribution, P90/P50 the two ends at upper
half and P50/P10 capturing the two ends at the lower half. Table 7.5 present the ratios for P90/P10 and
P90/P50 for regular workers and Table 7.6 presents the ratios for P50/P10 as well as the Gini coefficients.
There are very few states where there has been a decline in equality for both the periods, resulting in a
decline for the whole period. If we include the states which have shown a decline for the whole period
despite an increase in between, the number goes up to only six states for P90/P10 and just four for P90/P50.
The majority of the states show an increase in equality by this measure. In contrast, the inequality at the
lower half seems to have declined for a majority of the states for the whole period; 17 states. Since the
bottom half mostly consists of low paid workers this is a sign of some ‘leveling up’, as we mentioned
before.
When the other measure of Gini coefficient is examined, as given in Table 7.5, 20 states out of 25 states
record an increase in inequality. Since this measure takes into account the entire range of distribution, the
Gini coefficient represents a more comprehensive measure than the inter-quantile distribution. In that sense,
what is to be noted is the increase in wage inequality for regular workers in most Indian states since the
economic reform.
In contrast, wage inequality among casual workers decreased for most states even by the inter-quantile
dispersion ratio. 17 out of 27 states showed a decline for D9/D1; for the upper half 13 states reported a
decline in wage inequality whereas another eight showed no change. For the lower half, half the states i.e.
14 out of 27 reported a decline although this is somewhat less impressive than the performance of the lower
half for regular workers (see Tables 7.7 and 7.8).
The overall performance by the Gini coefficient measure shows a decline in wage inequality for casual
workers in 20 out of 27 states and another three states reporting no change in inequality. Thus the increase
in wage inequality is confined only to four states.
Inter-quantile dispersion ratio (P90/P10) Inter-quantile dispersion ratio( P90/P50)
States P1 P2 P3 P1 P2 P3
Declining inequality in both the periods and hence a decline for the whole period
Declining inequality in both the periods and hence a decline for the whole period
Goa 6.9 5.7 3.9 Arunachal 2.1 2.0 1.8
Karnataka 11.5 11.3 9.2
Odisha 11.7 11.1 9.3 Manipur 1.8 1.7 1.6
Decline in inequality for the whole period despite an increase in P1 or P2
Decline in inequality for the whole period despite an increase in P1 or P2
AP 13.0 15.3 9.1 Goa 2.3 2.4 2.1
Tamil Nadu 12.0 12.5 7.4 Tamil Nadu 3.4 4.3 3.2
Puducherry 9.7 10.4 7.0 Increase in equality in all three periods
Table 7.5 : Wage inequality among regular workers
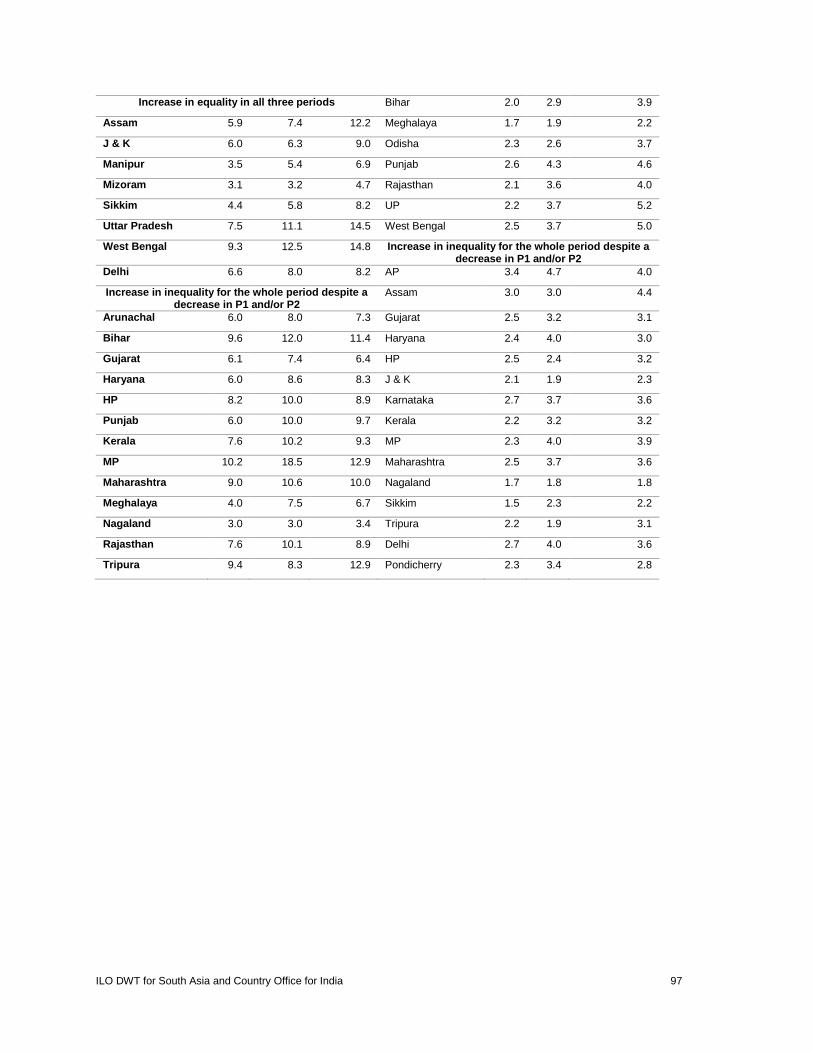
ILO DWT for South Asia and Country Office for India 97
Increase in equality in all three periods Bihar 2.0 2.9 3.9
Assam 5.9 7.4 12.2 Meghalaya 1.7 1.9 2.2
J & K 6.0 6.3 9.0 Odisha 2.3 2.6 3.7
Manipur 3.5 5.4 6.9 Punjab 2.6 4.3 4.6
Mizoram 3.1 3.2 4.7 Rajasthan 2.1 3.6 4.0
Sikkim 4.4 5.8 8.2 UP 2.2 3.7 5.2
Uttar Pradesh 7.5 11.1 14.5 West Bengal 2.5 3.7 5.0
West Bengal 9.3 12.5 14.8 Increase in inequality for the whole period despite a decrease in P1 and/or P2
Delhi 6.6 8.0 8.2 AP 3.4 4.7 4.0
Increase in inequality for the whole period despite a decrease in P1 and/or P2
Assam 3.0 3.0 4.4
Arunachal 6.0 8.0 7.3 Gujarat 2.5 3.2 3.1
Bihar 9.6 12.0 11.4 Haryana 2.4 4.0 3.0
Gujarat 6.1 7.4 6.4 HP 2.5 2.4 3.2
Haryana 6.0 8.6 8.3 J & K 2.1 1.9 2.3
HP 8.2 10.0 8.9 Karnataka 2.7 3.7 3.6
Punjab 6.0 10.0 9.7 Kerala 2.2 3.2 3.2
Kerala 7.6 10.2 9.3 MP 2.3 4.0 3.9
MP 10.2 18.5 12.9 Maharashtra 2.5 3.7 3.6
Maharashtra 9.0 10.6 10.0 Nagaland 1.7 1.8 1.8
Meghalaya 4.0 7.5 6.7 Sikkim 1.5 2.3 2.2
Nagaland 3.0 3.0 3.4 Tripura 2.2 1.9 3.1
Rajasthan 7.6 10.1 8.9 Delhi 2.7 4.0 3.6
Tripura 9.4 8.3 12.9 Pondicherry 2.3 3.4 2.8

98 ILO DWT for South Asia and Country Office for India
Inter-quantile dispersion ratio (P50/P10) Gini coefficient
State P1 P2 P3 State P1 P2 P3
Declining inequality in both the periods and hence a decline for the whole period
Declining inequality in both the periods and hence a decline for the whole period
AP 3.8 3.3 2.3 Nil
Bihar 4.9 4.2 2.9 Decline in inequality for the whole period despite an increase or no change in P1 or P2
Goa 3.0 2.3 1.9 Arunachal P 0.43 0.35 0.35
Gujarat 2.4 2.3 2.1 Andhra Pradesh 0.47 0.53 0.47
Karnataka 4.3 3.0 2.6 Goa 0.36 0.36 0.32
Kerala 3.5 3.2 2.9 Tamil Nadu 0.46 0.51 0.44
Maharashtra 3.7 2.9 2.8 Pondicherry 0.42 0.45 0.40
Odisha 5.0 4.3 2.5 Increase in inequality in all three periods
Rajasthan 3.6 2.8 2.2 HP 0.37 0.42 0.45
Tamil Nadu 3.6 2.9 2.3 Kerala 0.38 0.45 0.47
Uttar Pradesh 3.4 3.0 2.8 Maharashtra 0.41 0.49 0.50
West Bengal 3.7 3.4 3.0 Meghalaya 0.27 0.35 0.36
Pondicherry 4.2 3.1 2.5 Mizoram 0.26 0.27 0.45
Decline in inequality for the whole period despite an increase or no change in P1 or P2
Nagaland 0.24 0.26 0.27
HP 3.2 4.2 2.8 Odisha 0.42 0.44 0.47
MP 4.4 4.6 3.3 Punjab 0.37 0.48 0.49
Punjab 2.3 2.3 2.1 Rajasthan 0.37 0.46 0.47
Delhi 2.4 2.0 2.3 Sikkim 0.25 0.37 0.41
Increase in equality in all three periods UP 0.39 0.47 0.56
Arunachal 2.8 4.0 4.1 West Bengal 0.43 0.51 0.54
Assam 2.0 2.4 2.8 Increase in inequality for the whole period despite a decrease or no change in P1 and/or P2
J & K 2.9 3.3 3.9 Gujarat 0.36 0.45 0.42
Manipur 2.0 3.2 4.2 Haryana 0.38 0.51 0.50
Increase in inequality for the whole period despite a decrease in P1 and/or P2
J & K 0.35 0.34 0.42
Haryana 2.5 2.1 2.8 Karnataka 0.45 0.47 0.46
Meghalaya 2.3 4.0 3.1 MP 0.42 0.50 0.49
Mizoram 2.0 1.9 2.7 Manipur 0.28 0.30 0.30
Nagaland 1.8 1.7 1.9 Tripura 0.39 0.36 0.47
Sikkim 3.0 2.5 3.7 Delhi 0.40 0.46 0.46
Tripura 4.2 4.4 4.2
Table 7.6 : Wage inequality among regular workers

ILO DWT for South Asia and Country Office for India 99
Inter-quantile dispersion ratio (P90/P10) Inter-quantile dispersion ratio (P90/P50)
State P1 P2 P3 State P1 P2 P3
Declining inequality in both the periods and hence a decline for the whole period
Declining inequality in both the periods and hence a decline for the whole period
Bihar 2.5 2.4 2.3 AP 2.0 1.8 1.6
HP 2.4 2.3 2.0 Karnataka 2.0 1.9 1.6
MP 3.2 2.6 2.5 Kerala 1.8 1.7 1.5
Nagaland 7.3 2.6 2.3 MP 2.0 1.8 1.5
Punjab 2.3 2.2 1.9 Decline in inequality for the whole period despite an increase or no change in P1 or P2
Tripura 2.9 2.6 1.8 Arunachal P 2.7 3.2 1.7
Decline in inequality for the whole period despite an increase or no change in P1 or P2
HP 1.7 1.4 1.5
AP 3.0 3.5 2.6 Manipur 2.3 2.0 2.0
Arunachal P 3.9 4.9 2.9 Odisha 1.7 1.7 1.4
Goa 3.6 2.5 3.3 Punjab 1.4 1.4 1.3
Haryana 10.8 2.5 2.8 Rajasthan 1.8 1.3 1.7
Kerala 3.5 4.0 3.3 UP 1.8 1.5 1.7
Manipur 4.6 2.9 3.1 West Bengal 1.5 1.6 1.4
Rajasthan 3.0 2.0 2.5 Pondicherry 2.1 1.9 2.0
Sikkim 2.2 2.5 2.0 No change throughout or for the whole period
Tamil Nadu 4.0 4.0 3.8 Bihar 1.5 1.5 1.5
UP 4.0 2.5 2.5 J & K 1.4 1.4 1.4
Delhi 3.2 2.6 3.1 Tamil Nadu 2.0 2.0 2.0
Increase in equality in all three periods Gujarat 2.0 1.6 2.0
Karnataka 3.0 3.1 3.4 Haryana 1.4 1.3 1.4
Mizoram 2.4 2.5 3.2 Maharashtra 2.0 1.8 2.0
Pondicherry 4.1 4.1 4.5 Meghalaya 1.6 1.7 1.6
Increase in inequality for the whole period despite a decrease or no change in P1 and/or P2
Nagaland 1.7 1.8 1.7
Increase in equality in all three periods
Gujarat 3.3 3.1 3.4 Nil
Assam 2.2 1.9 3.0 Increase in inequality for the whole period despite a decrease or no change in P1 and/or P2
J & K 2.4 2.5 2.5 Assam 1.5 1.3 1.6
Maharashtra 3.0 3.5 3.2 Goa 1.9 1.6 2.0
Meghalaya 2.1 2.9 2.8 Mizoram 1.6 2.0 1.7
Odisha 2.5 3.0 2.7 Sikkim 1.3 1.5 1.4
West Bengal 2.3 2.4 2.3 Tripura 1.3 1.5 1.4
Delhi 1.3 1.4 2.0
Table 7.7: Wage inequality - casual workers

100 ILO DWT for South Asia and Country Office for India
Inter-quantile dispersion ratio (P50/P 10) Gini coefficient
State P1 P2 P3 State P1 P2 P3
Declining inequality in both the periods and hence a decline for the whole period
Declining inequality in both the periods and hence a decline for the whole period
Bihar 1.7 1.6 1.5 AP 0.25 0.25 0.23
Haryana 7.3 1.9 1.9 Bihar 0.24 0.20 0.19
Punjab 1.7 1.6 1.5 HP 0.22 0.19 0.17
Tripura 2.1 1.8 1.3 MP 0.28 0.22 0.20
Uttar Pradesh 2.2 1.7 1.5 Manipur 0.29 0.28 0.24
Delhi 2.5 1.9 1.5 Nagaland 0.27 0.25 0.22
Decline in inequality for the whole period despite an increase or no change in P1 or P2
Punjab 0.19 0.18 0.15
Goa 1.9 1.5 1.6 Sikkim 0.19 0.18 0.17
Himachal Pradesh 1.4 1.6 1.3 Tripura 0.33 0.20 0.15
Manipur 2.0 1.4 1.6 Decline in inequality for the whole period despite an increase or no change in P1 or P2
Nagaland 4.3 1.4 1.4 Arunachal P 0.37 0.39 0.24
Rajasthan 1.7 1.5 1.5 Goa 0.30 0.19 0.26
Sikkim 1.7 1.7 1.5 Haryana 0.32 0.16 0.21
Tamil Nadu 2.0 2.0 1.9 J & K 0.22 0.18 0.18
No change throughout or for the whole period Karnataka 0.28 0.28 0.26
Gujarat 1.7 1.9 1.7 Maharashtra 0.29 0.29 0.24
Increase in inequality in all three periods Odisha 0.23 0.24 0.21
Karnataka 1.5 1.6 2.1 Rajasthan 0.27 0.19 0.20
Meghalaya 1.3 1.7 1.8 Tamil Nadu 0.30 0.28 0.29
Odisha 1.5 1.8 1.9 Uttar Pradesh 0.28 0.20 0.21
Increase in inequality for the whole period despite a decrease or no change in P1 and/or P2
West Bengal 0.22 0.23 0.19
Andhra Pradesh 1.5 2.0 1.6 No change throughout or for the whole period
Arunachal Pradesh 1.4 1.5 1.7 Gujarat 0.27 0.26 0.27
Assam 1.5 1.4 1.9 Kerala 0.25 0.26 0.25
Jammu & Kashmir 1.7 1.8 1.8 Pondicherry 0.28 0.26 0.28
Kerala 2.0 2.4 2.2 Increase in inequality for the whole period despite a decrease or no change in P1 and/or P2
Madhya Pradesh 1.6 1.5 1.7 Assam 0.21 0.15 0.25
Maharashtra 1.5 2.0 1.6 Meghalaya 0.22 0.22 0.24
Mizoram 1.5 1.3 1.9 Mizoram 0.23 0.21 0.24
West Bengal 1.5 1.5 1.7 Delhi 0.20 0.19 0.25
Pondicherry 1.9 2.1 2.3
Table 7.8: Wage inequality among casual workers

ILO DWT for South Asia and Country Office for India 101
7.8. Summing up
There is considerable variation across states in both levels and growth rates in wages of both regular and
casual workers. This is not merely due to differences in economic growth performance. It could also be due
to a variety of factors including wage policies and institutions as well as human development levels. Wage
elasticity with respect to growth in per capita income show that despite low growth, several states have
witnessed high wage elasticity.
In the market for regular work, a larger number of states record a lower growth rate for women compared
to men. An opposite picture is seen when we examine the growth performance in wages of casual workers.
Inter-state disparity as measured by the coefficient of variation show an increase for both men and women
in the case of regular workers. For men it increased from 0.12 in 1993-94 to 0.26 in 2011-12, whereas for
women it increased from 0.26 to 0.37 for the same period. Therefore, in the case of the market for regular
work for men, there is a high initial level of disparity and the same has continued with a marginal decline
compared to men. The casual labour market for both men and women was characterized by a higher level
of disparity in 1993-94, which has declined for both. For men, the coefficient of variation was 0.35 that
declined to 0.29 during 1993-94 and 2011-12, whereas for women it declined from 0.41 to 0.29. In that
sense, the inter-state disparity is the same for both men and women in casual work. That it has seen a decline
indicates that there is some levelling for both men and women.
Gender disparity also presents a mixed picture. But in the case of regular work, 18 out of 25 states show an
increasing disparity that is disadvantageous to women between 1993-94 and 2011-12. The scenario for
casual work is somewhat better in the sense that the number of states showing increasing disparity to women
is 13 out of 25. The situation is one of two opposing trends; in half the states women faced decreasing
disparity where in the remaining half they faced increasing disparity. It is significant here to point out there
in a couple of states (Delhi and Punjab) women enjoyed a higher wage rate in 1993-94 — but only Delhi
could retain that position in 2011-12. In the case of casual work, Jammu and Kashmir and Sikkim have
emerged as states where women enjoy a higher average wage than men in 2011-12. The Gini coefficients
of inequality show an increase in inequality in 20 out of 27 states.
Inequality measures show that there has been a decline in wage inequality in regular work in the bottom
half of the wage distribution as measured by D5/D1 for a majority of states (17 out of 27 states). For casual
workers, the number of states is just half (13 out of 27). But the Gini coefficient measure of inequality show
a decline for casual workers in 20 out of 27 states. This picture is exactly opposite of what is seen for regular
workers.
In conclusion, the findings of inequality within the states show a decline for casual workers and an increase
for regular workers. The increasing diversification of jobs with greater specialization and the introduction
of new technologies and organization of work seem to have influenced greater inequality in the wages of
regular workers. But the wages in the casual labour market characterized by poorly educated manual
workers is perhaps converging within the states.

102 ILO DWT for South Asia and Country Office for India
8. Wage policy I - Legislations and institutions on
minimum wages
8.1. Introduction
In common with the universally recognized principles and practices, wage policy in India is based on the
recognition of the twin dimension of wages as source of livelihood to the worker and cost to the employer.
There is no single comprehensive document or statement that defines the contents of an Indian wage policy.
It is reflected in various statements in official documents, semi-official pronouncements and resolutions,
legislative enactments, reports of the committees and commissions and boards appointed by the government
from time to time and judicial decisions. The basic tenets of wage policy as advanced in these processes
primarily consist of the following: one, a worker must receive at least a minimum wage that meets the
requirements of a reasonable minimum level of living for the worker and his/ her family; two, worker should
receive a share in the prosperity of the employing enterprise and the economy in the form of rising wages;
and, third, their wages should not be set as high as to adversely affect the survival and growth of the
enterprise. Thus besides subsistence, criteria like the changes in cost of living, productivity and profitability
have featured in wage policy statements and wage fixation processes. The issue of wage-cost inflation also
found mention in some documents, but it was not taken up at the level of actual wage fixation as most of it
took place at the individual industry level (in the formal sector of the economy) where macro-economic
consideration like inflation did not feature as important consideration. Besides, the principle of equal wage
for equal work and elimination of discrimination, especially one based on gender, is also a basic principle
of the Indian wage policy.
Wage policy in India has been inspired and influenced by several national and international ideologies and
developments. The Indian labour movement, which started gaining strength as part of the national
movement for independence during the 1920s, clearly influenced the national political leadership to frame
a progressive labour policy, in general, and wage policy, in particular in the post-independence period.
Establishment of the International Labour Organisation in 1919, of which India became a founder member,
and its adoption of conventions and recommendations — related to wages, like abolishing malpractices in
wage payment, setting up a minimum wage level for workers with weak bargaining position, ensuring
adequate living wage and just share for workers, equal remuneration for work of equal value and efficient
allocation and utilization of manpower — had a major influence in the setting of wage policy and legislative
framework for wages in India. Within a year of Independence, the Minimum Wages Act was passed by the
Indian government and a Fair Wage Committee was appointed to recommend a framework for fixation of
minimum and higher levels of wages. The Constitution of India adopted in 1952 proposed a ‘living wage’
as an objective the state should endeavour to achieve. Several other committees and commissions were set
up subsequently to advice on labour and wage policy.
In 1973, the Planning Commission set up a committee on wage policy under the chairmanship of Professor
Sukhamoy Chakravarty. It recommended measures to ensure minimum wages to workers and share of
workers in growth and productivity, rationalization of wage differentials, reduction in wage disparity,
provision for just compensation for inflation and health risks and protection of real wages while keeping
prices stable and reducing unemployment. Another committee (Bhoothalingam Study Group, 1978) asked
for rationalization of wage-differentials and wage disparities and linking of wages with productivity. Two
national commissions on labour (First, 1966-1969 and second, 1999-2002) also dealt with the question of

ILO DWT for South Asia and Country Office for India 103
wages among other issues concerning labour. On the question of wages, the first Commission emphasized
the need for a wage policy which ensures industrial harmony, increase in productivity and workers’ share
in it, and, of course, workers’ standard of living. It also asks to take the impact of wages on prices into
consideration. The second NCL focused more on labour flexibility, technological changes and economic
growth as considerations in setting wages. National Commission on Rural Labour (1991) recommended
and laid down some broad guidelines for fixing the National Floor Level Minimum Wage, linking wages
to capacity to pay and production and the concept of dearness allowance and bonus, towards setting up a
wage structure.
The National Commission for Enterprises in the Unorganized Sector (NCEUS) also recommended a
statutorily backed National Minimum Wage along with a National Minimum Social Security and a
Minimum Conditions of Work to ensure the safety and health of the workers (NCEUS 2006 and 2008). The
reasons for such recommendations will be spelt out later.
In this and the following chapter, we discuss the various concepts, principles, legislations and practices of
wage fixation in India. Here we discuss the constitutional mandate on wage policy and government policy
on wages. This is followed by a detailed discussion on minimum wages, which has an early legislative
backup and potential coverage of all low-paid wage workers in the economy. In the next chapter, we discuss
other legislative measures relating to wage payment and their implementation that have a direct relation to
wage structure. In addition, we will also discuss the different wage setting practices, their historical
evolution and the present scenario.
8.2. Concepts and approaches
8.2.1. Constitutional mandate
The Constitution of India accepts the responsibility of the state to ensure fair payment to workers and just
distribution of income in the economy. This constitutional provision is clearly stated in the Directive
Principles of State Policy. Article 39 directs the state to provide adequate means of livelihood and avoid
gender-based discrimination in employment and payment. Article 42 mandates just and humane working
conditions while Article 43 in the Constitution of India calls upon the State to secure ‘work, a living wage,
conditions of work ensuring decent standard of life’ to all workers in all sectors. In a report like this that
deals with the question of wages, an issue that is so central to the livelihood security of millions of workers
in the country, it is only proper that we quote the constitutional directives, as follows:
Article 39. The State shall, in particular, direct its policy towards securing — (a) that the citizens, men and
women equally, have the right to an adequate means of livelihood; and (b) that there is equal pay for equal
work for both men and women.
Article 42. The State shall make provision for securing just and humane conditions of work and for
maternity relief.
104 ILO DWT for South Asia and Country Office for India
Article 43. The State shall endeavour to secure, by suitable legislation or economic organization or in any
other way, to all workers, agricultural, industrial or otherwise, work, a living wage, conditions of work
ensuring a decent standard of life and full enjoyment of leisure and social and cultural opportunities.
Though the provisions are in the nature of guiding principles and do not have the power of legal
enforceability, they nevertheless make the intent of the constitution emphatically clear.
8.2.2. Committee on fair wages
The founding of the International Labour Organization (ILO) in 1919 and the flagging of the issue of
minimum wages right from the beginning seem to have influenced thinking on this issue in India. Following
the constitutional guidelines, the Central Advisory Council of the Government of India appointed a
Tripartite Committee constituting of employers, employees and Government representatives called the Fair
Wages Committee in 1948. The recommendations made by the Committee have been a reference and guide
for successive legislations and wage fixing machinery. It defined three different levels of wages: Living
Wage, Fair Wage and Minimum Wage. Among the three, Living Wage constituted the highest covering
food, clothing, shelter, education of children, health expenditure and old age insurance. Fair Wage,
envisaged as between the Living Wage and the Minimum Wage includes subsistence plus standard wage.
It considers national income, productivity and the capacity to pay of the industry in the determination of its
level. It should be set in such a way as to ensure continuation and growth of employment and to be
comparable to similar occupations/ activities. A Minimum Wage was defined as one necessary for
sustenance of life and some measure of education, medical requirements and amenities for the preservation
of efficiency of worker. It is the absolute minimum below which wages should not be set.
The Committee recommended setting-up of a Wage Board for each state and a Regional Board for each
industry to fix fair wages and regulate them. Based on the guidelines of the committee, successive meetings
of Standing Labour Committee were held to establish a statutory wage fixing machinery. It was
recommended that the statutory minimum wages should be fixed according to the provisions of the
minimum wage legislation (Minimum Wages Act, 1948). It was the first such statutorily binding guideline
which once fixed, has to be followed by the employer irrespective of their capacity to pay.
While the idea of Minimum Wage was operationalized by both Central and State governments, the idea of
a Living Wage remains only at the definitional level. No precise Fair Wage is in vogue, and various Wage
Boards fix wages taking into account the workers’ needs, demands and the capacity to pay of the industry.
But since the introduction of economic reforms in 1991, the functioning of the Wage Boards are in decline.
8.2.3. ILO Conventions and India
The issue of minimum wages was raised as an issue at the Peace Conference following World War I. The
Treaty of Versailles that created the ILO in 1919 referred to ‘the payment to the employed of a wage
adequate to maintain a reasonable standard of life as this is understood in their time and country’ as among
the general principles guiding the future of ILO (ILO:2014 Minimum Wage Systems: IL Conference, 103rd
Session, Geneva.) Subsequent work and deliberations resulted in the adoption of Convention No.26 at the
11th session of ILO conference held in 30th May 1928. This was followed by Recommendation No. 30
related to Minimum Wage Fixing Machinery. Subsequently the 34th session (6 June 1951) adopted
Convention No. 99 on Minimum Wages in Agriculture. At the General Conference of the ILO in its 54th

ILO DWT for South Asia and Country Office for India 105
session (3 June 1970) passed another Convention (No. 131) concerning Minimum Wage Fixation in
developing countries.
Based on the conventions adopted by the ILO prior to 1956, the 15th session of the Indian Labour
Conference in 1957 passed a resolution that laid down the criteria for Need-based Minimum Wage for
industrial workers. According to the resolution, the following should be considered in fixing the minimum
wage:
1) Standard working class family comprises three consumption units;
2) Earnings of women, children and adolescents to be disregarded;
3) Minimum food intake of 2700 calories for an average Indian adult of moderate activity;
4) Per capita clothing consumption of 18 yards per annum;
5) Housing rent to be calculated on the basis of minimum rent charged by Govt. under Subsidized
Industrial Housing Scheme for low income groups;
6) Fuel, lightning and miscellaneous items of expenditure should constitute 20 percent of total
minimum wage; and.
7) Another Supreme Court guideline in 1991 expressed that children’s education, medical requirement
and social recreational requirements should constitute another 25 percent of minimum wage.
The Minimum Wage Act, 1948 provides for States responsibility to ensure living wage for workers and
decent working conditions. Furthermore, in this endeavour a National Floor-level Minimum Wage was
fixed in 1991 following the recommendations of the National Commission on Rural Labour. There was no
move to give statutory backing to this but it is revised from time to time and State Governments are
persuaded to fix the minimum wages in their respective States above this floor level for all scheduled
employments. We shall come back to this important recommendation later.
8.2.4. Planning and wage policy in India
Since independence, the growing consciousness of the importance and rights of labour has led to the
recognition of the need for a wage structure with rising real wages. Special attentions were paid to both
industrial and agricultural labour separately, particularly in the second, sixth and eighth five year plans. The
First Five Year Plan contained some statements on wage movements and economic stability. During the
plan the Minimum Wages Act fixed the minimum statutory wages for all major sectors including
agricultural sector. The minimum wages were equivalent to the calculated income required to ensure
minimum standard of living. However, later it was recognized that it has been far from effective for
agricultural labour. Problems of fixing standard minimum wage across region and enforcement due to
regional diversity and lack of organization were identified as the inhibiting factors in the working of this
machinery.
The Second Plan acknowledged creation of industrial democracy and strong trade union movement as
prerequisites for establishing a socialist society. It clearly outlined three important aspects of wage policy:
I. A wage policy should aim at a structure involving rising real wages via increasing productivity
through better layout of plants, improvement in working conditions and training while assuring the
minimum wage and protection to all workers.

106 ILO DWT for South Asia and Country Office for India
II. Laying down principles to bring wages into conformity with the expectations of the working
class in the future pattern of society.
III. The settlement of wage disputes. It envisages instituting Wage Boards consisting of equal
representatives of employer, workers and an independent chairman, in individual industries in
different areas. It was expected to be more acceptable dispute settlement machinery compared to
the existing Industrial Tribunals with representation of the stakeholders.
It also took due cognizance of the existing gender-based discrimination in employment and wages and the
need to implement the principle of equal pay for equal work and ensuring other benefits and employment
generation policies. The Fourth Five Year Plan observed that the wage policy should consider price stability
and link wages to productivity. It also emphasized good industrial relations.
Labour policies in the earlier plans were focused mostly on the organized sector. The Sixth Five Year Plan
extended its coverage to the unorganized sector as well, including agricultural labourers, fishermen,
handloom weavers, artisans etc. in rural and urban areas. Necessary amendments were promised to be made
to provide such statutory provisions and State Governments were entrusted with the enforcement of the
Central legislations. The objective of labour/wage policy as envisaged in the Sixth plan was to lay down
criteria for fixation and revision of minimum wages and to evolve wage structure without impinging on the
freedom of parties to negotiate wage agreements. It included elements like need-based minimum wages,
adjusting real wages for rise in cost of living, allowances for occupational hazards, bonus, social security
benefits etc. Certain factors that were considered to be important for wage fixation were capacity to pay,
profitability and productivity, consumption pattern, cost of living and regional disparities. So, while on one
hand it recognizes the primacy of collective bargaining, on the other hand, it also acknowledges the
necessity of prescribing guidelines for fixing minimum wage for the section of labour vulnerable to
exploitation. This is not only to assure minimum standard of living and improvement in poverty figures but
also to ensure industrial harmony which is indispensable for economic progress, particularly in the core
sectors.
Eighth and Ninth plans also stressed on safe and humane working conditions, social security benefits,
improvement of productivity of labour and reducing malpractices in wage payment. Subsequent plans had
very little to say on wage policy, as the concern had shifted more to the issues of labour flexibility, labour
law reforms and skill formation. As part of the flexibility debate, issue of wage flexibility, specially, on
minimum wages has been raised.
8.2.5. National Commissions on Labour
The first National Commission on Labour was set up on 24 December 1966 under the Chairmanship of
Justice P. B. Gajendragadkar, a former Chief Justice of the Supreme Court of India. The Commission
submitted its report in August, 1969 after detailed examination of all aspects of labour problems, both in
the organized and unorganized sectors. It assessed the general wage policy of the government on the basis
of industrial harmony, workers’ level of living, changes in productivity, impact of wages on prices and
share of wages in value added in manufacturing industries. With the passage of time due to changes in
labour force, labour market composition, labour market dynamics and economic policy change leading to
changes in domestic industrial climate and industrial relations, the need for reforms in existing labour laws
was strongly felt.
ILO DWT for South Asia and Country Office for India 107
The Second National Commission on Labour was set up on 15 October 1999 under the Chairmanship of
Ravindra Varna, a veteran trade unionist and Gandhian social and political activist. It was particularly
requested to suggest rationalization of existing labour laws in the organized sector and to provide guidelines
for structuring umbrella legislation to ensure minimum level of labour protection and welfare measures
covering workers in the unorganized sector. In doing so, it was supposed to allow for conditions conducive
to flexibility in labour market, technological change and economic growth. It recommended a wage policy
which should be based on a set of principles directed towards attaining social justice, higher employment
level and capital formation and price stability. It also suggested grouping existing labour laws into five
groups: industrial relations, wages, social security, safety, welfare and working conditions.
8.3. The Minimum Wages Act, 1948: An important legislative measure
As per the constitutional mandate and government policy towards labour, a number of labour laws were
passed after independence. These include legislations having a major role in setting wage levels and
structure. These are: The Minimum Wage Act, 1948; Payment of Wages Act, 1936, Equal Remuneration
Act 1976, and Payment of Bonus Act, 1965. Of these, The Minimum Wages Act of 1948 is the most
important given its coverage of the vast majority of wage labour in the Indian economy and the potential it
has in terms of providing a route to escape the poverty trap to a significant section of these workers,
especially those who work as casual labour. We therefore focus on this important piece of legislation in the
rest of this paper/chapter with a view to assess the mechanism of wage fixation, coverage, and
implementation.
8.3.1. Objectives, evolution and enactment
As discussed earlier, Minimum Wages Act, 1948, came into existence following successive meetings of
Standing Labour Committee in 1943 and 1944 and Tripartite Labour Conferences in 1943, 1944 and 1945.
The Standing Labour Committee prescribed the setting up of statutory Minimum Wage for an activity. A
draft bill to fix the Minimum Wages was considered in 1945 and the Minimum Wages Bill was introduced
in the Central Legislative Assembly on 11April 1946. It was subsequently passed in 1946 and came into
force with effect from 15th March 1948. The lists of employments included in the schedule were divided
into two parts—Part I consisting of non-agricultural employment and Part II consisting of agricultural
employment. Both Central and State Governments are the appropriate Governments to notify scheduled
employment and fix/ revise minimum wages, in their respective spheres.
Although the Directive Principles of the Constitution envisioned a universal coverage of the policy and
living wage as the ultimate goal, and Fair Wages Committee recommended fair wages which should be
above the minimum wage, the Act primarily focused on the Minimum Wages and to begin with, 25
employments were ‘scheduled’ for its coverage.
8.3.2. Salient Provisions, schedule, machinery for fixation and revision
The Minimum Wages Act, 1948 empowers the Government to fix minimum wages for employees working
in scheduled employments, male or female. It provides for review and revision of minimum wages already
fixed after suitable intervals not exceeding five years. Central Government is the appropriate agency in
relation to any scheduled employment carried on by or under its authority or in railway administration or
in relation to mines, oilfields or major ports or any corporation established under the Central Act. State
governments are the appropriate Government in relation to other scheduled employments. The Central

108 ILO DWT for South Asia and Country Office for India
Government is concerned to a limited extent with building and construction activities mostly carried out by
Central Public Works Department, Ministry of Defense and agricultural farms under the Ministries of
Agriculture and a few other departments. The bulk of such employment falls in the state spheres and state
governments are required to fix/revise wages and ensure their implementation in respect of scheduled
employment within their spheres. Enforcement of Minimum wages in Central sphere is secured through the
Central Industrial Relations Machinery (CIRM).
Section 5 of the Act provides for two methods of wage fixation: Committee method and Notification
method. Under the Committee method, appropriate governments form committees and sub-committees to
recommend rates for fixing and revision of minimum wages. Whereas under the notification method, the
government publishes the proposed wage rates in the Official Gazette at least two months in advance of the
effective date and on the basis of advice and representations received during the due date, notifies the
revised rates for the concerned scheduled employment in the Official Gazette.
Also in order to protect the fixed minimum wages against inflation, minimum wages so fixed have been
linked to the Consumer Price Index for Industrial Workers after this was recommended at the Labour
Ministers’ Conference in 1988. This provision of Variable Dearness Allowance (VDA) as a component of
minimum wages has allowed for revision of minimum wages in scheduled employment such that there is
100 percent neutralization. VDA is revised in April and October every year in the central sphere. The
enforcement mechanism so far has been inspection, both at Central and State level.
Given the great deal of disparity in minimum wages across states in India, the Government of India initiated
steps in 1987 to set up Regional Minimum Wage Advisory Committees. These committees were
subsequently renamed as Regional Labour Ministers’ Conference, which made a number of
recommendations including (a) reducing the disparity in minimum wages between states of a region, setting
up of an inter-state Coordination Council, and consultation with neighbouring states while fixing/revising
minimum wages. However, there is hardly any evidence to suggest that these recommendations are being
seriously followed.
8.3.3. Coverage
The Minimum Wages Act of 1948 does not discriminate between workers in the organized or formal or
unorganized or informal sector; it also does not discriminate between permanent/temporary and
casual/regular workers. In that sense, it has the widest reach. But in actual practice, this reach has been
limited by the condition that it is applicable to only those employments which the appropriate government
incorporates in the Section 27. Originally, the Act was made applicable to 25 employments including
agriculture, in Central and State schedules. As per the provisions in the Act, appropriate governments can
add new employments to the schedule and revise the wages. As of 2013 there are 45 scheduled employments
in the Central, 1466 in the States and 188 in Union Territories (see Table 8.1). As such there is a complex
web of 1699 employments with minimum wages in many of which a further differentiation is made for
regions and skill levels. Section 3 of the Act stipulated that for inclusion of any employment in the schedule
i.e. there should be at least 1000 employees engaged in such employment in the state. According to the
Report on the Working of the Minimum Wages Act, 1948 (2013) there were in total 375 types of scheduled
employments for which minimum wage rates have been fixed/ revised by the States/Union Territories. As
so, many activities remain excluded and thus the Minimum Wage Act is not applicable for such occupation.

ILO DWT for South Asia and Country Office for India 109
It may be noted that the Act only lays down the procedure for fixing and revision of minimum wages, but
does not define the basis and level. It is generally understood that the wage fixing authorities will consider
the principles laid down in the resolution of the 15th Indian Labour Conference, though they may not always
be able to fully follow. As a result, one finds very large variation in minimum wage rates for the same
employment/occupation across states, not necessarily always reflecting the differences in cost of living. For
example, minimum wages for agricultural labourers as on 31.12.2011 varied between Rs 80 in Arunachal
Pradesh and Rs 92 in Odisha to Rs 170 in Mizoram and 178 in Haryana. In 2013, the revised minimum
wages for agriculture varied from Rs.80 in Arunachal Pradesh, Rs.126 in Odisha to Rs.269 in Karnataka.
Sl. No.
Government NEP* Remarks
1 Arunachal Pradesh 30 Uniform minimum wages (Rs.80/-) No DA
2 Assam 105 Uniform minimum wages (Rs.141.42/-) + DA 6.14
3 Bihar 88 Uniform minimum wages (Rs.168/-) + DA Rs.8
4 Chhattisgarh 46 Uniform minimum wages (Rs.132/- + DA Rs.66.57) but Rs.147 + 53.07 for 7 employments.
5 Delhi 29 Uniform rate Rs.311 - No DA
6 Goa
21 Uniform minimum wages (Rs.150/-) No DA (For Agriculture Rs.225)
7 Gujarat 54 Almost Uniform (With DA) Rs. 210-218 except 4 (< Rs. 210) and 3(> Rs. 210)
8 Haryana 50 Uniform minimum wages (Rs.205.44 - no DA)
9 Himachal Pradesh 12 Uniform minimum wages (Rs.150- no DA)
10 Jammu & Kashmir 28 Uniform minimum wages (Rs.150- no DA)
11 Jharkhand 88 Uniform minimum wages (Rs.127 + 40.17 = 167.17)
12 Madhya Pradesh 38 Uniform - Rs.118 + 94 =212
3 Central government 45 Differential rates with Dearness Allowance (DA)
14 Andhra Pradesh 73 Differential rates with DA
15 Manipur 15 Uniform minimum wages (Rs.122.10 - No DA)
16 Meghalaya 28 Uniform minimum wages (Rs.100 - No DA)
17 Mizoram 1@ Uniform minimum wages (Rs.220 - No DA)
18 Nagaland 54 Uniform minimum wages (Rs.115 - No DA)
19 Odisha 84 Uniform minimum wages (Rs.150 - No DA) (Agr. Other than ploughing Rs.126/-)
20 Punjab 71 Uniform minimum wages (Rs.240.64 - No DA)
21 Rajasthan 62 Uniform minimum wages Rs.166 - No DA (except 6 sch.)
22 Sikkim 26 Uniform minimum wages (Rs.200 - No DA)
23 Uttar Pradesh 64 Uniform Rs.100 + 100 + DA (except 3 sch., Agr., Tanneries & bangles)
24 Karnataka 79 Differential rates with DA
25 Kerala 73 Differential rates with DA
26 Maharashtra 67 Differential rates with DA
27 Tamil Nadu 73 Differential rates with DA
28 Tripura 22 Differential rates with DA
29 Uttarakhand 58 Differential rates with DA
30 West Bengal 56 Differential rates but no DA
31 Union Territories 188 Some uniform rate and some differential rate with DA.
Note: * Number of employments included in Section 27 of the Minimum Wages Act. @ All employments are reported as covered in this state. Source: Labour Bureau 2013.
Table 8.1: Coverage of employments under the Minimum Wages Act of 1948 as on 2013
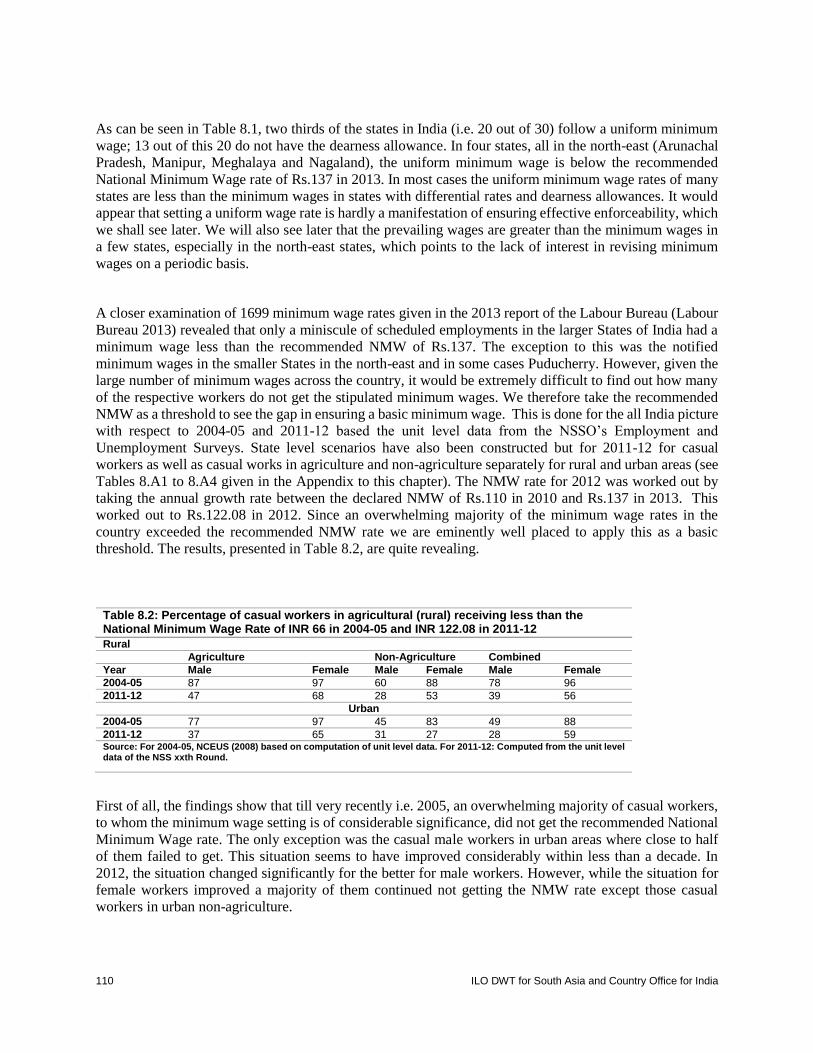
110 ILO DWT for South Asia and Country Office for India
As can be seen in Table 8.1, two thirds of the states in India (i.e. 20 out of 30) follow a uniform minimum
wage; 13 out of this 20 do not have the dearness allowance. In four states, all in the north-east (Arunachal
Pradesh, Manipur, Meghalaya and Nagaland), the uniform minimum wage is below the recommended
National Minimum Wage rate of Rs.137 in 2013. In most cases the uniform minimum wage rates of many
states are less than the minimum wages in states with differential rates and dearness allowances. It would
appear that setting a uniform wage rate is hardly a manifestation of ensuring effective enforceability, which
we shall see later. We will also see later that the prevailing wages are greater than the minimum wages in
a few states, especially in the north-east states, which points to the lack of interest in revising minimum
wages on a periodic basis.
A closer examination of 1699 minimum wage rates given in the 2013 report of the Labour Bureau (Labour
Bureau 2013) revealed that only a miniscule of scheduled employments in the larger States of India had a
minimum wage less than the recommended NMW of Rs.137. The exception to this was the notified
minimum wages in the smaller States in the north-east and in some cases Puducherry. However, given the
large number of minimum wages across the country, it would be extremely difficult to find out how many
of the respective workers do not get the stipulated minimum wages. We therefore take the recommended
NMW as a threshold to see the gap in ensuring a basic minimum wage. This is done for the all India picture
with respect to 2004-05 and 2011-12 based the unit level data from the NSSO’s Employment and
Unemployment Surveys. State level scenarios have also been constructed but for 2011-12 for casual
workers as well as casual works in agriculture and non-agriculture separately for rural and urban areas (see
Tables 8.A1 to 8.A4 given in the Appendix to this chapter). The NMW rate for 2012 was worked out by
taking the annual growth rate between the declared NMW of Rs.110 in 2010 and Rs.137 in 2013. This
worked out to Rs.122.08 in 2012. Since an overwhelming majority of the minimum wage rates in the
country exceeded the recommended NMW rate we are eminently well placed to apply this as a basic
threshold. The results, presented in Table 8.2, are quite revealing.
Rural
Agriculture Non-Agriculture Combined
Year Male Female Male Female Male Female
2004-05 87 97 60 88 78 96
2011-12 47 68 28 53 39 56
Urban
2004-05 77 97 45 83 49 88
2011-12 37 65 31 27 28 59 Source: For 2004-05, NCEUS (2008) based on computation of unit level data. For 2011-12: Computed from the unit level data of the NSS xxth Round.
First of all, the findings show that till very recently i.e. 2005, an overwhelming majority of casual workers,
to whom the minimum wage setting is of considerable significance, did not get the recommended National
Minimum Wage rate. The only exception was the casual male workers in urban areas where close to half
of them failed to get. This situation seems to have improved considerably within less than a decade. In
2012, the situation changed significantly for the better for male workers. However, while the situation for
female workers improved a majority of them continued not getting the NMW rate except those casual
workers in urban non-agriculture.
Table 8.2: Percentage of casual workers in agricultural (rural) receiving less than the National Minimum Wage Rate of INR 66 in 2004-05 and INR 122.08 in 2011-12

ILO DWT for South Asia and Country Office for India 111
This picture of some positive change has to be tempered, however, by a sharp regional variation in states
that have now emerged as best performers with only a small percentage (say less than 10 percent) not
getting the NMW and those where a majority (above 50 per cent) still do not get this minimum wage. As
mentioned earlier, the detailed tables are given in the Appendix to this chapter (Tables 8.A1 to 8.A4). Below
we summarize, in Table 8.3, the percentage shares of casual workers (in both agriculture and non-
agriculture) not getting the recommended NMW in 2011-12 by states by classifying them as those in the
first quarter, second quarter and those where a majority (51 percent and above) do not receive.
What the above results bring out is the gap between the notification of the minimum wages and the ground
reality of a significant share of workers not getting even the floor level wage. States that perform reasonably
well (say less than 25 percent not getting the NMW) favour mainly the male workers. The majority of the
female workers seem to be highly disadvantaged in a number of states. Among the major states only four
states — Jammu and Kashmir, Kerala, Haryana and Punjab — stand out as favourable to women casual
workers in this respect along with the two north-eastern States of Nagaland and Sikkim. It is interesting to
see that the northeastern states come out quite well in this test despite the fact that the notified minimum
wages in many of them are far below the NMW. This seems to be a case of administrative lethargy or lack
of priority in managing periodic revision of minimum wages as observed earlier.
Male workers Female workers
Less than 25 per cent Less than 25 per cent
Sikkim (1.6), Kerala (2.9), Delhi (3.3), Punjab (5.6),
Mizoram (11.2), J&K (11.6), Uttarakhand (12.4),
Pondicherry (13.4), Arunachal Pradesh (13.7),
Haryana (14.4), HP (14.8), Meghalaya (15.0), Nagaland
(15.2), Rajasthan (19.6), Tamil Nadu (19.7), Manipur
(21.8), Tripura (22.0), Undivided Andhra Pradesh
(23.5)
Nagaland (0.0), J&K (4.1), Sikkim (8.8), Kerala (15.8),
Manipur (18.2), Haryana (19.0), Punjab (21.6)
Between 26 and 50 per cent Between 26 and 50 per cent
Karnataka (26.2), Goa (29.1), Assam (34.3),
Jharkhand (36.2), Maharashtra (41.0), UP (43.5), Bihar
(46.0), Odisha (46.8)
Rajasthan (25.4), Arunachal Pradesh (27.1), Tripura
(28.2), Mizoram (30.4), Meghalaya (39.5), Odisha
(43.1), HP (48.0), Pondicherry (48.4), West Bengal
(49.2)
51 per cent and above 51 per cent and above
West Bengal (51.0), MP (56.6), Gujarat (61.8),
Chhattisgarh (71.1)
UP (50.6), Uttarakhand (51.8), Goa (51.9), Jharkhand
(55.0), Undivided AP (59.4), Chhattisgarh (60.9),
Tamil Nadu (61.6), Delhi (64.3), Bihar (65.0), Gujarat
(66.7), Maharashtra (67.1), Assam (69.2), Karnataka
(76.0). Source: Same as Table 2.
Given such a scenario, it would be instructive to understand the working of the system at the state level.
This we do with reference to some states.
Table 8.3: Percentage Share of casual workers not receiving the National Minimum Wage rate of INR 122.08 in 2011-12 in India’s states

112 ILO DWT for South Asia and Country Office for India
8.4. Selected state-level experiences
8.4.1. State of Andhra Pradesh (Undivided)10
Background
When we speak of the State of Andhra Pradesh here, it refers to the States of Telangana and Andhra Pradesh
that came into being on 2 June 2014. The former State of Andhra Pradesh was in fact was formed on
November 1, 1956, and came into being by merging the states of Andhra and the state of Hyderabad (the
predecessor to the present state of Telangana). In 1960 the then existing two sets of rules viz. Andhra
Minimum Wage Rules and Hyderabad Minimum Wage Rules gave way to the Andhra Pradesh Minimum
Wage Rules, 1960. However, there were only two categories under the Schedule of Employments till 1978
which then rose to three and to 15 by 1984. During the next year, 14 new employment categories were
added and since then, by a process of incremental annual addition, the number reached 65 by 2014. Until
2006, the Schedule of Employment did not include any category of agricultural employment but since then
it increased to eight by 2014. Therefore, the process of coverage in terms of the primary requirement of
notifying an employment under the Schedule has been a long one and it is likely to continue for some more
time.
Fixation of minimum wages
The former state of Andhra Pradesh has followed the principles and guidelines given at the national level
for fixing the minimum wages in its Schedule of Employment. First, it has accepted the five
recommendations of the 15th Indian Labour Conference 1957 mentioned earlier. Second, it also accepted
the Supreme Court’s suggestion to include a Variable Dearness Allowance (VDA). Third, it seems to have
implicitly accepted the National Floor Level Minimum Wage (non-statutory) because by 2013 there was
no minimum wage that was fixed below this wage rate (i.e. INR137 in 2013). Fourthly, it is moving towards
fixing differential minimum wages recognizing the skill differences.11 For fixing the minimum wages in
agriculture, each district has been classified according to three Zones based on the level of agricultural
development with Zone I at the top followed by Zone II in the middle and Zone III at the bottom.
The method for fixing the minimum wages is that of the Notification Method (the other being the
Committee Method) as provided in the Minimum Wages Act of 1948. It starts with notification of the
proposal for fixation or revision of minimum wages in the Official Gazette followed by a waiting period of
two months for receiving representations, if any, from the employers or employees. If there are
representations, the Minimum Wages Advisory Board (not in existence for the last several years) is
consulted before final notification. The minimum wages thus notified becomes effective from the date of
publication. By and large, revisions are carried out every five years for employments where VDA has been
accepted and wherever this is not accepted revisions are carried out every two years. A notable consequence
of the periodic revisions is that the gap between the minimum rate and the maximum rate has widened
rather than reduced. For example, in 2001 the minimum rate was Rs.26 per day and the maximum rate
Rs.79 i.e. the latter was 204 per cent higher than the former. This gap increased to 385 per cent in 2013.
Acceptance of VDA began only in 1989 at the central government level and it was implemented in Andhra
Pradesh in 1991 excluding the agricultural employments. Agricultural workers had to wait another two
10 This section is based on a background paper prepared by D. Narasimha Reddy (2015). 11 In 2006, the Planning Commission had suggested a wage differential of 15 per cent between unskilled to semi-skilled, and
semi-skilled to skilled workers.

ILO DWT for South Asia and Country Office for India 113
decades before including VDA in their minimum wage fixation. This perhaps points to the politically weak
bargaining power of the largely unorganized agricultural workers.
Coverage
This is like an ‘area of darkness’. No reliable estimates are available regarding the number of workers
covered. However, the Labour Department has submitted details of the number of establishments covered
to the Government of India through the Labour Bureau. It shows a coverage of 143,495 establishments in
2001 and 244,553 in 2012 that is highest ever reported. However, the percentage of establishments
submitting returns was reported at 4.36 per cent in 2001 and just 2.01 percent in 2012. The average daily
employment shown is quite perplexing; it shows 192,714 in 2001 and 866,173 in 2012. But in 2011 the
average daily employed persons shown was 3,184,614 i.e. 3.7 times the figure in 2012. It is difficult to
identify establishments in the agricultural sector and one can only assume that the minimum wages are
applicable to all workers in it. Information gathered from the Labour Department revealed that the number
of villages covered was 26,614 with estimated workers of 9.82 million in 2005 and 11.6 million in 2014.
Implementation machinery
The Department of Labour is the principal agency for implementing the minimum wages. In the case of
agricultural employments, officers from the revenue departments as well as excise department (for toddy
tapping) are enlisted for inspection. Similarly, in the case of employment in public motor transport, services
of the motor vehicle inspectors are utilized. The overall staff strength in the Labour Department was 285 in
2002 and 294 in 2012 but it declined sharply in 2013 to 172. Given the vast agricultural sector as well as
the non-agricultural employments under the Minimum Wages Act one hardly needs to point out the
inadequacy of the staff strength in the Labour Department. However it should also be pointed out that in an
era of fiscal consolidation governments in India (both central and state) have been experiencing very little
of growth in recruitment. Therefore, this needs to be viewed as part of a general trend in government
employment.
The inadequacy and inability of inspection are revealed from the figures collected for the number of claims
in the non-agricultural and agricultural sector respectively. In 2004, the total number of claims in the non-
agricultural employments was 21,884, out of which 15,324 were disposed of benefiting 19,228 workers. In
2014-15, the total claims were 12,770 of which 3,921 were disposed of benefitting just 7,153 workers. In
the agricultural sector, the total claims in 2004 were a mere 231 of which 88 were disposed benefitting 232
workers. Since 2012 no new claims were received/recorded. The overall picture is one of lack of
information that could be due to inadequacy as well as inability in terms of inspection and monitoring.
Apart from shortage of staff, there is also a climate against inspections. Furthermore, the Labour
Department officials says that they have to deal with a plethora of minimum wages in a given employment
depending on skill, zone and category of work and so on. As much as 20 to 40 categories of workers are
found in each scheduled employment demanding considerable time and effort in terms of revision and
implementation. Workers are also often said to feel discriminated when they do not see much difference in
the work performed in certain operations differentiated by minimum wages. To overcome these problems
and issues, the then Government of Andhra Pradesh constituted a Committee for Simplification and
Rationalization of Fixation and Revision of Wages for the Schedule of Employments under the Minimum
Wages Act 1948. The Committee is reported to have recommended simplification by (i) rationalizing the
existing schedule of employment into four categories, (ii) rationalizing technical categories of workers into
four skill levels, (iii) rationalizing non-technical categories into four groups, (iv) fixing minimum wages

114 ILO DWT for South Asia and Country Office for India
for three administrative territories (municipal corporations, municipal towns and other places), and (v)
adding, as suggested by the Supreme Court in 1991, 25 per cent of the minimum wages for education,
health, etc. These recommendations seem to have been inspired by the system prevalent in the State of
Maharashtra.
Now that there are two new states carved out of the former Andhra Pradesh, the fate of these
recommendations will depend on the priority and initiative of the new two state governments on the
question of minimum wages. It must however be said that the recommendations are worth considering since
they would be much easier for workers to comprehend and official system to implement.
8.4.2. Maharashtra12
Background
The State of Maharashtra came into being in 1960 after bifurcating the bigger State of Bombay into
Maharashtra and Gujarat. Rules pertaining to minimum wages were framed in 1963. One of the first
employments to include them was the composite mills (large factories), involving dyeing and printing.
Workers in these industries were unionized and 80 percent of the cloth was produced in the composite mills.
The introduction of minimum wages is reported to have prevented undercutting by having small units which
were paying very low wages. However, the situation changed from the 1980s with a regressive trend
towards setting up of small power loom units. Currently 75 per cent of cloth production takes place in the
power loom sector. The number of employments in the schedule was gradually increased and it stands at
67 in 2013.
An important recent inclusion in the Minimum Wage Act is that of domestic workers, a large majority of
whom are women. An Act came into being in 2008 but it took three years to set up a committee to implement
the law. A Domestic Workers Welfare Board was also formed in 2011 intended to provide various
assistance to the registered domestic workers. The organization of these workers under the Molkarin
Sanghatana in several districts as well as the national campaign by the National Campaign Committee for
Unorganised Workers and the National Women’s Commission seems to have both directly and indirectly
worked in favour of legislation. To this should also be added that six states (Karnataka, Kerala, undivided
Andhra Pradesh, Bihar, Rajasthan and Jharkhand) have already included domestic workers under the
Minimum Wages Act. It has been reported that there are nearly 12 lakh domestic workers in Maharashtra.
Fixation of minimum wages
Notification method is the principal route adopted by the Government of Maharashtra to fix minimum
wages. Initial notification is followed by representations from stakeholders and others which are then vetted
by the Minimum Wages Advisory Board before final notification. Minimum wages for notified
employments are fixed according to three zones or areas viz., Municipal Corporations, Municipal Councils
and Areas other than the above two. For agriculture there are five zones. For each zone, minimum wages
are fixed for unskilled, semi-skilled and skilled workers. Ever since the Supreme Court judgment in 1991,
the Maharashtra government has also accepted the principle of VDA that has to be revised every six months.
Minimum wage rates for the scheduled employments are revised periodically and made available through
the website of the Labour Department. The rates relate to basic wages plus a dearness allowance on a
12 This section is based on a note on ‘Minimum Wage Fixation and Wage Setting Practices at Local/Enterprise Level in
Mahrashtra’ prepared by Srinath Jagannathan.
ILO DWT for South Asia and Country Office for India 115
monthly basis. For workers receiving daily rates, the advice is to divide the monthly rate by 26 to get the
daily rate.
The institution of a less complicated system of minimum wage categories is something the State of
Maharashtra has to strive for. However, some of its notified minimum wages are less than the recommended
NMW. Of the 67 scheduled employments all but two have minimum wages above the NMW. But the sector
with the highest number and share of workers namely, agriculture, find itself with a minimum wage that is
not even three-quarters (73 per cent) of the NMW and constitutes one of the lowest minimum wages not
just in Maharashtra but in the country itself in 2013.13
Coverage
In terms of coverage, data is quite sparse as in the case of most states in India. The number of establishments
covered was reported as 3.13 million but strangely the number of employees given was 2.97 million. In
2013, the number of establishments covered was 1.29 million with a total employment of 3.98 million
(Labour Bureau 2013). There are no separate statistics for the coverage in agriculture but one has to assume
that it covers all agricultural workers.
Despite being one of the richest states in India (in per capita terms) as well as having a high level of
industrialization and urbanization, Maharashtra’s record in ensuring payment of prescribed minimum
wages (or anywhere near that) is quite low. As we have seen in Table 8.3, Maharashtra is in the company
of states with a high share of workers not able to secure even the national (floor level) minimum wage that
is significantly lower than the notified minimum wages for 63 out of 67 scheduled employments. In 2012,
41 per cent of male casual workers received wages that were below the NMW. For women casual workers
the share was as high as 67 per cent, thereby pointing to sharp gender discrimination in wages weighed
against women workers.
Implementation machinery
In terms of the total staff strength there has been a sharp reduction in the Labour Department. The reported
staff strength in 2010 was 605 and it declined to almost half at 319 in 2013. This seems to be a general
trend in most states thereby taking out whatever little clout the Labour Department had in inspecting and
monitoring the implementation of minimum wages as well as a number of other duties.
General comments
The case of power loom workers in Maharashtra requires a mention here. The basic pay for most sections
of workers varies from INR 3000 to 6000 plus a dearness allowance that varies from close to 2000 to 3000.
However, in the case of power loom workers, the basic pay has not been revised for the last three decades;
it now stagnates at INR 230 to 350 with a dearness allowance of around INR 6300. Field investigations
revealed several concerns and anxieties. A trade union activist pointed out that “there are several employers
in the power loom sector employing more than 200 workers but many do not pay more than 60 percent of
the minimum wage rate. Hours of work often extend to 12 hours a day. Many migrant workers are
compelled to work under such conditions because their alternative is much lower wage in their villages”.
An official pointed out that “when there were composite mills, the existence of minimum wages prevented
the growth of smaller units with lesser pay. With the decline of large factories, the situation has changed
13 The employment is the cotton ginning and processing which has a lower than the NMW (INR122 in 2013).
116 ILO DWT for South Asia and Country Office for India
for the worse for the workers”. Some union activists said that workers who join trade unions are targeted
for violence and bribery and other methods of influencing leaders of worker organizations are not
uncommon. All these experiences points to the highly unfavourable ground reality in enforcing the
minimum wages.
8.4.3. Kerala
Kerala is known as a state with relatively high wage rates in the unorganized sector. Such an impression is
mainly due to the ability of workers in the informal/unorganized sector to secure wages higher than their
counterparts in most, if not all, other parts in India as we noted in Chapter 4. However, such a situation is
the result of a complex interplay of several factors: early organization of workers into trade unions, their
political affiliation resulting in influencing the state governments to constitute effective wage-setting
institutions, relatively high literacy and education of the work force and the enactment of a set of labour
laws and regulations at the national level and their implementation at the state level. The first Minimum
Wage Committee in Kerala dates back prior to the formation of Kerala in 1956. The first committee was
formed in 1952 as a result of struggles by cashew workers by the then Government of Travancore-Cochin
which later became part of the expanded state of Kerala. Since the Minimum Wages Act is also beneficial
to the unorganized/informal sector workers, the institution of Minimum Wage Committees in Kerala need
to be seen as part of a process of evolution of a number of formal labour institutions governing wages and
working conditions in the unorganized or informal sector of the economy. These are the Industrial Relations
Committees (an institution borrowed from the organized sector), Workers Welfare Fund Boards and the
emergence of strong trade union organizations14.
As of 2013, the Government of Kerala included 73 employments under the Section 27 of the Minimum
Wages Act of 1948; subsequently five more have been added (Paper products, Foot wears, Private financial
institutions, Photography and videography and Mid-Day Meals in Schools) bringing the total to 78. There
is a high degree of public awareness about minimum wages and an active culture of organized struggles to
secure them whenever the system fails to abide by the law.
Fixation
The fixing of the minimum wages is based on the principles and guidelines laid down by the 15th Indian
Labour Conference as discussed earlier. In additional the principle of VDA as well as the Supreme Court
judgment on adding 25 per cent for education and health is also accepted. The system of Minimum Wage
Advisory Board (MWAB) is taken quite seriously in Kerala with periodic reconstitution and a schedule of
work. The MWAB is reconstituted every three years and the current one was formed in 2014. It consists of
37 members with 16 each from the constituency of workers (trade unions) and employers and five officials
including the chairperson. Based on a set of notified employments identified by the Labour Department,
the Board constitutes sub-committees (with Board members as well as experts) and examines the existing
minimum wage structure. It collects evidence through a series of sittings from the stakeholders. Such
sittings are given media coverage through advertisements and information to the trade unions and
employers’ organizations. The active participants are the direct stakeholders viz., trade unions and
employers’ organizations. Through an interactive process a consensus is arrived at on the new minimum
wage rates which are later recommended to the state government. What is interesting in the Kerala system
is that there is provision for enhancing rates over and above the minimum to workers with longer years of
14 For an account of the functioning of the Welfare Fund Boards see Kannan (2002) and for a detailed history of trade unionism
see Nair (2006). For a history of the economic, social and political context of early mobilization of the largely unorganized rural
workers see Kannan (1988).

ILO DWT for South Asia and Country Office for India 117
experience. There is no link to productivity because the concept of minimum wages refers to the absolute
minimum required.
The revised minimum wages are then notified by the state government for public response. Based on
representations received and further perusal, final notification is issued by the government, valid for three
to five years as specified. Upon completion of the term, trade unions take up the question of revision and
set the system in motion once again.
The MWAB does not deal with those employments for which Industrial Relations Committees exist. This
includes two Industrial Relations Committees for agricultural work in Palakkad and Kuttanad, the two
prominent rice-growing regions in Kerala15.
Coverage
While the system of fixation of minimum is quite impressive, statistics on coverage is a disappointing one
as in the case of most other states in India. In 2013, the Government of Kerala reported 161,957
establishments covered under the Minimum Wages Act but only 2.5 per cent of them submitted their annual
return. The employment figures of reporting establishments work out to an average employment size of 22
workers per establishment (Labour Bureau 2013). In the case of agriculture one has to assume that there is
registration of establishments but all the workers all eligible for the minimum wages notified. There are
also other occupations where the notion of ‘establishments’ does not apply; for example, tree climbing (e.g.
coconut and arecanut pluckers) and loading and unloading work.
Our test of whether the casual workers — the most poor and vulnerable among the work force — are able
to get at least the NMW in 2012 revealed (see Table 8.3) that in Kerala an overwhelming majority are able
to secure the same. The percentage of casual workers not getting at least the NMW was only around 3 per
cent in 2012 for men and 16 per cent for women workers. Although women workers in Kerala came out
much better than their counterparts, in most other states the gap between them and the men should be seen
as a mark of the persistence of gender discrimination in the labour market. Moreover, despite the average
wage secured being higher than the NMW, women’s wages were considerably lower than that of men in
the casual labour market; 50 percent that of men in rural areas and 54 per cent in urban areas in 2011-12.
However, in absolute terms wages of women casual workers in Kerala was the highest (Rs.121) in rural
areas and second highest (Rs.129) — after Jammu and Kashmir — in urban areas16 among the larger states.
Implementation
As of 2013, Kerala reported a total staff strength of 258 officials in the Labour Department. Although this
represents one of the high worker-to-official ratios, there is hardly any way to gauge the adequacy from the
point of implementation of several labour laws. If one goes by the number of inspections in 2013 (32,268),
the per capita inspections works out to 130 for 248 officials (leaving ten top officials). When this issue was
discussed with some of the retired officials, they were unanimous in their view that in Kerala the trade
unions are quite vigilant in monitoring the implementation of minimum wages; that factor acts as a deterrent
should there be temptation to default.
15 To call them ‘industrial’ may be a misnomer but such is the bureaucratic practice that once a nomenclature is accepted, it is
applied to all.
16 For regular workers the gender gap is found to be considerably lower than that in rural areas. In 2011-12 it was 64 per cent and
83 per cent in rural and urban areas respectively. These were computed from unit level data from 2011-12 NSS Round.

118 ILO DWT for South Asia and Country Office for India
However, the gender disparity in minimum wage fixing looks problematic, since employments dominated
by women workers have lower minimum wages than those dominated by male workers. For example,
minimum wages in 2013 for women-dominated cashew factory workers was INR 221 compared to the
male-dominated coir manufacturing at INR 268 i.e. 18 per cent less. Similarly, women-dominated tea
plantation workers’ minimum wage was INR 172 compared to male rubber tappers at INR210. There is a
general opinion that trade unions have not accorded anywhere near equal status to women workers be it in
fixation of minimum wages, election of office bearers or sensitive to women-specific working conditions
and problems. When this reached an extreme point, women workers revolted in masses as was witnessed
in the two recent cases of tea plantation workers in Idukki district (in 2015) and hospital nurses across
Kerala (in 2012). In the first case the flash strikes and organization by nearly ten thousand plantation
workers in Munnar gave a jolt to established trade unions and their political parties. The state machinery
quickly swung into action and started negotiations but through the IRC which did not have any women
representatives. However, the agitating women workers were made to accept the IRC-mediated negotiations
and finally a settlement was reached to hike the wages by 30 per cent. This shows that ‘discrimination can
be fought, on women’s terms’ (Jain 2015)
The agitation by nurses in private hospitals in Kerala in 2012 was sparked by a case of violence against a
staff nurse in a private hospital. It became a major agitation, joined by 8 to 10 thousand nurses for effective
implementation of minimum wages, revision of wages and reasonable working conditions. The established
trade unions had not taken much interest in organizing the nurses dominated by women although they were
working with very low wages and long working hours. Working for low wages in this sector is a
consequence of the educated unemployment aspiring for service sector jobs. In this case, there was the
added attraction of emigration to other countries once a nurse has had some experience. This struggle also
witnessed a certain shock to established political unionism. The nurses formed a new organization called
United Nurses Association with members from all over India, as their agitation had reverberated across the
country with similar demands. As the civil society in Kerala was quite sympathetic to the plight of the
agitating nurses, the Government of Kerala acted fast by appointing a committee that gave a report towards
improving work conditions and revised the minimum wages. This became the basis for further negotiations
in the Industrial Relations Committee leading to implementation of the new but revised pact.
General comments
In the Kerala context one must note that there is a strong element of collective bargaining in wage setting,
including minimum wages and hence the notification method is only a consequence of the consensus arrived
at through tripartite negotiations.
A recent but novel initiative started by the Government of Kerala relates to what is called Wage Protection
System. Under this system, salary and allowances of employees governed by minimum wages will be
directly credited to the bank account of the employees by the employers. The Labour Department will
monitor the system through an understanding with the banks. This was in response to several complaints
by employees in private educational institutions, hospitals and shopping malls about lower than minimum
wages agreed by their employers. The WPS is an idea borrowed from the one existing in the United Arab
Emirates where a large number of workers from Kerala are employed. When the idea was mooted the state
government sent a delegation to study the functioning of this system which later recommended its adoption.
Ever since it was mooted in 2011, it took four years to introduce the system by formally amending in 2015
the Kerala Minimum Wages Act to allow for this electronic WPS. The system is in its initial stages starting
with private educational institutions, textile and jewellery shops and construction sector. The benefit is
likely to be largely to the regular employees of these establishments. In the case of casual workers, a similar
scheme is in operation only in the public employment programme of MGNREGS.
ILO DWT for South Asia and Country Office for India 119
8.5. A National Minimum Wage
The concept of a National Minimum wage has been advanced and debated from time to time. The National
Commission on Rural Labour (1991) and more recently National Commission for Enterprises in the
Unorganized Sector (NCEUS) also known as Arjun Sengupta Commission (2005-09) made a strong plea
for a statutory national minimum wage as a floor below which no worker should be paid. The objective of
a national minimum wage is to fix a statutory minimum level of payment covering the basic need of a
standard family of four consumption units, and to reduce inequality in such standards across the states.
While uniform national level wage policy is desirable, it is not easy to concretize given the differences in
costs and local conditions which play a major role in fixing wages. In July 1987, following the
recommendations of Indian Labour Conference held in November, 1985, five Regional Minimum Wages
Advisory Committees were set up. These committees were entrusted with the task of reducing inter-state
disparities in minimum wages in a region and recommended coordination among neighbouring states in
fixing/ revising minimum wage rates. Five Regional Minimum Wage Advisory Committees are: Eastern
Region, North Eastern Region, Southern Region, Northern Region and Western Region.
Another bid to achieve this goal of uniform minimum wages is the concept of National Floor Level
Minimum Wage introduced in 1991, based on the recommendations of National Commission on Rural
Labour (NCRL). It was fixed at Rs 35/- per day in 1996 and with subsequent adjustment to rise in price
indices the Central Government revised it several times. In 2013, the NMW was notified at Rs.137. The
current rate stands at Rs 160 per day since 01.07.2015. Although it does not have any statutory backing,
States are persuaded to fix and revise their minimum wages for scheduled employment and activities above
or at least at par with the National Floor Level Minimum Wage. The subject has again come under
discussion among the stakeholders, government, workers and industry with the trade unions demanding a
statutory national minimum wage.
8.6. Issues in implementation
It goes without saying that mere legal provision of minimum wages need not guarantee its access to the
intended workers, especially in countries where the enforcement system is weak (see e.g. Jones 1997). As
we have seen earlier, the Indian situation is characterized by a plethora of minimum wages both nationally
and within states with periodic revisions. Most of them now exceed the recommended National Minimum
Wage rate. And yet the effectiveness in implementation is far from satisfactory, to put it modestly.
Enforcement seems to be disproportionately left to the officials of the Labour Department through
inspections. If violations are detected, prosecutions follow, resulting in fines. It is well known that the
regime of labour inspections is widely perceived as ineffective in ensuring payment of minimum wages.
Factors include inadequacy of staff and vehicles, widespread rent-seeking behavior of officials in the form
of corruption, absence or weakness of trade unions at the enterprise/local level or, in many cases, even at
the state level, the threat of job loss for workers in a context of poverty and lack of alternative job
opportunities, low level of education and so on. These factors have prompted further thinking and research
in this area leading to formulation of a set of strategies for effective implementation of minimum wages.
For example, Benassi (2011), following the insights in compliance theory, comes out with three approaches
ranging from ‘soft’ to ‘hard’ ones viz. (a) persuasion, (b) management, and (c) enforcement.

120 ILO DWT for South Asia and Country Office for India
Persuasion is a soft approach involving interactions between officials and employers persuading the former
to abide by the minimum wage laws. Also, ‘supportive public discourse’ in society. Persuasion could
involve convincing the employers of the benefits of paying minimum wages through improved productivity
and commitment to work on the part of workers. Management approach would stress on clear rule setting,
a participative process of wage setting (e.g. tripartite committees), information dissemination to the
stakeholders and capacity building for enforcement officials, employers and workers and their
organizations. Enforcement approach could take a ‘hard’ view of implementation and that is where
inspection assumes importance. But inspection has to be followed by deterrent punishment in cases of
default; otherwise, effectiveness is lost. However, the reliance on this approach in India has been met with
many difficulties and challenges including understaffing, lack of training, rent-seeking and many others
mentioned earlier.
There is indeed a strong case for deploying all three approaches because this could produce a useful synergy,
resulting in more effective implementation. However, in the case of India, as in the case of most other
developing economies, there is need to recognize the structural barriers and the consequent need for a wider
approach linking with policies intended for human development and livelihood security including social
security. In the first place, workers should be in a position to refuse work when the wages offered are below
the minimum wage. That means their reserve price should be at least equal to the minimum wage. In a
situation of everyday poverty, this is impractical in several contexts as well as groups, if not all. Low wage
workers are mostly asset-less or asset-poor and hence do not have the staying power. This is where anti-
poverty policies and schemes have a crucial role to play. Effective public distribution of essential
commodities at subsidized prices, social assistance in the form of old age pensions and subsidized
consumption for children (e.g. supplementary nutrition and mid-day meals) could provide a measure of fall
back and increasing the reserve price of the laboring poor. Here the effective implementation of minimum
wages itself could contribute to reducing poverty as empirical studies have shown with reference to selected
developing countries (see Saget 2001) as well as a more recent study on India (see Belser and Rani 2010)17
Health care is a crucial item of expenditure and it could be catastrophic to poor labour households and
therefore the provisioning of public health care is also a form of strengthening the staying power or
increasing the reserve price of labour. The second structural barrier is the low level of education and any
effort in adult non-formal education of such workers would enhance their awareness about minimum wage
rules and regulations as indeed on an array of work and employment related legislation and other support
mechanisms. The third is the presence of effective organizations of workers. This is a great challenge in the
Indian context, with a sizeable presence of casual workers in many employments. While national level trade
unions are addressing this issue, there are challenges involved in forming effective local level trade unions
and their role in workers’ education, dissemination of information, negotiations with employers and an
overall climate to sustain their employment through enhanced productivity as well as payment of wages
that should, at the least, abide by the minimum wage legislation. In fact, it is this larger approach that has
been advocated by commissions that dealt with this issue. In particular, the NCEUS made focused
recommendations in the form of (a) a National Minimum Wage below no state should set wages for
employments included in the Schedule, (b) a National Minimum Social Security addressing health care, old
age and death/accident, (c) strengthening of the National Rural Employment Guarantee Scheme, and (d) a
minimum conditions of work ensuring no child or forced labour, safety and other basic requirements. The
17 “Our findings show that for salaried workers, the fact that they are being paid below the minimum wage currently increases the
probability of being poor by 9 to 10 per cent. For casual workers, not receiving the national minimum wage raises the probability
of being poor by anywhere between 7 to 10 per cent. Similarly, complete compliance or enforcement of state-level minimum
wages would reduce the probability of wage-earners being poor by 3 to 6 per cent. The marginal effects of the probit estimates
also bring out that minimum wage is the third most important factor in reducing the poverty risk for the wage-earner household
after education and location, if extended to all workers. Clearly this is a significant effect and strongly suggests that minimum
wages, whether national or state level, may help in lifting a significant number of low-income families out of poverty.” (Belsar and
Rani 2010:20).
ILO DWT for South Asia and Country Office for India 121
NCEUS contended that such a package will ensure the creation of a ‘social floor’ for the vast mass of
workers in the informal sector constituting 82 to 84 per cent of India’s workforce. At the same time, the
NCEUS acknowledged the need for enhancing productivity of the micro and small enterprises that dominate
the Indian economy as well as agriculture (NCEUS 2009: 358)18.
18 These proposals were elaborated in great detail in its Report on Social Security for Unorganized Workers (2006), Report on the
Conditions of Work and Promotion of Livelihoods (2007/8). On specific analysis and recommendations pertaining to promotional
measures in micro enterprises and in agriculture see, NCEUS (2007 and 2008).

122 ILO DWT for South Asia and Country Office for India
Appendix to Chapter 8
Sl.no Male Female Total
1 Mizoram 0.0 Mizoram 0 Mizoram 0
2 Pondicherry 0.8 Goa 0 Goa 1.7
3 Manipur 3.6 Punjab 6.8 Punjab 4.3
4 Punjab 4.2 Kerala 7.8 Manipur 5.6
5 Kerala 5.1 Haryana 9.2 Kerala 6.0
6 J & K 11.1 Arunachal 20.2 J & K 11.1
7 Arunachal 11.5 Rajasthan 32.9 Arunachal 15.1
8 Goa 17.1 Tripura 34.9 Haryana 18.4
9 Haryana 20.7 Manipur 35.7 Rajasthan 28.2
10 H P 20.8 Odisha 47.1 Tripura 33.8
11 Meghalaya 23.3 Meghalaya 50.9 Meghalaya 35.4
12 Tamil Nadu 24.7 Chhattisgarh 56.8 Pondicherry 38.3
13 Rajasthan 25.5 W Bengal 57.8 Uttaranchal 43.5
14 AP 28.4 UP 58.8 Tamil Nadu 44.4
15 Karnataka 31.3 MP 60.6 H P 45.9
16 Uttaranchal 32.3 H P 62.4 AP 49.4
17 Tripura 33.6 AP 68.4 Karnataka 51.4
18 Assam 48.1 Jharkhand 70.1 Odisha 52.5
19 Maharashtra 48.6 Gujarat 71.8 Assam 55.4
20 Bihar 53.5 Pondicherry 74.5 W Bengal 56.4
21 Odisha 54.4 Assam 77.3 Bihar 56.6
22 W Bengal 56.2 Tamil Nadu 77.3 UP 57.5
23 UP 57.3 Maharashtra 77.9 Maharashtra 61.7
24 MP 64.9 Karnataka 78.3 MP 63.5
25 Jharkhand 66.9 Bihar 85.3 Chhattisgarh 66.3
26 Gujarat 71.6 Uttaranchal 96.1 Jharkhand 68.2
27 Chhattisgarh 74.4 Delhi Gujarat 71.6
28 Sikkim 100 Sikkim Sikkim 100
29 Nagaland 100 Nagaland Nagaland 100
30 Delhi J & K NA Delhi
All India 47.4 All India 68.3 All India 54.2
Source: Computed from unit level data from NSS 68th Round.
Table 8. A1: Percentage of casual workers in Agricultural sector receiving less than National Minimum Wage (INR 122.08) (2011-12) Rural

ILO DWT for South Asia and Country Office for India 123
Sl.no Male Female Total
1 Punjab 0 Arunachal 0 Uttaranchal 0
2 Uttaranchal 0 Goa 0 Arunachal 0
3 Arunachal 0 Meghalaya 5.1 Meghalaya 2.6
4 Meghalaya 0 Kerala 10.4 Punjab 3.4
5 Kerala 6.9 Odisha 17.6 Kerala 7.4
6 Haryana 8.4 UP 30.6 Haryana 8.4
7 Odisha 13.4 Manipur 32.2 Mizoram 13.8
8 Mizoram 13.8 MP 53.4 Odisha 15.1
9 Assam 19.5 Tripura 59.7 Assam 19.5
10 Tamil Nadu 23.1 AP 65.5 J & K 26.2
11 J & K 26.2 Tamil Nadu 66.4 Goa 30.7
12 Pondicherry 33.9 Karnataka 70.2 Pondicherry 33.9
13 Karnataka 35.6 Gujarat 71.8 UP 34.9
14 UP 36.3 Chhattisgarh 71.9 Tamil Nadu 37.5
15 Bihar 37.8 Maharashtra 79.3 Bihar 40.1
16 AP 38.5 H P 100 Manipur 40.7
17 Goa 42.1 Punjab 100 MP 47.1
18 Manipur 42.2 Rajasthan 100 Karnataka 51.9
19 MP 43.9 Bihar 100 AP 54.8
20 Maharashtra 64.3 W Bengal 100 W Bengal 66.9
21 Chhattisgarh 64.8 Delhi NA Chhattisgarh 67.5
22 Gujarat 66.4 Mizoram NA Gujarat 68.5
23 W Bengal 66.8 Jharkhand NA Maharashtra 73.8
24 Rajasthan 71.1 Uttaranchal 0 Tripura 76.1
25 Tripura 84.6 Haryana 0 Rajasthan 78.7
26 Delhi 0 Sikkim 0 H P 100
27 Sikkim 0 Nagaland 0 Delhi NA
28 Nagaland 0 Assam 0 Sikkim NA
29 Jharkhand 0 Pondicherry 0 Nagaland NA
30 H P 0 J & K 0 Jharkhand NA
All India 37.0 All India 64.5 All India 47.2
Source: Computed from unit level data from NSS 68th Round.
Table 8.A2: Percentage of casual workers in agricultural sector receiving less than National Minimum Wage (INR 122.08) (2011-12) Urban
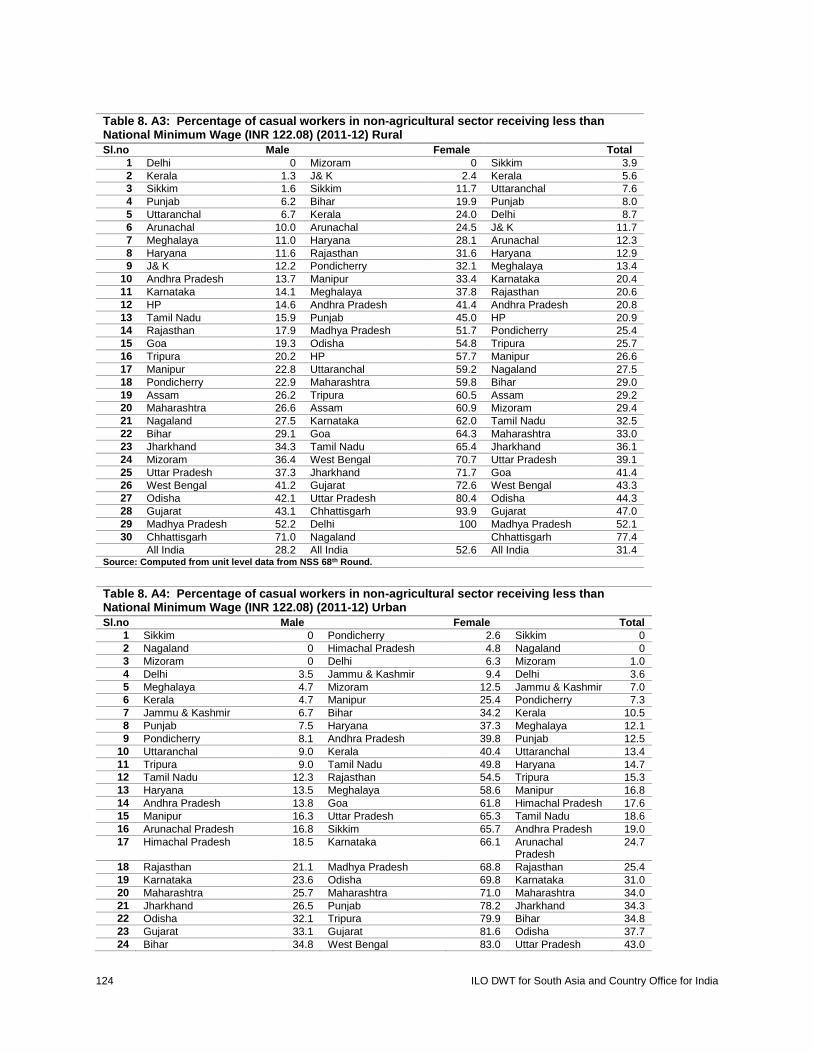
124 ILO DWT for South Asia and Country Office for India
Sl.no Male Female Total
1 Delhi 0 Mizoram 0 Sikkim 3.9
2 Kerala 1.3 J& K 2.4 Kerala 5.6
3 Sikkim 1.6 Sikkim 11.7 Uttaranchal 7.6
4 Punjab 6.2 Bihar 19.9 Punjab 8.0
5 Uttaranchal 6.7 Kerala 24.0 Delhi 8.7
6 Arunachal 10.0 Arunachal 24.5 J& K 11.7
7 Meghalaya 11.0 Haryana 28.1 Arunachal 12.3
8 Haryana 11.6 Rajasthan 31.6 Haryana 12.9
9 J& K 12.2 Pondicherry 32.1 Meghalaya 13.4
10 Andhra Pradesh 13.7 Manipur 33.4 Karnataka 20.4
11 Karnataka 14.1 Meghalaya 37.8 Rajasthan 20.6
12 HP 14.6 Andhra Pradesh 41.4 Andhra Pradesh 20.8
13 Tamil Nadu 15.9 Punjab 45.0 HP 20.9
14 Rajasthan 17.9 Madhya Pradesh 51.7 Pondicherry 25.4
15 Goa 19.3 Odisha 54.8 Tripura 25.7
16 Tripura 20.2 HP 57.7 Manipur 26.6
17 Manipur 22.8 Uttaranchal 59.2 Nagaland 27.5
18 Pondicherry 22.9 Maharashtra 59.8 Bihar 29.0
19 Assam 26.2 Tripura 60.5 Assam 29.2
20 Maharashtra 26.6 Assam 60.9 Mizoram 29.4
21 Nagaland 27.5 Karnataka 62.0 Tamil Nadu 32.5
22 Bihar 29.1 Goa 64.3 Maharashtra 33.0
23 Jharkhand 34.3 Tamil Nadu 65.4 Jharkhand 36.1
24 Mizoram 36.4 West Bengal 70.7 Uttar Pradesh 39.1
25 Uttar Pradesh 37.3 Jharkhand 71.7 Goa 41.4
26 West Bengal 41.2 Gujarat 72.6 West Bengal 43.3
27 Odisha 42.1 Uttar Pradesh 80.4 Odisha 44.3
28 Gujarat 43.1 Chhattisgarh 93.9 Gujarat 47.0
29 Madhya Pradesh 52.2 Delhi 100 Madhya Pradesh 52.1
30 Chhattisgarh 71.0 Nagaland Chhattisgarh 77.4
All India 28.2 All India 52.6 All India 31.4 Source: Computed from unit level data from NSS 68th Round.
Sl.no Male Female Total
1 Sikkim 0 Pondicherry 2.6 Sikkim 0
2 Nagaland 0 Himachal Pradesh 4.8 Nagaland 0
3 Mizoram 0 Delhi 6.3 Mizoram 1.0
4 Delhi 3.5 Jammu & Kashmir 9.4 Delhi 3.6
5 Meghalaya 4.7 Mizoram 12.5 Jammu & Kashmir 7.0
6 Kerala 4.7 Manipur 25.4 Pondicherry 7.3
7 Jammu & Kashmir 6.7 Bihar 34.2 Kerala 10.5
8 Punjab 7.5 Haryana 37.3 Meghalaya 12.1
9 Pondicherry 8.1 Andhra Pradesh 39.8 Punjab 12.5
10 Uttaranchal 9.0 Kerala 40.4 Uttaranchal 13.4
11 Tripura 9.0 Tamil Nadu 49.8 Haryana 14.7
12 Tamil Nadu 12.3 Rajasthan 54.5 Tripura 15.3
13 Haryana 13.5 Meghalaya 58.6 Manipur 16.8
14 Andhra Pradesh 13.8 Goa 61.8 Himachal Pradesh 17.6
15 Manipur 16.3 Uttar Pradesh 65.3 Tamil Nadu 18.6
16 Arunachal Pradesh 16.8 Sikkim 65.7 Andhra Pradesh 19.0
17 Himachal Pradesh 18.5 Karnataka 66.1 Arunachal Pradesh
24.7
18 Rajasthan 21.1 Madhya Pradesh 68.8 Rajasthan 25.4
19 Karnataka 23.6 Odisha 69.8 Karnataka 31.0
20 Maharashtra 25.7 Maharashtra 71.0 Maharashtra 34.0
21 Jharkhand 26.5 Punjab 78.2 Jharkhand 34.3
22 Odisha 32.1 Tripura 79.9 Bihar 34.8
23 Gujarat 33.1 Gujarat 81.6 Odisha 37.7
24 Bihar 34.8 West Bengal 83.0 Uttar Pradesh 43.0
Table 8. A3: Percentage of casual workers in non-agricultural sector receiving less than National Minimum Wage (INR 122.08) (2011-12) Rural
Table 8. A4: Percentage of casual workers in non-agricultural sector receiving less than National Minimum Wage (INR 122.08) (2011-12) Urban

ILO DWT for South Asia and Country Office for India 125
25 Assam 37.7 Jharkhand 87.4 Gujarat 43.5
26 Uttar Pradesh 41.6 Assam 90.0 Assam 43.6
27 Goa 44.3 Chhattisgarh 91.2 Goa 46.0
28 Madhya Pradesh 44.7 Uttaranchal 93.1 Madhya Pradesh 46.5
29 West Bengal 48.4 Arunachal Pradesh NA West Bengal 53.0
30 Chhattisgarh 57.9 Nagaland NA Chhattisgarh 67.9
All India 27.4 All India 62.3 All India 32.3
Source: Computed from unit level data from NSS 68th Round.

126 ILO DWT for South Asia and Country Office for India
9. Wage policy II - Other legislations and wage
setting institutions
9.1. Introduction
In the last chapter we focused, on the basis of an overall review of the wage policy setting, on the design
and functioning of The Minimum Wages Act, 1948 which has turned out to be one of the main foundational
pillars of labour legislation in India despite several flaws in implementation. In this paper/chapter, we focus
on the other three important legislations governing wages as well as those wage-setting institutions that
have come to stay, arising out of the organization of workers into trade unions as well as legislations that
have adopted the tripartite model of wage settlement.
9.2. Payment of Wages Act, 1936
9.2.1. Objectives and salient provisions
This Act was passed a little more than a decade before India became independent. It arose out of a
recommendation of the Royal Commission on Labour (1929). Taking advantage of the conditions of
poverty of the vast mass of laboring poor, employers in many employments, including factories and
establishments, resorted to delayed payment of wages, deductions in the name of quality of output or
presumed violations of norms, fines on petty mistakes or presumed mistakes and so on. The Act sought to
provide a cure for such malpractices, the brunt of which was mostly borne by the low-paid labouring poor.
As such The Payment of Wages Act was passed in 1936 to regulate the manner and frequency of payment
of wages and ensure regular payment without delay and arbitrary deduction in the form of fines and
penalties. According to the Act, employers cannot withhold wages earned by workers nor can they make
any unauthorized deduction. Payment must be made before expiry of a specified day after the last day of
the wage period. In case of those acts or omissions, which have been approved by an appropriate authority,
fines are imposed but they are not to exceed an amount equal to three per cent of wages payable. Under the
Act, workers or their trade unions can file a claim before the Authority if payment of wages is delayed or
wrongful deductions are made. An appeal can also be filed against the order of the Authority. The salary in
factories/establishments employing less than 1000 workers is required to be paid by 7th of every month and
in other cases by 10th day of every month. Payments have to be in cash and not in kind.
9.2.2. Coverage and extension over the years
This Act initially applied to all workers whose wages on the basis of wage-period average were less than
or equal to sixteen hundred rupees per month. It has been revised several times to extend its coverage. In
2005, with the amendment in the Payment of Wages Act, the wage ceiling was extended to INR 6500 per
month, and later to INR 10,000 per month in 2007. At present the ceiling stands at INR 18,000 per month
since 2012. A ceiling on wages for inclusion under the Act therefore means that the Act is intended to
protect the interests of the low wage workers who usually are from poorer households vulnerable to
exploitation.
As for the coverage of establishments, the Act was applicable, till 1963, to all the factories as defined under
Section 2 (m) of the Factories Act, 1948 i.e. factories which employ 10 or more workers using power and
ILO DWT for South Asia and Country Office for India 127
20 or more workers not using power. However, in 1964, the coverage was extended to the factories under
Section 85 of the Factories Act, 194819.
9.2.3. Implementation machinery and experience
Section 14 of the Act provides for inspection method for the implementation and supervision of the Act. It
specifies that an Inspector of Factories appointed under section 8 of the Factories Act, 1948, shall be an
Inspector for the purposes of this Act in respect of all factories within the local limits assigned to him. The
State Government is entrusted with the task of appointing Inspectors for the purposes of this Act in respect
of all persons employed upon a railway to which this Act applies. However, the State Government may
appoint other persons, as it thinks fit to be Inspectors for the purpose of this Act, by notification in the
Official Gazette.
How effectively the inspection system works every year can only be gauged by the statistical returns the
state governments send to the Labour Bureau for consolidation. There seems to be a certain lack of
seriousness in sending statistical returns on a regular basis by several states. The Labour Bureau states, last
year, that, ‘The data is based on the Returns received from the responding states/UTs only. Returns for the
year 2012 was not received from the following states/UTs despite several reminders’ (Labour Bureau
2015b:9). There were 10 states (Arunachal Pradesh, Gujarat, Jharkhand, Madhya Pradesh, Meghalaya,
Manipur, Nagaland, Punjab, Sikkim and Uttar Pradesh) and one Union Territory (Dadra & Nagar Haveli)
which did not send the returns. Four states (Bihar, Chhattisgarh, Maharashtra, Mizoram) and Union
Territory (Lakshadweep) sent what the Labour Bureau terms ‘defective’ returns. Based on the returns sent
by the remaining 16 states and 3 Union Territories, the Labour Bureau reported that 177,723 establishments
were covered under the Act; however, only 11 per cent of them submitted annual returns.
In general, the impression one gets is that there is a big gap between the intentions of the Act and its
implementation across the country.
9.3. Equal Remuneration Act, 1976
Common sense and logic would demand that there should be equal remuneration to workers, irrespective
of their gender, race or caste, if they are performing the same or similar tasks requiring the same effort,
time, skill and responsibility. However, the real world situation is characterized by several labour market
and outside-labour market discriminations and the one stubborn discrimination is the disparity in wages
between men and women performing the same or similar tasks. The discrimination works at two levels;
one, by segmenting jobs earmarked for women and men and two, discrimination on some ground even
when the tasks performed are the same or similar. Wage discrimination could also be between men and
men as well as women and women as we have seen in Chapter 4.
There has been international attention to counter this situation. The ILO came out with two Conventions on
this subject; the first was in 1951 on Equal Remuneration (Convention No.100) and another one in 1958
19 The Labour Bureau, Ministry of Labour and Employment, Government of India however states in its 2012 report that ’due to
incomplete response, data in respect of factories under Section 85 have not been included in the statistics of earnings till 1982‘
(Labour Bureau 2012:2).
128 ILO DWT for South Asia and Country Office for India
(Convention No.111) against discrimination in employment and occupation. The United Nations General
Assembly adopted a Convention on the Elimination of all forms of Discrimination against Women
(CEDAW) in 1979 and recognized ‘pay equity’ as a right of women.
9.3.1. Objective
The Directive Principles of State Policy in the Indian Constitution had declared, under Article 39, ‘the State
shall direct its policy towards securing equal livelihood opportunities and equal pay for all citizens, both
men and women’. However, it took almost three decades for this directive to become a law in the form of
The Equal Remuneration Act, 1976.
There are two major objectives which this Act intends to implement. First, it provides for equal wages for
work of same and similar nature to male and female workers. And second, it protects discrimination against
women employees in recruitment, promotion and training, unless it is forced by law. Thus, it protects the
right of women of equal opportunity and treatment at workplace.
9.3.2. Coverage
The Act is implemented by the Central Government in relation to employments which are either directly
carried on by Central Government or under the authority of the Central Government or a railway
administration, or related to a banking company, a mine, oil field or major port or any corporation
established by or under a Central Act. In respect of all other employments in establishments which are not
within the ambit of the Central Government, the implementation rests with the State Governments.
The Act, though applicable to all workers and employers irrespective of the nature of work and size of
enterprise, does not specifically define an establishment to which it is applicable, but makes reference to
the definition of employer as provided by section 2 of the Payment of Gratuity Act, 1972. Thus, it applies
to establishments employing ten or more workers.
9.3.3. Implementation
Implementation mechanism for the Act includes (i) appointment of an Advisory Committee by the
appropriate government (i.e. both the Central and State Governments) to advise on employment
opportunities and nature of employment for women; (ii) Labour Officer or officer of similar rank for hearing
and deciding claims and complaints regarding violation of the Act; and (iii) Inspectors to investigate
whether the rules made under the Act are being complied with by the employers. As in the case of The
Payment of Wages Act, 1936 the implementation of this Act is also quite ineffective given the continuing
large gaps between the wages of men and women workers as we have shown in Chapter 4.
9.4. Payment of Bonus Act, 1965
9.4.1. Concept: Deferred wage/profit sharing
There are two concepts of the bonus as discussed in the policymaking and academic discourse, i.e. bonus
as profit sharing and bonus as deferred wage. According to the profit sharing theory, a bonus should be
linked to the profit of the establishment and to be paid to the employees only when it makes profit; whereas
ILO DWT for South Asia and Country Office for India 129
deferred wage concept considers a bonus as a part of the wage which should be paid to the employees
irrespective of the profits of the establishment. In this approach, bonus is seen as a means to reduce the gap
between ‘living wage’ and the currently paid wage.
The Payment of Bonus Act, 1965 provides for payment of bonus to persons employed in certain
establishments with minimum and maximum limits. The Act makes it a statutory right of the worker to get
a minimum bonus (8.33 % of wages/ salary) irrespective of the profits of the employer and a bonus
proportional to the wage (with a maximum of 20 % of wages/ salary) if the allocable surplus exceeds the
amount of minimum bonus as set by the Act. Bonus is to be paid on an annual basis, within a period of
eight months of the closure of financial year.
9.4.2. Coverage: Enterprise/ workers
This Act applies to all factories, and establishments in which twenty or more persons are employed on any
day during an accounting year. Also an establishment to which this Act applies continues to be governed
by the Act even if the number of workers at any time falls below twenty. It covered initially all employees
whose wages are less than INR 3500 rupees per month, skilled or unskilled, working in any industry.
However, later in 2007, with the amendment of the Act those workers whose average monthly salary is up
to ten thousand rupees are eligible for a bonus.
Every employee who has worked in an establishment for at least thirty working days in a year is entitled to
receive a bonus from employer in that accounting year subject to the condition that he is not dismissed from
service for fraud or other inappropriate conduct as mentioned in the Act, leading to some kind of loss to the
establishment.
9.5. Wage setting institutions and practices
9.5.1. Historical developments
9.5.1.1. Collective bargaining
The history of collective bargaining in India can be traced back to early 1920s. Bargaining in industries was
at a very nascent stage at that time and it was not very common to regulate labour management relations.
The need for collective bargaining and hence trade union movement as dispute settlement mechanism in
industrial sector arose with the advent of factory system in India. This mechanism of settlement of disputes
related to wages and other employment related benefits and working conditions is specific to organized
labour sector, leaving the majority of workers in the unorganized/non-unionized sector. The trade union
movement in the early 20th century has been instrumental in creating the awareness and establishing the
foundation for collecting bargaining. So we turn to a brief outlining of the origin and evolution of collective
bargaining in India.
The modern factory system set its foot in India during 1850s with the establishment of Cotton Mills in
Bombay and Jute Mills in Calcutta. However, industrialization could make any significant progress only
after 1920s. This brought into being a new class of workers who were wage earners. Along came the
changes in working environment, new line of production and miseries of factory system, e.g. excessive
hours of work, poor working and housing condition, high death rate etc. Initially the workers had no say in

130 ILO DWT for South Asia and Country Office for India
the wage fixation process and had to be content with the amount negotiated individually or as fixed by the
management which were mostly exploitative. The growing consciousness among the workers and concern
among some social workers and philanthropists led to the formation of first Bombay Factory Commission
in 1875 and few other committees to enquire into worker’s problems. Afterwards, some workers’
associations were formed in industries in Bombay, Ahmedabad, Madras and other parts of pre-independent
India. N.M. Lokhandey, MK Gandhi, BP Wadia are some leaders who played crucial roles in the initial
phase of the movement. The movement progressed at a greater pace after World War I with the influence
of war, upsurge of nationalist movement, Russian socialist revolution and establishment of ILO. The Indian
Trade Union Act, 1926 provided recognition of unions and union activities.
There were instances of prolonged and large scale strikes by trade unions, especially in the cotton textile
industry in Bombay and Kanpur and jute mills in Calcutta and tea plantation in Assam during the 1920s
and 1930s which resulted in a significant increase in wages and improvement in conditions of work. The
Bombay Industrial Dispute Act of 1938, created an atmosphere conducive to the growth of collective
bargaining in the country. The establishment of bodies like Indian Labour Conference and the Standing
Labour Committee in 1942 created an environment much needed for the success of collective bargaining
in the country. The Bombay Industrial Relations Act, 1946 incorporated the provision of settlement of
industrial disputes by conciliation officers and the Board of Conciliation. The Industrial Disputes Act 1947,
allowed the Works Committee in addition to the other settlement authorities which further paved the way
for growth of mutual negotiations in industries.
In the first five-year plan (1951-56), it was stated that the workers right of association, organization and
collective bargaining was to be accepted without reservation as the fundamental basis of mutually
satisfactory relationships. The Industrial Policy Resolution of 1956 further declared that in a socialist
democracy, labour is a partner in the common task of development. A Code of Discipline in Industry was
adopted in 1958 by the Indian Labour Conference, which affirmed the principle to settle all future
differences, disputes and grievances by mutual negotiation, conciliation, and voluntary arbitration. The
Code helped to facilitate the process of collective bargaining by placing a moral obligation on employers
to recognize trade20 unions as bargaining agents. But in the absence of any statutory backing it turned out
ineffective. This led to the continuation of collective bargaining as per the guidelines of Industrial Dispute
Act, 1947. Between 1961 and 1967 recognition was secured for 48 trade unions in the center and for 268
unions in the states. The Inter-Union Code of Conduct was also agreed upon during the same period, under
which the four central labour organizations agreed that every employee should be free to join the union of
his choice and no coercion should be exercised in the matter. Also, there should be no dual membership of
unions and the ignorance and backwardness of workers should not be exploited by any organization.
From 1970 onwards collective bargaining took a more general form. It widened its scope from plant or
enterprise level to the industry or the national level. With the constitution of Joint Wage Negotiating
committee (JWNC) for the steel industry at the national level, collective bargaining became centralized. A
bipartite, national apex body was set up in 1975 by the Government to address the general problems of
industrial relations in the private sector. On the recommendations of the national apex body, National
Industries Committees were set up. In the post-reform period (1990’s onwards), however, the situation has
reversed. There are hardly any industry level negotiations, either regionally or nationally. Most of the
bargaining takes place at the enterprise level.
20 Trade unions usually mean association of workers. But employer’s associations are also regarded as trade union.

ILO DWT for South Asia and Country Office for India 131
9.5.2. Dispute settlement machinery under the Industrial Dispute Act, 1947
The Industrial Dispute Act (IDA) provides for settlement machinery for any industrial disputes including
that relating to wages. In fact, a fair percentage of disputes have been related to wages. According to the
Indian Labour Statistics (2011), 17.9 % of industrial disputes and 21.2 % of industrial disputes were related
to wages and allowances during 2008 and 2009 respectively. Besides, 3.6 % and 4.9 % of industrial disputes
were related to bonus in the respective years.
Any dispute may be settled either through negotiations with state intervention or without state intervention.
Industrial Dispute Act makes provision for the investigation and settlement of such industrial disputes. As
provided by the Industrial Dispute Act, 1947 following are the five dispute settlement machinery in
industrial sector in India. They are 1. Works Committee, 2. Conciliation, 3. Court of Inquiry, 4.
Adjudication and 4. Voluntary Arbitration.
a. Works committee
The Act directs the appropriate government to make the employer constitute a Works Committee in
enterprises with hundred or more workers. The committee should have representatives of employers and at
least equal number of representatives of employees. The objective of setting up such bipartite committee is
to promote good industrial relation by bipartite negotiation.
b. Conciliation
Conciliation refers to involvement of an independent third party which mediates and promotes settlement
of a dispute. The representatives of the two parties — employers and employees — are brought together
before a third party to discuss and arrive at a mutual agreement. The role of this third party is only to
facilitate the process and not to impose any decision. Conciliation is a state intervention to settle industrial
dispute. The conciliation process may take place either by appointment of Conciliation officers or Boards
of Conciliation. In a Board, the chairman is an independent person and other members are representatives
of disputing parties in equal numbers and are appointed on the basis of recommendation of the parties.
c. Court of inquiry
The central or state government may constitute Court of Inquiry for inquiring into the matter related to
industrial dispute. The chairman and members of the board are independent persons and are appointed as
required.
d. Adjudication
Adjudication is a process of industrial dispute settlement by state intervention via involvement of judiciary.
Here the legal authority appointed is usually a Judge of High Court or equivalent authority. The settlement
made is binding on the parties. Industrial Dispute Act provides for three-tier adjudication machinery.
e. Labour Court
The appropriate government may constitute one or more Labour Courts by official notification for the
adjudication of industrial disputes related to matters specified in the Second Schedule. It consists of only
one person of the rank of Judge of High Court.

132 ILO DWT for South Asia and Country Office for India
i. Industrial Tribunal
The appropriate government may constitute one or more Industrial Tribunals for the adjudication of
industrial disputes related to matters specified in Second Schedule or Third Schedule. It relates to wages,
compensatory or other allowances, bonus, PF, profit-sharing, conditions of work, retrenchment and other
issues.
ii. National Tribunal
Though the Labour Courts and Industrial Tribunals are formed by State or Central government, the
National Tribunals are constituted by Central government only for the adjudication of industrial disputes
involving industrial establishment situated in more than one state, affected by the dispute. It consists of
only one person of the rank of Judge of a High Court. An order appointing a Labour Court, Tribunal or
National Tribunal also specifies the period within which the judgment or award has to be submitted to the
appropriate government.
The Central or State government may refer a dispute to a Board for assisting settlement of dispute. After
the investigation, the Conciliation Officer (CO) is required to submit the report within fourteen days of the
commencement of conciliation proceedings. If no settlement is reached, the government may refer the case
to the Board or Court or Tribunals. If the dispute is referred to the Board, it is the duty of the Board to
investigate the matters and induce the parties to come to a fair settlement. It is supposed to submit the report
of its proceedings within two months of its commencement. If the dispute is still not settled it may be
referred to direct judicial intervention or adjudication. A dispute thus referred to the Labour Court/ Tribunal/
National Tribunal is preceded expeditiously and report has to be submitted within six months or any
specified period. Also the appropriate government has the power to transfer the proceeding under this Act
pending before an adjudication authority to another Court or Tribunal for quick proceeding and award.
e. Voluntary arbitration
Arbitration is a process in which an independent third party listens to the parties in dispute, investigates the
case and takes decision which is binding on the disputing parties. There are two types of arbitration:
Voluntary Arbitration and Compulsory Arbitration.
In Voluntary Arbitration, the appointment of arbitrator or arbitrators is by mutual consent of the disputing
parties and the dispute is referred to arbitration before it is referred for adjudication. Here the arbitrator acts
only when the dispute is referred to him/her. Whereas in Compulsory Arbitration the arbitrator is appointed
irrespective of the consent of the disputing parties and the respective parties has to comply with the decision
of the arbitrator. Compulsory Arbitration is adopted when the parties fail to come to a settlement by bipartite
negotiation or voluntary arbitration. Section 10A of Industrial Dispute Act provides for voluntary reference
of disputes to arbitration. It also states that in case no decision is reached at by the arbitrators, another
person will be appointed as umpire whose decision will be taken as the arbitration award for the dispute.
This, however, did not change the situation, and tripartite wage boards became the principal machinery of
wage fixation since 1957.
9.5.3. Wage Boards
9.5.3.1. Constitution and functioning
Wage Boards are tripartite committees formed by government constituting of representatives of employers,
representatives of workers and independent members representing the public. The Wage Boards are

ILO DWT for South Asia and Country Office for India 133
entrusted with the task of recommending wages, compensation, gratuity, number of hours of work and
revisions in wages from time to time for a particular industry they are appointed for. Of these, wage fixation
is the primary objective of the Board. In principle it is supposed to work out a wage structure based on the
recommendations of Committee on Fair Wages. However, it also takes into account other criteria like need
to maintain industrial production, adjust wage differential such as to provide incentives to workers for skill
improvement, due allowance for fair return to capital, ensure fair allocation to depreciation and reserve,
remuneration to management and prices. Representation of three parties in the Board fulfils the objective
of improving industrial relation through negotiations and participation in determining wages and
employment conditions. Though the history of Wage Boards in India is much older, the first such wage
board was set up by the government in 1957 in cotton textile and sugar industries.21 It was the consequence
of Bombay Industrial Relations (Amendment) Act, 1948 which was the first such legislation to include
provision for establishing Wage Board for any industry covered by the Act.
Wage Boards were constituted with the idea of providing for a wage fixing machinery for the organized
labour sector which was at a very nascent stage of development and didn’t have adequate bargaining power
during the 1950s and 1960s. Though the reference has been made before, it was only in the second plan
that the need for industrial wage boards was emphasized as wage dispute settlement machinery. This was
also discussed in the 15th Indian Labour Conference in 1957, after which different Wage Boards were
appointed for different industries. However, all the wage boards were not statutory and so their
recommendations were not binding by law. Only the Wage Boards for journalists and non-journalist
newspaper and news-agency employees were statutory in nature. Due to this the relevance of non-statutory
Wage Boards has declined over time and the last such board was setup in 1966 (with the exception of sugar
industry).22 Cement, jute, rubber plantation, coal mining, ports, tea, coffee, leather goods, iron and steel,
limestone are some other industries for which the Wage Boards had been set up during this period. In many
industries, the appointment of Wage Boards has been the result of demands and pressures on the part of
workers’ associations and trade unions.
Recognizing the regional variations in condition of industry and cost of living, most Wage Boards adopted
a region-cum-industry approach in determining wage levels and structures. They dwelt in detail upon the
concept of need-based minimum wages, as propounded by the 15th Indian Labour Conference in 1957 and
adopted a rather some version of it for minimum level of wages. Beyond that they generally maintained the
historical relativities among different levels of occupations and employments. Among other criteria, the
capacity of industry to pay was hotly debated in terms of its concept and measurement and adopted by
different Boards in one form or other. They generally accepted the principle of periodical adjustment of
wages to the rise in cost of living, in the form of dearness allowance, with hundred percent neutralization
of rise in Consumer Price Index at the lowest level and progressive decline in its extent at higher levels of
wages.
9.5.3.2. Present status of Wage Boards
As discussed, the importance of the non-statutory Wage Boards has gradually declined over a period of
time and no non-statutory Wage Board has been set up after 1966. Wage Boards in various industries like
rubber, cement, jute, cotton, sugar, tea coffee etc. has been abolished. This was also recommended by the
second National Commission on Labour in 2002. The trade unions, having grown in strength in these
industries, were supposed to be able to negotiate their wages with the management. The only statutory
21 The Wage Board for the said industry was non-statutory in nature.
22 In the sugar industry the last Wage Board was constituted in 1985,

134 ILO DWT for South Asia and Country Office for India
Wage Board is for journalist and newspaper employees. The Working Journalists and other Newspaper
Employees (Conditions of Service) and Miscellaneous Provisions Act, 1955 provides for regulation of
conditions of service of working journalists and non-journalist newspaper employees continues. Since
1955, six Wage Boards has been constituted under this Act. The Section 9 and 13 C of the Act, provide for
constitution of two Wage Boards for fixing/revising rates of wages in respect of working journalists and
non-journalists newspaper employees, respectively.
There have been a number of petitions demanding its abolition which argued that due to significant socio-
economic changes in the Indian economy particularly after liberalization, the need for such institutions has
disappeared. The journalist and newspaper employees are now paid fair wages and compensation to attract
and retain skilled and qualified individuals in order to sustain in the competitive environment. They stressed
on the invalidity of the Act as being outdated as most of the Wage Board decisions has been invalidated.
However such petitions have been rejected and the provision for Wage Boards to look after the wage related
issues and other conditions of work of newspaper employees are still being regulated through the Act. The
Government of India constituted two Wage Boards (Majithia Wage Boards), one for working journalists
and other for non-journalists newspaper employees in 2007 as sixth Wage Board under the Chairmanship
of Justice Majithia as per the provisions of the Act. The recommendations of the Board were accepted by
the Government.
9.6. Collective bargaining at industry/ enterprise level
At present, collective bargaining takes place at three levels. National-level industry bargaining takes place
in core industries usually owned by central government or having a major role as employer. Some of them
are banks, coal, oil, and ports. In these industries the pay scales of government employees are determined
by pay commissions and wage rates for some industries are determined by Wage Boards.
Industry-cum-regional level bargaining is more practiced in sectors dominated by private sector enterprises
like cotton, jute, sugar, tea plantation etc. Here, the decisions related to basic wage rates and other benefits
are taken at the industry level while certain incentives and allowances are decided at the regional level,
taking into account the needs and circumstances of the workers. However, over the past few decades the
practice of region-cum-industry level bargaining has declined.
Collective bargaining at enterprise or plant level is now more common in private sector. In these plants
there is no uniform bargaining procedure, it depends on the management and trade union (unions) in the
plant. On the one hand, this kind of decentralized bargaining in one hand may reduce the bargaining power
of the union and may be adversely affected in case of managerial crisis; on the other, it could help in faster
resolution of issues and higher wage rate depending on the capacity to pay of the establishment. But there
are also situations where managements seek to avoid collective bargaining either through weakening trade
unions or opposing the presence of unions. These are matters of empirical investigation to which we now
turn.

ILO DWT for South Asia and Country Office for India 135
9.7. Wage fixing practices at the enterprise level: State level experiences
9.7.1. Andhra Pradesh (Undivided)23
The information and analysis presented here is based on a study carried out for this report (Reddy 2015).
Thirty enterprises were covered in the study spread across four districts viz. Hyderabad, Ranga Reddy,
Medak and Mahabubnagar. Therefore, the study area covers the present state of Telangana. The main source
of information was the Human Resources (HR) division of enterprises (or those dealing with wages and
employee relations in the case of small enterprises), and the information included type of the products, size
of employment broadly in terms of permanent and temporary categories, and the wage fixing process
followed.24 This information was supplemented by the unions or workers in these enterprises. The size of
the thirty units vary widely from a mere 10 workers in one case to 9507 in another unit. The information
given is broadly of two categories of workers viz. permanent and contract. Contract workers would include
the entire range of workers like temporary, casual, trainees and learners, apprentices and ‘fixed period
workers’, who do not seem to have any employment or social security. The skill levels within permanent
and temporary workers vary. For the sake of convenience and also based on the industry perception, the
permanent workers are classified into four levels viz. (i) Highly Skilled, (ii) Skilled, (iii) Semi-Skilled, and
(iv) Unskilled. Among the ‘contract’ workers, there is no reporting of ‘Highly Skilled’ and hence only three
categories.
9.7.1.1. Some Basic Characteristics
With this expectation, the enterprises are grouped into five size-classes, as shown in Table 9.1. The majority
of the units (17) are in the relatively lower size classes of less than 300 workers, while the rest are distributed
in the larger size-classes. What is somewhat surprising is that size has no relation with the composition of
the permanent and contract workers. On the contrary, the largest (>1000) enterprises have the highest (65
per cent) proportion of contract employees, while even in the smallest size category (10-100) permanent
workers constitute majority share.
The highest proportion of contract workers are in the Electrical and Electronics category (66.43 per cent).
It is because of the two large units Bharat Heavy Electricals Limited, a public sector unit, and Toshiba, a
private sector unit, respectively employing 63 to 75 per cent in the category of contract workers. But within
the electrical category, the other relatively smaller units have the majority of workers in the permanent
category. Chemical and Pharma units also have a high proportion of workers in the contract category. By
contrast, the ‘General Engineering’ group of enterprises have the highest proportion (75 per cent) in the
23 This section is based on the background paper by Reddy (2015). 24 One of the toughest tasks faced by a researcher working on labour and industry related issues is in seeking information at the
enterprise level. There are many narratives by researchers on the difficulties faced in collecting information from the Human
Resource or any other branch of the management, even if it is clear that information sought is in no way relates to confidential
issues, and the information sought lies within the territory of that which the enterprise is obliged to submit regular returns on, which
are in the public domain. They shirk even to share annual reports which are published for circulation. The experience of the present
study is no different. About 45 enterprises had to be approached to succeed in reaching the sample target of 30 enterprises. First,
there were instances where they insisted on a letter from the Commissioner of Labour directing them to share information, when it
was quite obvious this would be difficult to obtain through the bureaucracy. Then, there were outright refusals to entertain any
visitor or researcher seeking any information. In some cases they would politely decline saying, they had no power to share any
information without the permission of senior management, which seems like an abstract entity. And some would ask for a schedule
or a questionnaire suggesting that they would fill and return it, but one would realize after a few visits that nothing was going to
come. Some enterprises provided the wrong information deliberately, even down to the number of employees, which upon
verification with the unions or other sources turned out to be misleading. Of course, there were a few exceptions where the
information was forthcoming without much persuasion. In any case, without the help of the unions in most of the enterprises the
task could not have been completed.
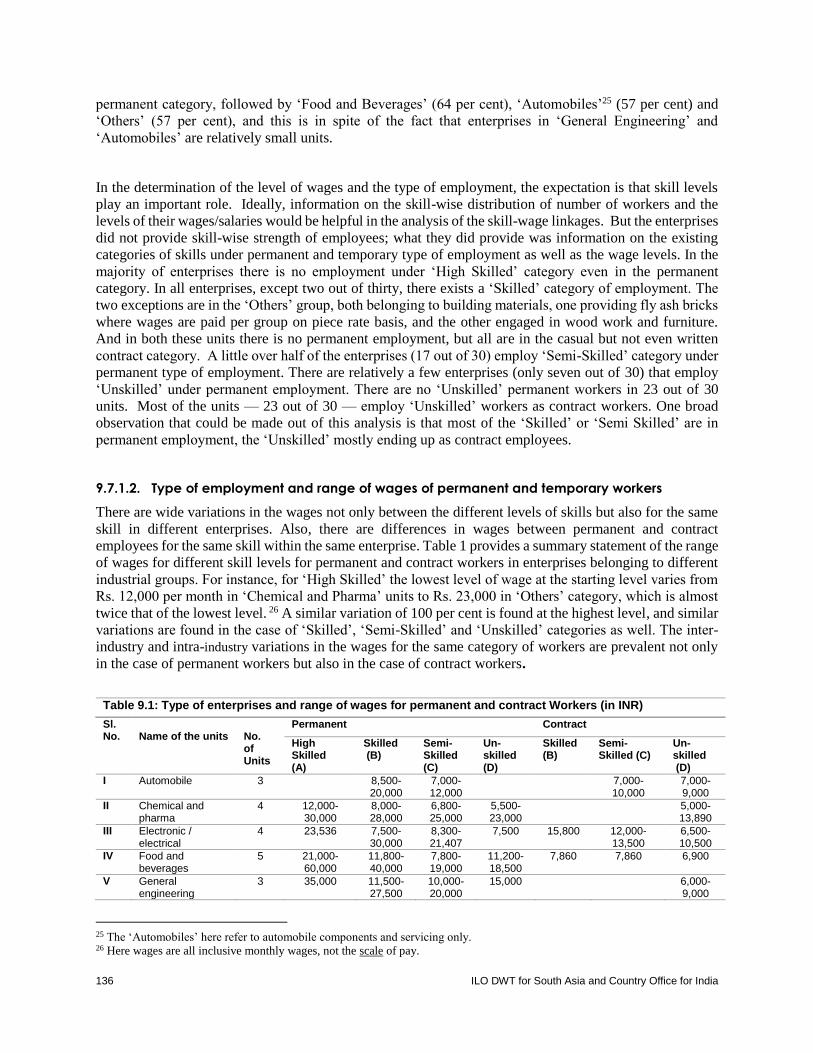
136 ILO DWT for South Asia and Country Office for India
permanent category, followed by ‘Food and Beverages’ (64 per cent), ‘Automobiles’25 (57 per cent) and
‘Others’ (57 per cent), and this is in spite of the fact that enterprises in ‘General Engineering’ and
‘Automobiles’ are relatively small units.
In the determination of the level of wages and the type of employment, the expectation is that skill levels
play an important role. Ideally, information on the skill-wise distribution of number of workers and the
levels of their wages/salaries would be helpful in the analysis of the skill-wage linkages. But the enterprises
did not provide skill-wise strength of employees; what they did provide was information on the existing
categories of skills under permanent and temporary type of employment as well as the wage levels. In the
majority of enterprises there is no employment under ‘High Skilled’ category even in the permanent
category. In all enterprises, except two out of thirty, there exists a ‘Skilled’ category of employment. The
two exceptions are in the ‘Others’ group, both belonging to building materials, one providing fly ash bricks
where wages are paid per group on piece rate basis, and the other engaged in wood work and furniture.
And in both these units there is no permanent employment, but all are in the casual but not even written
contract category. A little over half of the enterprises (17 out of 30) employ ‘Semi-Skilled’ category under
permanent type of employment. There are relatively a few enterprises (only seven out of 30) that employ
‘Unskilled’ under permanent employment. There are no ‘Unskilled’ permanent workers in 23 out of 30
units. Most of the units — 23 out of 30 — employ ‘Unskilled’ workers as contract workers. One broad
observation that could be made out of this analysis is that most of the ‘Skilled’ or ‘Semi Skilled’ are in
permanent employment, the ‘Unskilled’ mostly ending up as contract employees.
9.7.1.2. Type of employment and range of wages of permanent and temporary workers
There are wide variations in the wages not only between the different levels of skills but also for the same
skill in different enterprises. Also, there are differences in wages between permanent and contract
employees for the same skill within the same enterprise. Table 1 provides a summary statement of the range
of wages for different skill levels for permanent and contract workers in enterprises belonging to different
industrial groups. For instance, for ‘High Skilled’ the lowest level of wage at the starting level varies from
Rs. 12,000 per month in ‘Chemical and Pharma’ units to Rs. 23,000 in ‘Others’ category, which is almost
twice that of the lowest level. 26 A similar variation of 100 per cent is found at the highest level, and similar
variations are found in the case of ‘Skilled’, ‘Semi-Skilled’ and ‘Unskilled’ categories as well. The inter-
industry and intra-industry variations in the wages for the same category of workers are prevalent not only
in the case of permanent workers but also in the case of contract workers.
Sl. No.
Name of the units
No. of Units
Permanent Contract
High Skilled (A)
Skilled (B)
Semi-Skilled (C)
Un-skilled (D)
Skilled (B)
Semi-Skilled (C)
Un-skilled (D)
I Automobile 3 8,500-20,000
7,000-12,000
7,000-10,000
7,000-9,000
II Chemical and pharma
4 12,000-30,000
8,000-28,000
6,800-25,000
5,500-23,000
5,000-13,890
III Electronic / electrical
4 23,536 7,500-30,000
8,300-21,407
7,500 15,800 12,000-13,500
6,500-10,500
IV Food and beverages
5 21,000-60,000
11,800-40,000
7,800-19,000
11,200-18,500
7,860 7,860 6,900
V General engineering
3 35,000 11,500-27,500
10,000-20,000
15,000 6,000-9,000
25 The ‘Automobiles’ here refer to automobile components and servicing only. 26 Here wages are all inclusive monthly wages, not the scale of pay.
Table 9.1: Type of enterprises and range of wages for permanent and contract Workers (in INR)
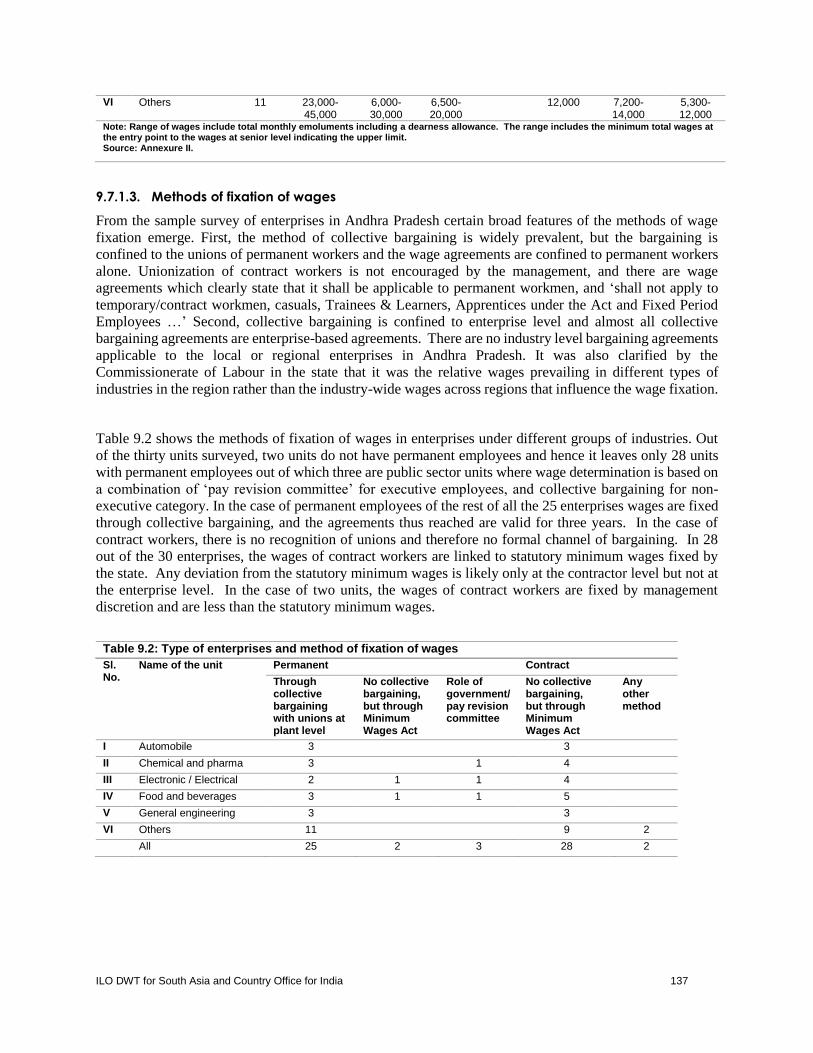
ILO DWT for South Asia and Country Office for India 137
VI Others 11 23,000-45,000
6,000-30,000
6,500-20,000
12,000 7,200-14,000
5,300-12,000
Note: Range of wages include total monthly emoluments including a dearness allowance. The range includes the minimum total wages at the entry point to the wages at senior level indicating the upper limit. Source: Annexure II.
9.7.1.3. Methods of fixation of wages
From the sample survey of enterprises in Andhra Pradesh certain broad features of the methods of wage
fixation emerge. First, the method of collective bargaining is widely prevalent, but the bargaining is
confined to the unions of permanent workers and the wage agreements are confined to permanent workers
alone. Unionization of contract workers is not encouraged by the management, and there are wage
agreements which clearly state that it shall be applicable to permanent workmen, and ‘shall not apply to
temporary/contract workmen, casuals, Trainees & Learners, Apprentices under the Act and Fixed Period
Employees …’ Second, collective bargaining is confined to enterprise level and almost all collective
bargaining agreements are enterprise-based agreements. There are no industry level bargaining agreements
applicable to the local or regional enterprises in Andhra Pradesh. It was also clarified by the
Commissionerate of Labour in the state that it was the relative wages prevailing in different types of
industries in the region rather than the industry-wide wages across regions that influence the wage fixation.
Table 9.2 shows the methods of fixation of wages in enterprises under different groups of industries. Out
of the thirty units surveyed, two units do not have permanent employees and hence it leaves only 28 units
with permanent employees out of which three are public sector units where wage determination is based on
a combination of ‘pay revision committee’ for executive employees, and collective bargaining for non-
executive category. In the case of permanent employees of the rest of all the 25 enterprises wages are fixed
through collective bargaining, and the agreements thus reached are valid for three years. In the case of
contract workers, there is no recognition of unions and therefore no formal channel of bargaining. In 28
out of the 30 enterprises, the wages of contract workers are linked to statutory minimum wages fixed by
the state. Any deviation from the statutory minimum wages is likely only at the contractor level but not at
the enterprise level. In the case of two units, the wages of contract workers are fixed by management
discretion and are less than the statutory minimum wages.
Sl. No.
Name of the unit
Permanent Contract
Through collective bargaining with unions at plant level
No collective bargaining, but through Minimum Wages Act
Role of government/ pay revision committee
No collective bargaining, but through Minimum Wages Act
Any other method
I Automobile 3 3
II Chemical and pharma 3 1 4
III Electronic / Electrical 2 1 1 4
IV Food and beverages 3 1 1 5
V General engineering 3 3
VI Others 11 9 2
All 25 2 3 28 2
Table 9.2: Type of enterprises and method of fixation of wages
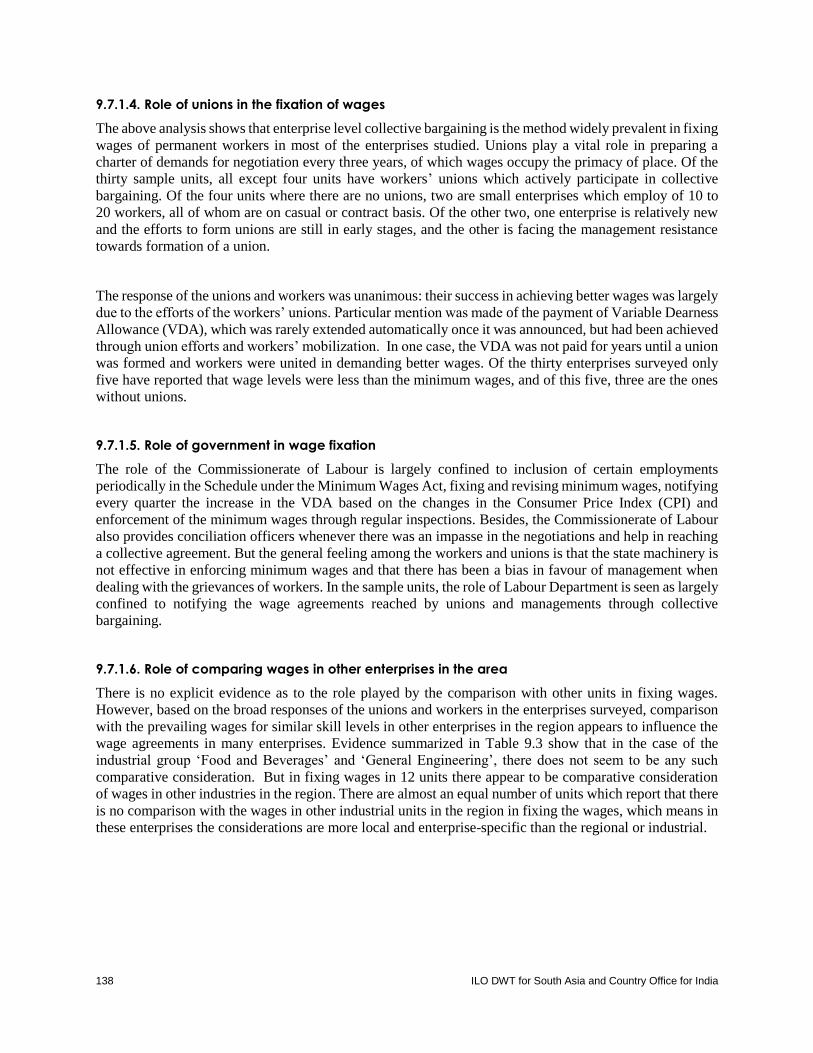
138 ILO DWT for South Asia and Country Office for India
9.7.1.4. Role of unions in the fixation of wages
The above analysis shows that enterprise level collective bargaining is the method widely prevalent in fixing
wages of permanent workers in most of the enterprises studied. Unions play a vital role in preparing a
charter of demands for negotiation every three years, of which wages occupy the primacy of place. Of the
thirty sample units, all except four units have workers’ unions which actively participate in collective
bargaining. Of the four units where there are no unions, two are small enterprises which employ of 10 to
20 workers, all of whom are on casual or contract basis. Of the other two, one enterprise is relatively new
and the efforts to form unions are still in early stages, and the other is facing the management resistance
towards formation of a union.
The response of the unions and workers was unanimous: their success in achieving better wages was largely
due to the efforts of the workers’ unions. Particular mention was made of the payment of Variable Dearness
Allowance (VDA), which was rarely extended automatically once it was announced, but had been achieved
through union efforts and workers’ mobilization. In one case, the VDA was not paid for years until a union
was formed and workers were united in demanding better wages. Of the thirty enterprises surveyed only
five have reported that wage levels were less than the minimum wages, and of this five, three are the ones
without unions.
9.7.1.5. Role of government in wage fixation
The role of the Commissionerate of Labour is largely confined to inclusion of certain employments
periodically in the Schedule under the Minimum Wages Act, fixing and revising minimum wages, notifying
every quarter the increase in the VDA based on the changes in the Consumer Price Index (CPI) and
enforcement of the minimum wages through regular inspections. Besides, the Commissionerate of Labour
also provides conciliation officers whenever there was an impasse in the negotiations and help in reaching
a collective agreement. But the general feeling among the workers and unions is that the state machinery is
not effective in enforcing minimum wages and that there has been a bias in favour of management when
dealing with the grievances of workers. In the sample units, the role of Labour Department is seen as largely
confined to notifying the wage agreements reached by unions and managements through collective
bargaining.
9.7.1.6. Role of comparing wages in other enterprises in the area
There is no explicit evidence as to the role played by the comparison with other units in fixing wages.
However, based on the broad responses of the unions and workers in the enterprises surveyed, comparison
with the prevailing wages for similar skill levels in other enterprises in the region appears to influence the
wage agreements in many enterprises. Evidence summarized in Table 9.3 show that in the case of the
industrial group ‘Food and Beverages’ and ‘General Engineering’, there does not seem to be any such
comparative consideration. But in fixing wages in 12 units there appear to be comparative consideration
of wages in other industries in the region. There are almost an equal number of units which report that there
is no comparison with the wages in other industrial units in the region in fixing the wages, which means in
these enterprises the considerations are more local and enterprise-specific than the regional or industrial.
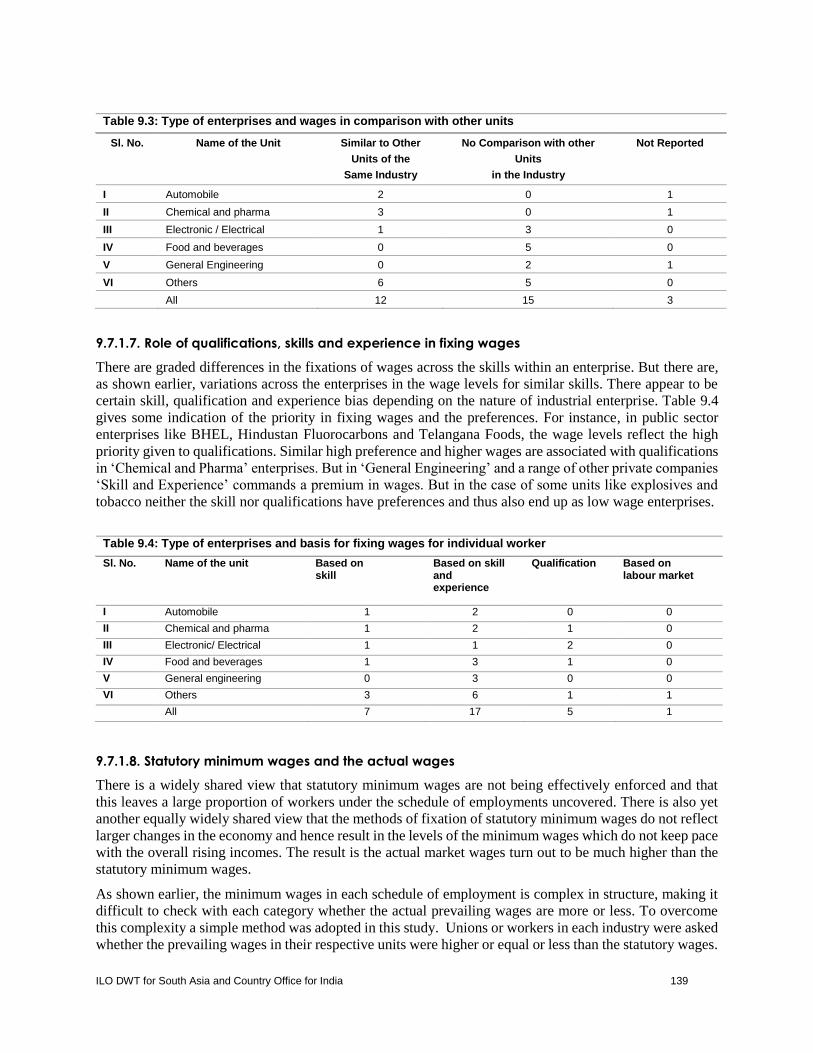
ILO DWT for South Asia and Country Office for India 139
Sl. No. Name of the Unit Similar to Other
Units of the
Same Industry
No Comparison with other
Units
in the Industry
Not Reported
I Automobile 2 0 1
II Chemical and pharma 3 0 1
III Electronic / Electrical 1 3 0
IV Food and beverages 0 5 0
V General Engineering 0 2 1
VI Others 6 5 0
All 12 15 3
9.7.1.7. Role of qualifications, skills and experience in fixing wages
There are graded differences in the fixations of wages across the skills within an enterprise. But there are,
as shown earlier, variations across the enterprises in the wage levels for similar skills. There appear to be
certain skill, qualification and experience bias depending on the nature of industrial enterprise. Table 9.4
gives some indication of the priority in fixing wages and the preferences. For instance, in public sector
enterprises like BHEL, Hindustan Fluorocarbons and Telangana Foods, the wage levels reflect the high
priority given to qualifications. Similar high preference and higher wages are associated with qualifications
in ‘Chemical and Pharma’ enterprises. But in ‘General Engineering’ and a range of other private companies
‘Skill and Experience’ commands a premium in wages. But in the case of some units like explosives and
tobacco neither the skill nor qualifications have preferences and thus also end up as low wage enterprises.
Sl. No. Name of the unit Based on skill
Based on skill and experience
Qualification Based on labour market
I Automobile 1 2 0 0
II Chemical and pharma 1 2 1 0
III Electronic/ Electrical 1 1 2 0
IV Food and beverages 1 3 1 0
V General engineering 0 3 0 0
VI Others 3 6 1 1
All 7 17 5 1
9.7.1.8. Statutory minimum wages and the actual wages
There is a widely shared view that statutory minimum wages are not being effectively enforced and that
this leaves a large proportion of workers under the schedule of employments uncovered. There is also yet
another equally widely shared view that the methods of fixation of statutory minimum wages do not reflect
larger changes in the economy and hence result in the levels of the minimum wages which do not keep pace
with the overall rising incomes. The result is the actual market wages turn out to be much higher than the
statutory minimum wages.
As shown earlier, the minimum wages in each schedule of employment is complex in structure, making it
difficult to check with each category whether the actual prevailing wages are more or less. To overcome
this complexity a simple method was adopted in this study. Unions or workers in each industry were asked
whether the prevailing wages in their respective units were higher or equal or less than the statutory wages.
Table 9.3: Type of enterprises and wages in comparison with other units
Table 9.4: Type of enterprises and basis for fixing wages for individual worker
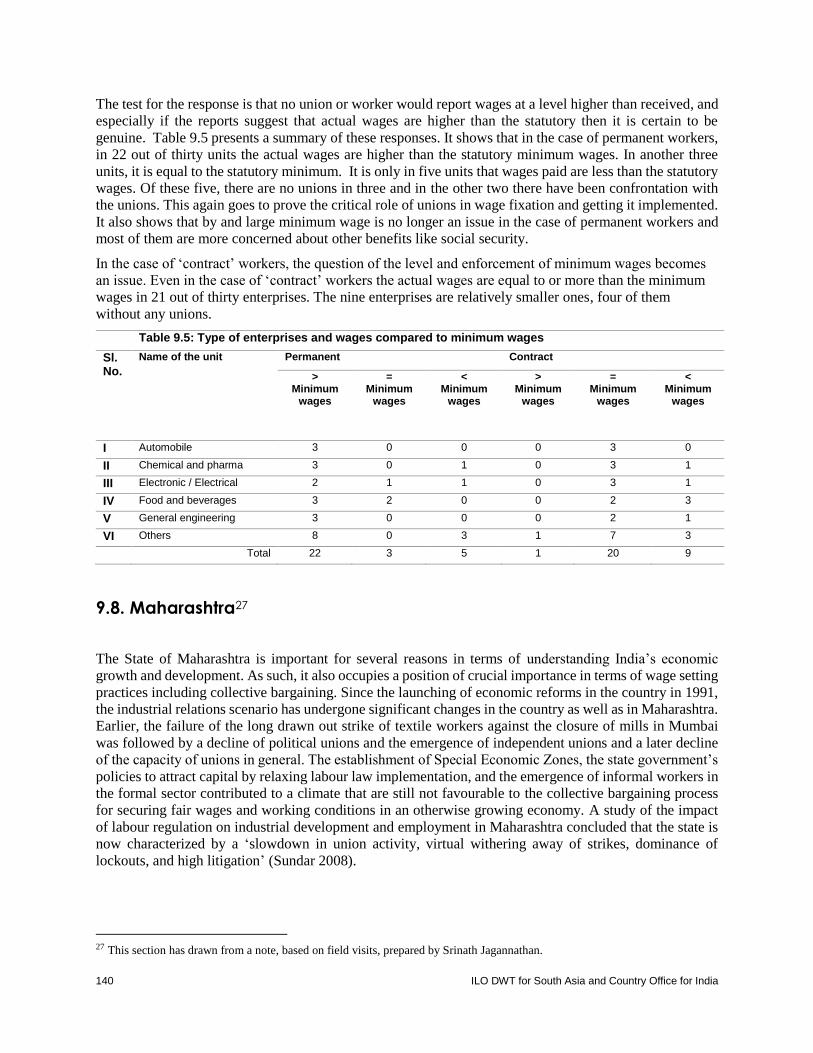
140 ILO DWT for South Asia and Country Office for India
The test for the response is that no union or worker would report wages at a level higher than received, and
especially if the reports suggest that actual wages are higher than the statutory then it is certain to be
genuine. Table 9.5 presents a summary of these responses. It shows that in the case of permanent workers,
in 22 out of thirty units the actual wages are higher than the statutory minimum wages. In another three
units, it is equal to the statutory minimum. It is only in five units that wages paid are less than the statutory
wages. Of these five, there are no unions in three and in the other two there have been confrontation with
the unions. This again goes to prove the critical role of unions in wage fixation and getting it implemented.
It also shows that by and large minimum wage is no longer an issue in the case of permanent workers and
most of them are more concerned about other benefits like social security.
In the case of ‘contract’ workers, the question of the level and enforcement of minimum wages becomes
an issue. Even in the case of ‘contract’ workers the actual wages are equal to or more than the minimum
wages in 21 out of thirty enterprises. The nine enterprises are relatively smaller ones, four of them
without any unions.
Table 9.5: Type of enterprises and wages compared to minimum wages
Sl. No.
Name of the unit Permanent Contract
> Minimum
wages
= Minimum
wages
< Minimum
wages
> Minimum
wages
= Minimum
wages
< Minimum
wages
I Automobile 3 0 0 0 3 0
II Chemical and pharma 3 0 1 0 3 1
III Electronic / Electrical 2 1 1 0 3 1
IV Food and beverages 3 2 0 0 2 3
V General engineering 3 0 0 0 2 1
VI Others 8 0 3 1 7 3
Total 22 3 5 1 20 9
9.8. Maharashtra27
The State of Maharashtra is important for several reasons in terms of understanding India’s economic
growth and development. As such, it also occupies a position of crucial importance in terms of wage setting
practices including collective bargaining. Since the launching of economic reforms in the country in 1991,
the industrial relations scenario has undergone significant changes in the country as well as in Maharashtra.
Earlier, the failure of the long drawn out strike of textile workers against the closure of mills in Mumbai
was followed by a decline of political unions and the emergence of independent unions and a later decline
of the capacity of unions in general. The establishment of Special Economic Zones, the state government’s
policies to attract capital by relaxing labour law implementation, and the emergence of informal workers in
the formal sector contributed to a climate that are still not favourable to the collective bargaining process
for securing fair wages and working conditions in an otherwise growing economy. A study of the impact
of labour regulation on industrial development and employment in Maharashtra concluded that the state is
now characterized by a ‘slowdown in union activity, virtual withering away of strikes, dominance of
lockouts, and high litigation’ (Sundar 2008).
27 This section has drawn from a note, based on field visits, prepared by Srinath Jagannathan.
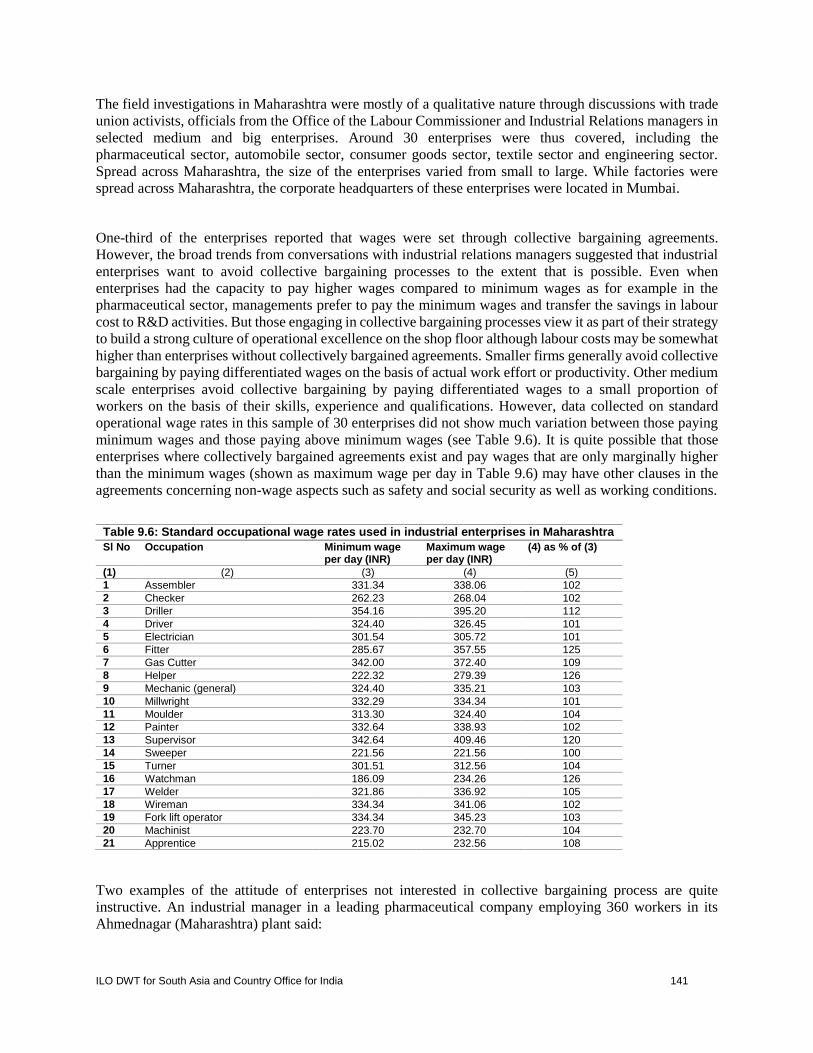
ILO DWT for South Asia and Country Office for India 141
The field investigations in Maharashtra were mostly of a qualitative nature through discussions with trade
union activists, officials from the Office of the Labour Commissioner and Industrial Relations managers in
selected medium and big enterprises. Around 30 enterprises were thus covered, including the
pharmaceutical sector, automobile sector, consumer goods sector, textile sector and engineering sector.
Spread across Maharashtra, the size of the enterprises varied from small to large. While factories were
spread across Maharashtra, the corporate headquarters of these enterprises were located in Mumbai.
One-third of the enterprises reported that wages were set through collective bargaining agreements.
However, the broad trends from conversations with industrial relations managers suggested that industrial
enterprises want to avoid collective bargaining processes to the extent that is possible. Even when
enterprises had the capacity to pay higher wages compared to minimum wages as for example in the
pharmaceutical sector, managements prefer to pay the minimum wages and transfer the savings in labour
cost to R&D activities. But those engaging in collective bargaining processes view it as part of their strategy
to build a strong culture of operational excellence on the shop floor although labour costs may be somewhat
higher than enterprises without collectively bargained agreements. Smaller firms generally avoid collective
bargaining by paying differentiated wages on the basis of actual work effort or productivity. Other medium
scale enterprises avoid collective bargaining by paying differentiated wages to a small proportion of
workers on the basis of their skills, experience and qualifications. However, data collected on standard
operational wage rates in this sample of 30 enterprises did not show much variation between those paying
minimum wages and those paying above minimum wages (see Table 9.6). It is quite possible that those
enterprises where collectively bargained agreements exist and pay wages that are only marginally higher
than the minimum wages (shown as maximum wage per day in Table 9.6) may have other clauses in the
agreements concerning non-wage aspects such as safety and social security as well as working conditions.
Sl No Occupation Minimum wage per day (INR)
Maximum wage per day (INR)
(4) as % of (3)
(1) (2) (3) (4) (5)
1 Assembler 331.34 338.06 102
2 Checker 262.23 268.04 102
3 Driller 354.16 395.20 112
4 Driver 324.40 326.45 101
5 Electrician 301.54 305.72 101
6 Fitter 285.67 357.55 125
7 Gas Cutter 342.00 372.40 109
8 Helper 222.32 279.39 126
9 Mechanic (general) 324.40 335.21 103
10 Millwright 332.29 334.34 101
11 Moulder 313.30 324.40 104
12 Painter 332.64 338.93 102
13 Supervisor 342.64 409.46 120
14 Sweeper 221.56 221.56 100
15 Turner 301.51 312.56 104
16 Watchman 186.09 234.26 126
17 Welder 321.86 336.92 105
18 Wireman 334.34 341.06 102
19 Fork lift operator 334.34 345.23 103
20 Machinist 223.70 232.70 104
21 Apprentice 215.02 232.56 108
Two examples of the attitude of enterprises not interested in collective bargaining process are quite
instructive. An industrial manager in a leading pharmaceutical company employing 360 workers in its
Ahmednagar (Maharashtra) plant said:
Table 9.6: Standard occupational wage rates used in industrial enterprises in Maharashtra

142 ILO DWT for South Asia and Country Office for India
“Our company operates 25 plants in India and abroad, and has plants in locations such as the USA, Hungary
and Brazil. It has 12 plants in different parts of the country such as Jammu and Kashmir, Tamil Nadu,
Gujarat, and Maharashtra. The plant is used for processing raw material for the oncology products produced
by the company. Overall the company employs more than 16,000 employees; nearly 5,000 workers are
contract employees. In the Ahmednagar plant, we have about 315 shop floor workers and 40 supervisory
or managerial staff. About 100 workers in the Ahmednagar plant are contract workers. Our company does
not believe in a philosophy of engaging in collective bargaining negotiations with trade unions. It has
recognized a trade union for collective bargaining in only one of its plants. Consequently, less than one per
cent of the workers in the company are unionized. The company has not recognized a trade union in its
Ahmednagar plant. Thus wages are not determined on the basis of collective bargaining. Largely, they are
determined on the basis of minimum wages as a reference. After 1995, the Indian pharmaceutical industry
underwent a change. We began to focus more on R&D. We need to be in the forefront of the IPR game in
order to succeed. So we save on labour costs and focus on increasing R&D investments.”
The enterprise cited above pays its workers the minimum wage. Though it is a large company earning more
than INR 3,000 crore (INR 30 billion or US$500 million in 2015) as profit every year, it does not pay its
workers anything more than the minimum wage. The workers employed in the shop floor in pharmaceutical
companies such as the one described above are machine operators, maintenance staff for machines,
housekeeping staff and quality control supervisors.
An industrial relations manager in an automobile company explained why the company does not engage in
a collective bargaining philosophy:
“If you look at our Pune plant, we have more than 500 workers on the shop floor and about 60 supervisory
and managerial workers. We require machine operators, drillers, grinders, moulders, assemblers, painters,
electricians, fitters, testers, welders and supervisors on the shop floor. For each of these employment
categories, we pay wages of between INR 9,000 and INR 15,000 every month. We have been able to avoid
unionization of the workforce. So there are no collective bargaining agreements. However, there is a lot of
pressure in the Pune belt. Most factories are unionized. Also, the wage negotiations with trade unions have
led to an increase of more than INR 25,000 per month for workers with experience. We have productivity-
linked bonuses for our workers. We are also able to pay higher salaries for the experienced workers and
those with better qualifications. Thus, the pressure to unionize has not increased in our factory. Our focus
on competition is not on the basis of labour. Our focus on competition is on account of our R&D spending.
Our R&D expenditure every year is almost a fifth of our net profits. On the other hand, our wage bill,
including payments for managers and workers, and bonuses paid to top management is only a sixth of our
profits. Considering that we are making more than INR 3,000 core profits every year, that is a huge
differential.”
These two observations are quite significant in that they are reflective of the larger scenario of a decline in
trade union power if not trade unionism, an ability to disregard collective bargaining process by big
industrial establishments and low economic staying power of workers in the absence of declining decent
employment (employment with social security and right of association) and inadequate growth of
employment even within a regime of high economic growth (i.e. declining employment elasticity).
In contrast to the situation in the above two companies, a human resource manager in another
pharmaceutical company had this to say:

ILO DWT for South Asia and Country Office for India 143
We have recognized three trade unions across different locations in India. Overall, we employ
more than 20,000 workers in the country. In Maharashtra we have two large plants with more
than 500 workers each. One is in Pune and the other is in Patalganga. For both these plants, we
have recognized trade unions. Wages are fixed according to collective bargaining agreements. In
comparison to our competitors who pay only the minimum wage, we typically pay at least three
times more than the minimum wage in both our plants in Maharashtra. Our annual wage bill is at
least five times more than some of our competitors. We also value experience. For employees
who have worked with us more than 10 years, wage increases can be as high as between INR
6,000 and 7,000 per month. If you look at our net profits in recent times, our net profits may be a
third of our competitors. Our net profits are currently more than INR 1,000 crores. Similarly, our
R&D expenditure may be half of our competitors. But our annual wage bill continues to be higher
than our annual profits. We believe our model will be more sustainable. Over a period of time,
the returns on R&D will diminish. Operational excellence will be required at the shop floor. Our
employees are more satisfied than our competitors. We are ranking well in terms of employee
satisfaction surveys and good places to work in the country. So in the future, when the profits will
be driven to a great extent by operational excellence on the shop floor, our performance will be
more sustainable.
Another industrial relations manager in an automobile company, which employs about 800 workers, spoke
about his company’s strategy thus:
While quality control supervisors and skilled technicians earn between INR 25,000 and 40,000
per month, senior managers in the factory earn anywhere between 60,000 and 125,000 per month.
We have been able to manage costs in the factory quite effectively. Collective bargaining
agreement with unions has helped us to improve productivity. In order to comply with regulations,
we recruit most of the workers locally. There will be hardly 10 workers who are from outside the
region. Thus the government is also happy with us. For us as well, it makes sense as the local
youth are skilled enough to understand what is required on the shop floor. In some of our factories,
the labour costs may be higher by 50% than the average monthly labour costs of the industry.
However, our workforce is committed. We have been able to reduce cycle times, waiting times,
boost operational quality, reduce waste and errors.
These two examples provide quite a contrast to the first two. What we find is that wage setting machineries
are related to the strategy being pursued by an enterprise. Enterprises that focus on operational excellence,
worker commitment and cooperation are favourably disposed to collective bargaining. And they do realize
that this strategy brings economic rewards in reducing wastes and related avoidable costs thus stressing the
efficiency dimension in collective bargaining.
Enquiries with industrial relations managers in medium-sized enterprises revealed that given their higher
wage bill (reportedly one-third of the profits as against one-tenth in very large enterprises that we described
above) they follow a strategy of paying higher wages to skilled and experienced workers as a strategy to
avoid collective bargaining. The idea is to weaken the solidarity among the workers. While collective
bargaining agreements more often than not are linked to productivity, some industrial areas like the Pune
area have faced some troubles leading to agitations by workers when the work pressure increases. A
consumer goods producing workers employing around 100 workers (mostly on contract) pay minimum
wages to workers but avoids recruiting experienced workers because ’youngsters have better understanding
144 ILO DWT for South Asia and Country Office for India
of the latest technology on account of the technical training they have received‘. The monthly wages ranged
from INR 8,700 to 9,500.
Workers in small enterprises are at a distinct disadvantage because their companies have to be satisfied
with lower profit share compared to big firms due to a variety of factors including technology and
marketing. They are often engaged in low value products requiring less of skilled workers. The owner of a
small enterprise with 25 workers had this to say:
We manufacture and sell a single product — ephedrine hydrochloride. It is useful for treating low
blood pressure and related ailments. Almost all of our workers are unskilled. All of them are paid
the minimum wage. The annual sale of the company is nearly INR 1 crore (100 lakhs). Currently
we make a profit of about seven to eight lakhs. Our annual labour costs are around INR 20 lakh.
The workers are not part of a union. So there is no collective bargaining. The labour costs are
high. It is difficult to pay minimum wages. It is difficult to maintain the machinery. There are a
couple of workers who also do the work of maintaining the machines. They are paid an additional
INR 4,000 per month. All other workers are paid between INR 4,000 and 8,000 per month.
Minimum wages to workers are paid after they have learnt the work, typically one to three months
after they start working.
Field investigations in manufacturing enterprises reveal the crucial role of skills in determining wages given
the competitive conditions in a globalized market. The companies do realize this because having mere
‘cheap labour’ does not constitute a competitive advantage. They also realize that a greater share of the
enterprise work force have to be in the skilled category given the all-round technological changes. In order
to be competitive, quality consciousness and re-skilling of workers for operational excellence may be
required. This might mean a highly skilled work force which is able to participate more effectively in
strategies of operational excellence. This could prove to be an important route for moving towards a higher
wage level; it will have to be at least 50 per cent above the minimum wages if the enterprises have to achieve
competitive strength through shop floor innovation, quality consciousness, multiple skills and multi-
tasking. Skill forms an important part of the discourse of minimum wages in Maharashtra. As the skill
levels of workers increase, it becomes important to regulate industrial relations contexts effectively.
Minimum wages is an important regulatory intervention of the state. If high skill and high technology
contexts of industrial relations involving young workers are not regulated by the state, it is likely that the
situation might become volatile over time. The expansion of skill needs to be accompanied by an ethos of
bargaining in the workplace. As skill levels of workers increase, it becomes imperative for both
managements and trade unions to engage in rational processes of bargaining.
9.9. West Bengal
West Bengal is another state where a similar field investigation was carried out to find out the nature of
wage fixation and the role played by collective bargaining. West Bengal has been a major state noted for
its industrialization. However, its importance has been on the decline for quite some time. If one takes the
share of value added in manufacturing, the share of West Bengal has been on a steady decline since the
beginning of the 1990s from a little over six per cent of the all India total to around 2.5 per cent by 2013.
This is also corroborated by the fact that the share of manufacturing in the Gross State Domestic Product
(GSDP) has declined from around 13 per cent in 1993-94 to 9.7 per cent in 2014-15. In terms of trade union
activism, the general impression is that trade unions are quite strong in the state with most workers

ILO DWT for South Asia and Country Office for India 145
participating in trade union struggles. This could be largely due to the presence of trade unions in large
industries. Taken as a whole, empirical data for recent times point out that a majority of the workers
reported non-existence of trade unions in their work place and that has been increasing over time. According
to the data in the NSS of 2004-05 and 2009-10, 73 per cent and 78 per cent of rural workers reported that
there was no trade union presence in their work place while 61 and 68 per cent of urban workers reported
no presence of trade unions. As for wages, the real wages of workers covered in the Annual Survey of
Industries (manufacturing) was higher in West Bengal compared to all India from 1990 to 2008; since then
it has converged that perhaps points to the decline of large scale industrial establishments. An
overwhelming proportion of non-agricultural workers are concentrated in the unorganized sector as in the
rest of India where there is very little presence of trade unions.
Discussions with the chambers of commerce as well as owners of a few enterprises confirmed this overall
situation. According to the businessmen there is hardly any trade union activity except in large scale
enterprises. Wages, they said, are not very significant in the dealings between the unions and the
management. According to them, ‘labour indiscipline’ issues dominate the industrial relations. How wages
get determined depends on the nature of the industry in the state and the skill level of the workers. At
present, they said, very few there are very few industries where an industry-level agreement exists for wage
fixation. In the recent past they recalled only two industry-wide agreements through a tripartite process viz.,
tea and jute industries.
With respect to the tea industry a new tripartite agreement signed on 21 March 2015 fixed the daily cash
wages of workers at INR 112.50, INR 122.50 for the next year and INR 132.50 for the third year. Note here
that these wages are less than the recommended National Minimum Wage rate of INR 137 notified by the
Government of India for 2013! It is also known that these wages are less than the minimum wages fixed by
the West Bengal government for any other occupation. It is also interesting that there is no minimum wage
notified by the West Bengal Government for the tea workers. In the jute industry, the situation seemed to
be somewhat better. Tripartite agreement provided for a marginal wage increase (of around INR 26 per
month) who joined till 2010. Under the agreement the average earnings of a jute mill worker varied between
INR 7,600 and INR 11,000.
For other industries, wages are fixed at the enterprise level either through an agreement with trade unions
if they exist or wages are fixed independently of the trade unions. The investigation covered around 30
enterprises across various industries in and around Kolkata. The findings may be summarized as follows.
Wage fixation: Owners or managements of most of the factories covered responded that they fixed wages
on the basis of the market demand conditions for their products and an informal understanding with the
workers. However, for certain industries like printing, there is an industry-wide wage structure arrived at
through an industry-level agreement. For certain other industries like packaging, wages are fixed on a piece-
rate basis. For certain other industries like construction, the proprietor of the construction company employ
a very small number of workers directly. The bulk of the workforce is employed through labour contractors.
Such phenomena are now being seen in the case of unskilled workers even in factories. The management
quotes a price on the basis of the work to be done and not on the basis of how much labour is required.
Is there a reference wage rate?: Two types of responses were received to this question. The first type of
response was that the wage rate is similar across enterprises in the same industry. This could be due to
either implicit or explicit cooperation among owners of enterprises in the locality. The idea is labour
mobility across enterprises is not encouraged or appreciated. The second type of response was that the wage
146 ILO DWT for South Asia and Country Office for India
rate depended entirely on the orders received. This was more so for the tiny enterprises. In an interesting
deviation from the norm, one entrepreneur responded that he paid wages slightly above those prevalent in
the industry/locality but on the condition that the workers should not form a trade union! He said that he is
not the only owner who may be resorting to this practice of wage setting. A majority of the enterprises
covered reported that they had no information about the government-notified minimum wages for their
industry.
Role of trade unions: Except a few which said that the wages were fixed at the industry-level, no enterprise
reported any role for trade unions in wage fixation. In the organized large scale enterprises, the wage rate
per se is not often the main area of contention for trade unions. For example, in a factory of a subsidiary
company of Hindustan lever, the struggle between the management and the union was about the issue of
fixing pay scales with wages broken into basic wage, dearness allowance and house rent allowance.
However, the management insisted on paying only a consolidated salary/wage without any break-up that
they perceived as leading to establishing some kind of ‘entitlements’.
Role of government: Apart from industry-level tripartite agreements, the government does not seem to have
a direct role in wage fixation. However, whenever an industrial dispute arises with respect to wages, the
conciliation officer of the government tries to find a middle path.
Considerations in fixing individual wages: Most of the respondents reported that both skill and experience
play an important part in determining the wage for individual workers. Some also cited ‘conditions in the
labour market’ in determining the wage rate. This is interesting because it refers to overall situation that
makes it possible for enterprises to either depress or enhances wages.
9.10. Concluding observations
Wage policy in India has had laudable and at the same time realistic objectives: to ensure a minimum level
of earnings to workers and sharing of benefits of productivity growth and general industrial prosperity with
the workers, on the one hand; and to evolve a wage structure that is conducive to raising productivity and
efficiency of workers and thus contribute to the growth of industry and economy. Several legislative,
institutional and policy actions have been taken, geared towards achievement of these objectives. Most
measures are, however, applicable to a small fraction of the workers, that is in the organized sector and
leave the vast mass of unorganized workers out of their purview. Minimum Wages Act, even if limited in
application to ‘scheduled’ employments only, was an important measure to protect wages of these workers.
As we have seen, its implementation has been poor.
It can, therefore, be safely concluded that wages of the vast majority of workers in India are outside the
purview of any regulation — either by government or by trade unions through collective bargaining — and
are primarily determined by the conditions in the labour market. Since the labour market, in general, is
characterized by excess supply of labour, wages of the workers in the unregulated segments have tended to
remain at ‘subsistence’ level, without any significant increase, particularly in relation to other indicators of
growth, such as per capita income, over the years. Secondly, wages are systematically regulated and revised
upwards either through official mechanism or collective bargaining in some segments such as the public
sector and the large private corporate sector. And the wage gap between the workers in this segment and
the vast majority of workers in the unregulated segment is very wide, and has been sharply increasing.
ILO DWT for South Asia and Country Office for India 147
10. Conclusion: Summary of findings, some
explanations and recommendations
10.1. The larger picture
This study report focuses on the wage situation in India and hence examines the universe of wage labour in
the Indian economy that is close to half the total workforce. Despite impressive aggregate economic growth
over the last three decades, India continues to be a low wage large economy characterized by dualism in
both enterprise organization and employment. This is often referred to as organized and unorganized sectors
of the economy. The dualism in employment is also referred to in a similar fashion but it denotes lack of
employment and/or social security provided by the employer. Therefore, dualism in employment is not only
due to a high share of the self-employed in the workforce. In terms of the structure of employment there
seems to be an overall stability in terms of share of the population in the labour force an impact on the
earnings. The expected expansion in wage employment with progressive industrialization and urbanization
has been very slow.
The dualism in the wage labour market is manifested in terms of two distinct markets; one for regular work
and the other for casual work. The organized or formal sector of the economy used to be largely composed
of regular workers but this trend is getting weaker with an increasing share of casual workers as well as
regular workers without employment or social security. Nevertheless, wages for casual work may be taken
as a representative wage for the unorganized or informal sector and wages for regular work as the
representative wage for the organized or formal sector.
Within such a dualistic system of labour market, there are at least four segments differentiated by rural and
urban as well as men and women. The urban labour market is largely composed of regular workers with 74
percent of the total wage workers in 2011-12, whereas the rural labour market is largely composed of casual
workers with 81 per cent of the total wage workers. In that sense what happens to the wages of regular
workers has a greater consequence for urban labour. Similar what happens to wages of casual workers has
a greater consequence for rural labour. Among the male wage workers 40 per cent are in regular work while
this share is only 30 per cent for women wage workers.
These core characteristics are reflected at the regional level (state level) with some variation.
10.2. Importance of strengthening the statistical system
An effective and well-functioning statistical system is crucial to the collection, processing and publication
of data on a range of economic and social aspects of a country which, in turn, is crucial to analysis leading
to an informed understanding of the working of an economy and society. In this larger context, data on
wages is highly relevant and important to understand the nature and trends in the living standards of
different sections of workers. As we have seen in Chapter 3, there are several sources of data relating to
wages either through a system of exclusive collection of such data or along with other economic indicators.
The most comprehensive source is the quinquennial rounds of Employment and Unemployment Surveys

148 ILO DWT for South Asia and Country Office for India
of the NSSO. With the decision to conduct these rounds on an annual basis, an important positive
development has taken place that will now enable the availability of data on wages as well on an annual
basis. Given the fact that unit level data pertaining to all NSS rounds are periodically released, this will
enable processing and analysis of wage data to understand the wage issue from as many angles as one would
like to examine.
There are well entrenched systems for collection of wage data for agriculture and related activities as well
as organized manufacturing. There are two parallel systems namely, the Agricultural Wages in India
collected by the Ministry of Agriculture, Government of India and the other called Wage Rates in Rural
India by the Labour Bureau, Ministry of Labour and Employment, Government of India. Since the latter
collects data for a larger number of occupations than the former, there is a strong case for examining the
desirability of continuing the former system. For organized manufacturing, wage data is part of the statistics
reported by enterprises on a range of indicators relating to production. The challenge here is to ensure full
compliance by all covered enterprises and timely release of the data.
The third set of sources relate to administrative statistics collection system under certain labour legislations
such as The Payment of Wages Act, 1936 and The Minimum Wages Act, 1948. The problem of ‘moral
hazard’ is quite pervasive here. The major one is very low rate of compliance by enterprises. It is our opinion
that such a system of collection through administrative measures be replaced by periodical survey of the
covered sector or enterprises focusing on the question of wages, in our case.
10.3. Trends in wages
Real wages of workers in all categories, sectors and groups have experienced relatively high growth over
the past three decades. Growth has been faster in a more recent period, 2004-05 to 2011-12, as compared
to the earlier period, 1993-94 to 2004-05. This period has also been characterized by a high economic
growth. Average annual GDP growth for the entire period (1993-94/2011-12) was around 7.5 percent,
somewhat higher at 8.0 percent in the period 2004-05/2011-12, than in earlier years. One could surmise
that the overall performance of the economy has been reflected on the wage front as well. What is the
mechanism through which growth has got transmitted into higher wages? This mechanism could obviously
be the labour market either through increase in the demand for labour or through institutional interventions
either by the state or increasing bargaining power of the workers. None of these phenomena have been
observed in the Indian labour market over the past two decades. If anything, each one of them has shown a
declining trend. Employment growth has been low and declining: it was around 1.8 percent during 1993-
94/2004-05, but declined to less than half a percent per annum during 2004-05/2011-12. High GDP growth
did not lead to correspondingly high employment growth: employment elasticity declined from over 0.4
during 1983/1993-94 to 0.3 during the next ten year period (1993-94/2004-05) and to as low as 0.06 during
2004-05/2011-12.
It is well known that the direct intervention by the state in the labour market particularly in wage fixation
(except in government public sector) has been virtually absent and earlier wage fixing institutions where
government had a role (like the Wage Boards) have been discontinued. Minimum wage fixation is the only
mechanism where state is involved in wage fixation. It is also well known that the bargaining power of
labour, as reflected in the trade union prowess and activity in the labour market has shown no signs of
improvement: if anything, it seems to have declined.
ILO DWT for South Asia and Country Office for India 149
It should, however, be noted that in some segments of the economy and the labour market, the trends have
been different from that in the macro-economy and the national labour market, and often these segments
have led the trends in wages. Rural wages have risen faster; first, because of the faster growth and rising
demand for labour in the non-farm sector, which has also influenced the trends in wages in agriculture, and,
two, MGNREGA has made a significant impact on rural wages, both by paying a guaranteed wage generally
higher than usual market wage to participating labour and by pressurising labour market in agriculture. This
seems to have significantly influenced wages in agriculture which are observed to have risen faster than in
other sectors. A positive impact of MNREGS on agricultural wages has been amply evidenced in many
studies on the subject (see, e.g. Kannan and Jain 2013, Khera 2013). Manufacturing workers as reflected
by ‘production workers’ category have had the smallest increase in wage due to slow output growth and
still slower employment growth in this sector. Fast growth of construction and increasing use of non-
standard workers in all sectors has led to increase in the demand for ‘footloose’ workers. As a result, wages
of casual workers have generally risen faster.
Expansion in sectors and processes using more manual and unskilled workers does seem to have made
impact on wages of groups that supply such labour, despite an overall excess supply of labour, probably
due to the regionally segmented nature of their labour market. Thus wages of the uneducated and those of
Scheduled Tribe and Scheduled Caste workers have risen faster than those belonging to other educational
and social categories. A faster rise in women’s wages is primarily a result of greater participation of
educated women in the ‘regular’ category and to a certain extent their high participation in MGNREGA
works in rural areas, even when the overall participation rate of women has declined during 2004-05/2011-
12.
Thus, it looks that the increase in real wages of workers in general has not so much been a result of a simple
general up-scaling of wages across all groups of workers, as of a structural change in labour market,
characterized by increase in demand in some sectors and segments of labour market, leading to an either
forced or sympathetic increase in other segments.
10.4. Continuing wage disparities
By and large, wages in traditional low wages sectors and labour market segments and of the relatively low-
paid groups have risen faster; the result, obviously, has been a compression in wage spread and a decline
in wage disparities, in general. Yet, disparities continue to be high. So, the average wage of a women worker
is two-thirds that of a male worker, a casual worker less than two-fifths of a regular worker, SC/ST worker
about three-fourths of the overall average. Average wages in agriculture made 61 percent of the secondary
and 36 percent of the territory sector wages. A worker in the ‘farmer-fisherman etc.’ category earns one
fifth of this in administration executive and managerial category. These variations could be analysed in
terms of both demand and supply side factors and also by regions and states.
10.5. Inter-state variations
The case of inter-state variations are, however, more interesting as well as complicated. There are not only
large variations across the states but their relative levels and increase in wages over the past two decades
do not often reflect the condition of their economy and labour market. Most North Eastern States, other
150 ILO DWT for South Asia and Country Office for India
hilly states and UTs like Chandigarh and Delhi, pay among the highest wages, which may be a reflection
of their cost of living and labour market situation. One can understand Chhattisgarh, Madhya Pradesh, Bihar
and Odisha standing at the bottom in the group of all states but it is not that clear as to why Gujarat is also
in this group — sometimes at the bottom-most or second from bottom rank as in the case of regular and
casual wages for men — where one also finds Punjab and Maharashtra (see Tables 7.2 and 7.3). Considering
only the major states, leaving out the exceptional states/Union Territories, Haryana tops the ranking
followed by Maharashtra for regular wages and Kerala and Jammu and Kashmir for casual workers. Here
again explanations may not be similar for their high ranking. Haryana, the most ‘developed’ state with
highest per capita income could be expected to pay high wages to its workers. Kerala’s high rank is more
for institutional rather than economic reasons but this is no longer the case with Kerala also moving up the
per capita income ladder in recent times.28 However, the Kerala story is not a shining one when it comes to
gender disparity in wages. High cost of living and low landlessness could be explanatory factors for high
wages of casual workers in Jammu and Kashmir.
Among the bottom five states of the four labour markets (regular male and female, casual male and female),
Gujarat finds itself in this group along with Odisha followed by Madhya Pradesh in two. While the case of
Odisha and Madhya Pradesh is understandable from the point of relative underdevelopment, it does not
stand to reason why Gujarat, with a robust and fast growing economy, is in this group.
In terms of growth in real wages among the casual workers, some of the low-wage states have performed
very well. Notably Bihar has recorded the highest growth in real wages (leaving aside some of the NE states
and UT’s). The other well-performing states with a growth rate of four or more percent are Andhra Pradesh
(Undivided), Odisha, Karnataka, Kerala and Tamil Nadu for male workers. The growth rate in the wages
of women casual workers is comparatively low for these states ranging from 3.4 to 4.9. For a number of
states including Gujarat and Punjab, the growth rates have been quite unimpressive at around 2-2.5 per cent.
What is striking in the growth in real wages is the large range: 1.41 per cent (Gujarat) to 6.6 per cent
(Arunachal Pradesh) for men and 0.9 (HP) to 8.7 (Arunachal Pradesh) in regular work and 0.3 to (Mizoram)
to 5.1 (AP-Undivided) for men and (-) 2.7 (Delhi) to 7.7 (J&K) for women in casual work.
It is rather difficult to explain the inter-state difference in wage levels and growth rates in real wages as
described above. There is a clear case for detailed research and analysis to understand the wage structure,
disparity and growth across states by category of workers and labour market segments, in different
economic sectors, occupational and in rural or urban areas. For example, inter-state differences in
agricultural wages are found to be quite well explained by the extent of rural non-farm sector and
agricultural productivity (Venkatesh 2013). A few general propositions, however, can be advanced to
explore reasons for interstate differences in overall wage levels and growth in real wages.
Labour market dynamics in terms of change in demand and supply of labour is obviously put forward as
the first reason for such differences: labour surplus states have low wages and labour deficit states have
high wages, while states with higher employment growth record higher growth in wages and vice-versa.
Bihar and Odisha both have been low-wages states, but, both have recorded a relatively high increase in
wages in recent decades. Reasons are different: in the case of Bihar, large scale migration to Punjab and
Haryana from rural areas has significantly reduced labour supply in some parts, resulting in better
bargaining power and higher wages locally (Rodgers and Rodgers, 2011). Otherwise, there was hardly any
increase in the demand for labour within Bihar, employment growth in Bihar was just 0.2 percent per annum
28 Kerala’s rank in per capita income has been within the first four ranks among the major states during the last five years or so.

ILO DWT for South Asia and Country Office for India 151
during 2005-12. In Odisha, a relatively faster industrial growth, especially in urban areas, has led to a rise
in labour demand and increase in general level of wages. Odisha recorded one of the highest employment
growth, 4.1 percent per annum, second only to Kerala (6.6 percent) in urban areas during 2005-12. High
wage rates and faster growth in Haryana and Tamil Nadu can be attributed to increase in labour demand
due to faster growth of industries.
At the same time, the role of institutional factors, state policy and its effectiveness and state of trade unions,
also seem to play important role in placing a state in higher relative position in respect of wages. For
example, Kerala has maintained a relatively high level and high growth of wages even with high rate of
unemployment and even in periods when demand for labour did not significantly increase, due both to state
commitment and union pressure to fix, revise and pay minimum wages and ensure periodical increase in
wages, in general. In Gujarat on the other hand, wage rates have remained relatively low and seen one of
the lowest increase over the years, in spite of the robust and fast growing economy and very low
unemployment rate (0.5, as against 2 percent for the country, on UPSS criterion in 2011-12) and a relatively
high employment growth during 2005-12. Union pressure in Gujarat, as also in many other states now, is
very low. An indicator of the efforts of the state could be the level of minimum wage fixed and performance
in its implementation. Minimum wages, for example, in agriculture were among the lowest among states
and not revised for long (They were revised in 2015). The state, along with Odisha and Madhya Pradesh,
also has a relatively poor record in implementation of minimum wages.
In recent times this scenario has changed somewhat. Gujarat and Chhattisgarh have emerged as poor
implementers in minimum wages for casual workers followed by Madhya Pradesh in the case of male
workers and a large number of states, including Karnataka, Maharashtra and Gujarat, as poor implementers
for female workers (see Table 8.3). Kerala, followed by Punjab and Haryana, as well as a few North-eastern
states have emerged as the best performers. To reiterate: the situation, in general, seems to have improved
over the years for male workers but not for female workers. Implementation of MGNREGS is found to
have also contributed to an improvement in the implementation of minimum wage, both by paying
guaranteed minimum wage to those participating in them thus leading to pressure for better implementation
of statutorily fixed minimum wage. The performance also appears to have a positive impact on general
levels of wages in rural areas by setting higher benchmark for setting wages (Chand and Srivastava, 2014).
10.6. Wage determination
Given the dualistic nature of the economy, the question of wage determination has been analysed with the
help of empirical data for the two distinct labour markets viz., regular and casual. In the regular labour
market education and the regional factor (representation by the state) emerge as important explanatory
variables. At the least a middle school level of education is critical to make a difference. The social group
identity is seen to be a disadvantage for those belonging to SC and OBC groups. The affirmative policy in
government employment may have moderated the result for some other groups such as those belonging to
the ST especially in urban areas. The regional factor has brought out that despite a high growth performance,
the state of Gujarat does not confer a wage advantage to its regular workers. On the contrary, regular
workers in a majority of states seem to enjoy an advantage over Gujarat. Therefore, the link between
economic growth and wage is not a straightforward one. The states with a greater advantage than Gujarat
are in fact those with relatively high human development (except the north-eastern states) and those with a
lower advantage report a lower human development achievement. The results therefore point to the need to

152 ILO DWT for South Asia and Country Office for India
improving human abilities especially in terms of education and health along with reduction in consumption
poverty.
In the casual labour market, wages for urban men seem to be relatively neither flat with neither education
nor social group identity making a significant difference. Education at the graduate level seems to play a
differentiating role for rural men and urban women. The most important factor seems to be the regional
one. Here again, a majority of the states report a wage advantage viz-a-viz Gujarat. Those reporting a
disadvantage are the ones with a lower human development achievement, except Maharashtra where the
disadvantage is for the rural women.
Wage rate per se is only one factor in the determination of wage income, the other being the quantum of
employment. While regular work denotes payment for all days irrespective of work, casual work is by
definition irregular. By taking a uniform quantum of work, this report finds that average wage income varies
across social groups. This has to do with access to quality of employment. The incidence of regular work
in the organized sector, where the wage advantage is the highest, follows a social hierarchical structure.
However, in the case of Muslims they occupy the bottom position in access to higher education as well as
regular work in the non-agricultural organized sector. So, the differential access to the quality of job also
contributes to the variation in wage income. This differential access has to do with the barriers in access to
education. To reiterate, the evidence given in Table 6.6—quite revealing in the sense that the incidence of
workers with higher education (secondary level and above) is very close to the incidence of workers with
regular jobs in the organized sector for the five broad social groups. This, in turn, is reflected in the share
of wage income in per household national income.
10.7. Wage inequality
Overall wage inequality, which was reported as increased till 2005, now reveals a marginal decline during
2004-05 to 2011-12. The inter-quantile dispersion reveals that the decline is mostly in the bottom half of
the distribution. In 2011-12, 27 per cent of the inequality is explained by location, gender and labour status
and increases by four percentage points when social group identity is factored in. However, inclusion of
education into this set of factors enhances the explanatory power to 46. If age as a proxy for experience is
further included half the inequality is explained by these factors taken together. There is still another
unexplained half.
However, there is another important dimension to inequality in terms of the persistence of very low wages
to the majority. When the entire universe of wage workers are differentiated by the above factors, we get
160 mutually exclusive groups in which the bottom 60 percent of the workers do not get the recommended
national minimum wage of Rs.122 in 2011-12. While a reduction in wage inequality is a positive
development from the point of social justice, the persistence of low wages is an important dimension that
awaits a resolution.
ILO DWT for South Asia and Country Office for India 153
10.8. Linking wage Inequality to income inequality
Several studies have pointed out the increasing trend in income inequality in India, something that has
emerged as a problem of public concern in both developing as well as developed countries. In India income
inequality is measured by consumption expenditure due to paucity of data on income. However, a recent
survey seems to have captured information on household income and the results show a higher level of
inequality than that reported by using consumption expenditure (IHDSurvey, article by Sonalde Desai). In
this report we take a simple route. We have calculated wage income per labour household (both overall and
the four segments in the labour market) and compared it with per household national income as represented
by GDP for two time periods, 1993-94 and 2011-12. The results show a decline in wage income of all the
groups compared to the per household GDP. When the exercise is conducted by taking social groups there
is a hierarchical ranking with three social groups — ST, SC and Muslim in that order — at the bottom
accounting for about a quarter of the per household GDP.
10.9. Wage policy
One of the important institutional features of the Indian labour market is the formulation of the concept of
minimum wages and its implementation. However, there is no single minimum wage and that is
understandable in a vast country with varying levels of economic development with a federalist system of
governance with separation of powers. We have discussed in Chapter 8 the plethora of minimum wages not
only differentiated by industry but also regions, as well as levels of skill. That seems to be stretching the
need for multiple minimum wages basically meant to ensure that low-wage workers are not exploited to a
level where they are forced to accept wages that are not adequate to cover the cost of basic subsistence.
There is therefore a need to rationalize a large number of minimum wages in a given state into one that is
intended to protect the unskilled low paid workers in both casual and regular work categories. At the same
time there is also the need for a national floor level wage below which no wage should be set as minimum.
This is all to ensure that starvation wages are not permitted, which is consistent with the judgment of the
Supreme Court.
Given the varying levels of effectiveness in implementation of minimum wages, as revealed by the
incidence of workers not receiving the recommended national minimum wages, the challenge in the Indian
context is to create conditions for increasing what we have called ‘the reserve price of labour’ i.e. a wage
below which it would be difficult to ensure supply of labour. While administrative measures of the kind
discussed in Chapter 8 may help in improving the effectiveness in implementing the minimum wages we
have placed a greater emphasis on a strategy to raise the reserve price of labour. We would argue that the
relatively greater increase in the wages of casual workers since 2004-05 is related to the policies and
programmes that have further strengthened the fall-back mechanisms of poor labouring households. The
significant state intervention here is that of the MGNREG Act of 2005 that gave rise to the launching of the
NREG scheme of public employment in rural areas with a maximum of 100 days per household who
demand such work. An evaluation of the first five years of this programme found that the average days of
employment did not exceed 50 days but it resulted in a wage income from such employment equivalent to
10 per cent of the official poverty line. That is certainly a factor in raising the reserve price of labour.
However, there were also welfare programme that would have either reduced the insecurities and
vulnerabilities of families thereby indirectly contributing to raising the reserve price.

154 ILO DWT for South Asia and Country Office for India
These are the launching of the national health insurance for selected segments of the unorganized workers
(called Rashtriya Swasth Bhima Yojana or RSBY), extension of the coverage of social pensions along with
some enhancement in the amount paid. Strengthening and extending earlier programmes such as mid-day
meals in primary schools, functioning of supplementary nutrition for pre-school children (through the
ICDS), the National Rural Health Mission activities and the scheme to strengthen school education through
SSA — all these would have either directly or indirectly helped raise the reserve price of labour. For
example, there has been a sharp fall in the incidence of child labour, a greater decline in the entry into the
labour force of those belonging to the age group of 15-19 as a result of increase in enrolment and so on.
The net result has been a faster pace of decline in the absolutely poor as well as the vulnerable. The
challenge is the continuing backlog, which is much greater than other similarly placed Asian countries.
We would therefore strongly advocate the strengthening and expansion of the public employment
programme and reinforce its linkage with asset creation both of a directly productive nature such as land
and water management, afforestation, infrastructure for animal husbandry as well as an indirect nature that
strengthens ability; as in education, skill formation and upgradation, health, housing and social security.
Given the large backlog of poor and vulnerable workers working mostly as casual workers or disguised
casual workers (as in the case of the lower segment of the self-employed), with educational attainments not
more than primary level, with little assets or no assets and poor conditions of life and work, India has no
other alternative but to rely on a developmental approach to improve the human and economic capabilities
of this large mass of labouring poor whose incidence is higher among the socially disadvantaged sections.

ILO DWT for South Asia and Country Office for India 155
10.10. Recommendations
1. Based on the analysis in this report, we give below a set of recommendations for the different stake-
holders with a view to improving the wage situation, especially at the bottom half of the wage
distribution.
2. Recognize the need for a developmental perspective to improve the wage condition of the labouring
poor who are mostly, if not only, employed as casual workers in both rural and urban areas. The idea
here is to enhance the reserve price of labour below which workers will not be compelled, due mainly
to poverty, to work for wages that are below subsistence requirements.
3. Expand and strengthen the existing coverage of the rural public employment guarantee scheme known
as the Mahatma Gandhi National Rural Employment Guarantee Scheme (MGNREGS) under the
National Rural Employment Guarantee Act of 2005 by first enhancing its budgetary outlay to provide
for 100 days of work to those demanding such work. Although the MGNREGS is a demand-
determined one, in actual practice the formulation of projects and aggregation of demand at the local
level are largely determined by anticipated expenditure.
4. The ceiling of 100 days of work per household be removed for the economically backward districts in
the country which are the 200 districts where the MG-NREGS was initially implemented in 2005-06.
Further, the ceiling of 100 days per household in other districts be replaced by 100 days per household
for the district as a whole (rather than each individual household) so that demand for more employment
from poorer locations within a district can be catered to.
5. Design and implementation of MG-NREGS should allow for flexibility in working time especially for
women with a view to enhance their work participation, and thereby an increase in the wage income
of their households.
6. The idea of allowing part-time work for women in the MG-NREGS by dividing a full-day work into
two half-days of four hours work is something that is likely to increase the participation of women
given their domestic responsibilities, generally speaking.
7. Considering the need for a skilled workforce especially in the primary sector of the economy, a well-
designed skill development programme should be built into the MG-NREGS to enhance labour
productivity. Focus should be given to the broad area of land and water management (land-shaping,
bunding, water-harvesting, moisture retention, soil-testing, water-use optimizing techniques of
irrigation, construction of tanks and ponds, check dams and a host of similar activities), scientific
agronomic practices, organic cultivation, afforestation, agro-forestry, infrastructure for animal
husbandry, animal husbandry practices, as well as skill in basic management systems such as
accounting, work measurement, etc. Creating and improving child care facilities should also be
considered as part of the effort to increase women’s work participation and labour productivity.
8. Recognizing the crucial linkage between the health conditions of the labouring poor and their capacity
to earn a decent wage, health programmes should focus on the needs of the labouring poor and their
families. Similarly effective implementation of the social pension amongst the old, aged, poor and
other weaker sections will also help raise the reserve price of labour by providing a cushion to family
expenditure. Therefore, effective implementation of the existing anti-poverty and social welfare
programmes should be seen as part of an overall strategy to reduce the incidence of the prevalence of
the very low wages among a whole spectrum of workers as we have seen in Chapter 6.
9. Since the question of a reserve price of labour is linked to the idea and practice of minimum wages,
our first and foremost recommendation is to give statutory backing to the National Minimum Wage
worked out by the Government of India from time to time. This should be declared as a national floor

156 ILO DWT for South Asia and Country Office for India
level wage below which no minimum wage should be set up either by the central government or by
the state governments.
10. The number of minimum wages should be minimized by restricting it to unskilled and semi-skilled
labour in broad sectors of the economy. Wage setting for others should be left to collective bargaining;
in the absence of the collective bargaining mechanism, state regulation could be thought of to prevent
exploitative wages and conditions of work. In a developmental context, there is a case for linking
wages with productivity wherever feasible.
11. Administrative measures such as provision of adequate staff, facilities, and training should be
strengthened to facilitate minimum wage revisions. Monitoring of implementation has however been
found to be a great challenge with a high rate of default in submitting returns and detecting non-
compliance. A system of periodic surveys to monitor compliance under labour legislation may be
instituted.
12. A time-lag should be agreed upon by all states and the central government on the revision of minimum
wages. Most state governments have not revisited the minimum wages set decades ago. Revising them
for compensating for partial or full inflation has been the chief concern for some time.
13. Revisions of existing minimum wages for inflation should be given wide publicity through
newspapers, television and radio under the Public Service Broadcasting System. For the private sector,
this could be brought under the Corporate Social Responsibility System.
14. Trade unions are perhaps the most effective disseminators with regard to minimum wages. But their
outreach might be limited. Trade unions should therefore strive to disseminate minimum wage-related
information among the workers as wide as possible.
15. Inspections should be carried out by the Labour Department of the concerned government whenever a
complaint is registered through due process. Demand-based inspection should be for a group of
workers and not for individual worker. To ensure effectiveness of such inspections, punishments
should be deterrent enough to discourage from repetition of such defaults.
16. A very high proportion of enterprises are in the small-scale sector. Here, the state intervention should
first be in terms of promotional ones with a view to enhancing their productivity. A number of
committees and commissions have gone into this issue and a large number of recommendations are
available.
17. A well-functioning collective bargaining system is a necessary condition for industrial peace. The
decline in collective bargaining has led to, in many cases, industrial conflicts. Wages and working
conditions have to be a common concern of the society and therefore of the three main stakeholders
i.e. employers, workers and the government.
18. Wages and related labour statistics should get equal, if not more, priority in monitoring of the macro
economy. While the decision to conduct annual rounds on employment and unemployment through
the NSSO is a welcome one, the Government of India should ensure that the time lag between the
survey and release of the report is cut down to just few months if the results are to aid a better
monitoring of the economy as well as policy.
19. With the introduction of the Rural Wages in India scheme, data on wages for 25 occupations will be
available. In the light of this, the Agricultural Wages in India scheme under the Ministry of Agriculture
may be discontinued.
20. Given the regional variation in levels, disparity and growth in wages there is need for a more nuanced
understanding of the working of the labour markets at the state level. This calls for detailed state-
specific as well as comparative studies on wages within the framework of labour and employment is
called for. It calls for collaborative work among government agencies, academia and expert
organizations. The ILO Team in India could be of assistance in this much needed task.
ILO DWT for South Asia and Country Office for India 157
References
Abraham, V (2007), ‘Growth and Inequality of Wages in India: Recent trends and patterns’, Indian Journal
of Labour Economics, 50(4), 927-41.
Acharyya, R, and Marjit, S (2000), ‘Globalisation and Inequality: An Analytical Perspective’, Economic
and Political Weekly, 35(39), 3503-3510.
Ahluwalia, Isher (1992), Productivity and Growth in Indian Manufacturing, New Delhi, Oxford University
Press.
Azam, M. and Prakash, N (2015), ‘A Distributional Analysis of Public–Private Wage Differential in India’,
Labour, 29: 394–414. doi: 10.1111/labr.12068.
Banerjee A, Bertrand M, Datta S, Mullainathan S (2008), ‘Labor Market Discrimination in Delhi: Evidence
From A Field Experiment’, Working Paper, Department of Economics, MIT, USA.
Banerjee, B and JB Knight (1985), ‘Caste Discrimination in the Indian Urban Labour Market’, Journal of
Development Economics, 17: 277-307.
Belser, Patrick and Uma Rani (2010), Extending the Coverage of Minimum Wages in India: Simulations
from Household Data, Conditions of Work and Employment Series No.26, International Labour Office,
Geneva.
Benassi, Chiara (2011), The Implementation of Minimum Wage: Challenges and Creative Solutions,
Working Paper No 12, Global Labour University, Berlin.
Bhaumik SK and Chakrabarty M (2007), Education the Panacea for Economic Deprivation of Muslims?
Evidence from Wage Earners in India, 1987-2005, IZA Working Paper No IZA DP No. 3232.
Borooah, V and S Iyer (2005). ‘Vidya , Veda, and Varna: The Influence of Religion and Caste on Education
in Rural India’, Journal of Development Studies 41(8): 1369-1404.
Bardhan, PK (1970), ‘The Green Revolution and Agricultural Laborers’, Economic and Political Weekly,
Special Number, July 1970.
Banerjee A, Bertrand M, Datta S, Mullainathan S. (2008), Labor Market Discrimination in Delhi: Evidence
From a Field Experiment, Working Paper, Department of Economics, MIT, USA.
Bhalotra (2003), The Impact of Economic Liberalization on Employment and Wages in India, Working
Paper No 12, Policy Integration Department, International Policy Group, ILO, Geneva.
Bhattacharjee, S, V Hnatkovska and Amartya Lahiri (2015), ‘The Evolution of Gender Gaps in India’, India
Policy Forum, National Council for Applied Economics Research, Volume 11 (1): 119-156.
Banerjee, B and JB Knight (1985): ’Caste Discrimination in the Indian Urban Labour Market’, Journal of
Development Economics, 17: 277-307.

158 ILO DWT for South Asia and Country Office for India
Bhaumik SK and Chakrabarty M(2007) ‘Education the Panacea for Economic Deprivation of Muslims?
Evidence from Wage Earners in India’, 1987-2005, IZA Working Paper No. IZA DP No 3232.
Borooah, V and S Iyer (2005). ‘Vidya, Veda, and Varna: The Influence of Religion and Caste over
Education in Rural India’, Journal of Development Studies 41(8): 1369-1404.
Bhandari, AK and A Heshmati, 2006, Wage Inequality and Job Insecurity among Permanent and Contract
Workers in India: Evidence from Organized Manufacturing Industries, Discussion Paper 2097, Institute for
the Study of Labor, Bonn.
Cain, JS, Hasan, R, Magsombol, R and Tandon, A (2010), ‘Accounting for Inequality in India: Evidence
from Household Expenditures’, World Development, 38, pp 282–297.
Chakaravarty and Somanathan E (2008), ‘Discrimination in an Elite Labour Market? Job Placements at II
M-Ahmedabad’, Economic and Political Weekly, November 1, 2008, pp 45-50.
Chakraborty S and Mukherjee S (2014), ‘Gender Wage Gap in the Indian Labour Market: Evidence from
the NSS 66th round data’, The Indian Journal of Labour Economics, 57(2), 259-280.
Chand, R and SK Srivastava, (2014), ‘Changes in the Rural Labour Market and Their Implications for
Agriculture’, Economic and Political Weekly, Vol. 49, No. 10, pp 47-54.
Deaton, Angus and Jean Dreze (2002), ‘Poverty and Inequality in India: A Re-Examination’, Economic &
Political Weekly, 37(36), 3729-48.
Duraisamy, M and Duraisamy P (1995), ‘Implications for Structural Reforms for Public-Private Sector
Wage Differentials in India’, The Indian Journal of Labour Economics, Vol. 38, No. 4.
Duraisamy, M and Duraisamy, P (1999), ‘Women in the Professional and Technical Labour Market in
India: Gender Discrimination in Education, Employment and Earnings’, The Indian Journal of Labour
Economics, 42(4), 599-612.
Duraisamy, M and Duraisamy, P (2014) ‘Occupational Segregation, Wage and Job Discrimination against
Women across Social Groups in India, 1983-2009-10, (mimeo), Madras Institute of Development Studies,
Chennai, December.
Das, MB and Dutta, P (2007), ‘Does Caste Matter for Wages in the Indian Labour Market?’ Working Paper,
Social and Human Development Unit, World Bank, Washington D.C.
Deshpande, A and K Newman (2007), ‘Where the Path Leads: The Role of Caste in Post-University
Employment Expectations’, Economic and Political Weekly Vol. 42(41).
Deshpande, Ashwini, Deepti Goel and Shantanu (2015), ‘Bad Karma or Discrimination? Wage Gaps among
Salaried Workers in India, Discussion Paper No 9485, Institute for the Study of Labor, Bonn.
Divakaran, S (1996), ‘Gender Based Wage and Job Discrimination in Urban India’, Indian Journal of
Labour Economics, Vol 39, No 2, pp 235-256.
Dutta, Puja Vasudeva, (2005), ‘Accounting for Wage Inequality in India’, The Indian Journal of Labour
Economics, 48( 2).

ILO DWT for South Asia and Country Office for India 159
Galbraith, JK; Roy Chowdhury, D and Shrivastava, S (2004), ‘Pay Inequality in the Indian Manufacturing
Sector, 1979-1998’, Working Paper 28, University of Texas Inequality Project.
Ghose, Ajit (2005), ‘High Wage_Low Productivity Organized Manufacturing and the Employment
Challenge in India’, The Indian Journal of Labour Economics, 48(2): 231-42.
Glinskaya, E and Lokshin, M. (2007) ‘Wage Differentials between the Public and Private sectors in India’,
Journal of International Development, 19(3), 333-355.
Goldar, B 2004. ’Trade Liberalisation and Real Wages in Organized Manufacturing Industries in India‘, in
Karnik A. and Burange L.G. (eds.), Economic Policies and the Emerging Scenario: Challenges to
Government and Industry, Himalaya, Mumbai.
Goldar and SC Agarwal 2005, ‘Trade Liberalization and Price-cost Margin in Indian industries’,
Developing Economies, Vol. 43, No. 3, pp 346-73.
Goldar, Biswajit (2013), ‘Wages and Wage Share in India during the Post-reform Period’, The Indian
Journal of Labour Economics, 56(1): 75-94.
Goldar, Biswajit and Amit Sadhukhan (2015), Employment and Wages in Indian Manufacturing: Post
Reform Performance, Working Paper No 185, Employment Policy Department, International Labour
Organization, Geneva.
Goldar, Biswanath and Rashmi Banga (2005), ‘Wage-Productivity Relationship in Organized
Manufacturing in India: A State-wise Analysis’, The Indian Journal of Labour Economics, 48(2): 259-272.
Government of India, (2001), Mid-Term Appraisal of the Nineth Five Year Plan, Planning Commission,
New Delhi.
Government of India, (2015), Economic Survey 2014-15, Ministry of Finance, New Delhi.
Heckman, James J (1979), ‘Sample Selection Bias as a Specification Error’, Econometrica, Vol. 47, No. 1,
January, pp. 153-161.
Himanshu. (2005), ‘Wages in Rural India: Sources, Trends and Comparability’, The Indian Journal of
Labour Economics, 48(2).
Hnatkovska, V, and A Lahiri, 2012, Structural Transformation and the Rural-Urban Divide, Working
Paper, University of British Columbia.
Harrison, A. E. (2002), ‘Has Globalization Eroded Labor’s Share? Some Cross-Country Evidence,’
University of California, Berkeley and National Bureau of Economic Research, Cambridge, MA.
Indian Society of Labour Economics (ISLE) and Institute of Human Development (IHD) (2014), India
Labour and Employment Report, Academic Foundation, New Delhi.
International Labour Organization (2014), Minimum Wage systems: General Survey of the Reports on the
Minimum Wage Convention, 1970 (No.131), and the Minimum Wage Fixing Recommendation, 1970
(No.135), International Labour Office, Geneva.
160 ILO DWT for South Asia and Country Office for India
Jacob, M. (2006), Changes in the Wage Gap of Gender and Caste Groups in India, PhD Dissertation.
College Park, University of Maryland.
Jain, Devaki (2015), ‘Reading the Tea Leaves: What the Indian Women’s Movement can learn from the
Munnar Agitation’ in Scroll.in (Online magazine), October 20.
Jodhka, SS and K Newman (2007), ‘In the Name of Globalization: Meritocracy, Productivity and the
Hidden Language of Caste’, Economic and Political Weekly Vol. 42(41) Review, 96(4): 1225-52.
John, J (1997), ‘Minimum Wages: On Vicious Consumption of Labour Power and Unrealized Potentials’
in Labour File: A Monthly Journal of Labour and Economic Affairs, Special Report: Minimum Wages,
New Delhi.
Jose AV (1974), ‘Trends in Real Wage Rates of Agricultural Labourers’, Economic and Political Weekly
Vol 9, No 13.
Jose, AV (1988), ‘Agricultural Wages in India’, Economic and Political Weekly, Review of Agriculture,
25 June.
Jose AV (2016), ‘Real Wages in Rural India’, in Kannan, KP, et.al. (2016), Labour and Development:
Essays in honour of Professor T.S. Papola, Academic Foundation, New Delhi.
Kannan, KP (1988), Of Rural Proletarian Struggles: Mobilization and Organization of Rural Workers in
South-West India, Oxford University Press, New Delhi.
Kannan, KP (1994), ‘Levelling Up or Levelling Down? Labour Institutions and Economic Development in
India’, Economic and Political Weekly, 29(30):1938-45.
Kannan, KP (2002), ‘The Welfare Fund Model of Social Security for Unorganized Workers: The Kerala
Experience’ in The Indian Journal of Labour Economics, 45(2), April-June.
Kannan, KP (2014), Interrogating Inclusive Growth: Poverty and Inequality in India, Routledge, New
Delhi and Oxon.
Kannan, KP (2016a), ‘Employment Creation Under Conditions of Jobless Growth: The Potential of India’s
Micro and Small Enterprises’ in Kannan, KP, Rajendra P Mamgain and Preet Rustagi (eds.) (2016), Labour
and Development: Essays in Honour of Professor T.S. Papola, Academic Foundation, New Delhi.
Kannan, KP (2016b), At the Bottom of Durable Inequality: The Plight of Dalits and Adivasis in India, Paper
presented at the Workshop on Poverty and Inequality at the Department of Anthropology, London School
of Economics and Political Science, June 30 to July 1, 2016 (Unpublished).
Khanna, S (2012), Gender Wage Discrimination in India: Glass Ceiling or Sticky Floor?, Working Paper
No. 214, Center for Development Economics, Delhi School of Economics.
Kijima, Y (2006), ‘Why Did Wage Inequality Increase? Evidence from Urban India 1983–99’, Journal of
Development Economics, 81(1), 97-117.
Kingdon, GG (1998) ‘Does the Labour Market Explain Lower Female Schooling in India?’, Journal of
Development Studies, 35(1), pp 39–65.

ILO DWT for South Asia and Country Office for India 161
Kingdon, GG and Unni J (1997), How Much Does Education affect Women’s Labour Market Outcomes in
Inda? An Analysis using NSS Household Data, Working Paper No 92, Gujarat Institute of Development
Research, Ahmedabad.
Kreuger, Alan (1999), Measuring Labor’s Share, Cambridge, MA, NBER Working Paper No.7006.
Krishnaji, N (1971), ‘Wages of Agricultural Labourers’, Economic and Political Weekly Vol. 6, No. 39.
Labour Bureau (2015a), Wage Rates in Rural India (2013-14), Ministry of Labour and Employment,
Government of India.
Labour Bureau (2015b), Report on the Working of the Minimum Wages Act, 1948 for the Year 2013,
Ministry of Labour & Employment, Government of India.
Labour Bureau (2015c), Indian Labour Year Book 2011 and 2012, Ministry of Labour & Employment,
Government of India.
Madheswaran, S and Khasnobis, BG (2007), Gender Discrimination in the Labour Market: Evidence from
the NSS, WIDER research project on ‘Gender Wage Gap and its Impact on Poverty: Evidence from India’
Madheswaran S and Paul Attewell (2007): ‘Caste Discrimination in the Indian Urban Labour Market:
Evidence from the National Sample Survey’, Economic and Political Weekly (India),13 October, 4146-53.
Madheswaran, S (1998), ‘Earning Differentials between Public and Private Sector in India’, Indian Journal
of Labour Economics, Vol. 41, No.4.
Madheswaran, S and Shroff, S (2000), ‘Education, Employment and Earnings for Scientific and Technical
Workforce in India: Gender Issues’, The Indian Journal of Labour Economics, Vol. 43, No. 1, pp 121-37.
Mehta, Aashish, Hasan, Rana. (2012), ‘The Effects of Trade and Services Liberalization on Wage
Inequality in India, International Review of Economics and Finance, 23, 75–90.
Mincer, J (1958). ‘Investment in Human Capital and Personal Income Distribution’, Journal of Political
Economy. 66 (4): 281–302.
Mincer, J (1974). Schooling, Experience and Earnings. New York: National Bureau of Economic
Research.
Mukherjee, D and Majumder, R (2011) ‘Occupational Pattern, Wage Rates and Earning Disparities in India:
A Decomposition Analysis’, Indian Economic Review, 131-152.
Nadhanael, GV (2012), Recent Trends in Rural Wages: An Analysis of Inflationary Implications, Reserve
Bank of India Occasional Papers, Vol 33, No 1 & 2, pp 89-112.
Nagaraj, R (1994), ‘Wages and Employment in Manufacturing Industries: Trends, Hypothesis and
Evidence’, Economic and Political Weekly, 29(4), pp.177-86.
Nair, Ramachandran K (2006), The History of Trade Union Movement in Kerala, Kerala Institute of Labour
and Employment and Manak Publications, New Delhi.

162 ILO DWT for South Asia and Country Office for India
National Commission for Enterprises in the Unorganised Sector (NCEUS 2006), Report on Social Security
for Unorganised Workers, Government of India, New Delhi.
National Commission for Enterprises in the Unorganised Sector (NCEUS 2007), Reports on Financing of
Enterprises in the Unorganised Sector and Creation of a National Fund for the Unorganised Sector
(NAFUS), Government of India, New Delhi.
National Commission for Enterprises in the Unorganised Sector (NCEUS 2008a), Report on Conditions of
Work and Promotion of Livelihoods in the Unorganised Sector, Academic Foundation, New Delhi.
National Commission for Enterprises in the Unorganised Sector (NCEUS 2008b), A Special Programme
for Marginal and Small Farmers, Government of India, New Delhi.
National Commission for Enterprises in the Unorganised Sector (NCEUS 2009), The Challenge of
Employment in India: An Informal Economy Perspective, Academic Foundation, New Delhi.
National Sample Survey Organization, Employment and Unemployment Situation in India, 68th Round
(June 2011 to July 2012), Report No.554, Ministry of Statistics and Programme Implementation,
Government of India, New Delhi.
Onaran, Ozlem (2007), ‘Wage Share, Globalization and Crisis: The Case of Manufacturing Industry in
Korea’, Mexico and Turkey, Work Paper No.132, Political Economy Research Institute, University of
Massachusetts, Amherst.
Pai, Suchismita (2013), ‘Maharashtra Domestic Workers Battle for Their Rights’, The Hindu, June 18.
Papola and Sahu, (2012), Growth and Structure of Employment in India: A Long-Term and Post-Reform
Performance and the Emerging Challenge, New Delhi, Institute for Studies in Industrial Development.
Ramaswamy, E A (2008), ‘Wage Inequality in Indian Manufacturing: Is it Trade, Technology or Labor
Regulation’, Working Paper No. 21, Indira Gandhi Institute for Development Research, Mumbai.
Reddy, Narasimha D (2015), Wage Fixation Practices in Andhra Pradesh, Background Paper prepared for
the India Wage Report (Unpublished).
Rodgers, G and J Rodgers, (2011), ‘Inclusive Development? Migration, Governance and Social Change in
Rural Bihar’, Economic & Political Weekly, Vol. 46, No. 23, pp 43-50
Rodgers, G and Vidya Subramanian (2016), Patterns of Inequality in the Indian Labour Market, 1983-
2012, New Delhi, Academic Foundation and Institute for Human Development.
Rodriguez, Francisco and Arjun Jayadev (2010), The Declining Labor Share of Income, Human
Development Research Paper 2010/36, United Nations Development Programme.
Rodrik, Dani (1998), Premature Deindustrialization, Economics Working Papers No.107, Institute of
Advanced Studies, Princeton University, New Jersy.
Roy, Satyaki (2012), Skill Premium: What Caused the Mismatch?, MRPA Paper No./18010.
Royal Commission on Labour (1929), Report of the Royal Commission on Labour, New Delhi, Government
of India.

ILO DWT for South Asia and Country Office for India 163
Rustagi, Preet, 2005, ‘Understanding Gender Inequalities in Wages and Incomes in India’, The Indian
Journal of Labour Economics, Vol 48, No 2, Apr - June.
Sadhukhan (2012), ‘Trade, Technology, and Institution: How Do They Affect Wage Inequality? Evidence
from Indian Manufacturing’, (mimeo).
Saget, Catherine (2001), Is the Minimum Wage an Effective Tool to Promote Decent Work and Reduce
Poverty? The Experience of Selected Developing Countries, Employment Paper 13, Employment Strategy
Department, International Labour Office, Geneva.
Sarkar, Sandip and Mehta, Balwant Singh. (2010) Income Inequality in India: Pre- and Post-Reform
Periods. Economic and Political Weekly. 45(37), 45-55.
Sharma, HR 2001. ‘Employment and Wage Earnings of Agricultural Labourers: A State-wise Analysis’,
The Indian Journal of Labour Economics, Vol. 44, No. 1.
Sharma, Alakh and SK Sasikumar, (1996), ‘Structural Adjustment, Poverty, Employment and Safety Nets’,
The Indian Journal of Labour Economics, Vol.39, No.3.
Singhari S & Madheswaran S (2016). ‘Social Exclusion and Caste Discrimination in Public and Private
Sectors in India: A Decomposition Analysis’. Working Paper No 361, Institute for Social and Economic
Change, Bangalore.
Sood, A, Paaritosh Nath and Sangeetha Ghosh (2014), ‘Deregulating Capital, Regulating Labour:
Dynamics in the Manufacturing Sector in India’, Economic and Political Weekly, Vol XLIX, Nos 26 and
27, pp 58-68.
Srivastava, R and Singh, R (2005), ‘Economic Reforms and Agricultural wages in India’, The Indian
Journal of Labour Economics, 48(2), 407-424.
Srivastava, R and Singh, R (2006), ‘Rural Wages During the 1990s: A Re-estimation’, Economic and
Political Weekly, Vol, 4053-4062
Srivastava, R, (2013), A Social Protection Floor for India, New Delhi, ILO DWT for South Asia and ILO
Country Office for India.
Srivastava, Ravi and Ajaya Kumar Naik (2016), ‘Growth and Informality in the Indian Economy’ in
Kannan, K.P., et.al. (2016), Labour and Development in Honour of Professor T.S. Papola, New Delhi,
Academic Foundation.
Srivastava, Archana and Somesh Mathur (2011), ‘Rising Wage Inequality in India: A Translog Cost
Function Analysis’, Journal of Business and Policy Research, Volume 6, Number1, July 2011, World
Business Institute, Australia
Sundar, Shyam KR (2008), Impact of Labour Regulations on Industrial Development and Employment: A
Study of Maharashtra, Bookwell, New Delhi.
Sundaram, K (2001), ‘Employment and Poverty in the 1990s: Further Results from NSSO 55th Round
Employment and Unemployment Survey, 1999–2000’, Economic and Political Weekly, 11 August, Vol 36,
No 32.

164 ILO DWT for South Asia and Country Office for India
Stewart, F (2001). ‘Horizontal Inequalities as a Source of Conflict. In: F. Hampson, and D. Malone (Eds.)
From Reaction to Prevention. Lynne Rienner Publishers, London.
Thorat, S and P Attewell (2007), ‘The Legacy of Social Exclusion: A Correspondence Study of Job
Discrimination in India’, Economic and Political Weekly Vol. 42(41).
Unni, Jeemol and Uma Rani (2003), “Changing Structure of Workforce in Unorganised Manufacturing’,
The Indian Journal of Labour Economics, 46 (4), 983-997.
Unni, Jeemol, 2005, ‘Wages and Income in Formal and Informal Sectors in India’, The Indian Journal of
Labour Economics, Vol. 48 (2), pp.311-317.
Varshney, A (2001), Ethnic Conflict and Civic Society: India and Beyond, Johns Hopkins University Press,
Baltimore, Maryland.
Venkatesh, P (2013), ‘Recent Trends in Rural Employment and Wages in India: Has the Growth Benefitted
the Agricultural Labours?’,Agricultural Economics Research Review, Vol. 26, pp 13-20.
Virmani and Hashim (2009), Factor Employment, Sources and Sustainability of Output Growth: Analysis
of Indian Manufacturing, Working Paper No.3, Department of Economic Affairs, Ministry of Finance,
Government of India.
World Bank (1989), India: Poverty Employment and Social Services: A World Bank Country Study,
Washington DC, World Bank.
ILO DWT for South Asia and Country Office for India 165
Towards an India Wage Report
This report, perhaps the first of its kind for India, brings together the various aspects of the wage system
in India. Despite impressive economic growth over the last three decades, India continues to be a low
wage large economy characterized by the domination of self-employment activities of a little more
than half the workforce. That means the focus on the wage situation is confined to the universe of wage
labour, which is only around half the work force in 2012.
There has been an increasing trend in wages since the early 1990s but there is no evidence to show that
this has been due to the increased demand in the labour market or a higher bargaining power of
workers. Wage disparities across gender, education, region, social group identity and type of
employment have been a persisting feature. When these are combined what is found is a ‘long tail of
wage inequality’ with very low wages, especially for women in rural areas. Given this persistence of poor
and vulnerable workers working mostly as casual workers with educational attainments at not more
than primary level, with little or no assets and poor conditions of life and work, India has no other
alternative but to rely on a developmental approach to improve the human and economic capabilities
of this large mass of labouring poor.
ISSN: 2227-4391; 2227-4405 (web pdf)
ILO DWT for South Asia and Country Office for India
India Habitat Centre, Core 4B, 3rd Floor
Lodhi road, New Delhi-110 003
India
Tel.: +91 11 4750 9200, Fax: +91 11 2460 2111
Email: [email protected]
www.ilo.org/india