wage determinants and wage inequalities - case of
TRANSCRIPT

Teknik Dergi, 2019 8961-8985, Paper 530
Wage Determinants and Wage Inequalities - Case of Construction Engineers in Turkey* Serkan AYDINLI1
Mustafa ORAL2 Emel ORAL3
ABSTRACT
Unfair wage policies that fail to meet the needs of employees have been cited to be one of the most important reasons for high turnover rates of construction professionals. Despite, little research has been conducted related to the determinants of a fair wage, and industry-wide wage policies. Hence, a questionnaire survey was held in 2016 with 305 company/human resource managers and 410 construction engineers working in the Turkish construction industry, which is one of the largest in the world, to determine wage policies of the companies. Findings of the questionnaire survey are discussed within the frame of the literature findings related to the prerequisites of a fair wage. Wages of respondents are compared to the legal minimum wage requirements. Effects of some compensable variables like the level of education, experience, seniority in the company, foreign language skills, computer skills, the complexity of the project, the location of the project and the size of the company on the wage rates are examined by using Multinomial Logistic Regression Analysis and Self Organizing Maps. Lorenz Curves and Gini Coefficients are used to represent and analyze the wage distribution of the respondents. Multi-national comparisons are presented where possible.
The findings of the current research present a benchmark for further research related to the prevailing wages, wage inequalities, and the wage policies, not only for Turkish construction industry but also for the construction industry worldwide.
Keywords: Wage determinants, wage inequalities, construction engineer, construction industry, gini coefficient, lorenz curve, multinomial regression analysis, self-organizing maps.
Note:
- This paper has been received on January 15, 2018 and accepted for publication by the Editorial Board on October 09, 2018.
- Discussions on this paper will be accepted by May 31, 2019. https://dx.doi.org/10.18400/tekderg.378955 1 Cukurova University, Department of Civil Engineering, Adana, Turkey - [email protected] -
https://orcid.org/0000-0002-2897-4144 2 Cukurova University, Department of Computer Engineering, Adana, Turkey - [email protected] -
https://orcid.org/0000-0001-9127-8857 3 Cukurova University, Department of Civil Engineering, Adana, Turkey - [email protected] -
https://orcid.org/0000-0002-7477-7993

Wage Determinants and Wage Inequalities - Case of Construction Engineers in Turkey
8962
1. INTRODUCTION
Turkish construction industry is one of the largest in the world. More than 185 thousand construction companies employ around 1.8 million employees. In addition to domestic companies, there are 4418 foreign construction companies actively working in Turkey [1]. While about 67-77% of the construction investments is on building projects, around 23-33% is on infrastructure [2-3]. Although small to medium-sized companies dominate the domestic market, 40 Turkish construction companies are in the ‘Top 250 International Contractors' list of ENR in 2016 which puts Turkey into second place after China in the international markets. In 2016, the growth rate of Turkish construction industry was about 7.4%. Meanwhile, the unemployment rate for construction engineers† was 11% [4]. The most important reason of such a high unemployment rate is the excessive number of graduates that join to the workforce each year (around ten thousand graduates annually which are nearly 10% of the total number of construction engineers) [5]. Supply/demand ratio works in the disadvantage of the engineers and as both the 'Demand and Supply Theory' by Marshall [6] and the 'Bargaining Theory of Wages' by Davidson [7] stress, it is inevitable that employers play a stronger role and wages, and job opportunities for the engineers tend to be low. Thus, it is vital for the job-seekers to be aware of the determinants that influence the employment opportunities and the wage policies in the industry. However, this is practically not easy to follow, as the employment is mainly project-based and, unionization, labor union agreements, and collective agreements are limited in the construction industry.
Wage policies in the industry should not be the concern of the job-seekers only; they should also be one of the primary concerns of the employers due to their effects on the employees' motivation, morale, group cooperation, efficiency, and employee turnover rates [8-29]. As 'Fair Wage Theory' by Akerlof [30] and Akerlof and Yellen [31], state that fairer an employee considers his/her wage, the harder he/she will work or vice versa.
Above discussion raises two critical issues to be resolved. First one is the definition and the constitutes of a fair wage for construction engineers, and the second one is the current situation in the industry regarding the wages of professionals, which engineers should consider while working out their wage expectations. Thus, the aim of the current research has been to; determine the constituents of a ‘fair' wage for construction engineers, compare these with industry-wide applications and to present models that can be used to analyze the effect of different variables concerning level of wages. It is expected that findings will present guidance to; the academicians in determining course contents, company managers in establishing wage policies, construction engineers in gaining awareness related to the prevailing wages and the government bodies in both defining and implementing minimum wage regulations.
2. RESEARCH BACKGROUND AND LITERATURE REVIEW
International Labour Organization (ILO) describes wage as "payment which is made by the employers to the laborer for his services hired on the conditions of pay per hour, per day, per week, per fortnight or month" [32]. The ILO encourages its member states to implement
NOTE: In this context, Construction engineers are engineers/architects/technicians who undertake various responsibilities
related with planning, coordination, organization, and control of work on construction projects.

Serkan AYDINLI, Mustafa ORAL, Emel ORAL
8963
minimum wage regulations to eliminate unduly low pay, reduce wage inequality and promote decent work. The ILO defines minimum wage as "the minimum amount of remuneration that an employer is required to pay wage earners for the work performed during a given period, which cannot be reduced by collective agreement or an individual contract" [33]. Minimum wage regulations change from country to country depending on the needs and choices. While some countries implement the same minimum wage rate to all of the employees, some enforce different standards according to the age or the occupation of the employee or according to the sector or the geographical region of work. [33].
Turkish minimum wage system is regulated under a constitutional guarantee and is fed from international contracts and the ILO’s recommendations [34]. Minimum wage is set at the latest in every two years by the Minimum Wage Fixing Board by considering social and economic conditions of the country [35]. Inflation differentials are also reflected in the minimum wages every six months. Also, the minimum wages for engineers are regulated by a protocol signed between Union of Chambers of Turkish Engineers and Architects (UCTEA) and Presidency of Social Security Institution each year. The protocol states that wages of civil engineers/architects and city planners cannot be based on national minimum wages due to the nature of the responsibilities undertaken. Minimum gross wages that will be effective for the following year are publicized at the end of each year. Accordingly, in 2016, while the base minimum wage for all of the employees (disposable take-home pay, i.e., what remains after taxes, pensions, social security contributions, or other deductions) was set to be around 1.250TL/month*‡ the minimum wage for construction engineers (disposable take-home pay) was set to be around 2.500 TL/month*§ [36].
In addition to its recommendations with regard the implementation of minimum wages, the ILO emphasizes that for a wage system to be fair and effective, it should be transparent, it should reward employees according to the difficulty and quality of their work and it should ensure that the motivated workers can earn substantially more than the minimum wage [33].
The ILO’s recommendations on wages, in general, are in parallel to the views of modern behavioral scientists like Simon [37], Robert Dubin [38] — who support the 'Behavioral Theory of Wages'. Behavioral Theory of Wages claims that wages are determined by factors like the size and the prestige of the company, the strength of the union, the employer's concern to maintain the workers, the social norms, the traditions, the customers prevalent in the organization, the psychological pressures on the management, the prestige attached to specific jobs in terms of social status and the wages paid for similar positions in other firms, etc. [39]. These views are also supported by construction management related literature stating that wages of construction professionals should;
(1) reflect the value of compensable variables like;
- level of education [40-46],
- computer and foreign language skills [47-50],
- experience and seniority [40],[41],[46],[51],[52] and,
‡ 417 USD/month (1 USD = 3.00 TL as an average in 2016) , § 833 USD/month

Wage Determinants and Wage Inequalities - Case of Construction Engineers in Turkey
8964
(2) reward individual and collective performance [40],[41],[46] where; completion of work in estimated time/ cost/quality; low rate of rework, compliance with occupational health and safety requirements, customer satisfaction and, skills related with; not only decision making, but also problem solving, planning, coordination, communication with and motivating subordinates, personality characteristics like honesty, punctuality, attitude and fairness towards workers are the critical performance determinants of construction engineers. [53-55].
(3) reflect inflation rate [56-57],
(4) avoid undue disparities in wages within the company or concerning the prevailing wages in the industry [32],[40],[56],[57] and
(5) reflect the complexity of the project, project budget, project location, i.e., city, country, the distance between the construction site and the town center [58].
Above listed literature is overviewed below.
2.1. Level of Education and Foreign Language Knowledge
Effect of level of education on wages is one of the most studied topics related to the wage determinants in different industries (Table 1). Linear regression analysis is the mostly preferred statistical analysis method. Findings generally show a positive correlation between education levels and wages (see Table 1).
Table 1 - Literature review on the effect of level of education on wage rates
Author Nation Sector Method Result
Bhattarai & Wisnievski [40] England Private
Linear Regression Adj. R2= 0,922
Wages of employees getting training certificates are 4.3% higher on average than others.
Boudarbat et al. [41] Canada Private Linear Regression There is a positive relationship between education level and wage.
Nestić [42] Croatia Private Linear and Quantile Regression
There is a positive relationship between education level and wage.
Liu & Zhang [43] China Private Linear Regression Adj. R2= 0,506
There is a positive relationship between education level and wage.
Addabbo & Favaro [44] Italy Private Quantile Regression Adj. R2= 0,33
The level of education leads to the closure of the wage gap between men and women.
Yang & Mayston [45] China Private Probit Regression Employees with higher levels of education are more likely to find a better job.
Iriondo & Perez-Amaral [59] Europe Private Linear Regression There is no relationship between
education level and wage.
Morikawa [46] Japan Public and Private
Quantile Regression Adj. R2= 0,44
There is a positive relationship between education level and wage.

Serkan AYDINLI, Mustafa ORAL, Emel ORAL
8965
Among the researchers presented in Table 1, Yang & Mayston [45] are the only ones to investigate the effect of foreign language knowledge on wages. By using Probit Regression Analysis, they determined that as the level of English knowledge increases, the wage increases by an average of 4.3%.
2.2. Age and Experience
Literature related to the effects of age and experience on wage levels show that while wages mostly increase by age and experience, they tend to decrease after a certain age (which is around 45 to 55). Table 2 shows the findings of previous studies.
Table 2 - Literature review on the effect of age and experience on wage rates
Author Nation Sector Method Result
Bhattarai & Wisnievski [40] England Private
Linear Regression Adj. R2= 0,922
The age at which the wage reaches the maximum level is 45.8.
Boudarbat et al. [41] Canada Private Linear Regression Employees with the highest wage are aged 46-55.
Nestić [42] Croatia Private Linear and Quantile Regression
Experience (up to 30 years) causes wages to increase.
Liu ve Zhang [43] China Private Linear Regression Adj. R2= 0,506
The wage earned increases as the working age increases.
Morikawa [46] Japan Public and Private
Quantile Regression Adj. R2= 0,44
Employees with the highest wage are aged 50-55.
2.3. Individual Performance
Researchers like Kagioglou et al. [53], Dainty et al. [54], Cox et al. [60], Cheng & Li [55], Samuel et al. [61] and Nassar & Abourizk [62] studied evaluation criteria for professional performance of construction professionals. Kagioglou et al. [53] and Cox et al. [60] determined the most significant measures as the customer satisfaction, completion of work on estimated time and cost, work accidents involved and rework. On the other hand, Dainty et al. [54] stated the personality characteristics like honesty, punctuality, attitude, motivating oneself, ability to work with different team members and fairness towards subordinates to be more significant than other factors as performance determinants of professionals. Analytical Hierarchy Process (AHP) has been the most commonly used method for determining the performance criteria [55][62].
2.4. Prevailing Wages
Babecký et al. [56] and Galuscak et al. [57] both studied the effect of prevailing wages on determining the wages of professionals by using Probit Regression analysis. Babecký et al. [56] concluded that prevailing wages in Czech construction industry was significant in determining the wages. Galuscak et al. [57] additionally stressed the fact that small-sized

Wage Determinants and Wage Inequalities - Case of Construction Engineers in Turkey
8966
European construction companies, rather than medium-large ones, considered prevailing wages while determining the wage levels of their employees.
2.5. City of Work and Size of the Company
Idson and Feaster [63] and Nestić [42] reached to similar results showing that employees working in large companies earn more than employees working in small companies. Wage differences reach up to 39%. In the meantime, Morikawa [46] determined that wages change around 40% between large cities and small towns.
3. RESEARCH MATERIAL AND METHODOLOGY
A questionnaire survey was undertaken in 2016, to determine industry-wide applications related to wage determinants of construction engineers and wage policies of construction companies in Turkey. Questionnaires were distributed to both the construction engineers and, the company/human resources managers who are the part of wage determination process of the companies. 410 construction engineers and 305 company/human resources managers participated in the survey which provided a statistically significant sample size within 95% confidence level [64].
The first part of the questionnaire consisted of questions related to the demographic characteristics of the respondents, attributes of their work and monthly wages earned (disposable take-home pay). Compensable variables and performance determinants were listed according to the literature findings discussed above and were questioned in the second part of the questionnaire. A 9 Point Likert Scale (1-strongly disagree to 9-strongly agree) was used for scaling questions.
Descriptive statistical analysis, Lorenz curve [65] and Gini coefficients, Multinomial Logistic Regression analysis and Self Organizing Maps (SOM) were used to derive results from the questionnaire findings. These methods were used complementarily to each other in discussing the results; Gini coefficients and Regression analysis provided statistical information for the discussion of the results, and SOM maps enabled to track and to analyze the results visually.
4. RESULTS AND DISCUSSION
4.1. Demographics of the Respondents
Table 3 shows age distribution of the respondents. It is observed that while most of the company managers are over 30 years old, construction engineers are at younger ages on the average. When the frequency of the construction engineers are compared with the frequency of the members of the Chamber of Civil Engineers (based on the list provided for the current research by the Chamber of Civil Engineers) it is observed that the sample represents active working population of engineers.

Serkan AYDINLI, Mustafa ORAL, Emel ORAL
8967
Table 3 - Age Distribution of the Respondents
Age Range Frequency (%) Company Managers
Frequency (%) Construction
Engineers
Frequency (%) Construction Engineers
(Members of Chamber of Civil Engineers in 2017)
20-25 4.7 19.7 21.0 26-30 24.0 32.0 19.2 31-40 39.0 28.6 26.9 41-50 20.7 14.0 14.0 51-60 9.3 5.7 11.7 > 60 2.3 - 7.2
Table 4. shows the business areas of the respondents. Distribution of the respondents is in good agreement with the statistical data on Turkish construction industry showing that 67-77% of construction investments are on building projects and 23-33% are on infrastructure projects [2-3].
Table 4 - Business Areas of the Respondents
Business Area % of Respondents Company/Human
Resources Managers Construction Engineers
Building Projects 67.21 63.7 Infrastructure Projects 35.40 14.1 Prefabricated Production 17.04 5.6 Building Inspection 7.86 16.6
4.2. Wages and Wage Distribution Inequalities
Table 5 shows the answers of construction engineers related to their monthly wages in 2016. Results show that 0,73 % of the respondents do not even earn the national minimum wage of 1.250 TL/month. In total 24.87 % of the respondents earn less than 2.500 TL/ month, i.e., the disposable take-home pay value of the legal minimum monthly wage for construction engineers in 2016.
Figure 1 shows the Lorenz curve drawn according to the construction engineers' responses related to their monthly wages. The graph plots the percentiles of the cumulative population of the construction engineers on the x-axis, and their cumulative income (cumulative monthly wages) on the y-axis. The straight diagonal line represents perfect equality in income distribution (Gini coefficient equals to 0); the curve which lies under it (Lorenz curve) shows the actual distribution of wages according to the engineers’ answers.

Wage Determinants and Wage Inequalities - Case of Construction Engineers in Turkey
8968
Table 5 - Monthly Wages of Construction Engineers in Turkey
Wage (TL/month) Number of Respondents % of respondents Cumulative % of respondents
<1.250 3 0,73 0,73 1.250-2.500 99 24,14 24,87 2.501-4.000 210 51,22 76,09 4.001-6.000 49 11,95 88,04 6.001-8.000 36 8,78 96,82 8.001-10.000 8 1,95 98,77 >10.000 5 1,23 100 Total 410 100 100
Figure 1 - Lorenz Curve for Wages of Construction Engineers in Turkey
Gini coefficient, which is a measurement of inequality, is expressed as the ratio of the area that lies between the line of perfect equality and the Lorenz curve to the total area under the line of perfect equality. Gini coefficient can range from 0 (perfect equality) to 1 (absolute inequality). Some Gini coefficients related to the wages of construction engineers were calculated by utilizing the following formula [66]. The Gini coefficient for the whole sample was determined to be 0,2526. Gini coefficients for different categories of the compensable variables that affect the wages were also calculated, and these are discussed in the following sections.

Serkan AYDINLI, Mustafa ORAL, Emel ORAL
8969
𝐺 = 1 − 𝑋 − 𝑋 𝑌 + 𝑌
where;
G: Gini coefficient
Xi: Cumulative % of population corresponding to the ith individual
Yi: Cumulative % of population income corresponding to the ith individual
N: number of individuals
Statistics on income inequalities provided by international institutions like UN, World Bank, OECD or by governments are generally country or region based, and statistics on income inequalities amongst professionals is limited. Only one study related to the income distribution among construction professionals has been found during the literature review. Gini coefficient for Pakistani professionals was calculated to be 0,280 in that study [67] (see Table 6). Additionally, Gini coefficient for civil engineers working in the USA was roughly calculated to be 0,334 during the current research by using the data published by OECD [68] on civil engineers' incomes in the USA in 2016 (Table 6).
According to Turkish Statistical Institution figures [4], Gini coefficient for the working-age population between 18-65 in 2016 in Turkey is 0,40, and according to UNDP [69] figures it is around 0,40 for USA and 0,30 for Pakistan (Table 6). When Gini values of three countries are compared, it is observed that the income inequality for the construction professionals is the least in Turkey, income inequality for professionals in Pakistan is very close to their national average and, income inequality is not related to wealth.
Table 6 - Gini Coefficients for Working-Age Population and Construction Professionals in Turkey, USA and Pakistan
Turkey USA Pakistan Gini Coefficient for Working Age Population 0,40 0,40 0,30
Gini Coefficient for Construction Industry Professionals 0,2526 0,334 0,280
4.3. Effect of Inflation on Wages
As stated above, the inflation rate is a significant determinant of the amount of increase in minimum wages and is recommended to be reflected as an annual increase if the companies prefer to implement a fair wage policy. When Turkish construction engineers' answers related to the rate of increase in their wages between 2015 and 2016 are analyzed, it is observed that only 36% of them had an increase that is equal to or more than the official inflation rate of 8% (Table 7).

Wage Determinants and Wage Inequalities - Case of Construction Engineers in Turkey
8970
Table 7 - Increase % in the Wages of Construction Engineers Between 2015 and 2016
Increase % Number of Respondents % of Respondents Cumulative % of Respondents
0 – 0.9 140 34.14 34.14 1 – 2.9 33 8.0 42.14 3 – 4.9 29 7.1 49.24 5 – 7.9 59 14.39 63.63 8 – 9.9 58 14.14 77.77 10 – 12.9 28 6.83 84.60 13 – 14.9 23 5.61 90.21 15 – 17.9 10 2.44 92.65 18 – 20.9 9 2.3 94.95 21 – 23.9 4 0. 9 95.85 24 – 25.9 3 0.73 96.58 26 – 28.9 3 0.73 97,31 29 – 30.9 3 0.73 98.04 >30.9 8 1.96 100.0 Total 410 100.0
4.4. Effect of Compensable Variables on Wages and Wage Inequalities
Multinomial Logistic Regression analysis is preferred to examine the relationship between the independent and the dependent variables when the dependent variable includes three or more categories and when favouring one class of independent variables over another does not depend on the presence or absence of other irrelevant alternatives. Any category of the dependent variable is considered as the reference category, and other categories are analyzed concerning this category. For the current research, dependent variable ‘Monthly Wage' was represented by three categories which are ‘low,' ‘medium' and ‘high' (see Table 8). Independent variables were also categorized as shown in Table 8.
Variables ‘country of the project', ‘computer skills' and ‘travelling distance between the project site and the town centre' were excluded from the analysis due to the little variability and unsuitability for categorization. ‘Project size' was excluded due to the number of missing responses (which was around 40% of the responses). ‘Seniority' was excluded due to its high collinearity with the variable ‘experience.'
Pearson and Deviance significance values (greater than 0.05, see Table 9) show that model fit is statistically acceptable [70-71]. Additionally, Nagelkerke Pseudo R2 Coefficient show that independent variables can explain 45.9% of the dependent variable ‘Monthly Wage' which is also statistically satisfactory.

Serkan AYDINLI, Mustafa ORAL, Emel ORAL
8971
Table 8 - Categories of Variables and Number of Respondents in Each Category
Variable Category Number of Respondents
% of Respondents
Monthly Wage < 2500 TL (Low Wage) 102 24.88 2500 – 4000 TL (Moderate Wage) 210 51.22 > 4000 TL (High Wage) 98 23.90
Education Associate Degree 22 5.36 Undergraduate Degree 329 80.24 Graduate Degree 59 14.40
Experience
0-2 years 77 18.78 3-5 years 96 23.41 6-10 years 87 21.22 11-20 years 99 24.15 > 20 years 51 12.44
Company Size
< 10 100 24.39 11-50 162 39.51 51-250 88 21.46 > 250 60 14.64
Project Type
Prefabrication/Low Complexity 23 5.60 Building Inspection/Low Complexity 68 16.58
Building Construction /Medium Complexity 261 63.66
Infrastructure Projects /High Complexity 58 14.16
City
1. Group Cities (İstanbul) 158 38.53 2. Group Cities (Ankara – İzmir – Bursa) 82 20.01
3. Group Cities (Others) 170 41.46 Foreign language Scores by using Likert Scale 9. 410 100
Reference category of the dependent variable was determined by comparing the accuracy percentage between actual and estimated values for the three categories as shown in Table 10. Results show that accuracy of the model is 64.8%, which is very satisfactory for human resource management related studies. Results also indicate that the model works more accurately in comparisons between ‘low’ and ‘high’ wage categories rather than comparisons with 'medium'

Wage Determinants and Wage Inequalities - Case of Construction Engineers in Turkey
8972
wage categories. Thus, ‘low’ wage category was accepted as the reference category for further analysis (see Table 11).
Table 9 - Model-Fit Indicators
Model Model-Fit Criteria Likelihood Ratio Tests -2 Log Likelihood Chi-square Df Sig.
Constant 661.834 Final Model 482.758 179.076 32 0.000 Pearson
497.282 524 0.794
Deviance 438.294 524 0.997 Nagelkerke Pseudo R2 0.459
Table 10 - Estimation Classification of Logistic Regression Model
Category/Actual Category/Estimated
< 2500 TL 2500 – 4000 TL > 4000 TL Accuracy %
Low (< 2500 TL) 59 39 4 57,8
Medium (2500 – 4000 TL) 22 167 21 79,5
High (> 4000 TL) 3 39 56 57,1
Cumulative % Frequency 20,4 59,7 19,9 64,8
The exponential beta coefficient, Exp (B) in Table 11, represents the change in the dependent variable (i.e., monthly wage in the current research) which is associated with a one-unit change of the corresponding independent variable via the reference category. The Exp (B) results will be interpreted in the following paragraphs together with Gini coefficients and Self Organizing Maps (SOM).
SOM maps, given in Figure 2, were produced by using the SOM model developed by Oral and Oral [64]. SOM which is an unsupervised neural network algorithm converts complex, nonlinear statistical relationships between high-dimensional data items into simple geometric relationships on a low-dimensional display. It compresses information by preserving the primary topological and metric relationships of the primary data items on display. The SOM maps presented in this study display the relationships between wage and the level of education, experience, project type, size of the company and city categories. The relationship between the compensable variables and wage can be analyzed in detail if all the maps are evaluated together. To give an example; the low wage region on the upper right corner in Figure 2 (a) is due to the employees with six or more years' experiences that have either an associate or an undergraduate degree (Figure 2 (c)) and that is either a building construction engineer or a building inspector (Figure 2 (d)) in medium-sized companies (Figure 2 (e))

Serkan AYDINLI, Mustafa ORAL, Emel ORAL
8973
which is not located in Istanbul (Figure 2 (f)). Therefore, evaluation of all the maps given in Figure 2 enables observation of hidden relationships that may not be detected through statistical analysis.
Table 11 - Multinomial Logistic Regression Analysis Results
WAGEa B Std. Error Wald df Sig. Exp(B)
95% Confidence Interval for
Exp(B) Lower Bound
Upper Bound
Constant -0.607 1.482 0.168 1 0.682 Foreign Language** 0.157 0.095 2.705 1 0.100 1.170
0.970
1.410
Education
Associate degree 0b . . 0 . .
.
.
Undergraduate degree* 2.400 1.187 4.087 1 0.043 11.020 1.076 112.876 Graduate degree* 3.917 1.343 8.511 1 0.004 50.234 3.616 697.905
Experience
0-2 years* -1.805 0.770 5.499 1 0.019 0.164
0.036
0.744
3-5 years -0.509 0.692 0.541 1 0.462 0.601 0.155 2.333 6-10 years 0b . . 0 . . . . 11-20 years* 1.296 0.654 3.925 1 0.048 3.656 1.014 13.181 > 20 years 0.076 0.699 0.012 1 0.913 1.079 0.274 4.247
Building Construction /Medium Complexity -0.527 0.642 0.674 1 0.412 0.591 0.168 2.077 Prefabrication */Low Complexity -2.474 1.019 5.899 1 0.015 0.084 0.011 0.620 Building Inspection*/Low Complexity -1.993 0.800 6.214 1 0.013 0.136 0.028 0.653 Infrastructure Projects /High Complexity 0b . . 0 . . . .
City
İstanbul* 1.135 0.484 5.509 1 0.019 3.111
1.206
8.026
2. Group** 0.961 0.530 3.291 1 0.070 2.614 0.926 7.379 3. Group 0b . . 0 . . . .
Company Size
< 10* (small) -1.408 0.598 5.554 1 0.018 0.245
0.076
0.789
11-50*(medium) -1.614 0.560 8.313 1 0.004 0.199 0.066 0.596 51-250 (large) 0b . . 0 . . . . > 250 (very large) -0.107 0.770 0.019 1 0.889 0.898 0.198 4.067
a. ‘Low’ wage is considered as the reference category. b. Coefficients are calculated with reference to the reference categories. * It is significant at the 95% confidence level. ** It is significant at the 90% confidence level

Wage Determinants and Wage Inequalities - Case of Construction Engineers in Turkey
8974
Low
Associate
Medium Undergrad High Graduate
(a)Wage (b)Level of Education 0-2
Small 3-5 Medium 6-10 Large 11-20 Very Large >20
(c) Experience (d) Company Size
Building
İstanbul
Building Insp. 2nd Group
Prefabrication 3rd Group Infrastructure
(e) Project Type (f) City
Figure 2 - SOM maps
Table 12 - Gini Coefficients for Compensable Variables
Overall
Gini 0.2526
Education Associate degree 0.3814 Graduate degree 0.2354 Postgraduate degree 0.2685
Experience
0-2 years 0.2622 3-5 years 0.1692 6-10 years 0.1912 11-20 years 0.2827

Serkan AYDINLI, Mustafa ORAL, Emel ORAL
8975
Table 12 - Gini Coefficients for Compensable Variables (continue)
Overall
Gini 0.2526
Company size
<10 employees (small) 0.2260 11-50 (medium) 0.2206 51-250 (large) 0.247 >250 (very large) 0.4629
Project Type
>20 years 0.3205 Building construction 0.2070 Building inspection 0.2947 Prefabrication 0.2596 Infrastructure 0.2655
Finally, as informed previously, Gini coefficients were calculated for each category of the compensable variables to analyze the wage inequalities in the industry. The findings are presented in Table 12.
Based on the above-presented results, effects of compensable variables on wages of construction engineers in Turkey are discussed in the following paragraphs.
4.4.1. Level of Education
Results in Table 8 show that around 5% of respondents are construction technicians (Associate degree holders) by profession. They undertake the responsibilities of a construction engineer on site. It was indeed a widespread practice to employ experienced construction technicians to conduct the duties of site managers until an amendment in the related regulation [72] in 2014. Construction technicians were prohibited from undertaking legal responsibilities of construction projects by this amendment. Meanwhile, some construction companies have continued to work with these practitioners. The maps in Figures 2(a) and 2(b) show that none of these practitioners earns a ‘high’ wage. When the maps in Figure 2(b) and (d) are analyzed together, it is observed that all of these professionals who work in small-sized companies earn ‘low’ wages. Meanwhile, Gini coefficient being the highest for associate degree holders among the three categories of level of education is an indicator of the divergence between wages (Table 12). However, a few numbers of respondents with some outliers may be affecting the value of the Gini coefficient.
Results in Table 11 show that the odds to earn ‘high’ wages rather than ‘low’ wages for the engineers with undergraduate degrees or graduate degrees are respectively 11.020 and 50.234 times more than for associate degree holders. Meanwhile, a graduate degree provides 4.56 (= 50.234/11.020) times more chance to earn a ‘high’ wage rather than a ‘low’ wage than an 'undergraduate' degree. The map in Figure 2(b) supports these findings by showing that both

Wage Determinants and Wage Inequalities - Case of Construction Engineers in Turkey
8976
undergraduate and graduate degree holders earn 'high' wages, and the relative ratio of ‘high' wages are higher for the graduate degree holders. These findings are in good agreement with the literature review findings presented in Table 1. As discussed by previous studies, there is a positive relationship between the wages paid to employees and their education levels. Like in many industries, the employers in the construction industry consider the benefits they can gain from the employees when determining the employee wages; resulting in the technical knowledge and the competencies that are acquired via academic degrees to be an important wage determinant.
4.4.2. Experience
The SOM maps in Figure 2(a) and 2(c) show that engineers with any experience may earn ‘low’ wages. However, the regression analysis results show that the odds of earning a 'high' wage rather than a ‘low' wage for 11-20 years' experienced engineers are 22.29 (3.656/0.164) and 3.656 times more concerning engineers with experiences of 0-2 years and 6-10 years, respectively. Meanwhile, experience over 20 years does not guarantee a ‘high' monthly wage. Gini coefficient being the highest for the most experienced group of engineers (Table 12) and literature findings given in Table 2. are in support of the regression analysis results showing that while some experienced engineers earn quite a lot, others earn quite a little. Such a deviation is because while some engineers at the retirement age continue to work in high positions in construction projects, others continue to work as senior building inspectors or in similar low profile positions, earning low wages after retirement. The variations between the wages of the experienced engineers are also observed in the map in Figure 2(c). The map additionally supports the regression analysis results by showing that ‘high’ wages are earned more by the 11-20 years’ experienced engineers rather than others (Figure 2(c)). The map also shows that none of the least experienced engineers earn ‘high’ wages and engineers with 3-5 years’ experience only earn ‘high’ wages if they work either in Istanbul or small-sized companies in other cities.
4.4.3. Company Size
Parallel to the results of Idson and Feaster [63] and Nestić [42], the map in Figure 2(d) shows that while the vast majority of engineers working in large and very large companies earn ‘high’ wages. Meanwhile, engineers with less than five years' experiences earn 'low' wages in these companies (Figure 2(c) and 2 (d)). The value of the Gini coefficient, being the highest (0.4629), additionally indicates that while the majority of engineers in very large companies earn 'high' wages, there exist engineers who work in these companies with extremely 'low' wages. Meanwhile, the results in Table 11 show that working in very large companies rather than large companies do not affect wages significantly. However, other company sizes affect the wages and the odds for an engineer working in a large-sized company to earn ‘high' wage is 5.025 (=1/0.199) times more than for an engineer working in a medium-sized company, and 4.08 (=1/0.245) times more than for an engineer working in a small- sized company. Company size in construction industry is one of the important indicators of the company’s ability to engage in large projects continuously and have higher turnovers. Thus, these companies are able to allocate higher budgets to human resources in order to keep their employees long term.

Serkan AYDINLI, Mustafa ORAL, Emel ORAL
8977
4.4.4. Project Type and Complexity:
The map in Figure 2(e) shows that vast majority of engineers working in infrastructure projects earn ‘medium' or ‘high' wages; only low (less than five years) experienced engineers earn ‘low' wages. Meanwhile, engineers working in building inspection are more likely to earn ‘low' or ‘medium' wages. (Figure 2 (c) and 2(e)). Results in Table 11 additionally show a significant difference between the wages of construction engineers working in low complexity (i.e., building inspection and prefabrication) projects and the wages of the ones working in high complexity (infrastructure) projects. Results show that the odds to earn a ‘high' wage rather than a ‘low' wage for construction engineers when working in infrastructure projects are 7.35 (1/0.136), and 1.90 (=1/0.084) times more than working in building inspection, and in prefabrication projects, respectively. In the meantime, it is observed that wage inequalities for the four project complexity categories are similar as none of the Gini coefficients are distantly different than the others (see Table 12).
4.4.5. City of Work
‘City of work' is categorized into three groups for regression analysis. The first group only includes Istanbul which has the highest cost of living in Turkey. The second group consists of Ankara, Izmir, and Bursa which follow Istanbul concerning the cost of living. The third group consists of other cities. The results show that the odds to earn ‘high’ wage rather than ‘low’ wage in Istanbul is 1.19 and 3.11 times more than the second group and the third group of cities, respectively. Statistical data provided by TSI [4] show that Gini coefficient for working population is 0.398 for Istanbul, which is the highest among all of the cities in Turkey. On the other hand, Gini coefficient for construction engineers is determined to be the lowest for Istanbul (Table 12). In support of the regression results, the map in Figure 2(f) shows that the vast majority of engineers working in Istanbul or second category of cities earn ‘medium' or ‘high' wages while ‘low' wages dominate the cities in the third category. The analysis results show that cost of living is an important criterion in wage agreements as the wages are required to fulfill the needs of the employees.
4.4.6. Foreign Language Skills
Construction engineers were asked to rate their level of foreign language skills required for their occupation by using Likert Scale 9. Exp (B) value in Table 11which is 1.170 (within 90% confidence level) means that; the odds to earn a ‘high' wage rather than a 'low' wage is 4.10 times more for an engineer who uses foreign language at a level of 9 out of 9 than the odds of an engineer who does not use any foreign languages at all. These results show that foreign language skills increase wage rates more in Turkish construction companies than in Chinese companies (as determined by Yang & Mayston [45]). The difference may be related to the differences between supply-demand balance of these two countries; as according to the English proficiency index (2017) by Education First, Turkey ranks 62th and China 36th between 80 countries [73]; which shows that English proficiency of the individuals is very low in Turkey and results foreign language skills increase wage rates more in Turkish construction companies than in Chinese companies.

Wage Determinants and Wage Inequalities - Case of Construction Engineers in Turkey
8978
4.4.7. Effect of Performance on Wages- Employee and Employer Perspectives
Only 6% of the construction engineers stated that their employer evaluated their performance and returned it as a bonus or as an increase in their wages. These engineers were then asked to choose the variables that were assessed by their employer during the performance appraisal. Their responses are presented in Table 13.
Results in Table 13 show that problem solving, planning, organization and coordination abilities related to the completion of tasks within a pre-determined schedule and quality specifications are the most frequently valued criteria during performance evaluation. Meanwhile, unlike the literature findings, level of compliance with health and safety rules and level of the number of accidents within the unit are not assessed as much as the other criteria, and that may be the result of two different approaches. First one is that complying with health and safety procedures and avoiding accidents is indispensable during construction works and should not be an issue to be considered during the performance appraisal. The second one is just the opposite; these issues are not of any concern for the Turkish construction companies.
Table 13 - Performance Indicators of Construction Engineers
Variable % of Respondents
Rank
Problem-solving ability 5.66 1 Organization and coordination ability 5.66 1 On time completion of a task 4.58 2 Planning ability 4.58 2 Quality of work 4.58 2 Ability in finding construction faults 4.58 2 Productivity 4.31 3 Relations with customers 4.31 3 Level of compliance with health and safety rules 3.77 4 Social relationships with co-workers 3.77 4 Ability to motivate subordinates 2.16 5 Rate of rework 1.08 6 Number of accidents in his/her unit 0.81 7
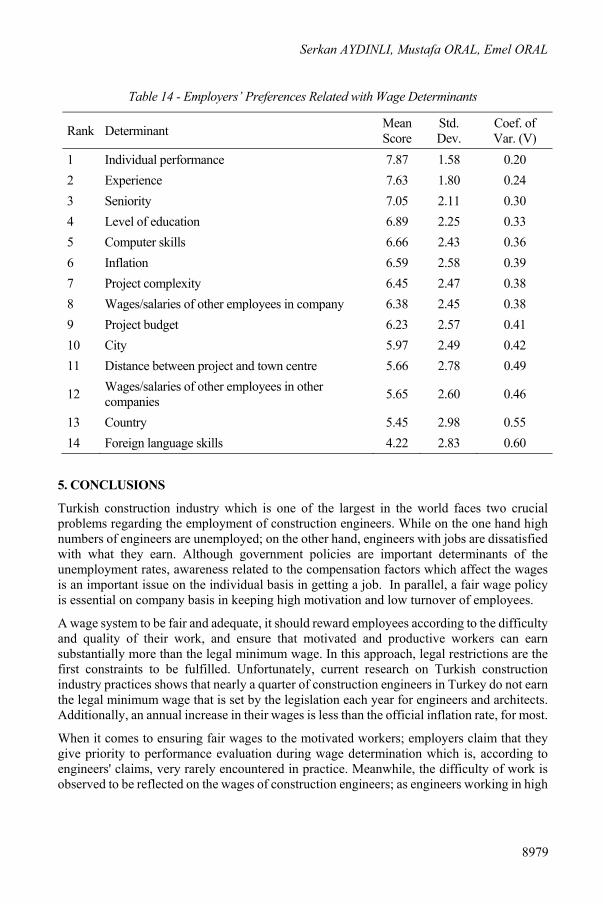
Table 14 summarizes company/human resources managers' responses related to their wage evaluation criteria of construction engineers. Individual performance is the most significant wage determinant from the perspective of the employers. Experience, seniority, and level of education follow it. In contrary to regression analysis results foreign language skills is the least important criterion for the employers; although high coefficient of variation (V= 0.60) shows that there is not a good agreement amongst the employers related with the issue.
Serkan AYDINLI, Mustafa ORAL, Emel ORAL
8979
Table 14 - Employers’ Preferences Related with Wage Determinants
Rank Determinant Mean Score
Std. Dev.
Coef. of Var. (V)
1 Individual performance 7.87 1.58 0.20 2 Experience 7.63 1.80 0.24 3 Seniority 7.05 2.11 0.30 4 Level of education 6.89 2.25 0.33 5 Computer skills 6.66 2.43 0.36 6 Inflation 6.59 2.58 0.39 7 Project complexity 6.45 2.47 0.38 8 Wages/salaries of other employees in company 6.38 2.45 0.38 9 Project budget 6.23 2.57 0.41 10 City 5.97 2.49 0.42 11 Distance between project and town centre 5.66 2.78 0.49
12 Wages/salaries of other employees in other companies 5.65 2.60 0.46
13 Country 5.45 2.98 0.55 14 Foreign language skills 4.22 2.83 0.60
5. CONCLUSIONS
Turkish construction industry which is one of the largest in the world faces two crucial problems regarding the employment of construction engineers. While on the one hand high numbers of engineers are unemployed; on the other hand, engineers with jobs are dissatisfied with what they earn. Although government policies are important determinants of the unemployment rates, awareness related to the compensation factors which affect the wages is an important issue on the individual basis in getting a job. In parallel, a fair wage policy is essential on company basis in keeping high motivation and low turnover of employees.
A wage system to be fair and adequate, it should reward employees according to the difficulty and quality of their work, and ensure that motivated and productive workers can earn substantially more than the legal minimum wage. In this approach, legal restrictions are the first constraints to be fulfilled. Unfortunately, current research on Turkish construction industry practices shows that nearly a quarter of construction engineers in Turkey do not earn the legal minimum wage that is set by the legislation each year for engineers and architects. Additionally, an annual increase in their wages is less than the official inflation rate, for most.
When it comes to ensuring fair wages to the motivated workers; employers claim that they give priority to performance evaluation during wage determination which is, according to engineers' claims, very rarely encountered in practice. Meanwhile, the difficulty of work is observed to be reflected on the wages of construction engineers; as engineers working in high
Wage Determinants and Wage Inequalities - Case of Construction Engineers in Turkey
8980
complexity projects or in the projects which require foreign language skills or higher levels of education are observed to earn more than their peers.
When wage inequalities are analyzed, it is observed that overall income inequality for construction engineers is not as high as the national average and the available international values. In the meantime, wage inequalities differ concerning the different categories of compensation variables.
In addition to presenting the constituents of a fair wage for construction engineers, findings of the current research will be beneficial to academicians, construction engineers, and company managers. By demonstrating the wage practices in the construction industry, determinants of wage rates, and the priorities of employers regarding the performance appraisals, the findings will help engineers, especially new graduates, in building realistic wage expectations. Findings will also be of use by the academicians as they reveal the necessity of the inclusion of practical issues in the course contents that would improve the problem solving, organization and coordination skills of the students. Finally, findings will be beneficial to construction company managers in implementing wage policies which would consider prevailing wages and industry-wide applications. In parallel, findings are expected to draw the attention of the government bodies, by presenting the deviations between legally expected and practically paid in the industry.
6. LIMITATIONS AND RECOMMENDATIONS FOR FUTURE WORK
While the current study focused on the determinants of construction engineers' wages and wage policies of Turkish construction companies only, its findings can be taken as a basis for further studies especially in developing countries. Larger sample sizes are recommended for these studies, as although the total number of respondents of the current study was statistically significant to derive conclusions, increasing number of respondents in each category of compensable variables would lead to the determination of more realistic Gini coefficient values.
The discussion in the current paper shows that the SOM maps help to interpret data by presenting the relationship between different variables in a simple visual format. In the meantime, SOM is a type of artificial neural network which can be utilized for prediction. Further developments of the current research, will focus on developing a SOM-based model that would help to predict wages of construction engineers under given conditions.
Finally, findings of the current survey can be used to create artificial intelligence based wage systems. Wages and salary increases can be more objectively and fairly determined using algorithms such as fuzzy logic and artificial neural networks. In this manner, contemporary intelligent wage systems can help for effective motivation and management of human resources in construction industry.
Acknowledgements
The first author of this study has been supported by TUBITAK (The Scientific and Technological Research Council of Turkey) with post graduate scholarship. The first author would like to express his thanks to TUBITAK for this support.

Serkan AYDINLI, Mustafa ORAL, Emel ORAL
8981
The authors would like to thank to Çukurova University, Scientific Research Project Funding (CU BAP) for their financial support [Project number: FBA-2016-5779].
References
[1] MET. Company Reports 2016. Ministry of Economy of Turkey, 2016.
[2] Buildecon. Turkey Construction Market Report 2012. Turkey, 2012.
[3] TSI. Construction Labor Input Indices 2016. Turkish Statistical Institute, [Online]. Available: http://www.turkstat.gov.tr/PreTablo.do?alt_id=1023, Accessed November 8, 2017, 2016.
[4] TSI. Construction Seasonally and Calendar Adjusted Gross Wages-Salaries Index and Percentage Changes (2010=100). Turkish Statistical Institute, [Online]. Available: http://www.turkstat.gov.tr/PreTablo.do?alt_id=1023, 2017, Accessed November 8, 2017.
[5] UCTEA. Member Information 2016. Union of Chambers of Turkish Engineers and Architects, [Online]. Available: https://www.tmmob.org.tr/icerik/tmmob-uye-sayisi-510-bini-asti, Accessed November 8, 2017.
[6] Marshall, A. Principles of political economy. Maxmillan, New York, 1890.
[7] Davidson, J. The Bargain Theory of Wages. New York; London: GP Putnam, 1898.
[8] Business Roundtable Integrating Construction Resources and Technology into Engineering, Report No. B-1A, Construction Industry Cost Effectiveness Project Report, New York, 1982.
[9] Abu-Hijleh, S. F., Ibbs, C. W. Schedule-based Construction Incentives. Journal of Construction Engineering and Management, 115(3), 430-443,1989.
[10] Huselid, M. A., The Impact of Human Resource Management Practices on Turnover, Productivity, and Corporate Financial Performance. Academy of Management Journal, 38(3), 635-672,1995.
[11] Igalens, J., & Roussel, P. A Study of The Relationships Between Compensation Package, Work Motivation and Job Satisfaction. Journal of Organizational Behavior, 1003-1025,1999.
[12] Fay, C. H., Thompson, M. A. Contextual Determinants of Reward Systems' Success: An Exploratory Study. Human Resource Management, 40(3), 213-226, 2001.
[13] Doloi, H. Analysis of Incentivised Remuneration Schemes in Construction Industries. 22st International Symposium on Automation and Robotics in Construction, 11-14 September, Ferrara, Italy, 2005.
[14] Gazioğlu, S., Tansel, A. Job Satisfaction in Britain: Individual and Job-Related Factors. Applied Economics, 38(10), 1163-1171, 2006.
[15] Brewster, C., Sparrow, P., Vernon, G. International Human Resource Management. 2nd ed., 2007.

Wage Determinants and Wage Inequalities - Case of Construction Engineers in Turkey
8982
[16] Enshassi A., Mohamed S., Abu Mustafa Z., & Mayer P. E. Factors Affecting Labour Productivity in Building Projects in The Gaza Strip. Journal of Civil Engineering and Management, 13(4), 245-254, 2007.
[17] Gooderham, P., Parry, E., Ringdal, K. The Impact of Bundles of Strategic Human Resource Management Practices on the Performance of European Firms. The International Journal of Human Resource Management, 19(11), 2041-2056, 2008.
[18] Randeree, K., Ghaffar Chaudhry, A. Leadership–Style, Satisfaction and Commitment: An Exploration in The United Arab Emirates' Construction Sector. Engineering, Construction and Architectural Management, 19(1), 61-85, 2012.
[19] Kazaz A., Manisalı E., Ulubeyli S. Effect of Basic Motivational Factors on Construction Workforce Productivity in Turkey. Journal of Civil Engineering and Management, 14(2), 95-106, 2008.
[20] Williams, M. L., Brower, H. H., Ford, L. R., Williams, L. J., & Carraher, S. M. A Comprehensive Model and Measure of Compensation Satisfaction. Journal of Occupational and Organizational Psychology, 81(4), 639-668, 2008.
[21] Arashpour, M., Arashpour, M. Important Factors Influencing Personnel Performance of Construction Companies. Economics, Business and Management, Vol.2., 32-37, 2011.
[22] Arumugam, V. C., Mojtahedzadeh, R. The Impact of Human Resource Management Practices on Financial Performance of Malaysian Industries. International Research Journal of Finance and Economics, 80, 49–54, 2011.
[23] Mudor, H., & Tooksoon, P. Conceptual Framework on The Relationship Between Human Resource Management Practices, Job Satisfaction, and Turnover. Journal of Economics and Behavioral Studies, 2(2), 41-49, 2011.
[24] Siems, F. U., Goelzner, H., Moosmayer, D. C. Reference Compensation: A Transfer of Reference Price Theory to Human Resource Management. Review of Managerial Science, 6(2), 103-129, 2012.
[25] Jarkas, A. M., Radosavljevic, M. Motivational Factors Impacting the Productivity of Construction Master Craftsmen in Kuwait. Journal of Management in Engineering, 29(4), 446-454, 2012.
[26] Gupta, N., Shaw, J. D. Employee Compensation: The Neglected Area of HRM Research. Human Resource Management Review, 24(1), 1-4, 2014.
[27] Chih, Y.Y., Kiazad, K., Zhou, L., Capezio, A. Li, M., Restubog, S.L.D. Investigating Employee Turnover in the Construction. Journal of Construction Engineering and Management, 142(6), 2016.
[28] Tanriverdi, H., Çakmak, C., Altindag, E. The Relationship of Organizational Culture and Wage Policies in Turkish Family Firms. Business Management Dynamics, 5(7), 1-16, 2016.

Serkan AYDINLI, Mustafa ORAL, Emel ORAL
8983
[29] Berber, N., Morley, M. J., Slavić, A., Poór, J. Management Compensation Systems in Central and Eastern Europe: A Comparative Analysis. The International Journal of Human Resource Management, 28(12), 1661-1689, 2017.
[30] Akerlof, G. A. Labor Contracts As Partial Gift Exchange. The quarterly journal of economics, 97(4), 543-569, 1982.
[31] Akerlof, G. A., & Yellen, J. L. The Fair Wage-Effort Hypothesis and Unemployment. The Quarterly Journal of Economics, 105(2), 255-283, 1990.
[32] ILO. “Definition of Wage” [Online]. Available: http://www.ilo.org/global/topics/wages/lang--en/index.htm, 2017, Accessed November 8, 2017.
[33] ILO, “General Survey concerning the Minimum Wage Fixing Convention, 1970 (No. 131), and the Minimum Wage Fixing Recommendation, 1970 (No. 135), Committee of Experts on the Application of Conventions and Recommendations”. International Labour Organization. [Online]. Available: http://www.ilo.org/global/standards/WCMS_235303/lang--en/index.htm, Accessed November 7, 2017.
[34] Korkmaz, A., Avsallı, H. Türkiye'de Asgari Ücretin Hukuksal Yönü. Journal of Alanya Faculty of Business, 4(2), 2012.
[35] Labour Law 4857., [Online]. Available: http://turkishlaborlaw.com/turkish-labor-law-no-4857/19-4857-labor-law-english-by-article, Accessed November 8, 2017, 2003.
[36] UCTEA. “Meeting Decisions (19.12.2015).” Union of Chambers of Turkish Engineers and Architects, [Online]. Available: https://www.tmmob.org.tr/belgeler/toplanti-kararlari-28, 2015, Accessed November 8, 2017.
[37] Simon, H.A., “Behavioral economics. In: Eatwell, J., Millgate, M., Newman, P. (Eds.)”, The New Palgrave: A Dictionary of Economics, Macmillan, London, 1987.
[38] Dubin, R. Theory building: Revised Ed. Free Press, 1978.
[39] Essays, UK. Economic and Behavioural Theories in Compensation Economics Essay. November 2013. [Online]. Available: https://www.ukessays.com/essays/economics/economic-and-behavioural-theories-in-compensation-economics-essay.php?vref=1 Accessed November 7, 2017.
[40] Bhattarai, K. R., Wisniewski, T. Determinants of Wages and Labour Supply in The UK. Chinese Business Review, 16(3), 126-140, 2002.
[41] Boudarbat, B., Lemieux, T., Riddell, W.C. Recent Trends in Wage Inequality and The Wage Structure in Canada. Dimensions of Inequality in Canada, University of British Columbia Press, Vancouver, Canada, 2006.
[42] Nestić, D. The Determinants of Wages in Croatia: Evidence From Earnings Regressions. 65th Anniversary Conference of the Institute of Economics, 18-19 November 2004, Zagreb, Croatia, 2005.
[43] Liu L., & Zhang C. Wages for Migrant Workers in The Pearl River Delta: Determining Factors. Social Sciences in China, 29(3), 104-120, 2008.

Wage Determinants and Wage Inequalities - Case of Construction Engineers in Turkey
8984
[44] Addabbo, T., Favaro, D. Gender Wage Differentials by Education in Italy. Applied Economics, 43(29), 4589-4605, 2011.
[45] Yang, J., & Mayston, D. Impact of Overeducation on Wages in China. Chinese Economy, 45(2), 65-89, 2012.
[46] Morikawa, M. A Comparison of The Wage Structure between the Public and Private Sectors in Japan. Journal of the Japanese and International Economies, 39, 73-90, 2016.
[47] Ginsburgh, V. A., Melitz, J., & Toubal, F. Foreign Language Learning: An Econometric Analysis. CEPR Discussion Paper No. DP10101, 2014.
[48] Di Paolo, A., & Tansel, A. Returns to Foreign Language Skills in a Developing Country: The Case of Turkey. The Journal of Development Studies, 51(4), 407-421, 2015.
[49] Ginsburgh, V. A., Melitz, J., Toubal, F. Foreign Language Learning, and Trade. Review of International Economics, 25(2), 320-361, 2017.
[50] Chen, Z., Ge, Y., Lai, H., & Wan, C. Globalization and Gender Wage Inequality in China. World Development, 44, 256-266, 2013.
[51] Dainty, A. R., Cheng, M. I., Moore, D. R. Competency-based Model for Predicting Construction Project Managers’ Performance. Journal of Management in Engineering, 21(1), 2-9, 2005.
[52] Ogunlana, S., Siddiqui, Z., Yisa, S., & Olomolaiye, P. Factors and Procedures Used in Matching Project Managers to Construction Projects in Bangkok. International Journal of Project Management, 20(5), 385-400, 2002.
[53] Kagioglou, M., Cooper, R., and Aouad, G. Performance Management in Construction: A Conceptual Framework. Construction Management and Economics, 19(1), 85-95, 2001.
[54] Dainty, A. R., Cheng, M. I., Moore, D. R. Redefining Performance Measures for Construction Project Managers: An Empirical Evaluation. Construction Management and Economics, 21(2), 209-218, 2003.
[55] Cheng, E. W., & Li, H. Job Performance Evaluation for Construction Companies: An Analytic Network Process Approach. Journal of Construction Engineering and Management, 132(8), 827-835, 2006.
[56] Babecký, J., Dybczak, K., Galuščák, K. Survey on Wage and Price Formation of Czech Firms. Czech National Bank Working Paper Series, (12), 2008.
[57] Galuscak, K., Keeney, M., Nicolitsas, D., Smets, F., Strzelecki, P., Vodopivec, M. The Determination of Wages of Newly Hired Employees: Survey Evidence on Internal Versus External Factors. Labour Economics, 19(5), 802-812, 2012.
[58] EFBWW. “Wages in Construction” The European Federation of Building and Woodworkers. 2009. [Online]. Available: http://www.efbww.org/pdfs/1%20-%20CAO%20GB%20FINAL.pdf, Accessed November 7, 2017.

Serkan AYDINLI, Mustafa ORAL, Emel ORAL
8985
[59] Iriondo, I., & Pérez-Amaral, T. The Effect of Educational Mismatch on Wages in Europe. Journal of Policy Modeling, 38(2), 304-323, 2016.
[60] Cox, R. F., Issa, R. R., Ahrens, D. Management’s Perception of Key Performance Indicators for Construction. Journal of construction engineering and management, 129(2), 142-151, 2003.
[61] Samuel, O. W., Omisore, M. O., & Atajeromavwo, E. J. Online Fuzzy Based Decision Support System for Human Resource Performance Appraisal. Measurement, 55, 452-461, 2014.
[62] Nassar, N., & AbouRizk, S. Practical Application for Integrated Performance Measurement of Construction Projects. Journal of Management in Engineering, 30(6), 04014027. 2014.
[63] Idson, T. L., & Feaster, D. J. A Selectivity Model of Employer-Size Wage Differentials. Journal of Labor Economics, 8(1, Part 1), 99-122, 1990.
[64] Oral E., Oral, M. Predicting Construction Crew Productivity by Using Self Organizing Maps. Automation in Construction, 19(6), 791-797, 2010.
[65] Lorenz, M. O. Methods of Measuring The Concentration of Wealth. Publications of The American Statistical Association, 9(70), 209-219, 1905.
[66] World Bank Group Inequality Measures, Poverty Manual, All, JH Revision of August 8, p. 218, 2005.
[67] Ahmad, M. Estimation of Distribution of Income Among Various Occupations/Professions in Pakistan. Pakistan Economic and Social Review, 119-134, 2001.
[68] OECD, Income inequality (indicator). [Online]. Available: https://data.oecd.org/inequality/income-inequality.htm, Accessed December 7, 2017.
[69] United Nations Development Programme (UNDP)) Human Development Reports [Online]. Available: http://hdr.undp.org/en/content/income-gini-coefficient , 2017, Accessed December 15, 2017.
[70] Tabachnick, B.G., Fidell L.S., Using Multivariate Statistics, 6th ed. Pearson, Boston, 2016.
[71] Peng, C. Y. J., Lee, K. L., Ingersoll, G. M. An Introduction to Logistic Regression Analysis and Reporting. The Journal of Educational Research, 96(1), 3-14, 2002.
[72] Regulation on the Records of Building Contractors and The Site Managers and Licenced Foremen (Yapı Müteahhitlerinin Kayıtları ile Şantiye Şefleri ve Yetki Belgeli Ustalar Hakkında Yönetmelik) [Online]. Available: http://www.resmigazete.gov.tr, Accessed December 7, 2017.
[73] EF. “Education First, English Proficiency Index” [Online]. Available: https://www.ef.com.tr/epi/, 2017, Accessed July 16, 2018.

Wage Determinants and Wage Inequalities - Case of Construction Engineers in Turkey
8986