towards achieving the right to health - bangladesh institute of
TRANSCRIPT
The Bangladesh Development Studies Vol. XXXIII, March-June 2010, Nos. 1 & 2
Towards Achieving the Right to Health: The Case of Bangladesh
OMAR HAIDER CHOWDHURY S. R. OSMANI*
Bangladesh has made great strides in improving the health of its population, much more than a country at its level of development can be expected to do. Serious problems still remain in reducing child malnutrition and maternal mortality in particular; nonetheless, the aggregative results achieved in the last three decades are quite impressive. These achievements have certainly have gone a long way towards fulfilling the right to health in Bangladesh. This paper argues, however, that despite overall progress the health sector of Bangladesh suffers from a number of inadequacies that militate against the rights-based approach to health. These include persistent inequities in access to healthcare (including gender inequity, and inequity along the poor versus non-poor divide), lack of meaningful participation of citizens in the running of the health system, and the absence of effective accountability mechanisms through which the providers of healthcare can be held responsible for their actions.
I. INTRODUCTION This paper attempts to provide an assessment of Bangladesh’s record on the
implementation of the right to development with specific focus on the right to health. The main elements of the human rights approach to health policy are discussed in Section II. Section III gives a brief account of the healthcare system in Bangladesh * Omar Haider Chowdhury was Research Director of Bangladesh Institute of Development Studies, Dhaka and. S. R. Osmani is Professor of Development of Economics at the University of Ulster, UK. This is an expanded and updated version of a paper originally prepared for the Right to Development Project jointly conducted by the School of Public Health of Harvard University and the Centre for Development and Human Rights of the Jawaherlal Nehru University, Delhi. The original paper was written by Omar Haider Chowdhury; after his untimely death, the paper was revised, expanded and updated by S. R. Osmani. The support provided by the project team, especially by Arjun Sengupta and Stephen Marks, in preparing the paper is gratefully acknowledged. All responsibility for any remaining errors and inadequacies lies with the authors.

The Bangladesh Development Studies 206
as a backdrop to the subsequent assessment of Bangladesh’s performance with respect to the right to health. Section IV presents the overall record of progress in the health sector of Bangladesh, with particular emphasis on the gender dimension of health and nutritional outcomes. An assessment of the performance of the health sector from the perspective of the rights-based approach to health is offered in Section V, focusing on equity, participation and accountability. 1 Section VI contains some concluding remarks.
II. THE HUMAN RIGHTS APPROACH TO HEALTH POLICY The human rights approach to health, which is grounded in international and
national human rights laws and declarations, provides clear and specific guidelines for promoting and protecting people’s right to health. The approach affirms the need to develop a comprehensive strategy for ensuring health for all, with special emphasis on the most vulnerable groups in the society, and to do so in a manner that ensures effective participation of the society in the formulation of the strategy and transparent accountability of those responsible for implementing it. This section examines Bangladesh’s human rights commitments in health as well as the distinguishing features of the rights-based approach to health policy.
Bangladesh’s Human Rights Commitments in Health The constitution of Bangladesh mandates that “it shall be a fundamental
responsibility of the state to attain, through planned economic growth, a constant increase of productive forces and a steady improvement in the material and cultural standard of living of the people with a view to serving its citizens: a) the provisioning of basic necessities of life, including food, clothing, shelter, education and medicine.” The government of Bangladesh, since independence, has been investing substantially in the strengthening of health and family planning services in the country, giving special allocation to the population that resides in the rural areas. The main thrust of the health programmes has been the provision of primary health care (PHC) services which has been recognised as a key approach to attain “Health for All by the year 2000.” Bangladesh has accepted the goal and reiterated her political and social commitment to achieve it based on the Primary Health Care Strategy declared in Alma-Ata in 1978.
Bangladesh ratified the International Covenant on Economic, Social and Cultural Rights (ICESCR) Covenant in 1999, which has reinforced its obligation to provide adequate health care for its citizens. With its adoption of several UN
1 For earlier assessments of the health sector in Bangladesh from the perspective of human rights, see Osmani (2006) and Rahman (2006).
206

Chowdhury & Osmani: Achieving the Right to Health 207
declarations such as those adopted in the World Summit for Sustainable Development (WSSD), International Conference on Population and Development (ICPD), the World Summit for Children, Habitat II, World Food Summit, the Fourth World Conference on Women (FWCW) and so on, Bangladesh has agreed to achieve the quantitative targets set within a given time period. Bangladesh is also committed to achieving the universally agreed goals in specific areas e.g. food security, health and education as set out in the Declarations of various world summits and the Millennium Development Goals (MDGs).
Major Elements of the Rights-Based Approach to Health Policy In order to bring the human rights perspective explicitly into health policy, it is
essential that the policy regime satisfies certain conditions that are central to the notion of human rights—for example, equity, non-discrimination, participation and accountability. As an organisational device, these conditions can be discussed under three components of the policy regime—viz., (i) the policy formulation process; (ii) contents of policies; and (iii) monitoring of implementation.2
The Policy Formulation Process The process of policy formulation in health needs to be participatory in nature,
particularly to reflect the voices of the population groups who are affected, directly or indirectly, by such policies. It needs to be recognised, moreover, that effective participation requires empowerment of the citizens, particularly the poor and the deprived sections, which can come through a process of building awareness by providing access to education and social development and fulfilling other civil and political rights. It is important, therefore, for the policy formulation process to take into account the realities and adopt appropriate forms of participation (e.g. direct participation at the local level or through representatives, involvement of the CBOs, NGOs and the civil society or other practical mechanisms) in specific contexts.
The policy formulation process also needs to address the issues related to progressive realisation of rights. In view of resource constraints, the right to health in a country like Bangladesh can only be fulfilled over a period of time in a progressive manner. However, in order to ensure that progressive realisation does not become a cover to hide negligence and lack of effort, the government needs to (i) develop and implement a time-bound plan of action to spell out when and how the full rights to health will be realised; (ii) lay down periodic (e.g. annual) targets to monitor the success of the State in moving towards realisation of the goals; and (iii) spell out clearly the mechanisms to ensure the accountability of the State.
2 See Osmani (2000, 2005). See also Osmani’s contribution in this volume.
207

The Bangladesh Development Studies 208
Contents of Policies The policy contents of the rights-based approach to health need to be guided by
the human right norms. These norms affirm that health is a fundamental right indispensable for the exercise of other human rights. However, the right to health is not to be understood as the right to be healthy: the state cannot provide protection against every possible cause of ill health.3 The right to health entails the right to the enjoyment of a variety of facilities, goods, services and conditions necessary for the realisation of the highest attainable standard of health. The right includes rights to both healthcare and the underlying determinants of health, including access to potable water, adequate and safe food, adequate sanitation and housing, healthy occupational and environmental conditions, and access to health-related information and education.
In drafting article 12 of the Covenant on Economic, Social and Cultural Rights, the Third Committee of the United Nations General Assembly did not adopt the definition of health outlined in the preamble to the constitution of WHO, which conceptualise health as “a state of physical, mental and social well being and not simply the absence of disease or infirmity.” However, the reference in article 12.1 of the Covenant to “the highest attainable standard of physical and mental health” is not confined to the right to the health care. On the contrary, the drafting history and the expressed wording of article 12.2 acknowledge that the right to health embraces a wide range of socio-economic factors that promote conditions in which people can lead healthy life, and extends to the underlying determinants of health, such as food and nutrition, housing, access to safe and potable water and adequate sanitation, safe and healthy working conditions, and a healthy environment.
Such a broad interpretation of the right to health implies that health is more than a medical or scientific issue. Its content, delivery and outcomes extend far beyond the confines of the ministry of health. This basic point has been stressed as the true starting point for sustainable partnership for health development in the 21st century.
The right to health contains both freedoms and entitlements. The freedoms include the right to control one’s body, including reproductive health, and the right to be free from interference, such as freedom from torture and non-consensual medical treatment. The entitlements include a system of healthcare and protection that is available, accessible, acceptable, and of good quality. Thus, the right to health implies that functioning public health and health care facilities, goods and services are available in sufficient quantity within a state. It also means that they are
3 The contents of the right to health, as spelt out in various human rights instruments, are discussed at length in OHCHR (2006).
208
Chowdhury & Osmani: Achieving the Right to Health 209
accessible to everyone without discrimination. Accessibility has a number of dimensions, including physical, informational and economic accessibility. Thus, information accessibility includes the right to seek, service and impart information concerning health issues, subject to the right to have personal health data treated with confidentiality. Economic accessibility means that health facilities, goods and services must be affordable for all. Further, all health facilities, goods and services must be acceptable, i.e. respectful of medical ethics and be culturally appropriate and of good quality.
According to the international human rights law, the generic right to health encompasses a number of more specific health rights including the right to maternal, child and reproductive health; the right to healthy and safe workplace environments; the right to prevention, treatment and control of diseases; and the right to health facilities, goods and services.
Monitoring of Implementation The process of monitoring and evaluation of health policy needs to possess,
apart from the traditional elements, some mechanisms such that the State, as the duty-bearer, can be made accountable for its performance. Of necessity, the process of ensuring the accountability must be participatory in nature involving procedures to hold the State accountable for each element of its duties, viz., the duty to respect, the duty to protect and the duty to fulfil. Along with the mechanisms to ensure both internal and external accountability, it is also important for the rights-based monitoring to assess the culpability of the State in the case of failure to adopt and implement appropriate policies.
We shall assess the performance of the health sector in Bangladesh (in section V) in the light of the characteristics of the human rights approach discussed above, after setting out the framework of the healthcare system in Bangladesh (in section III), and describing the quantitative record of progress achieved in the sphere of health (in section IV).
III. THE HEALTH CARE SYSTEM OF BANGLADESH
The healthcare system in Bangladesh is discussed here in three parts. The first part presents the policies and programmes that have defined the framework within which the health sector has operated since independence. The second part describes the availability of health facilities and medical personnel, and its trend over time. The third part looks at the size and pattern of expenditure on health, with a special focus on public expenditure.
209
The Bangladesh Development Studies 210
Policies and Programmes for the Health Sector in Bangladesh Bangladesh did not have a coherent health policy for the first three decades
since independence in 1971. In the absence of a formal health policy, all health-related planning and programming were guided by the health sector components of successive Five Year Plans. The first National Health Policy of Bangladesh was approved by the Parliament in 2000, and the draft of a new policy has been under discussion since 2009. While the policy documents provided broad directions for action, the practical programmatic operations in the health sector have been guided by two major strategies adopted in the recent past with a view to co-ordinating donor and government funding on health-related matters under the sector-wide approach (SWAp)—viz. the Health and Population Sector Programme (HPSP) (1998-2003) and its successor the Health, Nutrition and Population Sector Programme (HNPSP) (2003-2010).4
At the time of independence, there were three principal problems related to the health status of the population: overpopulation, malnutrition and high incidence of communicable diseases. The First Five Year Plan (1973-1978) of Bangladesh recognised the quantitative and qualitative inadequacy of existing health facilities and the need to develop health delivery service system so as to benefit the entire population, particularly the common man. The plan recognised that much of the morbidity is preventable and that the health services should have a pronounced preventive bias. A stated objective of the health sector plan was to create a rural health infrastructure for providing integrated and comprehensive health services, including maternal and child health (MCH) services at the Thana Health Complex (THCs) and Rural Health Centres (RHC) or sub-centres in each rural union. In order to increase access to safe water and improve environmental sanitation, the plan provided for sinking tubewells in rural areas with community involvement and for water related latrines. Meanwhile, the first population policy was adopted in 1976, whose main strategy was to provide comprehensive health and family planning services through clinics and field workers, with a strong emphasis on doorstep services to rural women.
The Second Five Year Plan (1980-85) continued the efforts of the First Plan with two additional features. First, it encouraged the private sector and the NGOs to share some responsibilities for reaching healthcare services to the masses. As a result, private sector facilities started rising rapidly, especially after the government relaxed the existing restrictions on private laboratories, clinics and hospitals (Khan 1996). Second, the Plan sought to make Primary Health Care (PHC) the main focus 4 For lucid exposition of the evolution of health policy and programmes and policies in Bangladesh, see, among others, Osman (2008) and BHW (2010).
210

Chowdhury & Osmani: Achieving the Right to Health 211
of health sector activities, with a view to ensuring at least a minimum level of healthcare to all.
The Third Five Year Plan (1985-90) added a new dimension in health services by emphasizing Maternal and Child Health (MCH) as a means of population control. This started a process of integration between health and population sector activities. As part of this integration, a new range of programmes such as the Expanded Programme on Immunization (EPI), vitamin A distribution, and control of diarrhoea were intensified. The Fourth Five Year Plan (1990-95) continued with the two-pronged emphasis on Primary Health Care (PHC) on the one hand and Mother and Child Health (MCH) on the other.
The Fifth Five Year Plan (1997-2002) introduced for the first time a sector-wide approach (SWAp) to health sector programming in the form of the Health and Population Sector Strategy (HPSS) adopted in 1997, which fed both into the Fifth Plan and the first National Health Policy in 2000. The operational plan of HPSS, called the Health and Population Sector Programme (HPSP), was launched in 1998 for duration of five years. HPSP represented a major shift in the government’s approach to the provision of health care. A number of reforms with far-reaching consequences were envisaged:
• Transition from a vertically integrated but horizontally segregated project-based approach towards a sector-wide approach in which all sectoral projects were planned in an integrated manner so as to complement each other and to derive the synergies involved.
• Unification of the health and family planning wings of the Ministry of Health and Family Welfare (MOHFW) so as to avoid duplication of Mother and Child Health (MCH) services and to ensure efficiency gains by offering a combined package of health and family planning.
• Introduction of an Essential Service Package (ESP)—containing five basic maternal, child and public health services—to be delivered from one single service point in the spirit of “one-stop shopping.” The ESP package included child health services, limited maternal health care, family planning, control of communicable diseases, and a programme for behavioural change. The package was designed to absorb 60-70 per cent of the combined health budget, and its delivery was envisaged through facilities at upazila level and below, supported by the construction of a large number of “one stop” community clinics throughout the rural landscape. The intention was to make it easier for a household to access health services by enabling all its members to meet their needs in one single visit, instead of requiring different members to go to different places at different times for their
211

The Bangladesh Development Studies 212
respective problems. It also meant, however, the end of domiciliary services, which was the most preferred mode of reaching services to the grass-roots level in the pre-HPSP period.
• Construction of a Community Clinic for every 6,000 people, taking a wide range of healthcare services closer to the people.
On the expiry of HPSP in 2003, the government launched its successor the Health, Nutrition, and Population Sector Programme (HNPSP), conceived within the sector-wide approach. In many respects, HNPSP was a continuation of HPSP, but with a few notable additions and modifications which included:
• Strengthening the pro-poor focus of health sector programming, for example, by allocating more resources to the poorer districts.
• Diversification of health sector financing, involving a shift from the government’s role as a “provider” to a “purchaser” of services and establishing public-private partnership for providing health care.
• Adopting demand-side financing options (DSF) with the objective of stimulating demand for essential services, especially by the poor and the marginalised groups, by subsidising the cost of drugs, tests, and transport to the health facility. It also includes a voucher scheme for pregnant women to enable them to access private sector facilities for institutional delivery.
• Reversing the unification of the health and family planning wings of the Ministry of Health and Family Welfare, with a concomitant de-emphasis on the fixed-point one-stop service introduced by HPSP and partial return to the earlier practice of domiciliary services.
The first National Health Policy that was introduced in 2000, imbued with the same philosophy as embodied in the HPSS of 1997, contained 15 goals, 10 policy principle and 32 strategies. The major goals were as follows:
1. Make basic health services accessible to all, particularly the poor; 2. Reduce the rate of maternal and child mortality as well as maternal and
child malnutrition; 3. Ensure availability of doctors, nurses and medical equipment required to
provide services at upazila and union levels; 4. Make health services accountable and cost-effective; 5. Increase the effectiveness and accessibility of family planning programme,
especially by the poor.
The key policy principles adopted for the purpose of achieving these goals included the following: (1) primary health care services to all must be ensured, (2)
212
Chowdhury & Osmani: Achieving the Right to Health 213
equity in the provision of healthcare, (3) decentralisation of healthcare management, (4) stakeholder participation in planning and management, and (5) public-private partnership in the provision of healthcare.
For all its lofty ideas, the Health Policy of 2000 soon got into trouble primarily because of bureaucratic resistance to the idea of merging the health and family planning wings of the Ministry of Health and Family Welfare. A degree of integration did occur initially at the upazila level and below, where the family planning officials had lower ranks compared to their health counterparts and were as such easier to be subsumed within a unified set up. But higher ranked family planning officials at the district level and above refused to yield. When a new political government took power in 2001 under the leadership of Bangladesh Nationalist Party (BNP), the disgruntled bureaucrats lobbied with the politicians to overturn the unification, and succeeded in doing so by taking advantage of the culture of antagonistic politics that had plagued the country ever since democracy returned in 1991. Since the Health Policy (and its operational tool, HPSP) was introduced by the previous Awami League government, the new BNP government was not at all averse to the idea of undoing what had been done in the previous regime.
The medical profession, by contrast, was strongly in favour of unification on the grounds of both efficiency in service delivery and the prospect of enhanced importance of doctors, so much so that two factions of doctors, loyal respectively to the two major political parties, urged in one voice to proceed with unification (BHW 2010). The donors too were opposed to the reversal of unification—after all HPSP was very much their baby—to the extent that the World Bank withdrew support to the health sector for a brief period to express its disapproval. The opponents of unification did make an intellectual case for their position by arguing that the replacement of domiciliary services provided by family planning officials with a fixed point integrated service would undermine the campaign to reduce fertility and improve maternal health since rural women might refuse to travel to clinics seeking advice on reproductive health in general and contraception in particular. Before introduction of the HPSP in 1998, the modality of service delivery was doorstep services. Bangladesh’s success in health and family planning was then widely acclaimed by the international community. It has been argued that the progress in family planning programme was interrupted by sudden shift in the service delivery system introduced by HPSP. 5 Regardless of the merit of this argument, however, what won the day in the end was the confluence of short-
5 See Barakat (2002) for more on this debate.
213
The Bangladesh Development Studies 214
sighted self-interest of disgruntled bureaucrats and vengeful politicians. The Health Policy, and with it the HPSP, was soon scuttled.
When HNPSP was launched in 2003 to replace HPSP, it retained, and even enhanced, many of the features of the earlier programmes, except for the proposal for unification, which was firmly jettisoned. One unfortunate casualty of this exception was the idea of Community Clinics, which many thought would be an excellent institutional mechanism for bringing a wide range of essential health services to the easy reach of the rural poor in an efficient and participatory manner (since the Clinics were supposed to be managed by local communities). The tension that was generated in the tussle over unification prevented the preparation of a new coherent Health Policy that would command wide support. A draft policy was formulated in 2006 by the BNP government, which was revised in 2008 by the care-taker government, but the policy never materialised. The Awami League govern- ment that returned to power in 2009 soon formulated a new draft policy, with a renewed focus on community clinics. The draft is still in the stage of consultation, and what fate awaits the process of consultation—whether it leads to the adoption of a widely accepted coherent policy or gets mired into political tussle like its predecessors—remains to be seen.
Nutrition Projects and Programmes The first major nutrition project launched in Bangladesh was the Bangladesh
Integrated Nutrition Programme (BINP), which commenced in 1995, with the help of World Bank funding, and closed in 2002. Its successor, called the National Nutrition Programme (NNP), was initiated in 2004 and is still ongoing in conjunction with the Health, Nutrition and Population Sector Programme (HNPSP). BINP was modelled after the celebrated Tamil Nadu Integrated Nutrition Project (TINP), at the heart of which was nutritional counselling with a view to changing behaviour. Unfortunately, however, BINP was unable to replicate the success of its role model.
The project had three inter-related objectives:
(a) To improve the capacity of national level nutrition institutions in Bangladesh in the areas of advocacy, analysis of causation and consequences of malnutrition, policy advice, operational research, and operational support of national programmes;
(b) To improve the capacity of communities, households and individuals in the project areas to better understand their nutritional problems in practical terms and take appropriate actions to address them at their own level;
214

Chowdhury & Osmani: Achieving the Right to Health 215
(c) To improve the nutritional status of the population in the project area, with particular emphasis on children and pregnant and lactating women.
These goals were to be achieved through three types of activities: • The most important activity was embodied in the Community-Based
Nutrition Component (CBNC), which used growth monitoring as a framework for nutritional counselling and targeted supplementary feeding for children aged under 24 months, and for pregnant women.
• The next in importance was national nutrition activities, including institution building, operational research, and monitoring and evaluation.
• The third component was inter-sectoral nutrition activities, i.e., programmes from other sectors to improve nutrition, such as home gardening and poultry raising.
Through the CBNC, the project sought to build a partnership between community nutrition promoters and women from community who help mothers identify the causes of malnutrition in their children. The focus of counselling was on care practices and prevention of malnutrition before, during, and after pregnancy. The nutrition promoters also worked with women to help them recognise and overcome gender asymmetries such as intra-household allocations of food that meant that women were served last and the least. The project was launched as a pilot scheme—in 59 upazilas out of a total of 464, covering some 12 per cent of the country’s population.
Assessment of the impact of BINP has been a matter of intense controversy, with some evaluations claiming significant success, while others showing little effect.6 World Bank, the major sponsor, itself concluded with a negative tone in its Project Performance Appraisal Report (PPAR) at the conclusion of the project. After reviewing the available evidence, the Report came up with the following assessment of CBNC, the most important component of the project.
“Implementation began slowly; service delivery at the community level was delayed by one year. However, once it began, impressive participation levels were achieved, and the monitoring system showed large reductions in severe malnutrition. But evidence from the mid-term evaluation and, even more so the endline study, showed the project to be having less impact than had been thought; an impact that was certainly well below target levels. Pregnancy weight gain met 6 For a sample of this controversy, see, among others, INFS (1999), MOHFW (2002), Karim et al. (2003), Save the Children (2003), Haider et al. (2004), Hossain, Duffield and Taylor (2005), White (2005), World Bank (2005a, 2005b) and White and Masset (2007).
215

The Bangladesh Development Studies 216
the project target, but this was also achieved in the control areas, so that only a small gain can be attributed to the project, and too little to make a large difference to the prevalence of low birth weight, which fell by less than targeted. Outcome data were not collected on anemia and Vitamin A and iodine disorders, though use of mineral supplements did increase in the project area. The CBNC thus had some success in implementation but failed to achieve its objectives in terms of nutritional outcomes” (World Bank 2005b, p.ix).
Despite the negative assessment by the World Bank and the fierce controversy in the academic community surrounding the impact of the project, the government went ahead with a scaled up version of the project under the name National Nutrition Programme (NNP), launched in 2004. By the end of 2008, the project had expanded to 109 upazilas, covering about 25 per cent of the country’ population, with the plan to expand it further to another 64 upazilas by the middle of 2009.
The objectives of NNP are similar to those of BINP—viz. to achieve sustainable improvement in birth-weight of children and weight gain of pregnant women and overall nutritional status of vulnerable groups through adoption of expected behavioural change in individuals and households involving the local communities. The programme focuses on Area Based Community Nutrition (ABCN) interventions. The major difference with BINP is that the ABCN interventions have been contracted out to NGOs, working with their own supervision and monitoring mechanisms. NNP has also tried to achieve some integration with HNPSP by implementing different programmes related to nutrition within the HNPSP, for example micronutrient supplementation (vitamin A and iron-foliate).The Government fulfils its supervisory role through Nutrition Management Committees at upazila, union and village levels. Within the villages, Community Nutrition Promoters (CNP), known as Pushti apa (nutrition sister), provide services from a Community Nutrition Centre (CNC) established to serve an average of 1,200 people.
NNP is a truly large-scale nutritional intervention programme. By 2007, it came to covered 29 million people, which included about 5.8 million households, 11.9 million children under the age of 2, and 3 million pregnant women. Furthermore, growth monitoring promotion (GMP) covered 97 per cent of the target group in the project area.
As in the case of its predecessor BINP, however, the expected beneficial effects of the project are none too evident. The project itself claims to have reduced prevalence of low birth-weight, improved exclusive breastfeeding practice, and reduced moderate and severe malnutrition better than the national average. The validity of these claims is difficult to judge, however, since as a recent review notes
216

Chowdhury & Osmani: Achieving the Right to Health 217
authentic supervision and monitoring mechanism does not seem to exist at any level of NNP (IRT 2009a). The project’s own monitoring report is based on recording by NGO partners who are implementing most of the activities. Since these are not technically supervised or monitored and there are no external evaluations of the activities of the NGOs, the success claimed by them is open to question. Suspicion regarding the validity of the claims is further accentuated by the nature of some of the data generated by the project. For example, as the aforementioned review notes: (a) infant mortality rates turn out to be 3 times lower than the national average, (b) the data on nutritional status show an increase in the problem despite the intervention, and (c) the monthly figures on growth monitoring show almost unchanged numbers month after month. (IRT 2009b).
Despite some uncertainty about the actual outcomes, it must be acknowledged that NNP provides a framework for large-scale nutritional intervention of potentially powerful consequences, as the success of its model the Tamil Nadu project shows, provided the impediments to successful implementation can be identified and addressed. Community involvement, partnership with NGOs and potential synergy with HNPSP are some of its strengths that can in principle be harnessed to combat the still massive problem of undernutrition in Bangladesh.
Immunisation The first large-scale programme of immunisation for children began in 1979.
Funded by UNICEF, the programme administered vaccines for tuberculosis, DPT, measles and polio, all to be administered by 12 months of age. But the provision was inadequate, vaccines were frequently not available; in consequence, very limited progress was made in raising coverage, which remained well below 5 per cent until the mid-1980s.
The real breakthrough came in 1985, with the launching of the Expanded Program of Immunisation (EPI) with financial support from several donors, mainly the Swedish International Development Agency (SIDA) and UNICEF, and technical support from WHO. 7 The programme was revised to include community-level delivery through outreach centres, bringing about very rapid increases in immunization rates toward the end of the decade. During the second part of the 1990s, just over half of all children were fully vaccinated by 12 months. While the percentage of children fully vaccinated did not increase much the percentage of
7 The reasons and processes behind the resounding success of the immunization programme have been analysed in Huq (1991), MOHFW (1997) and Chowdhury, Bhuiya and Aziz (1999), among others.
217

The Bangladesh Development Studies 218
those having no vaccination at all continued to decline, reaching less than 10 per cent by the end of the 1990s (World Bank 2005a).
In the early 2000s, immunisation continued to be provided in the rural areas through outreach centres, complemented by services at district and upazila-level hospitals, union-level clinics, annual campaigns, and catch-up days to reach children who had missed doses. National immunisation days were instituted during the 1990s to deliver two doses of polio vaccine a year. Immunisation was included under the Essential Services Package (ESP) developed for HPSP, and subsequently as part of Essential Service Delivery (ESD) under HNPSP, according to which immunisation was to be made available from community clinics. As a result of these efforts, as many as 75 per cent of children came to be fully immunized by 2007, a truly spectacular rise from the base of less than 5 per cent in the early 1980s (NIPORT, Mitra and associates and Macro International 2009).
Drug Policy Bangladesh has been one of the pioneers in formulating and implementing a
coherent drug policy in the face of massively powerful global pharmaceutical industry. By overcoming fierce opposition from vested interests, the Government of Bangladesh adopted the National Drug Policy (National Drug Control Ordinance 1982) in 1982, and updated and revised it in 2004 (MOHFW 2005).
The National Drug Policy played a critical role in improving the supply of quality essential drugs in Bangladesh at an affordable price (Islam 1999). The Policy prepared an Essential Drug List (EDL), which initially included 150 items (45 for rural PHC facilities) with controlled prices, which was later reduced to 117 in 1993. The EDL has recently been revised to reflect advances in medical science and now contains 209 drugs.
The Drug Policy has been instrumental in stimulating the development of the pharmaceutical industry in Bangladesh and in raising the market share of local manufacturers (Reich 1994). With an annual average growth rate of about 17 per cent, pharmaceuticals have been one of the fastest growing industries in the country, and are now emerging as the second largest exporter after readymade garments (Begum 2007). This expansion has been driven mainly by local manufacturers, thanks to the incentives provided by the Drugs Policy. As a result, the relative market shares for the local and foreign producers have been completely reversed. In 1980, eight multinational companies manufactured 75 per cent of all products (by value); by contrast, it is the local pharmaceuticals who now claim a market share of more than 75 per cent. Out of the top ten pharmaceutical companies in the country at present, eight are local.
218

Chowdhury & Osmani: Achieving the Right to Health 219
The Drug Policy also stimulated the production of essential drugs by requiring all manufactures that 60 per cent of production capacity should be devoted to producing medicines under the Essential Drugs List (EDL). As a result, the local pharmaceutical industry is now capable of producing all the 209 items under the EDL and can meet the demands of the country. The prices of these have also been kept affordable by subjecting 117 out of 209 drugs listed under EDL to price control.
The combination of these policies with the requirement that raw materials must be procured from internationally competitive markets has resulted in a substantial decline in the prices of the essential drugs in real terms (Ahmed 2004). From 1981 to 1991, retail price of drugs increased by only 20 per cent, far below the level of overall inflation. This success in making a whole range of essential drugs affordable to the masses was especially welcome for a country in which the share of out-of-pocket expenditure by households in total national expenditure on health is exceptionally high by international standards (about 70 per cent).
Nevertheless, problems still remain with regard to the importation and/or manufacture of substandard, counterfeit, and ineffective drugs. In addition, inappropriate drug information, irrational prescribing and inappropriate dispensing practices continue to plague the health system.8
Availability of Health Care Facilities Provision of health care
The health care system in Bangladesh is composed of a wide range of public and private providers.9 In fact, Bangladeshis can obtain health services from several sources. Apart from government service, there are traditional (Ayurvedi, Kabiraji) and homeopathic providers, NGOs and other non-profit facilities, and qualified and unqualified drug sellers. Additionally, modern private care is provided by qualified practitioners and government doctors engaged in private practice.
The location and service mix offered by public and private providers varies by the level of urbanisation. The tertiary and advanced services are offered by both public and private providers in the major metropolitan areas. The secondary level services are offered at the district headquarter level, and the primary level service is offered at the administrative levels of upazilas. There are generally no in-patient and specialised services below the upazila level. A large majority of the services at 8 See BHW (2010) for a balanced discussion of the remaining problems of governance in drug administration. 9 For good overviews of the healthcare system in Bangladesh, see, inter alia, World Bank (2003a, 2005a, 2005c), W. Mahmud (2008) and Osman (2008).
219

The Bangladesh Development Studies 220
the village level are offered by private individuals, trained and untrained health practitioners and pharmacists. The myriad of health service providers in Bangladesh can be classified into three broad groups—public, private and the NGOs. While there is some overlap among them, each of them provides essentially different types of services. The public provider, i.e., the government sector provides both preventive and curative service, the private sector provides mainly curative service, and the NGO sector provides mainly preventive service and some basic care.
Of the three types, public provision is by far the most important in terms of availability of physical infrastructure and other resources. The government health system is structured as a hierarchical pyramid with five layers: three at the primary, one at the secondary, and one at the tertiary level. At the base are ward-level Health Assistants (HA) and Family Welfare Assistants (FWA), serving a population of about 6,000 to 7,000 people, performing home visits and working from a Community Clinic (where operational). Services provided at this level consist of mainly ESP (Essential Services Package), MCH (mother and child health) and FP (family planning), combined with limited curative care. The next level is the Union Health and Family Welfare Centre (UHFWC), staffed by three paramedics, sub-assistant Community Medical Officer, Family Welfare Visitor, and Pharmacist, providing family planning, maternal and child health services and some curative care. Some UHFWCs are staffed and equipped for normal deliveries and obstetric first aid and offer adolescent health services. The next higher level is Upazila Health Complex (with31/50 hospital beds), which serves as the first-level referral level facility and provides outpatient, general health and MCH services plus in-patient care. Above this level are the district hospitals, and on top of them are the tertiary and teaching hospitals in large cities.
Although the health system pyramid in principle covers the entire population, actual facilities are relatively thin at lower levels. Thus, while the district towns are all covered; and most of the upazila headquarters are covered too (as of April 2009, 4,13 upazilas out of a total of 481 had a health complex), at the next level below there were only about 1,300 Union Health and Family Welfare Centres for a total of 4,403 unions, and out of 20,000 wards only about a half had a Community Clinic.10
There has been a notable expansion in the number and availability of health service institutions as well medical personnel over the last decades. Between 1975 and 2007, the number of Government hospitals has increased from 131 to 670 and the number of private beds has increased from 15,452 to 33,818. That is, the number of government hospitals has increased nearly five-fold during the last quarter century, while the bed strength has more than doubled. This divergence between the 10 The figures in this paragraph are quoted from IRT (2009a, p. xiii.).
220
Chowdhury & Osmani: Achieving the Right to Health 221
rates at which hospitals and beds have expanded demonstrates that in recent decades the government has laid greater stress on expanding small-scale hospital facilities for semi-urban and rural areas.
In addition, private clinics and hospitals are being set up at a rapid pace. Their number has grown from about 150 in the early 1980s to over 2,200 at present, thus outnumbering public hospitals by a huge margin. Since private clinics tend to be smaller in size, however, the difference in the number of beds is much smaller than the difference in the number of hospitals. Currently, almost half of hospital beds are accounted for by private clinics—up from only one-sixth in the early 1980s.
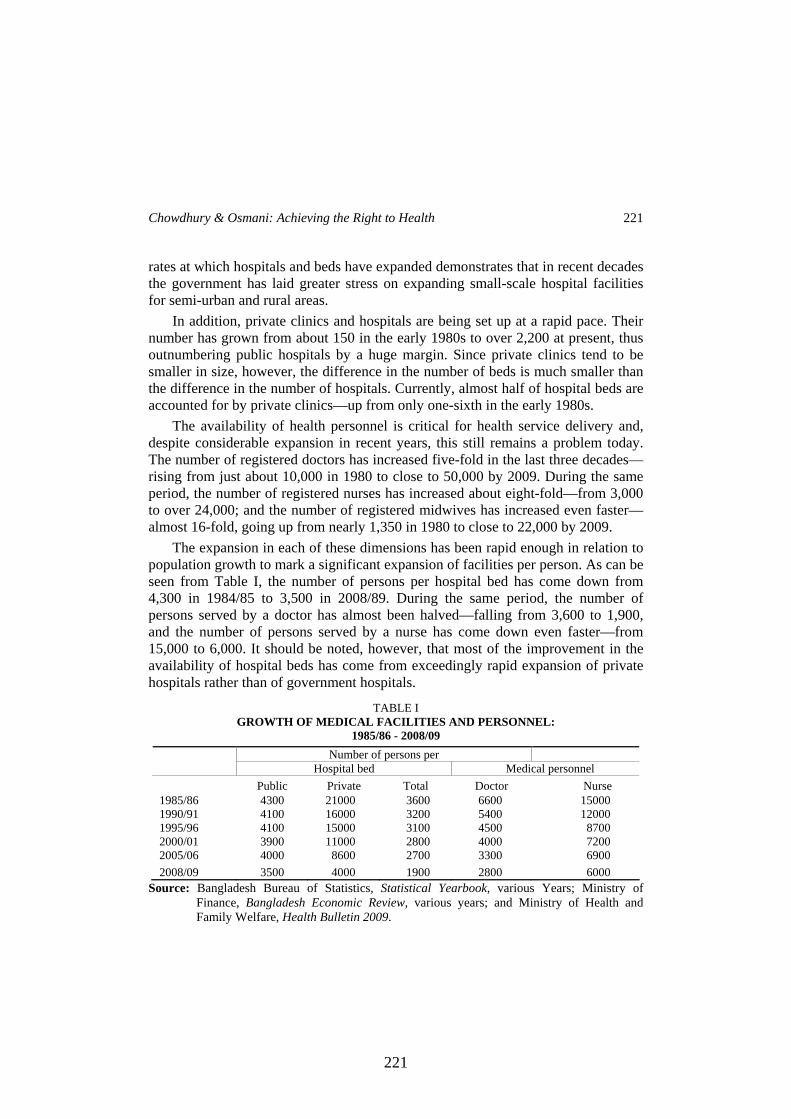
The availability of health personnel is critical for health service delivery and, despite considerable expansion in recent years, this still remains a problem today. The number of registered doctors has increased five-fold in the last three decades— rising from just about 10,000 in 1980 to close to 50,000 by 2009. During the same period, the number of registered nurses has increased about eight-fold—from 3,000 to over 24,000; and the number of registered midwives has increased even faster— almost 16-fold, going up from nearly 1,350 in 1980 to close to 22,000 by 2009.
The expansion in each of these dimensions has been rapid enough in relation to population growth to mark a significant expansion of facilities per person. As can be seen from Table I, the number of persons per hospital bed has come down from 4,300 in 1984/85 to 3,500 in 2008/89. During the same period, the number of persons served by a doctor has almost been halved—falling from 3,600 to 1,900, and the number of persons served by a nurse has come down even faster—from 15,000 to 6,000. It should be noted, however, that most of the improvement in the availability of hospital beds has come from exceedingly rapid expansion of private hospitals rather than of government hospitals.
TABLE I GROWTH OF MEDICAL FACILITIES AND PERSONNEL:
1985/86 - 2008/09 Number of persons per
Hospital bed Medical personnel Public Private Total Doctor Nurse 1985/86 4300 21000 3600 6600 15000 1990/91 4100 16000 3200 5400 12000 1995/96 4100 15000 3100 4500 8700 2000/01 3900 11000 2800 4000 7200 2005/06 4000 8600 2700 3300 6900 2008/09 3500 4000 1900 2800 6000
Source: Bangladesh Bureau of Statistics, Statistical Yearbook, various Years; Ministry of Finance, Bangladesh Economic Review, various years; and Ministry of Health and Family Welfare, Health Bulletin 2009.
221

The Bangladesh Development Studies 222
The Bangladesh Health Labour Market Study (BHLMS) 2003 estimated that the private sector healthcare personnel outweighed the public sector and that the traditional providers, in particular, constituted the bulk of healthcare providers in Bangladesh. According to this survey, 50 per cent of doctors, 42 per cent of nurses, 65 per cent of paramedics and all the traditional practitioners were in the private sector and the traditional providers outnumbered the qualified doctors by a factor of 12 to 1.
Despite the rapid expansion of facilities and personnel—both in absolute numbers and relative to population size—there remain a number of serious inadequacies. First, the number of qualified doctors and nurses per person is still quite low by international standards. According to the estimates made by WHO (2006), the density of medical workers (doctors, nurses, and midwives together) is only 0.58 per 1,000 people in Bangladesh, whereas international evidence suggests that the optimal density is about 2.5. The current density in Bangladesh is thus only about a quarter of what it should be. Second, the distribution of different categories of medical workers is completely lopsided. For example, according to international best practice, the nurse-doctor ratio should be 2:1, but the current situation in Bangladesh is completely the reverse—with twice as many registered doctors as nurses. Third, the availability of existing facilities is highly skewed towards the urban sector—with only about 16 per cent of qualified doctors practising in rural areas where the majority of population still live (BHW 2008). The problem is further aggravated by widespread absenteeism, which is especially severe in rural areas. An official study carried out in 2003-04 showed that 39 per cent of upazila health complexes lacked a residential medical officer and nearly 60 per cent of union sub-centres lacked a doctor (FMRP 2006).
Water and Sanitation Bangladesh has made tremendous strides in improving access to safe water.
According to a recent estimate, nearly 96 of all people drink water from either tube-well or piped water, which can be considered safe, compared to just 37 per cent in the early 1980s (BBS 2010). The biggest improvement in this regard occurred in the 1980s, so that by the early 1990s almost 90 per cent of households already had access to safe water (NIPORT, Mitra & associates and Macro International 1994). However, water related diseases remain the major cause of mortality and morbidity, because ‘safe’ is only a relative term; much of the water that is used for drinking purposes is not free from germs, and as a recent study shows more than 90 per cent of households drink completely untreated water (NIPORT, Mitra & associates and Macro International 2009). Moreover, only 16 per cent of all households use
222

Chowdhury & Osmani: Achieving the Right to Health 223
tubewell or piped water for all domestic purposes, which is a further reason for the spread of waterborne diseases.
Sanitation coverage has also expanded, but not as much as safe water. According to a recent survey of the Bureau of Statistics, just over 40 per cent of all households had access to water-sealed latrines; more than 50 per cent had latrines that were not water-sealed, and about 7.5 per cent households had no latrines at all (BBS 2010).11 A comparison of Bangladesh Health and Demographic Surveys in successive years reveals, however, that most of the improvement in sanitation that has occurred in the recent past has taken the form of moving people away from open disposal of excreta to uncovered latrines rather than giving them access to truly modern sanitation (water-sealed). Thus, households with no access to latrines at all have come down from 30 per cent in 1993/94 to 7.5 per cent in 2007, but the proportion of households with access to modern sanitation has increased only marginally from 25 per cent to 29 per cent during the same period (NIPORT, Mitra & associates and Macro International 1994, 2009). At the same time, the proportion of households with uncovered latrines has gone up sharply from 45 per cent to 64 per cent.
While these figures mark a substantial improvement over the situation prevailing two to three decades ago, the absolute number of people without access to proper sanitary services is very high. This is especially true of slum dwellers in urban areas. For instance, even though three-quarters of all total investment in water supply and sanitation was concentrated in urban areas in the 1980s, slum dwellers and squatters had a relatively low level of service provision at the end of the decade —with less than 40 per cent having access to piped water supply, about 6-7 per cent to water sealed latrines and about 45 per cent to any pit latrine (BBS and UNICEF 1994).
A quantum jump in combating water-borne diseases was achieved in Bangladesh in the 1980s with the introduction and rapid dissemination of oral rehydration solution (ORS). In a pioneering move, the Bangladesh Rural Advancement Committee (BRAC), a multi-faceted non-governmental organisation, prepared a home-assembled oral rehydration solution (ORS) in collaboration with ICDDR,B to prevent death from diarrhoeal morbidity. In 1979, BRAC started to teach households around the country how to treat diarrhoea through the use of ingredients readily available at home and in the next year it launched a larger programme. By November 1990, BRAC had, as per its own data, educated 13
11 An alternative source shows, however, that only 29 per cent of households had access to modern improved sanitation, and only 22 per cent did so in rural areas (NIPORT, Mitra & associates and Macro International. 2009).
223

The Bangladesh Development Studies 224
million mothers on ways of preparing ORS. Evaluations of the programme by BRAC found that 80 per cent of the mothers retained the knowledge imparted to them about oral rehydration therapy (ORT) and that ORT was now a generally accepted part of the treatment of diarrhoea. BRAC’s teaching effort was supplemented by use of the communication media through radio and television, posters, advertising, etc. BRAC’s success with ORT has established the notion that NGOs are capable of undertaking programmes on a national basis, complementing government’s effort and that lay workers may be used to convey useful health information which can change social behaviour. In a recent survey, as many as 76 per cent of all children under five, who suffered from diarrhoea, were found to have been treated with ORS in 2007—up from 50 per cent in 1993/94 (NIPORT, Mitra & associates and Macro International 1994, 2009).
On the other side of the ledger, a particular problem that has marred all other achievements with respect to health and hygiene in Bangladesh is the emergence of arsenic-contaminated water. Detection of arsenic in ground water since the late 1980s has aroused widespread concern among the people of Bangladesh. The contamination occurs in different forms, organic and inorganic, and with different levels of toxicity. Humans are mainly exposed to arsenic through ingestion and inhalation. The arsenic issue was internationally recognised in 1995, when the first international conference on the subject was organised.
The Bangladesh Arsenic Mitigation and Water Supply Project (BAMWSP) reports that 29 per cent of the 4.9 millions tubewells tested using Aqua kit had arsenic contamination at or greater than 50 ppb (parts per billion). In 2004, 7 per cent of urban people and 9 per cent of rural people were found to be directly exposed to arsenic contamination above the safe level, with the poor people being exposed more than the average (NIPORT, Mitra & associates and Macro International 2005). The government has taken a number of steps to first contain and eventually eliminate the problem, beginning with the process of sealing the tubewells identified as containing contaminated water beyond the safe level. A recent survey has found that according to the respondents’ own perception, 74 per cent felt that they were drinking water safe from arsenic, 16 per cent were not sure, and 10 per cent knew that their drinking water was contaminated (BBS 2010). The fact that one in ten persons is knowingly drinking arsenic-contaminated water must be treated as a matter of serious concern.
Size and Pattern of Health Expenditure Recent estimates show that per capita spending in health is currently about $17
per year, of which 30 per cent is contributed by the public sector, about 6 per cent is accounted for by the civil society, and the remaining 64 per cent consists of out-of-
224

Chowdhury & Osmani: Achieving the Right to Health 225
pocket expenditure on a diverse range of small-scale private providers of modern and alternative services. Direct household expenditure on purchasing drugs from pharmacies amounts to $ 4 per head, far outstripping public expenditure of less than $1 per head on drugs (IRT 2009a, p.52).
The pro-proportion of out-of-pocket expenditure is exceptionally high in Bangladesh by international standards. The 65 per cent share from out-of-pocket sources compares with 35-60 per cent in other Asian developing countries such as China, Sri Lanka, Philippines and Thailand. In general, richer countries rely more on government taxation and social insurance funding for health care, but even in comparison with other low-income developing countries, a disproportionate share of the financing burden is placed on households (see HEU 2003).
There are a few more unusual features of the pattern of health expenditure in Bangladesh. First, Bangladesh is an outlier in the share of total national spending allocated to in-patient care. Bangladesh spends 14 per cent of recurrent expenditure on in-patient services compared with 25-40 per cent in other countries. This suggests that Bangladesh may be under-spending on in-patient care. Second, an unusually large proportion (46 per cent) of total spending is accounted for by expenditures on medical goods purchased from retail outlets (for the most part medicines).
A significant structural change has occurred over the recent period in the health sector as the private sector has come to acquire increasing dominance. The first national health accounts (NHA-1) prepared for 1996-97 showed that among all the health service providers, the largest market share, in terms of the value of services, belonged to the private drug retailers (46 per cent). Government services accounted for 33 per cent of total value provided, while private modern qualified providers accounted for 6 per cent and unqualified modern and traditional providers for 5 per cent of the total market share (HEU 1998).
Over the years, expenditure on account of all categories of providers has increased. However, in relative terms, or as proportion of total health expenditure (THE), public sector expenditure fell from 33 per cent in 1996-97 to around 26 per cent in 2001-02. During the same period, NGOs’ share increased from 3 per cent to over 6 per cent, and the share of private providers—comprising private clinics, diagnostic facilities, drug retail outlets, traditional providers, and others—increased from 64 per cent to 73 per cent. Retail expenditure on drugs continues to be a dominant activity, accounting for around 46 per cent of total expenditure in both 1997-98 and 2001-02 (HEU 2003).
The pattern of public expenditure on health in the last three decades is laid out in Tables II and III. Table II shows that in the three decades from 1980 to 2010, per
225

The Bangladesh Development Studies 226
capita public expenditure on the health sector has increased nearly three-and-a-half times in real terms—from an annual average of Tk. 62 per person during 1980-85 to Tk. 212 during 2006-10 (at 1995/96 prices). In dollar terms, this represents an even bigger increase—from $1.20 per person to $5.22 during the same period. The absolute amounts may seem small, but the increase seems quite impressive.
TABLE II PER CAPITA PUBLIC EXPENDITURE ON HEALTH: 1981-85 TO 2006-10
(PERIODIC AVERAGES)
1981-85 1986-90 1991-95 1996-00 2001-05 2006-10 At constant prices (Taka) Revenue expenditure 27 38 51 62 82 125 Development expenditure 35 29 56 75 73 87 Total expenditure on health 62 67 107 137 155 212 At dollar prices Revenue expenditure 0.52 0.83 1.17 1.47 1.80 3.10 Development expenditure 0.68 0.63 1.28 1.69 1.61 2.13 Total expenditure on health 1.20 1.46 2.46 3.16 3.41 5.22
Source: Bangladesh Bureau of Statistics, Statistical Yearbook, various years; Ministry of Finance, Bangladesh Economic Review, various years.
Note: Revenue expenditures are revised budget estimates, whilst development expenditures are actual figures, except for the figure for the year 2009-10 which was estimated from revised budget estimates on the basis of the difference between revised and actual estimates in earlier years.
Table III reveals, however, that the increase in public expenditure on health looks far less impressive when calculated as share of total public expenditure or as a proportion of GDP. In recent years, the health sector has received just under 7 per cent of total public expenditure—revenue and development expenditure combined. The most important point to note, however, is the prolonged stagnation of the share of budgetary expenditure devoted to health. In the decade from the first half of the 1980s to the first half of the 1990s, the share of health increased steadily from 5.1 per cent to 6.8 per cent of the total budget. But in the fifteen years since then, the share, if anything, has declined a little—to an average of 6.7 per cent during 2006-2010. It is also worth noting that the stagnation in the overall share of health has occurred as a result of falling share of development expenditure whilst the share of
226

Chowdhury & Osmani: Achieving the Right to Health 227
revenue expenditure has kept rising. One consequence of this trend is that the relative importance of revenue and development expenditure has reversed in the last decade. In the two decades from 1980 to 2000, development expenditure exceeded revenue expenditure, but the opposite is true in the decade since 2000.
TABLE III TREND OF PUBLIC EXPENDITURE ON HEALTH: 1981-85 TO 2006-10
(PERIODIC AVERAGES)
1981-85 1986-90 1991-95 1996-00 2001-05 2006-10
As percentage of total budgetary expenditure
Revenue expenditure 2.23 2.87 3.25 3.18 3.29 3.92 Development expenditure 2.88 2.22 3.53 3.65 2.94 2.74 Total expenditure on health
5.11 5.09 6.79 6.83 6.23 6.66
As percentage of GDP Revenue expenditure 0.26 0.33 0.40 0.42 0.46 0.55 Development expenditure 0.33 0.26 0.44 0.48 0.41 0.39 Total expenditure on health
0.59 0.59 0.84 0.90 0.87 0.94
Source: Bangladesh Bureau of Statistics, Statistical Yearbook, various years; Ministry of Finance, Bangladesh Economic Review, various years.
Note: Revenue expenditures are revised budget estimates, whilst development expenditures are actual figures, except for the figure for the year 2009-10 which was estimated from revised budget estimates on the basis of the difference between revised and actual estimates in earlier years.
Public expenditure on health accounted for just under one per cent of GDP during 2006-10. The relative stagnation in health expenditure is reflected in this statistic too. From 0.6 per cent of GDP in the early 1980s, public expenditure on health increased to 0.9 per cent in the second half of the 1990s, but there has hardly been any rise in this figure since then. Thus, the general picture that emerges is that while the share of health in public expenditure has increased over the last three decades, all the increase occurred before 2000. The last decade has seen relative stagnation in public expenditure on health, with the share of development expenditure losing out more than that of revenue expenditure.
Traditionally, a larger part of the government’s health budget has gone to service facilities at the upazila level and below. During the 1980s and 1990s about half of total expenditure on health was being spent on primary health care, which is
227
The Bangladesh Development Studies 228
provided mostly at these lower level facilities (MOHFW 1995). This proportion went up to 60-70 per cent in the late 1990s with the introduction of the ESP, which was highly successful in diverting more resources into primary level care, in focusing resource flows into vital services such as maternal care and in shifting resources from secondary and tertiary hospitals to lower-level facilities (MOHFW 2001). By 2001-02, approximately 60 per cent of the total health budget came to be channelled to these lower-level health facilities. In so far as these facilities are used mostly by rural people, who are on average poorer than the urban people, this pattern suggests a degree of vertical equity in the distribution of public spending. Moreover, the equity effect is reinforced by the fact that most of the services provided at these levels are in the nature of free primary health care and nutritional and family planning services, which are more pro-poor than the services provided at higher levels. 12 There is a worrying sign, however, that this pattern has been reversed in recent years. The share of resources going to the upazila level and below has declined from 60 per cent in 2001-02 to 51 per cent in 2003-04 and further to 42 per cent in 2005-06 (MOHFW 2008a). As a recent review of the ongoing Health, Nutrition and Population Sector Programme (HNPSP) has noted, “A key area of concern is the declining share of the budget going to upazila and below. The program needs to re-focus on those essential health, nutrition and population services. This would mean seeing the share of the budget allocated to upazila and below levels rising substantially, including on the service delivery—essential obstetric care, nutrition, MCI, and family planning” (MOHFW 2008b, p.7).
Comparison of per capita spending across districts reveals a mixed picture of horizontal equity. The overall distribution happens to be biased against the poorer districts in that the richer districts have traditionally enjoyed a higher per capita spending than the poorer ones. The redeeming feature, however, is that the poorest districts (those with poverty ratio of more than 48 per cent) have enjoyed a faster growth of spending than the richest ones (those with poverty ratio of less than 24 per cent). Thus, during the six-year period from 1990/00 to 2005/06, the growth of spending was 52 per cent in the poorest districts as against 24 per cent in the richest
12 Combining household income data from the Household Income and Expenditure Survey of 2000 with the health expenditure data from HEU (2003), Glinskaya (2005) has found that the ESP that is administered at upazila levels and below is the only item of government expenditure (along with primary education) that is strongly pro-poor—in the sense the poor receive a greater share of these subsidies than the non-poor. By contrast, overall public expenditure on health (and education) are not strongly pro-poor in the above sense; however, they are weakly pro-poor in the sense that they are distributed more equally than overall private expenditure.
228
Chowdhury & Osmani: Achieving the Right to Health 229
ones. However, this egalitarian tendency is tempered by the fact that the biggest growth of spending was enjoyed by the second richest districts (with poverty ratio between 24 and 29 per cent) (HEU 2007).
IV. TOWARDS ACHIEVING HEALTH FOR ALL IN BANGLADESH: A PROGRESS REPORT
Trends in Health and Nutritional Status The major indicators of health status show that Bangladesh has progressed
significantly in improving the health status of its people since independence, but most of the gain has been made in the last couple of decades. During the 1980s, the crude death rate (CDR) remained more or less static at around 10-12 per thousand, but since then it has come down sharply. The CDR has nearly been halved in the two decades since 1990—from 11.2 in 1990-91 to 6.0 in 2007-08 (Table IV). As in most aspects of standard of living, rural people have lagged behind their urban counterparts in the arena of health as well, as can be seen from the fact that the CDR for rural areas has remained consistently higher than in the urban areas. The redeeming feature, however, is that the rural CDR has declined faster than urban CDR, with the result that the rural-urban gap has steadily come down. In the early 1990s, the rural areas had an excess of nearly 3 deaths per thousand compared to urban areas; by 2007-08, this gap had been cut down by half to about 1.5 deaths per thousand (Table IV). Trends in life expectation at birth tell a similar story. In the last two decades, life expectation in Bangladesh has increased by nearly 11 years— going up from 56 years in 1990-91 to almost 67 years in 2007-08. The urban population has had a distinct advantage over their rural counterparts in terms of living longer, but the advantage has diminished over time—falling from an excess of almost 4 years in the early 1990s to just about 2 years in 2007-08 (Table IV). The overall decline in CDR, the rise in life expectation and the narrowing of the gap between rural and urban areas can be explained in terms of improved access to health services and increased awareness about preventive and curative health care that has increasingly encompassed the rural people as well.
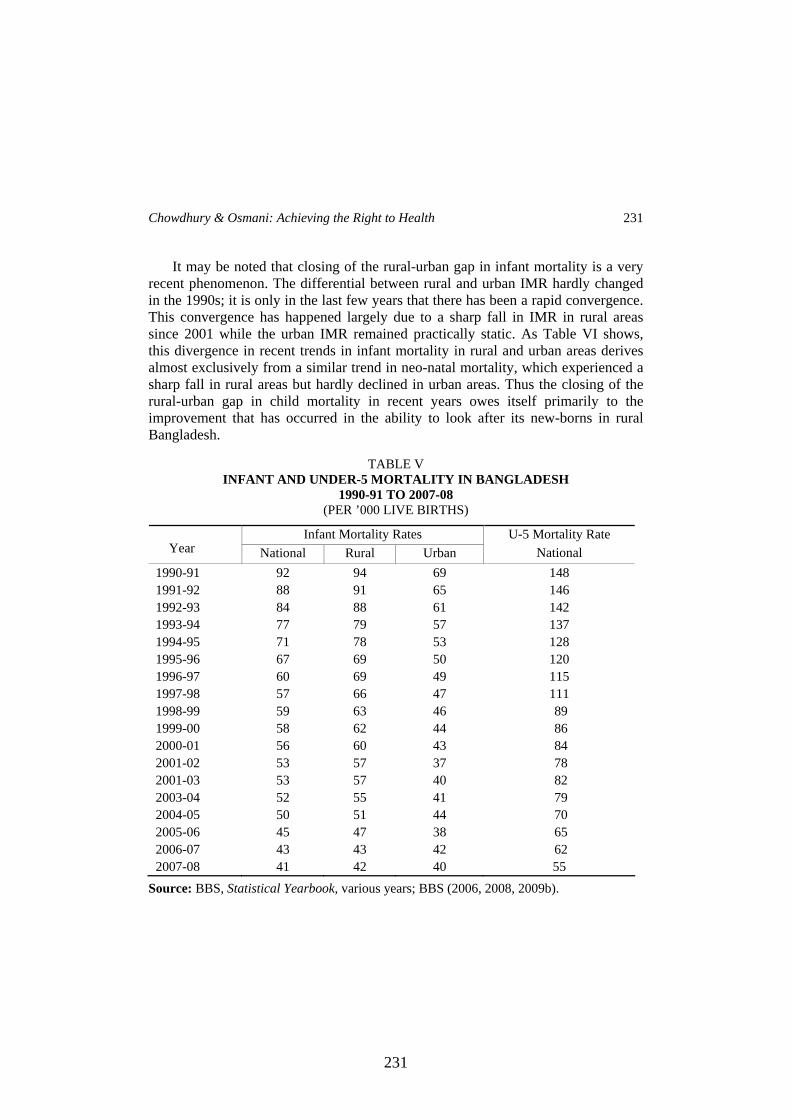
Perhaps the most important part of the decline in overall mortality, and the resulting increase in life expectation, can be attributed to an impressive decline in infant and child mortality in recent decades. Unlike the overall mortality rate (CDR), infant mortality rate (IMR) started to decline already in the 1980s—coming down from 112 per thousand live births in 1984-85 to 92 per thousand in 1990-91, and the rate of decline has accelerated since then. In the last two decades, infant mortality rate has been more than halved—from 92 per thousand in 1990-91 to around 41 in 2007-08. The decline in under-5 mortality rate during the same period has been
229

The Bangladesh Development Studies 230
even more impressive—falling from 148 live births in 1990-91 to 55 in 2007-08 (Table V).
Rural areas have had a distinctly higher infant mortality rate throughout the period under consideration, but the rural-urban differential has narrowed remarkably in recent years (Table V). Excess death of infants in rural areas compared to urban areas was at least 25 in the early 1990s; but by 2007-08 the differential had all but disappeared (amounting to just one or two excess deaths). As discussed below, a massive campaign of immunisation of children combined with widespread use of oral rehydration therapy against diarrhoeal diseases has helped bring about this remarkable improvement in child mortality throughout the country.
TABLE IV MORTALITY AND LIFE EXPECTATION IN BANGLADESH:
1990-91 TO 2007-08
Crude Death Rate (per ’000 people)
Life Expectancy at Birth
National Rural Urban National Rural Urban 1990-91 11.2 11.5 7.8 56.1 55.8 60.2 1991-92 11.0 11.3 7.5 56.3 56.0 60.5 1992-93 10.0 10.4 7.2 57.9 57.5 60.6 1993-94 9.3 9.3 7.1 58.7 57.7 60.0 1994-95 8.7 9.0 6.7 58.9 57.5 60.9 1995-96 8.2 8.8 6.5 60.1 58.2 61.2 1996-97 5.5 6.5 4.2 61.5 59.4 62.3 1997-98 5.1 5.4 3.7 61.5 60.2 63.2 1998-99 5.1 5.4 3.5 62.7 n.a. n.a. 1999-00 4.9 5.3 3.5 63.6 n.a. n.a. 2000-01 4.8 5.2 4.3 64.2 n.a. n.a. 2001-02 5.1 5.4 3.8 64.9 60.2 67.2 2001-03 5.9 6.2 4.7 64.9 64.4 67.6 2003-04 5.8 6.1 4.4 65.1 64.3 67.8 2004-05 5.8 6.1 4.9 65.2 64.3 67.9 2005-06 5.6 6.0 4.4 66.4 64.6 68.0 2006-07 6.2 6.5 5.1 66.6 66.0 68.1 2007-08 6.0 6.6 5.1 66.8 66.2 68.3
Source: BBS, Statistical Yearbook, various years; BBS (2006, 2008, 2009b).
230
Chowdhury & Osmani: Achieving the Right to Health 231
It may be noted that closing of the rural-urban gap in infant mortality is a very recent phenomenon. The differential between rural and urban IMR hardly changed in the 1990s; it is only in the last few years that there has been a rapid convergence. This convergence has happened largely due to a sharp fall in IMR in rural areas since 2001 while the urban IMR remained practically static. As Table VI shows, this divergence in recent trends in infant mortality in rural and urban areas derives almost exclusively from a similar trend in neo-natal mortality, which experienced a sharp fall in rural areas but hardly declined in urban areas. Thus the closing of the rural-urban gap in child mortality in recent years owes itself primarily to the improvement that has occurred in the ability to look after its new-borns in rural Bangladesh.
TABLE V INFANT AND UNDER-5 MORTALITY IN BANGLADESH
1990-91 TO 2007-08 (PER ’000 LIVE BIRTHS)
Infant Mortality Rates
Year National Rural Urban U-5 Mortality Rate
National 1990-91 92 94 69 148 1991-92 88 91 65 146 1992-93 84 88 61 142 1993-94 77 79 57 137 1994-95 71 78 53 128 1995-96 67 69 50 120 1996-97 60 69 49 115 1997-98 57 66 47 111 1998-99 59 63 46 89 1999-00 58 62 44 86 2000-01 56 60 43 84 2001-02 53 57 37 78 2001-03 53 57 40 82 2003-04 52 55 41 79 2004-05 50 51 44 70 2005-06 45 47 38 65 2006-07 43 43 42 62 2007-08 41 42 40 55
Source: BBS, Statistical Yearbook, various years; BBS (2006, 2008, 2009b).
231

The Bangladesh Development Studies 232
TABLE VI NEO-NATAL MORTALITY IN BANGLADESH: 2000-01 TO 2007-08
(PER ’000 LIVE BIRTHS)
Year National Rural Urban 2001 39 41 28 2002 36 39 24 2003 36 38 25 2004 36 37 27 2005 33 35 28 2006 31 32 27 2007 29 30 29 2008 31 31 30
Source: BBS (2006, 2008)
While improvement on the mortality front has been quite impressive, the success in overcoming the problem of malnutrition has been somewhat less so. Child nutrition surveys carried out during the last two decades do reveal some improvement, but not to the same extent as in the case of mortality decline. Two major sources of child nutrition data exist in Bangladesh namely, the Child Nutrition Surveys (CNS) of Bangladesh Bureau of Statistics (BBS) and the Bangladesh Demographic and Health Surveys (BDHS) carried out by Macro International with the help of local collaborators. The two sets of surveys differ slightly in coverage and methodology, but they display broadly similar trends.
CNS data show that in the two decades from 1985 to 2005, the proportion of malnourished children—as measured by the percentage of children who are underweight i.e., low weight for age—has come down from 71 per cent to 48 per cent (Table VII). Despite the improvement, it is alarming to note that almost half the children were malnourished by the most recent estimate. Whatever improvement has occurred owes itself almost entirely to the reduction in chronic malnutrition (as measured by stunting i.e., low height for age), which has declined from 68 per cent to 42 per cent during the same period, while the prevalence of acute malnutrition (as measured by wasting i.e., low weight for height) has remained fairly stubborn - falling only marginally from 15 per cent to 13 per cent.
232

Chowdhury & Osmani: Achieving the Right to Health 233
TABLE VII PREVALENCE OF CHILD MALNUTRITION IN BANGLADESH: 1985 - 2005
(% OF CHILDREN AGED 6-59 MONTHS)
National Rural Urban Underweight (low weight for age)
1985 70.9 72.0 62.3 1990 65.8 66.7 62.7 1992 68.3 69.8 57.2 1995 57.4 59.3 46.3 2000 51.0 52.6 41.8 2005 47.8 50.1 38.5
Stunting (low height for age) 1985 67.5 68.9 57.1 1990 64.6 66.7 58.3 1992 64.2 65.8 52.8 1995 51.4 52.8 42.9 2000 48.3 50.2 37.5 2005 42.4 44.9 32.5
Wasting (low weight for height) 1985 15.3 15.4 14.0 1990 14.4 14.7 14.0 1992 16.7 16.9 15.1 1995 16.6 17.2 13.3 2000 12.0 12.2 10.9 2005 12.7 13.1 10.8
Source: BBS (2007), Table 27, p.50. Note: All figures are based on NCHS 1977 GRS. Although BBS has started to use the new
revised WHO Growth Reference Standard (GRS) since 2005, for the sake of comparability with earlier years the figures for 2005 were re-estimated by BBS on the basis of NCHS 1977 GRS, which was the basis for earlier estimates. Also note that from 1985 to 2000, BBS Child Nutrition Surveys reported nutritional data for 6-71 months old children, whereas the 2005 survey refers to the 0-59 months (under-five) age-group, in line with common international practice. For the sake of comparability with the earlier years, BBS (2007) re-estimated nutritional data for all the years by considering only the 6-59 months old, the common set across all the years, and these are the ones presented in the table above.
The BDHS data span the decade from 1996/97 to 2007 (Table VIII). During this period, the proportion of underweight children went down from 56 per cent to 46 per cent - roughly a percentage point decline per year, which is almost exactly what
233

The Bangladesh Development Studies 234
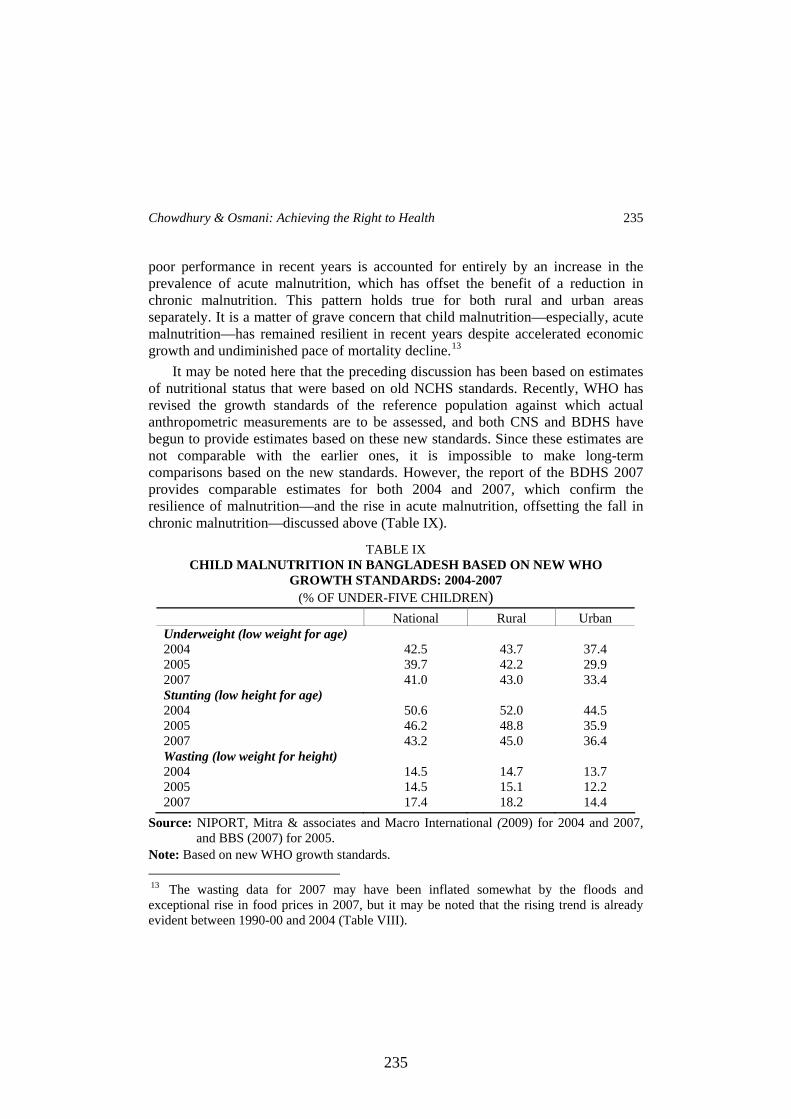
the CNS data also reveal for the decade between 1995 and 2005 (Table VII). But it is worth noting that, according to the DHS data, almost the entire improvement occurred in the 1990s, with hardly any improvement during the 2000-2007 period (Table VIII). Further analysis shows that there was some improvement in chronic malnutrition during the latter period, as the prevalence of stunting fell from 45 per cent in 2000 to 36 per cent in 2007, but acute malnutrition increased at the same time—from 10 to 16 per cent, with the result that overall malnutrition hardly improved.
TABLE VIII ALTERNATIVE ESTIMATES OF PREVALENCE OF CHILD MALNUTRITION
IN BANGLADESH: 1996/97 - 2007 (% OF UNDER-FIVE CHILDREN)
National Rural Urban Underweight (low weight for age) 1996-97 56.3 57.8 41.9 1999-00 47.7 49.2 39.8 2004 47.5 48.8 42.2 2007 46.3 48.1 39.7 Stunting (low height for age) 1996-97 54.6 56.2 39.4 1999-00 44.7 46.6 35.0 2004 43.0 44.3 37.6 2007 36.2 37.6 30.5 Wasting (low weight for height) 1996-97 17.7 18.2 12.8 1999-00 10.3 10.6 9.3 2004 12.8 13.2 11.5 2007 16.2 16.9 13.5
Source: NIPORT, Mitra & associates and Macro International (1997, 2001, 2005, 2009). Note: All figures are based on old NCHS 1977 standards. Since 2007, BDHS has started to use
the new WHO GRS; however, for the sake of comparability with earlier years, the report also provided estimates for 2007 based on the old NCHS 1977 standards. We have used these latter estimates, along with the earlier years’ estimates based on NCHS standards, in the table above.
The fact that there has been much less improvement in nutritional status in recent years compared to the second half of the 1990s is confirmed by the CNS data as well. Thus, while the proportion of underweight children fell by almost 6 percentage points between 1995 and 2000, it fell by just over 2 percentage points between 2000 and 2005 (Table VII). Moreover, as in the case of BDHS data, the
234
Chowdhury & Osmani: Achieving the Right to Health 235
poor performance in recent years is accounted for entirely by an increase in the prevalence of acute malnutrition, which has offset the benefit of a reduction in chronic malnutrition. This pattern holds true for both rural and urban areas separately. It is a matter of grave concern that child malnutrition—especially, acute malnutrition—has remained resilient in recent years despite accelerated economic growth and undiminished pace of mortality decline.13
It may be noted here that the preceding discussion has been based on estimates of nutritional status that were based on old NCHS standards. Recently, WHO has revised the growth standards of the reference population against which actual anthropometric measurements are to be assessed, and both CNS and BDHS have begun to provide estimates based on these new standards. Since these estimates are not comparable with the earlier ones, it is impossible to make long-term comparisons based on the new standards. However, the report of the BDHS 2007 provides comparable estimates for both 2004 and 2007, which confirm the resilience of malnutrition—and the rise in acute malnutrition, offsetting the fall in chronic malnutrition—discussed above (Table IX).
TABLE IX CHILD MALNUTRITION IN BANGLADESH BASED ON NEW WHO
GROWTH STANDARDS: 2004-2007 (% OF UNDER-FIVE CHILDREN)
National Rural Urban Underweight (low weight for age) 2004 42.5 43.7 37.4 2005 39.7 42.2 29.9 2007 41.0 43.0 33.4 Stunting (low height for age) 2004 50.6 52.0 44.5 2005 46.2 48.8 35.9 2007 43.2 45.0 36.4 Wasting (low weight for height) 2004 14.5 14.7 13.7 2005 14.5 15.1 12.2 2007 17.4 18.2 14.4
Source: NIPORT, Mitra & associates and Macro International (2009) for 2004 and 2007, and BBS (2007) for 2005.
Note: Based on new WHO growth standards. 13 The wasting data for 2007 may have been inflated somewhat by the floods and exceptional rise in food prices in 2007, but it may be noted that the rising trend is already evident between 1990-00 and 2004 (Table VIII).
235

The Bangladesh Development Studies 236
Yet another worrying feature on the malnutrition front is that, unlike in the case of mortality decline, the rural-urban differential in child malnutrition has remained relatively stubborn over the years. Both CNS data (Table VII) and BDHS data (Table VIII) show that while the malnutrition gap between rural and urban areas has declined a little over the last decade and a half, a very substantial differential still remains. Thus, it may be seen (by comparing Table I with Table VIII) that during the mid-1990s the rural-urban differentials in both infant mortality and child malnutrition were quite high, but whereas the mortality differential has all but disappeared by 2007 the malnutrition differential has been cut only by half. Children in rural Bangladesh have traditionally been at a disadvantage vis-à-vis their urban counterparts in terms of both mortality and malnutrition. With respect to mortality decline, however, they have done a lot of catching up over time—achieving near parity in recent years, but in respect of malnutrition the catching up process seems to have worked much more slowly. Along with the overall resilience of acute malnutrition in recent years, this aspect of nutritional status too remains a matter of enduring concern.
The Gender Dimension of Health Status Past studies have repeatedly demonstrated the existence of gender
discrimination in health and nutrition in South Asia in general and Bangladesh in particular.14 Recent evidence shows that despite a good deal of progress that has been made in recent years in closing the gender divide, gender differential in health outcomes still persists to some extent.
The extent of progress achieved in narrowing the gender divide can be seen from Table X, which shows the trends in sex-specific infant mortality and life expectation. While interpreting the figures in this table, it needs to be borne in mind that as females have a natural biological advantage over males in terms of survival, the life outcomes should be better for females compared to males provided they are treated equally with respect to health and nutritional care. This is reflected to some extent in infant mortality figures, which show that mortality in the first year of life was lower for female children than male children in the early 1990s. As overall mortality has declined over the years, thanks to better health and nutritional inputs, male infants have gradually been able to overcome their natural disadvantage so that the gap between male and female infant mortality has narrowed down consistently.
In contrast to infant mortality figures, the life expectation data reveal lower achievement for females in the 1990s, indicating that females had a distinctly
14 Some of the pioneering studies on gender discrimination in health and nutrition in Bangladesh include D’Souza and Chen (1980), Chen, Huq and D’Souza (1981) and D’Souza and Bhuiya (1982).
236

Chowdhury & Osmani: Achieving the Right to Health 237
inferior survival outcome taking the life cycle as a whole, despite having a natural biological advantage over males. This disjuncture between potential and actual differential in female and male life expectation is suggestive of gender discrimination against women in post-infancy period. The trends are encouraging, however, in the sense that by about the year 2000 female shortfall in life expectation had almost completely disappeared, and by 2008 females actually emerged with a small lead of 2.4 years. It is important to bear in mind, though, according to international evidence female lead over males should be a lot higher—at least 5 years—in the absence of discrimination. The fact that the actual lead is much lower than potential suggests that gender discrimination in terms of health and nutritional care still persists in Bangladesh.
TABLE X GENDER DIFFERENTIAL IN INFANT MORTALITY AND LIFE EXPECTATION
Infant Mortality
(per ‘000 live births) Life Expectation
(years) Year Both sex Male Female Both sex Male Female
1991 92 95 90 56.1 56.5 55.7 1992 88 90 86 56.3 56.8 55.9 1993 84 86 82 57.9 58.2 57.9 1994 77 77 76 58.7 58.4 58.1 1995 71 73 70 58.9 59.1 58.6 1996 67 68 67 60.1 60.3 59.7 1997 60 61 59 61.5 61.7 61.2 1998 57 58 56 61.5 61.7 61.2 1999 59 61 57 62.7 63.0 62.4 2000 58 59 57 63.6 63.7 63.5 2001 56 58 55 64.2 64.0 64.5 2002 53 54 52 64.9 64.5 65.4 2003 53 55 51 64.9 64.3 65.4 2004 52 57 47 65.1 64.4 65.8 2005 50 52 47 65.2 64.4 65.8 2006 45 47 43 66.5 65.4 67.8 2007 43 44 41 66.6 65.5 67.9 2008 41 42 40 66.8 65.6 68.0
Source: BBS (2009b).
237

The Bangladesh Development Studies 238
A closer look at child mortality reveals that discrimination against females start quite early in life. Table XI breaks up childhood mortality into several time-spans - namely, neonatal mortality (mortality within the first month of life), post-neonatal mortality (mortality after the first month but within first year of life), infant mortality (mortality within first year of life), child mortality (mortality between the end of the first year and the end of the fifth year of life), and under-five mortality (mortality within the first five years of life). It may be noted that neonatal mortality is distinctly lower for females, reflecting the natural female advantage mentioned earlier. However, soon after the first month of life this advantage begins to get eroded, with the result that the male-female gap is much lower in terms of post-neonatal mortality (and infant mortality) compared to neonatal mortality. What is most revealing, though, are the figures on child mortality i.e. death after the first year of life up to the end of the fifth year.
TABLE XI GENDER DIFFERENTIAL IN CHILDHOOD MORTALITY
(PER ‘000 LIVE BIRTHS)
Neonatal mortality
Postneonatal mortality
Infant mortality
Child mortality
Under-5 mortality
1993-94 Male 71 37 107 47 149 Female 56 38 93 62 150 Difference 15 -1 14 -16 -1
1996-97 Male 60 35 95 37 128 Female 49 35 84 47 127 Difference 11 -1 11 -10 1
2001 Male 52 23 75 23 96 Female 42 26 67 29 94 Difference 11 -3 8 -6 2
2004 Male 52 28 80 24 102 Female 40 24 64 29 91 Difference 12 4 16 -5 11
2007 Male 42 19 61 16 76 Female 36 17 54 20 72 Difference 6 2 7 -4 4
Source: NIPORT, Mitra & associates and Macro International (1994, 1997, 2003, 2005, 2009).
Note: Data refer to the ten-year period preceding the survey year.
238

Chowdhury & Osmani: Achieving the Right to Health 239
These figures reveal that the female advantage of early life completely disappears after the first year of life, with the result that child mortality turns out to be distinctly higher for females compared to the males. The overall under-five mortality figures are still lower for females, but this only because the advantage the females hold in the first year of life outweighs the disadvantage in the next four years. The evidence is thus quite clear that the female child is discriminated against soon after it is born. It is encouraging to note, however, that the female disadvantage in child mortality has come down over the years, which suggests that the intensity of gender discrimination may be softening over time, but it has not yet disappeared.
In order to see how the mortality differentials are reflected in nutritional status, we present below two sets of data—one based on the periodic Child Nutrition Surveys of the Bangladesh Bureau of Statistics (Table XII) and another on the Bangladesh Demographic Health Surveys (Table XIII). These data clearly show some degree of female disadvantage in terms of underweight (low weight for age) measure. However, the picture is not very clear in terms of stunting (low height for age), which is a better indicator of chronic deprivation. The BDHS data show only a slightly elevated figure for females, whereas the BBS figures show hardly any discrimination at all. Evidence such as this has prompted some observers to comment on the apparent disjuncture between mortality and nutritional measures as indicators of gender discrimination. The real problem, however, is that unlike mortality figures the published figures on nutritional status do not generally break up the picture into shorter time-spans. As noted earlier, mortality figures reveal gender discrimination only when the evidence after the first year of life is looked at. This suggests that one ought to look at the figures for nutritional status that obtain after the first year life. In a recent study, Dancer, Rammohon and Smith (2008) did just that. The study showed that while a male child does have a lower probability of survival in the first year of life, having survived the first year the male child enjoys a significantly superior nutritional status compared to the female child.
TABLE XII GENDER DIFFERENTIAL IN CHILD NUTRITIONAL STATUS: BBS DA
TA (per cent)
Underweight Stunting Wasting Girls Boys Girls Boys Girls Boys 1989-90 67.8 64.8 65.9 65.6 13.8 15.3 1995-96 58.1 56.8 51.2 51.6 17.3 15.9 2000 50.9 51.3 49.1 48.4 11.4 12.0 2005 39.0 40.0 45.3 47.1 14.5 14.5
Source: BBS (2007, 2009b).
239

The Bangladesh Development Studies 240
TABLE XIII GENDER DIFFERENTIAL IN CHILD NUTRITIONAL STATUS: BDHS DATA
Underweight Stunting Wasting
Girls Boys Girls Boys Girls Boys 1996-97 58.0 54.6 55.0 54.3 16.8 18.6 1999-00 49.6 45.8 45.8 43.6 10.1 10.6 2004 48.7 46.4 43.5 42.5 12.5 13.2 2007 48.6 44.1 36.7 35.6 16.0 16.5
Source: NIPORT, Mitra & associates and Macro International (1997, 2001, 2005, 2009).
Thus closer examination of both mortality and nutritional status indicators suggests that gender discrimination against the female child is still very much a way of life in Bangladesh, although the degree of discrimination has diminished over time. There is also some additional evidence that discrimination that starts early in childhood (especially, after the first year of life) continues into later life. Thus a survey of urban regions of Bangladesh in 2003 found that, among the adolescents (13-19 years olds), girls suffered from anaemia considerably more than boys, even though among the 6-9 month olds girls had a distinct advantage (Table XIV). It is also worth noting in this context that even though the overall crude death rate is smaller for females than for males, the evidence on cause-specific death rates reveal that females die more out of malnutrition than males (BBS 2009b, p.520),15 which also indicates the existence of gender discrimination in the sphere of nutrition.
TABLE XIV GENDER DIFFERENTIAL IN THE PREVALENCE OF ANAEMIA:
URBAN BANGLADESH 2003 (per cent)
Children aged 6-9 months Adolescents (13-19 years) Girls Boys All Girls Boys All Non-slum 52.2 57.8 55.0 28.0 16.5 22.8 Slum 59.3 63.5 61.5 35.1 20.1 28.1 All Urban 53.0 58.4 55.7 28.8 16.9 23.4
Source: BBS (2009b).
15 The figures on death caused by malnutrition refer to the cases where a death can be attributed directly to malnutrition. In reality, however, malnutrition can and does cause death indirectly as well by leading to various types of diseases, especially the infectious ones; deaths from these diseases are not counted under malnutrition-caused death.
240

Chowdhury & Osmani: Achieving the Right to Health 241
Yet another aspect of gender dimension in health is captured by maternal mortality, which is affected both by the nutritional input and healthcare experience over a woman’s life span and by the quality of maternal care taken during pregnancy. Both these factors are unfavourable in Bangladesh. Because of life-long gender discrimination as well as paucity of modern maternal care, the women of Bangladesh suffer from a very high maternal mortality compared to many other developing countries. As can be seen from Table XV, the mortality ratio has been declining in Bangladesh, but at a very slow rate; from 4.72 (per ’000 live births) in 1991 it has come down only to 3.48 in 2008. What is particularly disconcerting is that there seems to have been a reversal of progress towards the end of the 1990s, especially in rural areas. In view of the well-known difficulties in estimating maternal mortality, it is not altogether clear whether this reversal is genuine or merely a statistical artefact. What is not in doubt, however, is the very slow rate of progress in reducing maternal mortality. The current mortality ratio of 3.48 (in 2008) is way above the MDG target of 1.44 and at the current rate of progress there is not even a remote chance of reaching the target by 2015, and that is a matter of concern.
TABLE XV MATERNAL MORTALITY RATIO IN BANGLADESH: 1991-2008
(PER ’000 LIVE BIRTHS)
Year National Rural Urban 1991 4.72 4.84 4.02 1992 4.66 4.80 3.98 1993 4.52 4.68 3.91 1994 4.49 4.60 3.85 1995 4.47 4.52 3.80 1996 4.44 4.50 3.75 1997 3.50 3.78 3.08 1998 3.23 3.36 2.85 1999 3.20 3.33 2.63 2000 3.16 3.29 2.61 2001 3.15 3.26 2.58 2002 3.91 4.17 2.73 2003 3.76 4.02 2.70 2004 3.85 3.87 2.53 2005 3.48 3.58 2.75 2006 3.37 3.75 1.96 2007 3.51 3.86 2.19 2008 3.48 3.93 2.42
Source: BBS (2009c).
241

The Bangladesh Development Studies 242
V. ASSESSMENT OF ACHIEVEMENTS FROM THE RIGHTS-BASED PERSPECTIVE
We have seen in the preceding section that Bangladesh has made great progress in improving the health of its people in the last three decades. Indeed, Bangladesh’s achievement in this sphere, and more generally in the social sphere (as distinct from the economic sphere) has been widely acclaimed as exceptional for countries at comparable levels of economic development.16 From the perspective of the right to health, this success must count as a move towards the right direction. All States are obliged to ensure progressive realisation of rights as expeditiously as possible, and in terms of overall progress at least the state of Bangladesh can certainly claim credit for doing it more expeditiously than many others. However, there is more to the right to health than speedy improvement in the overall health of the people. As noted in section II, several other considerations are also important while assessing a State’s performance from the perspective of rights. These include equity and non-discrimination, the extent of people’s participation in the policy process (in formulation, implementation and monitoring of policies), and existence of effective accountability mechanisms for holding the duty-bearers (principally, the State) responsible for its action (or the lack of it). This section presents an assessment of the health sector in Bangladesh in the light of these ingredients of a right-based approach.
Equity in Health Care Equity has many dimensions. One of these—the gender dimension of health
equity—has already been examined in section IV; the general conclusion was that while considerable progress has been made in closing the gender gap in nutritional and health outcomes in Bangladesh, the practice of gender discrimination still persists in a significant way. The relative neglect of the girl child, as well as of adult women, remains a blot in the health scene of Bangladesh from the perspective of human rights.
Even more significant is the persistence of health inequity among the rich and the poor, as the evidence presented in this section will show.17 Inequity exists both 16 See W. Mahmud (2008) for a perceptive analysis of the factors behind this success. 17 For earlier discussions on various aspects of health inequity in Bangladesh, see Gwatkin et al. (2000, 2007)), Bhuiya,Chowdhury,Ahmed and Adams (2001), Chowdhury and Bhuyia (2001), Ensor et al. (2002), Chowdhury et al. (2003), Ahmed,Tomson,Petzold and Kabir (2005), Giashuddin, Kabir and Hasan (2005), Glinskaya (2005), Karim, Tripura, Gani and Chowdhury (2006), BHW (2007), Collin, Anwar and Ronsmans (2007), Rahman (2007), Razzaque, Streatfield and Gwatkin (2007), Anwar et al. (2008) and Dmytraczenko, Shahid, Sinha (2009), among others.
242
Chowdhury & Osmani: Achieving the Right to Health 243
in health outcomes and in the provision of healthcare. From a rights point of view, it is the latter that is more directly relevant since the right to health really entails the right to adequate healthcare rather than the right to be healthy. In other words, the obligation of the state relates primarily to providing equitable healthcare to all regardless of their socio-economic characteristics, and not necessarily to ensuring equal health for all because the health status of people can vary because of genetic differences and individual choices on which the state do not have much control. However, when dealing with broad groups of people such as the rich and the poor, differences in health outcomes are also indicative of differences in healthcare since individual differences—in genetic dispositions and behaviour patterns—would tend to cancel out to a large extent for the average picture. We shall, therefore, present evidence on differentials in both health outcomes and healthcare in Bangladesh.
To begin with, it can be seen from Table XVI that currently the degree of undernutrition for children from the poorest quintile is almost twice as high as that for children from the richest quintile.18 One would of course expect the poorer children to suffer more from lack of nutrition than the richer ones, but what is especially important to note is that the differential does not seem have changed much in the decade from the mid-1990s. If anything, the relative position of the poorest children seems to have become slightly worse in terms of stunting. While the extent of stunting has declined for both groups of children (this is part of the overall progress mentioned earlier), it has declined somewhat faster for the richest quintile, so that the differential has increased from slightly less than double (1.8) to slightly more than double (2.2). Overall progress has thus been combined with persistent inequity, and probably a slightly enhanced inequity, in the incidence of child undernutrition between the rich and poor.
Similar conclusion emerges for childhood mortality and morbidity. As in the case of undernutrition, the mortality levels of children from the poorest quintile is almost double that of the richest quintile (Table XVII). Again, consistent with the picture of overall progress, both infant and under-five mortality have declined across the board for all classes of people, but the differential between the poorest and richest quintiles has remained virtually unchanged. As for morbidity, Table XVII presents the picture on three common childhood diseases in Bangladesh—viz., common fever, diarrhoea, and acute respiratory infection (ARI), based on the information provided by successive rounds of the Bangladesh Demographic and 18 Unless otherwise stated, quintile groups in this section (and in the rest of the paper) refer to groups of people arranged in the ascending order of their wealth index (not income or expenditure).
243

The Bangladesh Development Studies 244
Health Survey. As expected, the incidence of these diseases is consistently higher for children from the poorest quintile, except that it is only marginally higher in the case of common fever presumably because the airborne bacteria and viruses that cause fever do not respect any class division! It is interesting to note that unlike in the case of malnutrition and mortality, there appears to have been no systematic decline in the prevalence of these diseases since the mid-1990s. However, as in those cases, there has been no systematic decline in the differential between the rich and the poor either. On the contrary, the differential in the incidence of ARI seems to have registered a marked increase. In 1996/97 the incidence of ARI among children from the poorest quintile was 1.2 times that of children from the richest quintile; by 2004 this ratio had gone up to 1.5, rising further to 2.0 by 2007.
TABLE XVI SOCIO-ECONOMIC DIFFERENTIALS IN THE NUTRITIONAL
STATUS OF CHILDREN
NCHS 1977 GRS WHO 2006 GRS 1996/97 2004 2007 2004 2005 2007 Underweight
Bottom quintile 65.2 59.3 55.5 55.6 48.7 50.5
Top quintile 37.6 30.2 31.7 25.9 24.9 26.0
Ratio (bottom to top quintile) 1.7 2.0 1.8 2.1 2.0 1.9
Stunting
Bottom quintile 61.4 54.4 46.2 62.2 54.0 54.0
Top quintile 34.8 25.0 21.1 30.5 29.8 26.3
Ratio (bottom to top quintile) 1.8 2.2 2.2 2.0 1.8 2.1
Wasting
Bottom quintile n.a. 15.5 20.2 17.7 19.3 20.8
Top quintile n.a. 9.4 11.3 11.1 10.4 13.2
Ratio (bottom to top quintile) n.a. 1.6 1.8 1.6 1.9 1.6
Source: Gwatkin et al. (2007) for data for 1996/97, NIPORT, Mitra & associates and Macro International (2005, 2009) for 2004 and 2007 respectively, and BBS (2007) for 2005.
244

Chowdhury & Osmani: Achieving the Right to Health 245
TABLE XVII SOCIO-ECONOMIC DIFFERENTIALS IN CHILDHOOD MORTALITY
AND MORBIDITY
1996/97 1999/00 2004 2007 Infant mortality Bottom quintile 97 93 90 66 Top quintile 57 58 65 36 Ratio (bottom to top quintile) 1.7 1.6 1.4 1.8 Under-five mortality Bottom quintile 141 140 121 86 Top quintile 76 72 72 43 Ratio (bottom to top quintile) 1.9 1.9 1.7 2.0 Prevalence of fever Bottom quintile 31.6 39.7 42.6 38.9 Top quintile 30.0 35.3 37.7 34.8 Ratio (bottom to top quintile) 1.1 1.1 1.1 1.1 Prevalence of diarrhoea Bottom quintile 8.8 6.3 8.7 10.2 Top quintile 6.4 6.4 6.1 8.1 Ratio (bottom to top quintile) 1.4 1.0 1.4 1.3
Prevalence of acute respiratory infection (ARI) Bottom quintile 12.7 n.a. 21.4 16.5 Top quintile 10.6 n.a. 14.1 8.1 Ratio (bottom to top quintile) 1.2 n.a. 1.5 2.0
Source: NIPORT, Mitra & associates and Macro International (1997, 2001, 2005, 2009).
In order to shed light on the reasons for undiminished differentials between rich and poor children in terms of nutritional status, mortality and morbidity, we now turn to the evolving pattern of healthcare for children. This is also where the right-based analysis of health really comes of its own. For this purpose, we first make a distinction between preventive and curative care. The pattern of curative care is presented in Table XVIII, with respect to the three diseases discussed above. Two points of clarification are in order here before discussing the findings of this table. First, for each of these diseases, we look at the coverage of medical treatment separately at public and private health facility, in addition to the combined figures. Private facility in this case refers to private hospitals and clinics (including those run by NGOs), but excludes advice given by and medication prescribed by pharmacies and traditional healers. Given the higher cost of attending a private
245

The Bangladesh Development Studies 246
facility (other than the NGOs) and the well-known inadequacies of public health facilities, especially in rural areas, one would expect the differential between the rich and poor to be higher for private as opposed to public facilities.
TABLE XVIII SOCIO-ECONOMIC DIFFERENTIALS IN CURATIVE HEALTHCARE FOR
CHILDREN
1996/97 1999/00 2004 2007 Medical Treatment of fever Bottom quintile 15.0 17.0 8.9 13.3 Top quintile 26.1 44.1 39.1 38.7 Ratio of shortfalls 1.2 1.5 1.5 1.4
Treatment of fever Bottom quintile 4.4 4.5 2.4 n.a. at public facility Top quintile 5.7 3.8 7.3 n.a. Ratio of shortfalls 1.0 1.0 1.1 n.a.
Treatment of fever Bottom quintile 10.6 12.1 6.5 n.a. at private facility Top quintile 20.4 39.8 31.8 n.a. Ratio of shortfalls 1.1 1.5 1.4 n.a. Treatment of diarrhoea Bottom quintile 76.1 78.9 74.9 88.7 with ORT Top quintile 73.0 80.4 94.4 88.2 Ratio of shortfalls 0.9 1.1 4.5 1.0 Medical Treatment of Bottom quintile 22.4 16.4 6.9 10.8 diarrhoea Top quintile 23.8 41.3 30.6 30.8 Ratio of shortfalls 1.0 1.4 1.3 1.3 Treatment of diarrhoea Bottom quintile 10.7 5.9 1.4 n.a. at public facility Top quintile 16.1 9.6 7.5 n.a. Ratio of shortfalls 1.1 1.0 1.1 n.a. Treatment of diarrhoea Bottom quintile 11.7 10.5 5.5 n.a. at private facility Top quintile 7.7 30.3 23.1 n.a. Ratio of shortfalls 1.0 1.3 1.2 n.a. Medical Treatment of ARI Bottom quintile 23.0 n.a. 10.7 23.6 Top quintile 51.3 n.a. 44.1 73.3 Ratio of shortfalls 1.6 n.a. 1.6 2.9 Treatment of ARI Bottom quintile 7.4 n.a. 2.4 n.a. at public facility Top quintile 14.4 n.a. 10.2 n.a. Ratio of shortfalls 1.1 n.a. 1.1 n.a. Treatment of ARI Bottom quintile 15.6 n.a. 8.3 n.a. at private facility Top quintile 35.8 n.a. 33.8 n.a. Ratio of shortfalls 1.3 n.a. 1.4 n.a.
Source: NIPORT, Mitra & associates and Macro International (1997, 2001, 2005, 2009).
Second, the differential between the rich and the poor is measured slightly differently here from the preceding tables. In the case of incidence of outcomes such
246
Chowdhury & Osmani: Achieving the Right to Health 247
as malnutrition, mortality and morbidity, the differential was calculated as the simple ratio between of incidences for the poorest and the richest quintiles. This method would be somewhat misleading, however, in the case of coverage of medical treatment because of the extremely small percentages often encountered, especially for the poorer groups. The problem lies in the fact that it is easier to make gains of equal proportions from a small base compared to a large base, so that the simple ratio of coverage between poor and rich groups would not correctly reflect the proportion of incremental healthcare actually being enjoyed by the two groups. To take an extreme example, if the coverage for the poor groups doubles from 1 per cent to 2 per cent, and the coverage for the rich group also doubles from 40 per cent to 80 per cent, the ratio of coverage would remain unchanged, but it would be absurd to claim that the poor and the rich have shared equally in enhanced coverage of medical treatment. One way of getting around this problem is to measure the ratio of shortfalls of coverage—from a possible maximum, which is 100 per cent in this case. In the example above, one would then calculate the ratio (100-1)/(100-40) for the first period and (100-2)/(100-80) for the second period, and find that the differential has gone up sharply from 1.65 to 4.00. The interpretation would be that by going from 40 to 80 the richer group has reduced its shortfall (from the maximum of 100 per cent) much faster than the poorer group, which has moved up only from 1 to 2 per cent. This would correctly convey the message that the richer group had received the bulk of the incremental coverage between the two points in time. Accordingly, in Table XVIII (and also in subsequent tables on healthcare coverage) the differential coverage between the poorest and richest quintiles is measured as the ratio of their respective shortfalls (from 100 per cent).
It is noteworthy that for each of the three childhood diseases, the proportion of children in the poorest quintile covered by medical treatment has either remained virtually unchanged or gone down in absolute terms (Table XVIII). In the case of diarrhoea, the redeeming feature is that the decline in medical treatment has been compensated by the increased coverage of Oral Rehydration Therapy (ORT), but there is no such redemption for the other two diseases. By contrast, for the richest quintile, the coverage of medical treatment has gone up in absolute terms in each case. As a result, the differential in coverage has widened between the rich and the poor—during the decade since 1996/97, the ratio of shortfalls in coverage of the poorest and richest quintiles has gone up from 1.2 to 1.4 in the case of fever, from 1.0 to 1.3 in the case of diarrhoea, and even more dramatically from 1.6 to 2.9 in the case of ARI. Thus the rich have been able to reduce their shortfall much faster than the poor. Evidently, the system of curative healthcare in Bangladesh has become distinctly more inequitable over time.
247
The Bangladesh Development Studies 248
The growing inequity is especially evident when it comes to medical treatment at private facilities. By contrast, the differential in coverage in public facilities has remained virtually unchanged. As it is, the coverage of medical treatment at private facilities is already biased in favour of the rich. The fact that the differential is widening over time indicates that the private healthcare facilities are becoming increasingly more biased towards the rich. When this finding is combined with the fact that the expansion in health facilities in Bangladesh in the last three decades has been driven primarily by the private sector rather than the public sector (section III), it becomes evident that the curative healthcare system of Bangladesh has failed singularly to promote equitable fulfilment of the right to health.
The situation with regard to preventive care is altogether different, however. Table XIX reports coverage of children from the richest and the poorest quintiles by the following types of preventive care—BCG vaccination, measles vaccination, DPT vaccination, full basic immunisation (which in addition to BCG, measles and DPT, also includes protection against polio), and Vitamin A supplementation. The poorest quintile is covered less than the richest quintile in each of these cases, but the remarkable feature is that the differential has generally come down over the years,19 in complete contrast to what has happened with regard to curative care. Sine preventive care is provided mostly by the government, either directly or in collaboration with NGOs, we may conclude that equity in healthcare has been advanced in the arena in which the government is more directly involved, but not so in the arena in which private sector plays the predominant role.
The phenomenon of growing inequity between the rich and the poor is evident not just in children’s health but also in women’s health.20 Table XX shows that not only do the poorest women suffer from more malnutrition (BMI being less than 18.5) than their richest counterparts, the differential is rising consistently over time. In 1996/97, the extent of malnutrition among women in the poorest quintile was twice as high as that of women in the richest quintile; by 2007 the gap had more than trebled.
19 The sole exception is full basic immunisation, for which the ratio of shortfalls between the poorest and richest quintiles went up after 1996/97 but came back to the original level by 2007. 20 Comparable data on men’s health are not available.
248

Chowdhury & Osmani: Achieving the Right to Health 249
TABLE XIX SOCIO-ECONOMIC DIFFERENTIALS IN PREVENTIVE HEALTHCARE FOR
CHILDREN
1996/97 1999/00 2004 2007 BCG coverage Bottom quintile 79.8 84.2 87.2 97.1 Top quintile 94.8 96.5 97.9 98.1 Ratio of shortfalls 3.9 4.5 6.1 1.5 Measles coverage Bottom quintile 62.4 59.1 59.6 80.2 Top quintile 82.6 85.9 90.5 89.2 Ratio of shortfalls 2.2 2.9 4.3 1.8 DPT coverage Bottom quintile 60.7 62.1 70.8 92.4 Top quintile 83.2 85.2 91.1 94.7 Ratio of shortfalls 2.3 2.6 3.3 1.4 Full basic immunisation Bottom quintile 47.4 50.3 57.5 79.9 Top quintile 66.6 74.9 86.7 88.4 Ratio of shortfalls 1.6 2.0 3.2 1.7 Vitamin A supplementation Bottom quintile 66.3 73.5 74.6 88.8 Top quintile 76.3 83.1 83.5 90.0 Ratio of shortfalls 1.4 1.6 1.5 1.1
Source: NIPORT, Mitra & associates and Macro International (1997, 2001, 2005, 2009).
TABLE XX
SOCIO-ECONOMIC DIFFERENTIALS IN THE NUTRITIONAL STATUS OF WOMEN
1996/97 2004 2005 2007 Undernutrition (BMI<18.5) Bottom quintile 64.5 46.1 44.0 43.4 Top quintile 32.6 16.7 14.7 13.4 Ratio 2.0 2.8 3.0 3.2
Source: NIPORT, Mitra & associates and Macro International (1997, 2001, 2005, 2009).
Inequity is widening not just in terms of health outcomes but also in terms of healthcare, especially maternal care. Table XXI presents the evolving pattern of maternal care in terms of three major categories—ante-natal care, delivery assistance and postnatal care, with more than one indicator for each category. It is
249

The Bangladesh Development Studies 250
evident that the differential of maternal care given to women from the poorest and richest quintiles has been widening in terms of the majority of indicators. Thus, the ratio of shortfalls (from a maximum of 100 per cent) between the poorest and richest quintile in terms of access to ante-natal care from a medically trained person has increased from 2.2 in 1996/97 to 4.2 in 2007; in the case of delivery assistance from a medically trained person, this ratio has increased from 1.2 to 1.9 in the same period; and in the case of access to postnatal care from a trained provider it has increased from 1.3 in 2001 to 1.9 in 2007. Thus, in all these aspects of maternal care, the richer women are closing their shortfall (from the maximum possible care) much faster than the poorer women.
The only notable exception to this pattern is Vitamin A supplementation (provided for two months after childbirth). It is no coincidence that Vitamin A supplementation is a part of preventive care provided primarily through a public sector programme (with or without the help of NGOs), whereas most of the other indicators relate to services provided by both public and private sector, the latter becoming increasingly the more dominant actor. Thus, as in the case of child health, maternal healthcare too is becoming ever more inequitable as the private sector is coming to play an ever more dominant role.21
The fact that healthcare provision through the private sector is inequitable is not in itself a matter of concern as far as health policy is concerned because this is merely a reflection of overall inequality that exists in the society. It is perfectly understandable that the richer segment of the society would use their greater purchasing power to obtain good quality services from private providers much more than the poorer segment can afford to do. The health inequity that arises from this particular source can only be tackled by broader socio-economic measures that can reduce overall economic inequality, not by health policy per se. What really matters from the perspective of health policy is whether, and the extent to which, public health facilities can offer an adequate alternative to the market that the poor can also access and benefit from. There are serious reasons to doubt that this is the case in Bangladesh.
21 Public sector used to be the dominant provider of quality healthcare until the mid-1980s, but the relative roles of public and private sectors reversed in the 1990s. Thus, in 1984, about 19 per cent of quality health service in rural areas originated from public sector and 17 per cent from the private sector (the rest being traditional and other informal services of uncertain quality). By 1995, however, the public sector's share came down to 12 per cent while that of private sector went up to 22.5 per cent (Begum 1996). Ever since, the private sector has remained the dominant sector in providing quality healthcare.
250

Chowdhury & Osmani: Achieving the Right to Health 251
TABLE XXI SOCIO-ECONOMIC DIFFERENTIALS IN HEALTHCARE FOR WOMEN
1996/97 1999/00 2001 2004 2007 Ante-natal care By a medically Bottom quintile 16.0 19.4 22.2 24.9 30.8 trained person Top quintile 62.3 69.8 74.8 81.1 83.6 Ratio of shortfalls 2.2 2.7 3.1 4.0 4.2 By a doctor Bottom quintile 10.0 9.6 9.0 12.3 15.0 Top quintile 54.6 61.9 60.3 65.6 71.6 Ratio of shortfalls 2.0 2.4 2.3 2.5 3.0 By a nurse or a Bottom quintile 6.0 9.8 13.2 12.6 15.8 trained midwife Top quintile 7.8 8.0 14.5 15.5 11.9 Ratio of shortfalls 1.0 1.0 1.0 1.0 1.0 Ante-natal care content
Tetanus toxoid Bottom quintile 70.0 70.5 n.a. 77.4 78.9 Top quintile 90.2 93.2 n.a. 92.2 87.3 Ratio of shortfalls 3.1 4.3 n.a. 2.9 1.7 Iron supplementation Bottom quintile n.a. 21.2 n.a. 31.6 38.9 Top quintile n.a. 62.8 n.a. 76.1 75.9 Ratio of shortfalls n.a. 2.1 n.a. 2.9 2.5 Delivery assistance By a medically Bottom quintile 1.8 3.5 3.6 3.3 4.8 trained person Top quintile 29.8 42.1 37.9 39.4 50.9 Ratio of shortfalls 1.4 1.7 1.6 1.6 1.9 At a health facility Bottom quintile 0.9 1.9 2.5 2.0 4.4 Top quintile 17.3 19.4 30.4 31.3 43.4 Ratio of shortfalls 1.2 1.2 1.4 1.4 1.7 Post-natal care Vitamin A Bottom quintile n.a. 8.4 n.a. 8.5 12.5 supplementation Top quintile n.a. 28.0 n.a. 25.9 27.0 Ratio of shortfalls n.a. 1.3 n.a. 1.2 1.2 Received post-natal Bottom quintile n.a. n.a. 10.9 5.1 7.6 care from a Top quintile n.a. n.a. 32.6 46.9 52.0 trained provider Ratio of shortfalls n.a. n.a. 1.3 1.8 1.9
Source: NIPORT, Mitra & associates and Macro International (1997, 2001, 2003, 2005, 2009).
In principle, public facilities—being either free or heavily subsidized—are supposed to be the main vehicle through which the poorer segment of the society can access healthcare services. Indeed, one study has found, consistently for all
251

The Bangladesh Development Studies 252
socio-economic indicators, that the poorer households used government services relatively more than the better off households (WHO 2002). There is also evidence that public facilities are used more by women compared to men. Analysing data from the Household Income and Expenditure Survey of 2005, a recent study has found that the proportion of curative healthcare visits to government health facilities is higher for females (55 per cent) than for males (45 per cent) (HEU 2007). Even when visits for reproductive health related matters are excluded, the proportion of women using public facilities (58 per cent) is still found to be higher than that of men (42 per cent). Public health facilities thus have the potential to promote both overall equity and gender equity in healthcare. Unfortunately, however, the accumulated evidence suggests that this potential is far from being realised.
A recent evaluation of the health sector programme reveals that public health service ranks the lowest among all types of service providers in terms of satisfaction to the users (GOB 2005). The proportion of users satisfied with the overall public services was found to be 62 per cent as against 88 per cent for both qualified private practitioners and unqualified service providers. Among public health services, the greatest concerns for the users are the non-availability of drugs and medical supplies and quality of in-patient food. The other important aspects of client dissatisfaction were lack of cleanliness and unhygienic conditions in the facilities, privacy of treatment and waiting time for treatment. Furthermore, the service users from higher socio-economic status were likely to experience better responsiveness from doctors/service providers as well as receive better quality of treatment. Not surprisingly, one study reports that although the poor utilised government services more frequently, they also found the services as bad more often compared to the non-poor—36 per cent and 30 per cent respectively (WHO 2002).
A number of problems afflict the public healthcare facilities. First, although these facilities are supposed to provide most services free of charge, in reality they are not free for patients. Often the patients are forced to purchase drugs and supplies and to make various other kinds of unofficial and informal payments. A study conducted by the Ministry of Health in the late 1990s found that informal fees were common at all levels of the health system and they could amount to more than ten times the official charges (Killingsworth et al. 1999).
Second, absenteeism is rife in public facilities. According to a survey carried out in 2003, absenteeism among doctors was 41 per cent of upazila health complexes and 44 per cent for union-level facilities (Chaudhury and Hammer 2003).
Third, the opportunity of government doctors to do private practice makes matters worse. Although the doctors claim to attend to private patients after office hours and outside the official premises, there is strong evidence that public and
252

Chowdhury & Osmani: Achieving the Right to Health 253
private services tend to be provided on the same premises and during office hours (Osman 2004). Moreover, field studies indicate that doctors devote less time to their non-private patients than they ought to (Akter and Islam 2006, FMRP 2006).
Fourth, non-availability of essential drugs and equipment is a serious hindrance. A review of HPSP found that only one in five persons using government health services was found to receive all the prescribed medicines (CIET 2001). This was actually lower than the baseline situation observed in 1998, when one in three persons was found to have received all the prescribed medicine (CIET 1999). The big thrust of providing ESP through the community clinics also failed to deliver. A survey of community clinics found that after a generous initial supply of drugs there was no further supply for most of the clinics, which rendered them non-functional (WHO 2002). Many studies have revealed that costly medicines and equipment are sold off by corrupt officials and staff (Akter and Islam 2006, FMRP 2007, Hossain and Osman 2007). A recent official review has noted that, quite apart from the pilferage, even the official provision for drugs at lower levels of the health system has long been insufficient and declining (IRT 2009a).
The consequence of all these problems is reflected in a poor rate of utilisation of public health facilities. Studies conducted in the late 1980s and early 1990s found the overall utilisation of rural facilities to be less than 50 per cent of capacity (BIDS 1988). The under-utilisation was attributed to a variety of factors including non-availability of adequately trained personnel, absence of transparent professional standards, poor patient-doctor interaction, sub-standard diagnostic and physical facilities, non-availability of drugs and supplies, scant career prospects and general discontent amongst the majority of local level health service functionaries. The BIDS survey found that the majority of thana (upazila) health complexes lacked appropriate storage facilities for drugs and other medical supplies; difficulties were also reported in procurement of drugs and other medical supplies. Most of these complexes needed renovation and those with only one female ward lacked labour wards and delivery units. The same survey also found that nearly half of the union sub-centres were in deplorable conditions and only 40 per cent had adequate physical facilities. The survey carried out in the early 1990s did not find any improvement in this regard—about 63 per cent of the health centres had inadequate physical facilities, 60 per cent had inadequate personnel, 80 per cent faced a shortage of vaccine or supplies and the number of referral cases was a meagre 1-2 per cent.
Even as late 2009, an official review of the healthcare system came to the conclusion that over the years “there has been no improvement in the low utilization of curative health services, especially by the poor,” and expressed concern that
253

The Bangladesh Development Studies 254
“There are no plans to address these issues. The recently revised PIP implies a reduction in the share of the Essential Service Delivery OP from 20% of actual spending in June 2008 to just 15% in the 2008/09 to 2010/11 period. Patient numbers are assumed to grow in line with population, implying no improvement in access. Geographical allocation of MOHFW spending continues to be biased against the poorest districts” (IRT 2009a).
The poor state of public health facilities hurts the poorer people and women particularly, because as noted before they tend to avail these services more than the rest of the population, primarily in the hope of saving on costs. Faced with the numerous impediments mentioned above, however, the poorer people actually turn out to receive less of the benefits from public facilities compared to the richer people who can find ways of getting around the difficulties. It is hardly surprising, therefore, that a service delivery survey carried out in the early 2000s found that the very poor were less likely to use government health services than the rest of the population (CIET 2001).
In terms of the proportion of health expenditure accruing to different groups of people, a study based on the Household Income and Expenditure Survey of 2000 estimated that the poorer half of the population received 45 per cent of all health subsidies while the richer half received 55 per cent (World Bank 2003b). A later study, based on data from the Household Income and Expenditure Survey of 2005, has found that the poorest quintile received 36 per cent of all public health services by volume (HEU 2007). This may sound promising, but it should be noted that this figure includes both preventive and curative care, and we have already commented on the egalitarian nature of preventive care (especially for children). The real problem lies with curative care. Looking at the relative utilisation of curative care by different quintiles of population (defined in terms of consumption expenditure), the same study has estimated that the bottom two quintiles each accounts for 14-16 per cent of total utilisation, whereas the top two quintiles each accounts for about 26-28 per cent (HEU 2007, p.11). Clearly, instead of offsetting the inequity that is inherent in private sector services, public facilities are in fact exacerbating the inequity. This is a matter of grave concern from the perspective of rights.
Participation and Accountability22
On paper at least the health policies and programmes in Bangladesh have acknowledged the importance of participation and accountability in the health sector,
22 This part of the paper draws heavily on Osmani (2006) and the Technical Appendix on “Gender, Equity and Voice” in IRT (2009b).
254

Chowdhury & Osmani: Achieving the Right to Health 255
even though the approach was not always an explicitly right-based one.23 Thus, the National Health Policy of 1998 envisioned a participatory approach to caring for people’s health, at least at the local level. It called for decentralisation of services and participation of local population and local government institutions in policy development, financing and monitoring of health services. The locus of such participation was chosen at the lowest tier of government services, namely the new Community Clinics to be established under the Health and Population Sector Programme (HPSP). Each Community Clinic was to be managed by a community group whose membership was to be drawn from all walks of life, including the poor people and women. The group was to be responsible for all aspects of running the clinic, starting from site selection.
In principle, the participatory process envisioned by the project of Community Clinics is precisely the kind of approach demanded by human rights norms. In practice, however, the project failed to live up to the expectations. A study of Community Clinics carried out for the World Health Organisation found that, by the middle of 2001, only about half the projected number of community clinics had become functional. More disturbingly, most of the clinics that were functional were not actually running along the expected participatory path. In fact, in many cases site selection and even the construction of the clinic was completed even before the group was formed. Even in those cases where the group existed, there was very little role of the group and many members of the groups were openly disappointed with their clinics and expressed pessimism about future prospects (WHO 2002).
The non-participatory nature of the whole process was also corroborated by the official evaluation of the HPSP carried out in 2000 (CIET 2001). A survey of households revealed that only one in ten respondents knew about a community clinic group that was active in their area. Among those who knew of a group’s existence, 85 per cent did not know anything about its activities and 10 per cent believed it did nothing. The lack of knowledge about the community groups was not confined only to the potential users; even many of the community based health workers were not fully aware of them. Almost a third of these workers confessed to knowing nothing about the groups or how they should function. In any case, with the shelving of the idea of community clinics at the end of HPSP, even the rudimentary participation that was initiated with the project ceased to exist.
23 Good reviews of the strengths and weaknesses of the voice and accountability mechanisms in the health system of Bangladesh can be found in GK (2000), Jasimuddin et al. (2001), Barakat, Hoque and Syeduzzaman (2003), CPD (2003), S. Mahmud (2004, 2006), BIDS (2006), Zaman and Abdul (2006), BHW (2007, 2010), IRT (2009b, Technical Appendix 2) and Schurmann and Mahmud (2009).
255

The Bangladesh Development Studies 256
Decisions taken at the national level also do not allow for any meaningful participation. This is corroborated clearly by the experience with HPSP. As noted earlier, one of the objectives of HPSP was to terminate the practice of domestic visits by family planning workers and locate their services at the Community Clinic. Yet, the baseline survey conducted for the programme revealed during focus group discussions that this decision was not popular with the users. While men’s focus groups were roughly equally divided on this issue, more than three quarters of women’s groups were against it (CIET 1999). There was, however, no mechanism for the users to influence the nature of decision making at the national level.
Yet another feature of the HPSP was that it sought to unify health and family planning services, which had been running almost parallel to each other, even though they were under the same Ministry. The idea of unification was generally welcomed by the focus groups of both sexes (CIET 2001). Yet, as discussed in section III, the expedience of politics and bureaucratic vested interests connived with each other to scuttle the idea of unification, leaving no room for ordinary people to participate in the final decision.
During the HNPSP phase (2003-2010), when the Community Clinics fell out of favour, the Government tried to promote community participation through a different mode—by introducing local level planning (LLP) with local stakeholder participation. The Ministry of Health and Family Welfare was to form a national level committee and six district committees to carry forward the task of decentralisation in planning. Budgets were to be prepared on the basis of local-level planning with stakeholder participation. However, actual implementation of LLP and budget piloting in 6 districts and 14 Upazilas still remains at the early stage of preparation. It is, therefore, too early to evaluate this renewed attempt to introduce citizen participation in running the healthcare system.
While government programmes have so far failed to install participation in the health system, there is evidence to show from NGO experience that participatory processes at the local level can make significant progress in the delivering of cost-effective interventions at the community level. Traditionally, the management and provision of community-based health services has been dependent on people external to the community, as in the case the initiative promoted under HPSP in Bangladesh. In this set up, local people are passive beneficiaries and do not have a chance to be active participants in their own health care. By contrast, the Community-Managed Health Care concept, which has been piloted by Plan International from 2001 to 2007, is based on grass-roots community participation to improve the quality of primary health care services, improve access for the hard-core poor, improve accountability of service providers, and to increase health service utilisation rates (Mirza 2010). The project sought to improve the
256

Chowdhury & Osmani: Achieving the Right to Health 257
sustainability and the effectiveness of the primary health care system in 11 target areas through a community-managed approach to reach the disadvantaged community members, including those in the lower economic quintiles, especially poor women and children. A package of essential maternal and child health services were provided in the poor rural communities.24
A major emphasis of this project was on building community capacity to actively participate and demand services through community management health committees. Over 250 community-based organisations (CBOs) were formed and participated actively in the decisions for running the community clinics. The project also invested heavily in getting trained personnel in the communities. The health care staff were trained on the essentials of providing integrated maternal, child health and new born care as well as on gender and community facilitation techniques using participatory rural appraisal tools.
Evaluation of the project shows that it increased health service utilisation by women and gave them a much-needed voice in decision-making about health care services. It also improved accountability within the health system and information sharing between health care providers and communities. Within the project sites maternal mortality ratio declined over time to 186 per 100,000 live births while the national average was 320 per 100,000 live births. Many of the women who were trained to participate in the health committees became elected members in the local government bodies. There are other examples of effective local level participation in community-managed healthcare. One such case is the experience of Chowgacha Health Complex, described in Box I. Unfortunately, there are not enough examples of this kind in the country.
The rights-based approach demands that, in addition to developing participatory mechanisms for serving decision-making processes, effective accountability mechanisms must also be devised to as integral part of the monitoring process so that the State cannot get away by failing to meet their commitments through negligence or malfeasance. The preceding discussion in this paper as well as many other studies (summarised in BHW 2007, 2010) has shown that the right to health is being violated in Bangladesh in multiple ways. Examples include the failure to bridge the gap between the rich and the poor in terms of accessibility to good quality healthcare, the failure to ensure meaningful participation of the people in designing and implementing healthcare systems, administering useless and harmful medicine to the children, disregarding the patients’ need for privacy at the time of medical consultation and examination, and subjecting the patients, especially the 24 Over 660,000 people, of which 244,200 were women and 325,600 children, accessed the heath care services (Mirza 2010).
257

The Bangladesh Development Studies 258
poor ones, to disrespectful behaviour. The government service providers are also known to extract unofficial fees from the patients. 25 A recent newspaper story, described in Box II, provides a graphic account of how people’s rights to health (and life) are being violated at the local level.
BOX I CHOWGACHA HEALTH COMPLEX:
AN EXAMPLE OF PEOPLE'S PARTICIPATION CONTRIBUTING TOWARDS BETTER QUALITY CARE
Chowgacha Upazila Health Complex has already earned its reputation as a model health facility in the public sector. The main essence of its success has been spontaneous participation of the local community and the facility's willingness and ability to receive and utilise the contribution with efficiency. Volunteers from local community often work as additional staff while staff members sponsored by local people also help meet the shortage of workforce. Supplies like fuel for generators, instant power supply (IPS) tires for ambulance, blood bags, reagents, cards for patients (such as antenatal or immunisation cards), mobile phones, dustbins, drugs, etc. are generously contributed by local philanthropists, NGOs, and people's representatives when scarce.
However, the facility seems to have flourished at the cost of the union level facilities since most of the staff working at this upazilla health complex (UHC) originally worked at the union level. The continuing rivalry between the Health and Family Planning wings of the MOHFW adds to the staff crisis; a single lady doctor provides all the antenatal care (averaging more than 100 a day) with long waiting time while the Family Welfare Visitor (who belongs to the Family Planning wing) is not allowed to share the load. While these issues remain to be addressed, Chowgacha Health Complex still deserves to be considered as a site for drawing lessons on how local level participation and good governance promote quality health services for the common people.
Source: BHW (2010).
There is currently no effective mechanism for seeking redress against these violations of the right to health nor for holding the violators to account. The
25 The baseline survey for HPSP reported that a fifth of the users made an extra (unofficial) payment to the workers when they visited rural government health facilities, and more than a fifth paid an unofficial registration fee. These payments have acquired an institutionalised character, as revealed by the fact that almost everyone has to pay—there is no difference in this regard between rich and poor, literate and illiterate, or male and female patients (CIET 1999).
258

Chowdhury & Osmani: Achieving the Right to Health 259
National Health Policy of 1998 envisioned the adoption of a Client Bill of Rights. Its objective was to raise awareness of the clients regarding their rights to high quality healthcare, which would ensure privacy, informed choice, safety and efficacy of care, and adherence to approved schedules. If implemented, this bill would have laid the foundations for setting up accountability mechanisms at the local level, but unfortunately no action was taken at the national level to implement it.
BOX II HEALTH COMPLEX RANSACKED AS CHILD DIES WITHOUT
TREATMENT
Agitated relatives and locals went on rampage at Sadullapur upazila health complex after a child patient died in the emergency ward without treatment for absence of any physician Sunday afternoon. The mob ransacked Resident Medical Officer's office and damaged doors and windowpanes of the complex. Police said, one and a half years old Apsia Akhter fell in a pond at her village at Hamindpur under Sadullapur upazila. Locals rescued her in an unconscious state and rushed to the health complex for treatment. But after a wait for about two hours no physician was available in the complex and Apsia died without any treatment. The incident sparked violent protest by locals who went on rampage at the health complex. An employee of the health complex seeking anonymity told this correspondent that virtually the health complex has no physician for the last four days. Out of two physicians, Dr Shakawat Hossain is on leave while Dr Abdus Salam was not present at the upazila headquarters. In another incident yesterday noon, one Ariful of Madhapara rushed to health complex with major finger injuries but no physician was available. At this locals again tried to ransack the complex but police foiled the attempt, said Hasan Inam, Sadullapur OC. Locals alleged that the health complex remains without physician most of the time depriving the people of minimum treatment. Earlier, people of the area urged the health directorate and concerned ministry for ensuring physicians. They also held procession and formed human chain but to no effect. The health directorate several times sent physicians including consultant but soon after joining they went on leave or got transferred to other places, said Khademul Islam Khudi, upazila chairman, Sadullapur. “Being frustrated, a few days ago I put the complex under lock and key as a note of protest but all in vain,” he said.
Source: The Daily Star, Tuesday, May 18, 2010.
The fact is that rights are being violated not just by the service providers at the local level, but also by national policy makers who do not care to take people’s views into account. They promised to implement the Client Bill of Rights, but
259

The Bangladesh Development Studies 260
didn’t bother to keep the promise. They decided to terminate home visits by family planning workers even though the majority of users were in favour of continuing this practice, and they reversed the unification of health and family planning services even though the users are generally in favour of unification. The human rights approach demands that appropriate accountability mechanisms must be put in place so that such violations cannot occur with impunity.
Yet another example of poor accountability at the national level relates to the arsenic contamination of drinking water that has recently posed a serious health hazard in several parts of the country. In the 1980s, a massive programme of installation of tubewells was undertaken with the help of donor funding for providing safe drinking water to the rural population. The programme has been eminently successful in achieving its avowed objective, but in many locations the water coming out of the tubewells has been contaminated with arsenic, causing serious health concerns. The exact reason for the contamination is still being debated, nor is it clear exactly who is culpable for allowing this to happen. But the important point is that no accountability mechanism exists either to determine the locus of culpability, or to provide adequate redress to those affected by the problem.
Civil society has an important role to play here, by pressing for the creation of the institutions of accountability and by making the best possible use of whatever institutions happen to exist. An exemplary case of brave civil society action has centred around the innovative drug policy discussed earlier. As the government has retreated somewhat in the face of intense pressure from global multinational interests, a group of consumer organisations, health activists and a few journalists have been struggling to retain the benefits that the country has achieved through the drug policy. In fact, a public interest case was filed in 1995 against the Bangladesh government for violation of various provisions of the original drug policy. As it happens, not a great deal came out of this legal process, but at least a beginning was made to test the validity of the notion of the right to health in the court of law.
The Community Clinics that were introduced in 1998 through the Health and Population Sector Programme (HPSP) had the potential to ensure accountability at the local level since the Clinics were supposed to be managed by health authorities jointly with representatives of local communities. That potential was lost when the idea of Community Clinics fell out of favour with the new Government that took power in 2001. However, with the closure of HPSP in 2002 and the subsequent launching of the Health, Nutrition and Population Sector Programme (HNPSP), a fresh attempt was made by the Government to devise a series of new mechanisms for ensuring voice and accountability. Specifically, the Government proposed three mechanisms to promote voice of the ordinary people: National Health Users’ Forum (NHUF); Health Advisory Committee (HAC); and Clients’ Charter of Rights.
260

Chowdhury & Osmani: Achieving the Right to Health 261
In addition to these government initiatives, a number of NGOs, civil society organisations, consumer associations and media also played an active role in the health sector to strengthen the voices of the poor, demand greater accountability, and generate information through public disclosure.
None of the government initiatives is working very well, however. In principle, the proposed Health Users’ Forum (HUF) was the most progressive of the government initiatives, since it aimed to involve all stakeholders (government, service providers, clients and communities) in working together to make public health facilities work better. The forums were to be formed at local through to national levels. They were to have access to international research and advocacy forums, so as to strengthen their rights-based approach, gender parity was to be ensured in the composition of the forums, and they were to form the basis for local planning, monitoring and evaluation. Unfortunately, however, the idea of HUFs has existed merely as a policy document without implementation.
The Health Advisory Committee (HAC) is composed of elected public representatives, service providers, local government officials and NGOs who are to meet and oversee service provision in a health facility. Where they have functioned well, the health authorities have benefited from this mechanism in a number of ways —for example, (a) the public have become more aware and sympathetic of the genuine limitations of the health facilities, (b) local representatives have assisted in ensuring cleanliness or security, and (c) NGOs have taken up issues such a staff placement with higher authorities. The local populations, on their part, have benefited from more timely services, less harassment by middlemen and medicine company representatives, and improved access for the poor and women. The problem, however, is that the HACs have remained largely inactive due to limitations of membership, information and resources.
On examining the reasons for the general failure of HACs as well as a small number of successes, a position paper by DFID drew a couple of important lessons:
• “The establishment of health committees is not, in itself, enough. Without training, support and ongoing mentoring, and without a clear goal and mandate, committees will stop functioning very quickly. Stakeholders need to develop skills around negotiation, representation and problem-solving, as well as record-keeping and committee management.
• Information and understanding are key for access and impact. When people have information, and when they believe that acting on that information can make a difference, they are more willing to risk the time and effort needed for participation in decision-making and, also, in health-seeking behaviour. Equally, when health professionals have better understanding of the lives
261

The Bangladesh Development Studies 262
and concerns of poor people, they are more willing to change their behaviour towards them and provide services which make poor people feel welcome” (quoted in IRT 2009b, pp.60-61).
Citizens’ Charter of Rights (CCR) was launched in 2004 with a view to making people aware of their rights to health. In 2007, the government published a revised version of the Charter, in which it introduced a standard set of clients’ rights in relation to health services. From the overall Clients’ Charter, individual charters were also developed, covering services at the Medical College and District Hospitals, and for the Upazila Health Complexes and the Union Sub-Centres. The development of charters was promising, although they lacked institutional and legal mechanisms for use by either citizens or government. They also lacked effectiveness as tools for voice and accountability, for two main reasons: first, the majority of the population, including the health service personnel, were unaware that these charters existed at all, and secondly, they were developed by a small number of government and health service personnel, without any significant consultation with the citizens.
Based on the review of experience of the last few years and also of various NGO experiences of working with the voice and accountability mechanisms of the HNPSP, a number of reforms have been proposed. For this purpose, a workshop was held in February 2009, in which a number of proposals were put forward to strengthen the voice and accountability mechanisms (Talukder and Rob 2009). How well these are implemented and how effective they would prove in enhancing voice and accountability in the health sector of Bangladesh remain to be seen.
VI. CONCLUDING OBSERVATIONS
In spite of the fact that Bangladesh did not have a proper Health Policy until 1998, more than a quarter century after independence, the country made impressive strides in improving the health status of its people during the 1980s and 1990s. This is especially true for child mortality and morbidity and women’s reproductive health —leading to a sharp fall in fertility. The achievements of Bangladesh with respect to mortality and fertility have been widely hailed by the international community as being exceptional for its level of economic and technological development. Mortality decline continued unabated after 2000, but progress on the nutritional front has been very slow and fertility decline stalled for a long interval before resuming its declining path towards the end of the decade. Incidentally, this was also the decade in which a Health Policy, two successive Health Sector Programmes, and a large-scale nutritional programme have been in operation. This is not to suggest that the policy regime was solely responsible for the slowdown in progress
262
Chowdhury & Osmani: Achieving the Right to Health 263
in nutrition and fertility after 2000, although the various inadequacies of the policies and programmes discussed in this paper must have contribute to the slowdown.
An important reason for the slowdown is that the avenues for easy and quick gains had already been exhausted in the preceding two decades—by launching massive campaigns for immunisation, safe water, and contraception. The health status of the country has reached a stage where further gains can only be made by reorienting the strategy in a way that ensures matching resources with goals in the most efficient manner. This would require more targeted focus on those segments of the population who have gained relatively less from the overall progress of the last three decades, which in turn would call for participatory planning at both local and national levels involving especially the disadvantaged groups, and strengthening the voice and accountability mechanisms. In short, the right-based approach to health— with its focus on equity, participation and accountability—is precisely what is needed to carry forward the successes of the past. This is of course an instrumental argument for adopting the rights-based approach to health. It complements the intrinsic argument that the State of Bangladesh has committed itself to fulfilling the rights to health for all its people and this commitment requires the State to ensure equity, participation and accountability in the health system, regardless of the instrumental value of these features in making the system more efficient, because these features constitute the very meaning of approaching health from the perspective of rights.
The analysis undertaken in this paper reveals that despite impressive gains being made on the health front, the health system of Bangladesh is characterised by many features that militate against the rights-based approach to health. For example, discrimination against the girl child in particular and women in general is still a problem even though it must be acknowledged that the gender gap in health and nutrition has narrowed down quite a bit over the years; the health system has remained stubbornly biased against the poorer segments of the population, and in some cases the bias has even become more pronounced, partly because the relative roles of public and private provision have reversed in the last couple of decades reducing the relative importance of public facilities to which the poorer people tend to turn more for their healthcare needs, and partly because numerous inadequacies and distortions in public healthcare facilities have compromised the potential egalitarianism of public provision itself; and despite several attempts to develop the institutions of voice and accountability the health system of Bangladesh is neither participatory nor accountable in any significant sense.
Addressing these shortcomings should receive top priority as the new Health Policy, whose draft was circulated soon after the new Awami League government came to power in 2009, is finalised in due course. The move to revitalise the
263

The Bangladesh Development Studies 264
Community Clinics, which can begin to build the process of participation and accountability from the grassroots up, is a step in the right direction. In addition, the new strategy must take on board all the lessons learned from the failures as well as successes of the successive health sector programmes in their attempts to infuse the principles of equity, participation, and accountability in their operational plans.
One issue that is often noted but not as often acted upon is that achieving the right to health is not just a matter of health policy, even if the latter is defined broadly to include food, nutrition, water, sanitation, etc. in addition to healthcare. Simultaneous recognition of many other complementary rights is also essential. For example, as noted earlier, recognition of the right to health entails recognition of people’s right to participate in decision-making processes and in accountability mechanisms. This is in turn requires recognition of people’s right to information, because voice cannot be exercised effectively without access to correct information on the content of policies, availability of resources, and progress of implementation, and also without information on exactly what constitutes an individual’s right to health.
In addition, since health status does not depend on health interventions alone, promotion of several other socio-economic rights must also be involved in the process of promoting the right to health. The point is that a person’s health is a joint outcome of a multiplicity of causal influences, so that interventions on different fronts, and hence attention to whole range of rights, may be needed if the right to health is to be fulfilled. 26 The right to education, particularly for women, is especially important as the status of children’s health has been found to be systematically related to mother’s education. Mothers’ own health and nutritional status is also instrumentally important for child health, in addition to being intrinsically important for the women themselves. Since mothers’ health is itself a function of women’s empowerment, these relationships suggest that the fulfilment of all kinds of rights that enhance women’s empowerment is also causally important for the health of a nation as a whole, not just for women’s health.27 The general 26 For example, a study by Deolalikar (2005) demonstrates the multi-dimensional nature of the causality behind child malnutrition in Bangladesh. Using data from the Child Nutrition Survey 2000 of the Bangladesh Bureau of Statistics as well as the Bangladesh Demographic and Health Survey 1999-2000, the study shows that poor nutrition outcomes for children were associated with a whole host of factors, including delayed and early terminated breastfeeding, low family food intake, low mother’s education, lack of access to health facilities, low village electrification, high food prices, and lack of access to safe water and sanitation. 27 Some of the links between gender discrimination, women’s empowerment and the health of a nation as a whole have been discussed in Osmani and Sen (2003).
264
Chowdhury & Osmani: Achieving the Right to Health 265
point here is that the fulfilment of any single right—in this case the right to health— is contingent upon simultaneous fulfilment of the full range of rights, including both socio-economic and civil political rights. The rights-based approach to health, therefore, needs to be embraced not as a stand-alone policy but as part of an integrated approach to the fulfilment all human rights—this is the essence of the idea of the right to development.
REFERENCES
Ahmed, M. 2004. “Effects of Regulations on Pharmaceutical Market in Bangladesh.” Available at: www.pharmadu.net/ articlesdetail.php?art= 2&pg=1.
Ahmed, S. M., G. Tomson, M. Petzold, and Z. N. Kabir. 2005. “Socioeconomic Status Overrides Age and Gender in Determining Health-Seeking Behaviour in Rural Banglasdesh.” Bulletin of the World Health Organization 83(2).
Akter, Islam and Shahidul Islam. 2006. Dhaka Medical College Hospital: A Diagnostic Study. Dhaka: Transparency International-Bangladesh.
Anwar, I., M. Sami, N. Akhtar, M. E. Chowdhury, U. Salma, M. Rahman and M. Koblinskya. 2008. “Inequity in Maternal Health-Care Services: Evidence from Home-Based Skilled-Birth-Attendant Programmes in Bangladesh.” Bulletin of the World Health Organization 86(4).
Barakat, Abul. 2002. “The Health and Population Sector Programme (HPSP): Why it Did Not Work and What can be Done?” Dhaka: University of Dhaka (mimeo).
Barakat, A., R. Huque and K. M. Syeduzzaman. 2003. “Case Studies on Private-Public Partnerships in the Health, Nutrition and Population (HNP) Sector in Bangladesh.” Dhaka: World Bank.
BBS. 2006. Key Indicators on Report of Sample Vital Registration System 2001-06. Dhaka: Bangladesh Bureau of Statistics.
_______2007. Child and Mother Nutrition Survey of Bangladesh 2005. Dhaka: Bangladesh Bureau of Statistics and UNICEF.
_______ 2008. Key Indicators on Report of Sample Vital Registration System 2008. Dhaka: Bangladesh Bureau of Statistics.
_______2009a. Statistical Yearbook 2009. Dhaka: Bangladesh Bureau of Statistics. _______2009b. Facts and Figures of Gender Compendium of Bangladesh 2009.
Dhaka: Bangladesh Bureau of Statistics.
265

The Bangladesh Development Studies 266
_______2009c. Gender Statistics of Bangladesh 2008. Dhaka: Bangladesh Bureau of Statistics.
_______2010. Report on Welfare Monitoring Survey 2009. Dhaka: Bangladesh Bureau of Statistics.
BBS and UNICEF. 1994. Progotir Pathey. Dhaka: Bangladesh Bureau of Statistics and United Nations Children’s Fund, Dhaka Office.
Begum, Sharifa. 1996. “Health Dimensions of Poverty.” In Hossain Zillur Rahman, Mahabub Hossain, and Binayak Sen, eds., 1987-94: Dynamics of Rural Poverty in Bangladesh. Dhaka: Bangladesh Institute of Development Studies (mimeo).
Begum, R. 2007. “Pharmaceutical Industries: Potentials and Possibilities.” NDC Journal 6(1).
Bhuiya, A., M. Chowdhury, F. Ahmed, A. M. Adams. 2001. “Bangladesh: An Intervention Study of Factors Underlying Increasing Equity in Child Survival.” In T. Evans, M. Whitehead, F. Diderichson, A. Bhuiya and M. Wirth, eds., Challenging Inequities in Health: from Ethics to Action. New York: Oxford University Press.
BHW. 2007. The State of Health in Bangladesh 2006: Challenges of Achieving Equity in Health. Dhaka: Bangladesh Health Watch and James P. Grant School of Public Health, BRAC University.
_______2008. The State of Health in Bangladesh 2007: Health Workforce in Bangladesh. Dhaka: Bangladesh Health Watch and James P. Grant School of Public Health, BRAC University, Dhaka.
_______2010. Bangladesh Health Watch Report 2009: How Healthy is Health Sector Governance? Dhaka: Bangladesh Health Watch and University Press Limited.
BIDS. 1988. “Bangladesh Health Finance and Expenditure Study.” Final Report of a study conducted for the Director General of Health Services, Government of Bangladesh. Dhaka: Bangladesh Institute of Development Studies (mimeo).
_______2006. Healthy Citizenship. (Newsletter). Dhaka: Bangladesh Institute of Development Studies.
Chaudhury, Nazmul and Jeffrey S. Hammer. 2003. “Ghost Doctors: Absenteeism in Bangladeshi Health Facilities.” Policy Research Working Paper no. 3065. World Bank, Washington, D. C.
266

Chowdhury & Osmani: Achieving the Right to Health 267
Chen, L. C., E. Huq and S. D'Souza. 1981. “Sex Bias in the Family Allocation of Food and Health Care in Rural Bangladesh.” Population and Development Review 7(1).
Chowdhury, A. and A. Bhuyia. 2001. “Do Poverty Alleviation Programmes Reduce Inequities in Health? Bangladesh Experience.” In D. Leon and G. Walt, eds., Poverty Inequality and Health: An International Perspective. London: Oxford University Press.
Chowdhury, A. M. R., A. Bhuiya, and K. M. A. Aziz. 1999. The ‘Near Miracle’ Revisited: Social Science Perspectives of the Immunization Programme in Bangladesh. Amsterdam: Het Spinhuis.
Chowdhury, A. M. R., Abbas Bhuiya, Simeen Mahmud, A. K. M. Abdus Salam and Fazlul Karim. 2003. “Immunization Divide: Who Do Get Vaccinated in Bangladesh?” Journal of Health, Population and Nutrition 21(3).
CIET. 1999. “Health and Population Sector Programme (1998-2003), Baseline Service Delivery Survey, Final Report.” Canada and Dhaka: CIET Canada and Ministry of Health and Family Welfare, Government of Bangladesh (mimeo).
_______2001. “Health and Population Sector Programme (1998-2003), Service Delivery Survey, Second Cycle, 2000, Final Report.” Canada and Dhaka: CIET Canada and Ministry of Health and Family Welfare, Government of Bangladesh (mimeo).
Collin, Simon M., Iqbal Anwar, and Carine Ronsmans. 2007. “A Decade of Inequality in Maternity Care: Antenatal Care, Professional Attendance at Delivery, and Caesarean Section in Bangladesh (1991–2004).” International Journal for Equity in Health 6(9).
CPD. 2003. “Health Sector Programme in Bangladesh: Promoting Participating and Gender Equity in Bangladesh.” Report no. 53. Dhaka: Centre for Policy Dialogue.
Dancer, D., A. Rammohan and M. D. Smith. 2008. “Infant Mortality and Child Nutrition in Bangladesh.” Health Economics 17.
Deolalikar, Anil. 2005. “Poverty and Child Nutrition in Bangladesh.”Journal of Developing Societies 21(1-2).
Dmytraczenko, Tania, Tahrat Shahid and Nistha Sinha. 2009. “Bridging Gaps across the Health Sector.” In A. Narayan and H. Zaman, eds., Breaking Down Poverty in Bangladesh. Dhaka: University Press Limited.
D'Souza, S. and A. Bhuiya. 1982. “Socioeconomic Mortality Differentials in a Rural Area of Bangladesh.” Population and Development Review 8(4).
267

The Bangladesh Development Studies 268
D'Souza, S. and L. C. Chen. 1980. “Sex Differentials in Mortality in Rural Bangladesh.” Population and Development Review 6(2).
Ensor, Tim, Priti Dave-Sen, Liaquat Ali, Atia Hossain, Shamim Ara Begum and Hamid Mora. 2002. “Do Essential Service Packages Benefit the Poor? Preliminary Evidence from Bangladesh.” Health Policy and Planning 17(3).
FMRP. 2006. Social Sector Performance Surveys: Primary Health and Family Planning in Bangladesh: Assessing Service Delivery. Dhaka and Oxford: Financial Management Reform Programme, Ministry of Finance, Government of Bangladesh and Oxford Policy Management.
_______2007. Governance, Management and Performance in Health and Education Facilities in Bangladesh: Findings from the Social Sector Performance Qualitative Study. Dhaka: Financial Management Reform Programme, Ministry of Finance.
Giashuddin, M. S., M. Kabir and M. Hasan. 2005. “Economic Disparity and Child Nutrition in Bangladesh.” Indian Journal of Pediatrics 72.
GK. 2000. Voices of the Unheard: Testimonies from the People’s Health Assembly. Dhaka: Gonoshasthya Kendra.
Glinskaya, Elena. 2005. “Education and Health Expenditures in Bangladesh: Benefit Incidence Analysis.” Journal of Developing Societies 21(1-2).
GOB. 2005. Unlocking the Potential: National Strategy for Accelerated Poverty Reduction. Dhaka: General Economics Division, Planning Commission, Government of Bangladesh.
Gwatkin, Davidson R., Shea Rutstein, Kiersten Johnson, Rohini P. Pande and Adam Wagstaff. 2000. “Socio-Economic Differences in Health, Nutrition and Population in Bangladesh.” Washington, D. C.: World Bank, HNP/Poverty Thematic Group (mimeo).
Gwatkin, Davidson R., Shea Rutstein, Kiersten Johnson, Eldaw Suliman, Adam Wagstaff, and Agbessi Amouzou. 2007. Socio-Economic Differences in Health Nutrition and Population: Bangladesh. Washington, D. C.: World Bank.
Haider, S. J., D. Hussain, I. Nayer, A. Maleque, Ashaduzzaman, and A.R. Khan. 2004. Impact Evaluation of Bangladesh Integrated Nutrition Project. Dhaka: IMED, Planning Commission, Government of Bangladesh.
HEU. 1998. Bangladesh National Health Accounts, 1996/97. Dhaka: Health Economics Unit, Ministry of Health and Family Welfare, Government of Bangladesh.
268

Chowdhury & Osmani: Achieving the Right to Health 269
_______2003. Bangladesh National Health Accounts, 1999-2001. Dhaka: Health Economics Unit, Ministry of Health and Family Welfare, Government of Bangladesh.
_______2007. Public Expenditure Review of the Health Sector 2003/04 to 2005/06. Dhaka: Health Economics Unit, Ministry of Health and Family Welfare, Government of Bangladesh.
Hossain, Naomi and Ferdous Osman. 2007. “Politics and Governance in the Social Sectors in Bangladesh, 1991–2006.” Research Monograph Series 34. Research and Evaluation Division, BRAC, Dhaka. Available at http://www.bracresearch.org/monographs/Monograph_34%20.pdf.
Hossain, S. M. Moazzem, Arabella Duffield and Anna Taylor. 2005. “An Evaluation of the Impact of a US$60 Million Nutrition Programme in Bangladesh.” Health Policy and Planning 20(1).
Huq, M. (ed). 1991. Near Miracle in Bangladesh. Dhaka: University Press Ltd. INFS. 1999. Mid-Term Evaluation of the Bangladesh Integrated Nutrition Project.
Dhaka: Institute of Nutrition and Food Sciences, University of Dhaka. IRT. 2009a. Bangladesh Health Population and Nutrition Sector Programme
(HPNSP): Annual Progress Review (APR), Vol. I: Main Consolidated Report. Dhaka: Independent Review Team, Ministry of Health, Family and Welfare, Government of Bangladesh.
_______2009b. Bangladesh Health Population and Nutrition Sector Programme (HPNSP): Annual Progress Review (APR), Vol. II: Technical Appendices. Dhaka: Independent Review Team, Ministry of Health, Family and Welfare, Government of Bangladesh.
Islam, N. 1999. “Bangladesh National Drug Policy: An Example for the Third World”? Tropical Doctor 29(2).
Jasimuddin, M., A. Ashraf, A. K. M. Sirajuddin, M. U. Alam and C. Tunon. 2001. “Incorporation of Community’s Voice into Health and Population Sector Programme of ICDDR, B, Bangladesh for its Transparency and Accountability.” ICDDR’B Working Paper no.148. International Centre for Diarrhoeal Diseases Research, Bangladesh, Dhaka.
Karim, R., S.A. Lamstein, M. Akhtaruzzaman, K.M. Rahman, and N. Alam. 2003. The Bangladesh Integrated Nutrition Project: Endline Evaluation of the Community Based Nutrition Component. Dhaka and USA: The Institute of Nutrition and Food Sciences, University of Dhaka, Bangladesh and The Friedman School of Nutrition Science and Policy, Tufts University.
269

The Bangladesh Development Studies 270
Karim, F., A. Tripura, M. S. Gani and A. M. R. Chowdhury. 2006. “Poverty Status and Health Equity: Evidence from Rural Bangladesh.” Public Health 120(3).
Khan, M. Mahmud. 1996. “Development of Private Health Care Facilities in Dhaka City: Impacts on Cost, Access and Quality.” Paper presented at the Centre for Development Research, Dhaka, Bangladesh.
Killingsworth, James R., Najmul Hossain, Yuwa Hedrick-Wong, Stephen D. Thomas, Azizur Rahman and Tahmina Begum. 1999: “Unofficial Fees in Bangladesh: Price, Equity and Institutional Issues.” Health Policy and Planning 14(2).
Mahmud, Simeen. 2004. “Citizen Participation in Health Sector in Rural Bangladesh: Perceptions and Realities.” IDS Bulletin 35(2).
_______2006. “Spaces for Participation in Health Systems in Rural Bangladesh.” In A. Cornwall and V. Coelho, eds., Spaces for Change? The Politics of Citizen Participation in New Democratic Arena. London: Zed Books.
_______2008. “Health Care Provision and Consumption in Bangladesh.” In S. R. Osmani (ed.) Emerging Issues in Bangladesh Economy: A Review of Bangladesh’s Development 2005-06. Dhaka: Centre for Policy Dialogue and University Press Limited.
Mahmud, W. 2008. “Social Development in Bangladesh: Pathways, Surprises and Challenges.” Indian Journal of Human Development 2(1).
Mirza, Tanjina. 2010. “Ensuring Accountability for Maternal, Child Health and New Born Care.” Dhaka: Plan International Canada (mimeo).
MOHFW. 1995. A Public Expenditure Review in the Health and Population Sector in Bangladesh. Dhaka: Health Economics Unit, Ministry of Health and Family Welfare, Government of Bangladesh.
_______1997. Expanded Programme on Immunization. National Coverage Evaluation Survey, Bangladesh. Dhaka: Directorate General of Health Services, Ministry of Health and Family Welfare, Government of Bangladesh.
_______2001. “Public Expenditure Review of the Health and Population Sector Programme, 1999/2000”. Research Paper 19. Health Economics Unit (HEU) and Management Accounting Unit (MAU), Ministry of Health and Family Welfare, Government of Bangladesh.
_______2002. Bangladesh Integrated Nutrition Project: Monitoring Report January 2002. Dhaka: Ministry of Health and Family Welfare, Government of Bangladesh.
270

Chowdhury & Osmani: Achieving the Right to Health 271
_______2005. “Health, Nutrition & Population Proposal (HNPPP), July 2003-June 2010.” Dhaka: Ministry of Health and Family Welfare, Government of the People’s Republic of Bangladesh.
_______2008a. Bangladesh Health Nutrition and Population Sector Programme: Mid-Term Review. Dhaka: Ministry of Health and Family Welfare, Government of Bangladesh.
_______2008b. Bangladesh Health Nutrition and Population Sector Programme: Mid-Term Review, Aide Memoire. Dhaka: Ministry of Health and Family Welfare, Government of Bangladesh.
NIPORT, Mitra and Associates and Macro International. 1994. Bangladesh Demographic and Health Survey 1993/94. Dhaka and Calverton, Maryland: National Institute of Population Research and Training (NIPORT), and Mitra and Associates, Dhaka and Macro International, USA.
_______1997. Bangladesh Demographic and Health Survey 1996/97. Dhaka and Calverton, Maryland: National Institute of Population Research and Training (NIPORT), and Mitra and Associates, Dhaka and Macro International, USA.
_______2001. Bangladesh Demographic and Health Survey 1999/00. Dhaka and Calverton, Maryland: National Institute of Population Research and Training (NIPORT), and Mitra and Associates, Dhaka and Macro International, USA.
_______2005. Bangladesh Demographic and Health Survey 2004. Dhaka and Calverton, Maryland: National Institute of Population Research and Training (NIPORT), and Mitra and Associates, Dhaka and Macro International, USA.
_______2009. Bangladesh Demographic and Health Survey 2007. Dhaka and Calverton, Maryland: National Institute of Population Research and Training (NIPORT), and Mitra and Associates, Dhaka and Macro International, USA.
NIPORT, Johns Hopkins University, Macro International, and ICDDR, B. 2003. Bangladesh Maternal Health Services and Maternal Mortality Survey. Dhaka, Baltimore, Maryland and Dhaka: National Institute of Population Research and Training (NIPORT), Johns Hopkins University, Macro International, and ICDDR, B.
OHCHR. 2006. Principles and Guidelines for a Human Rights Approach to Poverty Reduction Strategies. Geneva: Office of the High Commissioner for Human Rights.
271
The Bangladesh Development Studies 272
Osman, F. R. 2004. Policy Making in Bangladesh: A Study of the Health Policy Process. Dhaka: A. H. Development Publishing House.
______2008. “Health Policy, Programmes and System in Bangladesh: Achievements and Challenges.” South Asian Survey 15(2).
Osmani, S. R. 2000. “Human Rights to Food, Health and Education.” Journal of Human Development 1(2).
_______2005. “An Essay on the Human Rights Approach to Development.” In A. Sengupta, A. Negi and M. Basu, eds., Reflections on the Right to Development. New Delhi: Sage Publications.
_______2006. “Delivering Basic Health Services in Bangladesh: A View from the Human Rights Perspective.” In S. Ahmed and W. Mahmud, eds., Growth and Poverty: The Development Experience in Bangladesh. Dhaka: University Press Limited.
Osmani, S. R. and Amartya Sen. 2003. “The Hidden Penalties of Gender Inequality: Fetal Origins of Ill-Health.” Economics and Human Biology 1(1).
Rahman, Redwanur M. 2006. “Human Rights, Health and the State in Bangladesh.” BMC International Health and Human Rights 6(4).
Rahman, M. Shafiqur. 2007. “Socioeconomic Disparities in Health, Nutrition, and Population in Bangladesh: Do Education and Exposure to Media Reduce it?” Pakistan Journal of Nutrition 6(3).
Razzaque, Abdur, Peter Kim Streatfield and Dave R. Gwatkin. 2007 “Does Health Intervention Improve Socioeconomic Inequalities of Neonatal, Infant and Child Mortality? Evidence from Matlab, Bangladesh.” International Journal for Equity in Health 6(4).
Reich, M. A. 1994. “Bangladesh Pharmaceutical Policy and Politics.” Health Policy and Planning 9(2).
Save the Children UK. 2003. “Thin on the Ground: Questioning the Evidence behind World Bank Funded Community Nutrition Projects in Bangladesh, Ethiopia and Uganda.” London: Save the Children UK. [http://www. savethechildren. org.uk]
Schurmann, Anna and Simeen Mahmud. 2009. “Civil Sciety, Health and Social Exclusion in Bangladesh.” Journal of Health Population and Nutrition 27(4).
Talukder, Md. N. and U. Rob. 2009. “Strengthening Voice and Accountability in the Health Sector: Workshop Report.” Dhaka: Population Council.
272

Chowdhury & Osmani: Achieving the Right to Health 273
White, Howard. 2005. “Comment on Contributions Regarding the Impact of the Bangladesh Integrated Nutrition Project.” Health Policy and Planning 20(6).
_______ and Edoardo Masset. 2007. “Assessing Interventions to Improve Child Nutrition: A Theory-Based Impact Evaluation of the Bangladesh Integrated Nutrition Project.” Journal of International Development 19(5).
WHO. 2002. “Study on Improving Access to Health Care for the Poor and Vulnerable in Bangladesh.” Dhaka: World Health Organization (Mimeo).
_______2006. The World Health Report 2006: Working Together for Health. Geneva: World Health Organisation.
_______2003a. Private Sector Assessment for Health Nutrition and Population (HNP) in Bangladesh. Washington, D. C.:World Bank.
World Bank. 2003b. Bangladesh: Public Expenditure Review. Washington, D. C. and Manila: World Bank and Asian Development Bank.
_______2005a. Maintaining Momentum? An Impact Evaluation of Interventions to Improve Maternal and Child Health and Nutrition in Bangladesh. Washington, D. C.: Operations Evaluation Department, World Bank.
_______2005b. Project Performance Assessment Report: Bangladesh Integrated Nutrition Project. Washington, D. C.: Operations Evaluation Department, World Bank
_______2005c. “Comparative Advantages of Public and Private Health Care Providers in Bangladesh.” Bangladesh Development Series- Paper No. 4, World Bank Office, Dhaka.
Zaman, I. and A. Abdul. 2006. “Corruption in Public Health Service in Bangladesh.” In Global Corruption Report 2006. Berlin: Transparency International.
273