towards a more inclusive agricultural insurance program
TRANSCRIPT

DISCUSSION PAPER SERIES NO. 2019-38
DECEMBER 2019
Towards a More Inclusive Agricultural Insurance Program
Celia M. Reyes, Aubrey D. Tabuga, Nicoli Arthur B. Borromeo,Arkin A. Arboneda, and Carlos C. Cabaero
The PIDS Discussion Paper Series constitutes studies that are preliminary and subject to further revisions. They are being circulated in a limited number of copies only for purposes of soliciting comments and suggestions for further refinements. The studies under the Series are unedited and unreviewed. The views and opinions expressed are those of the author(s) and do not necessarily reflect those of the Institute. Not for quotation without permission from the author(s) and the Institute.
CONTACT US:RESEARCH INFORMATION DEPARTMENTPhilippine Institute for Development Studies
18th Floor, Three Cyberpod Centris - North Tower EDSA corner Quezon Avenue, Quezon City, Philippines
[email protected](+632) 8877-4000 https://www.pids.gov.ph

Towards a More Inclusive Agricultural Insurance Program
Celia M. Reyes Aubrey D. Tabuga
Nicoli Arthur B. Borromeo Arkin A. Arboneda Carlos C. Cabaero
PHILIPPINE INSTITUTE FOR DEVELOPMENT STUDIES
December 2019

ii
Abstract Typhoons, pests and other natural calamities cause the country, particularly the agricultural sector, significant damages. For instance, Typhoons Yolanda (Haiyan) and Ompong (Mangkhut) have caused PHP 35 billion and PHP 27 billion worth of agricultural damages, respectively, based on estimates by the Department of Agriculture. Given that a third of the country’s workforce depend on the agriculture sector, it is crucial that efforts are undertaken towards mitigation of the effects of these shocks and risks. One of these efforts is agricultural insurance as provided for by the Philippine Crop Insurance Corporation (PCIC). Using information from the PCIC, key informant interviews and focus group discussions with agricultural producers, and findings from earlier studies on agricultural insurance, this study examines the constraints in, opportunities, and efforts for achieving impact and inclusion of agricultural insurance programs in the Philippines. Keywords: Philippine Crop Insurance Corporation, agricultural insurance, Registry System in Basic Sectors in Agriculture

iii
Table of Contents 1. Introduction ..................................................................................................................... 1 2. The PCIC agricultural insurance program ..................................................................... 2
2.1. The Philippine Crop Insurance Corporation ................................................................ 2 2.2. Features of PCIC agricultural insurance program ....................................................... 5 2.3. PCIC special programs .............................................................................................. 8 2.4. Application process .................................................................................................. 11 2.5. Claims process ......................................................................................................... 12
3. Agricultural segments in the Philippines .................................................................... 26
3.1. Agricultural producers .............................................................................................. 26 3.2. Agricultural products................................................................................................. 29 3.3. Farm holdings .......................................................................................................... 33
4. Farmers’ awareness of agricultural insurance and the RSBSA ................................. 36
4.1. Analysis based on past PIDS studies and related literature ...................................... 37 4.2. Results from focus group discussion conducted in Cagayan Valley and Davao ....... 39
5. Updates on agricultural insurance: current and pending legislations ...................... 43 6. Summary and recommendations ................................................................................. 45 Bibliography ...................................................................................................................... 46 List of Tables Table 1. Regional and provincial extension offices of the PCIC .......................................... 2 Table 2. PCIC workforce, 2014-2017 .................................................................................. 4 Table 3. Cover ceiling for rice and corn crop insurance ....................................................... 5 Table 4. Distribution of agricultural producers listed in Versions 1 and 1.1 of the RSBSA,
by region and source agency ................................................................................ 8 Table 5. Requirements for insurance application .............................................................. 11 Table 6. Number of farmers/fisherfolks and area insured, 2017-2018 ............................... 12 Table 7. Provisions under the term insurance packages ................................................... 15 Table 8. PCIC Number of Claimants and Amount of Indemnity Paid, 2015-2018 .............. 16 Table 9. Number of PCIC insured farmers and claimants, 2015-2018 ............................... 19 Table 10. PCIC damage rate and loss ratio, 2015-2017 ...................................................... 22 Table 11. PCIC financial position, 2015-2017 ..................................................................... 25 Table 12. Number and area of holding/farm parcels by region, 2012 .................................. 33 Table 13. Agricultural area (in thousand hectares) by type of crop, 1992-2016 ................... 34 Table 14. Crop cover of the Philippines (in thousand hectares), 2013-2017 ........................ 34 Table 15. Farm sizes based on CAF and RSBSA, 2012 ..................................................... 35 Table 16. Distribution of insured parcels of land by farm size and product,
August 2015 - April 2016 ..................................................................................... 35 Table 17. Number of parcels insured by land size (compared with total number of farm
parcels from RSBSA and CAF) ........................................................................... 36

iv
List of Figures Figure 1. PCIC claims process ......................................................................................... 14 Figure 2. Number of workers by basic sector, 1995-2018 ................................................. 26 Figure 3. Agricultural workers (in thousand persons) by region, 2011-2018 ...................... 27 Figure 4. Agricultural workers (in thousand persons) by sex, age group, and educational
attainment, 2010-2015 ....................................................................................... 27 Figure 5. Agricultural producers registered in the RSBSA, 2012 ....................................... 28 Figure 6. Distribution of agricultural producers by region (% to total), 2012 ...................... 28 Figure 7. Volume of production (in metric tons) of palay, corn and HVCC, 1987-2018 ...... 29 Figure 8. Volume of palay production (in metric tons) by region, 1987-2018 ..................... 30 Figure 9. Volume of corn production (in metric tons) by region, 1987-2018 ...................... 30 Figure 10. Volume of HVCC production (in metric tons) by region, 1990-2018 ................... 31 Figure 11. Volume of production (in metric tons) in fishery, 1980-2018 ............................... 31 Figure 12. Volume of production (in metric tons) in fishery by region, 1980-2012 ............... 32 Figure 13. Distribution of agricultural producers by type of product, 2012 ........................... 33
1
Towards a more inclusive agricultural insurance program
Celia M. Reyes, Aubrey D. Tabuga, Nicoli Arthur B. Borromeo, Arkin A. Arboneda, and Carlos C. Cabaero*
1. Introduction The Philippines’ geographic positioning along the Pacific Ring of Fire and the Northwestern Pacific Basin makes the country highly vulnerable to tectonic and meteorological anomalies. An average of 20 typhoons strike the country every year (Flores 2018). Typhoons have cost the country significant damages. On a regular basis, typhoons are the main causes of agricultural losses, affecting the supply of agricultural products. For instance, Typhoon Yolanda (international name: Haiyan), which struck the Philippines in 2013, has left 6,300 casualties and has caused PHP 35 billion worth of agricultural damages based on estimates by the Department of Agriculture (DA) (Arcalas 2018). Meanwhile, in 2018, agricultural damages due to Typhoon Ompong (international code: Mangkhut) is at par with that of Yolanda at nearly PHP 27 billion. The country’s archipelagic nature, consisting of around 7,100 islands, also adds to the difficulty for communication and logistics in the event of natural disasters. Being a developing country and one which has a high number of families living below the poverty line (i.e. 3 million families), the Philippines also faces substantial constraints in terms of resources. Within such context, the agricultural sector usually suffers most of the brunt because many agricultural regions lie along the path of typhoons. A considerable proportion of the poor live in the rural and agriculture areas. Despite the rise of the industry and service sectors as key drivers of the economy, a sizable proportion (30%) of the country’s workforce still depend on the agriculture sector for their sustenance and livelihood. Given these, it is crucial that concerted efforts are undertaken towards proper mitigation of the risks. One of the important tools for this is agricultural insurance. The Philippine Crop Insurance Corporation (PCIC) is the government entity mandated to provide agricultural insurance services particularly to small farmers and fisherfolks. Unfortunately, not all farmers and fisherfolks, particularly the smallholders, are able to benefit from this mechanism. As of 2017, the PCIC agricultural insurance program have covered around 1.7 million farmers and fisherfolks. Of this number, 1.2 million are beneficiaries of the subsidized agricultural insurance programs (Philippine Crop Insurance Corporation 2018). Although there was a remarkable increase of 55% compared to end of 2016 coverage, this still leaves a sizable proportion that is yet to be covered as there are 8.8 million smallholder farmers and fisherfolks (i.e. those with holdings of up to seven hectares) registered in the Registry System for Basic Sectors in Agriculture (RSBSA)1. Using information from the PCIC, key informant interviews (KII), and focus group discussions (FGD) with agricultural producers as well as findings from earlier studies on agricultural insurance, this study examines the constraints in, opportunities, and efforts for achieving impact and inclusion of agricultural insurance programs in the Philippines. The main objective is to provide insights for improving the design of current and future agricultural insurance programs in the country.
* President, Research Fellow, Supervising Research Specialist, Research Specialist, and Research Analyst II, respectively, at the Philippines Institute for Development Studies 1 RSBSA is a nationwide database of information on farmers, laborers and fisherfolk in the country. A more in-depth discussion will be presented in Section 2.1.

2
This report is structured as follows: the succeeding section outlines the description and implementation of the PCIC agricultural insurance program. Section 3 discusses the different agricultural segments in the Philippines. Finally, various issues with regard to agricultural insurance arising from the KIIs and FGDs will be discussed, followed by recommendations on addressing these issues, including several legislations aimed at improving the agricultural insurance program in the country. 2. The PCIC agricultural insurance program2 Agricultural insurance is used as a mechanism for managing risk, providing a safety net for agricultural producers who suffer from external shocks (i.e. typhoons and other natural disasters) to their productivity (Reyes, Mina, et al. 2015). The fact that a large segment of the agricultural sector lies below the poverty line also places farmers in a disadvantage when it comes to gaining credit as they lack the means to be able to pay back loans. Thus, agricultural insurance plays a second role of becoming a collateral that can be used to lessen lender risk in the case of a default (Corpuz 2013). It is also implemented to give farmers more room to engage in riskier, albeit more profitable and productive farming practices, providing stability in the case of external shocks to production (Virola 2017). 2.1. The Philippine Crop Insurance Corporation The PCIC is a government-owned and controlled corporation that provides insurance protection to agricultural producers, particularly subsistence farmers, against losses of crops and non-crop agricultural assets due to natural calamities, pests, diseases, and other identified perils. Operating under the auspices of the DA, PCIC operations were decentralized to the regional level. However, there are only 13 PCIC regional offices (ROs) nationwide, compared to the 17 official regional classifications used by the Philippine Statistics Authority (PSA). To compensate with the fewer ROs and to make PCIC accessible with many agricultural producers, the PCIC has been continuously putting up a number of provincial extension offices. Since 2014, the PCIC now has 13 regional offices, 53 provincial extensions offices, and 17 service desks nationwide, as listed in Table 1. Table 1. Regional and provincial extension offices of the PCIC
Region Province Office Location/Address 1 Pangasinan 3rd Floor S & P North Bldg. Nancayasan, Urdaneta, Pangasinan
*San Vicente, Alaminos City, Pangasinan Ilocos Sur *National Highway, Brgy 2, Bantay, Ilocos Sur Abra **Office of the Provincial Agriculturist, Bangued, Abra Benguet *Benguet Agri-Pinoy Trading Center, Benguet State University
*BENCOM Bldg., Bekes, Buyacaoan, Buguias, Benguet 2 Cagayan Regional Government Center, Carig, Tuguegarao City, Cagayan
*Baptista Bldg., National Highway Libertad, Abulug, Cagayan
2 This section provides a consolidation and updating of PIDS Discussion Paper Nos. 2015-07, 2015-08 and 2017-39. Features of the PCIC agricultural insurance (Section 2.2), application process (Section 2.4) and claims process (Section 2.5) discussed in the sections are based on the brochures provided by the PCIC:
(a) Rice insurance: http://pcic.gov.ph/wp-content/uploads/2019/01/01-Rice-Crop-Insurance-September-03.pdf; (b) Corn insurance: http://pcic.gov.ph/wp-content/uploads/2019/01/01-Corn-Crop-Insurance-September-03.pdf; (c) HVC insurance: http://pcic.gov.ph/wp-content/uploads/2019/01/HVCC-Final.pdf; (d) Livestock insurance: http://pcic.gov.ph/wp-content/uploads/2019/01/01-Livestock-November-28.pdf; (e) Non-crop asset insurance: http://pcic.gov.ph/wp-content/uploads/2019/01/Non-Crop-Insurance-September-03.pdf; (f) Fisheries insurance: http://pcic.gov.ph/wp-content/uploads/2019/01/Fisheries-Insurance-Aug-17.pdf; and, (g) Credit and life term insurance: http://pcic.gov.ph/wp-content/uploads/2019/02/CLTI-BROCHURES.pdf

3
Region Province Office Location/Address **NIA MPIS Bulala, Camalaniugan, Cagayan
Isabela *3/F Heritage Bldg., Maharlika Highway, Centro Santiago City **BRO Office, Provincial Capitol, Ilagan City, Isabela **Mallig FST Office, Casili, Mallig, Isabela
Nueva Vizcaya **Office of the Provincial Agriculturist District IV, Bayombong Quirino **Tourism Office, Capitol Hill, Cabarroguis, Quirino Ifugao **PAENRO, Lagawe, Ifugao
** Office of the Provincial Agriculturist, Lamut, Ifugao Kalinga ** Office of the Provincial Agriculturist, Tabuk City, Kalinga
3 Pampanga Garcia Building, Villa Corazon, San Agustin, Mac Arthur Highway, San Fernando, Pampanga
Zambales *One Primer Bldg., Zone 4 Magsaysay St., Iba, Zambales 3-A Nueva Ecija 2nd Floor.CBNE, Building, Maharlika Highway, Cabanatuan City
Aurora *2nd Floor BG Plaza, Baler, Aurora 4 Laguna 2/F Rizal Commercial Center, JP Rizal St. corner MH del Pilar
Street, Calamba City, Laguna **Office of the Provincial Agriculturist, Santa Cruz, Laguna
Cavite **Provincial Agriculture Office, Trece Martires City, Cavite Batangas **Office of the City Veterinary and Agricultural Services,
Batangas City Rizal **Department of Agrarian Reform Provincial Office, Tanay, Rizal Quezon *Maharlika Kanlurang Mayao, Lucena City, Quezon Occidental Mindoro *Villamar Bldg, Juan Luna St., San Jose, Occidental Mindoro
*265 Salgado St., Buenavista, Sablayan, Occidental Mindoro Oriental Mindoro *K.B. Homes Zone 2, Pinamalayan, Oriental Mindoro Marinduque *Brgy. Isok 1, Boac, Marinduque Romblon *LFH Prominade Suite Bldg., Cocoville, Odiongan, Romblon Palawan *261 Malvar cor. P. Baltan St., Puerto Princesa City, Palawan
*Poblacion District II, Brooke’s Point, Palawan 5 Albay BB Andes Bldg., Zone 8, SOLS Subdivision, Legazpi City, Albay
Camarines Norte **Camarines Norte OPAG Camarines Sur *One Magsaysay Corporate Center, Naga City Catanduanes **Catanduanes OPAG Sorsogon **Sorsogon OPAG Masbate *Jerry Alerta Building, Tugbo, Masbate
6 Iloilo 2/F Regional Science Laboratory Building, Dept. of Agriculture, Fort San Pedro, Iloilo City *12 Washington St., Democracia, Jaro, Iloilo City
Aklan *G & F Radislao Bldg., Brgy. Jumarap, Banga, Aklan Antique *Barbaza MPC Bldg., Cerdena St., San Jose, Antique Capiz *Joeval’s Apartment, San Roque St., Roxas City, Capiz Negros Occidental *ACP Handumanan Bldg., Burgos cor San Juan Sts., Bacolod City
7 Cebu 2/F DBP Building, Osmeña Boulevard, Cebu City Bohol *BOPE Bldg., Rocha cor. Sikatuna St., Tagbilaran City, Bohol
*Ubay Business Center, Gaviola Compound, Ubay, Bohol Negros Oriental *Rafael Suites, Daro, Dumaguete City
*Verna’s Bldg., National Highway, Villareal, Bayawan City 8 Leyte 3/F F. Mendoza Realty Complex, 141 Sto. Niño St., Tacloban City
*Kokoy’s Grocery, 141 Sto. Niño St., Tacloban City

4
Region Province Office Location/Address *Indiana Heights, Haubon, San Isidro, Ormoc City
Southern Leyte *Visto Bldg., Brgy. Zone 5, Sogod, Southern Leyte Eastern Samar * Brgy. Alang-alang, Borongan City, Eastern Samar Northern Samar *Balite Bldg., Roxas St., Santol, Catarman, Northern Samar Western Samar *Mabini Avenue, Brgy. Patag, Catbalogan City, Western Samar
9 Zamboanga del Sur 4th Floor, City Commercial Center (C3), Rizal Avenue, Pagadian City *Mocreco Bldg., Yangco St., Madasigon, Molave
Zamboanga City *Sambongan Bayanihan Cooperative, Gen Vicente Alvarez St. Zamboanga del Norte *FSA Development, Andres Bonifacio College Drive, Dipolog City
*DBC Commercial Bldg., Disud, Sindangan Zamboanga Sibugay *Avery Arcade, Sanito, Ipil, Zamboanga Sibugay
10 Misamis Oriental 3/F One Montecarlo Building, Corrales-Hayes St., Cagayan de Oro City
Misamis Occidental *Oroquieta Town Center, Brgy. Canubay, Oroquieta City Bukidnon *Regidor Bldg., A. Mabini St., Valencia City, Bukidnon Agusan del Norte *Capitol Drive, Butuan City Agusan del Sur *Brgy. Pisaan, San Francisco Surigao del Norte *Ladaga Bldg., Washington, Surigao City Surigao del Sur *PAGE Bldg., Bag-ong Lungsod, Tandag City
11 South Cotabato 2/F SCGCC Building, Alunan Avenue, Koronadal City Davao del Norte *Ben S. Granada Training Center, RABE Subdivision, Tagum City Davao del Sur *Bureau of Fisheries Bldg., Bataan St., Digos City Davao City *Jacinto St. cor. Quezon Blvd., Davao City Davao Oriental *Provincial Capitol Compound, Mati City Compostela Valley *Mawab Municipal Hall Compound, Mawab, Compostela Valley Sarangani *National Bldg., Coop Office Capitol Compound, Alabel
12 Cotabato City Veraj Bldg., Mabinin Street, Poblacion 2, Cotabato City Sultan Kudarat *Torres Bldg., Poblacion 1, Lebak, Sultan Kudarat
*Provincial Training Center, Poblacion 2, Tacurong City Cotabato *MKTC Bldg., Quezon Boulevard, Kidapawan City
Lanao del Norte **Office of the Municipal Agriculturist, Baroy, Lanao del Norte Note: Regional offices are highlighted in orange; *Provincial Extension Offices; **Service desks. Source: PCIC In addition to this, the workforce of PCIC in its national and regional officers are continuously increasing to cope with the demand for agricultural insurance (Table 2). As of December 31, 2017, PCIC had total personnel complement of 836, composed of 211 regular employees, 621 under job order, and 4 consultants. This is a 33.1% increase from the previous year’s workforce of 628. Table 2. PCIC workforce, 2014-2017
2014 2015 2016 2017 Regular 191 209 208 211 Job order 316 373 413 621 Consultants 8 6 7 4 Total 515 588 628 836
Source: Commission on Audit (COA) Annual Audit Reports, various years
5
2.2. Features of PCIC agricultural insurance program Currently, the PCIC has seven major product lines — rice, corn, high-value crops (HVCs), livestock, fisheries, non-crop agricultural asset, and credit and life term insurance packages.
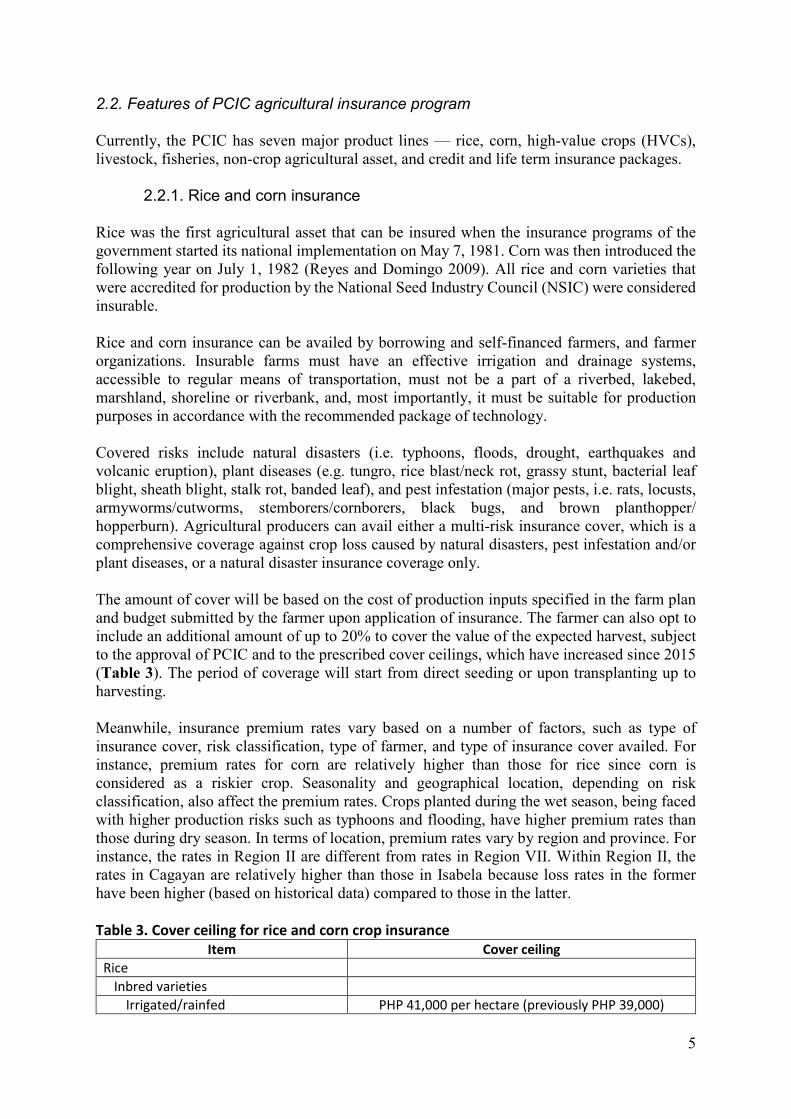
2.2.1. Rice and corn insurance Rice was the first agricultural asset that can be insured when the insurance programs of the government started its national implementation on May 7, 1981. Corn was then introduced the following year on July 1, 1982 (Reyes and Domingo 2009). All rice and corn varieties that were accredited for production by the National Seed Industry Council (NSIC) were considered insurable. Rice and corn insurance can be availed by borrowing and self-financed farmers, and farmer organizations. Insurable farms must have an effective irrigation and drainage systems, accessible to regular means of transportation, must not be a part of a riverbed, lakebed, marshland, shoreline or riverbank, and, most importantly, it must be suitable for production purposes in accordance with the recommended package of technology. Covered risks include natural disasters (i.e. typhoons, floods, drought, earthquakes and volcanic eruption), plant diseases (e.g. tungro, rice blast/neck rot, grassy stunt, bacterial leaf blight, sheath blight, stalk rot, banded leaf), and pest infestation (major pests, i.e. rats, locusts, armyworms/cutworms, stemborers/cornborers, black bugs, and brown planthopper/ hopperburn). Agricultural producers can avail either a multi-risk insurance cover, which is a comprehensive coverage against crop loss caused by natural disasters, pest infestation and/or plant diseases, or a natural disaster insurance coverage only. The amount of cover will be based on the cost of production inputs specified in the farm plan and budget submitted by the farmer upon application of insurance. The farmer can also opt to include an additional amount of up to 20% to cover the value of the expected harvest, subject to the approval of PCIC and to the prescribed cover ceilings, which have increased since 2015 (Table 3). The period of coverage will start from direct seeding or upon transplanting up to harvesting. Meanwhile, insurance premium rates vary based on a number of factors, such as type of insurance cover, risk classification, type of farmer, and type of insurance cover availed. For instance, premium rates for corn are relatively higher than those for rice since corn is considered as a riskier crop. Seasonality and geographical location, depending on risk classification, also affect the premium rates. Crops planted during the wet season, being faced with higher production risks such as typhoons and flooding, have higher premium rates than those during dry season. In terms of location, premium rates vary by region and province. For instance, the rates in Region II are different from rates in Region VII. Within Region II, the rates in Cagayan are relatively higher than those in Isabela because loss rates in the former have been higher (based on historical data) compared to those in the latter. Table 3. Cover ceiling for rice and corn crop insurance
Item Cover ceiling Rice
Inbred varieties Irrigated/rainfed PHP 41,000 per hectare (previously PHP 39,000)

6
Seed production PHP 50,000 per hectare (previously PHP 41,000) Hybrid varieties
Commercial production (F1) PHP 50,000 per hectare (previously PHP 42,000) Seed production (A x R) PHP 65,000 per hectare (previously PHP 52,000)
Corn Hybrid varieties PHP 76,000 per hectare (previously PHP 40,000) Open-pollinated varieties PHP 68,000 per hectare (previously PHP 28,000)
Source: PCIC
2.2.2. High value crop insurance HVC insurance started for tobacco as an interim coverage on September 1991. The PCIC then expanded the coverage on October 1993 to cover all HVCs (Reyes and Domingo 2009). This includes abaca, ampalaya (bitter gourd), avocado, baguio beans, banana, broccoli, cabbage, cacao, cacao nursery seedlings, calamansi tree, carrot, cashew tree, cassava, cauliflower, celery, chayote, Chinese pechay, coffee, coconut, commercial trees like falcate/mahogany and rubber, cotton, cucumber, durian, eggplant, garlic, ginger, guyabano, honeydew, jackfruit, lanzones, lettuce, melon, mango (fruit and tree), mangosteen, marang, melon, mongo (mung bean), onion, oil palm, okra, oil palm, onion, onion leek, orange tree, paper tree, papaya, patani, patola, peanut, pechay, pepper, pineapple, pole sitao, radish, rambutan, sayote, shallot, snapbeans, sorghum, soybeans, squash, star apple, strawberry, stringbeans, sugarbeet, sugarcane, sweet corn, sweet peas, sweet potato, sweet/hot/bell pepper, tiger grass, tobacco, tomato, upo, watermelon, white potato, winged beans, yam, and zucchini (PCIC, n.d.; Cajucom, 2013). Covered risks include typhoon, flood, drought, earthquake, volcanic eruption, plant diseases, pest infestations and accidental fire. Other perils may be covered, subject to the approval of PCIC. Coverage under this insurance package is available for plantation owners, cooperative farm farmers, corporate farm owners, and other planter or growers with insurable interest on the farm, who grows high-value crops individually or collectively. The amount of cover (or sum insured) shall be the cost of production inputs as agreed upon by PCIC and the insured, including a portion of the value of the expected yield (at the option of the farmer) but not to exceed 120% of the cost of production inputs. Insurance premium is solely shouldered by the farmers. Premium rates are based on the existing market rate and “shall range from 2% to 7% of the total sum insured, subject to any deductible and co-insurance provisions.” Similar to rice and corn, premium rates for HVCs vary per policy and are based on several factors, including pre-coverage evaluation of the type and number of risks to be covered, location-specific agro-climatic conditions, soil type, terrain, farm management practices, and production and loss records. Among the covered HVCs, baguio beans has the lowest premium rate at 1.55%, which is lower than the threshold of 2% since growers of this crop had not yet filed claims.
2.2.3. Livestock insurance Livestock insurance can be: (1) non-commercial and commercial mortality insurance cover for cattle, carabao, horse, swine, goat, sheep, (2) commercial mortality insurance cover for poultry; (3) special coverage for livestock dispersal, and (4) special cover for game fowls and animals, such as fighting cocks and race horses.

7
Covered risks for livestock dispersal and non-commercial livestock insurance include several diseases (e.g. parasitic diseases, leptospirosis, cancerous diseases, rabies, poisoning, heat stroke), all types of accidents except vehicular accidents, fire, lightning, dog bites (for goat and sheep only), and accidents arising from the transport of animals to and from the farm and place of treatment. All of these risks except for fire and lightning are covered under the commercial livestock insurance and special insurance for game fowls and animals. For poultry animals, covered risks include catastrophic losses arising from death of birds due to accidents and/or diseases. Moreover, farmers can opt to have an extended coverage to include other risks, particularly epidemic diseases, subject to certain conditions set by the PCIC, and additional premium per type of disease added.
2.2.4. Fisheries insurance PCIC introduced the fisheries insurance in 2011 as its newest addition to their insurance products. This covers inland fish structures such as fishponds, fish cages and fish pens. This insurance product protects fisherfolk, and fish farmers and growers against losses in unharvested aquaculture crop or stock in fisheries due to natural calamities and fortuitous events. The value of own and hired labor can be also covered as long as these are specified in the fisheries farm plan and budget. Premium rates for fisheries insurance are solely determined by the PCIC, which depends on the result of the pre-coverage evaluation of the type of product to be insured and other factors such as agro-climatic conditions and terrain, project management practices and factors, and production and loss records.
2.2.5. Non-crop agricultural asset insurance In 1996, PCIC, in an effort to become a “one-stop shop for agricultural insurance,” has started its non-crop agricultural asset insurance program. This insurance program covers warehouses, rice mills, fishing boats, irrigation facilities, and other farm equipment and agri-fishery-forestry assets and facilities (Cajucom 2013). This is to provide protection to agricultural producers against losses of their non-crop agricultural assets in cases of fire, lightning, theft, and earthquake. Premium rates depend on the type of risk/s and/or equipment to be insured. Rates for fire and lightning, and commercial car coverage are in accordance to prevailing industry practices. For property floater, premium rate is primarily based on location/area and is not lower than 1% of the sum insured “if the coverage is an initial insurance coverage for the subject property or the rate as expiring if renewal, subject to a minimum premium of PHP 400 per policy.”
2.2.6. Credit and life term insurance PCIC introduced term insurance packages in 2005, since agricultural risks also include risks to the lives of agricultural producers themselves. This is to provide life and accident coverage to their clients. The credit and term insurance packages include three different plans: Agricultural Producers Protection Plan (AP3), Loan Repayment Protection Plan (LRP2), and Accident and Dismemberment Security Scheme (ADS2). Specifically, AP3 covers death of the insured due to accident, natural causes, and murder or assault, LRP2 guarantees the payment of the face value or the amount of the approved agricultural loan upon the death or total permanent

8
disability of the insured borrower, while ADS2 covers death or dismemberment or disablement of the insured due to accident. Agricultural producers, preferably with existing agricultural insurance coverage with PCIC, including their family members up to the 4th degree of consanguinity or affinity, and farm workers aged 15 to 80 years old are eligible for coverage under AP3 and ADS2 Individual and Group Plan, while those aged 12 to 80 years old can avail of the ADS2 Family Plan. For LRP2, any individual or group of farmers with ages 18 to 80 years old who availed of agricultural loans are eligible for coverage. 2.3. PCIC special programs In addition to the regular programs, wherein, as discussed in Section 2.2, rice and corn farmer clients pay a portion of the total premium amount while other agricultural producers, including HVC farmers, livestock/poultry raising, and fisherfolk, are paying the full amount of insurance premium, PCIC also implements various special programs. Under these special programs, the insurance premium is fully subsidized by the government.
2.3.1. Registry System for Basic Sectors in Agriculture (RSBSA) In 2014, the PCIC started implementing the Department of Budget and Management (DBM)-funded special program named “Agricultural Insurance for Farmers and Fisherfolk Registered in the Registry System for Basic Sectors in Agriculture (RSBSA).” The RSBSA is a listing of basic sectors in agriculture3 (i.e. those involved in crop and animal production, aquaculture, and fishing). This registry, which was conducted in 2012, covers 75 provinces in 15 regions (excluding NCR and ARMM). PCIC copy of the RSBSA consists of 9,760,900 agricultural producers from the covered provinces4. In an effort to improve the registry, various agencies such as the DAR, PCIC, NIA, BFAR, and DA submitted a list of farmers and other agricultural producers to the DBM. These were then consolidated to form the second version of the RSBSA (dubbed as Version 1.1). This version consists of 3,845,437 farmers and fisherfolks. Planning offices of both the DA (i.e. Field Programs Operational Planning Division or FPOPD), being the current custodian of the RSBSA, and the PCIC (i.e. Planning and Management Information Office or PMIO) mentioned that there are currently no attempts in merging both versions of the RSBSA. This is mainly due to the mismatch or difference in definitions and/or methodologies in some of the variables included in the lists. However, the DA-FPOPD, through its Information and Communications Technology Service (ICTS), are currently validating the information in both lists to come up with an updated registry of agricultural producers in the country. Table 4. Distribution of agricultural producers listed in Versions 1 and 1.1 of the RSBSA, by region and source agency
Region Version 1 Version 1.1
Combined DAR PCIC NIA BFAR DA Total
NCR .. 0 0 0 8,442 0 8,442 8,442 CAR 318,330 53,537 2,101 376 12,409 11,252 79,675 398,005 Region I 649,927 94,880 234 234 48,156 56,815 200,319 850,246
3 Excluded in the RSBSA are persons who own and provide the means or factors of production but are not directly or personally and physically engaged in farming or fishery. 4 In contrast, RSBSA data set provided to PIDS consisted of 9,780,101 farmers, farm laborers, and fisherfolk.

9
Region II 692,105 119,269 768 340 46,833 26,020 193,230 885,335 Region III 693,008 230,178 385 385 78,978 142,582 452,508 1,145,516 Region IV-A 592,734 87,776 114 114 88,043 138,462 314,509 907,243 Region IV-B 483,630 98,674 153 129 98,645 43,819 241,420 725,050 Region V 828,932 132,936 951 139 91,417 9,955 235,398 1,064,330 Region VI 1,026,111 191,131 393 174 108,544 21,524 321,766 1,347,877 Region VII 922,933 103,978 210 205 83,898 6,793 195,084 1,118,017 Region VIII 721,274 152,568 5,427 133 108,238 55,799 322,165 1,043,439 Region IX 507,926 96,102 6,560 103 68,036 1,345 172,146 680,072 Region X 710,133 106,240 522 145 45,794 9,399 162,100 872,233 Region XI 474,153 122,467 545 66 35,818 6,084 164,980 639,133 Region XII 672,982 214,802 1,350 238 63,332 89,054 368,776 1,041,758 Caraga 376,722 134,385 1,244 159 35,156 24,926 195,870 572,592 ARMM .. 0 0 0 217,049 0 217,049 217,049 Total 9,670,900 1,938,923 20,957 2,940 1,238,788 643,829 3,845,437 13,516,337
Source: PCIC Planning and Management Information Office (PMIO) For the purposes of the RSBSA special program only, the PCIC, through its PMIO-IT Team, combined and analyzed the two lists of farmers and fisherfolks. Removing names found in both versions of the RSBSA using the PCIC Automated Business Systems (PABS), the list was then adjusted from 13,516,337 to a total of 10,915,180 records, consisting of 5,481,428 farmers, 4,069,433 laborers, and 1,364,319 fisherfolks. This special program fully subsidizes the insurance premium of all subsistence farmers and fisherfolk registered under the RSBSA for all insurance product lines offered by the PCIC, except for the term insurance packages. In 2014, the ceiling cover for rice and corn is the same as that under the regular program. In 2015, the maximum cover is the actual amount of loan for borrowing farmers, while at PHP 20,000 per hectare for self-financed farmers. Livestock raisers should only apply under the non-commercial mortality insurance cover category while poultry raisers are allowed to insure up to a maximum of 5,000 heads/birds for broiler and 1,000 heads/birds for pullets/layers. For fisheries, under aquaculture projects, a maximum of 1,000 square meters of inland fishpond and seaweed farm while 400 square meters for mariculture parks/off shore (fish cage/fish pen) can be insured. For non-crop agricultural assets, the program can insure up to a maximum of three units of fishing boats/equipment or three agricultural equipment/machineries. In addition to these qualifications, farmers are also prioritized based on their location and size of farm landholding. Coverage must be intensive in provinces listed under the DA Special Area for Agricultural Development (SAAD) program5. In terms of farm size, first priority is given to farmers tilling an area of 1.5 hectares and below, second priority is for those tilling an area of more than 1.5 hectares to 2.0 hectares, while third priority is given to those tilling an area of more than 2.0 hectares to 3.0 hectares. Last to be prioritized are farmers tilling an area of more than 3.0 hectares, subject to the limitation that only 3.0 hectares of their total farm landholding shall be entitled to full premium subsidy.
2.3.2. DA insurance programs PCIC also offers five special insurance programs under the DA: Sikat Saka, Weather-Adverse Rice Areas (WARA), High-Yield Technology Adoption (HYTA), Program for Unified
5 Provinces listed under the SAAD program: Apayao, North Cotabato, Western Samar, Sarangani, Eastern Samar, Lanao del Sur, Northern Samar, Maguindanao, Zamboanga del Norte, and Negros Oriental.

10
Lending in Agriculture/Production Loan Easy Access (PUNLA/PLEA), and Yolanda Rehabilitation and Recovery Program (YRRP). The Sikat Saka program is the credit component of the DA Food Staples Sufficiency Program (FSSP), with the Land Bank of the Philippines (LBP) as the program’s lending conduit. The program provides full premium subsidy for rice crop insurance coverage of subsistence farmers located in 45 major rice-producing provinces6. Qualified beneficiaries are members of irrigators’ associations that are identified by the National Irrigation Administration-Irrigators Association (NIA-IA) focal person based on the program lending criteria. Moreover, eligible farm lands must satisfy the following criteria: (1) have an effective irrigation and functional drainage system; (2) size of 0.5 to 5.0 hectares; (3) located at more than 200 meters to the nearest body of water or marshland; (4) can be reached by a regular means of transportation, and; (5) must be within a generally peaceful and stable peace and order location. Under the program, the maximum amount of cover is the amount of loan granted by the LBP. The WARA program is a fully subsidized rice insurance coverage for farmers in identified areas affected by climate change. All subsistence rice farmers identified and verified by regional DA offices to be in areas with adverse agro-climatic conditions and those affected by climate change can be insured under the WARA program. Eligible farms must be covered not later than 15 days after direct seeding or transplanting and must be certified by the Supervising Agricultural Technologist as not exposed to the risks covered. The maximum amount of cover under this special program is PHP 10,000 per hectare. PUNLA and PLEA are special credit facilities designed by the Agricultural Credit Policy Council (ACPC) for marginal farmers and fisherfolk to address their financial needs for affordable credit. PUNLA, which is implemented in the identified 15 poorest provinces7, provides a simplified and non-collateralized lending to intended beneficiaries of the agricultural loan program with interest of 6% per annum. On the other hand, PLEA, which is implemented nationwide, has a flexible repayment period based on borrower’s cash flow but not to exceed two years. The PCIC provides premium subsidy for the free insurance coverage of farms and/or farm investments, subject of agricultural loans, of farmers and fisherfolk participating in PUNLA/PLEA to be covered under PCIC’s RSBSA free crop insurance program. Lastly, the PCIC also implemented in 2014 a special program for Typhoon Yolanda-affected farmers and fisherfolk. With a total budget of PHP 88.015 million, the said program provided full premium subsidy to those agricultural producers in Regions VI, VII and VIII who were victims of Yolanda. The program covers all product lines.
2.3.3. Agrarian Production Credit Program (APCP) and Credit Assistance Program for Program Beneficiaries Development (CAP-PBD)
The APCP and CAP-PBD are both financing programs implemented by the DA, DAR, and LBP that provides credit to agrarian reform beneficiaries (ARBs). Credit assistance under both
6 Major rice producing provinces: Agusan del Sur, Aklan, Albay, Antique, Bataan, Bohol, Bukidnon, Bulacan, Cagayan, Camarines Sur, Capiz, Davao del Norte, Davao del Sur, Ilocos Norte, Ilocos Sur, Iloilo, Isabela, Kalinga, La Union, Laguna, Lanao del Norte, Lanao del Sur, Leyte, Maguindanao, Masbate, Negros Occidental, North Cotabato, Northern Samar, Nueva Ecija, Nueva Vizcaya, Occidental Mindoro, Oriental Mindoro, Palawan, Pampanga, Pangasinan, Quezon, Sorsogon, South Cotabato, Sultan Kudarat, Tarlac, Western Samar, Zambales, Zamboanga del Norte, Zamboanga del Sur, and Zamboanga Sibugay. 7 Identified poorest provinces: Apayao, Eastern Samar, Western Samar, Northern Samar, Negros Oriental, Zamboanga del Norte, Sulu, Agusan del Sur, Lanao del Norte, Cotabato, Sarangani, Maguindanao, Benguet, Bukidnon, and Siquijor.
11
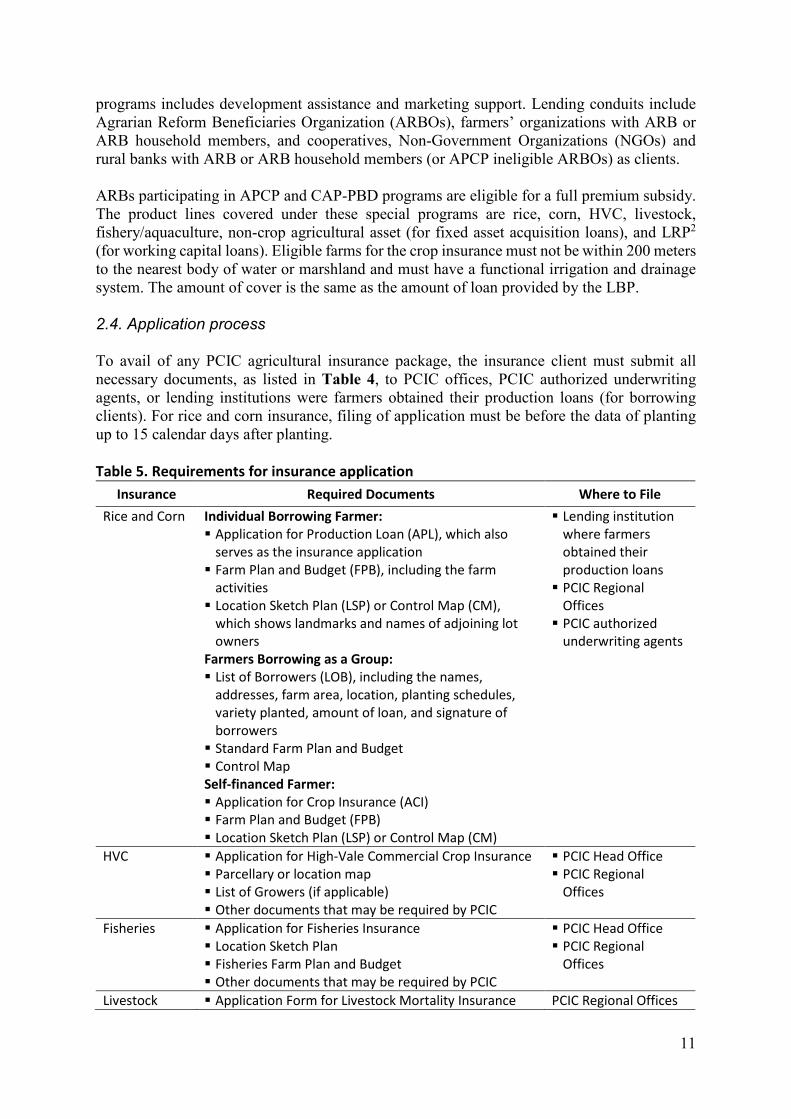
programs includes development assistance and marketing support. Lending conduits include Agrarian Reform Beneficiaries Organization (ARBOs), farmers’ organizations with ARB or ARB household members, and cooperatives, Non-Government Organizations (NGOs) and rural banks with ARB or ARB household members (or APCP ineligible ARBOs) as clients. ARBs participating in APCP and CAP-PBD programs are eligible for a full premium subsidy. The product lines covered under these special programs are rice, corn, HVC, livestock, fishery/aquaculture, non-crop agricultural asset (for fixed asset acquisition loans), and LRP2 (for working capital loans). Eligible farms for the crop insurance must not be within 200 meters to the nearest body of water or marshland and must have a functional irrigation and drainage system. The amount of cover is the same as the amount of loan provided by the LBP. 2.4. Application process To avail of any PCIC agricultural insurance package, the insurance client must submit all necessary documents, as listed in Table 4, to PCIC offices, PCIC authorized underwriting agents, or lending institutions were farmers obtained their production loans (for borrowing clients). For rice and corn insurance, filing of application must be before the data of planting up to 15 calendar days after planting. Table 5. Requirements for insurance application
Insurance Required Documents Where to File Rice and Corn Individual Borrowing Farmer:
Application for Production Loan (APL), which also serves as the insurance application Farm Plan and Budget (FPB), including the farm
activities Location Sketch Plan (LSP) or Control Map (CM),
which shows landmarks and names of adjoining lot owners
Farmers Borrowing as a Group: List of Borrowers (LOB), including the names,
addresses, farm area, location, planting schedules, variety planted, amount of loan, and signature of borrowers Standard Farm Plan and Budget Control Map Self-financed Farmer: Application for Crop Insurance (ACI) Farm Plan and Budget (FPB) Location Sketch Plan (LSP) or Control Map (CM)
Lending institution where farmers obtained their production loans PCIC Regional
Offices PCIC authorized
underwriting agents
HVC Application for High-Vale Commercial Crop Insurance Parcellary or location map List of Growers (if applicable) Other documents that may be required by PCIC
PCIC Head Office PCIC Regional
Offices
Fisheries Application for Fisheries Insurance Location Sketch Plan Fisheries Farm Plan and Budget Other documents that may be required by PCIC
PCIC Head Office PCIC Regional
Offices
Livestock Application Form for Livestock Mortality Insurance PCIC Regional Offices

12
Insurance Required Documents Where to File Veterinary Health Certificate
Term Application Form (AP3, LRP2, ADS2) Health Statement Form Medical Certificate, if applicable
PCIC Regional Offices PCIC Insurance
Underwriter PCIC authorized
underwriting agents Source: PCIC As of December 2018, there are 2,203,919 farmers and fisherfolks who availed of PCIC’s various insurance lines (Table 5). This is 29.7% more than the 1,699,871 insured in the previous year. In both years, almost half are insured under rice and corn insurance. In terms of area, a total of 1.8 million hectares were insured under crop insurance (i.e. rice, corn and HVC), which is 36.9% more than the 1.3 million hectares insured in 2017. These are largely due to the increased appropriation for the RSBSA agricultural insurance program from PHP 2.5 billion in 2017 to PHP 3.5 billion in 20188. Table 6. Number of farmers/fisherfolks and area insured, 2017-2018
Insurance Program 2017 2018*
Number of Farmers/Fisherfolk
Area (in hectares)
Number of Farmers/Fisherfolk
Area (in hectares)
Rice 619,338 837,118 768,675 1,026,382 Corn 179,363 256,113 247,824 370,803 Combined Rice & Corn 798,701 1,093,231 1,016,499 1,397,186 HVC 194,020 235,455 305,772 421,863 Livestock 216,204 - 334,087 - Fisheries 5,771 - 40,467 - Non-Crop Insurance 22,873 - 4,115 - Credit & Life Term Insurance 462,302 - 502,979 - Total 1,699,871 1,328,686 2,203,919 1,819,049
Note: *Tentative Source: PCIC Status of Implementation of Major Programs/Projects 2.5. Claims process The process of claiming indemnity is the same for crop (rice, corn and HVC) and fishery insurance packages. The assured crop or fish farmer, or any immediate member of his/her family, has to file a claim to the concerned PCIC Regional Office within a particular period from the occurrence of loss. For crops, filing of claims must be done within 45 calendar days for rice and corn, and within 30 calendar days for HVC. On the other hand, claims for fishery insurance must be filed within seven calendar days. After filing, a team of adjusters (TA) will conduct verification and loss assessment to be submitted to the concerned Regional Office. For rice and corn, the TA consists of one member from the PCIC and one from any of the following: DA, DILG, DAR, NIA, or concerned lending institution. For HVC, the TA consists of at least two members deputized by the PCIC, usually
8 PCIC Review of Operations for the Year Ended December 31, 2018 (tentative). http://pcic.gov.ph/wp-content/uploads/2019/01/December18-narrative-of-results-of-operations1svpFINAL.pdf

13
from the Philippine Council for Agriculture, Forestry and Natural Resources Research and Development (PCARRD) and DENR. For fishery, the TA consists of a member each from the PCIC, BFAR and the LGU personnel assigned on the fisheries program. The assessment of the TA on the amount of indemnity or claims to be paid for rice and corn is based on the stage of cultivation at the time of loss, actual cost of production inputs incurred at the time of loss (as indicated in the farm plan and budget), and percentage of yield loss9. Moreover, indemnity amount for HVC insurance is based on the actual cost of production inputs incurred at the time of loss as per farm plan and budget (subject to the limits stipulated in the policy contract), pro-rated cost of harvested crops, salvage value (if any), and percentage of yield loss9. On the other hand, the amount of indemnity for fishery insurance is “determined based on the severity of damage with the use of applicable loss prediction models (if available) [, and any or] a combination of the following methods may be utilized depending on practicability: (a) actual production count, if applicable; and, (b) production (difference approach, where the extent of damage shall be measured and expressed as the ratio of the difference of the average normal and actual productions to the average normal production).” If loss is due to pests and diseases, an adjustment factor is used by the PCIC to determine the amount of claim to be paid to the farmer. This adjustment factor is based on the deviation to natural crop stand and is scored as follows: 1.0 if no deviation, 0.8 if moderate deviation or 0.65 if normal deviation. In the event of loss arising from risks insured against, a written Notice of Loss (NL) shall be sent to the PCIC Regional Office within 20 calendar days (for crops) or within 2 calendar days (for fishery) from the occurrence of loss and before the scheduled date of harvest. In cases of loss of rice and corn “is due to pest infestation, disease, or drought, in which the effect of damage is gradual or the full extent is not immediately determinable, the NL shall be filed upon discovery of loss.” Filing of loss report shall not be later than 20 calendar days before the scheduled date of harvest. For HVCs, which are perishable in nature, the NL shall be filed within 3 days from the time of occurrence of perils, or within the prescribed period specified in the policy contract. All claims for indemnities are settled within 60 calendar days from the submission of complete claims documents. Meanwhile, crop farmers who have not filed any indemnity claims for three successive cropping periods are entitled to a no-claim benefit of 10 percent. Unlike crop and fishery insurance, PCIC does not conduct verification and loss assessment for livestock insurance. The assured livestock raiser only needs to submit a pro-forma NL10 within 10 days from the death of the insured animal. Other documents11, on the other hand, such as claim for indemnity and loss report, must be filed within 30 days. Claims for indemnity are
9 Yield loss is categorized as either total loss (if 90% or above), partial loss (if more than 10% but below 90%), or no loss (if 10% or below). 10 “can be in the form of telegram, fax, e-mail, or any other form of written statement containing the name of the assured, address, policy [number], livestock insured, cause of death, and date of the occurrence of death” (PCIC, 2014) 11 i.e., “(a) claim for indemnity/loss report, duly accomplished [and signed] by the assured; (b) veterinary disease report, duly accomplished and signed by the authorized veterinarian or LGU livestock inspector/technician; (c) original copy of the certificate of ownership/transfer of large cattle or certified machine cope of memorandum receipt for government-dispersed animals; (d) livestock death certificate; (e) necropsy/laboratory reports, if performed; (f) photographs of the dead animal/s showing clearly the identifying marks ([e.g.,] eartags, earnotch, brand, or tattoo); [and,] (g) other documents as may be required by the PCIC such as affidavit of two disinterested parties. For poultry[:] (a) weekly loss report; (b) veterinary report accomplished by his duly authorized veterinarian; (c) farm management chart or daily mortality chart; (d) photographs of dead birds; and, (e) pertinent proof of proceeds” (PCIC, 2014).

14
settled within 45 days from the receipt of all claim documents. These documents submitted by the assured producer are the sole bases for the indemnity payment. Figure 1. PCIC claims process
Source: PCIC Citizen’s Charter Similar to the above insurance packages, assured producers under the non-crop agricultural asset insurance must file a NL indicating the number and type of policy, location, data and time of occurrence of loss, and other required information by the PCIC. The NL and a proof of loss must be filed to the PCIC Regional Office within a specified number of days from the occurrence of loss depending on the type of insurance availed: 60 days for fire and lightning, ninety 90 days for property floater, and 3 days from NL filing for commercial car. The claim will be assessed and adjusted by a PCIC staff or an adjuster appointed by the PCIC. After the adjustment and submission of necessary documents, the claim will be settled as soon and as quickly as possible. For the term insurance packages, filing for indemnity claims must be done within 45 days from the death (for LRP2), dismemberment (for ADS2), or permanent disability (for AP3) of the insured. A family member, beneficiary, or a representative (or the insured individual in the case of ADS2 and AP3) must file a notice of claim, indicating the name and address of the insured, the COC number, the cause and date of death/injury, to the concerned PCIC Regional Office. Claim documents, such as the death certificate and/or medical certificate of the insured, police report if the event occurred through violent means, and birth certificate of the insured in the case of the insured’s death, are required to be submitted within 90 days of the death/accident
Applicant/ Client
•Notify the PCIC through the Municipal/City Agriculture Office, Office of the Provincial Agriculturist, or directly to the PCIC on the intent to file a notice of loss within the prescribed period for each product line
PCIC Claims Processor or
Claims Adjuster
•Conduct brief interview, ask relevant questions, ascertain insurance coverage from the records of the Marketing and Sales Department (MSD), and if in order, assist client in filling out pro-forma notice of loss & claim for indemnity
Applicant/ Client
•Fill out and submit Notice of Loss (NL) and Claim for Indemnity (CI) forms and other required documents/attachments, if applicable:•Livestock insurance: Necropsy report, Pictures of dead animal
•Term insurance: Death certificate, Medical certificate, Official receipts of medical expenses, Police report (in case of accidents)
PCIC Claims Processor or
Claims Adjuster
•Receive and review the NL/CI for completeness and compliance with existing policies and guidelines.
•If in order, schedule visit for ocular inspection/claim adjustment and verification activity.
•After inspection, verification, submit report to the chief of Claims Adjustment Division (CAD) for approval.
PCIC Teller
•After securing the approval of the CAD chief, issue check representing the net indemnity to be paid directly to the client.

15
of the insured for all the three packages of the PCIC’s credit and life term insurance. For AP3 and ADS2, the hospital bill and the hospital-issued official receipt should be presented for medical reimbursement claims. For LRP2, the manager of the lending institution or the cooperative involved must fill out a Claimant Statement Form. In case the indicated beneficiary for the ADS2 died earlier than the insured, a proof as the nearest kin has to be submitted as well in case no endorsement for beneficiary replacement was filed earlier. The PCIC may require the submission of other documents as needed. Table 7. Provisions under the term insurance packages
Subject Particulars Disappearance Disappearance per se of the insured is not compensable. However, if death
of the insured alleged to have disappeared is proven or established later to have occurred during the term of cover, the claim may be given due course
Voidance & Cancellation Clause
The policy shall be voided and cancelled by the PCIC upon occurrence of any of the following during the effectivity of the policy, and after notice thereof to the insured/lending institution/cooperative:
a) Conviction of a crime thus increasing the hazard insured against; b) Discovery of fraud or material misrepresentation;
c) Discovery of willful, reckless acts or omissions that increase the hazard insured against.
In case of cancellation, the insured is not entitled to any premium refund for the unexpired item
Civil Code 1250 Waiver Clause
It is hereby declared and agreed that the provision of Article 1250 of the Civil Code of the Philippines (Republic Act No. 386) which reads: "In case an extraordinary inflation or deflation of the currency stipulated should supervene, the value of the currency at the time of the establishment of the obligation shall be the basis of the payment..." shall not apply in determining the extent of liability under the provisions of this policy.
Source: PCIC The following table summarizes the amount of claims the PCIC had the past three years. Table 8 shows that the PCIC is showing continuous growth in the way in which it delivers its services. The number of claimants has been growing every year, which is both a function of the increase in the number of insured farmers and potentially the scope of the weather events that are happening in the country. Table 9 below summarizes the growth of the number of claimants and the number of insured farmers.

16
Table 8. PCIC Number of Claimants and Amount of Indemnity Paid, 2015-2018
Insurance Program 2015 2016 2017 2018
Claimants Indemnity (PHP M) Claimants Indemnity
(PHP M) Claimants Indemnity (PHP M) Claimants Indemnity
(PHP M) PCIC Regular Programs Rice 30,933 336.525 30,551 341.761 30,312 305.153 20,533 220.387 Corn 7,940 93.514 6,498 51.695 4,513 31.519 3,210 23.773 Combined Rice & Corn 38,873 430.039 37,049 393.455 34,825 336.672 23,743 244.160 HVC 302 3.143 539 10.962 523 21.537 335 2.833 Livestock 249 9.565 245 8.207 628 6.480 303 3.614 Non-Crop Insurance 33 0.563 4 0.272 16 0.304 0 0.000 Credit & Life Term Insurance 537 11.468 770 17.848 1,123 26.843 1,118 23.877 Fisheries 0 0.000 1 0.008 0 0.000 9 0.235
Sub-total 39,994 454.778 38,608 430.752 37,115 391.836 25,508 274.719 RSBSA Rice 53,452 440.823 84,111 640.976 142,319 1024.075 176,509 1,337.486 Corn 18,498 136.038 32,733 230.099 43,642 307.762 43,331 304.648 HVC 2,634 29.389 2,746 39.471 4,017 65.641 1,719 17.154 Livestock 822 7.544 1,259 10.489 1,938 15.351 2,542 20.729 Non-Crop Insurance 55 635.000 16 0.197 505 3.770 5 0.117 Fisheries 135 1.781 98 0.498 34 0.980 482 4.116
Sub-total 75,596 616.209 120,963 921.729 192,455 1416.996 224,588 1,684.251 Non-RSBSA Rice 16,254 115.630 Corn 3,538 24.590 HVC 35 0.320 Livestock 176 1.207 Non-Crop Insurance 1 0.039 Fisheries 32 0.274
Sub-total 20,036 142.060 DA Rice and Corn Programs Sikat Saka (Rice) 3659 80.152 4,227 86.627 3,994 70.441 4.548 89.339 Sikat Saka (Corn) 3 0.046 46 0.559

17
Insurance Program 2015 2016 2017 2018
Claimants Indemnity (PHP M) Claimants Indemnity
(PHP M) Claimants Indemnity (PHP M) Claimants Indemnity
(PHP M) Weather Adverse Rice Areas* 1,567 7.603 67 0.413 WARA (2014) 5,501 35.937 826 4.117 WARA (2015) 5,145 24.424 2,760 13.165 1,619 5.891 HYTA 2015 1,687 6.061 403 1.742 271 1.308 180 1.246 Hybrid Rice Program 1,160 9.996 PPI 32 0.167 Rice Model Farm 419 4.252
Sub-total 17,559 154.177 8,283 105.704 5,887 77.686 6,385 105.559 DAR-ARB-AIP Rice 1 0.008 Corn 0 0.000 HVC 94 0.965 Livestock 0 0.000 ADSS 7 0.020
Sub-total 102 0.993 Yolanda Rehabilitation Program Rice 14,170 76.893 119 0.742 1,972 11.042 2,318 17.002 Corn 2,466 16.476 42 0.354 187 0.789 234 1.313 HVC 292 3.660 76 0.293 0 0.000 8 0.051 Livestock 173 1.037 71 0.531 13 0.094 41 0.299 Non-Crop Insurance 4 0.036 1 0.005 4 0.090 0 0.000 Credit & Life Term Insurance 44 0.893 30 0.315 1 0.005 28 1.395 Fisheries 0 0.000 0 0.000 0 0.000 1 0.036
Sub-total 17,149 98.995 339 2.239 2,177 12.020 2,630 20.096 APCP and CAP-PBD Rice 2,334 31.783 2,346 27.409 2,467 26.680 3,147 44.874 Corn 1,308 15.618 538 7.056 541 4.552 506 5.171 HVC 173 5.889 613 15.299 204 3.792 3 0.038 Livestock 8 0.056 10 0.091 16 0.392 14 0.080 Non-Crop Insurance 0 0.000 0 0.000 0 0.000 0 0.000

18
Insurance Program 2015 2016 2017 2018
Claimants Indemnity (PHP M) Claimants Indemnity
(PHP M) Claimants Indemnity (PHP M) Claimants Indemnity
(PHP M) Fisheries 0 0.000 0 0.000 0 0.000 0 0.000 Credit & Life Term Insurance 1 0.072 0 0.000 0 0.000 0 0.000
Sub-total 3,824 53.418 3,507 49.854 3,328 37.351 3,670 50.163 DA-PUNLA/PLEA Rice 57 0.407 655 5.459 Corn 41 0.315 273 1.630 HVC 25 0.244 206 3.400 Livestock 11 0.042 33 0.217 Non-Crop Insurance 0 0.000 0 0.000 Credit & Life Term Insurance 0 0.000 3 0.100 Fisheries 0 0.000
Sub-total 134 1.008 1,170 10.806 DA-SURE Rice 10 0.088 Corn 0 0.000 HVC 0 0.000
Sub-total 10 0.088 PCIC Regular and Special Programs Rice 118,449 1,040.210 125,410 1,116.590 183,111 1,446.993 225,765 1,845.926 Corn 30,212 261.646 39,811 289.203 48,927 344.983 51,138 361.683 Combined Rice & Corn 148,661 1,301.856 165,221 1,405.793 232,038 1,791.976 276,903 2,207.609 HVC 3,495 43.046 3,974 66.025 4,769 91.215 2,306 23.796 Livestock 1,252 18.202 1,585 19.318 2,606 22.296 3,109 26.146 Non-Crop Insurance 92 1.234 21 0.474 54 0.793 6 0.156 Credit & Life Term Insurance 589 12.453 800 18.163 1,124 26.848 1,149 25.372 Fisheries 135 1.781 99 0.506 505 3.770 524 4.662 Grand-total 154,224 1,378.572 171,700 1,510.278 241,096 1,936.897 283,997 2,287.741
Note: 2018 data is based on the tentative review of operations for the year ended December 31, 2018 submitted to the PCIC President on January 22, 2019. Source: PCIC Annual Reports (2015, 2016, 2017); Review of Operations for the year ended December 31, 2018

19
Table 9. Number of PCIC insured farmers and claimants, 2015-2018
Insurance Program 2015 2016 2017 2018
Claimants Insured Farmers Claimants Insured
Farmers Claimants Insured Farmers Claimants Insured
Farmers PCIC Regular Programs Rice 30,933 68,391 30,551 70,258 30,312 70,055 20,533 49,113 Corn 7,940 17,419 6,498 24,114 4,513 30,935 3,210 17,671 Combined Rice & Corn 38,873 85,810 37,049 94,372 34,825 100,990 23,743 66,784 HVC 302 3,092 539 2,913 523 5,641 335 3,566 Livestock 249 6,985 245 10,717 628 25,126 303 25,670 Non-Crop Insurance 33 1,822 4 1,564 16 5,311 0 338 Credit & Life Term Insurance 537 275,378 770 285,633 1,123 455,116 1,118 483,435 Fisheries 0 51 1 60 0 51 9 3,471
Sub-total 39,994 373,138 38,608 395,259 37,115 592,235 25,508 583,264 RSBSA Rice 53,452 274,290 84,111 359,945 142,319 507,212 176,509 581.179 Corn 18,498 84,106 32,733 92,214 43,642 144,897 43,331 191.338 HVC 2,634 76,893 2,746 78,274 4,017 167,677 1,719 258.706 Livestock 822 145,957 1,259 114,079 1,938 187,015 2,542 266,500 Non-Crop Insurance 55 7,464 16 5,841 505 16,814 5 2,987 Fisheries 135 824 98 779 34 5,497 482 33,304
Sub-total 75,596 589,534 120,963 651,132 192,455 1,029,112 224,588 1,334,014 Non-RSBSA Rice 16,254 94,853 Corn 3,538 33,173 HVC 35 38,754 Livestock 176 38,892 Non-Crop Insurance 1 667 Fisheries 32 3,667
Sub-total 20,036 210,006 DA Rice and Corn Programs Sikat Saka (Rice) 3,659 12,899 4,227 13,967 3,994 14,647 4,548 15,365 Sikat Saka (Corn) 3 12 46 274

20
Insurance Program 2015 2016 2017 2018
Claimants Insured Farmers Claimants Insured
Farmers Claimants Insured Farmers Claimants Insured
Farmers Weather Adverse Rice Areas* 1,567 2,474 67 WARA (2014) 5,501 14,147 826 2,533 WARA (2015) 5,145 21,017 2,760 8,681 1,619 2,543 HYTA 2015 1,687 6,353 403 3,269 271 1,056 180 622 Hybrid Rice Program 1,160 4,796 PPI 32 262 Rice Model Farm 419 1,373
Sub-total 17,559 56,890 8,283 28,450 5,887 18,258 6,385 22,692 Yolanda Rehabilitation Program Rice 14,170 48,977 119 1,972 9,193 2,318 2,470 Corn 2,466 16,046 42 187 1,245 234 75 HVC 292 3,478 76 0 13,776 8 412 Livestock 173 21,553 71 13 3,215 41 385 Non-Crop Insurance 4 4,285 1 4 726 0 105 Credit & Life Term Insurance 44 61,725 30 1 6,501 28 17,369 Fisheries 0 8 0 0 207 1 0
Sub-total 17,149 156,072 339 2,177 34,863 2,630 20,816 APCP and CAP-PBD Rice 2,334 11,498 2,346 11,638 2,467 13,332 3,147 13,032 Corn 1,308 3,745 538 2,623 541 2,000 506 2,644 HVC 173 2,454 613 4,895 204 4,755 3 2,557 Livestock 8 73 10 198 16 340 14 228 Non-Crop Insurance 0 3 0 10 0 4 0 1 Credit & Life Term Insurance 1 0 0 4 0 8 0 0 Fisheries 0 1,525 0 815 0 140 0 0
Sub-total 3,824 19,298 3,507 20,183 3,328 20,579 3,670 18,462 DA-PUNLA/PLEA Rice 57 694 655 5,189 Corn 41 249 273 2,647 HVC 25 529 206 1,743

21
Insurance Program 2015 2016 2017 2018
Claimants Insured Farmers Claimants Insured
Farmers Claimants Insured Farmers Claimants Insured
Farmers Livestock 11 508 33 2,412 Non-Crop Insurance 0 8 0 17 Credit & Life Term Insurance 0 542 3 2,175 Fisheries 0 25
Sub-total 134 2,530 1,170 14,208 DA-SURE Rice 10 421 Corn 0 2 HVC 0 34
Sub-total 10 457 PCIC Regular and Special Programs Rice 118,449 460,046 125,410 470,291 183,111 618,732 225,765 768,675 Corn 30,212 121,316 39,811 118,951 48,927 179,338 51,138 247,824 Combined Rice & Corn 148,661 581,362 165,221 589,242 232,038 798,070 276,903 1,016,499 HVC 3,495 85,917 3,974 86,082 4,769 192,378 2,306 305,772 Livestock 1,252 174,568 1,585 124,994 2,606 216,204 3,109 334,087 Non-Crop Insurance 92 13,574 21 7,415 54 22,855 6 4,115 Credit & Life Term Insurance 589 338,628 800 286,448 1,124 462,299 1,149 502,979 Fisheries 135 883 99 843 505 5,771 524 40,467 Grand-total 154,224 1,194,932 171,700 1,095,024 241,096 1,697,577 283,997 2,203,919
Source: PCIC Annual Reports (2015, 2016, 2017)

22
Table 10. PCIC damage rate and loss ratio, 2015-2017
Insurance Program 2015 2016 2017 2018
Damage Rate (%) Loss Ratio Damage
Rate (%) Loss Ratio Damage Rate (%) Loss Ratio Damage
Rate (%) Loss Ratio
PCIC Regular Programs Rice 12.99 1.17 12.39 1.08 11.26 0.99 11.60 1.03 Corn 16.12 0.22 9.08 0.530 4.82 0.29 6.21 0.36 Combined Rice & Corn 13.56 1.09 11.82 0.95 10.01 0.81 10.69 0.87 HVC 0.58 0.23 2.68 0.80 3.64 1.29 0.66 0.27 Livestock 2.68 0.64 1.77 0.45 1.28 0.23 0.55 0.10 Non-Crop Insurance 0.07 0.09 0.04 0.06 304.00 0.04 0.00 0.00 Credit & Life Term Insurance 0.10 0.37 0.14 0.51 0.14 0.54 0.11 0.45 Fisheries 0.00 0.00 0.00 0.00 0.00 0.00
Sub-total 2.69 0.99 2.49 0.88 1.59 0.76 1.09 0.71 RSBSA Rice 6.47 0.52 7.18 0.81 7.72 0.79 8.79 0.88 Corn 6.64 0.34 10.08 0.50 7.43 0.74 5.38 0.54 HVC 0.72 0.22 0.80 0.25 0.85 0.15 0.13 0.02 Livestock 0.24 0.03 0.40 0.06 0.36 0.05 0.33 0.05 Non-Crop Insurance 0.45 0.14 0.12 0.03 0.00 0.00 0.02 0.01 Fisheries 3.42 0.48 0.96 0.18 0.07 0.02 0.00 0.00
Sub-total 9.04 0.73 4.86 0.58 4.71 0.57 3.96 0.47 Non-RSBSA Rice 5.05 0.50 Corn 0.00 0.00 HVC 0.00 0.00 Livestock 0.00 0.00 Non-Crop Insurance 0.00 0.00 Fisheries 0.00 0.00
Sub-total 2.40 0.28 DA Rice and Corn Programs Sikat Saka (Rice) 6.40 0.61 6.21 0.58 4.55 0.45 5.28 0.53 Sikat Saka (Corn) 8.57 0.85 3.21 0.32

23
Insurance Program 2015 2016 2017 2018
Damage Rate (%) Loss Ratio Damage
Rate (%) Loss Ratio Damage Rate (%) Loss Ratio Damage
Rate (%) Loss Ratio
Weather Adverse Rice Areas* 0.00 0.00 NA NA WARA (2014) 13.44 1.81 8.50 1.21 WARA (2015) 9.21 1.09 12.13 1.45 18.75 1.83 HYTA 2015 9.10 0.81 3.75 0.31 8.63 0.86 5.76 0.58 Hybrid Rice Program 8.51 0.85 PPI 2.54 0.25 Rice Model Farm 8.01 0.80
Sub-total 8.15 0.83 6.63 0.63 4.87 0.49 5.53 0.55 Yolanda Rehabilitation Program Rice 6.58 0.41 NA NA 7.51 0.75 16.44 1.64 Corn 5.98 0.37 NA NA 3.44 0.34 0.00 0.00 HVC 3.31 0.57 NA NA 0.00 0.00 Livestock 0.32 0.04 NA NA 0.13 0.02 0.00 0.00 Non-Crop Insurance 0.06 0.02 NA NA 0.00 0.00 Credit & Life Term Insurance 0.03 0.07 NA NA 0.16 0.26 Fisheries 0.00 0.00 NA NA 0.00 0.00
Sub-total 8.47 0.53 NA NA 1.40 0.28 1.93 1.03 APCP and CAP-PBD Rice 5.93 0.52 4.50 0.39 4.08 0.42 6.44 0.64 Corn 9.01 0.44 5.30 0.28 4.54 0.45 3.90 0.39 HVC 2.55 0.38 3.66 0.50 1.01 0.15 0.02 0.00 Livestock 1.24 0.57 0.97 0.27 1.75 0.58 0.00 0.00 Non-Crop Insurance 0.00 0.00 0.00 0.00 0.00 0.00 Credit & Life Term Insurance 0.00 0.00 0.00 0.00 0.00 0.00 Fisheries 0.00 0.00 0.00 0.00 0.00 0.00
Sub-total 9.97 0.87 4.08 0.39 3.10 0.36 4.72 0.51 DA-PUNLA/PLEA Rice 1.86 0.19 3.14 0.31 Corn 3.97 0.40 2.01 0.20 HVC 0.91 0.12 4.24 0.33

24
Insurance Program 2015 2016 2017 2018
Damage Rate (%) Loss Ratio Damage
Rate (%) Loss Ratio Damage Rate (%) Loss Ratio Damage
Rate (%) Loss Ratio
Livestock 0.00 0.10 0.26 0.08 Non-Crop Insurance 0.00 0.00 Credit & Life Term Insurance 0.14 0.15 Fisheries 0.00 0.00
Sub-total 1.18 0.18 2.20 0.27 DA-SURE Rice 0.00 0.00 Corn 0.00 0.00 HVC 0.00 0.00
Sub-total 0.00 0.00 PCIC Regular and Special Programs Rice 8.00 0.66 8.04 0.68 7.85 0.77 8.28 0.82 Corn 8.50 0.44 9.69 0.50 7.00 0.64 5.08 0.49 Combined Rice & Corn 8.10 0.60 8.33 0.63 7.67 0.74 7.51 0.74 HVC 0.87 0.26 1.15 0.32 1.02 0.18 0.15 0.02 Livestock 0.48 0.07 0.63 0.09 0.46 0.06 0.34 0.05 Non-Crop Insurance 0.13 0.10 0.05 0.04 0.06 0.03 0.02 0.01 Credit & Life Term Insurance 0.08 0.28 0.15 0.51 0.14 0.52 0.11 0.43 Fisheries 1.72 0.39 0.50 0.13 1.82 0.33 0.30 0.06 Grand-total 3.36 0.52 3.86 0.56 3.31 0.58 2.93 0.47
Source: PCIC Annual Reports (2015, 2016, 2017)

25
While useful, the number of claimants and the amount of indemnity paid does not fully capture the efficiency of the PCIC in providing indemnity relative to the amount of resources available. It also does not paint a picture on the sustainability of the model the PCIC is working with. Table 10 below shows the damage rate and the loss ratio of the PCIC. The PCIC defines the damage rate as the ratio between the amount of claims and the amount of cover. The PCIC then defines the loss ratio as the ratio between the amount of claims and the amount of premium. Thus, a loss ratio greater than 1 says that the amount of claims on a product exceeds the amount of premium that the product generates for PCIC. Looking at the data, the PCIC has consistently exhibited loss ratios lower than 1. However, it should be noted that the loss ratio does not take into account the operation expenses. As such, it may be difficult to examine the financial viability of the PCIC based on claims data alone. Table 11 shows the financial position of the PCIC. The table shows that the PCIC is able to generate positive net income in the past three years. This is mainly due to the increase in subsidy to the PCIC. Looking at the data, it appears that there is a significant change in how the income of the PCIC is being reported. Before 2017, the government share in the insurance is reported on the net insurance premiums. This 2017, the premium of the government is reported as a net assistance/subsidy. The current breakdown of how the PCIC income is being recorded makes it clear that government assistance is the primary source of income of the PCIC. Of course, this is due to the government program of providing free crop insurance. What the other parts of the data shows us is how large the free crop insurance program is compared to the regular program of the PCIC. As of 2017, 39,994 regularly insured farmers had PHP 391.83 million worth of claims, compared to 192,455 RSBSA farmers with PHP 1.42 billion worth of claims. Table 11. PCIC financial position, 2015-2017
2015 2016 2017 Net Insurance Premiums 1,720,343,078.00 1,791,376,554.00 454,883,801.00 Underwriting Expenses 1,376,210,257.00 1,448,801,535.00 2,253,916,410.00
Insurance benefits 1,298,639,814.00 1,554,737,077.00 1,879,251,872.00 Premium discounts 872,355.00 Commission expenses 36,760,699.00 37,009,372.00 56,986,054.00 Reinsurance premiums ceded/ facultative 1,120,926.00 1,041,383.00 1,021,549.00 Death benefits 3,300,000.00 3,265,000.00 4,483,000.00 Honoraria/ Incentive to claims adjuster 995,916.00 1,239,903.00 1,691,728.00 Honoraria/ Incentive to agricultural technician 4,902.00 57,800.00 Service fee 2,730,852.00 Applied Reserve for Indemnity Fluctuations 35,388,000.00 -148,549,000.00 306,879,000.00
Operating Expense 314,857,116.00 336,751,879.00 417,492,591.00 Other Income 43,836,790.00 39,293,924.00 53,523,206.00 Net Assistance/Subsidy 1,600,000,000.00 2,500,000,000.00 Net Income 73,112,495.00 45,117,064.00 336,998,006.00
Source: PCIC Annual Reports (2015, 2016, 2017)

26
3. Agricultural segments in the Philippines Vital to the development or improvement of agricultural insurance program design to ensure effective and inclusive coverage is an understanding of the segments of the Philippine agriculture. This section discusses these pertinent segments in association with access to agricultural insurance and agricultural financing, utilizing data from the Census of Agriculture and Fisheries (CAF), RSBSA, Major Crops Statistics of the Philippines by the Philippine Statistics Authority (PSA), PCIC and recent studies of the Philippine Institute for Development Studies (PIDS). In particular, it describes agricultural producers and products, their geographic distribution, types of crops, and farm holdings. It then examines the segments in the existing agricultural insurance programs in the country as well as the issues that have been identified with regard to inclusion. In summary, it identifies possible priority areas in the expansion of the current agricultural insurance programs. 3.1. Agricultural producers While a sizable portion of the labor force is still in the agriculture sector, there has been a continuous decline in the number of workers since 2011 (Figure 2). The estimated number of agricultural workers has reached its peak in recent years in 2011 at 12.27 million before going down to 11.29 million in 2015 and then further down to 9.998 million in 2017. Habito and Briones (2005) identified both economic and climate-related reasons as factors behind the decline in the number of agricultural workers. Climate-related phenomena usually cause short-term dips, such as the decline experienced in 1997 and 1998 because of the hit of a severe El Niño. The sharpest decline happened in 2013 to 2016, particularly in Eastern Visayas, and was largely driven by the adverse effect of Typhoon Yolanda. Economic factors, on the other hand, such as the rapid economic growth and tightening labor markets, are usually associated to long-term declines. Figure 2. Number of workers by basic sector, 1995-2018
Source: Labor Force Survey (LFS) and Decent Work Statistics (DeWS), Philippine Statistics Authority The distribution of agricultural workers across the regions has been fairly consistent over time (see Figure 3). Among the regions, Western Visayas has the greatest number of agricultural workers in 2018 at 970 thousand, followed by SOCCSKSARGEN at 776 thousand workers. Across the years, males consistently dominate agricultural workers in the Philippines. Compared with the other basic sectors, agriculture, together with industry, have higher proportion of male workers, with three males per one female in 2015, compared to services sector where male and female workers were at parity.
0
5
10
15
20
25
Mill
ions
Agriculture, fishery and forestry Industry Services

27
Figure 3. Agricultural workers (in thousand persons) by region, 2011-2018
Source: Labor Force Survey, Philippine Statistical Yearbook Among the basic sectors, there is a higher proportion of older workers (i.e. aged 55 and older) in the agricultural sector at 19.6% in 2015 compared to industry (9.3%) and services (11.8%) sectors. This composition of agricultural workers in terms of age is common to developing countries, since younger workers tend to have nonfarm occupations (Moya et. al. 2015 as mentioned in Briones 2017). In terms of educational attainment, agricultural workers have lower years of formal education compared to their counterparts in the industry and services sectors. In 2015, about 33% of the agricultural workers did not finish primary school, around 38% are secondary undergraduates, while about 26% are tertiary undergraduates. Despite this trend, educational attainment of workers in agriculture have been improving through the years, with around four percentage point shift to higher education brackets (Habito and Briones 2005). Figure 4. Agricultural workers (in thousand persons) by sex, age group, and educational attainment, 2010-2015
Source: Labor Force Survey, PSA
0%
10%
20%
30%
40%
50%
60%
70%
80%
90%
100%
2011 2012 2013 2014 2015 2016 2017 2018
NCR CAR Region 1 Region 2 Region 3
Region 4-A Region 4-B Region 5 Region 6 Region 7
Region 8 Region 9 Region 10 Region 11 Region 12
Caraga ARMM
970
776
748
741
707
655650647
633
626
601
539
526
438400
316 262018
Region 6 Region 12 Region 10
Region 5 Region 2 Region 7
Region 3 ARMM Region 11
Region 8 Region 9 Region 1
Region 4-A Region 4-B Caraga
CAR NCR
8,88
6
9,09
4
8,99
9
8,82
2
8,54
6
8,49
3
3,07
0
3,17
4
3,09
4
3,01
4
3,04
2
2,93
2
0%10%20%30%40%50%60%70%80%90%
100%
2010
2011
2012
2013
2014
2015
Male Female
4,83
2
5,01
5
5,06
8
4,87
4
4,74
3
4,56
7
4,80
9
4,91
4
4,75
6
4,71
4
4,64
0
4,61
0
2,31
5
2,33
8
2,26
8
2,24
7
2,20
5
2,24
8
2010
2011
2012
2013
2014
2015
15-34 35-54 55 and above
530 503 539 494 478 470
6,43
7
6,50
9
6,38
9
6,21
7
5,97
3
5,92
9
4,05
2
4,27
2
4,37
4
4,35
8
4,36
9
4,25
9
937 984 791 767 768 767
2010
2011
2012
2013
2014
2015
College or higher SecondaryElementary No Grade Completed

28
Owing to the need for improving the agricultural sector where most of the poor are, the Philippine government came up with a list of all farmers and other agricultural producers throughout the country. This largest known registry of agricultural producers is the RSBSA. The RSBSA is a nationwide database of information on farmers, laborers and fisherfolk in the country (with an exception NCR and ARMM). It catalogues agricultural producers by a number of demographics, including by region and product. Agricultural producers are often not restricted to one product and may be involved in multiple agricultural commodities. They are mostly comprised of farmers and farmer laborers with a fraction of fishermen. Based on a 2017 PIDS study, the RSBSA registers around 10 million farmers, farm laborers, and fisherfolks. Figure 5 below shows that an overwhelming 8.9 million producers are engaged into farming as either farmers or farm laborers. While the magnitude of fisherfolks seem negligible compared to this number, there are over 1.6 million producers who are engaged in fishing/aquaculture. Among the regions, Western Visayas has the greatest number of agricultural producers at about 1.03 million producers followed by Bicol at 828,917 producers. CAR and Caraga have the least number of producers at 323,256 and 376,697 respectively. The share of the regions in the number of agricultural producers are shown in Figure 6. Figure 5. Agricultural producers registered in the RSBSA, 2012
Source of basic data: RSBSA Figure 6. Distribution of agricultural producers by region (% to total), 2012
Source of basic data: RSBSA
Farmers, farm laborers and
fishermen, 241,876Farmers and farm
laborers, 1,570,506
Farmers and fishermen, 240,221
Farm laborers and fishermen, 248,373Farmers only,
3,296,653
Farm laborers only,
3,288,999
Fishermen only, 893,474
Unclassified, 729
3.3
6.7 7.1 7.36.1
4.9
8.5
10.59.4
7.4
5.2
7.3
5.66.9
3.9
0.0
2.0
4.0
6.0
8.0
10.0
12.0
CAR Region1
Region2
Region3
Region4A
Region4B
Region5
Region6
Region7
Region8
Region9
Region10
Region11
Region12
Caraga

29
3.2. Agricultural products Rice is a staple food of Filipinos while corn is the second most important crop. Figure 7 shows that the country's total volume of palay production in 2018 is estimated at 19.1 million metric tons. It grew at a compounded annual growth rate (CAGR) of 1.6% in the last decade (that is, 2009 to 2018), which is a much slower growth compared to the preceding 10-year CAGR (for 1999-2008) of 3.6%. Meanwhile, corn production is at 7.7 million metric tons in 2018. It has been growing at a rate of 1.0% per year in the past decade. Again, this is relatively sluggish compared to the annual compounded growth rate in the preceding decade with 4.2%. As for high-value crops, PSA data shows that 68.4 million metric tons have been produced in 2018, showing a CAGR of 1.8% from 1990 to 2018. Its growth rate in the last decade is 0.4%, which is much lower than the preceding decade’s annual growth rate of 3.8%. Figure 7. Volume of production (in metric tons) of palay, corn and HVCC, 1987-2018
Source: PSA Among the regions, Central Luzon is the top producer of palay at 3.62 million metric tons in 2018, Cagayan Valley came in second with 2.38 million metric tons of production while Western Visayas had the third highest production at 2.23 million metric tons (see Figure 8). As for corn, Figure 9 shows that the top producers are Cagayan Valley (1.63 million metric tons), Northern Mindanao (1.29 million) and SOCCSKSARGEN (1.23 million). Meanwhile, the top producers of HVCC are Western Visayas (16.09 million metric tons), Northern Mindanao (11.32 million) and Davao Region (9.71 million) (Figure 10).
01020304050607080
1987
1988
1989
1990
1991
1992
1993
1994
1995
1996
1997
1998
1999
2000
2001
2002
2003
2004
2005
2006
2007
2008
2009
2010
2011
2012
2013
2014
2015
2016
2017
2018
Mill
ions
Palay Corn HVC

30
Figure 8. Volume of palay production (in metric tons) by region, 1987-2018
Source: PSA Figure 9. Volume of corn production (in metric tons) by region, 1987-2018
Source: PSA
0.0
0.5
1.0
1.5
2.0
2.5
3.0
3.5
4.0
19
87
19
88
19
89
19
90
19
91
19
92
19
93
19
94
19
95
19
96
19
97
19
98
19
99
20
00
20
01
20
02
20
03
20
04
20
05
20
06
20
07
20
08
20
09
20
10
20
11
20
12
20
13
20
14
20
15
20
16
20
17
20
18
Mill
ions Region 3
Region 2
Region 6
Region 1
Region 5
Region 12
Region 4B
Region 8
Region 10
Region 9
ARMM
Caraga
Region 11
Region 4A
0.0
0.2
0.4
0.6
0.8
1.0
1.2
1.4
1.6
1.8
2.0
19
87
19
88
19
89
19
90
19
91
19
92
19
93
19
94
19
95
19
96
19
97
19
98
19
99
20
00
20
01
20
02
20
03
20
04
20
05
20
06
20
07
20
08
20
09
20
10
20
11
20
12
20
13
20
14
20
15
20
16
20
17
20
18
Mill
ions Region 2
Region 10
Region 12
ARMM
Region 1
Region 6
Region 5
Region 11
Region 3
Region 9
CAR
Caraga
Region 4B
Region 7

31
Figure 10. Volume of HVCC production (in metric tons) by region, 1990-2018
Source: PSA In terms of fisheries, the country has produced 4.36 million metric tons of fish and other fishery products in 2018. Among the regions, ARMM has the highest production at 899,374 metric tons, followed by Zamboanga Peninsula with 531,032 metric tons and MIMAROPA at 504,667 metric tons. The dip in fishery production has been noted since 2011 to 2012 for reasons that are yet to be determined by this study. Figure 11. Volume of production (in metric tons) in fishery, 1980-2018
Source: PSA
0.0
2.0
4.0
6.0
8.0
10.0
12.0
14.0
16.0
18.0
20.0
19
90
19
91
19
92
19
93
19
94
19
95
19
96
19
97
19
98
19
99
20
00
20
01
20
02
20
03
20
04
20
05
20
06
20
07
20
08
20
09
20
10
20
11
20
12
20
13
20
14
20
15
20
16
20
17
20
18
Mill
ions Region 6
Region 10
Region 11
Region 12
Region 4A
ARMM
Region 7
Region 9
Region 8
Region 5
Region 2
Caraga
Region 3
Region 4B
0
1
2
3
4
5
6
1980
1982
1984
1986
1988
1990
1992
1994
1996
1998
2000
2002
2004
2006
2008
2010
2012
2014
2016
2018
Mill
ions

32
Figure 12. Volume of production (in metric tons) in fishery by region, 1980-2012
Source: PSA Aside from volume of production, the distribution of producers by crop type also lends insight as far as identifying the potential priority areas for agricultural insurance program expansion. It is observed that producers that engage in livestock (3.2 million) and high value crops (2.73 million) are biggest in magnitude (see Figure 13). There is reason behind this, as the livestock industry has been trending positively in terms of value of production, amidst the overall downward trend in value of production by the agricultural industry in general (Domingo and Olaguera 2017). This is attributed to a dual increase in purchasing power and consumption of meat in the country, with an estimated compound annual growth rate of 30% for beef, chicken and pork from 2011 to 2021 (Chatham House, 2014 as referenced in Domingo and Olaguera, 2017). Subsequently, the production of high value crops comes intuitively from the notion of agricultural diversification, bolstered by the provision of improved rural technology, the demand for more crops aside from traditional subsistence crops, and the higher return per hectare that HVCs give in comparison with traditional crops (Briones 2007). Both these agricultural industries give greater returns in value relative to traditional crops, despite the absence of government support and infrastructure. Conversely, the government has pursued a policy direction that gives much greater priority to rice and corn farmers as mentioned in the sub-section on PCIC programs.
0.0
0.1
0.2
0.3
0.4
0.5
0.6
0.7
0.8
0.9
1.0
19
80
19
82
19
84
19
86
19
88
19
90
19
92
19
94
19
96
19
98
20
00
20
02
20
04
20
06
20
08
20
10
20
12
20
14
20
16
20
18
Mill
ions
ARMM
Region 9
Region 4B
Region 6
Region 12
Region 3
Region 4A
Region 5
Region 1
Region 10
Region 7
Region 8
NCR
Caraga
Region 11
Region 2

33
Figure 13. Distribution of agricultural producers by type of product, 2012
Source of basic data: Registry System for Basic Sectors in Agriculture (RSBSA) 3.3. Farm holdings According to the 2012 Census of Agriculture and Fisheries (CAF), the Philippines has about 7.3 million hectares of land divided unevenly amongst 7.9 million farm holdings, hence an average of 0.9 hectare per farm holding. Amongst the various regions in the Philippines, Bicol Region has the most land area for holding/farming parcels with 774,000 hectares, while NCR has the least at 20,000 hectares. Caraga has the highest average area of holding/farm parcels at 1.8 hectares, followed by the Zamboanga Peninsula at 1.7 hectares, followed by the regions in Central and Southern Luzon, and Mindanao. Table 12. Number and area of holding/farm parcels by region, 2012
Region Number of holdings (In thousands)
Area of holdings (in thousand hectares)
Average area of holding (in thousand hectares)
NCR 40 20 0.5 CAR 344 139 0.4 Ilocos Region 601 219 0.4 Cagayan Valley 721 481 0.7 Central Luzon 490 446 0.9 CALABARZON 415 498 1.2 MIMAROPA 376 446 1.2 Bicol Region 663 774 1.2 Western Visayas 511 296 0.6 Central Visayas 428 169 0.4 Eastern Visayas 594 454 0.8 Zamboanga Peninsula 268 448 1.7 Northern Mindanao 484 565 1.2 Davao Region 401 576 1.4 SOCCSKSARGEN 530 638 1.2 ARMM 351 347 1.0 Caraga 256 461 1.8 NIR 425 295 0.7 Total 7,898 7,272 0.9
Source: PSA CAF 2012 data also recorded the distribution of farmland around the country by size. Farms that are at most three hectares comprise of 3,481,680 hectares, which translates 88.9% of farm holdings and 48.42% of total farm area in the Philippines. This is an important statistic as it is
1.9
1.1
2.73.2
1.6
0.0
0.5
1.0
1.5
2.0
2.5
3.0
3.5
Rice Corn HVC Livestock Fisheries
Mill
ions

34
the maximum insurable crop area of PCIC insurance policies, which is instrumental in determining the financial sustainability of PCIC programs. In terms of agricultural area by type of crop, latest data show that 36% of total relevant area is dedicated to growing palay while 19.6% is allotted to corn farming. Palay is occupying greater share in the area through the years while corn farming has been occupying less and less relative to the total area. Crop cover is also increasing and for all types of crops as shown in Table 14. Table 13. Agricultural area (in thousand hectares) by type of crop, 1992-2016
Year Total Palay Corn % Palay % Corn 1992 12,474.5 3,198.1 3,331.4 25.6 26.7 1993 12,503.1 3,282.4 3,149.3 26.3 25.2 1994 12,741.6 3,651.5 3,005.8 28.7 23.6 1995 12,536.8 3,758.7 2,692.3 30.0 21.5 1996 13,015.6 3,951.1 2,735.7 30.4 21.0 1997 12,693.6 3,842.3 2,725.9 30.3 21.5 1998 11,040.8 3,170.0 2,354.2 28.7 21.3 1999 12,127.7 3,999.8 2,642.2 33.0 21.8 2000 11,945.7 4,038.1 2,510.3 33.8 21.0 2001 11,908.3 4,065.4 2,486.6 34.1 20.9 2002 11,827.3 4,046.3 2,395.5 34.2 20.3 2003 11,930.0 4,006.4 2,409.8 33.6 20.2 2004 12,231.0 4,126.6 2,527.1 33.7 20.7 2005 12,034.2 4,070.4 2,441.8 33.8 20.3 2006 12,389.9 4,159.9 2,570.7 33.6 20.7 2007 12,641.0 4,272.9 2,648.3 33.8 21.0 2008 12,894.5 4,460.0 2,661.0 34.6 20.6 2009 13,031.5 4,532.3 2,683.9 34.8 20.6 2010 12,805.6 4,354.2 2,499.0 34.0 19.5 2011 13,131.0 4,536.6 2,544.6 34.5 19.4 2012 13,354.9 4,690.1 2,593.9 35.1 19.4 2013 13,346.4 4,746.1 2,563.7 35.6 19.2 2014 13,354.1 4,739.7 2,611.4 35.5 19.6 2015 13,229.1 4,656.2 2,561.9 35.2 19.4 2016 12,646.6 4,556.0 2,484.5 36.0 19.6
Sources: Bureau of Agriculture Statistics, Philippine Statistics Authority Table 14. Crop cover of the Philippines (in thousand hectares), 2013-2017
Crop 2013 2014 2015 2016 2017 Palay 4,746.10 4,739.70 4,656.20 4,556.00 4,811.80 Corn 2,563.70 2,611.40 2,561.90 2,484.50 2,552.60 Coconut 3,551.30 3,502.00 3,517.70 3,565.10 3,612.30 Others 2,485.30 2,501.00 2,493.40 2,485.60 2,531.30 Total 13,346.40 13,354.10 13,229.20 13,091.20 13,508.00
Source: Selected Statistics on Agriculture (2018), PSA Farm holding size is an integral factor when it comes to agricultural insurance, as PCIC programs are conceptually targeted towards smallholder farmers. Smallholder farmers form a large segment of the rural population, and produce a sizable part of overall agricultural

35
production. In a study by Geron, Llanto and Badiola (2016), smallholder farmers are characterized by small, unproductive land, subpar links to markets, and lack of access to financial services due to unviability as an investment. Consequently, smallholder farmers face information asymmetry, as they do not gain access to information on the different financial services available to them like insurance. Smallholder farmers are also the most susceptible to the variability of weather and the risk of natural disasters due to their lack of means to recover quickly in the case of crisis. This ultimately makes them a big risk and unprofitable, discouraging private lenders from loaning them any credit because their return on investment would be lower in comparison to larger farms and agricultural enterprises. Table 15. Farm sizes based on CAF and RSBSA, 2012
Size of Farm (ha)
CAF, 2012 RSBSA, 2012
Number of Farms
% of Farms Area (ha)
Ave. Area (ha)
Number of Farms
% of Farms Area (ha)
Ave. Area (ha)
Under 0.5 2,159,963 38.8 277,781 0.1 1,107,785 42.3 139,655 0.1 0.5 - 0.999 1,004,633 18.1 609,084 0.6 452,911 17.3 267,861 0.6 1.000 - 2.999 1,780,702 32.0 2,594,815 1.5 776,532 29.6 1,115,009 1.4 3.000 - 7.000 518,046 9.3 2,112,232 4.1 239,100 9.1 973,757 4.1 7.001 - 9.999 44,102 0.8 363,202 8.2 19,408 0.7 160,360 8.3 10.000 - 24.999 49,657 0.9 655,134 13.2 24,274 0.9 315,872 13.0 25.000 - 49.999 3,877 0.1 125,214 32.3 1,569 0.1 49,666 31.7 50.000 and over 1,597 0.0 452,626 283.4 449 0.0 56,213 125.2 Total 5,562,577 100.0 7,190,087 1.3 2,622,028 100.0 3,078,394 1.2
Source: PCIC; PSA Unsurprisingly, smallholder farmers have less income and are more likely to be in poverty than farmers who have larger farm holdings (Mina and Reyes 2017). The net income of households with total farm area of one to three hectares of land have an annual net income of around PHP 200,000, whereas households with 20 or more hectares reach up to PHP 1,300,000, according to the 2011 Survey on Characterizing Small Farmers of the Philippines. Impact evaluations of agricultural insurance programs in Cagayan Valley (Conrado, et al. 2017), CALABARZON (Lansigan, et al. 2017), and Central Visayas (Anzano and Alvarez 2016) all allude to farm size being a factor in the availing of insurance. These studies showed that smallholder farms usually do not have the appropriate information to be able to avail of insurance, complemented by their inability to avail of insurance relative to producers with large farms, who not only have more money to avail of insurance, but also stand to gain more in case of natural disasters. The table below shows the number of farmers per product that have access to agricultural insurance policies. Smallholder farmers in each of the product lines only compose of at most one fourth of insured farmers, which, corroborating with earlier figures, shows the very small penetration rate of insurance policies towards smallholder farmers as a whole. Table 16. Distribution of insured parcels of land by farm size and product, August 2015 - April 2016
Size of Insured Farm Parcel Rice Corn HVCC Less than 0.5 ha 81,136 16,512 14,349 From 0.5 to less than 1 ha 106,631 20,663 12,357 From 1 ha to less than 3 ha 213,927 43,061 24,330 From 3 ha to less than 7 ha 19,762 5,757 4,393 From 7 ha to less than 10 ha 7

36
From 10 ha to less than 25 8 Total 421,456 85,993 55,444
Source of basic data: PCIC, PSA This raises a problem as some case studies have shown that insurance can help smoothen the spending and credit access of smallholder farmers. This is compounded by the fact that the RSBSA, which has been the basis used by government agencies for targeting agricultural assistance policies, excludes a sizable segment of agricultural producers, especially smallholder farmers (Reyes and Gloria 2017). It is of note that RSBSA tends to understate the number of agricultural producers in the country, particularly in excluding producers from ARMM and NCR. Table 17 column (5) shows a large discrepancy of 2.9 million farm parcels between the RSBSA and CAF estimates. Table 17. Number of parcels insured by land size (compared with total number of farm parcels from RSBSA and CAF)
Size of Insured Farm Parcel
Number of farm parcels
insured (August 2015 -
April 2016)
Total no. of farm parcels
(RSBSA, 2012)
Penetration rate
Total no. of farm
parcels (CAF, 2012)
Discrepancy in farm parcels
(CAF less RSBSA)
(1) (2) (3 = 1/2) (4) (5 = 4-2) Less than 0.5 ha 111,997 1,107,785 10.11 2,159,963 1,052,178 0.5 to less than 1 ha 139,651 452,911 30.83 1,004,633 551,722 1 ha to less than 3 ha 281,318 776,532 36.23 1,780,702 1,004,170 3 ha to less than 7 ha 29,912 239,100 12.51 518,046 278,946 7 ha to less than 10 ha 7 19,408 0.04 44,102 24,694 10 ha to less than 25 ha 8 24,274 0.03 49,657 25,383 25 ha to less than 50 ha 1,569 3,877 2,308 More than 50 ha 449 1,597 1,148 Total 562,893 2,622,028 21.47 5,562,577 2,940,549
Source of basic data: PCIC, PSA To obtain the penetration rate of insurance by farm size, the number of farm parcels insured during the period August 2015 to April 2016 in column (1) was divided by total number of farm parcels based on the RSBSA in column (2). It is found that there is an alarmingly low penetration rate for parcels that are less than 0.5 hectare in size – only 10.11 percent compared to the larger pieces of farms. The penetration rate for farms 0.5 to 1 hectare is 30.83 while that for farms bigger than 1 hectare but not larger than 3 hectares is 36.23. Farms that range from 3 to 7 hectares have a penetration rate of 12.5 percent. These figures show that there is a room for improving the targeting approach so that smaller farm holders are insured. 4. Farmers’ awareness of agricultural insurance and the RSBSA Given the pertinent agricultural segments in association with access to agricultural insurance, this section discusses the extent of or issues concerning awareness of farmers on agricultural insurance based on past PIDS studies and related literature, and based on the results from focus group discussions conducted in Cagayan Valley and Davao Regions.

37
4.1. Analysis based on past PIDS studies and related literature
4.1.1. Issue of low awareness It has been well-documented in recent studies that agricultural insurance in the Philippines suffers from awareness issues. The issue of low awareness is usually analyzed in the context of the low availment and penetration rate of PCIC insurance products (e.g., Bangsal and Mamhot, 2012). For instance, Rola and Aragon (2013) found that lack of awareness regarding the PCIC is the primary reason for minimal participation in agricultural insurance programs of rice farmers in selected communities in Laguna. The rider questions in the Rice-Based Farm Household Questionnaire of the Philippine Rice Research Institute (PhilRice) also have the same results, with 67% of rice farmers interviewed in Nueva Ecija, Iloilo and Leyte not availing agricultural insurance from 2007-2011, primarily due to a limited understanding of crop insurance, along with lack of funds and other reasons. Local agricultural producers in Madridejos and Santa Fe in Cebu were only introduced to the PCIC programs in 2014. In Davao del Norte, many of the agricultural producers were not aware of agricultural insurance. This is not surprising given the fact that as of 2015, even the LGU officials and staff admitted that they were not aware of the programs of the PCIC. Lansigan, et al. (2017) found that 28.9% of coconut farmers surveyed from CALABARZON cite lack of awareness on the crop insurance program as the main reason of non-availment. Meanwhile, Anzano and Alvarez (2016) found that around one-third of rice farmers surveyed in Western Visayas cite lack of awareness on how to apply for a crop insurance product as the main reason for having no insurance at all. The lack awareness is not only about the crop insurance program as a whole but also the mechanism for availing, how to claim for indemnity, and its benefits. The literature also cites that the failure of farmers in filing for indemnity claims is partly attributed to their lack of knowledge on how to file for one. Thus, these farmers were unable to benefit fully from the program. The lack of awareness is also about the timeline – some of the farmers missed the deadline for the application of the indemnity claim. Some farmers received negative feedback from other farmers that discouraged them from filing their own indemnity claim. The literature notes that people also lack awareness of the benefits of agricultural insurance. The farmers looked at crop insurance as just another documentary requirement without being fully aware of its benefits (Reyes and Domingo 2009). Based on focus group discussions, many of the rice and corn farmers interviewed in Cagayan were not aware of the existence of non-crop insurance products (Reyes, Mina, et al. 2015). There are also reports of non-crop insurance products not being offered at all in some of the areas evaluated.
4.1.2. Sources of information on agricultural insurance The awareness of many farmers about agricultural insurance programs arises from their availment of credit services. Most of the farmers that availed crop insurance only did so because it is a requirement for obtaining a production loan from the Land Bank of the Philippines (LBP). This is collaborated by the results of Reyes and Domingo (2009), which correlates the availment of crop insurance to the presence (and access to) of formal lending institutions. For instance, majority of banana farmers with insurance who were included in the study for Davao Region noted that their availment of crop insurance is a requirement for getting an agricultural loan. Corn farmers in Central Visayas cite the fact that crop insurance is not needed for obtaining credit (52.9%) as the main reason why they did not avail of crop insurance.

38
Some farmers also learned about agricultural insurance from PCIC-organized briefings. In Negros Occidental, local livestock raisers only became aware of the existence of the livestock insurance product when their livestock association in partnership with the Negros Coop Bank and the PCIC organized a briefing about livestock insurance. Unfortunately, others have to experience typhoon to gain a better understanding of the benefits of agricultural insurance. In Bantayan Island, Cebu, local agricultural producers said that they were only recently introduced to the PCIC program in 2011. A more intensive information campaign happened in 2013 after Bantayan Island was severely affected by Typhoon Yolanda. One of the key sources of agricultural insurance information is the agricultural technician in every LGUs. Anzano and Alvarez (2016) found that of the 255 farmer-respondents who availed PCIC’s agricultural crop insurance product, only 130 have received any indemnity payment. Meanwhile, the majority of farmers who availed of crop insurance (85.49% of the 255) were aware of how crop insurance works, while a majority of them (77.65% of the 255) have also regularly availed of the product for at least the past two years. The farmer-respondents point out the presence and assistance of the agricultural technician as a major reason for the regular availment of the product (80.39%).
4.1.3. Factors affecting people’s awareness Reyes et. al. (2015) offered accessibility issues as one of the plausible explanations in the relatively low awareness level observed in their study. The PCIC, as of 2015, only has 12 regional offices and around 15 provincial extension offices all throughout the country. Furthermore, the PCIC chronically suffers from being understaffed. Thus, the PCIC does not have sufficient resources to reach all of its target clientele. This lack of resources, however, manifests on the whole operation of the PCIC and not just on the level of the awareness of its insurance products. It is not clear if the PCIC can handle the influx of new customers that will come when awareness of the PCIC product line increases. It appears that the problem on awareness is not a simple one. In fact, studies argue that the problem may be attitude-related. The most common reasons for not availing agricultural insurance is the perceived lack of need for agricultural insurance. Their perceptions about agricultural insurance are affected by the information they obtain from other farmers and the lack of trust on the system. Some farmers have second-hand information that claim payments take too long. The documentary requirements and the additional cost they incur for going through the application and claiming processes may also add to their perceived difficulties. Some farmers indicated that they find the documentary requirements of the agricultural insurance program difficult to comply with. Some farmers also do not trust the institution that offers agricultural insurance. Furthermore, some farmers were found to be unsatisfied with the amount of insurance cover.
4.1.4. Claims process The claims process of the PCIC has always been an important component of the PCIC’s mandate to deliver relevant crop insurance service to agricultural workers. Unfortunately, the claims aspect of the provision of agricultural insurance has been known to be quite a lengthy process and it is the element in which farmers have the lowest satisfaction. These are based on an assessment of the program implementation of PCIC’s special programs like that for Agrarian Reform beneficiaries (ARBs) (Reyes, Gloria and Mina 2015), as well as survey responses from

39
a non-negligible number of farmers from Central Visayas (Anzano and Alvarez 2016). In that survey, one of the reasons why people did not avail of agricultural insurance is due to the claims process being too long. Another reason was that people have difficulties meeting or preparing the documentary requirements. Meanwhile, the very low satisfaction rate with the claims process was evident in a study that covers five regions of the Philippines, namely Cagayan Valley, CALABARZON, Western Visayas, Central Visayas, and Davao Region (Reyes, Agbon, et al. 2017). 4.2. Results from focus group discussion conducted in Cagayan Valley and Davao To examine awareness of farmers on agricultural insurance and RSBSA, various FGDs and KIIs were conducted in four sites from two regions namely – Tagum City and Panabo City in Davao Region and Municipality of Peñablanca and Tuguegarao City in Cagayan Valley. The field research operation in Davao Region was conducted last October 1 to 4, 2018 while that for the Cagayan Region was carried out on October 25 to 27, 2018. There were 44 participants from the Davao Region and 46 participants in Cagayan Valley. These are a mix of farmers and fisherfolks with insurance and without agricultural insurance. Meanwhile, the key informants are officials from the city/municipal agriculturist office (C/MAO), PCIC regional office, and Land Bank of the Philippines (LBP) regional office. The FGDs for the farmers and fisherfolks with crop insurance were conducted separately from those who are not beneficiaries of the program. The agriculture officers of the LGUs concerned were the ones who selected the participants with instructions from the study team as to their composition. Because of possible language barrier, the team commissioned local facilitators and documenters for the FGDs. Most of the FGDs were carried out within the premises of the C/MAO but without the presence of the staff or officials of the C/MAO concerned. The one done in Peñablanca was conducted in the barangay hall of Dodan, where the agricultural technicians invited farmers living nearby although some farmers from other barangays also participated. Participants in the Cagayan FGD comprised of 31 beneficiaries and 15 non-beneficiaries. The mean age of the farmers is around 52 years old. Forty-seven percent are women while 53% are men. The average farm size of the participants is 2.03 hectares – those with insurance have an average farm size of 1.78 hectares while those without insurance have slightly higher at 2.6 hectares. Most (41 out of 46, or 89.1%) are corn growers while some (21 out of 46, or 45.7%) are rice farmers. In terms of educational attainment, over a third of the participants have actually reached college, some 18% had only elementary education while the rest (45%) have either reached or completed high school and technical/vocational courses. Meanwhile, participants in the Davao FGD comprised of 21 beneficiaries and 23 non-beneficiaries. The mean age of the farmers is also around 52 years old. There are slightly more men (57%) than women. The average farm size of the participants is 2.5 hectares, wherein those with insurance have an average farm size of 2.06 hectares while those without insurance have slightly higher at 2.9 hectares. Most (64%) are high-value crop growers while the others are rice farmers (43%), corn farmers (14%), livestock growers (18%), and fisherfolks (11%). Roughly 30% of the participants at have some college education. Half of them have had only secondary or technical/vocational education while the rest had only elementary education.
40
4.2.1. Awareness of agricultural insurance and PCIC The FGDs that were conducted reveal that the main reason for non-availment of insurance is the lack of awareness to PCIC’s insurance products. The outcome of FGDs with farmers from Davao Region and Cagayan Valley strongly indicate that there is a need to conduct more information dissemination campaigns. For Cagayan, their experience with typhoon Ompong forced them to learn about agriculture insurance as they have learned that other farmers were able to apply for claims. Among the farmers without insurance who were interviewed, a non-negligible 47% are not aware of the insurance program. These farmers recalled that they were very much willing to be insured under the program had they been informed about it. Farmers from Panabo City shared that even their neighbors keep such information, so that they are the only ones who can benefit from these programs. In many cases, although farmers are aware of PCIC and its programs, they are not informed on how to avail them such as how to enroll or who to approach and what the requirements are. Farmers are also unaware of the benefits of agriculture insurance. They thought that this program is the same with CAP insurance that became bankrupt and were not able to give the claims to their customers. Some farmers, especially those producing high value crops, do not feel the need to get insurance because the problems they encounter (mainly, pest and diseases) are not covered by the insurance. Moreover, only a few farmers know someone in their community who availed the PCIC insurance. Although some farmers without insurance are aware of the PCIC’s programs, they do not know the features and purpose of agricultural insurance. Among those who are aware of agricultural insurance program by the government, there are those who noted that they do not know the process in applying for insurance. Some stressed the need to know about the application process so that when calamities strike, they would be able to recover their capital. One of those who are aware noted that could get indemnity whenever there is a calamity. Another farmer said it is important that they receive an indemnity after a typhoon to be able to start anew. There are farmers who were not aware of the agricultural insurance programs of the government prior to Typhoon Ompong. Also, if not for Ompong, they would have not applied for insurance. One farmer emphasized the importance of the insurance program for single farmers like him. Another farmer cited climate change as one reason in applying for an insurance policy. Generally, the farmers are pleased with the free agricultural insurance program.
4.2.2. Awareness of RSBSA As for the RSBSA, most of the FGD participants (those who do not currently have crop insurance) noted that their names are all listed in the master list of their barangay. They are aware that the registry was made to be able to identify the farmers in the barangay and that it has been updated recently where those who died were already removed from the master list. One of the volunteer leaders of farmers’ association namely Barangay Agriculture and Fishery Council (BAFC) reported that they do submit the master list yearly; however, the PCIC list is not updated since their own names do not appear yet in their list. Another BAFC leader confirmed this saying that there are new young farmers while others have pawned their farms, hence the list must be updated. He noted that the past BAFC leader in their barangay was the one at fault, since he did not monitor the farmers in the area. He recently updated the list to include all farmers so that they could avail of the free agricultural insurance. Surprisingly, some

41
of those with insurance policies and are enlisted in the registry said they are not aware of the RSBSA although some said they have heard about it. These farmers, however, have only been included in the program only recently.
4.2.3. Sources of information As for the sources of information, participants received information about agricultural insurance programs from their technicians in the C/MAO. Agriculturists and technicians from another LGU noted that most farmers are aware since it is being discussed during barangay meetings. Those who are not aware of the program have not attended barangay meetings organized by the agriculture office of the concerned LGU. Farmers confirmed this and said that they learned about the program through their BAFC and technicians who usually visit their barangays. Despite learning about this, not all farmers avail of the program because of their unwillingness to pay and misinterpretation. On the perspective of key informants from the C/MAO and PCIC regional offices, there are other ways mentioned on how to disseminate information: (1) Department of Agriculture’s radio station, (2) farmers’ meetings, and (3) a discussion with PCIC representatives/employees. When asked on how to increase farmers’ access to insurance, a municipal agriculturist stressed that the problem lies on the farmers. Because of their mentality, they usually ignore these programs. Moreover, he said farmers are difficult to educate. Financial institutions like LBP exist to help the farmers; unfortunately, farmers do not pay their debts. Others refuse to embrace institutions like this because of rigid application process and lengthy documentary requirements so they resort to informal lenders like traders. On the other hand, some farmers noted that the best way to reach out to farmers is for PCIC to go down to the bottom. City agricultural offices are crucial elements in improving awareness and access to insurance by farmers. If the LGU is assertive and proactive enough and have adequate qualified personnel, it is likely that information is more effectively provided, farmers’ needs for information are addressed, and more qualified personnel can be deployed for prompt inspections of damages. Panabo LGU is very active in helping PCIC for information dissemination about their products and services especially the presence of the free premium. According to the CAO of Panabo, there is only one PCIC personnel covering the whole city; thus, LGU agricultural technicians helped in the dissemination of information. They assist farmers in the application process. Moreover, the CAO is now establishing a database (profile) of those farmers who apply and availed insurance (free premium) for monitoring and targeting.
4.2.4. Problem of accessibility and the need for clustering Unfortunately, many farmers have difficulty going to the CAO just to inquire on the agricultural insurance program. Farmers noted that PCIC must coordinate with barangay officials, cooperatives and associations. Some of the interviewed fisherfolks noted that they learned about the PCIC programs at barangay assemblies or events where PCIC has information dissemination campaigns. PCIC has been going around the area, joining barangay events as a way to reach out to farmers. Farmers’ associations/cooperatives are important for gathering the farmers together, for facilitating the applications and inquiries, and for information dissemination. This have been echoed by farmers in Davao Region. They have shared that farmers will surely attend a general assembly of cooperatives because they have a sense of ownership (due to their capital share)

42
on the organization. Barangay information drives are not that effective because farmers are not motivated to attend since there is no sanction for non-attendance, unlike in cooperatives where they are fined for absence. PCIC should also collaborate with the people organizations on the matter of information dissemination. In a nutshell, farmers recommended that the awareness campaigns should be done down to the community level. They have recommended that awareness from PCIC, to the city agriculture office, should be disseminated through associations/cooperatives, and barangays (up to the purok level). The need for farmers to cluster together for more efficient dissemination of information is also echoed by PCIC. More innovative approaches, however, are needed to reach farmers in hard-to-reach areas. There are farmers who claimed that only the ones living near the barangay halls have easy access to information about such programs. They also added that government programs are used for political purposes and information dissemination becomes selective.
4.2.5. Problems with the RSBSA RSBSA helped various government agencies in targeting the beneficiaries of a variety of agricultural programs of the government. However, the RSBSA is found lacking in certain areas. Initially, the PCIC used the RSBSA (Version 1) to provide free crop insurance to agricultural producers in the list that satisfies the criteria set by the PCIC. However, the PCIC was able to find small farmers who are not in the list but are qualified for the free insurance program. This limitation, along with similar experiences of non-inclusion found by DAR and DA, resulted in an initiative to add on the current list. This gave rise to the consolidation of farmers and other agricultural producers from various agencies, which was called the RSBSA Version 1.1. PCIC, through its Planning and Management Information Office, consolidated and adjusted the list due to names of farmers included in both versions. For the purposes of providing free insurance, PCIC is using the ‘cleaned’ version of the RSBSA consisting of 10,915,180 records. Moreover, upon conferring with the DBM, the PCIC decided to extend the free crop insurance to farmers who are not on the list provided that they were endorsed by their Municipal Agriculturists as valid farm workers qualified for the free crop insurance program. The PCIC was the able to validate their status via the post planting inspection and the adjustment process if they filed for indemnity claims. Due to this, the PCIC was able to generate a list of 20,957 farmers who were not in the list but where in fact agricultural workers deserving of government assistance. The other government agencies were also able to find deserving agricultural workers through their various approaches. Currently, based on interviews with officials from the PCIC Central and Regional Offices, the RSBSA list was operationally used by the PCIC in order to identify the farmers who will be provided free crop insurance and all the farmers in the list who wishes to avail of free crop insurance were served by the PCIC. Other farmers who are not in the list were financed by PCIC through its corporate earnings as well as the earnings of the PCIC from the penalties and fines of RA 10000 or the Agri-Agra Reform Credit Act of 2009.

43
4.2.6. Limited capitalization and manpower The problems experienced by PCIC with respect to improving awareness of people about its programs are closely tied with its limited capitalization and manpower. An official of the PCIC recalled that in the 1980s, the organization experienced disallowance by COA on the resources it spent on agricultural insurance advertisements in the mainstream media. Since then, the agency has become more cautious in using its budget for information dissemination. Given such constraints, partnerships with local government units’ agricultural offices has become a more feasible option. In the regions, the study found that PCIC partners with the local governments in disseminating information and improving the availment of agricultural insurance programs. Moreover, the PCIC has been proposing for an increase in its capitalization (i.e. from PHP 2 billion to PHP 10 billion) so that it can cater to or cover more marginalized farmers. House Bill No. 6923 or “An Act Strengthening the Philippine Crop Insurance Corporation (PCIC), Repealing for the purpose Presidential Decree No. 1467”, entitled "Creating the 'Philippine Crop Insurance Corporation' has been approved by the Lower House in January 2018. Its counterpart bill in the Senate, however, has not been passed. In addition, the organization has drafted a reorganization plan that seeks to increase its plantilla positions. A study that PCIC carried out with the Development Academy of the Philippines (DAP) shows that the PCIC should target to have around 850 permanent staff members but this is still being studied to match the equity of the organization. The organization also reveals that it is conducting continuous manpower development and improvement of its systems and procedures as a way to prepare the organization for expansion of its programs in the future. In addition, the PCIC intends to continue and intensify its existing awareness programs such as radio programs. The PCIC is also trying to work more extensively with LGUs to improve their network in providing agricultural insurance service. The FGDs suggested that the PCIC needs to expand its social media presence in order to reach its target beneficiaries. The farmers said that most of the time, it is their children who tell them about the programs of the government that tries to improve the welfare of farmers. As such, it is important that the PCIC uses avenues that are accessible to the younger (and more educated) members of agricultural households. 5. Updates on agricultural insurance: current and pending legislations In order to address these issues and to cater more small farmers, various movements in both houses of Congress were made to amend the PCIC charter by introducing various reforms in the way the PCIC operates. One of the proposed changes involves the adoption of index insurance. Another policy reform idea involves expanding the role of PCIC to make it a reinsurer for other companies willing to offer agricultural insurance. In essence, reinsurance is insurance for the insurance companies. Only by sharing some of their risk with reinsurers it is possible for primary insurers to offer coverage against the key risks we face today and to keep prices at affordable levels. Moreover, risks are transferred from individuals and companies, through primary insurers to the reinsurer. Reinsurance allows those parties to reduce their risk exposure and own capital requirements. Although not explicitly stated in PCIC’s mission and vision, this may be an opportunity to add the function of PCIC as reinsurer as part of the amendments of the PCIC Charter.

44
There have also been various proposals to amend the bylaws of the PCIC. The history of the legislative proposals to change the current mandate of the PCIC can be traced back to the 15th Congress. In the 15th Congress (2010-2013), three bills have been proposed in the lower house. House Bill 2825 by Representatives Bello and Bag-ao seeks to allow the PCIC to become a reinsurer and to increase the capitalization of the PCIC. House Bill 3758 of Representative De Venecia seeks to increase the list of covered activities to include fishing and aquaculture. These bills are substituted by House Bill 6883, which merges the feature of these two bills. In the Senate, the 15th congress saw the proposal of Senate Bill 2131 by Senator Recto, which aims to provide free insurance to land reform beneficiaries. House Bill 6883 has been received by the Senate and not acted upon. Senate Bill 2131 is still pending in the committee level. The 16th Congress (2013-2016) saw six bills in the lower house that seeks to reform the PCIC. House Bill 469 of Representative Guanlao aims to increase coverage by including livestock raising, fishing and aquaculture among the list of insurable industries. It also aims to increase the capitalization of the PCIC. House Bill 2074 of Representative De Venecia and Teves, and House Bill 418 of Representative Yap also echoes House Bill 469. House Bills 2193 of Representatives Bravo and Paez seeks to raise funds for PCIC by earmarking a part of the minimum access volume tariff to the PCIC. House Bill 3226 of Representatives Bravo and Paez sets the minimum government share of the insurance premium at 50% for rice and corn farmers and 25% for other crops. It also sets a minimum indemnity of 80% of the crop value. These bills are then substituted by House Bill 5024, which is similar to House Bill 6883. In the Senate, the 16th Congress saw Senator Recto re-filing Senate Bill 2131 as Senate Bill 252. He also filed Senate Bill 714, which aims to provide free insurance for rice and corn farmers. Both bills are still pending in the committee level. House Bill 5024 has been transmitted to the Senate and was not acted upon. The bills filed in the 17th Congress (2016-2019) includes House Bill 4578 filed by Rep. Christopher P. de Venecia, House Bill 4018 by Rep. Peter Unabia, House Bill 6686 by Rep. Eric Singson and Rep. Vilma Santos-Recto, House Bill 6923 by Rep. Arthur Yap, Senate Bill 1171 by Sen. Francis Pangilinan, and Senate Bill 1759 by Sen. Cynthia Villar. An analysis of the proponents of the said bills points to a common denominator among them. Most of the lawmakers who filed bills for crop insurance policies are members of the Committee on Agriculture in both the House of Representatives and the Senate. Sen. Francis Pangilinan, in particular, is the chairperson of the Committee on Agriculture before he was replaced by Sen. Cynthia Villar. The other representatives like Rep. Eric Singson (Deputy Speaker) often represents provinces with significant agricultural interests. Most of the proposed bills aim to improve the system by making enrolment mandatory to agrarian reform beneficiaries. Most of the bills also try to expand coverage by including crops previously not covered by the PCIC (corn, livestock, high value crops, aquaculture), including not just harvest related but also capital related losses to the insurance plan, and overhauling the system to be index-based instead of results-based. Another common feature is the proposal to increase the capitalization of the PCIC. Looking at the bills individually, HB 4578 aims to expand coverage to aquaculture/fishing products, corn, high value crops, and forestry products. It also aims to increase the

45
capitalization of the PCIC by direct government subsidy and government purchase of PCIC securities. HB 6686 makes crop insurance mandatory for agrarian reform beneficiaries. HB 6923 is similar to HB 4578 in that it expands the coverage of the crop insurance program. HB 6923 also allows index-based payment as a possible crop insurance mechanism. Senate Bill 1759, on the other hand, seeks to establish a central framework that allows private insurers to complement the PCIC. 6. Summary and recommendations Agricultural insurance provides a safety net for agricultural producers suffering from shocks that might affect their productivity. This is particularly beneficial for smallholder farmers, which comprises 88.9% of farm holdings and 48.4% of total farm area based on CAF 2012. Reaching the agricultural producers, particularly smallholder farmers, has been one of the major difficulties of PCIC. Currently, PCIC uses a consolidated list of farmers based on the two versions of the RSBSA – version 1 being the ‘original’ RSBSA conducted by DBM in 2012, and version 1.1 being the consolidated lists of farmers from PCIC, DA, DAR, BFAR and NIA. Although the PCIC made an attempt to combine both versions of the RSBSA, using an automated system that detects duplication of names may cause a significant exclusion of legitimate agricultural producers having similar names. Moreover, continual updating of the RSBSA to reflect changes in the composition of agricultural sector will be slow, inefficient and costly. Following the passage of Republic Act No. 11315 on April 2019, it would be more efficient to utilize the Community Based Monitoring System (CBMS) by adding rider questions for farming households to come up with a more updated and complete listing and geotagging of agricultural producers and households in the country. There may be also a need to improve penetration rates and in targeting of beneficiaries for the free insurance program. Penetration rates may be improved by PCIC establishing partnerships with more local government units in providing information dissemination and assistance to their constituents. Moreover, given the limited resources of the PCIC, targeting only those farmers with at most three hectares of farmland will particularly benefit smallholder farmers rather than prioritizing for free insurance coverage of the first three hectares of farmland per farmer. Moreover, as provided for in the proposed legislations of senators and congressmen, Congress may look into the opportunity of amending the PCIC Charter and expanding its role as a reinsurer for other companies that are willing to offer agricultural insurance. Having more entities that offer agricultural insurance will lead to higher penetration rates while keeping prices at affordable and competitive levels.

46
Bibliography Anzano, Corazon G., and Julian Thomas B. Alvarez. 2016. "Impact Evaluation of the
Agricultural Insurance Program of the Philippine Crop Insurance Corporation on Agricultural Producers in Central Visayas." Philippine Institute for Development Studies. https://pidswebs.pids.gov.ph/CDN/PUBLICATIONS/pidsdps1647.pdf.
Arcalas, Jasper Y. 2018. "Ompong farm damage climbs to nearly P27B." BusinessMirror.
https://businessmirror.com.ph/2018/09/25/ompong-farm-damage-climbs-to-nearly-p27b/.
Briones, Roehlano M. 2007. "Characterization of agricultural workers in the Philippines."
Philippine Institute for Development Studies. https://pidswebs.pids.gov.ph/CDN/ PUBLICATIONS/pidsdps1731.pdf.
Cajucom, Norman R. 2013. "Sharing the risk: importance of insurance adaptation." Climate
Change Consciousness Week 2013. Pasay City. Conrado, Vilma D., Jocelyn Tuscano, Beatriz Oñate, Erwin Torio, Jane Umengan, and Nina
Klare Paat. 2017. "Evaluation of the Impact of Agricultural Insurance Program of the Philippine Crop Insurance Corporation on Agricultural Producers in Region 02 (Cagayan Valley), Philippines." Philippine Institute for Development Studies. https://pidswebs.pids.gov.ph/CDN/PUBLICATIONS/pidsdps1712.pdf.
Corpuz, J. M. 2013. "Case study: loan guarantees and insurance in the Philippines." Paper
presented at the 4th World Congress on Agricultural and Rural Finance. Domingo, Sonny N., and Ma. Divina C. Olaguera. 2017. "Review of High-Value Agriculture
in the Philippines with Comprehensive Subsectoral Focus: Livestock Industries." Philippine Institute for Development Studies. https://pidswebs.pids.gov.ph/CDN/ PUBLICATIONS/pidsdps1751.pdf.
Flores, Helen. 2018. "PAGASA: Brace for 4-5 more typhoons as powerful as 'Ompong'."
Philippine Star. https://www.philstar.com/headlines/2018/09/18/1852471/pagasa-brace-4-5-more-typhoons-powerful-ompong.
Geron, Ma. Piedad S., Gilberto M. Llanto, and Jocelyn Alma R. Badiola. 2016.
"Comprehensive Study on Credit Programs to Smallholders." Philippine Institute for Development Studies. https://pidswebs.pids.gov.ph/CDN/PUBLICATIONS/pidsdps 1648.pdf.
Habito, Cielito F., and Roehlano M. Briones. 2005. "Philippine agriculture over the years:
performance, policies and pitfalls." Policies to Strengthen Productivity in the Philippines. Makati City.
Lansigan, Felino P., Consorcia E. Reano, Liza N. Comia, Nancy A. Tandang, Roselle V.
Collado, James Roldan S. Reyes, Rachelyn S. Arana, et al. 2017. "Evaluation of the Impact of Agricultural Insurance Program of the Philippine Crop Insurance Corporation on Agricultural Producers in Region IV-A (CALABARZON)." Philippine Institute for

47
Development Studies. https://pidswebs.pids.gov.ph/CDN/PUBLICATIONS/pidsdps 1715.pdf.
Mina, Christian D., and Celia M. Reyes. 2017. "Estimating Filipinos’ vulnerability to poverty."
Philippine Institute for Development Studies. https://pidswebs.pids.gov.ph/CDN/ PUBLICATIONS/pidspn1714.pdf.
Philippine Crop Insurance Corporation. 2018. "Annual Report 2017." Reyes, Celia M., Adrian Boyett D. Agbon, Christian D. Mina, and Arkin A. Arboneda. 2017.
"Crop Insurance Program of the Philippine Crop Insurance Corporation: Integrative Report from the Five Case Regions in the Philippines." Philippine Institute for Development Studies. https://pidswebs.pids.gov.ph/CDN/PUBLICATIONS/pidsdps 1739.pdf.
Reyes, Celia M., and Reneli Ann B. Gloria. 2017. "Evaluation of the Registry System for Basic
Sectors in Agriculture." Philippine Institute for Development Studies. https://pidswebs.pids.gov.ph/CDN/PUBLICATIONS/pidsdps1703_rev.pdf.
Reyes, Celia M., and Sonny N. Domingo. 2009. "Crop insurance: security for farmers and
agricultural stakeholders in the face of seasonal climate variability." Philippine Institute for Development Studies.
Reyes, Celia M., Christian D. Mina, Reneli Ann B. Gloria, and Sarah Joy P. Mercado. 2015.
"Review of design and implementation of the agricultural insurance programs of the Philippine Crop Insurance Corporation (PCIC)." Philippine Institute for Development Studies. https://dirp3.pids.gov.ph/webportal/CDN/PUBLICATIONS/pidsdps 1507_rev.pdf.
Reyes, Celia M., Reneli Ann B. Gloria, and Christian D. Mina. 2015. "Targeting the
Agricultural Poor: The Case of PCIC`s Special Programs." Philippine Institute for Development Studies. https://pidswebs.pids.gov.ph/CDN/PUBLICATIONS/pidsdps 1508.pdf.
Rola, Armand Christopher C., and Corazon T. Aragon. 2013. "Crop Insurance Participation
Decisions and Their Impact on Net Farm Income Loss of Rice Farmers in the Lakeshore Municipalities of Laguna, Philippines." http://phileconsoc.files.wordpress.com/2013/ 11/rola.docx.
Virola, Romulo A. 2017. "Evaluation of the Financial Sustainability of the Agricultural
Insurance Programs of the Philippine Crop Insurance Corporation." Philippine Institute for Development Studies. https://pidswebs.pids.gov.ph/CDN/PUBLICATIONS/ pidsdps1707.pdf.