toward a systematic evidence-base for science in out-of-school
TRANSCRIPT

A Study Prepared for the Noyce Foundation
August 2008
EMBARGOED
Karen Hussar, ed.d.
saraH scHwartz, M.ed.
ellen Boiselle, PH.d.
Gil G. noaM, ed. d., PH.d. (HaBil)
Program in education, afterschool & resiliencyHarvard university and Mclean Hospital
Toward a Systematic Evidence-Base for Science in Out-of-School Time:The Role of Assessment

- 2 -
TABLE OF CONTENTS
EXECUTIVE SUMMARY 3 INTRODUCTION 7
Domain Classifications 12 METHODOLOGY 19
Phase 1 19 Phase 2 19 Phase 3 20 Phase 4 20
DESCRIPTION OF ASSSESSMENT TOOL TABLES 21 ANALYSIS OF SCIENCE ASSESSMENT TOOLS 22 Introduction 22
Domain Classifications 22 Quantitative vs. Qualitative Instruments 28 Psychometric Properties 30 Domestic vs. International Instruments 32 Age of Respondents 33 Underrepresented Groups 34 Administration Time 34 Areas for Future Study 35
Learning from Math Anxiety Assessments 36 Observation Tools 37
RECOMMENDATIONS 40 ADDENDUM 49 REFERENCES 54 TABLES AND FIGURES 61
Figure 1 61 Table 1 62 Table 2 63 Table 3 65 Table 4 74
APPENDIXES 79 Appendix A 79 Appendix B 80 Appendix C 85
AUTHORS NOTE 87

- 3 -
EXECUTIVE SUMMARY
Purpose
After-school programs are gaining recognition as a setting that holds great
potential for increasing child and youth literacy and engagement in science. With this
awareness comes a call for evidence that demonstrates after-school programs’ impacts
on students’ knowledge, engagement, and interest in science. Consequently, there are a
growing number of evaluations of science after-school programs. For these evaluations,
a multitude of instruments have been developed to assess the impact of after-school
science programs. Although the use of these instruments has contributed to the
assessment of after-school science programs, the field now needs to examine critically
the most efficacious and efficient means of assessment, whether these assessments
should differ across programs, and how they relate to constructs of science learning and
program quality. To address these fundamental questions, the Noyce Foundation, a
leading strategic funder in the after-school science field, requisitioned this study to
review and report on the current state and needs of the after-school science assessment
world.
In this report, we approach the assessment of after-school (and summer) science
programs from a set of significant descriptive and interpretive perspectives: What
instruments are currently being used in the field? Have these tools been assessed with
regard to psychometric properties? Is there a need for the creation of generalized
assessment tools that could be used to compare across programs? What would be the
most useful structure for creating generalized assessments? Would it be more effective
to create one integrated instrument, multiple instruments for multiple science education
- 4 -
domains, an item bank of assessment questions from which programs can select, or a
decision tree with various assessment options?
Methods
We began this project with an extensive search for existing assessment tools in
the informal science and science education fields and uncovered 64 assessment tools
that we believed warranted further investigation. We then narrowed our list of
assessment tools from 64 to 16 by establishing specific criteria that these tools needed to
meet in order to be considered for a more in-depth review.
Our review and analysis focused primarily on student outcomes, based
specifically on a framework provided in a recent National Science Foundation report
(Friedman et al., 2008) for evaluating the impact of informal science education
programs. We used the following five domains, grounded in the NSF framework, to
classify instruments.
• Engagement/Interest
• Attitude/Behavior
• Content Knowledge
• Competence and Reasoning
• Career Knowledge/Acquisition
We examined instruments according to these five domains, as well as looking at
other key areas including: quantitative vs. qualitative instruments, psychometric
properties, domestic vs. international instruments, age of respondents,
underrepresented groups, and administration time.
In addition to our review and analysis of assessment tools, we convened focus
groups of practitioners and evaluators involved with after-school and informal science

- 5 -
education around the country to gather information about what types of assessment
tools they found most useful and which domains of science programming they believed
should be assessed.
Recommendations
At the onset of this project, two possibilities appeared probable: the modification
of existing instruments or the creation of one or more comprehensive instruments.
While many science assessment instruments do exist, we determined that there is a
need for new assessment tools in the field. More specifically, we recommend three
strategies to strengthen the evidence base for this field.
1. We recommend the creation of an online database that includes the tools
described in this report as well as many of the tools that evaluators throughout
the country have developed for their individual programs. This database should
be continuously updated with newly-created assessment tools. It should be
organized to allow programs to select the appropriate instrument(s) for their
sites according to a variety of criteria including domain, grade-level, assessment
time, etc.
2. In addition to the online database, we recommend that funders encourage the
use of a small number of informal science assessment questions that the entire
field would use whenever an evaluation is performed. This strategy would allow
for some baseline comparisons across programs. However, it is important to
note that these questions would not be sufficient for a detailed analysis of all five
domains nor would they have the psychometric qualities of a cohesive
instrument.
- 6 -
3. While the first two recommendations provide important initial steps, they do not
provide the growth this field needs. In addition to these strategies, the field
needs a tool or a set of tools that would eventually gain sufficient acceptance to
be utilized by a significant number of programs across the country, thereby
allowing for national norms to be established and true comparison to be made.
Since, at this point, there are no instruments that assess all five domains through
outcome measures, we recommend that steps be taken to develop such
instruments. Specifically, we recommend the creation of two complementary
tools: (1) a quantitative tool consisting of student surveys to assess participant
outcomes in the five domains, and (2) a qualitative-quantitative tool consisting of
an observation instrument to assess program quality in the five domains. These
tools should be validated, have strong psychometric properties, be normed-
based on different populations, include developmentally appropriate
adaptations for younger children, allow administration in a reasonable amount
of time, and be sensitive to change (to allow for pre- and post-testing).
Taken together, these recommendations will require a commitment on the part of
foundations and leaders in the field to support the creation of valid and reliable
assessment tools that can be used across programs. The process of creating a stronger
evidence base for this field will be most effective if programs across the country view
assessments as tools that will enhance the quality of their program and that are
reflective of the outcomes towards which they are striving.

- 7 -
INTRODUCTION
Politicians, educators, and business leaders alike emphasize the critical importance
of scientific literacy among citizens for both individual and national success in the 21st
century. Yet, research indicates that by most measures, our system of science education
is not working. Middle school and high school students are performing poorly on
international tests when compared to their peers in other developed nations. In
addition, few undergraduates are choosing to major in science or engineering (15% in
the United States, as compared to 47% in France, 50% in China, and 67% in Singapore)
(Augustine, 2005). Moreover, students report low levels of interest in science classes in
middle and high school (Zacharia & Calabrese-Barton, 2003).
In response to this need to enhance both the quality and quantity of science
education in the U.S., practitioners, researchers and policy-makers have begun to
expand the role of informal science learning as a venue to promote science literacy and
engagement. This strategy focuses increasingly on the large potential of out-of-school
time (OST) settings, which include programs that occur after school and during the
summer. After-school and summer programs typically provide an environment where
exploration can take place in a more relaxed, experiential, and test-free setting.
Moreover, a chief reason for low levels of interest in science among students in the
United States is that school science often feels disconnected from students’ lives outside
of school (Bouillion & Gomez, 2001). Because the after-school setting exists in between
the world of school and students’ homes and communities, it is in a privileged position
to address this perceived disconnect, offering science programs that may be more
personally and contextually relevant than those that are driven primarily by defined
curricula and tests (Noam, Biancarosa, & Dechausay, 2003).

- 8 -
There is considerable philosophical overlap between after-school programs and
informal science education. Youth development research has shown ideal after-school
settings as student-centered and providing opportunity for cooperation and
relationship-building while developing knowledge and skills through authentic, hands-
on activities (Eccles & Gootman, 2003; Noam, Biancarosa & Dechausay, 2003).
Similarly, ideal informal science programs are described as hands-on, learner-directed,
and interactive in the context of a social group and consisting of cooperative activities
and real-world tasks (Ash & Klein, 1999).
While there are many reasons to believe after-school programs can play a
significant role in increasing students’ interest, engagement, knowledge and
achievement in science, the evidence that after-school science programs are succeeding
in these goals remain sparse. In the past decade, there have been increasing numbers of
independently commissioned evaluations of science after-school programs. The data
from these studies are very promising, indicating that after-school science programs can
improve students’ attitudes towards science; increase their scientific knowledge and
skills; and, in some cases, raise grades, test scores, and college attendance (Schwartz &
Noam, 2007). Participation in science after-school and summer programs has also been
correlated with increased likelihood of selecting science-related college majors
(Schwartz & Noam, 2007).
To date, many of the studies that show promising results have used “home-
grown” assessment tools to demonstrate impact. Although this practice has its benefits
(e.g., instruments relate directly to a specific program), it results in two challenges.
First, the use of program-by-program assessments calls into question the validity
and/or reliability of the studies (since they traditionally lack norms, psychometric

- 9 -
properties, and peer-reviewed reports), and this can render them less persuasive in the
eyes of researchers, funders and policymakers. Second, because many programs and
program evaluators create their own tools, it is difficult to compare or summarize
results across programs or evaluators. As a consequence, there is very little
comparative data available to support the claim that OST science programming is
effective, or to support best practices for the field (Schwartz & Noam, 2007).
It should be noted that other applications of informal science, particularly in
museum science, have a voluminous body of evaluation research. Furthermore, there
are several organizations that make available an open source for evaluation findings
studying informal science (see informalscience.org, visitorstudies.org, and the National
Science Foundation’s Informal Science Education website). While these sites do not
focus specifically on after-school science, they demonstrate the accumulation of a large
body of collective knowledge of the informal science field. Yet even in this more mature
field, the evaluations remain, for the most part, quite focused on individual projects,
and they rarely can be generalized or used to compare data across programs.
The field of after-school and summer science is at a critical juncture. Interest in
and federal funding for after-school programs has surged over the last decade
(Afterschool Alliance, 2007; Dynarksi, Moore, Mullens, Gleason, James-Burdumy,
Rostenberg, Pistorino, Silva, Deke, Mansfield, Heaviside, & Levy, 2003). In 2005, 40% of
all students in grades K-8 were in at least one weekly non-parental after-school care
arrangement (U.S. Department of Education, 2004). Yet in order for the field to
continue to grow and improve in quality, research and evaluation efforts must keep
pace. Increasingly, funding is contingent upon programs’ capacity to show evidence of
their success. Consequently, there has been an increase in the number of instruments
- 10 -
created to evaluate individual programs. Although the use of these instruments has
already made significant contributions to the assessment of after-school science
programs, the field is now at a point where it is necessary to examine critically what are
the most efficacious and efficient means of assessment, whether these assessments
should differ across programs, and how they should relate to constructs of science
learning and program quality. To address these fundamental questions, the Noyce
Foundation, a leading funder in the after-school science field, invited this study, review
and report to better understand the current state as well as the needs of the after-school
informal science assessment world.
In this report, we approach the assessment of after-school informal science
programs from a set of significant descriptive and interpretive perspectives: What
instruments are currently being used in the field? Have these tools been assessed with
regard to psychometric properties? Is there a need for the creation of generalized
assessment tools that could be used to compare across programs? What would be the
most useful structure for creating generalized assessments? Would it be more effective
to create one integrated instrument, multiple instruments for multiple informal science
education domains, an item bank of assessment questions from which programs can
select, or a decision tree with various assessment options?
Our review focuses primarily on student outcomes, specifically in the domains
outlined in a recent National Science Foundation paper (Friedman et al., 2008),
including engagement/interest, attitude/behavior, content knowledge, competence and
reasoning, and career knowledge/acquisition. These domains will be further discussed
in the following section. While the report addresses instruments utilized across science
programs, which are typically quantitative instruments, we also explored any

- 11 -
qualitative instruments that have been used repeatedly across programs and have been
published. Additionally, although the report is focused on science, we also review
assessment tools used by mathematics after-school programs to determine if the
mathematics field has resolved any of the questions currently faced by the science
world. There also exists further literature on technology and engineering that is
relevant, but beyond the scope of this report. We believe the recommendations made in
the paper with respect to science will also have implications in the neighboring fields of
technology and engineering. Over time, all STEM literatures should be brought
together, but this report will focus specifically on the science and informal science
literature.

- 12 -
DOMAIN CLASSIFICATIONS
Meaningful assessment is always grounded in program goals. Although the
specific goals of after-school programs in science may vary in both focus and degree,
typical objectives include enhancing positive attitudes and behaviors regarding science
and increasing scientific knowledge and reasoning skills. A recent report from the
National Science Foundation (Friedman et al., 2008) provides a foundation for this work
by creating a framework for evaluating the impact of informal science education
programs, including museums, community initiatives and OST programs. Specifically,
this consensus report outlines five domains in which informal science education can
have an impact on participants:
• awareness, knowledge, or understanding of STEM concepts, processes, or careers, • engagement or interest in STEM, concepts, processes, or careers, • attitude towards STEM-related topics or capabilities • behavior related to STEM concepts, processes, or careers, and • skills based on STEM concepts, processes, or careers
The creation of these separate domains is important for two related reasons.
First, it highlights the significance of each domain in informal science education and it
encourages researchers and practitioners to consider multiple areas of impact. Second,
it provides a framework with which researchers and practitioners can both articulate
and differentiate specific program goals. Such articulation and differentiation is critical
for any effective evaluation, particularly as it fosters both clarity of purpose and
efficiency of design.
We used the domains in the National Science Foundation report as a starting
framework for our examination of existing evaluation tools in the informal science
education realm. After carefully considering NSF’s domains, as well as surveying
existing assessment tools, we delineated five separate domain categories. Although

- 13 -
these categories are similar to those created by the consensus report, we made
modifications to suit the specific nature of this project on existing tools. We also added
a category of interest in science careers because of the importance of this issue for
national policy and support of science education. Table 1 summarizes the components
of each domains used in the current report. Figure 1 shows how the NSF domains
translate into the domains used in this report.
TABLE 1. ASSESSMENT DOMAIN CLASSIFICATIONS
Engagement / Interest Level of participation / Interest in activity Curiosity in STEM-related activities and issues Excitement about / Enthusiasm for engaging in STEM activities Fun / Enjoyment in STEM activities Desire to become a scientist
Attitude / Behavior Belief that science / math is sensible, useful and worthwhile Belief in one’s ability to understand and engage in science and math (“can do attitude”) Pro-social / adaptive learning behaviors in relation to STEM Reduced anxiety / trepidation around STEM Positive scientific / math identity
Content Knowledge Knowledge and/or re-affirmation and expansion of what one already knows Development of fundamental skills (i.e, measuring) Ability to use basic instruments (i.e, graphing calculator, microscope)
Competence and Reasoning Ability to formulate strategies and to investigate scientific / mathematical problems Capacity to think logically, reflect, explain and justify one’s strategies and solutions Ability to see connections between topics Ability to apply content knowledge in novel context Knowledge of and the ability to apply principles of scientific inquiry Development of knowledge and ability to apply ethical principles of the profession
Career Knowledge / Acquisition Knowledge about STEM career options
Knowledge of pathways to STEM careers (i.e. pre-requisite classes, internships etc.)

- 14 -
FIGURE 1. COMPARISON OF NSF DOMAINS AND DOMAINS USED IN CURRENT
REPORT
The first domain, engagement/interest, is directly aligned with the
corresponding category from the NSF report. This domain focuses on participants’
feelings towards and resulting engagement in STEM, specifically addressing areas such
as their level of participation in activities, their enjoyment of those activities, and their
curiosity and enthusiasm about science topics and endeavors. We also include in this
category participants’ desire to be a scientist, since the aspiration to become a scientist is
largely related to their feelings towards science.
The next three categories are based on the NSF domains, but are reorganized.
We chose to separate content knowledge from competence and reasoning since they
capture two very distinct levels of learning which are, themselves, reflected in the

- 15 -
assessment instruments we surveyed. More specifically, content knowledge
characterizes knowledge at a concrete, factual level. This domain includes factual
knowledge (for example, the distinction between insects and arachnoids in the study of
biology), knowledge of fundamental skills such as measuring, and the ability to use
basic instruments (for example, the use of a microscope). In contrast, competence and
reasoning focuses on applying knowledge, thinking logically, and formulating
strategies. Also included in this category is the ability to apply ethical principles of the
profession, as this requires the application of abstract concepts to one’s work, such as
intellectual honesty or the willingness to alter one’s opinion based on evidence.
In addition, we combined attitude and behavior because we believe
engagement/interest in scientific activities can result in changes in behavior (e.g.,
beginning to recycle), as well as changes in attitudes (e.g., I know that I can help the
environment by recycling). Moreover, we consider attitude and behavior to be
mutually reinforcing, with attitudes influencing behaviors, and behaviors contributing
to attitude.
Perhaps the most significant change we made was in the creation of our last
domain, career knowledge/acquisition. We chose to make this a separate domain
because, although currently very few assessments address this domain, it is clear that
this is an area that needs further attention, particularly in light of the fact that not
enough students in the United States are studying science in college or entering STEM
careers (Augustine, 2005). This domain includes knowledge about STEM careers and
an understanding of what steps are necessary to prepare oneself for a career in STEM.
Importantly, we do not consider a youth’s desire to study science as a component of this
domain; we instead include this component in engagement/interest because it pertains

- 16 -
to youth’s feelings towards STEM. For example, it is not enough for youth to simply feel
that it would be fun to be an engineer; they also need to know what an engineer does on
a daily basis, as well as what classes, internships, jobs, or research would prepare them
to be competitive in the engineering world. The domain of career
knowledge/acquisition is particularly appropriate for the after-school setting since
after-school programs, with their connections to community organizations and
businesses, and their frequent use of mentors, are in a unique position to promote
knowledge and understanding of science careers.
Although our domain classifications were grounded in the categories created in
the NSF report, we recognize that other researchers and practitioners in the field
develop their instruments with different constructs and definitions in mind. Thus,
connecting the existing assessment literature to the newly formed consensus evaluation
strategies does not represent a perfect match. Our attempt to bridge the consensus
document with the existing literature has led to the categories that are strongly aligned
with the NSF document.
We reference these categories throughout our analysis of both science and math
assessment tools. To clarify how we used these categories in the subsequent analysis,
Table 2 provides examples of individual items from science assessment tools that we
classified in a specific domain.

- 17 -
TABLE 2. EXAMPLES OF ASSESSMENT ITEMS
Engagement / Interest Science Opinion Survey, Item #5: When I leave school, I would like to work with people who make discoveries in science. I strongly agree I agree I’m not sure I disagree I strongly disagree Science Curiosity Scale, Item # 9: I would like to experiment with the gadgets inside the space shuttle. Strongly disagree Disagree Uncertain Agree Strongly agree ROSE, Item A.7: How interested are you in learning about how the human body is built and functions? Not interested A little interested Interested Very interested
Attitude / Behavior Children’s Environmental Attitude and Knowledge Scale (CHEAKS), #5: I would be willing to ride the bus to more places in order to reduce air pollution. Very true Mostly true Not sure Mostly false Very false Modified Attitudes towards Science Inventory, ATSI Item Statements, #1: Science is useful in helping to solve the problems of everyday life. (1) Strongly disagree (2) Disagree (3) Uncertain (4) Agree (5) Strongly agree Test of Science-Related Attitudes (TOSRA), Item #29: The government should spend more money on scientific research. Strongly agree Agree Not Sure Disagree Strongly disagree
Content Knowledge Ohio’s Evaluation & Assessment Center Science Inquiry Test, Item #2: A small animal with dry skin and no legs that hatches from an egg is probably A. a snake B. a worm C. an eel D. a lizard Children’s Environmental Attitude and Knowledge Scale (CHEAKS), Item #46: Which is most responsible for creating acid rain?
(1) sulfur dioxide (2) carbon dioxide (3) ozone (4) nitrogen (5) ultraviolet radiation
Ohio’s Evaluation & Assessment Center Science Inquiry Test, Item #2: Which of the following objects has the most inertia? A. A 50-kilogram rock B. A 100-kilogram football player C. An automobile D. An oil tanker
Competence and Reasoning SAI (Moore and Foy), Item 3-A: To operate in a scientific manner, one must display such traits as intellectual honesty,

- 18 -
dependence upon objective observation of natural events, and willingness to alter one’s position on the basis of sufficient evidence. 1 (Strongly agree) 2 (Agree) 3 (Undecided) 4 (Disagree) 5 (Strongly disagree) VASS, Question 9: When they investigate a particular event in the natural world, physicists: (a) look for all possible aspects that might be attributed to the event under investigation. (b) concentrate on particular aspects that they consider relevant to the purpose of the study 1. (a) >> (b) 2. (a) > (b) 3. (a) = (b) 4. (a) < (b) 5. (a) << (b) EBAPS version 6.1, 02-01-2006, Item #19: Scientists are having trouble predicting and explaining the behavior or thunder storms. This could be because thunder storms behave according to a very complicated or hard-to-apply set of rules. Or, that could be because some thunder storms don’t behave consistently according to any set of rules, no matter how complicated and complete that set of rules is. In general, why do scientists sometimes have trouble explaining things? (a) Although things behave in accordance with rules, those rules are often
complicated, hard to apply, or not fully known. (b) Some things just don’t behave according to a consistent set of rules. (c) Usually it’s because the rules are complicated, hard to apply, or unknown; but
sometimes it’s because the thing doesn’t follow rules. (d) About half the time, it’s because the rules are complicated, hard to apply, or
unknown; and half the time, it’s because the thing doesn’t follow rules. (e) Usually it’s because the thing doesn’t follow rules; but sometimes it’s because the
rules are complicated, hard to apply, or unknown.
Career Knowledge / Acquisition PISA, Q27c: The subjects I study provide me with the basic skills and knowledge for a science-related career. Strongly agree Agree Disagree Strongly disagree PISA, Q27d: My teachers equip me with the basic skills and knowledge I need for a science-related career. Strongly agree Agree Disagree Strongly disagree
- 19 -
METHODOLOGY
The following section outlines our overall approach to locating and analyzing
assessment tools in the formal and informal science field. It is best described in four
distinct phases.
PHASE 1
The first phase of this project began in the spring and summer of 2007 with an in-
depth review of existing assessment tools in the informal science and science education
fields. We began this review by searching relevant journals (see Appendix A, page 79)
for articles that were related to informal science, science education, and assessment. We
also researched relevant programs and organizations (see Appendix B, pages 80-84) to
determine what (if any) assessment tools they employed for student assessment. When
necessary, we followed up (via email or phone) with an appropriate individual within a
particular program or organization to ascertain more information about their particular
method(s) of assessment. We also reviewed dissertation abstracts via keyword searches
(e.g., “assessment,” “evaluation,” “science,” “program quality,” “after-school,” “out-of-
school-time,” and “child outcomes”). Using these various sources, we compiled an
extensive list of science assessment tools that these various journals, programs,
organizations, and dissertations referenced. In total, we found 64 assessment tools that
we believed warranted further review (see Appendix C, pages 85-86).
PHASE 2
We narrowed the list of assessment tools compiled in Phase 1 from 64 to 16 by
establishing specific criteria that these tools needed to meet in order to be considered
for the in-depth review. The criteria included: potential for implementation beyond the

- 20 -
specific program for which the assessment tool was originally designed; assessment of
elementary, middle and/or high school-aged students; written in (or translated into)
English; assessment of at least one domain classification in addition to content
knowledge1; inclusion of psychometric data or an explanation as to why the tool
developers decided not to evaluate the psychometric properties of their instrument;
and availability of instrument and its relevant information.
PHASE 3
During the winter of 2008, we convened focus groups, each with a particular
group of STEM experts: practitioners, evaluators, and Boston-based STEM leaders. The
purpose of these discussions was to determine what types of assessment tools these
STEM experts found most useful, which domains of science programming they believed
should be assessed, and how funders evaluated the success of their STEM programs.
PHASE 4 Based on our in-depth analysis of the condensed list of science assessment tools,
as well as the feedback we received from focus group participants, we compiled and
integrated the information presented in the current report.
1 An instrument was identified as targeting a domain if at least one question addressed that particular domain.

- 21 -
DESCRIPTION OF ASSESSMENT TOOL TABLES
In order to provide an overview of all assessment tools, we created a detailed
chart that highlights their central features (see Table 3, pages 65-73). These features
include: a short description of the tool, the type of assessment, its scale, respondents,
domain(s) evaluated, sample item(s), administration time, reliability, validity,
frequency of use, primary reference, and additional comments. We chose these
categories by examining papers (e.g., Measuring Youth Program Quality: A Guide to
Assessment Tools [Yohalem & Wilson-Ahlstrom, 2007]) and websites (e.g.,
www.toolfind.org) that utilized categories to analyze assessment tools and by
incorporating suggestions from focus group participants. We then restructured the
information presented in Table 3 so that readers could easily compare specific features
across all assessment tools (see Table 4, pages 74-78). For example, if a program
evaluator wanted to identify assessment tools that took less than an hour to administer,
she could reference the “administration time” category. Likewise, if a teacher wanted
to identify assessment tools that incorporated both multiple-choice and extended
response questions, he could reference the “method of assessment” category. It is our
intention to make these tables accessible to interested individuals via a searchable web
tool.

- 22 -
ANALYSIS OF SCIENCE ASSESSMENT TOOLS
INTRODUCTION
This analysis highlights both general and specific issues related to assessment,
including domain classifications, qualitative vs. quantitative instruments, psychometric
properties, domestic vs. international instruments, age of respondents,
underrepresented groups, and administration time. Before reading our commentary,
we encourage readers to review Tables 3 and 4 in order to familiarize themselves with
these instruments. Readers also may want to reference these tables as they read the
following section.
DOMAIN CLASSIFICATIONS
Of the sixteen child assessment tools highlighted in the current report, none
address all five domain classifications. More than three-quarters of the instruments we
assessed address attitude/behavior and/or engagement/interest, about half of the
instruments address competence and reasoning and content knowledge, and only one
assessment tool addresses the domain of career knowledge/acquisition (see Table 4,
pages 74-78). This pattern of emphasizing questions related to the domains of
attitude/behavior and engagement/interest and neglecting the domain of career
knowledge/acquisition appears to be representative of an overall trend in the science
assessment field.
Attitude/Behavior & Engagement/Interest
With the exception of two instruments (the Discovery Inquiry Test in Science and
Views of Nature of Science Questionnaire), all the assessment tools include questions
- 23 -
related to the domain of attitude/behavior. Similarly, ten of the sixteen tools include
questions related to the domain of engagement/interest. Many assessment tools (the
Children’s Science Curiosity Scale, Modified Attitudes toward Science Inventory,
Science Opinion Survey, Scientific Attitudes Inventory, Test of Science Related
Attitudes, Wareing Attitudes toward Science Protocol) address both of these domains.
This is likely due to the call from experts in the science field who believe that an
increase in students’ interest and positive attitudes towards science will lead to
increased participation in science careers (Tai, Liu, Maltese, & Fan, 2006).
Those assessment tools that predominantly address attitude/behavior and
engagement/interest tend to devote a large number of items (a minimum of 25) to these
two domains. Among those assessment tools that the current paper highlights, the
majority tend to address these domains through a Likert-scale. Notable exceptions to
this trend include the Draw-a-Scientist Test which assesses attitude/behavior through a
drawing and the Views about Science Survey and Views-on-Science-Technology-
Society which assess this domain through multiple-choice questions.
Content Knowledge & Competence and Reasoning
As previously mentioned, about half of child assessment tools we studied
include items related to content knowledge and competence and reasoning. However,
instruments tend to assess content knowledge and competence and reasoning through
different formats. For example, many utilize multiple-choice questions (the Children’s
Environmental Attitude and Knowledge Scale, Discovery Inquiry Test in Science,
Epistemological Assessment for Physical Science, Views about Science Survey, Views
on Science-Technology-Society), while others use Likert-scale items (Programme for

- 24 -
International Student Assessment, Relevance of Science Education) or short-constructed
responses (The Views of Nature of Science Questionnaire). One assessment instrument,
the National Assessment of Educational Progress uses a combination of multiple-choice,
short constructed and extended-response questions.2
Among those assessment tools that use multiple-choice questions, there is great
variety as to how they evaluate content knowledge and competence and reasoning. The
Children’s Environmental Attitude and Knowledge Scale and Discovery Inquiry Test in
Science present the most traditional format with respondents choosing the correct
response among four or five possibilities. However, the multiple-choice questions
posed in the Discovery Inquiry Test in Science and the National Assessment of
Educational Progress require respondents to interpret graphs, charts, and illustrations,
as opposed to the Children’s Environmental Attitude and Knowledge Scale which
merely asks students to respond to a question and requires no such application of skills.
Conversely, both the Views about Science Survey and the Epistemological Assessment
for Physical Science present students with two contrasting positions related to a science
issue. Respondents must determine if they favor one position over the other and, if
they do, to what extent. However, the ambiguity of the “contrasting alternative design”
the Views about Science Survey utilizes may be difficult for respondents to comprehend
whereas the Epistemological Beliefs Assessment for Physical Science coherently
presents five contrasting viewpoints from which respondents can choose. The Views on
Science-Technology-Society is similar to the Views about Science Survey and the
Epistemological Assessment for Physical Science in that it presents respondents with an
extreme position about a science-related topic. Respondents must first determine if
2 It should be noted that NAEP tests being developed to be used in 2009 include computer-based simulation activities which aim to examine students’ inquiry skills.

- 25 -
they agree with this position; if not, they must select an alternative statement that is
closely aligned with their position.
As previously mentioned, two instruments, the Programme for International
Student Assessment and Relevance of Science Education, utilize Likert-scales to
measure the competence and reasoning and content knowledge domains. However,
Likert-scales may not be the ideal method to assess these two domains, as they rely on
respondents to report the frequency with which they participate in certain activities that
would be categorized within one of these two domains. Without any cross-validation
of these self-reports, it is impossible to determine the accuracy with which respondents
report this information.
The two assessment tools that incorporate short and/or extended responses to
address competence and reasoning and content knowledge employ different strategies
for assessing respondents’ answers. The National Assessment for Education Progress
has scorers classify responses in one of four categories: complete, essential, partial, or
unsatisfactory/incorrect. For each question that requires a short or extended response,
scorers receive a detailed explanation as to what constitutes a response within each of
these four categories. The Views of Nature of Science Questionnaire’s test developers
have a different philosophy related to their short-constructed responses. They explain,
Each question . . . is followed by . . . what is considered to be an answer consistent with reform documents and contemporary views about science. “Scoring” of answers is not meant to yield a numerical value, but rather a description of whether the respondent has the desired view (Abd-El-Khalick, 2002, p. 6). In other words, the test developers do not intend to have these short-constructed
responses evaluated for their “rightness” or “wrongness.” Rather, through

- 26 -
respondents’ answer, they hope to determine the degree to which respondents’ views
are aligned with current opinions about science.
Clearly, different assessment tools utilize different strategies, such as multiple-
choice and open-response questions, to assess content knowledge and competence and
reasoning. A benefit of multiple-choice questions is that they do not require a great
deal of time to administer. However, multiple-choice questions do not provide the
depth of information about respondents’ knowledge that short and extended-response
questions do. This is not to say that short and extended-response questions are an ideal
form of assessment. These types of questions are more difficult to assess; they
introduce issues of inter-rater reliability and they are challenging for respondents who
are not skilled writers.
There is also considerable variability in the actual content instruments address
(see Table 3, pages 65-73). For example, the Children’s Environmental Attitude and
Knowledge Scale is the only instrument that assesses respondents’ knowledge about the
environment. This contrasts the Views on Science-Technology-Society which addresses
the epistemological, social and technological aspects of science. Both the Views about
Science Survey and Views of the Nature of Science Questionnaire assess the
“methodology” of science. However, for both of these instruments, this is just one
aspect of the content knowledge they address. Similarly, both the Discovery Inquiry
Test in Science and National Assessment of Educational Progress address earth,
physical and life sciences, but these topics are just a portion of the content knowledge
the instruments assess.
Given that different programs choose to focus their curricula on different content
areas, this variability is not surprising. More likely than not, this trend will persist in

- 27 -
the formal and informal science fields. As such, it is unreasonable to assume that one
standardized assessment tool would be able to address all potential content areas. The
question arises, however, whether there could be guidelines for assessment in multiple
disciplines, such as biology, environmental science, and physical science. Some core
knowledge or principles exist in each of these disciplines that one could potentially
assess. It is also possible that some core competencies and reasoning processes cut
across disciplines that would allow for some common assessment instruments to be
developed for this domain. Finally, an alternative strategy would be to have experts
from the field develop a set of guidelines focusing solely on how evaluators assess
content. This approach would allow for some consistency across assessment tools while
still allowing programs to address their specific content areas.
Career Knowledge/Acquisition
Unlike the other four domains, very few child assessment tools address the
domain of career knowledge/acquisition. In fact, only one assessment tool that we
evaluated, Programme for International Student Assessment, includes questions related
to this domain. Even in this instance, there are only four probes that address exposure
to science careers and career counseling and none that address mentoring relationships.
In one respect, this trend is surprising given the emphasis that experts in the science
field have placed on increasing the numbers of individuals who opt for science careers
(e.g., Rising about the Gathering Storm, 2007). However, given that the NSF did not
highlight this domain in their recent report (Friedman et al., 2008), it appears that this
domain has not been sufficiently established yet in the science field. Regardless, given
the scarcity of existing questions, as well as the demand from the science field, there is a

- 28 -
need for more effective assessment related to the domain of career
knowledge/acquisition.
QUANTITATIVE VS. QUALITATIVE INSTRUMENTS
The current paper highlights quantitative assessment tools for a variety of
reasons. In general, quantitative instruments provide a significant amount of data in a
reasonable amount of time—a key feature for teachers and administrators who want to
assess the progress of a group of students. Such instruments are also more easily
transferred from one program to another. Quantitative data is easier to analyze, as it
does not require the creation and application of code categories. It also tends to be
reported more frequently in papers and reports, thus giving them more visibility.
Furthermore, we learned from focus group participants that individual programs tend
to create their own qualitative instruments that they do not share with a larger
audience. Unfortunately, this discretion ultimately prevents the field from
collaborating in the creation and implementation of qualitative instruments.
Even though they are not highlighted in this paper, many assessment tools
currently being used in the field are qualitative in nature (see Appendix C, pages 85-86).
These instruments provide a depth of information related to participants’ learning
process, engagement and attitude towards science. Yet, they tend to lack the formal
tools that are necessary for standardized use and are often cumbersome in terms of
implementation and scoring. As such, we did not find qualitative methods that were
widely used and/or published in the science field. Consequently, these instruments
did not meet the criteria for inclusion in the current report.

- 29 -
One instrument that is likely to be considered qualitative is the Draw-a-Scientist
Test. However, this tool ultimately can be regarded as quantitative as each drawing
receives a numerical rating, based on the presence of pre-determined elements.
Interestingly, the developer of the Draw-a-Scientist Test appears to be suggesting its
similarities to other quantitative assessment tools by highlighting that it takes “no more
than one to three minutes to analyze” a child’s drawing (H. Harty, personal
communication, February 4, 2008).
The only other instrument we surveyed that includes a qualitative component is
the Views of Nature of Science Questionnaire. In addition to responding to a series of
open-ended questions, respondents are given an opportunity to “clarify and elaborate
on their written responses” (Lederman, Abd-El-Khalick, Bell, & Schwartz, 2002, p. 506)
through a follow-up interview. This interview is also intended to “ensure a faithful
interpretation of their [respondents] responses” (F. Abd-EL-Khalick, personal
communication, February 5, 2008). However, the developers of this instrument explain
that it is not necessary to conduct individual interviews with all respondents; instead,
this can be done with a “reasonable sample of respondents” (Lederman et al., 2002, p.
511). Thus it appears as if the Views of Nature of Science’s developers are trying to
minimize its overall administration time by not requiring individual interviews with all
respondents.
Interestingly, the Views of Nature of Science Questionnaire, as well as the Draw-
a-Scientist Test seem to be best described as “mixed method instruments.” Such
instruments may be the most effective way to evaluate the essence of participants’
growth as they are multi-dimensional. Consequently, instrument developers need to
- 30 -
create instruments that utilize both qualitative and quantitative methods and minimize
the time needed for administration and scoring.
PSYCHOMETRIC PROPERTIES
Because psychometric properties are a significant indicator of the merit of
assessment tools, we were pleased that most instruments the current paper highlights
address reliability and validity (see Table 4, pages 74-78). Of course, as readers may
recall, an instrument needed to establish reliability and validity (or justification of a
decision not to) in order to be considered for our in-depth analysis. Regardless, there is
some disparity in the ways in which these instruments establish reliability. Some
instruments (the Children’s Environmental Attitudes and Knowledge Scale, Children’s
Science Curiosity Scale, Test of Science Related Attitudes) establish reliability through
Cronbach’s alpha and test-rest reliability. Another instrument, the Scientific Attitude
Inventory uses Cronbach’s alpha and split-half reliability. Some instruments just report
one form of reliability: Cronbach’s alpha (Discovery Inquiry Test of Science, Modified
Attitudes toward Science Inventory, Relevance of Science Education) or inter-rater
reliability (The National Assessment of Educational Progress; Views about Science
Survey). Other instruments (Draw-a-Scientist Test, Views on Science-Technology-
Society) choose not to report reliability, although subsequent studies that administer
these instruments have established their reliability. Regardless of how test developers
chose to assess the reliability of their instruments, most have established an acceptable
rating. Interestingly, one instrument, the Epistemological Beliefs Assessment for
Physical Science does not include reliability data as the developers of this assessment

- 31 -
tool “don’t want to assume that each subscale corresponds to a stable, consistent belief
(or set of beliefs).”
Given that validity can be established through a variety of means, such as
content, face, predictive and discriminate validity, it is not surprising that test
developers employed numerous strategies to assess this psychometric property. We
were encouraged to see that three instrument developers (the Children’s Environmental
Attitudes and Knowledge Scale, Children’s Science Curiosity Scale, Science Attitude
Inventory) established validity through factor analysis, as this is considered one of the
most rigorous and empirically sound methods of assessing validity. The most common
strategy instrument developers (the Children’s Environmental Attitudes and
Knowledge Scale, Children’s Science Curiosity Scale, Discovery Inquiry Test in Science,
Relevance of Science Education, Scientific Attitude Inventory, Views about Science
Survey, Views of Nature of Science Questionnaire, Views on Science-Technology-
Society, Wareing Attitude toward Science Protocol) employed to establish content and
face validity was to convene a group of experts from the science field (e.g., educators,
students, scientists, researchers) who then confirm that assessment items measured
what the developers intended for them to measure. Other instrument developers (e.g.,
Views about Science Survey, Views of Nature of Science Questionnaire, Views on
Science-Technology-Society) conducted follow-up interviews with respondents in order
to determine why respondents answered particular questions in the manner that they
did, as well as to ensure that respondents understood the posed questions. In order to
establish predictive validity, the creators of the Children’s Environmental Attitudes and
Knowledge Scale and Children’s Science Curiosity Scale also compared the answers of
respondents who had previously been identified as either having high or low interest in

- 32 -
science and science-related issues. The developers of the Children’s Environmental
Attitudes and Knowledge Scale and the Test of Science Related Attitudes addressed
discriminate validity by determining the inter-correlations among the various scales in
order to ensure that each subscale was assessing an attitude that one of the other scales
was not. Regardless of how tool developers assess reliability and validity, we believe
that any quality assessment tool must be able to establish these psychometric
properties.
DOMESTIC VS. INTERNATIONAL INSTRUMENTS
A distinction among the child assessment tools we analyzed is whether or not
they have been adapted for international use. Some instruments, such as the
Programme for International Student Assessment and the Relevance of Science
Education, were created with the intention of being used across countries and cultures.
The Draw-a-Scientist Test was originally administered to children in Australia, Canada
and the United States and now is used in many countries across the world. The Views
on Science-Technology-Society was translated into numerous languages for
international use. This contrasts with tools like the Epistemological Beliefs Assessment
for Physical Science, Modified Attitudes towards Science Inventory, Scientific Attitude
Inventory, Science Opinion Survey, and the Wareing Attitude toward Science Protocol
that are solely administered in the United States and Canada. A middle ground
between these two extremes are assessment tools like the Children’s Environmental
Attitudes and Knowledge Scale, Children’s Science Curiosity Scale, Views about Science
Survey, and Views of Nature of Science Questionnaire that were originally
administered in the United States and have subsequently been administered in several

- 33 -
other countries. Conversely, the Test of Scientific Related Attitudes was originally
administered in Australia and then was validated in the United States. Finally, other
instruments, such as the Discovery Inquiry Test in Science and the National Assessment
of Educational Progress, were specifically designed for US students and were not
intended for international comparisons.
Interestingly, when assessment tools are created (or modified) for international
comparisons, they tend to compare school-based programs. However, given the global
nature of after-school programs, there is a need for assessment tools that can effectively
compare out-of-school-time programs across countries. Such cross-cultural
comparisons will ultimately strengthen the field of informal science education.
AGE OF RESPONDENTS
The majority of the assessment tools we analyzed tend to focus on middle and
high school respondents (see Table 4, pages 74-78). Consequently, there is a relative
dearth of instruments that assess elementary school students, particularly early
elementary school. In fact, only two instruments (the Children’s Environmental
Attitudes and Social Knowledge Scale and Draw-a-Scientist Test) we studied are
appropriate for early elementary school children. This pattern of having the majority of
instruments focusing on middle and high school-aged respondents with only a few
focusing on younger children appears to be representative of an overall trend in the
science assessment field. An problematic solution to this issue would be to administer
assessment tools to elementary school-aged children that were originally created for
older respondents, particularly as the vocabulary and/or syntax of the instruments is

- 34 -
not appropriate for younger respondents. Instead, additional science assessment tools
should be created that are developmentally appropriate for younger children.
UNDERREPRESENTED GROUPS
Many out-of-school time programs work with underrepresented populations,
such as urban and female students. Therefore, it is important that instruments used to
assess these particular audiences maintain an acceptable level of validity and reliability.
Yet, not all instruments transfer from their original audience to underrepresented
samples. In such cases, it may be necessary to revise the targeted instrument. We were
encouraged that one assessment tool, the Modified Attitudes towards Science
Instrument, adapted this strategy: its test developer revised its original form to better
assess an under-represented audience, urban African American students. NAEP also
took elaborate steps to address cultural bias in its tests. Similarly, the Science Attitudes
Inventory was also modified in order to eliminate gender-biased statements. By
acknowledging the diverse populations that their instruments assess, these tool
developers have strengthened the quality and transferability of their instruments. Such
awareness among all test developers will only strengthen the quality of instruments
administered in the field.
ADMINISTRATION TIME
As demonstrated in Table 4, administration time varies greatly among the
instrument tools the current paper highlights, ranging from 10 minutes to up to 2 hours.
However, the administration time of some instruments (Modified Attitudes towards
Science Inventory, National Assessment of Educational Progress, Programme for

- 35 -
International Assessment, Relevance of Science Education) can be reduced by
eliminating background questions that may not be relevant for a particular program
(e.g., parent background, number of books in the home).
It is important to note that administration time is not directly related to the
quality of an instrument. For example, the Children’s Science Curiosity Scale is a well-
validated, frequently-used instrument that takes less than 15 minutes to administer.
Furthermore, administration time does not directly relate to number of domains
addressed. For example, the Views of Nature of Science requires a significant amount
of time to administer (an hour and fifteen minutes) but only addresses two domains
(content knowledge and competence and reasoning). Given the limited time and
money programs are typically afforded with respect to evaluation, program evaluators
may benefit from creating, refining or choosing assessment tools that are relatively
short while still addressing the domains of interest.
AREAS FOR FUTURE STUDY
We now address two important areas that are largely unaddressed in the science
instruments we have discussed, but about which much can be learned by highlighting
research from neighboring fields. The first area focuses on the way anxiety might affect
students’ interest and learning in science, based upon research from mathematics
assessment. The second area addresses the need for observation instruments in addition
to instruments focusing on student outcomes.

- 36 -
Learning from Math Anxiety Assessments
In addition to our comprehensive review of science assessment tools, we also
conducted a survey of mathematics assessments to determine if any of the assessment
practices in the math field could inform our study of the sciences (see Addendum 1).
Although our survey of assessments currently used in OST math programs did not, in
most areas, yield substantive models or tools that could guide OST science, we were
intrigued by educational research related to math anxiety and its potential applications
to the OST science field. Math anxiety is often defined as a feeling of tension,
apprehension or fear that interferes with math performance in real-world and academic
settings (Ashcraft, 2002; Richardson & Suinn, 1972). Research has demonstrated that
math anxiety is conceptually distinct from generalized anxiety (Dew, Galassi & Galassi,
1983) and that it is not associated with intelligence (Hembree, 1990). Math anxiety can
lead to deliberate avoidance of the subject as well as career paths that require
mathematical competencies. While the etiology of math anxiety remains unknown,
researchers speculate that multiple pathways can result in math anxiety including:
negative classroom experiences, difficulty learning math, the development of
maladaptive problem-solving schema, and having teachers who prize accuracy, but
provide limited cognitive or motivational support. Research has shown that math
anxiety typically emerges during middle school and increases over the course of
adolescence. Some educators and researchers speculate, however, that math anxiety can
begin as early as elementary school (M. H. Ashcraft, personal communication, February
5, 2008).
Since the 1970s, researchers have been developing instruments to measure math
anxiety. Yet, while extensive research has been conducted the role of math anxiety in

- 37 -
school and OST settings, only one of the sixteen science assessments we have reviewed
even touched on feelings of anxiety towards science (Modified Attitudes towards
Science Inventory). It is very possible that science anxiety exists, but has not yet been
acknowledged by the science community. Moreover, math anxiety could be a
significant obstacle to students’ success in science since science frequently is predicated
on knowledge of math. If science or math anxiety does indeed influence student
learning and pursuit of science careers, then the more relaxed, cooperative learning
environment often found in after-school may be an ideal setting to reduce anxiety.
Observation Tools No matter how valid and sensitive student outcome measures are, they will not
answer the “input” programmatic question: “What makes a quality program that is
responsible for positive outputs?” One can infer that if outcomes are strong, then the
program (if in fact it is responsible for these outcomes) is effective. However, given
selection biases and the lack of strong experimental designs in many studies, it is not
easy to relate good outcomes to specific program elements. The role of assessment tools
and measurements across programs cannot end with student self report. The goal of
assessment is not only to strengthen outcomes, but also to strengthen programs so they
can reach the productive outcomes we envision for the field. The only way to provide
such data is to study program quality together with program outcomes. An added
benefit of such tools is that they not only examine quality, but they also have the
potential to study the learning and exploration process and trace specific interactions
between staff and students that result in learning.

- 38 -
The importance of observation tools has become accepted over the past few years
in the generic after-school field, with multiple tools competing for a growing market of
program assessment. A recent review of these quality program assessment tools
demonstrates that these instruments have become quite sophisticated with detailed
coding systems and reported reliability (Yohalem & Wilson-Ahlstrom, 2007). The
application of these tools to after-school programs has yielded some interesting results
that are helping the field develop a growing consensus around characteristics of quality
after-school programs. For example, most research agrees that key elements to quality
after-school programs include: physically and psychologically safe environments,
strong relationships between staff and students, strong leadership, and intentional,
authentic learning activities (Birmingham, Pechman, Russell, & Mielke, 2005; Honig &
McDonald, 2005; McLaughlin, 2000; Pathways to Success for Youth, 2005; Reisner,
White, Russell, & Birmingham, 2004; Vandell, Reisner, Pierce, Brown, Lee, Bolt &
Pechman, 2006).
Instruments developed for researching quality in generic after-school programs
typically include detailed observations of the activities students are engaged in and can
be used for observation of any activity, from arts to homework help to informal science
activities. However, since these instruments are designed to be applicable to any type of
activity, they do not address issues unique to informal science, such as authenticity of
science or inquiry-based learning.
There have been some recent attempts to create observation tools that focus more
specifically on science, but most of these tools were developed primarily for classroom
use. For example, the Reformed Teaching Observation Protocol (RTOP) was developed
to assess the degree to which classroom math and science instruction was “reformed,”
- 39 -
in line with the reform movement valuing student engagement and authentic inquiry
(Piburn, Sawada, Falconer, Turley, Benford, & Bloom, 2000). The Science Management
Observation Protocol (SMOP) is an instrument designed to examine specific teacher
behaviors and classroom characteristics that influence how well an inquiry-based
science classroom is managed (Sampson, 2004). Currently, the Education Development
Center is in the final stages of developing an inquiry science instruction observation
protocol (ISIOP) to identify the nature and extent to which inquiry science instruction
occurs in middle school science classrooms (Education Development Center, 2008).
Finally, the Program in Education, Afterschool, and Resiliency has piloted an
observation tool designed specifically to assess informal science along the NSF domains
for after-school and OST settings. The tool focuses on indicators of quality informal
science including categories such as content learning, engagement, and relevance.
The development of quality observation tools for after-school science programs
will be extremely important for the field, since it will allow researchers and
practitioners to better understand the links between inputs and outcomes and the
mediating processes between them.

- 40 -
RECOMMENDATIONS
As evidence-based programming has become essential in the field of formal and
informal science education, the Noyce Foundation asked us to assess the availability of
quality science outcome instruments with the intention of making recommendations
about the future of assessment in this field. At the onset of this project, two possibilities
appeared probable: the modification of existing instruments or the creation of one (or
more) comprehensive instruments. While countless science assessment instruments do
exist, we determined that there is a need for new assessment tools for the field. We
based this conclusion on a number of factors, including the fact that no assessment tool
effectively addresses all significant domain classifications and that no assessment tool
effectively incorporates both qualitative and quantitative outcomes.
The creation of a systemic data collection process is essential for the betterment
of science education and quality after-school programming. Funders and policymakers
have recognized the importance of evaluation and assessment and are investing
significant funds for this purpose. This produces a great opportunity to create the
evidence base needed for this field to stabilize and grow. If the field does not seize this
opportunity, the parameters of evidence and outcomes will undoubtedly be imposed by
outside forces, as this has already happened in other areas of after-school research (e.g.
Dynarski, Moore, Mullens, Gleason, James-Burdumy, Rosenberg, Pistorino, Silva, Deke,
Mansfield, Heaviside, & Levy, 2003). In such a case, measurement could easily become
school-based standardized tests and other academic outcomes, similar to those that
have been instituted in schools. Informal and after-school science learning are built
around a framework of exploration, engagement, and reasoning that require their own
assessment.

- 41 -
But it is important to acknowledge that the field remains far from consensus
around how to assess practices and student outcomes and how to institutionalize those
assessments. We repeatedly heard from focus group participants that there is great
anxiety about moving to one or more standardized tools. One concern expressed was
that each program has its own culture, history and purpose. A standardized instrument
would not allow each program to be assessed on its own merits and from within the
meanings and goals of its learning environment. While this perspective has a great deal
of validity and is voiced especially in qualitative and cultural psychology circles, we
contend that this point of view does not necessarily preclude comparative assessments
across programs. Programs can and often do administer instruments as well as a
tailored assessment that address a program’s specific culture and goals. Moreover, we
contend that instruments will never be the only way program success is assessed;
qualitative observations and satisfaction inventories are both important to effective
assessment. No assessment can make visits to programs and conversations with staff
and students a thing of the past. But the field needs comparative data for quality
improvement, planning, and policy-making. Such data would allow, not only for
individual programs to become evidence-based, but for the whole field to do the same.
Focus group participants also expressed concern that funders may use outcomes
in a punitive way against individual programs or multi-sited organizations. If
programs do not demonstrate progress on a particular standardized assessment tool,
they may not receive funding. Similar fears arose in response to the Mathematica
reports (Dynarski, James-Burdumy, Moore, Rosenberg, Deke, J., & Mansfield, 2004;
Dynarski, Moore, Mullens, Gleason, James-Burdumy, Rosenberg, Pistorino, Silva, Deke,
Mansfield, Heaviside, & Levy, 2003) assessing after-school outcomes; however, these

- 42 -
fears did not come true, and foundations did not withdraw funding of programs based
on the report’s findings. We argue that at the present time it would be inappropriate for
funders to deny financial support based on quantitative outcomes as many of the
assessments we surveyed do not have national norms. In addition, support from the
field will be jeopardized if a punitive approach is selected. It will be important to
initiate a dialogue with funders so that they have realistic expectations about outcomes
and to ensure that assessments are used to inform, not to punish. Over time, however,
there is no reason why valid and agreed upon outcomes cannot be part of an overall, in-
depth decision-making process about funding.
There is also a concern that any assessment tool will not actually strengthen the
field but simply provide evidence that the field is not strong, thus creating negative
policy implications. However, from our perspective, evidence-based practice does not
mean that programs need to demonstrate positive results immediately. Instead, if
individual programs are unsatisfied with their results, they should have the
opportunity to revamp their programs without significant consequences. Programs are
looking for ways to measure their impact and funders are looking for evidence that
programs work. It is important that these two groups come together to help shape the
content of instruments that will provide formative, not punitive, feedback that can
strengthen the field.
Despite concerns about a standardized assessment tool, moving the field to one
or more assessment tools remains a necessary step for several reasons. First, state and
national testing of science learning was introduced in 2007. As stated above, if the
informal field does not work to develop its own instrument, assessment of all science
programs will likely be reduced to academic outcomes as measured by the state-

- 43 -
mandated tests. This is a concern because informal science education requires its own
form of assessment. It should not be judged primarily against traditional formal science
assessment measures, such as content knowledge and competence and reasoning. While
these domains tend to dominate program goals among formal science education
programs, this is not the case for informal science programs. In fact,
engagement/interest and attitude/behavior tend to be the primary focus of informal
science education programs.
Second, we learned from focus group participants that individual programs are,
in fact, creating their own instruments to assess program quality. Clearly, they
recognize the importance of evidence-based programming and also that programs
should be able to choose the most suitable assessment strategies for their programs. But
working in isolation and focusing only on their own internal questions does not allow
programs to benefit sufficiently from the expertise and previous work of their
colleagues as they create and implement quality assessment tools and outcomes
measures. Undoubtedly, collaboration among instrument developers will only help
strengthen the quality of assessment tools that are being administered in the field. Also,
qualitative observations will continue to be essential and serve as excellent case studies
of the potential in environments where adults and youth work, explore and invent
together. But the field as a whole will not move forward with sufficient precision and
speed through the existing approach alone, nor will the present strategy convince policy
makers and funders sufficiently to secure financial support for the future.
The consensus document from the National Science Foundation (Friedman et al.,
2008) has provided a new possibility to address assessment in informal science. One
issue that has been a barrier to comparable data collection across program is that

- 44 -
evaluators have used different domains to assess science learning. While many studies
touched on similar issues such as interest/engagement, attitude/behavior and content
knowledge, definitions, language, and outcomes varied widely. In part, this is due to
differences in content and goals across programs, but much of it also has to do with lack
of clarity and precision in defining the practices and goals of science learning. With the
consensus report from NSF, we now have a document that explicitly defines the
domains of science learning across different program contexts. This in turn allows the
field to take the next logical step of connecting these domains with assessment
strategies and tools. Obviously, with clearer constructs it is possible to create better
instrumentation. This framework, which we adapted for this report, provided us with a
structure to analyze the existing tools.
The recommendation that comes from our analysis is that we need to evolve
instruments that can assess process and impact in these five domains across programs.
We recommend three strategies to strengthen the evidence base for this field.
Recommendation #1: Online database of assessment tools:
We recommend the creation of an online database that includes the tools
described in this report as well as many of the tools that evaluators throughout the
country have developed for their individual programs. This database should be
continuously updated with newly-created assessment tools. All of these tools should be
organized around the NSF-inspired domains outlined in this report. Our review has
shown us that, in certain domains, there are some strong instruments already in
existence. Our hope is that this database will guide programs increasingly to use these
already-developed instruments. The database would be organized to allow programs

- 45 -
to select the appropriate instruments for their sites according to a variety of criteria
including domain, grade-level, assessment time, etc. This tool would strengthen
existing NSF-funded communities of practice such as ITEST and AYS. In addition, this
database would likely lead to an organic movement towards shared instrumentation
and, thus, increased comparability between programs.
Recommendation #2: Item bank of questions:
In addition to the online database, we recommend that funders encourage the
use of a small number of informal science assessment questions that the field would use
whenever an evaluation is performed. A consensus group should be established to
determine those essential items. A possible place to begin would be the science
National Assessment of Educational Progress questions, since they have already been
validated. They do not, however, address all domains, and we therefore suggest
adding items for those unrepresented domains. This strategy of identifying a limited
number of items to be used in evaluations throughout the field would allow for some
baseline comparisons across programs, although it would not be sufficient for a detailed
analysis of all five domains, and lacks the psychometric qualities of a cohesive
instrument.
Recommendation #3: New instruments
While the first two recommendations provide important initial steps, they will
not bring the field to where we believe it needs to be. Informal science learning consists
of complex pedagogy and different levels of processing information and creating a
scientific identity on the part of children and youth. This task cannot be accomplished

- 46 -
by including a few consistent items within a diverse set of tools, nor will the field
mature sufficiently by individual programs choosing from a database of many
assessment tools. In addition to these strategies, the field needs a tool or a set of tools
that would eventually gain sufficient acceptance to be utilized by a significant
number of programs across the country. This would allow for national norms to be
established and true comparison to be possible. Since, at this point, there are no
instruments that assess all five domains through outcome measures, we recommend
that steps be taken to develop such instruments. We recommend the creation of two
complementary tools: (1) a quantitative tool consisting of student surveys to assess
participant outcomes in the five domains, and (2) a qualitative-quantitative tool
consisting of an observation instrument to assess program quality and informal science
learning processes in the five domains.
Depending on a program’s resources, it can either use the student survey alone,
or, for a more in-depth evaluation, use the student survey in conjunction with the
observation tool. While it is important that the tools address outcomes from all five
domains, it should be noted that program evaluators should not feel pressure to include
questions from all five domains. Instead, they can focus their assessments on those
domains that are central to their individual program goals.
These tools should be validated, have strong psychometric properties, be normed
based on different populations, allow administration in a reasonable amount of time,
and be easy to administer. It is especially important that the quantitative instrument
assessing participant outcomes be robust enough to register change over time when
used in pre- and post-testing. In addition, since there is a relative dearth of instruments
designed to assess students in elementary school, it is necessary that the instrument

- 47 -
include an adaptation that is developmentally appropriate for younger children. The
instrument would examine the same constructs, but using different items and language.
We also recommend that researchers further explore the role of anxiety in science
education, and that the instrument should include items that address science anxiety.
Finally, we believe it is important to convene a group of experts from various science
content disciplines to make decisions about whether there exist some core competencies
that cut across disciplines or whether each discipline needs to be assessed separately.
It is not sufficient, however, to assess participant outcomes alone, and for this
reason we also recommend the development of an observation tool specifically
designed for use in after-school and OST science settings. In part, it will important to
include an observation tool to overcome biases associated with self-report, particularly
when assessing domains such as engagement/interest and attitude/behavior. Even
more importantly, as we discussed in our analysis section, it is important for the field to
examine not only participant outcomes, but also the inputs that potentially created
those outcomes. The inclusion of an observation tool allows the field to correlate
program characteristics with participant outcomes, and thereby build a base of best
practices in the field.
While observation tools are already being developed, and are unlikely to
engender resistance from the field, the development of a new instrument to assess
student outcomes will most likely be a longer and more complex process. For this
reason, a strategy of inclusion has a greater chance of succeeding and will create less
resentment than one that is entirely mandated from above. Strengthening support and
building consensus among various groups including funders, policymakers,
practitioners and researchers will be critical. Thus we recommend a well-planned
- 48 -
meeting or set of meetings with leaders representing all these groups before developing
any outcome instruments. This report can serve as the foundation for the discussions
together with well-organized panels. The initiative would be strengthened if it could be
sponsored by multiple foundations, ideally in a joint public-private initiative.
For the development of the instruments, we recommend the creation of a center
on assessment that allows key players who are versed in assessment development and
have the conceptual and practical capacity to complete the task. At this point, there is
no one organization that has the knowledge and capacity to do this work alone. As
such, a center would allow a focused team across universities and other organizations
to come together to undertake this essential work, while reducing the potential for
unproductive competition in the field.
Taken together, these recommendations will require commitment on the part of
foundations and leaders in the field to support the creation of valid and reliable
assessment tools that can be used across programs. The process of creating a stronger
evidence base for this field will be most successful if programs across the country view
assessment as a tool to enhance program quality as well as a reflection of the outcomes
towards which they are striving. This report and its recommendations are designed to
be the basis for ongoing discussions and feedback from the field, as well as to guide
future policy. We hope this report will engender the discussion this important topic
deserves.

- 49 -
ADDENDUM
In an effort to inform our comprehensive review of science assessment tools, we
undertook a delimited review of mathematics assessment tools currently used in after-
school and out-of-school-time settings. This review consisted of conversations with
experts in the field, research on assessment literature, and online searches. Importantly,
this review was conducted for the purpose of determining whether there were any
important trends in the assessment of mathematics in out-of-school-time (OST) settings
that might inform our understanding of science assessments. Thus our review should
not be considered comprehensive or all-encompassing but rather a sampling from the
field. Our review of the math assessments revealed several interesting findings. First,
we found that many evaluators of OST programs in mathematics rely on traditional
standardized tests (e.g., IOWA, Terra Nova) or state-mandated states (e.g.
Massachusetts Comprehensive Assessment System) to assess the efficacy of their
programs in developing content knowledge and competence and reasoning (see
D’Agostino, 1995; Deeb-Westervelt, 2003; Harlow & Baenen, 2001; Huang, Gribbons,
Kim, Lee & Baker, 2000; Klein & Bolus, 2002; Kociemba, 1995; Leslie, 1998; Lovell, 2006;
McDonald & Trautman, 2005; McKinney, 1995; E. Schaps, personal communication,
October 15, 2008; Welsh, Russell, Williams, Reisner, & White, 2002; Zia, Larson, &
Mostow, 1999). Although this trend is not surprising considering the emphasis placed
on raising scores for the high-stakes math tests currently given in all states, it does
present certain challenges. First, because standardized tests typically measure students’
competency in a broad range of math subject-areas, it can be difficult to capture the
learning that takes place in one summer or in an hour per day after school. This
problem is exacerbated by the fact that scores for these standardized and state-

- 50 -
mandated tests are not always reported according to separate competencies (such as
content knowledge versus reasoning) but instead as a single, generalized score. For
example, on the MCAS, a student’s performance is classified into one of four categories:
Warning, Needs Improvement, Proficient, or Advanced. Evaluators cannot determine
whether a student performed well on a given topic or in a given domain (e.g.,
reasoning) unless they perform an item analysis. A possible solution to these challenges
may lie in criterion referenced tests such as Balanced Assessment in Mathematics
(McGraw Hill), which is currently being used by the Silicon Valley Math Initiative.
Balanced Assessment focuses on problem solving and communication, and allows staff
and students to examine in which areas students show competency and in which areas
they need improvement.
Another approach to the assessment of content knowledge and competence and
reasoning is the use of homegrown tools. A prime example of this type of assessment is
the ASM+ Student Assessments, used by After-School Math PLUS (Fancsali & Orellana,
2007). The ASM+ Student Assessments consist of open-ended questions relating directly
to math activities from the program. This type of assessment poses a distinct advantage
over standardized tests in that it directly assesses the learning that results from
program activities. However, these types of assessments cannot be used to compare
programs, even within the same state.
A second finding from our survey of math assessments involves assessments
addressing the domains of attitude/interest and engagement/behavior. In these
categories, attitudinal measures appeared to be the most frequently addressed. Some of
these attitudinal measures were specific to math, such as the Indiana Mathematics Belief
Scale (Kloosterman & Stage, 1992). Others, such as the Patterns of Adaptive Learning

- 51 -
Survey (PALS) (Midgley, Maehr, Hruda, Anderman, Anderman, Freeman, Gheen,
Kaplan, Kumar, Middleton, Nelson, Roeser, & Urdan, 2000), are not math specific, but
have been used in studies of attitudes towards math (Friedel, Cortina, Turner, &
Midgley, 2007). The majority of these measures, however, were developed for use with
high school and college students. Although some have subsequently been adapted for
use with younger students, particularly for those in the middle and upper elementary
grades, few attitudinal measures exist for early elementary students. Another method
used to assess attitudes/behavior and engagement/interest in math is through student
journals (Edwards, Kahn, & Brenton, 2001). While this is a useful method of obtaining
in-depth information in both domains, it is not an efficient method of assessment,
particularly for comparison across programs. Importantly, the National Science
Foundation is currently funding a project at the University of Michigan that focuses on
math and science attitudes and beliefs, studying tools for evaluating motivation-related
outcomes (MSP-MAP). Their findings will represent an important step in building a
research base in the study of student attitudes towards math and science.
Notably, our review did not reveal assessments pertaining to career
knowledge/acquisition in mathematics, showing that this area of assessment is lacking,
not only in science, but in mathematics as well.
In general, we see many of the same trends in the fields of science and math
assessment. In both fields, most of the assessments fall in the content knowledge,
competency and reasoning, engagement/interest, or attitudes/behavior domains and
include little in the career knowledge/acquisition domain. In fact, science appears to be
more advanced in this domain. In addition, both fields are struggling with a tension
between homegrown measures that lack the capacity to compare between programs,

- 52 -
and standardized measures that may not capture the learning that takes place in after-
school and summer programs. Again, science may be more advanced in this area, as a
result of the significant body of literature pertaining to informal science learning along
the fact that until recently, science was rarely included in standardized tests.
Although our survey of assessment tools currently used in OST math program
did not, in most areas, yield substantive models that can be used to guide OST science,
we were intrigued by educational research related to math anxiety and its potential
applications to the OST science field. Math anxiety is often defined as a feeling of
tension, apprehension or fear that interferes with math performance in real-world and
academic settings (Ashcraft, 2002; Richardson & Suinn, 1972). Research has
demonstrated that math anxiety is conceptually distinct from generalized anxiety (Dew,
Galassi & Galassi, 1983) and is not associated with intelligence (Hembree, 1990). Math
anxiety can lead to deliberate avoidance of the subject and career paths that require
mathematical competencies. While the etiology of math anxiety remains unknown,
researchers speculate that multiple pathways can result in math anxiety including:
negative classroom experiences, difficulty learning math, the development of
maladaptive problem-solving schema, and having teachers who prize accuracy, but
provide limited cognitive or motivational support. Research has shown that math
anxiety typically emerges during middle school and increases over the course of
adolescence. Some educators and researchers speculate, however, that math anxiety can
begin as early as elementary school (M. H. Ashcraft, personal communication, February
5, 2008).
Starting in the 1970s, researchers have been developing instruments to measure
math anxiety. The Fennema Sherman Mathematics Attitude Scale, developed originally

- 53 -
in 1976 and later modified explores not only math anxiety, but also areas such as
confidence in math, usefulness of math, and math as a male domain (Fennema &
Sherman, 1976). These instruments have been used to assess math anxiety as well as
attitudes towards math in both school and OST settings (DeHaven & Weist, 2003; Ring,
Pape, & Tittle, 2000). Another early assessment tool measuring math anxiety is
Richardson and Suinn’s (1972) Mathematics Anxiety Rating Scale (MARS). This
instrument, designed for high school and college students, as well as older adults, asks
subjects to rate how anxious they would feel in a variety of academic and everyday
situations. These early tools have spawned a variety of descendents (e.g., AMAS). More
recently, researchers began developing measures that are appropriate for younger
students. Suinn revised the MARS to created measures for high school students (MARS-
A) and later for students in grades 4-8 (MARS-E) (Suinn & Edwards, 1982; Suinn,
Taylor, & Edwards, 1988) The Mathematics Anxiety Scale for Children (Chiu & Henry,
1990) also is designed specifically for students in grades 4-8. Efforts are also currently
underway to develop updated measures to assess math anxiety in adolescents and
elementary school students (M. H. Ashcraft, personal communication, February 5,
2008).
While extensive research has been conducted on math anxiety, only one of the
sixteen science assessments we reviewed addressed feelings of anxiety towards science
(Modified Attitudes towards Science Inventory). It is possible that science anxiety
exists—particularly since science frequently is predicated on knowledge of math—but
that it has not yet been acknowledged by the science community. If science anxiety does
indeed exist, then the more relaxed, cooperative learning environment often found in
after-school may be an ideal setting to reduce anxiety.

- 54 -
REFERENCES
Abd-El-Khalick, F. (2002, April). The development of conceptions of the nature of
scientific knowledge and knowing in the middle and high school years: A cross
sectional study. Paper presented at the annual meeting of the National
Association for Research in Science Teaching, New Orleans, LA.
Afterschool Alliance, Policy News. Retrieved August 24, 2007 at
http://www.afterschoolalliance.org/policy_news.cfm
Ash, D., & Klein, C. (1999). Inquiry in the informal learning environment. In J.
Minstrell, & E. Van Zee (Eds.), Teaching and Learning in an Inquiry-Based
Classroom (pp. 216-240). Washington, DC: American Association for the
Advancement of Science.
Ashcraft, M. H. (2002). Math anxiety: Personal, educational, and cognitive
consequences. Current Directions in Psychological Science, 11(5), 181–185.
Augustine, N. R. (Chair). (2005). Rising above the Gathering Storm: Energizing and
Employing America for a Brighter Economic Future. National Academy of Science,
National Academy of Engineering, Institute of Medicine. Washington DC: National
Academy Press.
Birmingham, J., Pechman, E. M., Russell, C. A., & Mielke, M. (2005). Shared Features of
High-Performing After-School Programs: A Follow-Up to the TASC Evaluation.
Washington DC: Policy Studies Associates.
Bouillion, L.M. & Gomez, L.M. (2001). Connecting school and community with science
learning: Real world problems and school-community partnerships as contextual
scaffolds. Journal of Research in Science Teaching, 38, 878–889.

- 55 -
Chiu, L. H. & Henry, L. L. (1990). Development and validation of the Mathematics
Anxiety Scale for Children. Measurement and Evaluation in Counseling and
Development, 2, 121-127.
D'Agostino, J. (1995, April). Advanced skill instruction in Chapter 1 summer programs
and student achievement. Paper presented at the meeting of the
American Educational Research Association, San Francisco, CA.
Deeb-Westervelt, W. (2003). The effects of an afterschool academic intervention services
math program on the grade four New York State Mathematics Assessment: A
quasi-experimental case study (Doctoral dissertation, Hofstra University, 2003).
Dissertation Abstracts International, 64, 1140.
DeHaven, M., & Weist, L. (2003). Impact of a girls’ mathematics and technology
program on middle school girls’ attitudes toward mathematics. The Mathematics
Educator, 13, 32-37.
Dew, K. M. H., Galassi, J. P., & Galassi, M. D. (1983). Mathematics anxiety: Some
basic issues. Journal of Counseling Psychology, 30, 443-446.
Dynarski, M., James-Burdumy, S., Moore, M., Rosenberg, L., Deke, J., & Mansfield, W.
(2004). When Schools Stay Open Late: The National Evaluation of the 21st Century
Community Learning Centers Program: New Findings. Report submitted to the U.S.
Department of Education. Princeton, NJ: Mathematica Policy Research, Inc.
Dynarski, M., Moore, M., Mullens, J., Gleason, P., James-Burdumy, S., Rosenberg, L.,
Pistorino, C., Silva, T., Deke, J., Mansfield, W., Heaviside, S., & Levy, D. (2003).
When Schools Stay Open Late: The National Evaluation of the 21st Century
Community Learning Centers Program, First-Year Findings. Report submitted to the
U.S. Department of Education. Princeton, NJ: Mathematica Policy Research, Inc.

- 56 -
Eccles, J. & Gootman, J. (2003). Community Programs to Promote Youth Development.
Washington, DC: National Academy Press.
Education Development Center (2008). The Inquiry Science Instruction Observation
Protocol (ISIOP), National Science Foundation, Award Abstract #0535787.
Edwards, T., Kahn, S., & Brenton, L. (2001). Math Corps Summer Camp: An Innter City
Intervention Program. Journal of Education for Students Placed at Risk, 6(4), 411-426.
Fancsali, C. & Orellana, E. (2007). After-School Math PLUS: Final evaluation report.
New York, NY: Academy for Educational Development.
Fennema, E. & Sherman, J. (1976). Fennema-Sherman Mathematics Attitudes Scales:
Instruments designed to measure attitudes toward the learning of mathematics by
females and males. JSAS Catalog of Selected Documents in Psychology, 6, 31.
Friedel, J., Cortina, K., Turner, J., & Midgley, C. (2007). Achievement goals efficacy
beliefs and coping strategies in mathematics: The roles of perceived parent and
teacher goal emphases. Contemporary Educational Psychology, 32, 434-458.
Friedman, A. (Ed). (2008). Framework for Evaluating Impacts of Informal Science
Education Projects. Arlington, VA: National Science Foundation.
Harlow, K. & Baenen, N. (2001, November). The effectiveness of Wake Summerbridge
Summer Enrichment Program. Retrieved October 12, 2007, from
http://www.wcpss.net/evaluation-
research/reports/2001/0147Summerbridge.pdf
Hembree, R. (1990). The nature, effects, and relief of mathematics anxiety.
Journal for Research in Mathematics Education, 21(1), 33-46.
Honig, M. & McDonald, M. (2005). From Promise to Participation: Afterschool
Programs through the Lens of Socio-Cultural Learning Theory. Afterschool

- 57 -
Matters, Occasional Paper Series, No. 5, Fall.
Huang, D., Gribbons, B., Kim, K. S., Lee, C., & Baker, E. L. (2000). A decade of results:
The impact of the LA’s BEST after school enrichment program and subsequent
students achievement and performance. Retrieved October 19, 2007, from
University of California, Los Angeles, UCLA Center for the Study of Evaluation,
Graduate School of Education & Information Studies Web site:
http://www.lasbest.org/resourcecenter/uclaeval.pdf
Klein, S & Bolus, R. (2002). Improvements in math and reading scores of students who
did and did not participate in the Foundations After School Enrichment Program
during the 2000-2001 year. Retrieved September 14, 2007, from
www.communityschools.org/CCSDocuments/foundations.pdf
Kloosterman, P., & Stage, F. (1992). Measuring beliefs about mathematical problem
solving. School Science and Mathematics, 92, 109-115.
Kociemba, G. (1995). The impact of compensatory summer school on student
achievement: Grades 2 and 5 in the Minneapolis Public Schools (Doctoral
dissertation, University of Minnesota, 1995). Dissertation Abstracts International,
56, 1602.
Lederman, N. G., Abd-El-Khalick, F., Bell, R. L. & Schwartz, R. S. (2002). Views of
Nature of Science Questionnaire: Towards valid and meaningful assessment of
learners’ conceptions of nature of science. Journal of Research in Science
Teaching, 39(6), 497-521.
Leslie, A. V. L. (1998). The effects of an after-school tutorial program on the reading
and mathematics achievement, failure rate, and discipline referral rate of

- 58 -
students in a rural middle school (Doctoral dissertation, University of Georgia,
1998). Dissertation Abstracts International, 59, 1853.
Lovell, C. (2006). The relationship between participation in extended-day programs and
mathematics achievement of Title-I eligible participants (Doctoral dissertation,
Seton Hall University, 2006). Dissertation Abstracts International, 67.
McDonald, N. & Trautman, T. (2005). Computer-assisted middle school mathematics
remediation intervention: An outcome study. Retrieved October 12, 2007, from
http://www.amered.com/docs/buhl_research.pdf
McKinney, D. (1995). The effects of an after school tutorial and enrichment program on
the academic achievement and self concept of below grade level first and second
grade students. Unpublished doctoral dissertation, University of Mississippi.
McLaughlin, M. (2000). Community Counts: How Youth Organizations Matter for Youth
Development. Washington, DC: Public Education Fund Network.
Midgley, C., Maehr, M. L., Hruda, L. Z., Anderman, E., Anderman, L., Freeman, K. E.,
Gheen, M., Kaplan, A., Kumar, R., Middleton, M. J., Nelson, J., Roeser, R., &
Urdan, T. (2000). Manual for the patterns of adaptive learning scales (PALS).
Ann Arbor, MI: University of Michigan.
Noam, G., Biancarosa, G., & Dechausay, N. (2003). Afterschool Education: Approaches
to an Emerging Field. Cambridge: Harvard Education Press.
Miller, B. M. (2005). Pathways to success for youth: What counts in after-school. Arlington,
MA: Intercultural Center for Research in Education. Retrieved February 15, 2008,
from http://www.uwmb.org/MARS-Report.pdf.
Piburn, M., Sawada, D., Falconer, K., Turley, J. Benford, R., Bloom, I. (2000). Reformed
Teaching Observation Protocol (RTOP). ACEPT IN-003.
- 59 -
Reisner, E.R., White, R.N., Russell, C.A., & Birmingham, J. (2004). Building quality, scale,
and effectiveness in after-school programs: Summary report of the TASC evaluation.
Washington, DC: Policy Studies Associates.
Richardson, F. C. & Suinn, R. M. (1972). The mathematics anxiety rating scale:
Psychometric data. Journal of Counseling Psychology, 19(6), 551-554.
Ring, R., Pape, S., & Tittle, C. (2000, February). Student attitudes in a reformed
mathematics classroom. Paper presented at the meeting of the Association of
Mathematics Teacher Educators, Charlotte, NC.
Sampson, V. (2004). The Science Management Observation Protocol: Using Structured
Observations to Improve Teachers' Management of Inquiry-Based Classrooms.
Science Teacher, 71, 10.
Schwartz, S. & Noam, G. (2007). Commissioned paper for the National Academy Of
Sciences Committee on Learning Science in Informal Environments. Washington,
DC. http://www7.nationalacademies.org/bose/Schwartz_abd_
Noam_Commissioned_Paper.pdf.
Suinn, R. M., & Edwards, R. W. (1982). The measurement of mathematics anxiety: The
Mathematics Anxiety Rating Scale for Adolescent (MARS-A). Journal of Clinical
Psychology, 38, 576–580.
Suinn, R. M., Taylor, S., & Edwards, R. W. (1988). Suinn Mathematics Anxiety Rating
Scale for elementary school students (MARS-E): Psychometric and normative
data. Educational and Psychological Measurement, 48, 979-986.
Tai, R.H., Liu, C. Q., Maltese, A.V., & Fan, X. (2006, May 26). Planning early for
careers in science. Science, 312, 1143-1144.

- 60 -
U.S. Department of Education, National Center for Education Statistics (2004). Before
and After-School Care, Programs, and Activities of Children in Kindergarten through Eighth Grade: 2001. Washington, D. C.: U. S. Government Printing Office. Vandell, D. L., Reisner, E. R., Pierce, K. M., Brown, B. B., Lee, D., Bolt, D., &
Pechman, E. M. (2006). The study of promising after-school programs:
Examination of longer term outcomes after two years of program experiences.
Madison, WI: Wisconsin Center for Education Research.
Welsh, M., Russell, C., Williams, I., Reisner, E., & White, R (2002).
Promoting learning and school attendance through after-school programs.
Retrieved September 15, 2007, from
http://www.policystudies.com/studies/youth/TASC%20Year%203%20Student
%20Outcomes%20Report.pdf
Yohalem, N. & Wilson-Ahlstrom, A., with Fischer, A., & Shinn, M. (2007, March).
Measuring Youth Program Quality: A Guide to Assessment Tools. Washington,
DC: The Forum for Youth Investment, Impact Strategies, Inc.
Zacharia, Z. & Calabrese-Barton, A. (2003). Urban middle-school students’ attitudes
toward a defined science. Science Education, 87, 1–27.
Zia, B., Larson, J., & Mostow, A. (1999). Instruction and student achievement in a
summer school mathematics program. ERS Spectrum, 17(2), 39 – 47.

- 61 -
TABLES AND FIGURES
FIGURE 1. COMPARISON OF NSF DOMAINS AND DOMAINS USED IN CURRENT
REPORT

- 62 -
TABLE 1. ASSESSMENT DOMAIN CLASSIFICATIONS
Engagement / Interest Level of participation / Interest in activity Curiosity in STEM-related activities and issues Excitement about / Enthusiasm for engaging in STEM activities Fun / Enjoyment in STEM activities Desire to become a scientist
Attitude / Behavior Belief that science / math is sensible, useful and worthwhile Belief in one’s ability to understand and engage in science and math (“can do attitude”) Pro-social / adaptive learning behaviors in relation to STEM Reduced anxiety / trepidation around STEM Positive scientific / math identity
Content Knowledge Knowledge and/or re-affirmation and expansion of what one already knows Development of fundamental skills (i.e, measuring) Ability to use basic instruments (i.e, graphing calculator, microscope)
Competence and Reasoning Ability to formulate strategies and to investigate scientific / mathematical problems Capacity to think logically, reflect, explain and justify one’s strategies and solutions Ability to see connections between topics Ability to apply content knowledge in novel context Knowledge of and the ability to apply principles of scientific inquiry Development of knowledge and ability to apply ethical principles of the profession
Career Knowledge / Acquisition Knowledge about STEM career options
Knowledge of pathways to STEM careers (i.e. pre-requisite classes, internships etc.)

- 63 -
TABLE 2. EXAMPLES OF ASSESSMENT ITEMS
Engagement / Interest Science Opinion Survey, Item #5: When I leave school, I would like to work with people who make discoveries in science. I strongly agree I agree I’m not sure I disagree I strongly disagree Science Curiosity Scale, Item # 9: I would like to experiment with the gadgets inside the space shuttle. Strongly disagree Disagree Uncertain Agree Strongly agree ROSE, Item A.7: How interested are you in learning about how the human body is built and functions? Not interested A little interested Interested Very interested
Attitude / Behavior Children’s Environmental Attitude and Knowledge Scale (CHEAKS), #5: I would be willing to ride the bus to more places in order to reduce air pollution. Very true Mostly true Not sure Mostly false Very false Modified Attitudes towards Science Inventory, ATSI Item Statements, #1: Science is useful in helping to solve the problems of everyday life. (1) Strongly disagree (2) Disagree (3) Uncertain (4) Agree (5) Strongly agree Test of Science-Related Attitudes (TOSRA), Item #29: The government should spend more money on scientific research. Strongly agree Agree Not Sure Disagree Strongly disagree
Content Knowledge Ohio’s Evaluation & Assessment Center Science Inquiry Test, Item #2: A small animal with dry skin and no legs that hatches from an egg is probably A. a snake B. a worm C. an eel D. a lizard Children’s Environmental Attitude and Knowledge Scale (CHEAKS), Item #46: Which is most responsible for creating acid rain?
(2) sulfur dioxide (2) carbon dioxide (3) ozone (4) nitrogen (5) ultraviolet radiation
Ohio’s Evaluation & Assessment Center Science Inquiry Test, Item #2: Which of the following objects has the most inertia? A. A 50-kilogram rock B. A 100-kilogram football player C. An automobile D. An oil tanker
Competence and Reasoning SAI (Moore and Foy), Item 3-A: To operate in a scientific manner, one must display such traits as intellectual honesty,

- 64 -
dependence upon objective observation of natural events, and willingness to alter one’s position on the basis of sufficient evidence. 1 (Strongly agree) 2 (Agree) 3 (Undecided) 4 (Disagree) 5 (Strongly disagree) VASS, Question 9: When they investigate a particular event in the natural world, physicists: (a) look for all possible aspects that might be attributed to the event under investigation. (b) concentrate on particular aspects that they consider relevant to the purpose of the study 1. (a) >> (b) 2. (a) > (b) 3. (a) = (b) 4. (a) < (b) 5. (a) << (b) EBAPS version 6.1, 02-01-2006, Item #19: Scientists are having trouble predicting and explaining the behavior or thunder storms. This could be because thunder storms behave according to a very complicated or hard-to-apply set of rules. Or, that could be because some thunder storms don’t behave consistently according to any set of rules, no matter how complicated and complete that set of rules is. In general, why do scientists sometimes have trouble explaining things? (f) Although things behave in accordance with rules, those rules are often
complicated, hard to apply, or not fully known. (g) Some things just don’t behave according to a consistent set of rules. (h) Usually it’s because the rules are complicated, hard to apply, or unknown; but
sometimes it’s because the thing doesn’t follow rules. (i) About half the time, it’s because the rules are complicated, hard to apply, or
unknown; and half the time, it’s because the thing doesn’t follow rules. (j) Usually it’s because the thing doesn’t follow rules; but sometimes it’s because the
rules are complicated, hard to apply, or unknown.
Career Knowledge / Acquisition PISA, Q27c: The subjects I study provide me with the basic skills and knowledge for a science-related career. Strongly agree Agree Disagree Strongly disagree PISA, Q27d: My teachers equip me with the basic skills and knowledge I need for a science-related career. Strongly agree Agree Disagree Strongly disagree

- 65 -
TABLE 3. INFORMATION CHART FOR SCIENCE ASSESSMENT TOOLS Instrument Name
Short Description
Type of Assessment
Scale Respondent Domain(s) Evaluated
Sample Item(s) Admin-istration Time
Reliability Validity Frequency of Use
Primary Reference
Comments
Children’s Environmental Attitudes & Social Knowledge Scale (CHEAKS)
Measures children’s global attitudes and knowledge about environmental issues, such as animals, energy, pollution, recycling, water, and general issues.
36 Likert-scale items (addressing attitude) & 30 multiple-choice questions (addressing knowledge)
5-point Likert scale (for attitude questions) (very true, mostly true, not sure, mostly false, very false)
Initial study: 6-13-year-olds (grades 1 through 7) Subsequent studies: 11-17 year-olds; university students
engagement/ interest; attitude/ behavior; content knowledge
Attitude statement: I have asked my family to recycle some of the things we use. Knowledge statement: Ecology is the study of the relationship between a) different species of animals b) plants and the atmosphere c) organisms and their environments d) man and other animals e) man and the environment
25 minutes
Cronbach’s alpha: 0.88-0.90 Test-retest: 0.57-0.72
present & acceptable
sometimes Leeming, F.C. & Dwyer, W.O. (1995). Children’s environmental attitude and knowledge scale: Construction and validation. Journal of Environmental Education, 26(3), 22-32.
Initial study conducted in US. Subsequent studies conducted in Ireland and Turkey.
Children’s Science Curiosity Scale (CSCS)
Measures elementary school children’s attitudes towards science in a learning context.
30 Likert-scale items
5-point scale (strongly agree, agree, uncertain, disagree, strongly disagree)
Initial study: 5th graders Subsequent studies: 5-8th graders
engagement/ interest; attitude/ behavior
I would like to experiment with gadgets inside the space shuttle. It is boring to learn new science words.
10-15 minutes
Internal Consistency: 0.85 (for 36-items) Test-retest: 0.67-0.69
Concurrent validity: 0.64 Construct validity: 0.77 For criticism of validity see: Gardner, P.L. (1987). Comments on “Toward the Development of a Children’s Science Curiosity Scale,” Journal of Research in Science Teaching, 24(2), 175-176.
frequently Harty, H. & Beall, D. (1984). Toward the development of a children’s science curiosity measure. Journal of Research in Science Teaching, 21(4), 425-436.
Discovery Inquiry Test in Science (DIT)
Measures students’ ability to analyze and interpret data, extrapolate from one situation to another, and
29 multiple-choice items (11 focusing on life science, 8 on physical science, 6 on
NA Initial study: 6th- 8th graders
content knowledge; competence & reasoning
A small animal with dry skin and no legs that hatches from an is probably (a) a snake (b) a worm (c) an eel (d) a lizard
About 30 minutes
Cronbach’s alpha: 0.94
Present & acceptable
Frequently (has been effectively used with about 16000 Ohio
Kahle, J.B., Meece, J. & Scantlebury, K. (2000). Urban African-American middle school
DIT was developed in 1994 by a group of university science faculty,
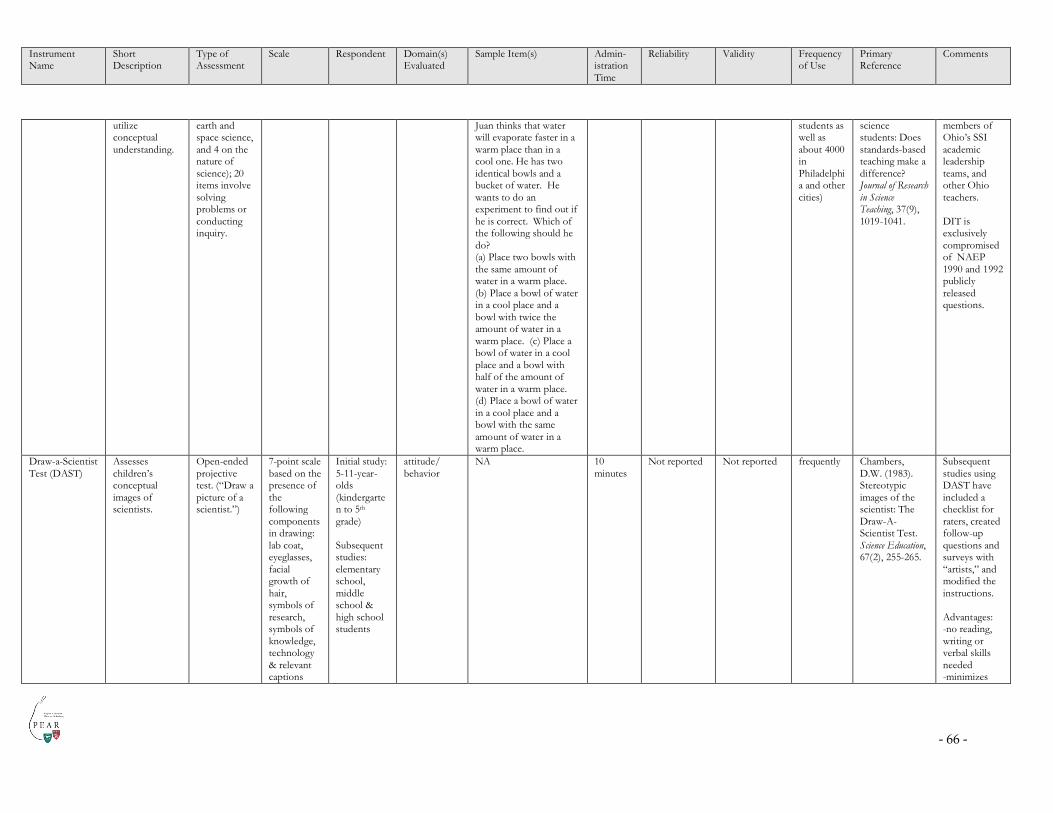
Instrument Name
Short Description
Type of Assessment
Scale Respondent Domain(s) Evaluated
Sample Item(s) Admin-istration Time
Reliability Validity Frequency of Use
Primary Reference
Comments
- 66 -
utilize conceptual understanding.
earth and space science, and 4 on the nature of science); 20 items involve solving problems or conducting inquiry.
Juan thinks that water will evaporate faster in a warm place than in a cool one. He has two identical bowls and a bucket of water. He wants to do an experiment to find out if he is correct. Which of the following should he do? (a) Place two bowls with the same amount of water in a warm place. (b) Place a bowl of water in a cool place and a bowl with twice the amount of water in a warm place. (c) Place a bowl of water in a cool place and a bowl with half of the amount of water in a warm place. (d) Place a bowl of water in a cool place and a bowl with the same amount of water in a warm place.
students as well as about 4000 in Philadelphia and other cities)
science students: Does standards-based teaching make a difference? Journal of Research in Science Teaching, 37(9), 1019-1041.
members of Ohio’s SSI academic leadership teams, and other Ohio teachers. DIT is exclusively compromised of NAEP 1990 and 1992 publicly released questions.
Draw-a-Scientist Test (DAST)
Assesses children’s conceptual images of scientists.
Open-ended projective test. (“Draw a picture of a scientist.”)
7-point scale based on the presence of the following components in drawing: lab coat, eyeglasses, facial growth of hair, symbols of research, symbols of knowledge, technology & relevant captions
Initial study: 5-11-year-olds (kindergarten to 5th grade) Subsequent studies: elementary school, middle school & high school students
attitude/ behavior
NA 10 minutes
Not reported Not reported frequently Chambers, D.W. (1983). Stereotypic images of the scientist: The Draw-A-Scientist Test. Science Education, 67(2), 255-265.
Subsequent studies using DAST have included a checklist for raters, created follow-up questions and surveys with “artists,” and modified the instructions. Advantages: -no reading, writing or verbal skills needed -minimizes

Instrument Name
Short Description
Type of Assessment
Scale Respondent Domain(s) Evaluated
Sample Item(s) Admin-istration Time
Reliability Validity Frequency of Use
Primary Reference
Comments
- 67 -
possibility of “socially-desirable” responses -little time to administer Disadvantages: vague instructions children may know more about scientists than their drawings reveal
Epistemological Beliefs Assessment for Physics Science (EBAPS)
Measures students’ views about the nature of knowledge and learning in the physical sciences along five non-orthogonal dimensions (structure of scientific knowledge, nature of knowing and learning, real-life applicability, evolving knowledge, & source of ability to learn).
30 items (Likert-scale & multiple choice)
5-point Likert scale (for 17 questions) strongly disagree, somewhat disagree, neutral, somewhat agree, strongly agree
high school & college students taking introductory physics, chemistry or physical science
attitude/ behavior; competence & reasoning
Understanding science is really important for people who design rockets, but not important for politicians. To be successful at science... (a) Hard work is much more important than inborn natural ability. (b) Hard work is a little more important than natural ability. © Natural ability and hard work are equally important. (d) Natural ability is a little more important than hard work. (e) Natural ability is much more important than hard work.
15-22 minutes
Not reported Present & acceptable
rarely http://www2. physics.umd. edu/~elby/ EBAPS/home.htm
Modified Attitudes towards Science Inventory (mATSI)
Measures students’ attitudes towards science related to such factors as students’ perceptions of
25 Likert-scale items
5 point scale (strongly agree, agree, neutral, disagree, strongly disagree)
5th grade students
engagement/ interest; attitude/ behavior
I like the challenge of science assignments. I often think, “I cannot do this,” when a science assignment seems hard.
25 minutes
Cronbach’s alpha: 0.70
present rarely
Weinburgh, M.E. & Steele, D. (2000). The modified attitudes toward science inventory:
The author (Weinburgh) of the ATSI revised her original instrument in order to make it reliable for

Instrument Name
Short Description
Type of Assessment
Scale Respondent Domain(s) Evaluated
Sample Item(s) Admin-istration Time
Reliability Validity Frequency of Use
Primary Reference
Comments
- 68 -
the science teacher, anxiety toward science, value of science in society, self-concept toward science and desire to do science.
Developing an instrument to be used with fifth grade urban students. Journal of Women and Minorities in Science and Engineering, 6, 87-94.
urban African-American 5th grade students and reduce administration time.
National Assessment of Educational Progress (NAEP) Science Assessment Instrument
Evaluates students’ knowledge of three fields of science (earth, physical, and life), three elements of knowing and doing science (conceptual understanding, scientific investigation, and practical reasoning), and two overarching domains in science (the nature of science and themes—systems, models, and patterns—present in science).
Multiple-choice, short constructed response questions, and extended constructed response questions
NA 4th, 8th and 12th grade students
attitude/ behavior; content knowledge; competence & reasoning
List four ways that the Earth is different from the moon. (4th grade) What property of water is most important for living organisms? (a) It is odorless. (b) It does not conduct electricity. (c) It is tasteless. (d) It is liquid at most temperatures on Earth. (8th grade) In the space below, draw a rough sketch (not necessarily to scale) illustrating the simplified model of the Solar System by showing the Sun and the four inner planets with their orbits. Be sure to label the Sun and each planet. (12th grade)
70 minutes (4th grade students) 103 minutes (8th and 12th grade students)
Inter-rater reliability: 0.94
present & acceptable
frequently Allen, N.L., Carlson, J., & Zelenak, C.A. (1998). The NAEP 1996 Technical Report. Washington, DC: National Center for Education Statistics.
A nationally representative sample of approximately 23,000 students in 4th, 8th and 12th grade completed assessment in 1996.
Programme for International Student Assessment (PISA)
Assesses how well students can apply the scientific knowledge and skills they have learned at school to real-life challenges.
multiple-choice
various 4-point scales
15-and 16-year olds
engagement/ interest; attitude/ behavior; competence & reasoning; career knowledge/ acquisition
How much do you agree with the statement(s) below? I am interested in learning about science. Broad science is valuable to me.
2 hours Information not currently available
Information not currently available
frequently PISA 2006 Science Competencies for Tomorrow’s World (2007). Organisation for Economic Co-operation and Development (OECD). Vol 1
57 countries participated in 2006 PISA survey, with 4,500-10,000 students in each country completing the survey.

Instrument Name
Short Description
Type of Assessment
Scale Respondent Domain(s) Evaluated
Sample Item(s) Admin-istration Time
Reliability Validity Frequency of Use
Primary Reference
Comments
- 69 -
My teachers equip me with the basic skills and knowledge I need for a science-related career.
& 2. Assessment occurs every three years with one of three subjects (reading, math, or science) being the focus of the assessment.
Relevance of Science Education (ROSE) Student Questionnaire
Assesses children’s interest in, attitude towards, and experiences in science and technology, as well as their opinion about environmental challenges and career aspirations.
Likert-scale items w/one open-ended question
Various 4-point Likert scales
15-year-olds engagement/ interest; attitude/ behavior
How interested are you in. . . how people, animals, plants and the environment depend on each other? To what extent to you agree with the following statements . . . I can personally influence what happens with the environment. School science has opened my eyes to new and exciting jobs. Thanks to science and technology, there will be greater opportunities for future generations. [Outside of school], how often have you . . . tried to find the star constellations in the sky?
30-45 minutes
Cronbach’s alpha: 0.90
present & acceptable
frequently Schreiner, C. & Sjoberg, S. (2004). Sowing the Seeds of Rose. Background, Rationale, Questionnaire Development and Data Collection for ROSE (The Relevance of Science Education)—A Comparative Study of Students’ Views of Science and Science Education. Department of Teacher Education and School Development. University of Oslo.
Data using the ROSE assessment is being collected in 35 countries.
Science Opinion Survey (SOS)
Assesses current interest and attitudes in science activities at school.
30 Likert-scale items
5-point scale (I strongly agree, I agree, I’m not sure, I disagree, I strongly disagree)
Initial study: 7th-12th graders Subsequent studies: 6th-8th graders
engagement/ interest; attitude/ behavior
Science lessons are fun. Working in a science laboratory would be an interesting way to earn a living.
10-15 minutes
Not available Not available Rarely Gibson, H.L. & Chase, C. (2002). Longitudinal impact of an inquiry-based science program on middle
Five items from the SOS were used in the 1996 NAEP survey

Instrument Name
Short Description
Type of Assessment
Scale Respondent Domain(s) Evaluated
Sample Item(s) Admin-istration Time
Reliability Validity Frequency of Use
Primary Reference
Comments
- 70 -
school students’ attitudes toward science. Science Education, 86, 693-705.
Scientific Attitude Inventory: A Revision (SAI II)
Assesses students interest in science, their attitudes toward science, their views of scientists, and their desire to become scientists.
40 Likert-scale items
5-point scale 6th, 9th, and 12th grade students
engagement/ interest; attitude/ behavior; competence and reasoning
Only highly trained scientists can understand science. The search for scientific knowledge is boring.
Information not available
Cronbach’s alpha: 0.78 Split-half: 0.81
present For criticism of validity see: Munby, H. (1997). Issues of validity in science attitude measurement. Journal of Research in Science Teaching, 34(4), 337-341.
Information not available
Moore, R.W. & Hill Foy, R.L. (1997). The scientific attitude inventory: A revision (SAI II). Journal of Research in Science Teaching, 34(4), 327-336.
The author (Moore) of the SAI revised his original instrument in order to eliminate gender-biased references and words that have been criticized as difficult to read. He also shortened the instrument and changes the scale from 6-points to 5.
Test of Science Related Attitudes (TOSRA)
Assesses science-related attitudes along seven dimensions: social implications of science, normality of scientists, attitude toward scientific inquiry, adoption of scientific attitudes, enjoyment of science lessons, leisure interest in science, & career interest in science.
70 Likert-scale items (10 questions from 7 subscales)
5-point scale (strongly disagree, disagree, not sure, agree, strongly agree)
Original study: 7th-10th graders Subsequent studies: 7th-12th grade
engagement/ interest; attitude/ behavior
I would prefer to do experiments than to read about them. A job as a scientist would be interesting.
30-45 minutes (for 7th graders) 25-30 minutes (for 10th graders)
Cronbach’s alpha: 0.82 Test-retest: 0.78
Present frequently Fraser, B.L. (1978). Development of a test of science-related attitudes. Science Education, 62, 509-515.
Fraser also developed a second TOSRA. TOSRA2 is comprised of two 35-statement questionnaires (pretest/protest). It is used with adults and children. The cross-cultural validity of TOSRA has been established in the US.
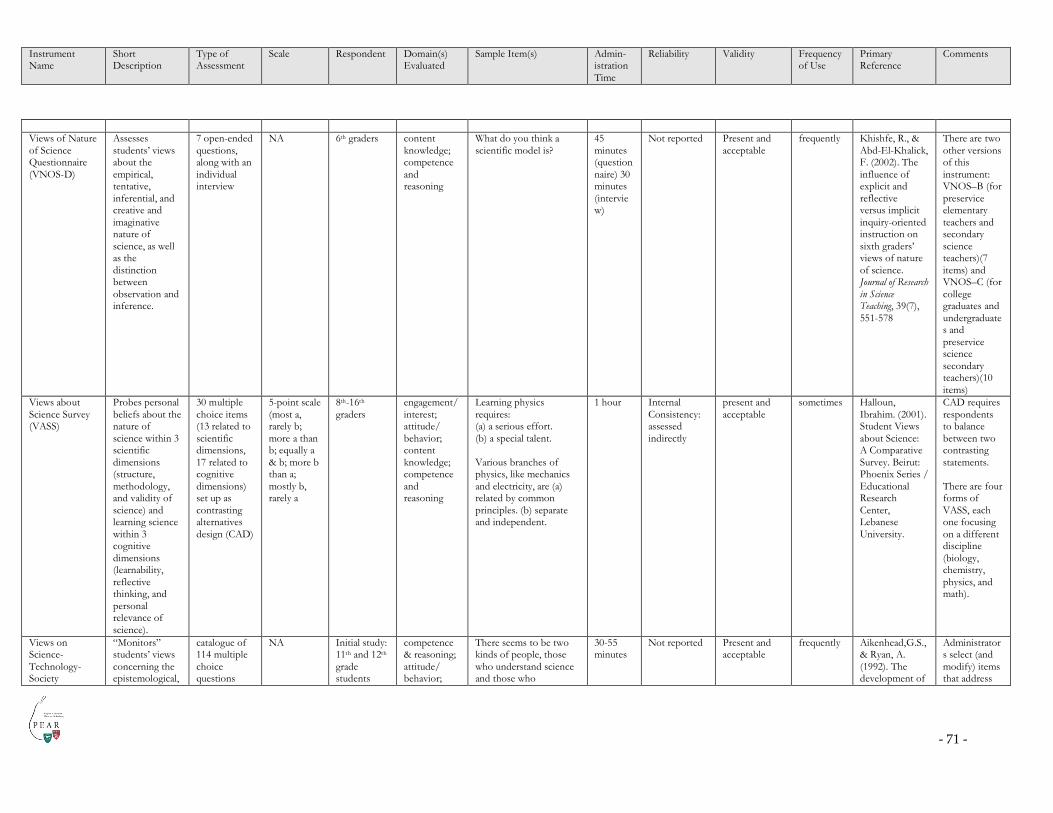
Instrument Name
Short Description
Type of Assessment
Scale Respondent Domain(s) Evaluated
Sample Item(s) Admin-istration Time
Reliability Validity Frequency of Use
Primary Reference
Comments
- 71 -
Views of Nature of Science Questionnaire (VNOS-D)
Assesses students’ views about the empirical, tentative, inferential, and creative and imaginative nature of science, as well as the distinction between observation and inference.
7 open-ended questions, along with an individual interview
NA 6th graders content knowledge; competence and reasoning
What do you think a scientific model is?
45 minutes (questionnaire) 30 minutes (interview)
Not reported
Present and acceptable
frequently Khishfe, R., & Abd-El-Khalick, F. (2002). The influence of explicit and reflective versus implicit inquiry-oriented instruction on sixth graders’ views of nature of science. Journal of Research in Science Teaching, 39(7), 551-578
There are two other versions of this instrument: VNOS–B (for preservice elementary teachers and secondary science teachers)(7 items) and VNOS–C (for college graduates and undergraduates and preservice science secondary teachers)(10 items)
Views about Science Survey (VASS)
Probes personal beliefs about the nature of science within 3 scientific dimensions (structure, methodology, and validity of science) and learning science within 3 cognitive dimensions (learnability, reflective thinking, and personal relevance of science).
30 multiple choice items (13 related to scientific dimensions, 17 related to cognitive dimensions) set up as contrasting alternatives design (CAD)
5-point scale (most a, rarely b; more a than b; equally a & b; more b than a; mostly b, rarely a
8th-16th graders
engagement/ interest; attitude/ behavior; content knowledge; competence and reasoning
Learning physics requires: (a) a serious effort. (b) a special talent. Various branches of physics, like mechanics and electricity, are (a) related by common principles. (b) separate and independent.
1 hour Internal Consistency: assessed indirectly
present and acceptable
sometimes Halloun, Ibrahim. (2001). Student Views about Science: A Comparative Survey. Beirut: Phoenix Series / Educational Research Center, Lebanese University.
CAD requires respondents to balance between two contrasting statements. There are four forms of VASS, each one focusing on a different discipline (biology, chemistry, physics, and math).
Views on Science-Technology-Society
“Monitors” students’ views concerning the epistemological,
catalogue of 114 multiple choice questions
NA Initial study: 11th and 12th grade students
competence & reasoning; attitude/ behavior;
There seems to be two kinds of people, those who understand science and those who
30-55 minutes
Not reported Present and acceptable
frequently Aikenhead,G.S., & Ryan, A. (1992). The development of
Administrators select (and modify) items that address

Instrument Name
Short Description
Type of Assessment
Scale Respondent Domain(s) Evaluated
Sample Item(s) Admin-istration Time
Reliability Validity Frequency of Use
Primary Reference
Comments
- 72 -
(VOSTS) social & technological aspects of science.
Subsequent studies: Post-secondary students
content knowledge
understand the arts (for example, literature, history, business, law). But if everyone studies more science, then everyone would understand the sciences. Your position, basically: (Please read from A to K, and then choose one) A. There ARE these two kinds of people. If the arts people did study more science, they would come to understand science, too, because the more you study something, the more you come to like and understand it. There ARE these two kinds of people. But if the arts people did study more science, they would not necessarily come to understand it better: B. because they may not have the skill or talent to understand science. Studying will not give them this skill. C. because they may not be interested in science. D. because they may not be oriented or inclined toward science. Studying science will not change the type of person you are. E. There are not just two kinds of people. There are as many kinds as there are individual preferences, including
a new instrument: “Views on Science-Technology-Society” (VOSTS). Science Education, 76, 477-491.
topics of interest to their research. A maximum of 15 to 20 items (20 for adults) is practical. VOSTS is an instrument for qualitative research, but its conversion to a quantitative instrument has been researched. Items have been translated into 14 languages.

Instrument Name
Short Description
Type of Assessment
Scale Respondent Domain(s) Evaluated
Sample Item(s) Admin-istration Time
Reliability Validity Frequency of Use
Primary Reference
Comments
- 73 -
people who understand both the arts and sciences. F. I don’t understand. G. I don’t know enough about this subject to make a choice. H. None of these choices fits my basic viewpoint.
Wareing Attitude toward Science Protocol (WASP)
Measures students’ attitudes toward science.
50-item Likert scale
five-point Likert scale (strongly agree, agree, undecided, disagree, strongly disagree)
4th-12th grade students
engagement/ interest; attitude/ behavior
We have a better world to live in because of science. Science discourages curiosity.
Information not available
0.91-0.94 present Rarely Wareing, C. (1982). Developing the WASP: Wareing Attitudes towards Science Protocol, Journal of Research in Science Teaching, 19(8), 639-645.
A Chinese version of the WASP is available.

- 74 -
TABLE 4. INFORMATION CHARTS FOR SCIENCE ASSESSMENT TOOLS BY CATEGORY DOMAIN CLASSIFICATIONS Engagement/
Interest Attitude/ Behavior
Content Knowledge
Competence & Reasoning
Career Knowledge/ Acquisition
Children’s Environmental Attitudes & Social Knowledge Scale (CHEAKS)
√ √ √
Children's Science Curiosity Scale (CSCS) √ √ Discovery Inquiry Test in Science (DIT) √ √ Draw-a-Scientist Test (DAST) √ Epistemological Beliefs Assessment for Physics Science (EBAPS) √ √ Modified Attitudes towards Science Inventory (mATSI) √ √ National Assessment of Educational Progress (NAEP) 1996 Science Assessment Instrument
√ √ √
Programme for International Student Assessment (PISA) √ √ √ √ Relevance of Science Education (ROSE) Student Questionnaire √ √ Science Opinion Survey (SOS) √ √ Scientific Attitude Inventory: A Revision (SAI II)
√ √ √
Test of Science Related Attitudes (TOSRA) √ √ Views of Nature of Science Questionnaire (VNOS-D) √ √ Views about Science Survey (VASS) √ √ √ √ Views on Science-Technology-Society (VOSTS) √ √ √ Wareing Attitude toward Science Protocol (WASP) √ √

- 75 -
METHOD OF ASSESSMENT Drawing Interview Likert
Scale Multiple- Choice
Short-Constructed Response
Extended Response
Children’s Environmental Attitudes & Social Knowledge Scale (CHEAKS)
√ √
Children's Science Curiosity Scale (CSCS) √ Discovery Inquiry Test (DIT) Draw-a-Scientist Test (DAST) √ Epistemological Beliefs Assessment for Physics Science (EBAPS)
√ √
Modified Attitudes towards Science Inventory (mATSI) √ National Assessment of Educational Progress (NAEP) 1996 Science Assessment Instrument
√ √ √
Programme for International Student Assessment (PISA) √ Relevance of Science Education (ROSE) Student Questionnaire √ √ Science Opinion Survey (SOS) √ Scientific Attitude Inventory: A Revision (SAI II)
√
Test of Science Related Attitudes (TOSRA) √ Views of Nature of Science Questionnaire (VNOS-D) √ √ Views about Science Survey (VASS) √ Views on Science-Technology-Society (VOSTS) √ Wareing Attitude toward Science Protocol (WASP) √
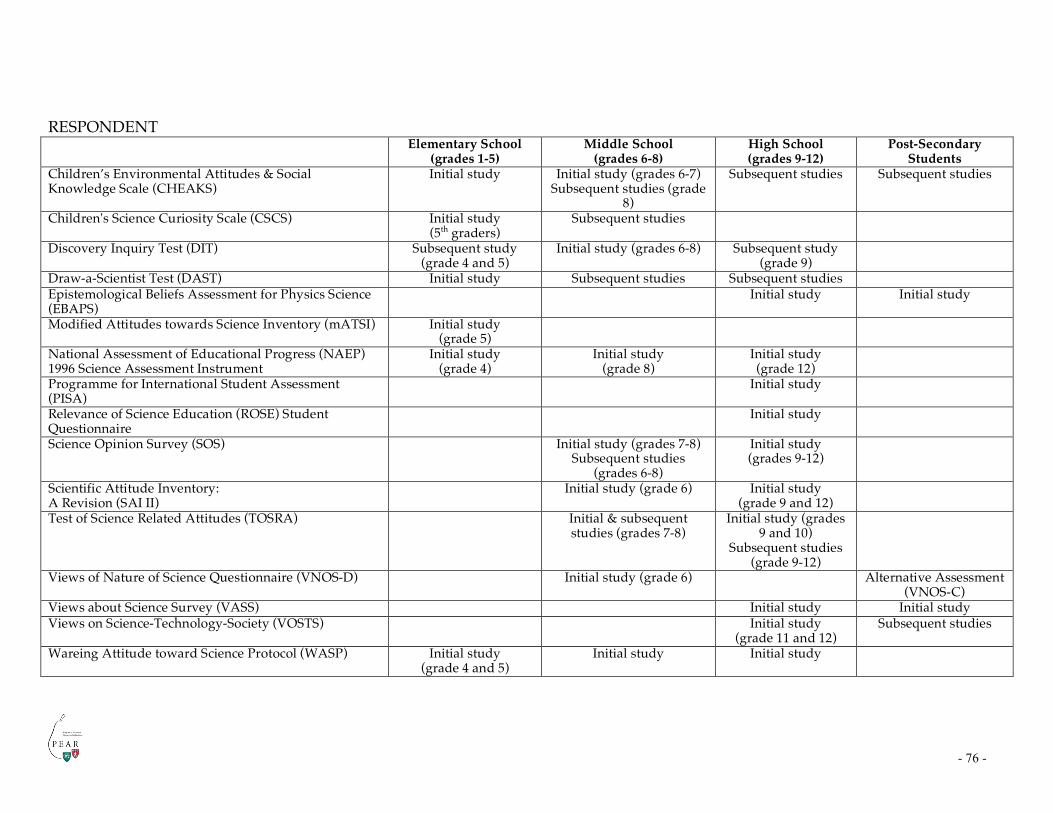
- 76 -
RESPONDENT Elementary School
(grades 1-5) Middle School
(grades 6-8) High School (grades 9-12)
Post-Secondary Students
Children’s Environmental Attitudes & Social Knowledge Scale (CHEAKS)
Initial study Initial study (grades 6-7) Subsequent studies (grade
8)
Subsequent studies Subsequent studies
Children's Science Curiosity Scale (CSCS) Initial study (5th graders)
Subsequent studies
Discovery Inquiry Test (DIT) Subsequent study (grade 4 and 5)
Initial study (grades 6-8) Subsequent study (grade 9)
Draw-a-Scientist Test (DAST) Initial study Subsequent studies Subsequent studies Epistemological Beliefs Assessment for Physics Science (EBAPS)
Initial study Initial study
Modified Attitudes towards Science Inventory (mATSI) Initial study (grade 5)
National Assessment of Educational Progress (NAEP) 1996 Science Assessment Instrument
Initial study (grade 4)
Initial study (grade 8)
Initial study (grade 12)
Programme for International Student Assessment (PISA)
Initial study
Relevance of Science Education (ROSE) Student Questionnaire
Initial study
Science Opinion Survey (SOS) Initial study (grades 7-8) Subsequent studies
(grades 6-8)
Initial study (grades 9-12)
Scientific Attitude Inventory: A Revision (SAI II)
Initial study (grade 6) Initial study (grade 9 and 12)
Test of Science Related Attitudes (TOSRA) Initial & subsequent studies (grades 7-8)
Initial study (grades 9 and 10)
Subsequent studies (grade 9-12)
Views of Nature of Science Questionnaire (VNOS-D) Initial study (grade 6) Alternative Assessment (VNOS-C)
Views about Science Survey (VASS) Initial study Initial study Views on Science-Technology-Society (VOSTS) Initial study
(grade 11 and 12) Subsequent studies
Wareing Attitude toward Science Protocol (WASP) Initial study (grade 4 and 5)
Initial study Initial study

- 77 -
ADMINISTRATION TIME Under 10
minutes 10-20 minutes 21-30 minutes 31-45 minutes Under 1
hour 1-2 hours
Children’s Environmental Attitudes & Social Knowledge Scale (CHEAKS)
√
Children's Science Curiosity Scale (CSCS) √ Discovery Inquiry Test (DIT) √ Draw-a-Scientist Test (DAST) √ Epistemological Beliefs Assessment for Physics Science (EBAPS) √ (up to 22
minutes)
Modified Attitudes towards Science Inventory (mATSI) √ National Assessment of Educational Progress (NAEP) 1996 Science Assessment Instrument
√
Programme for International Student Assessment (PISA) √ Relevance of Science Education (ROSE) Student Questionnaire √ Science Opinion Survey (SOS) √ Scientific Attitude Inventory: A Revision (SAI II)
Test of Science Related Attitudes (TOSRA) √ (for 10th graders)
√ (for 7th graders)
Views of Nature of Science Questionnaire (VNOS-D) √ Views about Science Survey (VASS) √ Views on Science-Technology-Society (VOSTS) √ Wareing Attitude toward Science Protocol (WASP)

- 78 -
PSYCHOMETRIC PROPERTIES Reliability Validity Children’s Environmental Attitudes & Social Knowledge Scale (CHEAKS) Cronbach’s alpha: 0.88-0.90
Test-Retest: 0.57-0.72 √
Children's Science Curiosity Scale (CSCS) Internal Consistency: 0.85 Test-Retest: 0.67-0.69
√
Discovery Inquiry Test (DIT) Cronbach’s alpha: 0.94 √ Draw-a-Scientist Test (DAST) Not reported Not reported Epistemological Beliefs Assessment for Physics Science (EBAPS) Not reported √ National Assessment of Educational Progress (NAEP) 1996 Science Assessment Instrument Inter-rater reliability: 0.94 √ Modified Attitudes towards Science Inventory (mATSI) Cronbach’s alpha: 0.70 present Programme for International Student Assessment (PISA) Relevance of Science Education (ROSE) Student Questionnaire Cronbach’s alpha: 0.90 √ Science Opinion Survey (SOS) Not available Not available Scientific Attitude Inventory: A Revision (SAI II)
Cronbach’s alpha: 0.78 Split-Half: 0.81
√
Test of Science Related Attitudes (TOSRA) Cronbach’s alpha: 0.82 Test-retest: 0.78
√
Views of Nature of Science Questionnaire (VNOS-D) Not reported √ Views about Science Survey (VASS) Internal Consistency: assessed indirectly √ Views on Science-Technology-Society (VOSTS) Not reported √ Wareing Attitude toward Science Protocol (WASP) 0.91-0.94 √

- 79 -
APPENDIXES
APPENDIX A. RELEVANT JOURNALS The American Biology Teacher American Journal of Evaluation Bulletin of Sciences Bulletin of Science, Technology and Society Cognitive Science Educational Assessment Educational & Psychological Measurement European Journal of Science Education Journal of Curriculum Studies Journal of the Learning Sciences Journal of Research in Science Teaching Journal of Science Teacher Education Research in Science Education Research in Science and Technological Education Science Science & Children Science & Education Science Education Science Education International The Science Teacher Science, Technology, and Human Values Studies in Educational Evaluation Studies in Science Education School Science & Mathematics Technology & Society Magazine

- 80 -
APPENDIX B. SAMPLE PROGRAMS
4-H Wildlife Stewards (http://4hwildlifestewards.org/index.htm) The Active Prolonged Engagement (APE) project (NSF funded at The Exploratorium) The After-School Corporation (TASC)—NYC (http://www.tascorp.org/) Boston University’s Project STAMP (www.bu.edu/lernet/programs/index.html) Coalition for School After School
(http://qt.exploratorium.edu/csas/index.html) Curriculum Arts Technology and Science (CATS) Design It! (http://cse.edc.org/curriculum/designit/) Dragonfly Quest (Boys and Girls Clubs)
(http://www.units.muohio.edu/dragonfly/bandg.shtml) Foundations Discovers Foundations Invents Foundations Travels GEMS Kits (http://www.carolina.com) KidzLit (http://www.devstu.org/afterschool/askl/videos/index.shtml) Kinetic City After School (http://www.kcmtv.com/evaluation.htm) KLICK (Kids Learning in Computer Klubhouses)
(http://klick.baldwin.k12.mi.us/) Massachusetts Envirothon Operation SMART (for Science, Math, and Relevant Technology), Girls Incorporated (http://www.girlsinc.org/ic/page.php?id=1.2.1) Project Learn (http://www.ucar.edu/learn/) Science for All Science Explorer through Developmental Studies Center Science and Technology Concepts for Middle School
(http://www.stcms.si.edu/stcms.htm) Science and Technology for Children (STC)
(http://www.nsrconline.org/curriculum_resources/elementary.html) Science by Stealth Studio 3D (Digital, Design, and Development)
(http://www.smm.org/studio3d/index.html) TechREACH Puget Sound Center Water Educational Training Science Project (www.emich.edu/wrc/WET.html) A World of Motion (Society of Automotive Engineers International)
(http://www.awim.org/) Youth Exploring Science (http://www.youthexploringscience.com/)

- 81 -
APPENDIX B. SAMPLE PROGRAMS (CONTINUED)
21st Century Community Learning Center (http://www.ed.gov/programs/21stcclc/index.html)
2:00-600 Afterschool Initiative (Boston) (http://www.bostonbeyond.org/research/Outcomes_Evaluation/index.html)
4-H Afterschool (http://www.4-hafterschool.org/evaluations.aspx) 6 to 6 Extended School Day Program (San Diego)
(http://www.sandi.net/extended_learning/6to6/) Academic Competitiveness Council (ACC) Academy of Engineering Labs Afterschool Alliance (http://www.afterschoolalliance.org/) American Association for the Advancement of Science (AAAS) Arizona Science Center (http://www.azscience.org/) Assessment of Performance Unit (APU) Association of Science-Technology Centers (http://www.astc.org/) AVID Center (http://www.avidonline.org/) AYS Berkeley Evaluation and Assessment Research Center (BEAR)
(http://bearcenter.berkeley.edu/) Assessing Science Knowledge (ASK) Constructing a Framework for Science Assessment Systems Better Education for Tomorrow Program (LA’s BEST) Los Angeles Boston Afterschool for All Partnership Boston Afterschool DELTAS (http://www.bpsdeltas.org/) Classroom Assessment Project to Improve Teaching and Learning (CAPITAL) Center for Equity and Biliteracy Education, San Diego State University (http://edweb.sdsu.edu/i2techscie/index.htm) Center for Informal Learning and Schools
(http://www.exploratorium.edu/CILS/) Center for Science Education (http://cse.edc.org/aboutus/default.asp) Center for Science and Mathematics Education Research
(http://www.umaine.edu/center/) Center for Social Organization of Schools at John Hopkins University Center for the Study of Evaluation (CSE) Center for Summer Learning (http://www.summerlearning.org/) Challenger Center for Space Science Education (http://www.challenger.org/) Charles Stewart Mott Foundation Children's Aid Society (http://www.childrensaidsociety.org/) Citizen Schools (http://www.citizenschools.org/) Coalition for Science in Afterschool (http://qt.exploratorium.edu/csas/index.html) Collaborative After School Project, U of CA (UCI-CASP) Consumers Guide to Afterschool Science Resources (http://www.sedl.org/afterschool/guide/science/index.html)

- 82 -
APPENDIX B. SAMPLE PROGRAMS (CONTINUED) Consulting Solutions Department of Education Education Development Center (EDC) Educational Equity Center-Academy for Educational Development
(http://www.edequity.org/) Explora (http://www.explora.us/ExploraPHP/english/index.php) Exploratorium (http://www.exploratorium.edu/) Explorit Science Center (http://www.explorit.org/) Family Museum (http://www.familymuseum.org/currentevents.htm) The Forum for Youth Investment (http://www.forumfyi.org/) Foundations, Inc. (http://www.foundationsinc.org/) Free-Choice Learning Program, Science & Mathematics Education Department (http://oregonstate.edu/dept/sci_mth_education/) Girl Scouts of the USA (http://www.girlscouts.org/) Girls Incorporated (http://www.girlsinc.org/) Great Lakes Children's Museum (http://www.greatlakeskids.org/) Goodman Research Group Harvard Family Research Project’s Out-of-School Time Program Research and Evaluation Database
(http://www.gse.harvard.edu/hfrp/projects/afterschool/evaldatabase.html) The Health Adventure (http://www.thehealthadventure.org/) Hewlett Foundation Horizons Research, Inc. Immersion Presents (http://www.immersionpresents.org/) Informal Science Education (ISE) program at NSF Informal Science Evaluation Reports and Resources
(http://www.informalscience.org/evaluation/index.php) Informal Science Education Resource Center (www.insci.org) Institute for Research on Learning International Assessment of Educational Progress (IAEP) International Association for the Evaluation of Educational Assessment (IEA) Kimball Group Learning Center Learning through Evaluation, Adaptation and Dissemination (LEAD) Center Learning Point Associates Liberty Science Center (http://www.lsc.org/) Marion County Commission on Youth, Inc. (http://www.mccoyouth.org/) Massachusetts Afterschool Research Study (MARS) Massachusetts Board of Education (Pat Plummer) Massachusetts Comprehension Assessment System (MCAS) McREL (http://www.mcrel.org/) Mott Foundation MPR Museum Consulting (http://www.mprconsultants.com/)

- 83 -
APPENDIX B. SAMPLE PROGRAMS (CONTINUED) National Afterschool Association (NAA) National Assessment of Educational Programs (NAEP) National Association of Biology Teachers (NABT) National Association for Research in Science Teaching National Center for Atmospheric Research (http://www.ucar.edu/) National Center for Education Statistics (NCES) National Center for Research on Evaluation, Standards, and Student Testing (CRESST) National Center for Research in Mathematical Science Education National Council on Measurement in Education National Education Longitudinal Study (NELS) National Institute on Out-of-School Time (NIOST) (http://www.niost.org/) National Partnership for Quality After-School Learning
(http://www.sedl.org/afterschool/) National Research Council (NRC) National Science Foundation (NSF) National Science Teachers Association (NSTA) Nauticus, The National Maritime Center (http://www.nauticus.org/) New Jersey School-Age Care Coalition (http://www.njsacc.org/index.html) New York Hall of Science (http://www.nyscience.org/) Northwest Invention Center (http://www.invention-center.com/) Oscar Johnson, Jr. Community Center After School Program
(http://www.cityofconroe.org/index.php?option=com_content&task=vie w&id=13&Itemid=351)
OERL, the Online Evaluation Resource Library: Search for Learner and Parent Instruments (http://oerl.sri.com/search/instrSearch.jsp)
Oregon Mathematics Leadership Institute (OMLI) Out-of-School Time Resource Center (http://www.sp2.upenn.edu/text.html) Pacific Science Center (http://www.pacsci.org/) Packard Foundation Partners for Outreach in Informal STEM Education (POISED)
(https://php.radford.edu/~poised/) PlusTime NH (http://www.plustime.org/) Program Evaluation and Research Group, Lesley College Program for International Student Assessment (PISA) Program in Science Education, Teachers College, Columbia Project Exploration (http://www.projectexploration.org/) Salvadori Center (http://www.salvadori.org/) Sayre Schools 21st CCLC PALS Program Science Club for Girls (http://www.scienceclubforgirls.org/) UMASS Donahue Institute (Eric Heller) University of Wisconsin-Extension Program Development and Evaluation RAND Sacramento Start
- 84 -
APPENDIX B. SAMPLE PROGRAMS (CONTINUED) Science Education through Portfolio Instruction and Assessment (SEPIA) Science, Technology, Engineering, and Math (STEM) Education Caucuses
(http://www.stemedcaucus.org/) Secondary International Science Study (SISS) Shake-a-Leg Miami
(http://www.shakealegmiami.org/site/c.kkLUJbMQKpH/b.2521629/k.BF03/Home.htm)
St. Louis Science Center (http://www.slsc.org/) Stanford Research Institute (SRI) Steppingstone Foundation Techbridge Program, Chabot Space & Science Center
(http://www.techbridgegirls.org/) TERC (http://www.terc.edu/) The After-School Corporation (TASC) in New York City
(http://www.tascorp.org/index_html) Tree Frog Treks (http://www.treefrogtreks.com/) Trends in International Mathematical and Science Study (TIMSS) United Way (youth development instruments) University of California Cooperative Extension, Santa Cruz County 4-H Youth
Development Program (http://cesantacruz.ucdavis.edu/) University of California, Lawrence Hall of Science
(http://www.lawrencehallofscience.org/) University of Pittsburgh Center for Learning in Out-of-School Environments
(www.informalscience.org) Vernier Technology Lab, Oregon Museum of Science & Industry (http://omsi.edu/visit/tech/lab.cfm) What We Know about Girls, STEM, and Afterschool Programs: A Summary
(http://www.afterschool.org/sga/pubs/whatweknow.pdf) WGBH (http://www.wgbh.org/)

- 85 -
APPENDIX C. CHILD ASSESSMENT TOOLS
4-H Youth Survey After-School Environment Scale (ASES) After-School Initiative’s (ASI) Toolkit for Evaluating Positive Youth Development Attitudes toward Chemistry Attitudes toward Science Inventory (ATSI) Attitude toward Subject Science Scale (ATSSS) Beacon Program Adolescent Survey Biology Attitude Scale Chemistry Attitudes and Experiences Questionnaire (CAEQ) Career Decision-Making System Revised, Level 1 (CDM-R) Children’s Environmental Attitudes and Knowledge Scale (CHEAKS) Children’s Science Curiosity Scale (CSCS) Colorado Learning Attitudes about Science Survey (CLASS) Colorado Trust Youth Participant Survey Colorado Trust Student Survey Contrasting Alternative Designs (CAD) Discovery Inquiry Test (DIT) Draw-a-Scientist Test (DAST) ECSEL Epistemological Beliefs Assessment for Physics Science (EBAPS) Eurobarometer Fetch Girls in Information Technology (Girl Scouts) Health Adventure Student Survey Inquiry Science Instruction Observation Protocol (ISIOP) MC2/ChemLinks: Student Interview Protocol Modified Attitudes towards Science Inventory (mATSI) National Assessment of Educational Progress (NAEP) New Traditions Survey & Student Interview Protocol New York City Beacons Evaluation, Adolescent Interview Programme for International Student Assessment (PISA) Promising After-School Programs Questionnaire (2 surveys: elementary & middle school students) Relevance of Science Education (ROSE) Student Questionnaire School Achievement Indicators Program (SAIP) Science Assessment II Scope Notebook Science Explorations Science Education for Public Understanding Program (SEPUP) Science Management Observation Protocol (SMOP) Science Opinion Survey Science Process Inventory (SPI) Science-Related Attitude Instrument (SRAI) Scientific Attitudes Inventory (SAI)

- 86 -
APPENDIX C. CHILD ASSESSMENT TOOLS (CONTINUED) Scientific Attitudes Inventory II (SAI II) Special Strategies Observation System Student Achievement Indicators Program (SAIP) Student Motivation towards Science Learning (STMSL) Student Opinion Survey in Chemistry (SOSC) Survey of Technology Infrastructure (STI) Techbridge Test of Biology Related Attitudes (TOBRA) Test of Science Related Attitudes (TOSRA) The After-School Corporation (TASC) Student Questionnaire (3 questionnaires: elementary, middle and high school students) University of Kentucky Field Trip Questionnaire Views about Science Survey (VASS) Views of Nature of Science Questionnaire (VNOS) Views of Nature of Science Questionnaire (Elementary-Middle School Version) (VNOSD) Views on Science and Education Questionnaire (VOSE) Views on Science-Technology-Society (VOSTS) Wareing Attitude toward Science Protocol (WASP) Women in Science Scale (WiSS) Youth Survey Mentor-Youth Relationships Youth-Mentor Relationship Questionnaire

- 87 -
AUTHORS NOTE
We would like to thank the board of the Noyce Foundation for their generous
support of this project. Dr. Pendred (Penny) Noyce and Ron Ottinger are not only
dedicated to strengthening the afterschool science field through research, practice and
policy, but were actively engaged throughout the writing process. We also want to
thank Alan Friedman who gave his time and expertise at critical moments.
In addition, we want to acknowledge the many researchers and evaluators,
policy makers and practitioners whose input has helped form this report. In particular,
we would like to thank the following individuals for participating in our focus group
discussions: Jessica Andrews (WGBH), Dan Barstow (TERC), Brenda Britsch (National
Girls Collaborative Project), Connie Chow (Science Club for Girls), Bob Coulter
(Missouri Botanical Gardens), Eda Davis-Lowe (SMILE at Oregon State), Alice Dennis
(Girl Scouts), Nancy Deutch (Curry School of Education at University of Virginia), Jason
Freeman (Coalition for Science After School), Ellen Gannet (National Institute on Out-
of-School Time), Leslie Goodyear (Education Development Center, Inc.), Georgia Hall
(National Institute on Out-of-School Time), Charlie Hutchinson (Education
Development Center, Inc.), Susan LeMenestrel, (4-H), Sam Piha (Community Network
for Youth Development), Kristin Pineo (United Way), Kim Pond (4-H), Tim Porter
(Boston Children’s Museum), Elizabeth Reisner (Policy Studies Associates), Judith Stull
(Mid-Atlantic Laboratory for Student Success at Temple University), Wendy Surr
(Wellesley Centers for Women), Charlie Trautman (Sciencenter), Sam Whalin (College
of Education, University of Illinois at Chicago), Nicole Yohalem (Forum for Youth
Investment), and John Zuman (INCRE). The discussions with these individuals have
played a valuable and significant role in informing our report.