toward a systematic discussion of missingness in visual
TRANSCRIPT

Toward A Systematic Discussion of Missingness in Visual Analytics
Maoyuan Sun* Courtney Bolton* Yuanxin Wang† Jian Zhao† Tianyi Li‡∗Northern Illinois University †University of Waterloo ‡Purdue University
ABSTRACT
Data-driven decision making has been a common task in today’s bigdata era, from simple choices such as finding a fast way for drivingto work, to complex decisions on cancer treatment in healthcare,often supported by visual analytics. For various reasons (e.g., anill-defined problem space, network failures or bias), visual analyticsfor sensemaking of data involves missingness (e.g., missing dataand incomplete analysis), which can impact human decisions. Forexample, data, with missing records, can cost a business millions ofdollars, and failing to recognize key evidence can put an innocentperson into a sentence to death as a falsely convicted of murder.Being aware of missingness is critical to avoid such catastrophes.To achieve this, as an initial step, we present a framework of catego-rizing missingness in visual analytics from two perspectives: data-centric and human-centric. The former emphasizes missingness inthree data-related categories: data composition, data relationshipand data usage. The latter focuses on the human-perceived missing-ness at three levels: observed missingness, inferred missingness andignored missingness. Based on the framework, we discuss possibleroles of visualizations for handling missingness, and conclude ourdiscussion with future research opportunities.
Index Terms: Human-centered computing—Human ComputerInteraction; Human-centered computing—Visualization
1 INTRODUCTION
For various reasons (e.g., network problems, system design failuresor bias), missingness often exists in a human sensemaking process.It (e.g., missing data and biased data selection [39]) impacts humandecisions and can lead to severe consequences. For example, datawith missing records cost millions of dollars per year in business [1].Due to the failure to notice incomplete evidence, John Bunn wasfalsely convicted of murder [20], and Sunil Tripathi was wrongfullyaccused as a suspect in the Boston Marathon bombing on socialmedia [26]. These tragedies lead us to question, “What are possiblemissingness in analytics?” and “Can we design techniques to preventpeople from falling into the traps of such missingness?”
While investigating missingness in analytics remains an elusiveskill and an understudied task, much effort has been put in a nar-row and focused direction: estimating missing data (e.g., imputa-tion [12]). It aims to “fix” identified missingness by replacing itwith some “best, reasonable inference” based on existing data [33].However, such a replacement “breaks” missingness, especially whenconsidering missingness as a type of data [33, 36], so it may bringa false impression of completeness. In fact, using the imputationtechniques for handling missingeness implies that users must real-ize the existence of missingness. Thus, a successful awareness ofmissingness is an initial but critical step for handling missingness.
Visualization can help with missingness awareness for data ana-lytics [3, 11]. With proper visual encodings, the existence of miss-
*e-mail: {smaoyuan, cbolton1}@niu.edu.†e-mail: {y2587wang, jianzhao}@uwaterloo.ca.‡e-mail: [email protected]
ingness gets salient and perceptually attracts user attention. Forexample, given a dataset of connections between two sets of entities,showing it in a matrix with different cell colors (blue indicates theexistence of a connection and white means no connection) may beeasier for users to realize missing connections than listing all con-nections in an edge list. By marrying advanced computation withhuman cognition via interactive visualizations, visual analytics [18],in particular, is well suited to support handling missingness.
Nevertheless, the current understanding of missingness with vi-sual analytics approaches seems scattered and primarily focusing ondata value (e.g., missing data). However, missingness can be morecomplicated when analysts make sense of various data types andwith different goals. In this work, we investigate missingness from asensemaking perspective. The goal is to establish a systematic under-standing of missingness and pave the road for future research usingvisual analytics to handle issues related to or caused by missingness.
As an initial step for better developing visual analytics techniquesto address missingness, we present a framework to categorize miss-ingness that may exist in a sensemaking process with visual analyt-ics. This framework considers missingness from two perspectives:data and human. The former regards the information to be inves-tigated by users and the latter highlights how users may perceivethe information. Specifically, the data-centric perspective regardsmissingness in three data-related groups: missingness in data com-position, missingness in data relation and missingness in data usage.The human-centric perspective separates missingness into threeperceptual-oriented levels: observed missingness, inferred missing-ness and ignored missingness. The two perspectives consider the twokey parties in visual analytics: computation and human cognition,which are glued together by interactive visualizations. Computa-tion can help to identify certain data-related missingness [4] (e.g.,missing relationship detection [10, 41, 42]). Moreover, how datais visualize can impact user awareness of missingness and theirjudgement on data quality [36].
This framework enables a systematic consideration of missing-ness in visual analytics. Relying on it, to handle missingness, thevisualization design needs to reveal possible data-related missing-ness and aims to prevent users from simply ignoring missingness.We hope this work can draw attention to future exploration of thedesign space of visualizing missingness and studying insights frommissingness in sensemaking.
2 A DATA-CENTRIC VIEW OF MISSINGNESS
A data-centric view categorizes missingness in three data-relatedgroups: data composition, data relationship and data usage. In thissection, we first introduce our notion of data composition and datarelationship and then discuss the data-centric view of missingness.
2.1 Data Composition and Data RelationshipThe composition of data can include three major components [6, 8]:entity, attribute and value. An entity is a data item, which is a basicunit encoding a piece of information. An attribute is a specificationthat describes an entity, and an entity can have multiple attributes. Avalue reveals how an entity performs on an attribute. Thus, a datasetcan be considered as a collection of entities, described by one ormultiple attributes with specified values. For example, in an imagedataset, each picture is a data entity. Attributes that describe eachpicture include width and height, with values such as 1080px and
arX
iv:2
108.
0493
1v1
[cs
.HC
] 1
0 A
ug 2
021
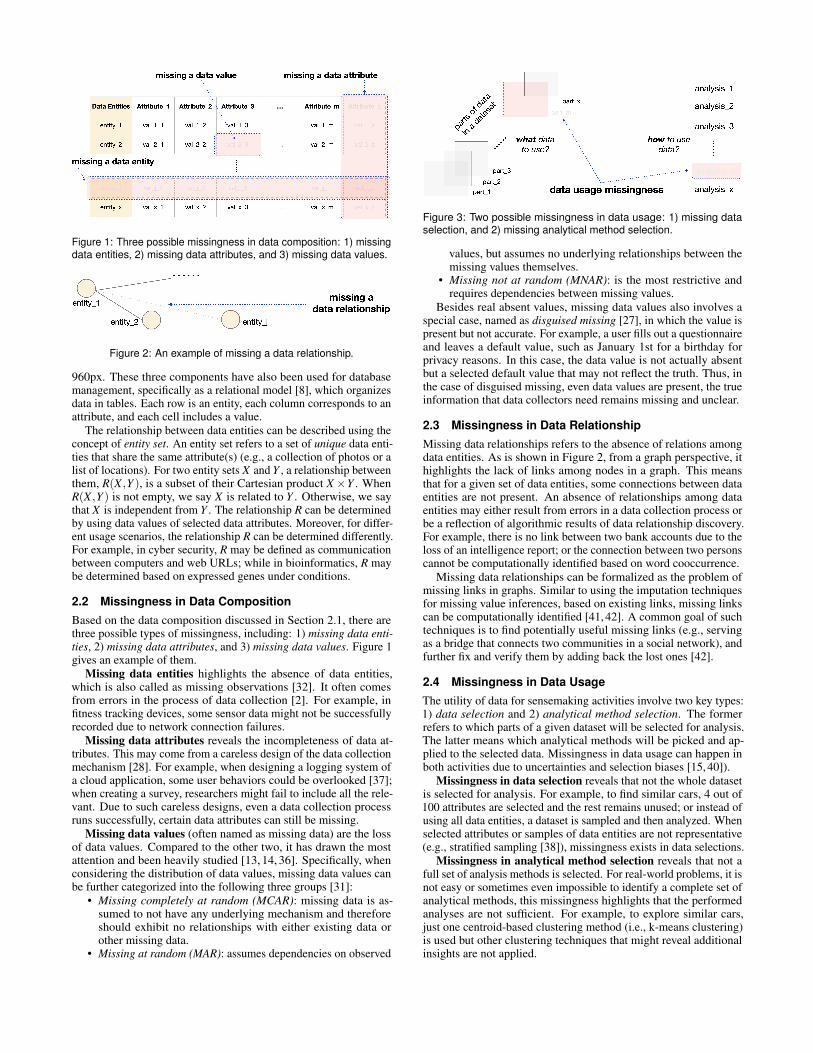
Figure 1: Three possible missingness in data composition: 1) missingdata entities, 2) missing data attributes, and 3) missing data values.
Figure 2: An example of missing a data relationship.
960px. These three components have also been used for databasemanagement, specifically as a relational model [8], which organizesdata in tables. Each row is an entity, each column corresponds to anattribute, and each cell includes a value.
The relationship between data entities can be described using theconcept of entity set. An entity set refers to a set of unique data enti-ties that share the same attribute(s) (e.g., a collection of photos or alist of locations). For two entity sets X and Y , a relationship betweenthem, R(X ,Y ), is a subset of their Cartesian product X ×Y . WhenR(X ,Y ) is not empty, we say X is related to Y . Otherwise, we saythat X is independent from Y . The relationship R can be determinedby using data values of selected data attributes. Moreover, for differ-ent usage scenarios, the relationship R can be determined differently.For example, in cyber security, R may be defined as communicationbetween computers and web URLs; while in bioinformatics, R maybe determined based on expressed genes under conditions.
2.2 Missingness in Data CompositionBased on the data composition discussed in Section 2.1, there arethree possible types of missingness, including: 1) missing data enti-ties, 2) missing data attributes, and 3) missing data values. Figure 1gives an example of them.
Missing data entities highlights the absence of data entities,which is also called as missing observations [32]. It often comesfrom errors in the process of data collection [2]. For example, infitness tracking devices, some sensor data might not be successfullyrecorded due to network connection failures.
Missing data attributes reveals the incompleteness of data at-tributes. This may come from a careless design of the data collectionmechanism [28]. For example, when designing a logging system ofa cloud application, some user behaviors could be overlooked [37];when creating a survey, researchers might fail to include all the rele-vant. Due to such careless designs, even a data collection processruns successfully, certain data attributes can still be missing.
Missing data values (often named as missing data) are the lossof data values. Compared to the other two, it has drawn the mostattention and been heavily studied [13, 14, 36]. Specifically, whenconsidering the distribution of data values, missing data values canbe further categorized into the following three groups [31]:
• Missing completely at random (MCAR): missing data is as-sumed to not have any underlying mechanism and thereforeshould exhibit no relationships with either existing data orother missing data.
• Missing at random (MAR): assumes dependencies on observed
Figure 3: Two possible missingness in data usage: 1) missing dataselection, and 2) missing analytical method selection.
values, but assumes no underlying relationships between themissing values themselves.
• Missing not at random (MNAR): is the most restrictive andrequires dependencies between missing values.
Besides real absent values, missing data values also involves aspecial case, named as disguised missing [27], in which the value ispresent but not accurate. For example, a user fills out a questionnaireand leaves a default value, such as January 1st for a birthday forprivacy reasons. In this case, the data value is not actually absentbut a selected default value that may not reflect the truth. Thus, inthe case of disguised missing, even data values are present, the trueinformation that data collectors need remains missing and unclear.
2.3 Missingness in Data RelationshipMissing data relationships refers to the absence of relations amongdata entities. As is shown in Figure 2, from a graph perspective, ithighlights the lack of links among nodes in a graph. This meansthat for a given set of data entities, some connections between dataentities are not present. An absence of relationships among dataentities may either result from errors in a data collection process orbe a reflection of algorithmic results of data relationship discovery.For example, there is no link between two bank accounts due to theloss of an intelligence report; or the connection between two personscannot be computationally identified based on word cooccurrence.
Missing data relationships can be formalized as the problem ofmissing links in graphs. Similar to using the imputation techniquesfor missing value inferences, based on existing links, missing linkscan be computationally identified [41, 42]. A common goal of suchtechniques is to find potentially useful missing links (e.g., servingas a bridge that connects two communities in a social network), andfurther fix and verify them by adding back the lost ones [42].
2.4 Missingness in Data UsageThe utility of data for sensemaking activities involve two key types:1) data selection and 2) analytical method selection. The formerrefers to which parts of a given dataset will be selected for analysis.The latter means which analytical methods will be picked and ap-plied to the selected data. Missingness in data usage can happen inboth activities due to uncertainties and selection biases [15, 40]).
Missingness in data selection reveals that not the whole datasetis selected for analysis. For example, to find similar cars, 4 out of100 attributes are selected and the rest remains unused; or instead ofusing all data entities, a dataset is sampled and then analyzed. Whenselected attributes or samples of data entities are not representative(e.g., stratified sampling [38]), missingness exists in data selections.
Missingness in analytical method selection reveals that not afull set of analysis methods is selected. For real-world problems, it isnot easy or sometimes even impossible to identify a complete set ofanalytical methods, this missingness highlights that the performedanalyses are not sufficient. For example, to explore similar cars,just one centroid-based clustering method (i.e., k-means clustering)is used but other clustering techniques that might reveal additionalinsights are not applied.

Figure 4: Compared to listing connections between individual entities(left), it is easier for users to see missing connections when showingthe same data in a matrix with different cell colors (right).
3 A HUMAN-CENTRIC VIEW OF MISSINGNESS
A human-centric view categories missingness at three levels: 1)observed missingness, 2) inferred missingness and 3) ignored miss-ingness. They reveal how the data-centric missingness discussed inSection 2 is perceived by people.
3.1 Observed MissingnessObserved missingness means that users can directly perceive miss-ingness. It indicates that the visibility of missingness is high, andusers can easily notice it. For example, a user quickly realizes that adata value is missing, after she sees an empty cell in a table; or bychecking and following ribbons in a parallel sets [21], a user findsthat there is no connection between two categorical data entities [9].
Because the visibility of missingness is affected by the way thatdata is represented, observed missingness relies on the visual context,in which data is encoded by certain visualizations. Different visualencodings can impact how easily users can observe missingness. Forexample, as is shown in Figure 4, it is easier for users to see missinglinks by looking at a matrix than checking the same data displayedlists of node-pairs. Thus, for observed missingness, users can verifytheir perceived missingness by referring to the given visual context(e.g., pointing to an empty cell).
3.2 Inferred MissingnessInferred missingness refers to that the visibility of missingness goeslow or missingness even gets invisible, so it is impossible for usersto directly observe missingness. However, via an investigation withgiven data, users can infer the possible existence of missingness. Forexample, by reading the following four intelligence reports that aremodified based on the Sign of the Crescent dataset [16]:
“Report on 04/24/2003. Phone calls on 22 April, 2003 made from703-659-2317 to the numbers: 804-759-6302 and 804-774-8920. Atranslation of this message reads: ‘I will be in my office on April 30at 9:OOAM. Try to be on time’.
Report on 01/11/2003. Abdul Ramazi is the owner of the SelectGourmet Foods shop in Springfield Mall, Springfield, VA., with aphone number 703-659-2317.
Report on 03/18/2003. A check with mobile phone providersshows that a Sprint cell phone 804-774-8920 is registered in thename Mukhtar Galab.
Report on 04/14/2003. The contact given by Faysal Goba was:1631 Capitol Ave., Richmond VA; phone number: 804-759-6302.From an interrogation of a cooperative detainee in Guantanamo.Detainee says he trained daily with a man named Faysal Goba at anAl Qaeda explosives training facility in the Sudan in 1994.”
One may infer that the three persons, Abdul Ramazi, MukhtarGalab and Faysal Gobamay collude suspicious activities together.However, this seems missing in the given reports as it was not ex-plicitly reported. Compared to observed missingness, inferred miss-ingness may not be easily verified. Thus, observed missingness ismore confirmative, while inferred missingness is more hypothetical.
3.3 Ignored MissingnessIgnored missingness indicates no observation nor awareness of miss-ingness, or the presence of possible missingness is not considered.It may appear for two reasons. First, the visibility of missingness
is too low to raise user awareness. For example, in Figure 4, a usermay never realize that missing edges exist after looking at lists ofedges. Second, due to some biases or the impact of cognitive capture(or tunneling) [35], users turn a blind eye to possible missingness.For example, to explore possible treatment for a disease, all efforthas been put on the group of people who have been infected by thedisease, while the uninfected group never gets any attention.
While ignored missingness cannot be completely avoided in theanalysis, the ignored missingness, if identified, can bring criticalvalues for sensemaking activities [29]. Based on this, we considerthat ignored missingness is similar to the concept of white space(sometimes also named as opportunity space) discussed in the busi-ness domain [17]. The white space suggests new leads for possiblegrowths of a business. For example, the customers of a credit cardproduct fall into two primary age groups 25-35 and 50-70. Thegap between 35 and 50 reveals a white space. It indicates that thecurrent product seems not attractive for the age group 35-50, giventhe lack of users of that age group. Thus, this white space impliesan opportunity to design a different credit card product with newawarding features for competing in the market of the missing agegroup. While a white space can bring useful values to business, it isusually difficult to discover and may easily slips one’s attention [17](e.g., the missing age group catches no attention at all).
In summary, observed missingness takes the least amount of usereffort to perceive possible missingness; while for ignored missing-ness, users are not aware of the existence of missingness in the wholesensemaking process. For inferred missingness, users can realizemissingness but it takes more effort.
4 HANDLING MISSINGNESS: THE ROLE OF VISUALIZATION
Based on the data-centric and human-centric perspectives of miss-ingness mentioned before, in this section, we discuss four possibleroles of visualizations for supporting missingness handling. The firstand second roles highlight supporting the detection of data-centricmissingness. The other two roles aim to improve user awareness ofdata-related missingness. In summary, visualizations can assist to un-cover the data-centric missingness and improve their expressiveness,so they become more visible and accessible to users.
4.1 Bridging Existing Data and Missing DataVisualizations play a key role of bridging the gap between existingdata and missing data. If we consider existing data as a visible landand missing data as an invisible world, a usable bridge connectingthem is critical to enable users to explore and walk into the invisiblepart from the visible one. This is because users need existing dataas a landing point before digging into the data-centric missingness.However, to enable the analytical transition from the existing datato the missing part, users need the support of necessary informationhints or leads, which can be provided by visualizations [7].
To establish such a bridge, a commonly used strategy is space-filling that reveals missingness as empty (e.g., an empty space in a barchart [36]), gap (e.g., broken lines in a line chart [36]), or different-looking space (e.g., a matrix with different colored cells [13, 41]).The focus of such visualization techniques are on the existing data.As the present data is mapped to certain visual encodings, possiblemissingness gets visible. By looking at the visually salient space,users can be aware of data-centric missingness. Thus, the visualizedexisting data serves critical visual context that enables users toidentify data-related missingness.
4.2 Supporting the Analysis of Analytic ProvenanceVisualizations can serve a usable solution to understand and auditanalytical provenance [22, 30], which is helpful to address missing-ness in data usage. It is challenging for users to keep tracking theprocess of their analyses. In a sensemaking process, some parts ofdata may not receive enough attention and users may miss one or

several possibly applicable methods unintentionally. To help avoidsuch data usage related missingness, visualizations can be used tosupport tracking analytical provenance and further analyze it.
To help identify missingness in data usage, two key aspects needto be considered: 1) the selected, investigated, derived and newlygenerated data, and 2) the method or process applied to such data.They, respectively, correspond to the provenance of data and process[34]. Visualizing them offers a way of analyzing analytic provenance.By checking such visualizations, users may notice missingness indata usage and further realize the limitation of their analyses.
4.3 Improving Awareness: from Ignoring to ObservingFrom a perceptual-oriented perspective, a key role of visualizationis to prevent users from falling in the trap of ignoring data-centricmissingness. The presence of missingness can get more visibleto users via the usage of visualizations than without them, so it ismore likely for users to be aware of missingness. This implies thatusing visualizations can improve the expressiveness of data-centricmissingness. The higher such expressiveness goes, the easier it isfor users to observe possible missingness. Thus, using visualizationsto handle data-centric missingness attempts to move forward fromignoring missingness to being able to observe it.
Proper visual encodings can direct user attention to data-centricmissingness (e.g., missing data values) [36], which may otherwisebe ignored by users. The data-centric missingness is often unknownto users at the initial analysis stage, unless they are informed. Thus, asensemaking process with data-centric missingness is exploratory innature and the original analysis goal may not consider missingnessat all. However, by referring to visualizations used in a sensemakingprocess, users may realize the existence of missingness, which couldhappen at an “aha” moment [23]. This matches both the spontaneousinsight [5] of visual analytics and one of the key characteristics ofvisualization insight – unexpected [25].
4.4 Scaffolding Missingness InferenceVisualizations offer a usable mean to scaffold missingness inference.Different from the other two perceptual levels of missingness (i.e.,observing and ignoring missingness), inferring missingness requiresmore user effort, as possible missingness is not directly revealed butsomehow can be inferred with enough cognitive effort. This can besupported by using visualizations. In this case, instead of merelyencoding missing parts of data or existing parts for the purpose ofindicating the “hole” in data, visualizations may focus on displayingeither the connections across different parts of data or the prove-nance of a sensemaking process. These help users to infer possibleexistence of data-centric missingness.
Since inference is a reasoning process, instead of a static stage,to scaffold missingness inference, multiple types of visualizationsmay be used and fusing information across them can be helpful.For example, by examining connections in a social network graph,checking related organizations, and reading relevant reports, usersmay infer that two suspects colluded some threats together, whichhas never been reported in a given dataset. Thus, visualizations canplay an important role in scaffolding missingness inference, but ithas more complex needs for the design of visualizations.
5 DISCUSSION AND CONCLUSION
While handling missingness remains a challenging problem in sense-making, as an initial exploration, we present a framework that helpsto systematically view and categorize missingness in visual analyt-ics. It highlights considering missingness from two key perspectives:data-centric and human-centric. The former regards missingness inthree data-related categories: data composition, data relationshipand data usage. The latter focuses on the human-perceived missing-ness at three levels: observed missingness, inferred missingness andignored missingness.
Based on the framework, we discuss four possible roles of vi-sualizations for helping to handle missingness in a sensemakingprocess. While this framework lays a preliminary theoretical foun-dation that aims to systematically consider missingness in visualanalytics, to handle missingness in practice, there are three researchthemes that are worthy of future studies: 1) missingness detection,2) missingness visualization and 3) missingness insight.
5.1 Detecting Missingness
Missingness detection lays the foundation for effective data analysis.Detecting missingness is not as simple as it looks like. Unless thereis a clear detection goal or some evidence that reveals something ismissing (e.g., data value), detecting missingness is fundamentallyattempting to address an unknown unknown problem [24]. Thisbrings a deeper question: how can we help users know which typesof data-centric missingness (e.g., missing data attributes, missingdata relationships, or missing data selections in the usage) exist?This is essential as it sets the detection goal. If users were not clearabout this, it would be hard for them to further explore and workon detection methods. Also, a sensemaking process can have mul-tiple types of data-centric missingness. For example, a vulnerablesystem with an interrupted network connection and an incautiouslydesigned logging mechanism can lead to missing both data valuesand attributes. For such cases, detecting missingness is even chal-lenging. The framework presented in this work may help to clarifythe detection goals.
5.2 Visualizing Missingness
The design of missingness-oriented visualizations remains an under-explored direction. Prior work has investigated visual encodings formissing values [13, 14, 36] and missing links [41]. However, thedesign space of visualizing missingness can be broader, especiallyconsidering that there are different categories of data-centric miss-ingness and they may need different visual encodings. As studiedin [36], even for the same type of missingness, different visual en-codings can be designed, which further impacts user-perceived dataquality. How to formalize the design space of missingness visual-izations still needs further explorations. Furthermore, consideringthe evaluation of missingness visualization, how and if possible canwe measure the expressiveness of visual encodings for data-centricmissingness? It enables comparing different designs for visualizingmissingness, which can be helpful to support making design deci-sions. The perceptual-perspective discussed in our framework mayhelp to derive usable measures.
5.3 Discovering Insights from Missingness
Studying possible insights that users gain from missingness in sense-making is a highly sought-after research challenge. Missingness canbe considered as a type of “data” [36] from which users can gainuseful insights. This turns missingness from being considered asdirty [19] to usable. For example, in an intelligence analysis, a miss-ing link between two key suspects may drive the subsequent analysistowards an investigation of any possible connections between them.While this is a simple example, it shows that missingness can beused in a sensemaking process. The insights derived from missing-ness may depend on an application domain and different types ofdata-centric missingness may bring different insights. Moreover,insights discovered from missingness, if possible, via using visualanalytics, may enlarge the set of characteristics of visualization in-sight [25]. This may further broaden our understanding of evaluatingvisualizations by considering the value of missingness.
In summary, we present a framework that provides a systematicview of missingness in visual analytics. We hope this work can drawattention to future studies on visual sensemaking with missingness.

REFERENCES
[1] Poor-quality data imposes costs and risks on businesses, says newforbes insights report. https://www.forbes.com/sites/forbespr/2017/05/31/poor-quality-data-imposes-costs-and-ris
ks-on-businesses-says-new-forbes-insights-report.[2] P. D. Allison. Missing data. Sage publications, 2001.[3] R. Andreasson and M. Riveiro. Effects of visualizing missing data:
an empirical evaluation. In International Conference on InformationVisualisation, pp. 132–138. IEEE, 2014. doi: 10.1109/IV.2014.77
[4] A. N. Baraldi and C. K. Enders. An introduction to modern missingdata analyses. Journal of school psychology, 48(1):5–37, 2010. doi: 10.1016/j.jsp.2009.10.001
[5] R. Chang, C. Ziemkiewicz, T. M. Green, and W. Ribarsky. Defininginsight for visual analytics. IEEE Computer Graphics and Applications,29(2):14–17, 2009. doi: 10.1109/MCG.2009.22
[6] P. P.-S. Chen. The entity-relationship model—toward a unified view ofdata. In Readings in Artificial Intelligence and Databases, pp. 98–111.Elsevier, 1988. doi: 10.1016/B978-0-934613-53-8.50013-3
[7] E. H. Chi, P. Pirolli, K. Chen, and J. Pitkow. Using information scent tomodel user information needs and actions and the web. In Proceedingsof the SIGCHI conference on Human factors in computing systems, pp.490–497, 2001. doi: 10.1145/365024.365325
[8] E. F. Codd. A relational model of data for large shared data banks.Communications of the ACM, 13(6):377–387, 1970. doi: 10.1145/362384.362685
[9] G. Convertino, R. K. Tayi, S. Tomar, M. Gupta, and C. Kakwani.Method, apparatus, and computer-readable medium for missing dataidentification, Aug. 22 2019. US Patent App. 15/901,255.
[10] M. Destandau and J.-D. Fekete. The missing path: Analysing incom-pleteness in knowledge graphs. Information Visualization, 20(1):66–82,2021. doi: 10.1177/1473871621991539
[11] C. Eaton, C. Plaisant, and T. Drizd. Visualizing missing data: Graphinterpretation user study. In IFIP Conference on Human-ComputerInteraction, pp. 861–872. Springer, 2005. doi: 10.1007/11555261 68
[12] B. Efron. Missing data, imputation, and the bootstrap. Journal of theAmerican Statistical Association, 89(426):463–475, 1994. doi: doi.org/10.1080/01621459.1994.10476768
[13] S. J. Fernstad. To identify what is not there: A definition of missingnesspatterns and evaluation of missing value visualization. InformationVisualization, 18(2):230–250, 2019. doi: 10.1177/1473871618785387
[14] S. J. Fernstad and R. C. Glen. Visual analysis of missing data—to seewhat isn’t there. 2014 IEEE Conference on Visual Analytics Science andTechnology, pp. 249–250, 2014. doi: 10.1109/VAST.2014.7042514
[15] J. Heckman. Varieties of selection bias. The American EconomicReview, 80(2):313–318, 1990.
[16] F. Hughes and D. Schum. Discovery-proof-choice, the art and scienceof the process of intelligence analysis-preparing for the future of intel-ligence analysis. Washington, DC: Joint Military Intelligence College,2003.
[17] M. W. Johnson and A. G. Lafley. Seizing the white space: Businessmodel innovation for growth and renewal. Harvard Business Press,2010.
[18] D. Keim, G. Andrienko, J.-D. Fekete, C. Gorg, J. Kohlhammer, andG. Melancon. Visual analytics: Definition, process, and challenges.In Information visualization, pp. 154–175. Springer, 2008. doi: 10.1007/978-3-540-70956-5 7
[19] W. Kim, B.-J. Choi, E.-K. Hong, S.-K. Kim, and D. Lee. A taxonomyof dirty data. Data mining and knowledge discovery, 7(1):81–99, 2003.doi: 10.1023/A:1021564703268
[20] A. King. He spent 27 years wrongly convicted of murder. he wantsto spend the rest of his life encouraging inmates to read. https://www.cnn.com/2018/09/08/health/john-bunn-exonerated
-literacy-trnd/index.html.[21] R. Kosara, F. Bendix, and H. Hauser. Parallel sets: Interactive explo-
ration and visual analysis of categorical data. IEEE Transactions onVisualization and Computer Graphics, 12(4):558–568, 2006. doi: 10.1109/TVCG.2006.76
[22] T. Li, Y. Belghith, C. North, and K. Luther. Crowdtrace: Visualizingprovenance in distributed sensemaking. Proceedings of IEEE VIS 2020,
2020. doi: 10.1109/VIS47514.2020.00045[23] X.-Q. Mai, J. Luo, J.-H. Wu, and Y.-J. Luo. “aha!” effects in a guessing
riddle task: An event-related potential study. Human brain mapping,22(4):261–270, 2004. doi: 10.1002/hbm.20030
[24] T. H. Matta, J. C. Flournoy, and M. L. Byrne. Making an unknown un-known a known unknown: Missing data in longitudinal neuroimagingstudies. Developmental cognitive neuroscience, 33:83–98, 2018. doi:10.1016/j.dcn.2017.10.001
[25] C. North. Toward measuring visualization insight. IEEE computergraphics and applications, 26(3):6–9, 2006. doi: 10.1109/MCG.2006.70
[26] I. Ogrodnik. Missing student wrongly linked to boston marathonbombing found dead. https://globalnews.ca/news/510378/.
[27] R. K. Pearson. The problem of disguised missing data. Acm SigkddExplorations Newsletter, 8(1):83–92, 2006. doi: 10.1145/1147234.1147247
[28] T. D. Pigott. A review of methods for missing data. Educationalresearch and evaluation, 7(4):353–383, 2001. doi: 10.1076/edre.7.4.353.8937
[29] P. Pirolli and S. Card. The sensemaking process and leverage pointsfor analyst technology as identified through cognitive task analysis. InProceedings of international conference on intelligence analysis, vol. 5,pp. 2–4. McLean, VA, USA, 2005.
[30] E. D. Ragan, A. Endert, J. Sanyal, and J. Chen. Characterizing prove-nance in visualization and data analysis: an organizational frameworkof provenance types and purposes. IEEE transactions on visualizationand computer graphics, 22(1):31–40, 2015. doi: 10.1109/TVCG.2015.2467551
[31] D. B. Rubin. Inference and missing data. Biometrika, 63(3):581–592,1976.
[32] M. S. Santos, R. C. Pereira, A. F. Costa, J. P. Soares, J. Santos, and P. H.Abreu. Generating synthetic missing data: A review by missing mech-anism. IEEE Access, 7:11651–11667, 2019. doi: 10.1109/ACCESS.2019.2891360
[33] J. L. Schafer and J. W. Graham. Missing data: our view of the stateof the art. Psychological methods, 7(2):147, 2002. doi: 10.1037/1082-989X.7.2.147
[34] Y. L. Simmhan, B. Plale, D. Gannon, and S. Marru. Performanceevaluation of the karma provenance framework for scientific workflows.In International Provenance and Annotation Workshop, pp. 222–236.Springer, 2006. doi: 10.1007/11890850 23
[35] D. J. Simons and C. F. Chabris. Gorillas in our midst: Sustainedinattentional blindness for dynamic events. perception, 28(9):1059–1074, 1999. doi: 10.1068/p281059
[36] H. Song and D. A. Szafir. Where’s my data? evaluating visualizationswith missing data. IEEE transactions on visualization and computergraphics, 25(1):914–924, 2018. doi: 10.1109/TVCG.2018.2864914
[37] M. Sun, G. Convertino, and M. Detweiler. Designing a unified cloudlog analytics platform. In International Conference on CollaborationTechnologies and Systems, pp. 257–266. IEEE, 2016. doi: 10.1109/CTS.2016.0057
[38] J. E. Trost. Statistically nonrepresentative stratified sampling: A sam-pling technique for qualitative studies. Qualitative sociology, 9(1):54–57, 1986. doi: 10.1007/BF00988249
[39] E. Wall, L. M. Blaha, L. Franklin, and A. Endert. Warning, bias mayoccur: A proposed approach to detecting cognitive bias in interactivevisual analytics. In IEEE Conference on Visual Analytics Scienceand Technology, pp. 104–115. IEEE, 2017. doi: 10.1109/VAST.2017.8585669
[40] E. Wall, J. Stasko, and A. Endert. Toward a design space for mitigatingcognitive bias in vis. In 2019 IEEE Visualization Conference (VIS), pp.111–115. IEEE, 2019. doi: 10.1109/VISUAL.2019.8933611
[41] J. Zhao, M. Sun, F. Chen, and P. Chiu. Missbin: Visual analysisof missing links in bipartite networks. In 2019 IEEE VisualizationConference (VIS), pp. 71–75. IEEE, 2019. doi: 10.1109/VISUAL.2019.8933639
[42] J. Zhao, M. Sun, F. Chen, and P. Chui. Understanding missing links inbipartite networks with missbin. IEEE Transactions on Visualizationand Computer Graphics, 2020. doi: 10.1109/TVCG.2020.3032984