tourist arrival quarterly report
TRANSCRIPT
1 | P a g e
Research and Statistics Department Ministry of Tourism, Economic Development, Investment & Energy
Statistics Division
2015 January - March
Facilitating Informed Decision Making!
ANTIGUA & BARBUDA
MINISTRY OF FINANCE & THE ECONOMY
TOURIST ARRIVAL QUARTERLY REPORT
2 | P a g e
Foreword
This report provides a quantitative analysis of visitors to Antigua and Barbuda for the first quarter of 2015.
The quantitative data was collected from the immigration cards of arriving passengers, via ports at V.C. Bird
International Airport, Nelson Dockyard, Jolly Harbour, Deep Water Harbour, Heritage Quay, and Barbuda.
The data was compiled by the Research and Statistics Department in the Ministry of Tourism, Economic
Development, Investment & Energy, in collaboration with the Statistics Division within the Ministry of
Trade, Commerce and Industry, Sports, Culture and National Festivals. The report was produced through
the collaborative efforts of Tourism Research Officers Avonelle Alfred and Stosh Browne, as well as Tourism
Statistician Marissa Scott.
3 | P a g e
TABLE OF CONTENTS
Overview 4
Air Arrivals 5
Air Arrivals by Market 7
Length of Stay 9
Arrivals by Purpose of Visit 10
Sea Arrivals 11
Summary 12
4 | P a g e
Overview
This report is an overview of the first quarter (QTR1) visitor arrivals by both air and sea to Antigua and
Barbuda for the years 2011-2015. Also provided are comparisons between visitor arrivals for the years 2014
and 2015 during the same period. Visitors are classified as persons who stay more than 24 hours, but less
than one year, within a country outside of their usual country of residence. Persons who are in transit
and/or spend less than a day are not classified as visitors. Total sea arrivals are comprised of tourists
arriving by cruise and yacht, with cruise visitors spending less than a day, and yacht visitors a day or more.
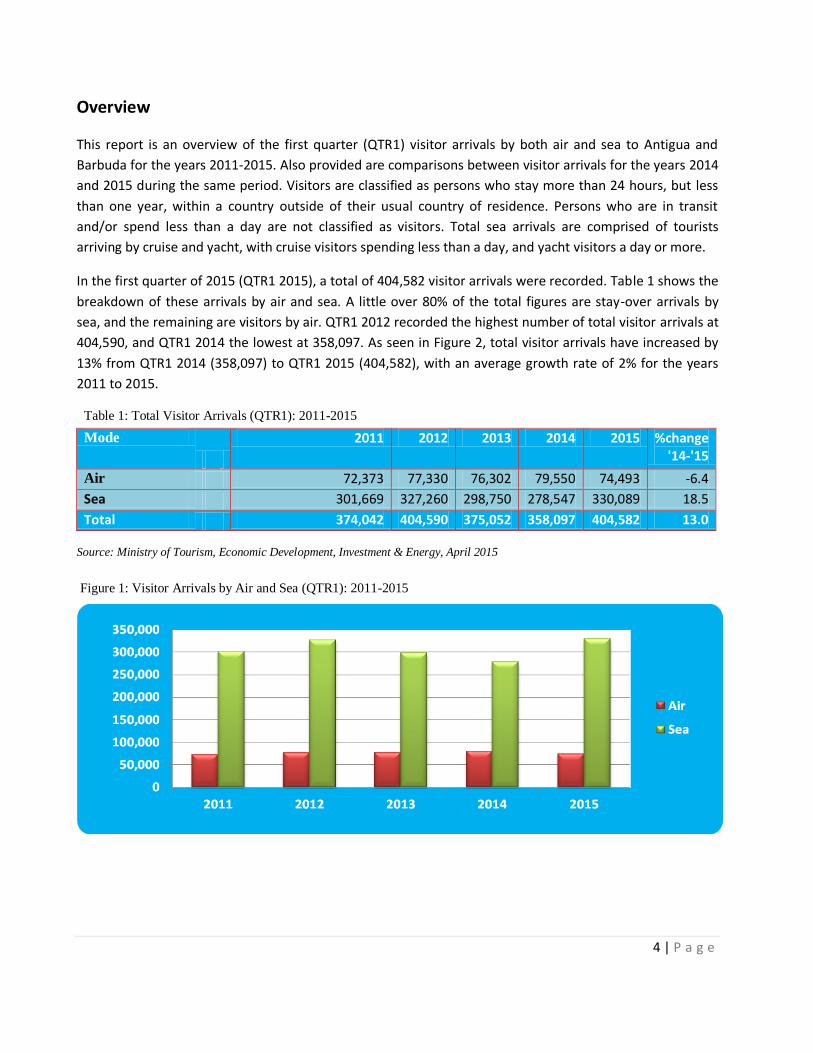
In the first quarter of 2015 (QTR1 2015), a total of 404,582 visitor arrivals were recorded. Table 1 shows the
breakdown of these arrivals by air and sea. A little over 80% of the total figures are stay-over arrivals by
sea, and the remaining are visitors by air. QTR1 2012 recorded the highest number of total visitor arrivals at
404,590, and QTR1 2014 the lowest at 358,097. As seen in Figure 2, total visitor arrivals have increased by
13% from QTR1 2014 (358,097) to QTR1 2015 (404,582), with an average growth rate of 2% for the years
2011 to 2015.
Table 1: Total Visitor Arrivals (QTR1): 2011-2015
Mode
2011 2012 2013 2014 2015 %change '14-'15
Air 72,373 77,330 76,302 79,550 74,493 -6.4
Sea 301,669 327,260 298,750 278,547 330,089 18.5
Total 374,042 404,590 375,052 358,097 404,582 13.0
Source: Ministry of Tourism, Economic Development, Investment & Energy, April 2015
Figure 1: Visitor Arrivals by Air and Sea (QTR1): 2011-2015

5 | P a g e
Figure 2: Total Visitor Arrivals Compared to Arrivals by Air and Sea (QTR1): 2011-2015
Air Arrivals
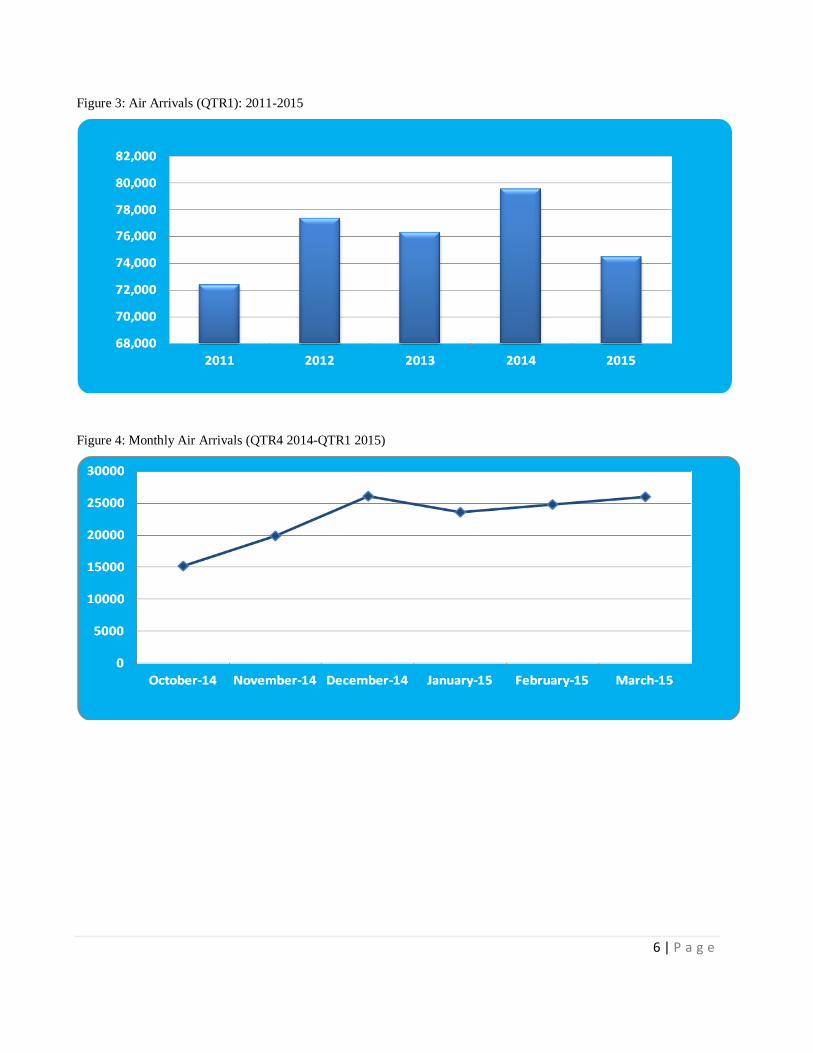
The first quarter of 2015 recorded 74,493 visitor arrivals by air to Antigua, 6.4% less than the same period
of 2014. The trend for the first quarter has been fairly consistent with the first quarter of 2011-2014, with
the 2014 quarter recording the highest air arrivals at 79,550. The average growth rate for this period during
2011 to 2015 is 1%. March 2015 recorded the highest number of visitor air arrivals in QTR1 2015, at 26,048.
Figure 4 shows the transition from the QTR4 2014 into QTR1 2015. Following a continuous rise in QTR4
2014, there was a significant decline to start QTR1 2015 but February and March 2015 saw a steady rise.
Table 2: Monthly Air Arrivals (QTR1): 2014-2015
January February March Q12014 January February March Q12015
25,920
26,842
26,788
79,550
23,637
24,808
26,048
74,493
Source: Ministry of Tourism, Economic Development, Investment & Energy, April 2015
6 | P a g e
Figure 3: Air Arrivals (QTR1): 2011-2015
Figure 4: Monthly Air Arrivals (QTR4 2014-QTR1 2015)
7 | P a g e
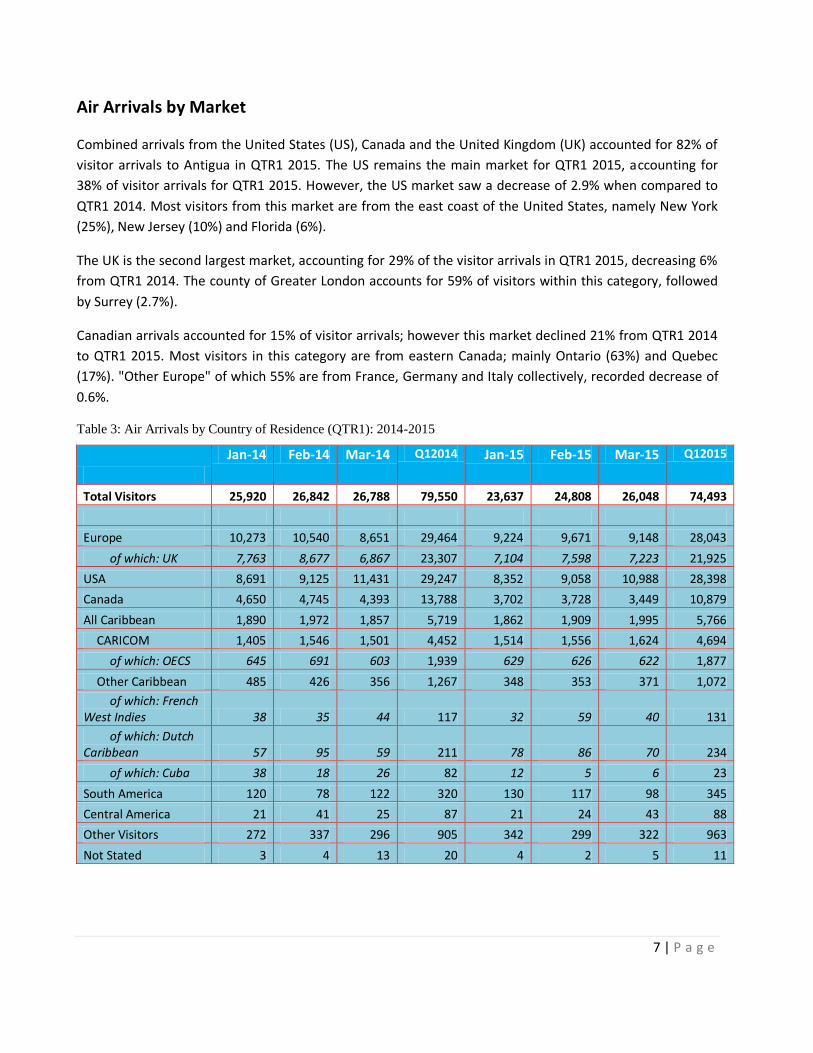
Air Arrivals by Market
Combined arrivals from the United States (US), Canada and the United Kingdom (UK) accounted for 82% of
visitor arrivals to Antigua in QTR1 2015. The US remains the main market for QTR1 2015, accounting for
38% of visitor arrivals for QTR1 2015. However, the US market saw a decrease of 2.9% when compared to
QTR1 2014. Most visitors from this market are from the east coast of the United States, namely New York
(25%), New Jersey (10%) and Florida (6%).
The UK is the second largest market, accounting for 29% of the visitor arrivals in QTR1 2015, decreasing 6%
from QTR1 2014. The county of Greater London accounts for 59% of visitors within this category, followed
by Surrey (2.7%).
Canadian arrivals accounted for 15% of visitor arrivals; however this market declined 21% from QTR1 2014
to QTR1 2015. Most visitors in this category are from eastern Canada; mainly Ontario (63%) and Quebec
(17%). "Other Europe" of which 55% are from France, Germany and Italy collectively, recorded decrease of
0.6%.
Table 3: Air Arrivals by Country of Residence (QTR1): 2014-2015
Jan-14 Feb-14 Mar-14 Q12014 Jan-15 Feb-15 Mar-15 Q12015
Total Visitors 25,920 26,842 26,788 79,550 23,637 24,808 26,048 74,493
Europe 10,273 10,540 8,651 29,464 9,224 9,671 9,148 28,043
of which: UK 7,763 8,677 6,867 23,307 7,104 7,598 7,223 21,925
USA 8,691 9,125 11,431 29,247 8,352 9,058 10,988 28,398
Canada 4,650 4,745 4,393 13,788 3,702 3,728 3,449 10,879
All Caribbean 1,890 1,972 1,857 5,719 1,862 1,909 1,995 5,766
CARICOM 1,405 1,546 1,501 4,452 1,514 1,556 1,624 4,694
of which: OECS 645 691 603 1,939 629 626 622 1,877
Other Caribbean 485 426 356 1,267 348 353 371 1,072
of which: French West Indies 38 35 44 117 32 59 40 131
of which: Dutch Caribbean 57 95 59 211 78 86 70 234
of which: Cuba 38 18 26 82 12 5 6 23
South America 120 78 122 320 130 117 98 345
Central America 21 41 25 87 21 24 43 88
Other Visitors 272 337 296 905 342 299 322 963
Not Stated 3 4 13 20 4 2 5 11

8 | P a g e
Figure 5: Air Arrivals by Country of Residence (QTR1): 2014-2015
Figure 6: Air Arrivals by Country of Residence (QTR1): 2015

9 | P a g e
Length of Stay
Figure 7 shows that more than half of the visitors spent 4-7days. This is followed by 30% of visitors
recorded to have spent 8-14 days, followed by 8% spending 15+ days and 1-3days, respectively. The
average length of stay for the period under review is 10.3 days.
Figure 7: Length of Stay (QTR1) 2015
10 | P a g e
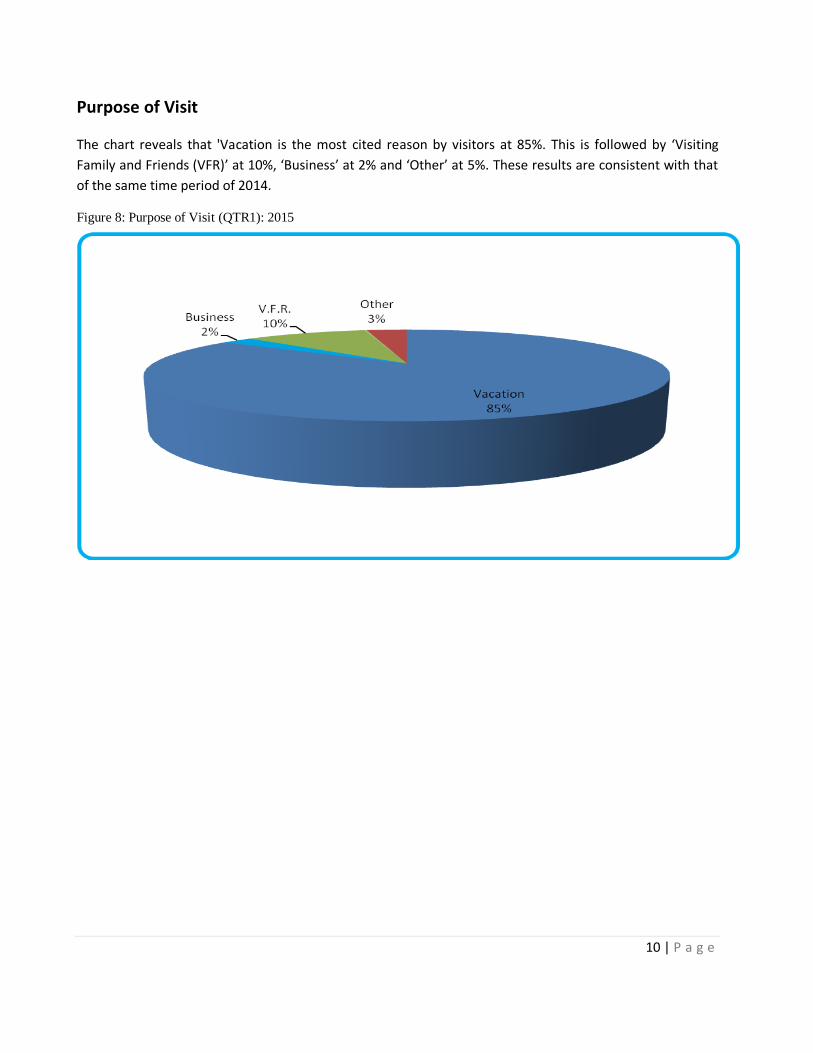
Purpose of Visit
The chart reveals that 'Vacation is the most cited reason by visitors at 85%. This is followed by ‘Visiting
Family and Friends (VFR)’ at 10%, ‘Business’ at 2% and ‘Other’ at 5%. These results are consistent with that
of the same time period of 2014.
Figure 8: Purpose of Visit (QTR1): 2015
11 | P a g e
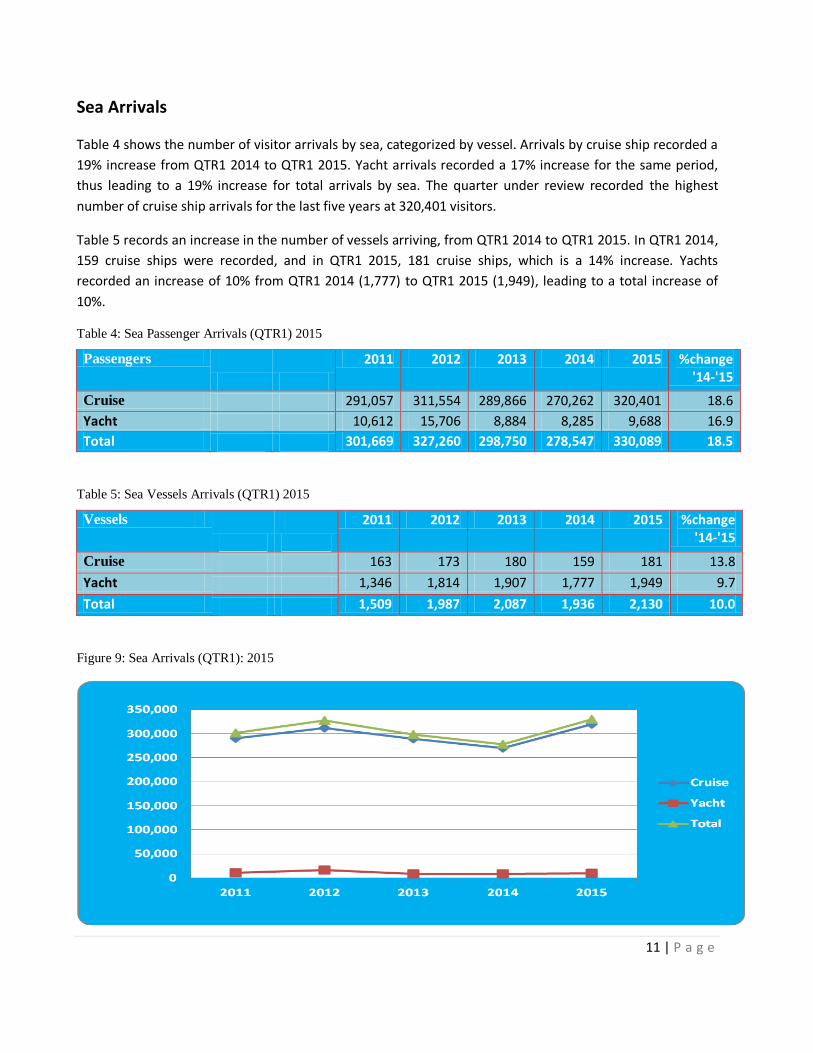
Sea Arrivals
Table 4 shows the number of visitor arrivals by sea, categorized by vessel. Arrivals by cruise ship recorded a
19% increase from QTR1 2014 to QTR1 2015. Yacht arrivals recorded a 17% increase for the same period,
thus leading to a 19% increase for total arrivals by sea. The quarter under review recorded the highest
number of cruise ship arrivals for the last five years at 320,401 visitors.
Table 5 records an increase in the number of vessels arriving, from QTR1 2014 to QTR1 2015. In QTR1 2014,
159 cruise ships were recorded, and in QTR1 2015, 181 cruise ships, which is a 14% increase. Yachts
recorded an increase of 10% from QTR1 2014 (1,777) to QTR1 2015 (1,949), leading to a total increase of
10%.
Table 4: Sea Passenger Arrivals (QTR1) 2015
Passengers
2011 2012 2013 2014 2015 %change '14-'15
Cruise 291,057 311,554 289,866 270,262 320,401 18.6
Yacht 10,612 15,706 8,884 8,285 9,688 16.9
Total 301,669 327,260 298,750 278,547 330,089 18.5
Table 5: Sea Vessels Arrivals (QTR1) 2015
Vessels
2011 2012 2013 2014 2015 %change '14-'15
Cruise 163 173 180 159 181 13.8
Yacht 1,346 1,814 1,907 1,777 1,949 9.7
Total 1,509 1,987 2,087 1,936 2,130 10.0
Figure 9: Sea Arrivals (QTR1): 2015
12 | P a g e
Summary Despite a decline in Air arrivals of 6.4%, in QTR1 of 2015, the period saw an increase in overall tourist
arrivals of 13 percent. This is as a result of an 18.5% increase in passenger arrivals by sea.
Sources:
Ministry of Tourism, Economic Development, Investment and
Energy
V.C. Bird International Airport
Nelson Dockyard
Jolly Harbour
Deep Water Harbour
Heritage Quay
Barbuda

13 | P a g e