torben environmental assessment of biowaste management v2 · unforgettable. roberto, vincent, vero,...
TRANSCRIPT

General rights Copyright and moral rights for the publications made accessible in the public portal are retained by the authors and/or other copyright owners and it is a condition of accessing publications that users recognise and abide by the legal requirements associated with these rights.
Users may download and print one copy of any publication from the public portal for the purpose of private study or research.
You may not further distribute the material or use it for any profit-making activity or commercial gain
You may freely distribute the URL identifying the publication in the public portal If you believe that this document breaches copyright please contact us providing details, and we will remove access to the work immediately and investigate your claim.
Downloaded from orbit.dtu.dk on: Jan 08, 2020
Environmental assessment of biowaste management in the Danish-German borderregion
Jensen, Morten Bang
Publication date:2016
Document VersionPublisher's PDF, also known as Version of record
Link back to DTU Orbit
Citation (APA):Jensen, M. B. (2016). Environmental assessment of biowaste management in the Danish-German borderregion. Kgs. Lyngby: Technical University of Denmark, DTU Environment.
PhD ThesisMarch 2016
Morten Bang Jensen
Environmental assessment of biowaste management
in the Danish-German border region

Environmental assessment of biowaste management in the Danish-German
border region
Morten Bang Jensen
PhD Thesis March 2016
DTU Environment Department of Environmental Engineering
Technical University of Denmark
DTU Environment
March 2016
Department of Environmental Engineering
Technical University of Denmark
Miljoevej, building 113
2800 Kgs. Lyngby
Denmark
+45 4525 1600
+45 4593 2850
http://www.env.dtu.dk
GraphicCo
Torben Dolin
Address:
Phone reception:
Fax:
Homepage:
E-mail:
Printed by:
Cover:
Morten Bang Jensen
Environmental assessment of biowaste management
in the Danish-German border region
PhD Thesis, March 2016
The synopsis part of this thesis is available as a pdf-file for download from the
DTU research database ORBIT: http://www.orbit.dtu.dk
i
Preface The thesis is organised in two parts: the first puts into context the findings of the PhD in an introductive review, while the second part consists of the papers listed below. These will be referred to in the text by their paper number, written with the Roman numerals I-IV.
I Jensen, M. B., Møller, J. & Scheutz, C. 2016. Comparison of the organic waste management systems in the Danish-German border region using life cycle assessment (LCA). Waste Management. DOI: 10.1016/j.wasman.2016.01.035
II Jensen, M. B., Møller, J. & Scheutz, C. 2016. Life cycle assessment (LCA) as an environmental planning tool for an organic waste management system in the Danish-German border region. Submitted to Waste Management.
III Jensen, M. B., Møller, J. & Scheutz, C. 2016. Assessment of a combined anaerobic and aerobic treatment facility for source-separated organic household waste using material and substance flow analysis and life cycle inventory. Submitted to Waste Management.
IV Jensen, M. B., Møller, J., Mønster, J. & Scheutz, C. 2016. Quantification of greenhouse gas emissions from a biological waste treatment facility. Submitted to Waste Management.
In this online version of the thesis, papers I-IV are not included but can be obtained from electronic article databases, e.g. via www.orbit.dtu.dk or on request from DTU Environment, Technical University of Denmark, Miljoevej, Building 113, 2800 Kgs. Lyngby, Denmark, [email protected].
ii
In addition, the following publications, not included in this thesis, were also concluded during this PhD study:
Jensen, M. B., Scheutz, C. & Møller, J. (2013). Meeting EU recycling targets by introducing a two-compartment bin to households. Proceedings Sardinia 2013, Fourteenth International Waste Management and Landfill Symposium.
Brogaard, L. K-S., Damgaard, A., Jensen, M. B., Barlaz, M. & Christensen, T. H. 2014. Evaluation of life cycle inventory data for recycling systems. Resources, conservation and recycling, 87, 30-45.
Jensen, M. B., Møller, J. & Scheutz, C. 2015. Miljøvurdering (LCA) af fremtidige behandlingsmuligheder for organisk affald fra husholdninger i den dansk-tyske grænseregion.
Edjabou, V. M. E., Jensen, M. B., Götze, R., Pivnenko, K., Petersen, C., Scheutz, C. & Astrup T. F. 2015. Municipal solid waste composition: Sampling methodology, statistical analyses, and case study evaluation. Waste management, 36, 12-23.
Mønster, J., Jensen, M. B. & Scheutz, C. 2015. Quantification of methane and nitrous oxide emissions from the Borgstedt waste treatment facility, Germany. Technical report.
Jensen, M. B., Scheutz, C. & Møller, J. (2015). Comparison of the Organic Waste Management System in the Danish-German Border Region using Life Cycle Assessment (LCA). Hong Kong International Conference on Solid Waste 2015, Knowledge Transfer for Sustainable Resource Management. Poster.
iii
Acknowledgements Firstly, I would like to express my sincere gratitude to my supervisors Charlotte Scheutz and Jacob Møller, for their unique support and guidance throughout my PhD study. Their passion and enthusiasm have been constant sources of inspiration and encouragement.
Major thanks also go out to the Arwos, Provas, Sønderborg Forsyning, Abfallwirtschaft Rendsburg-Eckernförde and Abfallwirtschaft Schleswig-Flensburg, who made the PhD possible, and specifically thanks go out to Bjarke Korsager, Annette Nielsen, Conny Barsballe, Thomas Wind, Jette Bøjskov, Aksel Busse and Heiko Ewen. Furthermore, special thanks go out to Jens Born from Flensburg University of Applied Science for helping with the German literature. Maabjergværket, Sønderborg Kraftvarmeværk, TAS, Kiel Forbrænding, Neumünster MBT, Borgstedtfelde, AIKAN, Komtek and Econet all deserve a thank you for providing most of the data used in the PhD. Special gratitude is extended to Ralph Hohenschurz and his staff, for letting me experiment at his facility, and to Stinne Stokkebo, for keeping my mood up and supporting me throughout the PhD period.
I also need to thank all of my colleagues at DTU for making my time here unforgettable. Roberto, Vincent, Vero, Kos and Line especially have helped me out tremendously. Ramona in particular deserves a special thanks, as she has kept up with me in the office for three years and continued to support me and we have shared (mainly her) thoughts.
My friends and family also deserves a major thank you! Jakob and Jesper for helping me and understanding the difficult times I have been through. Sjønne, Chrill and Svingel for taking my thoughts away from DTU whenever we went on trips! Mads and Teis for helping me settle in Copenhagen and feel welcome from the beginning. My mom and dad, Jose, Anne, Thomas, Helle, Mikkel and Karina all deserve special thanks for keeping my mind on what is important in life!
Finally, I have to thank the love of my life, Lies, who has given me so much and is now going to give me my first child! You have kept my mood high throughout the entire PhD, been supportive (even though I did not always show my appreciation) and taught me how to prioritise.
iv
Summary The treatment of organic waste from households has gained significant interest in recent years. Each country in the EU and the rest of the world treat their organic waste in many different ways, and Denmark and Germany are no exemption in this regard. The treatment of household organic waste in these two countries has taken a very different turn in the last century. Denmark has been incinerating organic household waste as part of a residual waste policy for more than a century, but it has only attempted biological treatment to a limited extent. Germany, on the other hand, has focused intensely on source separation followed by biological treatment and a mixture of incineration and mechanical and biological treatment for any organic matter remaining in residual waste. In recent years, Denmark has increased its focus on moving away from incineration and increasing material recycling, both on its own initiative and also incentivised by the EU’s 50% recycling target for 2020. This focus includes recycling organic waste from households as well as dry recyclable waste fractions.
This PhD project was carried out as a cross-border partnership with five waste management companies, three located in Denmark and two in Germany, all with the wish to increase the source separation and treatment of organic household waste. The current practice in the Danish border region does not include source separation, and all organic household waste is incinerated as part of the residual waste. The German region already has a well-established source separation system, but it wants to increase its efficiency.
The main aim of this Ph.D. thesis was to compare current organic waste management systems across the Danish-German border with future scenarios intended for the treatment of organic waste using LCA. The outcome of the project was a recommendation to waste management companies through life cycle assessment and experimental work at a biological treatment plant.
A major part of the PhD study was collecting data on all aspects of the waste management chain. Waste generation through to collection, transportation, treatment and final disposal were analysed. The most detailed analysis took place at a combined biogas and composting plant, where solid and liquid samples were taken and air emissions measured through whole-site fugitive emissions. The assessments were done by using a combination of material
v
flow analysis, substance flow analysis, life cycle inventories and life cycle assessments, using the EASETECH modelling software.
The life cycle assessment assessed the management of organic household waste in the Danish-German border region. The main output was a life cycle assessment showing large differences in the environmental performance of the two different regions, with the Danish region performing better in most impact categories. Furthermore, the importance of the energy systems was investigated, showing that a large influence on the results was the surrounding energy system. Besides comparing the two regions’ current performances to each other, they were compared to four future scenarios featuring increased source separation and different biological treatments. In this case the life cycle assessment was used as a planning tool for a future waste management system where environmental hotspots could be identified for both current and possible future systems. In all cases, the results showed that local conditions can play a major role in where the system can be improved, and conclusions made on an overall level (all five waste management companies together) can lead to suboptimal decisions; it is therefore important to look at each waste management company individually. Major differences in environmental performance were seen when changing from incineration or mechanical and biological treatment to biological treatment, such as increased savings of phosphorous and increased loadings of ammonia. Most important for the environmental performance of the biological treatment facilities were high biogas production and low fugitive methane, nitrous oxide and ammonia emissions.
Fugitive emissions measured at a combined biogas and composting plant were very significant and led to a turnaround in the environmental performance of the plant, going from a saving in greenhouse gas potential to a loading when including the measured emissions and applying the life cycle assessment principles.
Ultimately, increasing the source separation of organic household waste for the five waste management companies is a viable option, if the focus of the companies is on flexible fuel (biogas), compost production and subsequent resource savings. However, the picture is not clear, as the current waste management system (mainly incineration) is already working well, and in some cases it outperforms the biological treatment option.
vi
Dansk sammenfatning De seneste år har der været et øget politisk fokus på behandling af organisk husholdningsaffald, der samtidigt behandles forskelligt fra land til land. I Danmark og Tyskland har behandlingen af organisk husholdningsaffald taget en meget anderledes drejning i det sidste århundrede. I Danmark indsamles det organiske husholdningsaffald som en del af restaffaldet, som primært for-brændes, og biologisk behandling er kun forsøgt i begrænset omfang. Tysk-land derimod har fokuseret kraftigt på kildesortering med efterfølgende bio-logisk behandling og en blanding af forbrænding og mekanisk-biologisk be-handling af det organiske husholdningsaffald i restaffaldet. Danmark har i de senere år øget fokus på at bevæge sig væk fra affaldsforbrænding og i stedet øge materialegenanvendelse, både på eget initiativ, men også drevet af EU’s mål på 50% genanvendelse i 2020. Dette fokus omfatter genanvendelse af organisk husholdningsaffald samt tørre affaldsfraktioner.
Dette ph.d.-projekt blev gennemført som et partnerskab mellem Danmark Tekniske Universitet og fem affaldshåndteringsselskaber på tværs af den dansk-tyske grænse, tre i Danmark og to i Tyskland, alle med ønsket om at øge kildesortering og adskilt behandling af det organiske husholdningsaffald. Den nuværende praksis på det danske område omfatter ikke kildesortering, og alt organisk husholdningsaffald forbrændes som en del af restaffaldet. Den tyske region har allerede en veletableret kildesortering, men ønsker at øge denne. Gennem livscyklusvurderinger og eksperimentelt arbejde på et kom-bineret biogas- og komposteringsanlæg, er resultatet af projektet blevet en anbefaling til affaldsselskaberne vedrørende øget genanvendelse af det orga-niske husholdningsaffald.
En stor del af ph.d.-studiet var indsamling af data om alle aspekter af affalds-håndteringskæden. Alt fra affaldsmængder over indsamling og transport til behandling og endelig bortskaffelse blev analyseret. Den mest detaljerede analyse fandt sted på et kombineret biogas- og komposteringsanlæg, hvor fa-ste og flydende prøver blev taget og diffuse luftemissioner blev målt.
Livscyklusvurdering vurderer håndteringen af det organiske husholdningsaf-fald i den dansk-tyske grænseregion. Det vigtigste resultat af livscyklusvur-deringen viser store forskelle i de miljømæssige effekter af de to forskellige regioner, hvor den danske region klarer sig bedst i de fleste påvirkningskate-gorier. Desuden er betydningen af energisystemerne undersøgt og viser, at resultaterne i høj grad er afhængige af det omgivende energisystem. Udover
vii
at sammenligne de to regioners aktuelle miljøpåvirkning med hinanden, blev de sammenlignet med fire fremtidsscenarier med øget kildesortering og for-skellige biologiske behandlinger. Denne livscyklusvurdering er i dette tilfæl-de brugt som et planlægningsværktøj for det fremtidige affaldshåndteringssy-stem og til at identificere miljømæssige hotspots for både nuværende og mu-lige fremtidige systemer. I alle tilfælde viser resultaterne, at lokale forhold spiller en stor rolle for, hvordan systemet kan forbedres; konklusioner på et for overordnet niveau (alle fem affaldsselskaber sammen) kan føre til dårlige beslutninger, og det er vigtigt at se på hver affaldshåndteringsvirksomhed for sig. Vigtigst for de biologiske behandlingsanlæg er en høj produktion af bio-gas og lave emissioner (diffuse og direkte) af metan, lattergas og ammoniak.
De diffuse emissioner målt ved et kombineret biogas- og komposteringsanlæg var meget væsentlige og en livscyklusvurdering førte til at anlægget, går fra at være en miljømæssig gevinst til en belastning i miljøpåvirkningskategorien ”Global opvarmning”.
I sidste ende er øget kildesortering af organisk dagrenovation for de fem af-faldsselskaber en realistisk mulighed, hvis fokus for virksomhederne er flek-sibelt brændstof (biogas), kompostproduktion og deraf følgende ressourcebe-sparelser. Men billedet er ikke krystalklart, da den nuværende affaldsbehand-ling, hovedsagligt forbrænding, allerede fungerer godt, og i nogle tilfælde udkonkurrerer den biologiske behandling.
viii
Table of contents Preface ............................................................................................................ i
Acknowledgements ...................................................................................... iii
Summary ...................................................................................................... iv
Dansk sammenfatning ................................................................................. vi
Table of contents ....................................................................................... viii
Abbreviations................................................................................................ x
1 Background ............................................................................................. 1 1.1 Generation and treatment of organic waste in Denmark and Germany .......... 1 1.2 Life cycle assessment and organic waste management .................................. 2 1.3 Aim of the thesis ........................................................................................... 3 1.4 Industrial PhD............................................................................................... 4
2 Methods and tools ................................................................................... 7 2.1 Life Cycle Assessment .................................................................................. 7
2.1.1 EASETECH ..................................................................................................8
2.2 STAN ........................................................................................................... 9 2.3 Experimental work – material sampling and emission measurements ......... 10
2.3.1 Sampling campaign on a combined biogas and composting facility ............. 10 2.3.2 Whole-site fugitive emissions measurement campaign ................................ 13
2.4 Data collection ............................................................................................ 15 2.4.1 Waste generation and composition .............................................................. 17 2.4.2 Collection and transportation ....................................................................... 17 2.4.3 Treatment facilities ...................................................................................... 18 2.4.4 Residual products and substitution .............................................................. 20
3 Environmental assessment of organic waste management ................. 23 3.1 LCA case study ........................................................................................... 23
3.1.1 Goal and scope ............................................................................................ 24 3.1.2 Functional unit ............................................................................................ 24 3.1.3 Temporal scope ........................................................................................... 24 3.1.4 System boundaries ....................................................................................... 24 3.1.5 Data quality ................................................................................................. 25 3.1.6 System expansion and allocation ................................................................. 25 3.1.7 LCA method and impact categories ............................................................. 25 3.1.8 Modelling and assumptions ......................................................................... 26 3.1.9 LCA results ................................................................................................. 29
3.2 LCI and transfer coefficients ...................................................................... 36 3.2.1 MFA and SFA ............................................................................................. 36 3.2.2 Material and substance flow analysis ........................................................... 37

ix
3.3 Whole-site fugitive emissions ..................................................................... 39 3.4 Whole-site fugitive emissions coupled with an LCA for GHG emissions ... 44
3.4.1 LCI update .................................................................................................. 45 3.4.2 LCA update ................................................................................................. 45
4 Conclusions and recommendations ...................................................... 49 4.1 Organic waste management ........................................................................ 49 4.2 Recommendations ...................................................................................... 50
5 Further research ................................................................................... 51
6 References .............................................................................................. 53
7 Papers .................................................................................................... 59
x
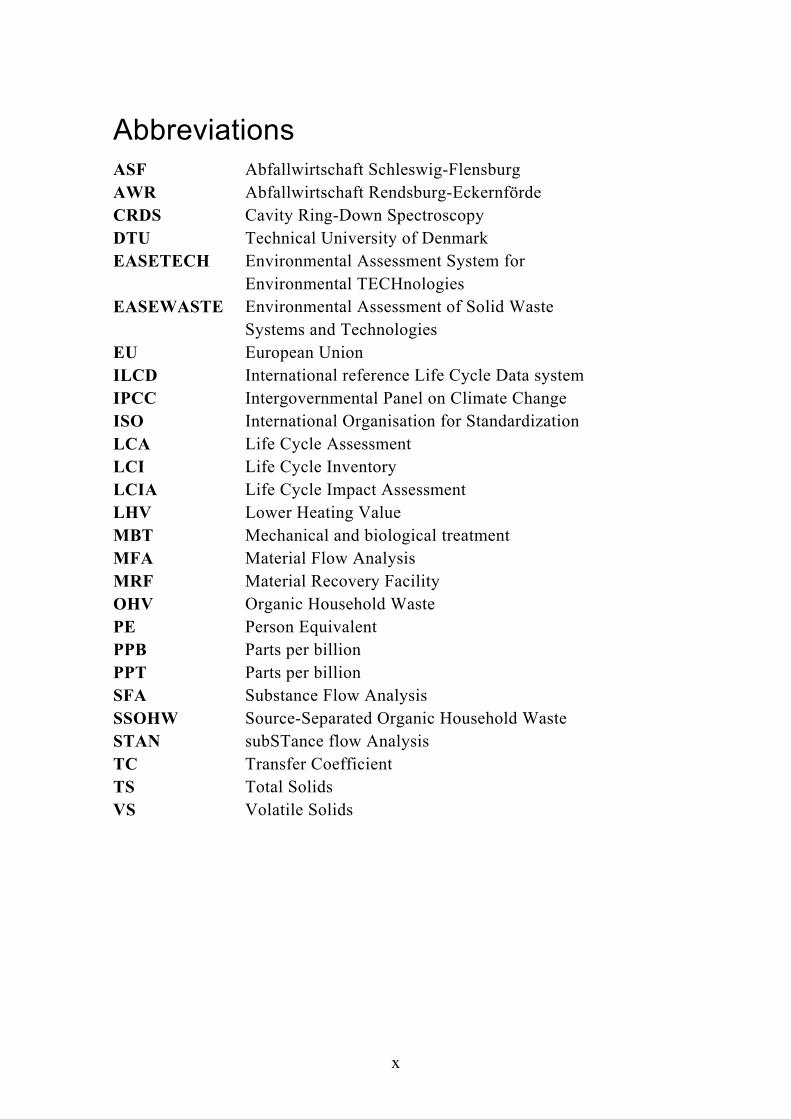
Abbreviations ASF Abfallwirtschaft Schleswig-Flensburg AWR Abfallwirtschaft Rendsburg-Eckernförde CRDS Cavity Ring-Down Spectroscopy DTU Technical University of Denmark EASETECH Environmental Assessment System for
Environmental TECHnologies EASEWASTE Environmental Assessment of Solid Waste
Systems and Technologies EU European Union ILCD International reference Life Cycle Data system IPCC Intergovernmental Panel on Climate Change ISO International Organisation for Standardization LCA Life Cycle Assessment LCI Life Cycle Inventory LCIA Life Cycle Impact Assessment LHV Lower Heating Value MBT Mechanical and biological treatment MFA Material Flow Analysis MRF Material Recovery Facility OHV Organic Household Waste PE Person Equivalent PPB Parts per billion PPT Parts per billion SFA Substance Flow Analysis SSOHW Source-Separated Organic Household Waste STAN subSTance flow Analysis TC Transfer Coefficient TS Total Solids VS Volatile Solids
1
1 Background
1.1 Generation and treatment of organic waste in Denmark and Germany
Organic household waste in recent years has gained increasing attention, and EU recycling targets of 50% (European Parliament, 2008) have only in-creased this interest. Specifically concerning biowaste, EU member states must take measures to encourage: (a) the separate collection of biowaste for, e.g., composting and anaerobic digestion, (b) the treatment of biowaste in a way that fulfils a high level of environmental protection and (c) the use of environmentally safe materials produced from biowaste (European Parliament, 2008). The amount of biowaste produced in the EU is currently between 118 and 138 million tonnes annually, and approximately 70% of this is found in municipal refuse (European Commission, 2010). Common treat-ment options for biowaste in the EU include aerobic composting, anaerobic digestion or a combination the two. In compositing, organic material is stabi-lised and sanitised to produce compost, which in turn is beneficial to plant growth. In anaerobic digestion, a part of the organic carbon is converted into biogas, which can be used to produce electricity and heat. A digestate is also produced which, like compost, can be applied on land to support plant growth. Proper management of biowaste can contribute to a more sustainable use of the Earth’s resources, the better protection of the environment and help in the battle against climate change. Currently, biowaste is managed and treated differently in individual EU member states, ranging from 100% land-filling to 100% utilisation (50% recycling and 50% energy utilisation) when looking at municipal solid waste management (Eurostat, 2016). Both Den-mark and Germany have had great success moving away from landfilling, and today both countries landfill less than 1% of their biowaste. In Denmark, the main share is incinerated (>90%) (Justesen and Nielsen, 2014) and the energy is utilised for electricity and heat. In Germany, a large share of the biowaste is collected separately (~40%) (German Environmental Protection Agency, 2016) and recycled using a combination of composting and anaerobic diges-tion. Biowaste – as defined by the European waste framework directive – in-cludes biodegradable garden and park waste, food and kitchen waste from households, restaurants, catering companies and retail outlets, together with similar waste from food processing companies, but not paper waste. It should be mentioned that composting and anaerobic digestion is counted as recy-cling, while incineration with energy recovery is categorised as ‘utilisation’.
2
According to the waste hierarchy, biological treatment of biowaste is prefera-ble to incineration with energy utilisation. Deviation from the hierarchy for specific waste streams can occur, but should be backed up by life cycle as-sessments including all environmental consequences of producing and dis-posing of the waste (JRC, 2011).
1.2 Life cycle assessment and organic waste management
Several studies have compared the management of organic waste as part of the residual waste stream treated with different technologies like landfilling, composting, anaerobic digestion and/or incineration (e.g. Arena et al., 2003; Rigamonti et al., 2009; Wittmaier et al., 2009). However, only a few studies have addressed the treatment of food waste as the only waste material frac-tion (e.g. Boldrin et al., 2009; Buratti et al., 2015; Martínez-Blanco et al., 2010). In addition, only a few studies have focused on heat production and utilisation (Bernstad and la Cour Jansen, 2012a; Møller et al., 2009; Sonesson et al., 2000). Treatment options for food waste are manifold, including com-posting, anaerobic digestion, incineration and mechanical and biological treatment (MBT). To choose the best management option, a life cycle as-sessment (LCA) can be a useful tool, and it has been used extensively within the field of waste management comparisons for a number of years (e.g. Grosso et al., 2012; Kim and Kim, 2010; Montejo et al., 2013). In order to conduct life cycle assessment (LCA) large amounts of data are required, pref-erably in the form of a life cycle inventory (LCI). LCIs contain key infor-mation about direct emissions from a process (such as anaerobic digestion or transportation), products produced during the process (such as compost or energy) and the use of materials or consumption of energy. LCIs can be based on many things, such as material flow analysis (MFA), substance flow analy-sis (SFA) and direct measurement. Combining MFAs and SFAs to make an LCI was devised by Andersen et al. (2011) for home composting, and then using the LCI to compare home composting of organic household waste with incineration and landfilling using an LCA. The authors concluded that home composting is a viable treatment option (Andersen et al., 2012). Naroznova et al. (2013) carried out an LCA based on LCI, to compare two different pre-treatment technologies for source-separated organic household waste (SSOHW), and they concluded similar environmental performance for the two options mainly due to the surrounding waste management system.
3
1.3 Aim of the thesis The main aim of this Ph.D. thesis was to compare current organic waste man-agement systems across the Danish-German border with future scenarios for the treatment of organic waste, by using an LCA. A secondly aim was to pro-vide information and data on a biological treatment facility, namely a com-bined biogas and composting facility.
Two treatment systems were assessed in detail, namely combined anaerobic and aerobic treatment for the treatment of source-separated organic house-hold waste, and incineration for the treatment of organic waste as part of re-sidual household waste. A full material flow analysis, substance flow analysis and life cycle inventory were prepared for a combined anaerobic and aerobic treatment facility treating source-separated organic household waste.
A description of the current management system for organic waste in the Danish-German border region is presented in Jensen et al. (I), and future management possibilities are described in Jensen et al. (II). An MFA, an SFA and an LCI were created for a combined biogas and composting facility, us-ing on-site measurements of solids, liquids and air emissions, and this work is presented in Jensen et al. (III). Finally, greenhouse gas emissions were measured at the combined biogas and composting facility, using a tracer dis-persion technique that combines controlled tracer gas release with downwind air plume measurement, as presented in Jensen et al. (IV).
The PhD thesis included the following specific objectives:
Assessing and evaluating current and future organic waste manage-ment in the Danish-German border region.
Developing LCIs for waste treatment facilities, electricity and district heating networks.
Developing MFA and SFAs of a combined biogas and composting fa-cility.
Performing a full-scale fugitive emission measurement of a combined biogas and composting facility.
Identifying and addressing main challenges for LCA in organic waste management systems.
Recommending best practices when wanting to increase the source separation of organic waste, based on the abovementioned points.

4
1.4 Industrial PhD This PhD was carried out as an industrial PhD in collaboration with five waste management companies (Arwos, Provas, Sønderborg Forsyning, Ab-fallwirtschaft Rendsburg-Eckernförde and Abfallwirtschaft Schleswig-Flensburg) and DTU Environment, Technical University of Denmark. The PhD was financed mainly by the EU’s InterReg 4A programme.
This PhD project contains a life cycle-based environmental assessment of the management of household biowaste in the Danish-German border region. The work was carried from October 2013 until January 2016. The waste manage-ment companies in the Danish-German border region wanted to launch a col-laboration that included a thorough examination based on a life cycle assess-ment that would identify the most environmentally optimal system, including new treatment facilities for the future collection and treatment of organic food waste. Several apparent advantages can be achieved by collaborating across borders.
First, a functioning modern treatment facility treating SSOHW already exists in the German part of the border region but does not have the required ca-pacity to receive organic waste from all waste companies. The facility was used as a reference point, which significantly increased the quality of the in-vestigation.
A limited geographical area (one municipality) does not have on its own suf-ficient amounts of waste to support an economically and environmentally well-functioning new treatment facility. Only by collaboration across the border can the adequate amount of organic waste be achieved to run an opti-mally functioning treatment operation.
If such a unit is not established in the region, each waste management com-pany is forced to treat organic waste in existing facilities far away. A nega-tive example of this is organic waste from Flensburg, which by the end of 2014 had to be transported to Sachsen-Anhalt and Meklenburg-Vorpommern. A modern local facility, however, would minimise the transportation distance and contribute to a positive environmental and industrial development and to businesses in the local area. From the perspective of the environmental as-sessment it has been shown that the transportation of waste does not contrib-ute significantly to the overall environmental performance of the system ((Björklund et al., 2011; Blengini, 2008; Hauschild and Barlaz, 2011)); how-

5
ever on the economic side, transportation plays a very important role (Franchetti, 2013).
Collaboration between DTU Environmental and the waste management com-panies is seen in the choices of treatment technologies. Furthermore, the col-laboration made the PhD work relevant to the “everyday life” of the compa-nies.
The results of the environmental assessment are intended to form the founda-tions for decision makers with regards to planning future waste management systems in the border region. It is the intention that decision makers, by means of the environmental assessment scenarios, will gain an overview of changes to potential environmental impacts, including resource use, by im-plementing different management strategies. In this regard, decision makers will be able to choose the waste management system which is most appropri-ate, based on a weighting of which environmental impact categories are most important.

6

7
2 Methods and tools In this chapter the methods and tools used during the PhD are described and explained on a topic-by-topic basis. Section 2.1 describes the overall LCA principles used and executed with the EASETECH model (Jensen et al., I, II, III and IV). Section 2.2 includes a presentation of the STAN model used for mass and substance flow balancing of a combined biogas and composting facility (Jensen et al., III). Section 2.3 describes the methods and tools used for sampling and measuring at a combined biogas and composting facility (Jensen et al., III and IV) and, finally, section 2.4 describes the collection process, including plant-specific input and output data.
2.1 Life Cycle Assessment In an LCA, the entire life cycle of a product or service, from raw material extraction, through to manufacturing, to use, end-of-life treatment and final disposal, is considered. This provides a systematic overview of the potential environmental burdens in the different life cycle stages and helps in identify-ing environmental hotspots (ISO, 2008). Using an LCA to assess organic waste management is a well-established and recognised method for providing a solid foundation for decision makers, and they have also been used for en-vironmental assessments of many kinds of organic waste and treatment sys-tems (Bernstad and la Cour Jansen, 2012a).
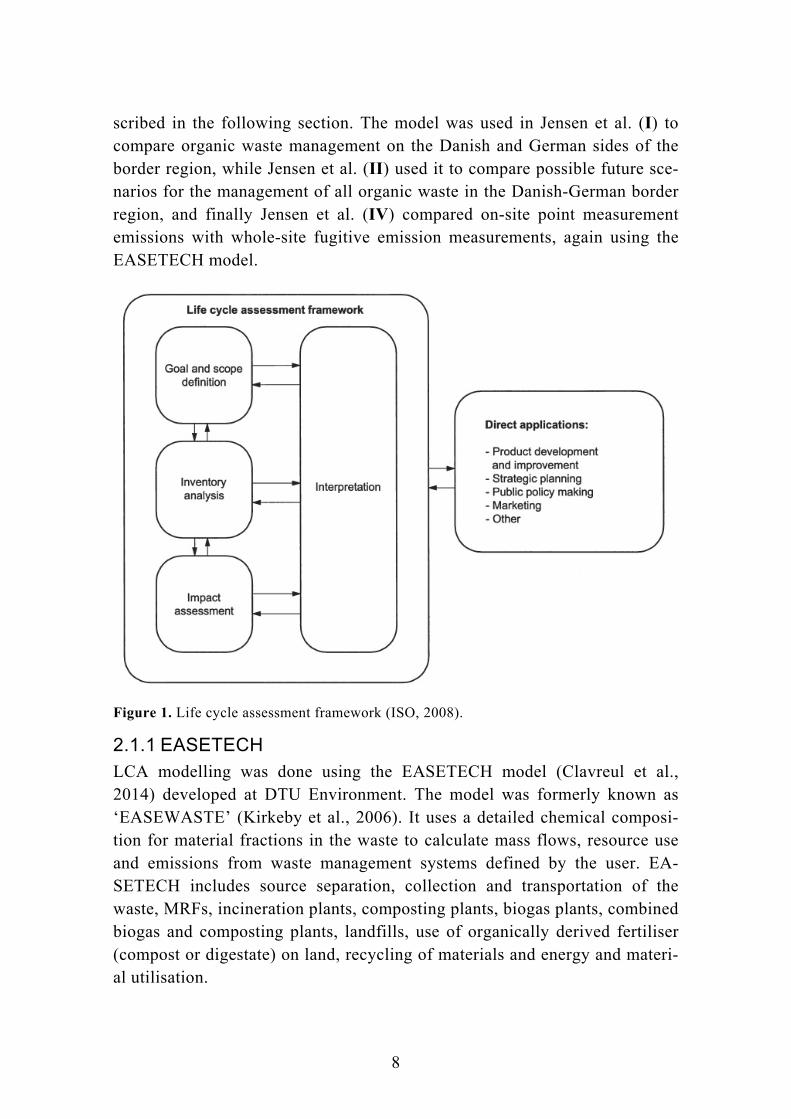
ISOs 14040 and 14044 define four phases in an LCA study (Figure 1): (1) Goal and scope definition, which sets the depth and the breadth of the LCA, (2) Inventory analysis (LCI), where input and output data with regard to the system are collected and studied, (3) Impact assessment (LCIA), which adds further information to the system and helps to assess the results, and finally (4) Interpretation, where results are summarised and discussed as a basis for recommendations made to decisions makers. Furthermore, LCA results can be useful inputs for the direct application of LCA or LCI results by decision makers.
The principles in an LCA can be directly applied to a waste management ser-vice, and it sometimes referred to as a ‘waste LCA’. This waste LCA consid-ers the life cycle from the waste entering the waste management system until all residues and products are taken care of. This means that the extraction of raw materials, manufacturing, production and use of products before they be-come waste are not considered, and the waste is given a zero-burden (Cleary, 2010). To perform an LCA, EASETECH software was used, and it is de-
8
scribed in the following section. The model was used in Jensen et al. (I) to compare organic waste management on the Danish and German sides of the border region, while Jensen et al. (II) used it to compare possible future sce-narios for the management of all organic waste in the Danish-German border region, and finally Jensen et al. (IV) compared on-site point measurement emissions with whole-site fugitive emission measurements, again using the EASETECH model.
Figure 1. Life cycle assessment framework (ISO, 2008).
2.1.1 EASETECH LCA modelling was done using the EASETECH model (Clavreul et al., 2014) developed at DTU Environment. The model was formerly known as ‘EASEWASTE’ (Kirkeby et al., 2006). It uses a detailed chemical composi-tion for material fractions in the waste to calculate mass flows, resource use and emissions from waste management systems defined by the user. EA-SETECH includes source separation, collection and transportation of the waste, MRFs, incineration plants, composting plants, biogas plants, combined biogas and composting plants, landfills, use of organically derived fertiliser (compost or digestate) on land, recycling of materials and energy and materi-al utilisation.
9
The model includes data for selected facilities and processes, but it also al-lows the user to create and specify their own processes. Complex scenarios can be built into the model, starting with waste generation and ending with final disposal in a landfill, industrial material recycling, spreading on agricul-tural land, utilisation in energy recovering facilities or by material utilisation. Whenever material recycling, energy utilisation or material utilisation take place, the waste management system is credited for the resource and envi-ronmental savings that correspond to the avoided production of virgin materi-als. EASETECH contains databases on a number of central processes, i.e. transportation, electricity and heat production, and the user has the ability to add their own data or import from commercial databases such as Ecoinvent.
2.2 STAN “MFA is a systematic assessment of the flows and stocks of materials within a defined system. It connects the inputs and outputs of a process with pathways and intermediate states. The law of the conservation of matter makes the con-trol of an MFA a simple task, as the user only has to compare inputs, stocks and outputs. This is a distinct characteristic of the MFA method that makes it attractive as a decision support tool in resource management, waste man-agement and environmental management” (Brunner and Rechberger, 2004).
The MFA is also important in management and engineering, because it pro-vides transparency. This is especially important for environmental impact assessments, since the material balances and transfer coefficients of the rele-vant processes can be calculated and the results of varying conditions cross-checked. An MFA alone is not sufficient for assessing waste management systems, but it can be used in collaboration with other tools such as an LCA (Brunner and Rechberger, 2004).
The mass balances in Jensen et al. (III) for a combined biogas and compost-ing facility were performed using the STAN model (Cencic and Rechberger, 2008), which allows the setup of mass flows, with a related concentration of substances, and the possibility of transferring coefficients together with the uncertainty of the entered values. The model expresses its results using San-key diagrams for easily accessible visual presentation. It also follows the Austrian ÖNORM S 2096 standard (MFA – application in waste manage-ment) and is setup via a very simple and user-friendly interface (Cencic and Rechberger, 2008).
10
2.3 Experimental work – material sampling and emission measurements
Three sampling campaigns were carried out during the PhD study, namely a waste collection and sorting campaign, as described in Edjabou et al. (2015), a sampling campaign on a combined biogas and composting facility, to be used as the basis for an MFA and an SFA (Jensen et al., III), and a whole-site fugitive emissions measurement campaign, in which methane, nitrous oxide and ammonia were studied (Jensen et al., IV). The sampling and measure-ments for the latter two approaches are described as follows.
2.3.1 Sampling campaign on a combined biogas and composting facility
The combined biogas and composting facility, which is located in the north-ern part of Germany, treated 45,000 tonnes of SSOHW in 2014 (reference year for this study). SSOHW is collected following a weekly collection scheme. The waste is received and stored in a receiving hall before it is fed into one of ten anaerobic digestion reactors (with an annual capacity of 30,000 tonnes) or into one of seven composting reactors (15,000 tonnes of fresh organic waste annually). The latter is used due to the current under-capacity of the anaerobic digestion reactors at the facility. The waste in both cases is not pre-treated before entering the reactors. In the anaerobic reactor, the waste material is sprinkled with water, and the leachate from the waste material is recirculated (annual water use is 2,600 m3). The temperature in the anaerobic reactor is mesophilic at about 38oC. Residence time in the anaero-bic reactors lasts between four and six weeks, depending on different factors such as biogas production. Biogas is produced mainly inside the anaerobic reactors and is collected and burned in an on-site biogas engine, in order to produce electricity and heat. After anaerobic digestion, the wet digestate is mixed with fresh organic waste before entering the composting reactors, in which the mixture is actively aerated, to ensure aerobic conditions, and fast composting is achieved over five to seven days. Excess air from the compost-ing reactors is collected and sent to a biofilter. After the composting reactors, the material is laid out in windrows (40 metres long, 5 metres wide at the bot-tom and 3 metres high) for sanitation and maturation. The windrows are cov-ered by a roof, but all emissions are released into the atmosphere. The wind-rows are turned twice a week with a windrow compost turner until the com-post is mature (about eight weeks), when it is then sieved into compost and residues. The turning procedure takes about an hour and a half. The compost

11
is stored in an open hall until it is sold to farmers and the residues are land-filled, in accordance with German law (Bundesministeriums der Justiz, 2013). In 2014, the production was 18,600 tonnes of compost, 4,100 tonnes of residues, 4,780 MWh of heat and 4,550 MWh of electricity. Biogas pro-duction was 2.28 million m3 with a methane content of 58% vol.
To perform an MFA and an SFA a sampling campaign was carried out over a three-day period, in order to take six samples at key locations at a combined biogas and composting facility. The rather short sampling time does not cover variations in the waste composition due to seasonality or different geographic origin of the waste as seen with some kinds of biowaste (i.e. garden waste (Boldrin and Christensen, 2010)). However, Edjabou et al. (2015) showed that no significant seasonal variations occurred when food waste from house-holds in the southern part of Denmark was addressed. The demographic in the southern part of Denmark is similar to the northern Germany area where the combined biogas and composting facility is located (Jensen et al. I).
Some of the data acquired were already available from the facility in annual green accounts, reports on air emissions and the chemical properties of the compost, the physical composition of the organic waste and personal com-munications with staff. These were used to make the overall mass balance on wet weight basis and provided information on the internal use of electricity, heat and materials.
Solid sampling
The sampling campaign was conducted over a period of three consecutive days during May 2014. Five solid samples and one liquid sample were taken at key locations at the facility. The five solid samples were performed sys-tematically, according to principles presented by Gy (1998), and included several mass reduction steps for reducing the initial sample of 100-300 tonnes down to 5 g for laboratory analysis. They were taken from (1) incoming fresh waste, (2) digestate, (3) ‘raw’ compost after the composting reactors, (4) ma-ture compost and (5) residues. The liquid sample (recirculated leachate) was taken from a circulation pipe. Table 1 provides an overview of the sampling and size reduction steps.
The following applies for the five solid samples. Due to practical arrange-ments, the initial sample was taken with a front loader from a 1-D lot of waste (1-dimentional; a narrow, low and long pile) going from app. 175 tonnes down to app. 10 tonnes (depending on the density of the sample; sam-ple 2 had the greatest weight due to high water content). The sample was then
12
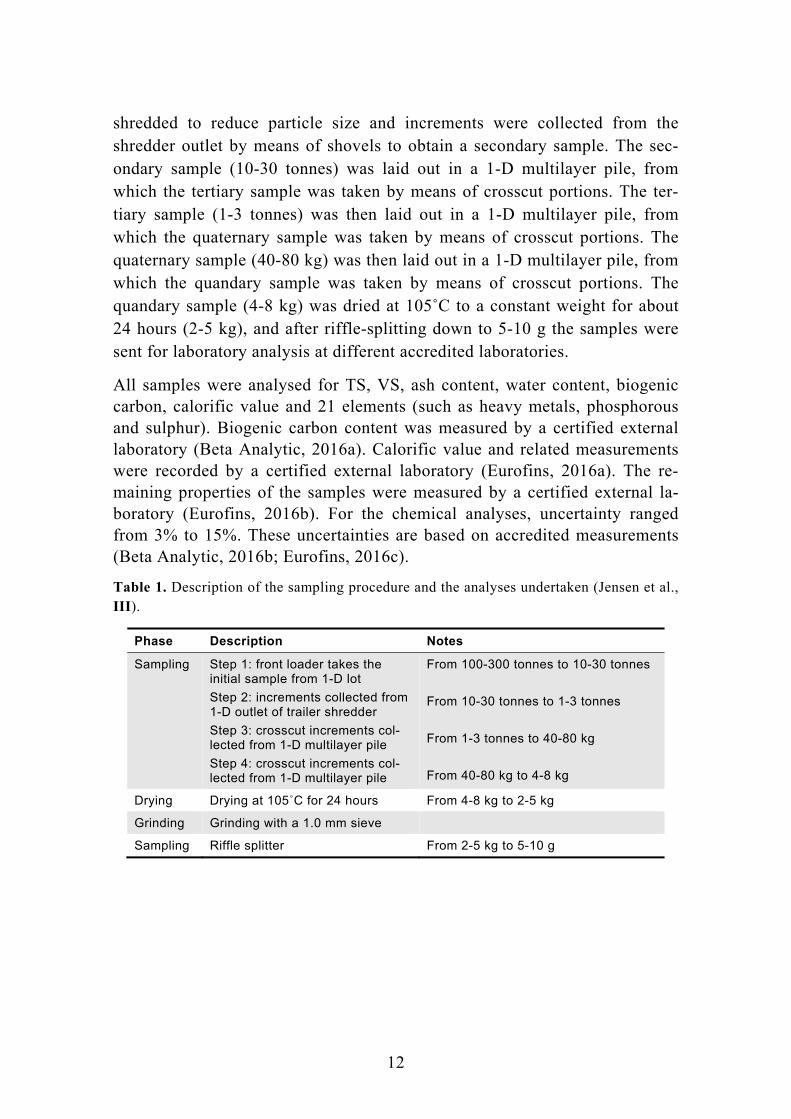
shredded to reduce particle size and increments were collected from the shredder outlet by means of shovels to obtain a secondary sample. The sec-ondary sample (10-30 tonnes) was laid out in a 1-D multilayer pile, from which the tertiary sample was taken by means of crosscut portions. The ter-tiary sample (1-3 tonnes) was then laid out in a 1-D multilayer pile, from which the quaternary sample was taken by means of crosscut portions. The quaternary sample (40-80 kg) was then laid out in a 1-D multilayer pile, from which the quandary sample was taken by means of crosscut portions. The quandary sample (4-8 kg) was dried at 105˚C to a constant weight for about 24 hours (2-5 kg), and after riffle-splitting down to 5-10 g the samples were sent for laboratory analysis at different accredited laboratories.
All samples were analysed for TS, VS, ash content, water content, biogenic carbon, calorific value and 21 elements (such as heavy metals, phosphorous and sulphur). Biogenic carbon content was measured by a certified external laboratory (Beta Analytic, 2016a). Calorific value and related measurements were recorded by a certified external laboratory (Eurofins, 2016a). The re-maining properties of the samples were measured by a certified external la-boratory (Eurofins, 2016b). For the chemical analyses, uncertainty ranged from 3% to 15%. These uncertainties are based on accredited measurements (Beta Analytic, 2016b; Eurofins, 2016c).
Table 1. Description of the sampling procedure and the analyses undertaken (Jensen et al., III).
Phase Description Notes
Sampling Step 1: front loader takes the initial sample from 1-D lot
Step 2: increments collected from 1-D outlet of trailer shredder
Step 3: crosscut increments col-lected from 1-D multilayer pile
Step 4: crosscut increments col-lected from 1-D multilayer pile
From 100-300 tonnes to 10-30 tonnes
From 10-30 tonnes to 1-3 tonnes
From 1-3 tonnes to 40-80 kg
From 40-80 kg to 4-8 kg
Drying Drying at 105˚C for 24 hours From 4-8 kg to 2-5 kg
Grinding Grinding with a 1.0 mm sieve
Sampling Riffle splitter From 2-5 kg to 5-10 g
13
Gas emissions
Methane and nitrous oxide emissions from a number of leakages and point sources had previously been measured by a commercial company (Witzen-hausen-Institut, 2012). The following description of the measuring points is the present Ph.D. reports interpretation of the data presented therein: Five point sources were investigated, including the biofilter, airflow going into the biofilter from the reactor composting and covered areas, the anaerobic diges-tion exhaust pipe, material right after reactor composting and matured mate-rial ready for sieving. Measurements were performed during a one week peri-od.
Point 1: Emissions from the biofilter were measured by placing a plastic foil (2x5m) on the surface of the biofilter and continuously sampling the air be-low the foil though a pipe. Volume flow was measured using the anemometer inside the pipe.
Point 2: Exhaust fumes from reactor composting, and covered areas of the facility going into the biofilter, were measured directly in the exhaust pipe. Volume flow was measured using an impeller anemometer and verified by facility operation measurements.
Point 3: A long-time measurement was carried out directly in the exhaust stacks from the anaerobic digesters, used during the start-up and close-down of the digesters, when methane production is low, in order detect if any emis-sions occurred.
Point 4: Emissions from windrow composting, immediately after the material had left the reactor composting area, were measured using a plastic foil (2x5m) on top of the windrows and continuously sampling the air below the foil though a pipe. Volume flow was measured using the anemometer inside the pipe.
Point 5: Emissions were measured from windrow composting before sieving material using a plastic foil (2x5 m) on top of the windrows and continuously sampling the air below the foil though a pipe. Volume flow was measured using the anemometer inside the pipe.
2.3.2 Whole-site fugitive emissions measurement campaign Total gas emissions were quantified using a mobile tracer dispersion method that combines the controlled release of tracer gas from the plant with concen-tration measurements downwind of the plant, by using a mobile high-resolution analytical instrument (Börjesson et al., 2009, 2007; Galle et al.,
14
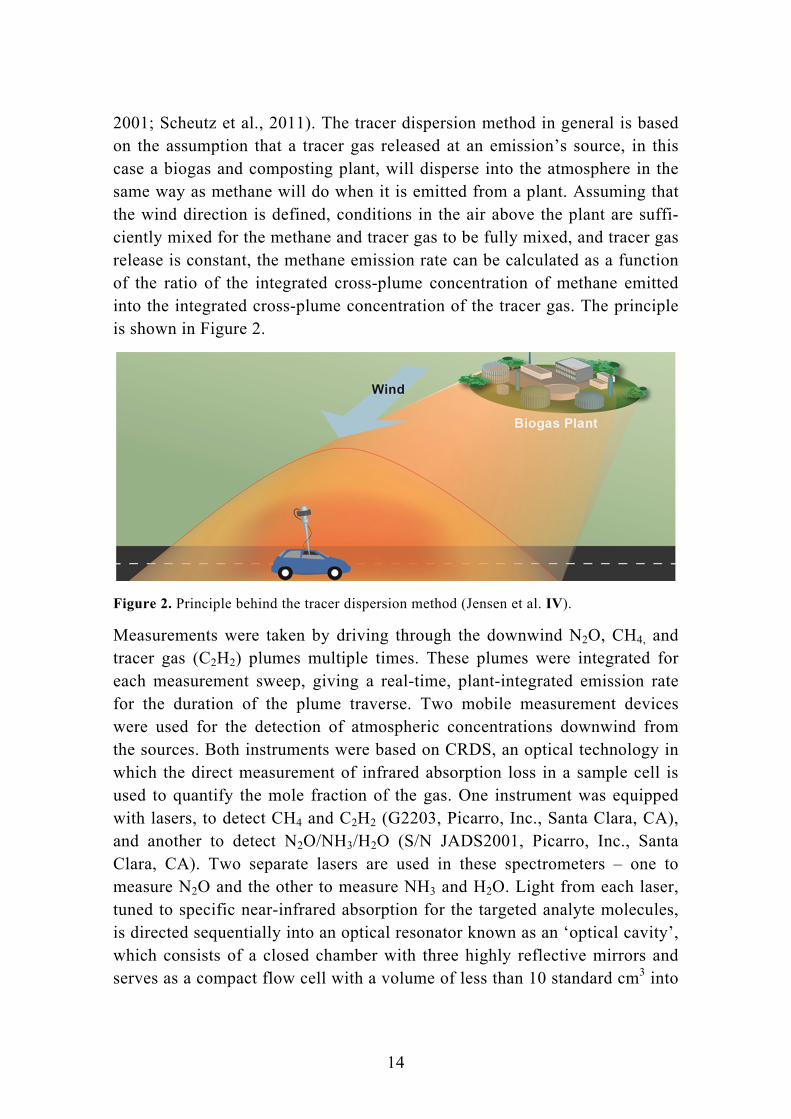
2001; Scheutz et al., 2011). The tracer dispersion method in general is based on the assumption that a tracer gas released at an emission’s source, in this case a biogas and composting plant, will disperse into the atmosphere in the same way as methane will do when it is emitted from a plant. Assuming that the wind direction is defined, conditions in the air above the plant are suffi-ciently mixed for the methane and tracer gas to be fully mixed, and tracer gas release is constant, the methane emission rate can be calculated as a function of the ratio of the integrated cross-plume concentration of methane emitted into the integrated cross-plume concentration of the tracer gas. The principle is shown in Figure 2.
Figure 2. Principle behind the tracer dispersion method (Jensen et al. IV).
Measurements were taken by driving through the downwind N2O, CH4, and tracer gas (C2H2) plumes multiple times. These plumes were integrated for each measurement sweep, giving a real-time, plant-integrated emission rate for the duration of the plume traverse. Two mobile measurement devices were used for the detection of atmospheric concentrations downwind from the sources. Both instruments were based on CRDS, an optical technology in which the direct measurement of infrared absorption loss in a sample cell is used to quantify the mole fraction of the gas. One instrument was equipped with lasers, to detect CH4 and C2H2 (G2203, Picarro, Inc., Santa Clara, CA), and another to detect N2O/NH3/H2O (S/N JADS2001, Picarro, Inc., Santa Clara, CA). Two separate lasers are used in these spectrometers – one to measure N2O and the other to measure NH3 and H2O. Light from each laser, tuned to specific near-infrared absorption for the targeted analyte molecules, is directed sequentially into an optical resonator known as an ‘optical cavity’, which consists of a closed chamber with three highly reflective mirrors and serves as a compact flow cell with a volume of less than 10 standard cm3 into
15
which the sample gas is introduced. The flow cell has an effective optical path length of 15-20 km, and this long path length allows for highly precise measurements (with ppb or even ppt uncertainty, depending on the analyte gas), using compact and extremely reliable near-infrared laser sources. Gas temperature and pressure are controlled rigidly in these instruments (Crosson 2008), and this stability allows the instrument (when properly calibrated to traceable reference standards) to deliver accurate measurements that need very infrequent calibrations relative to other N2O/NH3/H2O instrumentation. A further description of the equipment is presented in Mønster et al. (2014) and in Yoshida et al. (2014).
In the field campaigns, the air sample inlet was approximately 2 m above ground, and air was pumped into the analyser by a small external pump, pumping 4 L per minute, with a split to the atmosphere just before the ana-lyser inlet pumping about 0.4 L, thus allowing for a short reaction time from the sample inlet to concentration measurement. A GPS (Hemisphere, model R330 GNSS Receiver and A101 Smart Antenna) measured the location pre-cisely within 20 cm, and a weather station (All-In-One weather sensor, model 102780, Climatronics) measured atmospheric pressure, temperature, relative humidity, wind speed and wind direction.
To obtain the best possible simulation, tracer gas was released from the part of the treatment plant where the main greenhouse gases were being emitted. Initial on-site emission screenings were conducted to identify these major on-site sources of N2O and CH4 emissions. Off-site screenings were conducted to establish the background concentration of target gases, by performing measurements both up- and downwind of the treatment plant. Off-site screen-ing also served to identify possibly interfering emission sources in the area of the plant.
2.4 Data collection A major part of the PhD study involved collecting plant input-output data, because it was important to use specific and current data on the operating waste management system. This section gives a complete overview of how the data were collected and from which sources they came. The section is structured as a normal waste flow, first describing waste generation and then collection and transportation, treatment, residual products and, finally, infor-mation on substitution.
16
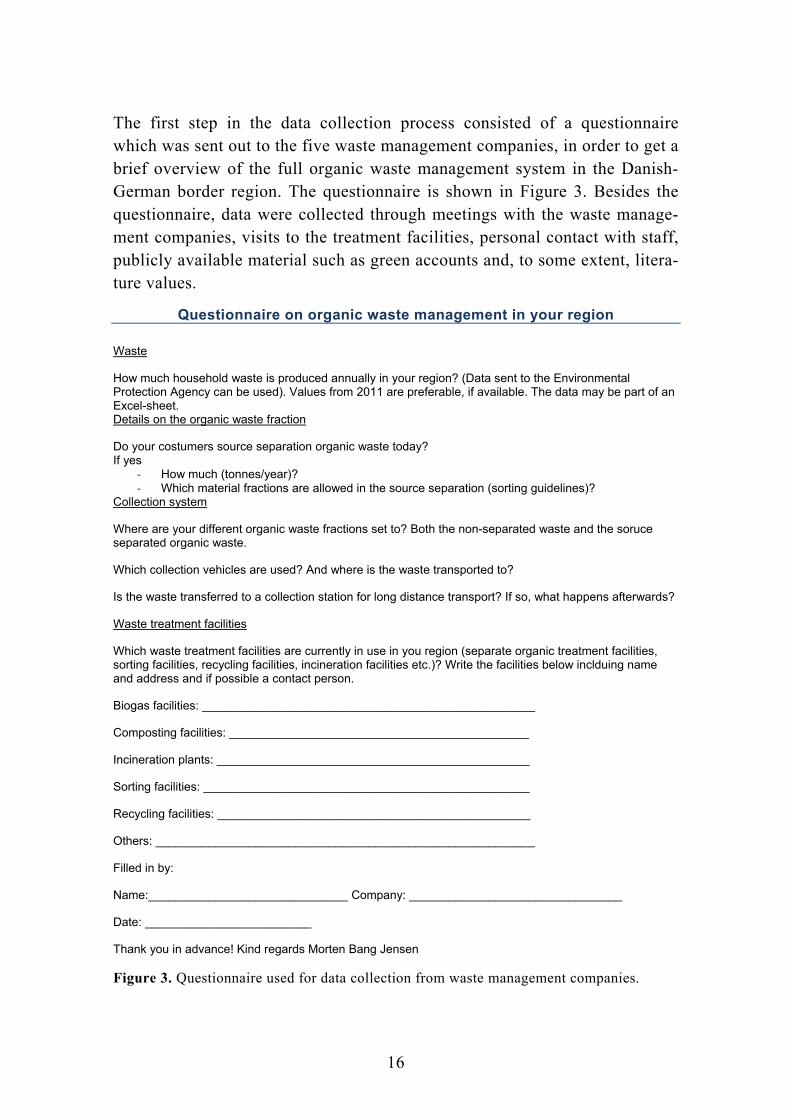
The first step in the data collection process consisted of a questionnaire which was sent out to the five waste management companies, in order to get a brief overview of the full organic waste management system in the Danish-German border region. The questionnaire is shown in Figure 3. Besides the questionnaire, data were collected through meetings with the waste manage-ment companies, visits to the treatment facilities, personal contact with staff, publicly available material such as green accounts and, to some extent, litera-ture values.
Questionnaire on organic waste management in your region
Waste
How much household waste is produced annually in your region? (Data sent to the Environmental Protection Agency can be used). Values from 2011 are preferable, if available. The data may be part of an Excel-sheet. Details on the organic waste fraction
Do your costumers source separation organic waste today? If yes
‐ How much (tonnes/year)? ‐ Which material fractions are allowed in the source separation (sorting guidelines)?
Collection system
Where are your different organic waste fractions set to? Both the non-separated waste and the soruce separated organic waste.
Which collection vehicles are used? And where is the waste transported to?
Is the waste transferred to a collection station for long distance transport? If so, what happens afterwards?
Waste treatment facilities
Which waste treatment facilities are currently in use in you region (separate organic treatment facilities, sorting facilities, recycling facilities, incineration facilities etc.)? Write the facilities below inclduing name and address and if possible a contact person.
Biogas facilities: __________________________________________________
Composting facilities: _____________________________________________
Incineration plants: _______________________________________________
Sorting facilities: _________________________________________________
Recycling facilities: _______________________________________________
Others: _________________________________________________________
Filled in by:
Name:______________________________ Company: ________________________________
Date: _________________________
Thank you in advance! Kind regards Morten Bang Jensen
Figure 3. Questionnaire used for data collection from waste management companies.
17
2.4.1 Waste generation and composition For all waste management companies the amount of waste generated was re-ported as annual tonnes (in some cases also on a monthly basis). The Danish companies reported values for residual waste, as no source separation is cur-rently taking place, while the German companies reported values for both SSOHW and residual waste.
In order to determine the content of organic waste in the residual waste, a waste sorting campaign was conducted in the Danish region and was done as part of this PhD study, paid for by the three Danish waste management com-panies. Residual waste from the three companies was collected and sorted over a three-month period in spring 2013 and sorted into 16 different material fractions. Details about the sorting campaign can be found in Edjabou et al. (2015). In one of the German municipalities, a waste sorting campaign had been carried out in 2009, so this was used to assess the composition of resid-ual waste (Witzenhausen-Institut, 2012). For the SSOHW, material fractions were assumed to have the same distribution as the material fraction of the organic waste in the residual waste. Besides animal and vegetable food waste, organic household waste was defined as including kitchen towels, yard waste flowers, animal excrement and bedding and small wood pieces. The small wood pieces are included due to the current sorting guidelines in the German region.
The chemical composition of waste fractions, including lower heating value, methane potential, nutrient content and content of heavy metals, is important to know, in order to model the potential environmental effects of treating or-ganic waste. These data were not available for the organic waste collected in the border region. Instead, data were taken from Riber and Christensen (2006), who determined the chemical composition of material fractions in average Danish residual waste. It was assumed that the chemical composition would be the same in the border region for the relevant material fractions.
2.4.2 Collection and transportation The collection and transportation of the residual household waste was similar across the entire region: it was bi-weekly, using 16-tonne collection trucks complying with the EURO V standard regarding emissions. The waste was collected and driven directly to the treatment facility. The same collection and transportation scheme is valid for SSOHW in the German region. The transportation distances are assumed to be equal to the distance from the big-gest city in each municipality to the treatment facility. Estimated diesel con-

18
sumption and associated emissions were based on Larsen et al. (2009). The transport distances in the future scenario were assumed to be equal to the dis-tance from the biggest city in each municipality to the already existing com-bined biogas and composting facility in the German region.
Transport distances for bottom ash and fly ash were estimated from the incin-eration facilities to the ash treatment or transfer station, and finally to the end user. Bottom ash is used locally as road material (transported by 32-tonne trucks) and fly ash is sent either to Norway (transported by ship) or Germany (32-tonne trucks). The compost and digestate were assumed to be used in the near vicinity to the biological treatment facilities (transported and applied using tractors).
2.4.3 Treatment facilities All current waste treatment facilities were contacted in order to collect spe-cific data required to model the actual system and avoid using generic data. For the treatment facilities in the future scenarios, it was decided to use amenities that are currently in operation and represent the current best prac-tice, though they were improved in the model to reflect being newly con-structed. Four organic treatment facilities were chosen, including an upgraded version of the already existing combined biogas production and composting facility in the area. The four treatment facilities are described in the following sections.
The incineration plants were modelled using material and substance flow analysis, with data provided on all plant inputs and outputs. The data provid-ed were annual and described all waste treated at the plant, hence not only the organic part. In order to model emissions related only to the organic part of the waste, the modelling differentiated between process-specific and waste-specific emissions. Process-specific emissions are related to the incineration process itself and are more or less independent of what waste is being incin-erated; one example is NOx formation, which is independent of waste com-position but depends on the way the incinerator is being operated. Waste-specific emissions were modelled using transfer coefficients. Where the phys-ical and chemical compositions of the waste were used, the content of a spe-cific compound was then routed to the different outputs of the incineration plant. It was assumed that these transfer coefficients were applicable to all material fractions in the waste, and in this way the incineration of the organic fractions could be modelled. Plant-specific energy efficiencies, both for elec-tricity and heat production, of the incinerators were used along with infor-

19
mation on the different surrounding energy systems that were substituted by the individual incinerators.
The combined biogas production and composting facility was modelled using plant-specific data on air emissions and biogas production together with chemical composition data on the compost produced. The fugitive loss of me-thane at the facility was 1.6 kg CH4/tonne of waste treated, based on point emission measurements (Witzenhausen-Institut, 2009). In addition, 1.2% of the methane going into the biogas engine was emitted into the air, based on manufacturer data found in the literature (Nielsen et al., 2003).
Data for the biological treatment facilities used in the future scenarios, in most cases, were taken from the literature, the only exception being the up-graded version of the already existing combined biogas and composting facil-ity, which was upgraded to meet the needs of the extra SSOHW received. Be-sides the capacity upgrade, biogas production per tonne of organic waste ar-riving at the facility was increased by 30%, and ammonia emissions were de-creased by 50%. Increased biogas production in the future scenario was based on the current under-capacity of the facility, in which 33% of received organ-ic waste goes directly to active composting and thereby bypasses anaerobic digestion. The anaerobic digestion process itself was thus not improved, but the calculation basis for biogas production was changed. Regarding ammonia emissions, it was assumed that the facility could be improved by refining the efficiency of the biofilter and by collecting off-gases from the windrow matu-ration process, which in a future plant would be enclosed. Furthermore, heat utilisation was increased to 100%.
The three other biological treatment facilities were chosen together with the waste management companies, with the criterion that the facilities should be readily available. Data for these biological treatment facilities were found in the literature, including pre-treatment technologies. The facilities chosen were a combined biogas and composting facility (details can be found in Jacobsen et al. (2013)), a co-digestion facility, treating manure and food waste (details can be found in Jacobsen et al. (2013)), and a tunnel compost-ing facility (details can be found in Boldrin et al. (2009)). The combined bio-gas and composting facility used a screw press for pre-treatment, and the co-digestion unit used a novel pulping technology called Ecogi, both described in detail by Naroznova et al. (2013).
The MBT was modelled with the least amount of detail, due to a paucity of data, but did include plant-specific fuel use, electricity consumption and a
20
few air emissions. No organic waste was sorted out for the purpose of recy-cling, and hence the facility did not have any substitution from utilising the organic waste fraction. The use of diesel and electricity, and emissions into the air of N2O, particulate matter and dioxins, was allocated proportionally to the wet weight of the fraction of organic waste compared to the total amount of waste received.
2.4.4 Residual products and substitution Emissions from compost applied on farmland were based on the DAISY agro-ecological computer model (Abrahamsen and Hansen, 2000), which in-cludes leaching of nutrients into the environment, ammonia and nitrous oxide emissions into the air, carbon sequestration and better soil workability. The model does not include factors such as crop yield, nutritional quality, weed, pest and disease suppression or soil erosion, as these are not yet described in a way that is generally applicable in an LCA (Martínez-Blanco et al., 2013). A description of emission coefficients in different scenarios, calculated by using the DAISY model, can be found in Bruun et al. (2006). EASETECH uses emission coefficients from this reference. Substitution of nutrients is based on the Danish legislation (Ministry of Environment and Food of Denmark, 2013) which assumes 100% substitution for P and K, and 20% for N in compost and 40% for N in digestate. Peat substitution was not included, as the compost or digestate was used 100% on agricultural land.
Bottom ash was used in all cases as a structural material in road bases and substituted virgin gravel. Literature data from EASETECH were used for the modelling process. Fly ash had two different treatments: backfilling in old salt mines in Germany (Bleicherode, 2015), which replaced small amounts of gravel, or fly ash used for acid neutralisation, replacing limestone in Norway (NOAH, 2015). Data for both treatment options had previously been gathered for EASETECH and were used in this study.
Each facility producing energy within a waste system is connected to an indi-vidual (separate) heating system, which can be either district- or locally-based. Each heating system was evaluated, in order to determine the marginal heat-producing technology. This led to a total of five different heating net-works, four of which were district heating networks and one which was local only. Where data collection was not possible, data from the EcoInvent data-base (EcoInvent, 2016) for a relevant technology were used. It was possible to find data on the specific heating networks for three out of the five cases (incineration 1, incineration 3 and incineration 4). The available data provid-
21
ed information about air emissions and resource use only. Information about air emissions differed slightly between the systems and included 20-23 sub-stances for air emissions and resource use. Data for the remaining two sys-tems were taken from the EcoInvent database, which provides more than 1,000 air emissions and resource uses. In order to have comparable technolo-gies, only the 23 emissions that were available for the other technologies were chosen for the EcoInvent inventories, together with resource use.
Electricity substituted in all cases was based on the marginal electricity cal-culated by the Danish Energy Directorate, using their RAMSES model (Danish Energy Agency, 2016) for a project undertaken for the Danish Envi-ronmental Protection Agency (Jacobsen et al., 2013). The marginal energy electricity consisted of 91.3% hard coal, 4.5% fuel oil, 3.8% natural gas and 0.4% energy crops and had a CO2 emission of 842 kg CO2/MWh. It was as-sumed that the marginal electricity in Germany would be similar to the Dan-ish marginal. Bruninx et al. (2013) conclude that the phasing out of nuclear power in Germany will be replaced mainly by coal. This is interpreted as cor-roborating that coal-based electricity production will continue to be the mar-ginal technology, as in Denmark.
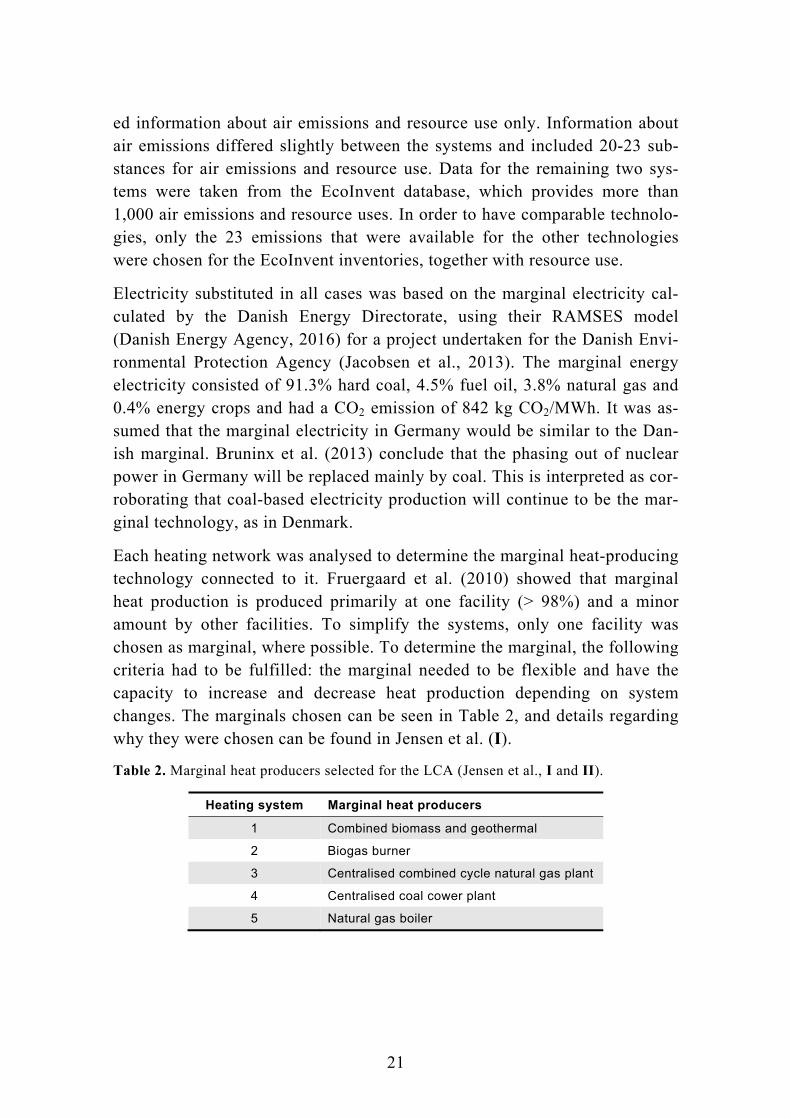
Each heating network was analysed to determine the marginal heat-producing technology connected to it. Fruergaard et al. (2010) showed that marginal heat production is produced primarily at one facility (> 98%) and a minor amount by other facilities. To simplify the systems, only one facility was chosen as marginal, where possible. To determine the marginal, the following criteria had to be fulfilled: the marginal needed to be flexible and have the capacity to increase and decrease heat production depending on system changes. The marginals chosen can be seen in Table 2, and details regarding why they were chosen can be found in Jensen et al. (I).
Table 2. Marginal heat producers selected for the LCA (Jensen et al., I and II).
Heating system Marginal heat producers
1 Combined biomass and geothermal
2 Biogas burner
3 Centralised combined cycle natural gas plant
4 Centralised coal cower plant
5 Natural gas boiler
22
For heating systems 3 and 4 the cogeneration of electricity and heat takes place. In order to account for this when only substituting heat, emissions from the marginals have to be allocated between heat and electricity. This was done according to exergy content, giving the electricity more importance than the heat and hence a higher share of the emissions. The allocation de-pends on the Carnot factor on each plant and the ratio of heat and electricity produced (Turconi, 2014). The allocations of emissions in the two relevant heating systems were: heating system 3, 20% and heating system 4, 14%.
The energy marginals were assumed to be the same in the future scenarios, by assuming they will happen in the near future (less than five years).
The quality of the data collected is addressed in section 3.1.5.
23
3 Environmental assessment of organic waste management In this chapter the major outcomes of the studies performed during the PhD are reported and discussed on a topic-by-topic basis. Section 3.1 includes findings on the LCA of the treatment of organic household waste (from Jen-sen et al., I and II), section 3.2 provides a detailed MFA, SFA and LCI of a combined biogas and composting facility (Jensen et al., III), section 3.3 compares GHG emissions from on-site measurements vs. whole-site fugitive emission measurements from a combined biogas and composting facility (Jensen et al., IV) and section 3.4 provides results when using whole-site fu-gitive emission measurements from a system perspective (Jensen et al., I and IV).
3.1 LCA case study In the present study the Danish-German border region was represented by seven municipalities situated near the border, i.e. directly adjacent to the bor-der or situated along a municipality directly adjacent. It should be noted that not all municipalities adjacent to the Danish-German border were part of the study, but the seven chosen herein represent the major part of the population in this area. The seven municipalities in the study were Sønderborg, Åbenrå, Haderslev and Tønder in Denmark, and Rendsburg-Eckernförde, Schleswig-Flensburg and Flensburg in Germany.
In the Danish region, there is currently no source separation of organic household waste, and it is incinerated together with residual waste in incin-eration plants with electricity and heat recovery. The recovered energy is used to substitute electricity and district heating. The region has three differ-ent incineration plants. In the German region, some of the organic waste is source-separated and sent to combined biogas production and composting with electricity and heat recovery, as well as compost production. The recov-ered energy is used to replace electricity and local heating, while the compost is applied on nearby farmland to substitute for conventional fertilisers. Fur-thermore, the region has one incinerator receiving residual household waste while producing electricity and heat, and one MBT facility receiving residual household waste while producing various recyclable fractions. Organic waste is stabilised at the MBT during composting and is thereafter sent to land-filling. SSOHW in the region consists of vegetable food waste, animal food
24
waste, kitchen towels, yard waste, animal bedding and small branches, ac-cording to the sorting guidelines provided by the waste management compa-nies.
3.1.1 Goal and scope The goal of the LCA was to compare the current organic waste management system across the Danish-German border with future scenarios for the treat-ment of organic waste. The current system contains three different treatment options for organic waste: combined anaerobic digestion and composting, incineration and mechanical and biological treatment through a total of six facilities.
3.1.2 Functional unit The functional unit of the study included collection, transportation, treatment and final disposal involved in the treatment of all organic household waste for comparing the current waste management system with future systems in the Danish or in the German region.
3.1.3 Temporal scope The time horizon applied was short-term, focusing on the current perfor-mance of the systems with respect to efficiencies, emissions and performance of the surrounding energy system. All data used were taken from 2006-2015, and the reference year for the LCA was 2014. The basis for the LCA was the current management system, including all existing treatment facilities. The future management system was based on optimised, existing and well-proven facilities.
3.1.4 System boundaries The modelled system started at waste generation in the households where consumer products become waste and enter the waste management with zero-burden. All collections and transportation of the waste, products and residues were included. Interchanges of materials and energy with the surrounding production system, and the final disposal of residual products from waste treatment, were also included. Energy and resource uses for running and op-erating all of the treatment facilities were included, together with emissions related to these aspects. Furthermore, external processes that provided ser-vices, such as transport, materials and energy, to the waste management sys-tem were included, even when they were not a direct part of the system. Capi-tal goods (construction and demolition of facilities) were not included. The
25
use of compost and digestate from biological treatment facilities on agricul-tural land and the treatment of ashes from incineration were also included.
3.1.5 Data quality The LCA used the principles of the ISO 14040 and 14044 standards, but did not follow them to the letter.
Data quality was assessed quantitatively on a scale from 1 to 5 (with 5 being the best) using the method developed by Weidema and Wesnæs (1996) and later updated by Frischknecht et al. (2007). In general, data quality was high, meaning the average value for each technology or process was less than two, and in many cases it was equal to one. Only for the treatment of ashes were the average values above two (2.6, 2.4 and 2.4). However, values below three still indicate reliable data. Furthermore, ash treatment did not influence the result in a major way, as shown in other papers (e.g. Turconi et al. (2011)).
3.1.6 System expansion and allocation This study used the consequential LCA approach, in which system expansion was used to include substitution instead of allocation. This meant that the waste management system was credited for avoided emissions that would otherwise be emitted during production outside the waste management sys-tem. When the waste management system substituted processes with multiple outputs, i.e. energy production at power plants, it was necessary to allocate emissions at the power plants to electricity and heat, respectively, in order to calculate the environmental effects of the substitution. Worth mentioning was the fact that this allocation was only used on processes outside the waste management system.
3.1.7 LCA method and impact categories Results of the LCA were calculated for the impact categories recommended by the ILCD (European Commission, 2010): global warming (IPCC, 2014); ozone depletion (WMO); ionising radiation (Frischknecht and Braunschweig, 2000); photochemical ozone formation (van Zelm et al., 2008); acidification (Posch et al., 2008; Seppälä et al., 2006); eutrophication, terrestrial (Posch et al., 2008; Seppälä et al., 2006); eutrophication, aquatic (freshwater and ma-rine) (Goedkoop et al., 2009); human toxicity, cancer effects and non-cancer effects (Rosenbaum et al., 2008); ecotoxicity (freshwater) (Rosenbaum et al., 2008); particulate matter (Greco et al., 2007; Rabl and Spadaro, 2014) and resource depletion, mineral and fossil (Guinée, 2002). The results are shown for four representative impact categories “Global Warming,” “Acidification,”

26
“Freshwater eutrophication” and “Abiotic resource depletion – elements.” All emissions in the systems were characterised using the characterisation factors from the method recommended by ILCD, while normalisation was done by using normalisation factors from Blok et al. (2013), hence showing the results in person equivalents (PEs) representing an average person’s yearly contribu-tion to the environment in the various impact categories. Results from the remaining impact categories can be found in Jensen et al. (I and II).
3.1.8 Modelling and assumptions The different scenarios were chosen together with the waste management companies and included only treatment technologies already available on the market today and proven to have the necessary operational stability to handle the waste. Existing waste management options were used in the future scenar-ios for the amount of waste they treated in the base scenario, while the extra amounts of SSOHW collected due to implementing source separation were treated in the chosen treatment options. The current organic waste manage-ment system was defined as scenario 1, while the four future scenarios were defined as scenarios 2, 3, 4 and 5, with all of them including the increased source separation of organic waste. The degree of source separation was de-fined according to current practice in the German area. Percentages in this regard are 76% in Rendsburg-Eckernförde, 47% in Flensburg and 41% in Schleswig-Flensburg. Source separation of 76% is very high compared to other studies (e.g. Bernstad and la Cour Jansen, 2012b; Bernstad et al., 2011; Grosso et al., 2012), but this value was used for the achievable percentages for the other municipalities, since their demography is similar. This means that the four Danish municipalities saw an increase in source separation from 0% to 76%, Flensburg and Schleswig-Flensburg had an increase to 76%, from 47% and 41%, respectively, and notably Rendsburg-Eckernförde saw no in-crease in source separation compared to Scenario 1. The extra SSOHW in the future scenarios was treated in different biological treatment facilities, while the rest was treated as before in the current system. Besides source separa-tion, the only other aspect that changed was the treatment of organic waste. In scenario 2, the extra SSOHW was sent to an upgraded version of the current combined biogas and composting facility in the area, which had sufficient capacity to handle the extra amount of SSOHW. In Scenario 3 the extra SSOHW was sent to the combined biogas and composting facility 3, in sce-nario 4 the extra SSOHW was sent to a co-digestion facility, and in scenario 5 it was sent to a tunnel composting facility.
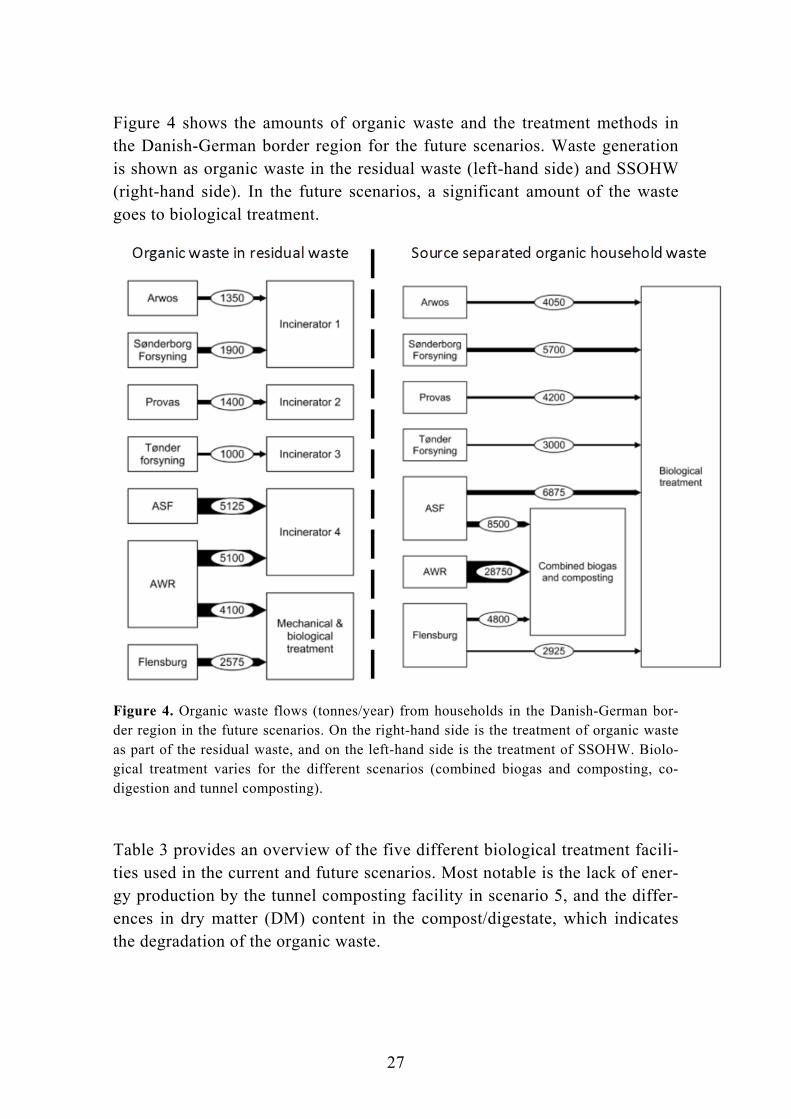
27
Figure 4 shows the amounts of organic waste and the treatment methods in the Danish-German border region for the future scenarios. Waste generation is shown as organic waste in the residual waste (left-hand side) and SSOHW (right-hand side). In the future scenarios, a significant amount of the waste goes to biological treatment.
Figure 4. Organic waste flows (tonnes/year) from households in the Danish-German bor-der region in the future scenarios. On the right-hand side is the treatment of organic waste as part of the residual waste, and on the left-hand side is the treatment of SSOHW. Biolo-gical treatment varies for the different scenarios (combined biogas and composting, co-digestion and tunnel composting).
Table 3 provides an overview of the five different biological treatment facili-ties used in the current and future scenarios. Most notable is the lack of ener-gy production by the tunnel composting facility in scenario 5, and the differ-ences in dry matter (DM) content in the compost/digestate, which indicates the degradation of the organic waste.
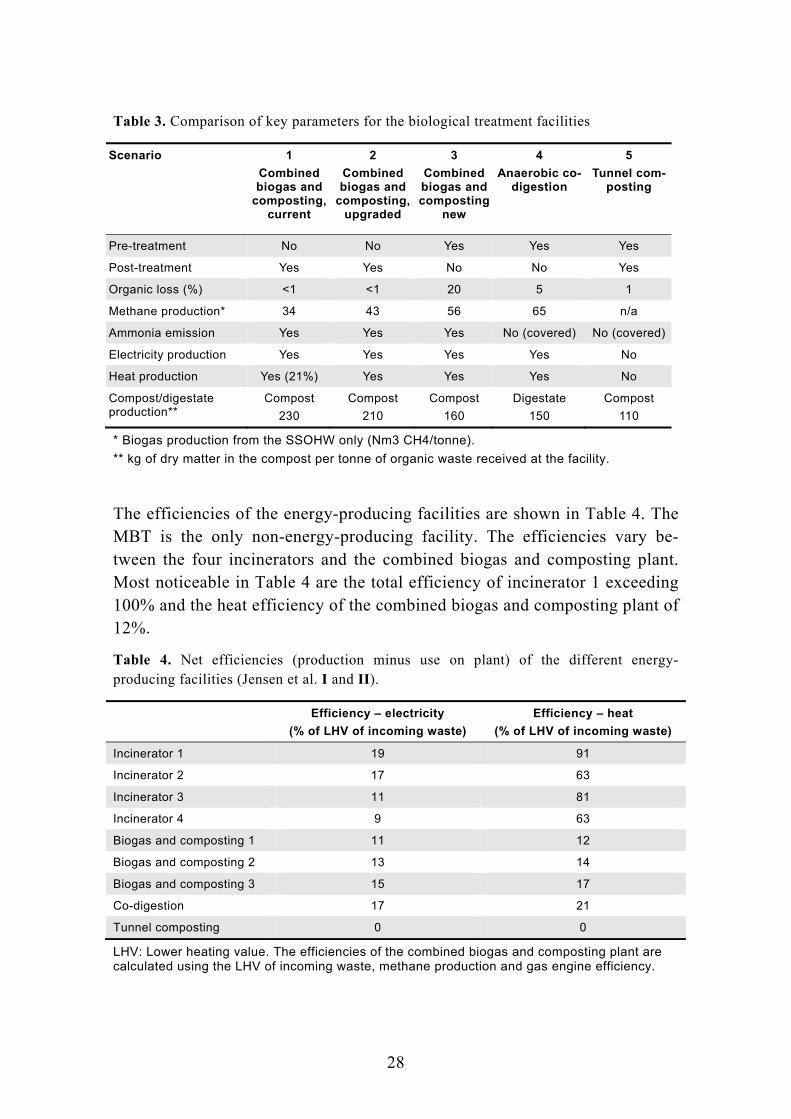
28
Table 3. Comparison of key parameters for the biological treatment facilities
Scenario 1
Combined biogas and
composting, current
2
Combined biogas and
composting, upgraded
3
Combined biogas and composting
new
4
Anaerobic co-digestion
5
Tunnel com-posting
Pre-treatment No No Yes Yes Yes
Post-treatment Yes Yes No No Yes
Organic loss (%) <1 <1 20 5 1
Methane production* 34 43 56 65 n/a
Ammonia emission Yes Yes Yes No (covered) No (covered)
Electricity production Yes Yes Yes Yes No
Heat production Yes (21%) Yes Yes Yes No
Compost/digestate production**
Compost
230
Compost
210
Compost
160
Digestate
150
Compost
110
* Biogas production from the SSOHW only (Nm3 CH4/tonne).
** kg of dry matter in the compost per tonne of organic waste received at the facility.
The efficiencies of the energy-producing facilities are shown in Table 4. The MBT is the only non-energy-producing facility. The efficiencies vary be-tween the four incinerators and the combined biogas and composting plant. Most noticeable in Table 4 are the total efficiency of incinerator 1 exceeding 100% and the heat efficiency of the combined biogas and composting plant of 12%.
Table 4. Net efficiencies (production minus use on plant) of the different energy-producing facilities (Jensen et al. I and II).
Efficiency – electricity
(% of LHV of incoming waste)
Efficiency – heat
(% of LHV of incoming waste)
Incinerator 1 19 91
Incinerator 2 17 63
Incinerator 3 11 81
Incinerator 4 9 63
Biogas and composting 1 11 12
Biogas and composting 2 13 14
Biogas and composting 3 15 17
Co-digestion 17 21
Tunnel composting 0 0
LHV: Lower heating value. The efficiencies of the combined biogas and composting plant are calculated using the LHV of incoming waste, methane production and gas engine efficiency.
29
The high heat efficiency for incinerator 1 is due to the flue gas condensation unit, which none of the other plants have in place, while the low heat effi-ciency for the combined biogas and composting plant is due to the fact that there is no market for the heat in the area, and so no production is needed. The efficiency for the biogas and composting plant is calculated using me-thane production, the efficiency of the gas engine and the lower heating value of the incoming waste. Methane production is 34 m3/tonne of waste, and the efficiency of the engine is 34% for electricity and 37% for heat (only 21% is utilised). The lower heating value of the incoming waste is 6,100 MJ/tonne.
3.1.9 LCA results LCA of the current system
Waste composition and amounts, together with data from the different treat-ment facilities across the border in the Danish-German region, were used to model the potential environmental impacts of organic waste treatment using the EASETECH model. The Danish system showed better performance in 10 out of the 14 impact categories (Jensen et al., I), but only four are shown in the following as examples.
Figure 5 shows a comparison of the organic waste treatment from households in the Danish-German border region for four environmental impact catego-ries. The Danish system shows better environmental performance in two out of the four highlighted impact categories compared to the German system. Both systems showed a net saving in “Global warming” of -26 mPE/tonne and -14 mPE/tonne for Denmark and Germany, respectively. Savings in “Global warming” are found in both the Danish and the German system, due to the electricity and heat substitution from the incinerators and the combined biogas and composting facility. The savings are due primarily to fossil carbon dioxide savings. The combined biogas and composting plant in the German system showed a net saving of 4.7 mPE/tonne of treated waste and was based on the gross savings of 6.9 mPE/tonne of treated waste and a loading of 2.2 mPE/tonne of treated waste. The savings are as mentioned for electricity and heat substitution, while the loadings are caused by N2O emissions from the composting and CH4 emitted primarily through the stack after the biogas en-gine. In general, the incinerators had savings almost exclusively in the “Global warming” category. Furthermore, there is a saving of 3 mPE/tonne of treated waste from the use of compost on land, due to carbon sequestration (2 mPE/tonne of treated waste) and the substitution of conventional fertilisers (1 mPE/tonne of treated waste). Loadings in “Global warming” arise from col-
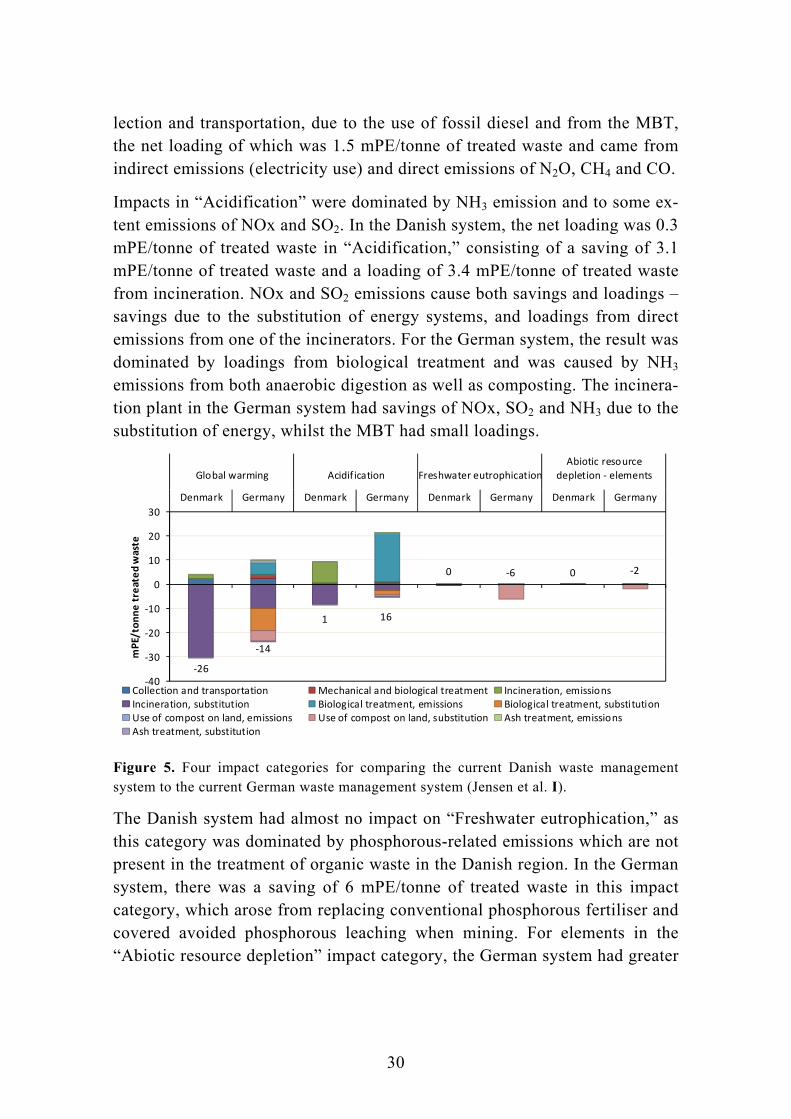
30
lection and transportation, due to the use of fossil diesel and from the MBT, the net loading of which was 1.5 mPE/tonne of treated waste and came from indirect emissions (electricity use) and direct emissions of N2O, CH4 and CO.
Impacts in “Acidification” were dominated by NH3 emission and to some ex-tent emissions of NOx and SO2. In the Danish system, the net loading was 0.3 mPE/tonne of treated waste in “Acidification,” consisting of a saving of 3.1 mPE/tonne of treated waste and a loading of 3.4 mPE/tonne of treated waste from incineration. NOx and SO2 emissions cause both savings and loadings –savings due to the substitution of energy systems, and loadings from direct emissions from one of the incinerators. For the German system, the result was dominated by loadings from biological treatment and was caused by NH3 emissions from both anaerobic digestion as well as composting. The incinera-tion plant in the German system had savings of NOx, SO2 and NH3 due to the substitution of energy, whilst the MBT had small loadings.
Figure 5. Four impact categories for comparing the current Danish waste management system to the current German waste management system (Jensen et al. I).
The Danish system had almost no impact on “Freshwater eutrophication,” as this category was dominated by phosphorous-related emissions which are not present in the treatment of organic waste in the Danish region. In the German system, there was a saving of 6 mPE/tonne of treated waste in this impact category, which arose from replacing conventional phosphorous fertiliser and covered avoided phosphorous leaching when mining. For elements in the “Abiotic resource depletion” impact category, the German system had greater
‐26
‐14
1 16
0 ‐6 0 ‐2
‐40
‐30
‐20
‐10
0
10
20
30
Denmark Germany Denmark Germany Denmark Germany Denmark Germany
Global warming Acidif ication Freshwater eutrophicationAbiotic resource
depletion ‐ elements
mPE/tonne treated waste
Collection and transportation Mechanical and biological treatment Incineration, emissionsIncineration, substitution Biological treatment, emissions Biological treatment, substitutionUse of compost on land, emissions Use of compost on land, substitution Ash treatment, emissionsAsh treatment, substitution
31
savings due to the use of compost on land, which did not happen in the Dan-ish system. The saving was due primarily to phosphorous savings.
Impact of the energy system on the LCA results
The five heating systems are all different, with five different marginal tech-nologies using wood chips, biogas and natural gas in a centralised plant, natu-ral gas in burners and hard coal in a centralised combined heat and power plant. Three parameters affect the results: the energy efficiency of the waste treatment plant, substituted fuel composition and energy efficiency in the substituted energy facility. The three parameters are most easily explained by looking at the “Global warming” impact category. Incinerators 1 and 2 had a low potential saving of 1.7 mPE/tonne of treated waste in the “Global warm-ing” impact category, due to the fact that the substituted fuels were CO2-lean (wood chips and biogas, respectively). The high heat efficiencies for incin-erators 1 and 2, and the high efficiencies of the substituted marginal facilities, did not matter much in this case. Incinerators 3 and 4 had a high potential saving of 9.2 and 16 mPE/tonne of treated waste, respectively. These values are a combination of high heat efficiencies at both incinerators, high heat ef-ficiencies at both substituted facilities and CO2-intensive fuels (natural gas and hard coal, respectively). The combined biogas and composting facility had a low potential saving similar to incinerators 1 and 2 of 1.1 mPE/tonne of treated waste. In this case the low potential saving of the combined biogas and composting facility was due to low heat recovery (12%), even though the substituted facility had high heat efficiency and a CO2-intensive fuel (natural gas).
Similarly the contribution made by substituting marginal electricity was cal-culated. In this case, the substituted technology was the same for all facilities primarily (centralised power plants using hard coal), and so only electricity efficiencies of the waste treatment plants matter for the comparison. The re-sults reflect the electricity efficiencies of the waste treatment facilities seen in Table 4. For incinerators 1 and 2, high potential savings of 25 and 22 mPE/tonne of treated waste in the “Global warming” impact category were calculated, which were due to high electricity efficiencies at both incinerators (19 and 17%). Incinerators 3 and 4 and the combined biogas and composting facility had lower electricity efficiencies of 11, 9 and 11.4%, respectively, leading to potential savings of 13.2, 12.7 and 14.0 mPE/tonne of treated waste, respectively. Because all of the facilities substituted the same marginal electricity, the results in all impact categories have the same proportion to each other primarily dominated by the electricity efficiencies.
32
LCA of the future scenarios
The presentation of the results is divided into three sections: firstly, the over-all results, where the current system is compared to the four possible future scenarios, secondly, a comparison between the countries, both to each other and within each country, and finally, an example of the performance of an individual municipality. The future system (scenario 4) shows better perfor-mance in up to nine out of the 14 impact categories (Jensen et al., II), but on-ly four are shown here.
Figure 6 illustrates the total environmental impact of treating all organic household waste in the Danish-German border region for four impact catego-ries. Scenario 1 describes the current practice, while scenarios 2 to 5 describe possible future circumstances. The future system showed better environmen-tal performance in three out of the four impact categories compared to the current scenario (scenario 3 and 4). In the “Global warming” category a net loading was seen for collection and transportation, ash treatment and mechan-ical and biological treatment, while biogas production and composting, incin-eration and the use of compost/digestate on land provided net savings. These savings were due mainly to the substitution of electricity and heat and carbon sequestration. In “Acidification” all processes contributed with a load except for the use of compost/digestate on land. In all scenarios, biological treatment contributed the most, followed by incineration. For biological treatment the main loading arose from ammonia emissions, while for incineration it was primarily from NOx and SO2 emissions. In “Freshwater eutrophication” there was a net saving in all scenarios, and the savings in scenarios 2, 3, 4 and 5 were approximately twice as large as for scenario 1. These savings were due primarily to the use of compost/digestate on land as a result of substituting the production of virgin fertiliser (phosphorous fertiliser). For “Abiotic re-source depletion – elements” a net saving was seen in all scenarios, which was due mainly to substituting conventional fertiliser when using the com-post/digestate on land. More than 90% of the savings arose from phosphorous substitution.
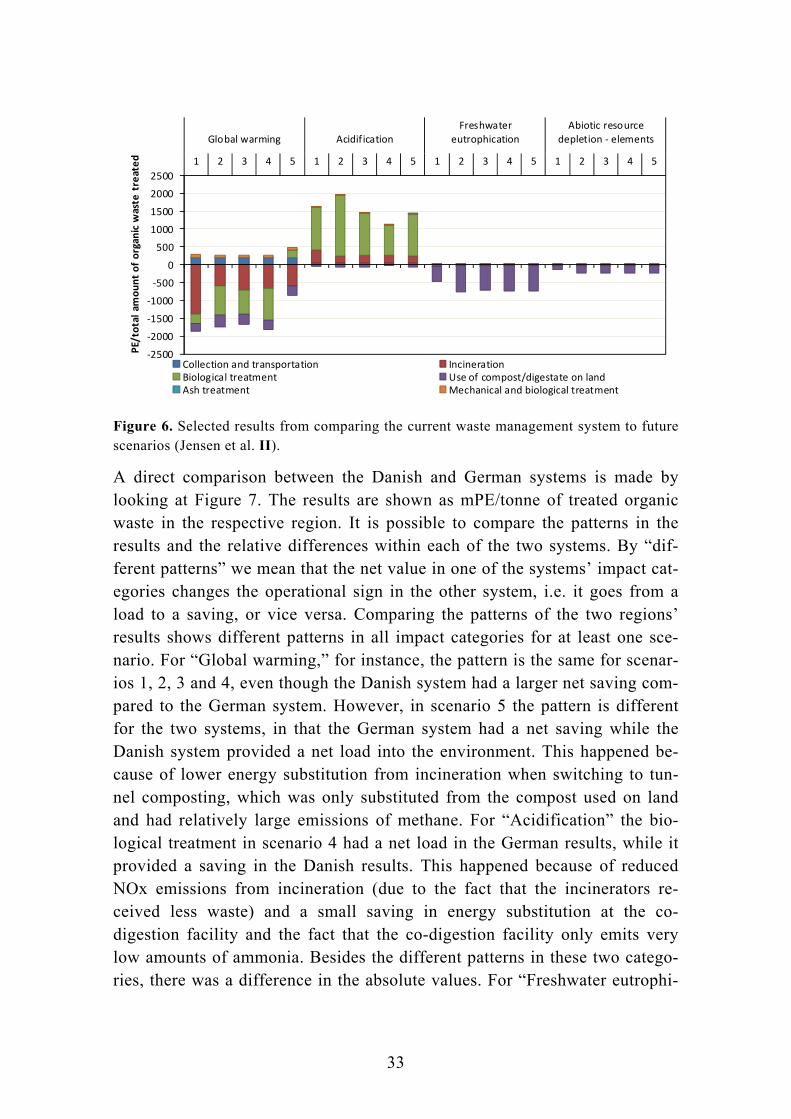
33
Figure 6. Selected results from comparing the current waste management system to future scenarios (Jensen et al. II).
A direct comparison between the Danish and German systems is made by looking at Figure 7. The results are shown as mPE/tonne of treated organic waste in the respective region. It is possible to compare the patterns in the results and the relative differences within each of the two systems. By “dif-ferent patterns” we mean that the net value in one of the systems’ impact cat-egories changes the operational sign in the other system, i.e. it goes from a load to a saving, or vice versa. Comparing the patterns of the two regions’ results shows different patterns in all impact categories for at least one sce-nario. For “Global warming,” for instance, the pattern is the same for scenar-ios 1, 2, 3 and 4, even though the Danish system had a larger net saving com-pared to the German system. However, in scenario 5 the pattern is different for the two systems, in that the German system had a net saving while the Danish system provided a net load into the environment. This happened be-cause of lower energy substitution from incineration when switching to tun-nel composting, which was only substituted from the compost used on land and had relatively large emissions of methane. For “Acidification” the bio-logical treatment in scenario 4 had a net load in the German results, while it provided a saving in the Danish results. This happened because of reduced NOx emissions from incineration (due to the fact that the incinerators re-ceived less waste) and a small saving in energy substitution at the co-digestion facility and the fact that the co-digestion facility only emits very low amounts of ammonia. Besides the different patterns in these two catego-ries, there was a difference in the absolute values. For “Freshwater eutrophi-
‐2500
‐2000
‐1500
‐1000
‐500
0
500
1000
1500
2000
2500
1 2 3 4 5 1 2 3 4 5 1 2 3 4 5 1 2 3 4 5
Global warming Acidif icationFreshwater
eutrophicationAbiotic resource
depletion ‐ elementsPE/total am
ount of organic w
aste treated
Collection and transportation IncinerationBiological treatment Use of compost/digestate on landAsh treatment Mechanical and biological treatment
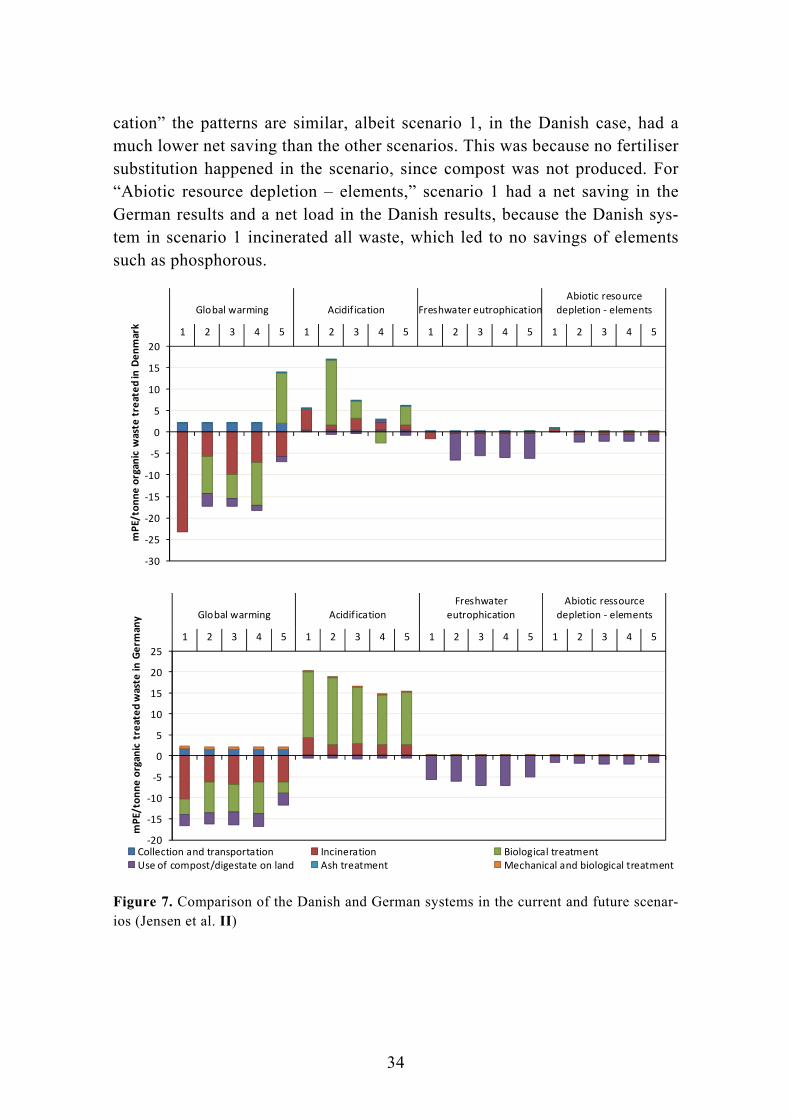
34
cation” the patterns are similar, albeit scenario 1, in the Danish case, had a much lower net saving than the other scenarios. This was because no fertiliser substitution happened in the scenario, since compost was not produced. For “Abiotic resource depletion – elements,” scenario 1 had a net saving in the German results and a net load in the Danish results, because the Danish sys-tem in scenario 1 incinerated all waste, which led to no savings of elements such as phosphorous.
Figure 7. Comparison of the Danish and German systems in the current and future scenar-ios (Jensen et al. II)
‐30
‐25
‐20
‐15
‐10
‐5
0
5
10
15
20
1 2 3 4 5 1 2 3 4 5 1 2 3 4 5 1 2 3 4 5
Global warming Acidif ication Freshwater eutrophicationAbiotic resource
depletion ‐ elements
mPE/tonne organic w
aste treated in Denmark
‐20
‐15
‐10
‐5
0
5
10
15
20
25
1 2 3 4 5 1 2 3 4 5 1 2 3 4 5 1 2 3 4 5
Global warming Acidif icationFreshwater
eutrophicationAbiotic ressource
depletion ‐ elements
mPE/tonne organic treated waste in
Germ
any
Collection and transportation Incineration Biological treatmentUse of compost/digestate on land Ash treatment Mechanical and biological treatment

35
To illustrate further the differences between the seven municipalities, the re-sults from Arwos (one waste management company) are shown in Figure 8. Scenario 1 (the current situation) had 100% of its waste sent to incineration. In the future scenarios, source separation increased to 76%, and the SSOHW was sent to the respective biological treatment facility. For “Global warming” scenario 1 showed a greater saving than the future scenarios. Noteworthy is scenario 5, in which a net loading was seen. Scenarios 2, 3 and 4 showed sim-ilar patterns with a net saving; the differences between the systems were bio-logical treatment, with a subsequent amount of compost produced and energy efficiencies, as seen in Table 4. For “Acidification” the main load in scenari-os 2, 3 and 5 came from the biological treatment facilities and in all cases from ammonia emissions. Scenarios 1 and 4 both showed a net saving in this category. For “Freshwater eutrophication” compost/digestate usage on land provided a saving in scenarios 2, 3, 4 and 5, due to phosphorous savings (from the phosphorous mining/extraction). Scenario 1 had a smaller saving due to the substituted energy system. For “Abiotic resource depletion – ele-ments” net savings were seen in scenarios 2, 3, 4 and 5, mostly due to phos-phorous savings. In scenario 1 there was a net loading in this category, as no elements were substituted during incineration.
Figure 8. LCA results for one waste management company (Jensen et al. II).
Besides knowing potential environmental impacts based on the treatment technologies employed, it can be useful to know which elements or com-pounds affect the environmental assessment the most. The result in each im-pact category, in most cases (>95%), was dominated by a few compounds. Table 5 lists the compounds responsible for more than 95% of each impact
‐40
‐30
‐20
‐10
0
10
20
30
1 2 3 4 5 1 2 3 4 5 1 2 3 4 5 1 2 3 4 5
Global warming Acidif ication Freshwater eutrophication
Abiotic resource
depletion ‐ elements
mPE/tonne organic w
aste treated in Arw
os
Collection and transportation Incineration Biological treatment
Use of compost on land Ash treatment Mechanical and biological
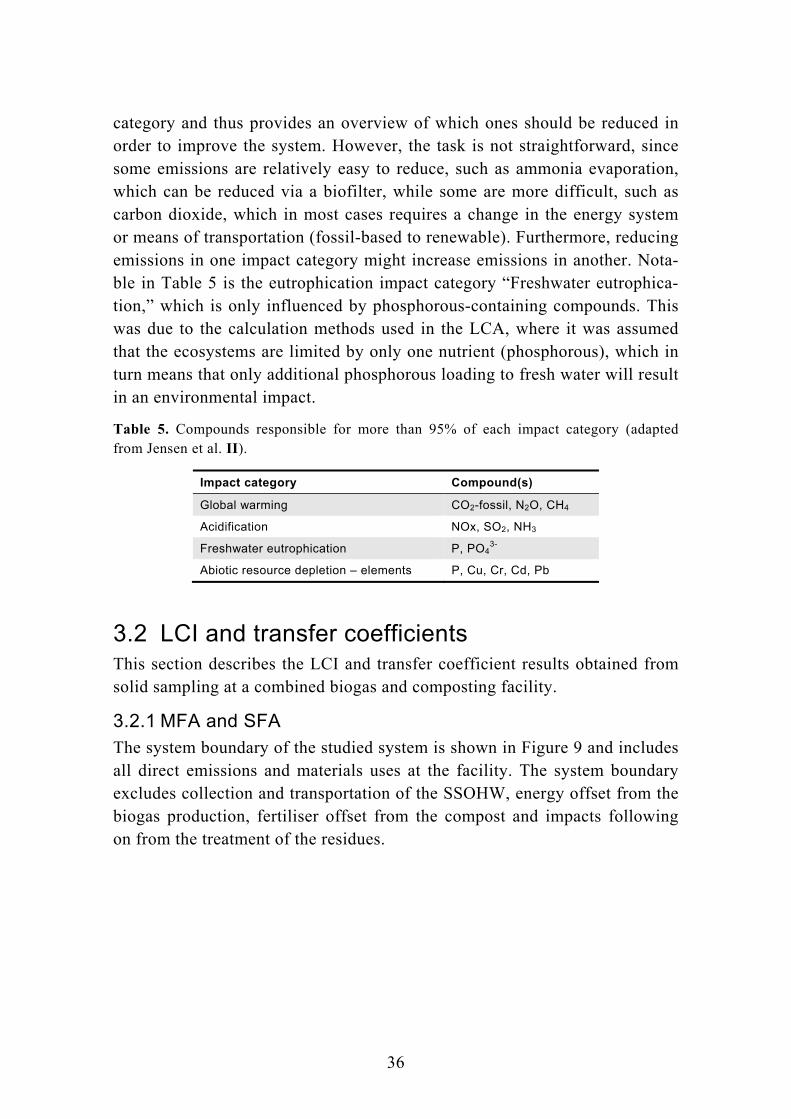
36
category and thus provides an overview of which ones should be reduced in order to improve the system. However, the task is not straightforward, since some emissions are relatively easy to reduce, such as ammonia evaporation, which can be reduced via a biofilter, while some are more difficult, such as carbon dioxide, which in most cases requires a change in the energy system or means of transportation (fossil-based to renewable). Furthermore, reducing emissions in one impact category might increase emissions in another. Nota-ble in Table 5 is the eutrophication impact category “Freshwater eutrophica-tion,” which is only influenced by phosphorous-containing compounds. This was due to the calculation methods used in the LCA, where it was assumed that the ecosystems are limited by only one nutrient (phosphorous), which in turn means that only additional phosphorous loading to fresh water will result in an environmental impact.
Table 5. Compounds responsible for more than 95% of each impact category (adapted from Jensen et al. II).
Impact category Compound(s)
Global warming CO2-fossil, N2O, CH4
Acidification NOx, SO2, NH3
Freshwater eutrophication P, PO43-
Abiotic resource depletion – elements P, Cu, Cr, Cd, Pb
3.2 LCI and transfer coefficients This section describes the LCI and transfer coefficient results obtained from solid sampling at a combined biogas and composting facility.
3.2.1 MFA and SFA The system boundary of the studied system is shown in Figure 9 and includes all direct emissions and materials uses at the facility. The system boundary excludes collection and transportation of the SSOHW, energy offset from the biogas production, fertiliser offset from the compost and impacts following on from the treatment of the residues.
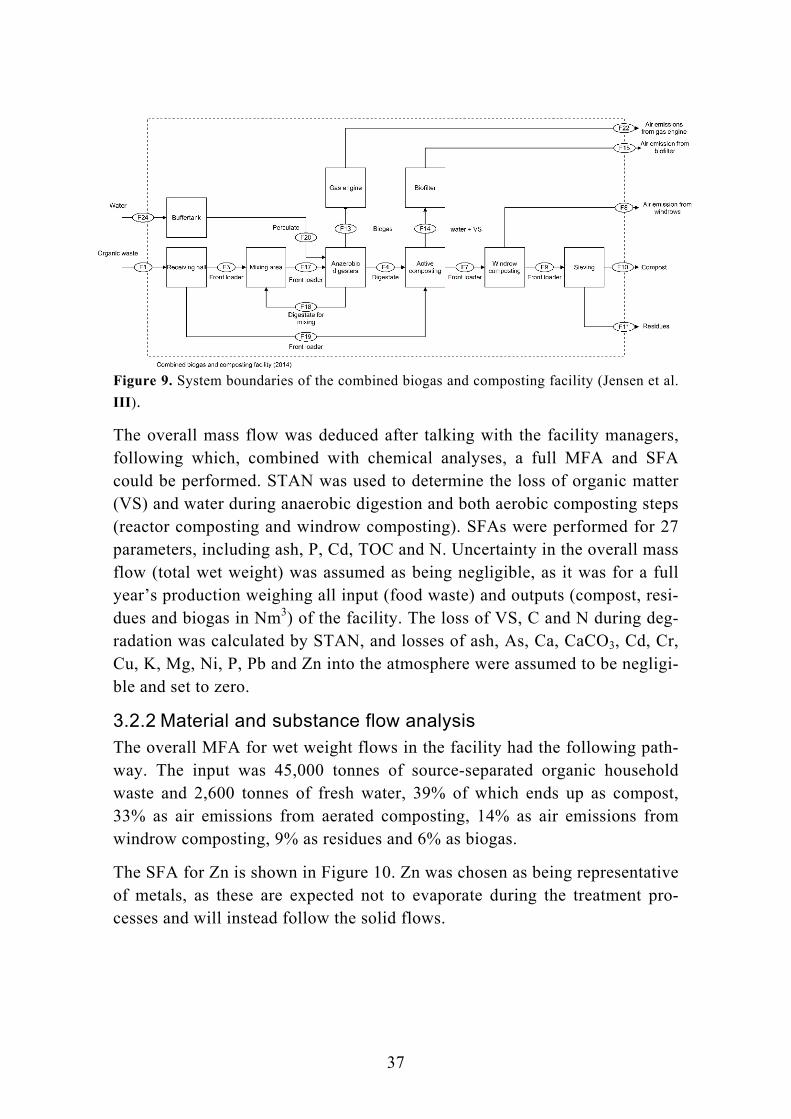
37
Figure 9. System boundaries of the combined biogas and composting facility (Jensen et al.
III).
The overall mass flow was deduced after talking with the facility managers, following which, combined with chemical analyses, a full MFA and SFA could be performed. STAN was used to determine the loss of organic matter (VS) and water during anaerobic digestion and both aerobic composting steps (reactor composting and windrow composting). SFAs were performed for 27 parameters, including ash, P, Cd, TOC and N. Uncertainty in the overall mass flow (total wet weight) was assumed as being negligible, as it was for a full year’s production weighing all input (food waste) and outputs (compost, resi-dues and biogas in Nm3) of the facility. The loss of VS, C and N during deg-radation was calculated by STAN, and losses of ash, As, Ca, CaCO3, Cd, Cr, Cu, K, Mg, Ni, P, Pb and Zn into the atmosphere were assumed to be negligi-ble and set to zero.
3.2.2 Material and substance flow analysis The overall MFA for wet weight flows in the facility had the following path-way. The input was 45,000 tonnes of source-separated organic household waste and 2,600 tonnes of fresh water, 39% of which ends up as compost, 33% as air emissions from aerated composting, 14% as air emissions from windrow composting, 9% as residues and 6% as biogas.
The SFA for Zn is shown in Figure 10. Zn was chosen as being representative of metals, as these are expected not to evaporate during the treatment pro-cesses and will instead follow the solid flows.

38
Figure 10. Total zinc flow analysis of the combined biogas and composting facility in
2014 (in tonnes/year).
The SFA for the different nutrients and heavy metals can be used to calculate transfer coefficients for the system in general as well as for individual pro-cesses in the system. Transfer coefficients for the overall system are calculat-ed by dividing the output by the input (the elemental content in the input wa-ter was excluded, since it is very small in all cases at less than 1%). In all, 80% of the Zn in the incoming waste ends up in the compost and 20% in the residues. Selected results are seen in Table 6.
Table 6. Input and transfer coefficients for wet weight, N, P, Cu and Zn in the combined biogas and composting facility. Inputs are shown as total tonnes/year, and the rest are a percentage of this figure (Jensen et al. III).
Wet Weight N P Cu Zn
Input 47,600 173 44.8 0.534 2.20
Compost 39.1 68.8 79.2 83.1 80.2
Residues 8.6 14.5 21.2 17.4 20.2
Biofilter 33.1 10.4 0 0 0
Windrows 13.7 11.0 0 0 0
Biogas 5.5 0 0 0 0
Sum [%] 100 105 100 100 100

39
Life cycle inventory
The full LCI for 2014 is presented in Table 7 and covers the production of electricity and heat, waste input, fuel consumption, the main gaseous emis-sions, compost and residues.
Transportation to and from the facility is not included, and neither are other upstream or downstream processes such as offsetting electricity or conven-tional fertilisers. Data for energy production and use are measured continu-ously at the facility, and energy use is shown as both internal use and export-ed energy. Most notable is the 2,914 MWh of heat having to be cooled off because the district heating network is too small to use all the heat produced.
3.3 Whole-site fugitive emissions The main objective was to quantify CH4, N2O, and NH3 emissions from a combined biogas and composting facility receiving biowaste, by using a mo-bile tracer dispersion method. Emission factors were estimated relating the measured emissions to the waste material treated and to the compost and me-thane gas generated therein. Finally, the contribution of the measured diffu-sive emissions to the whole-plant carbon footprint was assessed.
Initially, a screening measurement campaign of the area around the waste treatment facility was conducted, in order to identify potential CH4 and N2O sources which could cause interference with plume measurements. Besides the treatment facility, sources of CH4 were found at a farm 600 m north-northeast from the waste treatment facility. This farm had an anaerobic di-gester for biogas production, which resulted in whole-site fugitive CH4 emis-sions. Further northeast was another farm, which had smaller CH4 emissions, probably from a manure tank. Figure 11 shows measurements done on June 5th, where tracer gas and wind direction could be used to illustrate the indi-vidual methane sources and the possibility of separating them from the CH4 emissions emitted by the waste treatment facility.
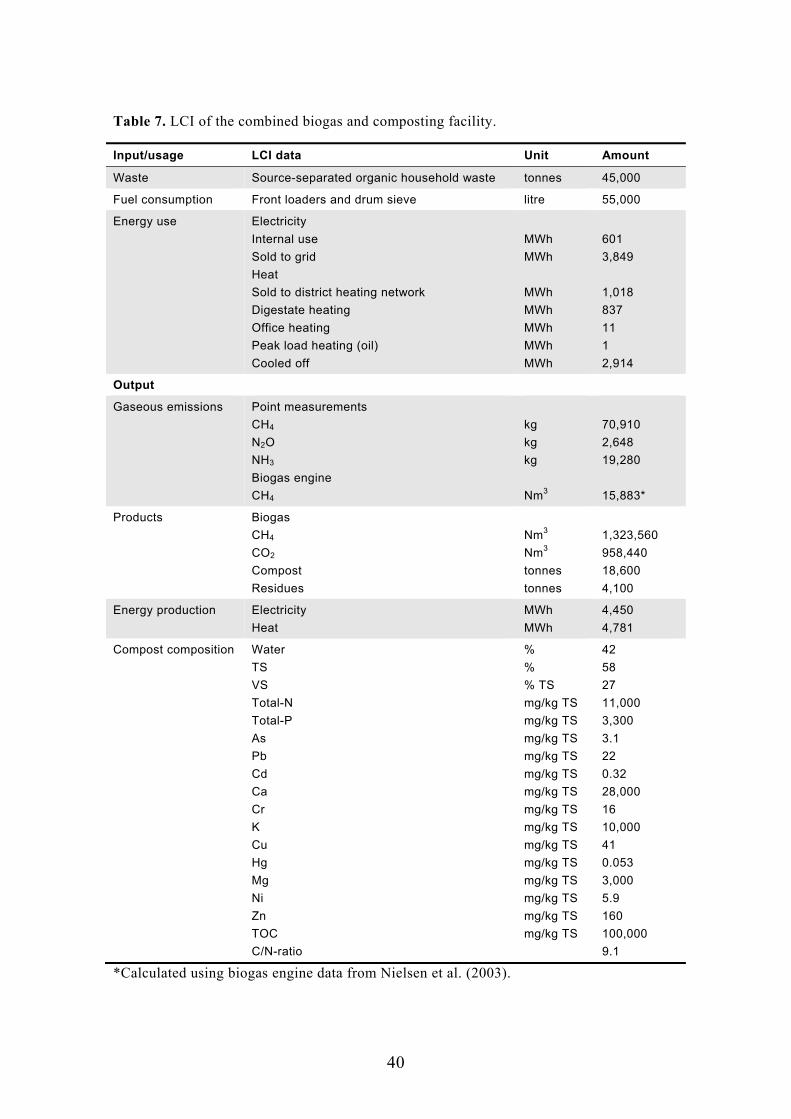
40
Table 7. LCI of the combined biogas and composting facility.
Input/usage LCI data Unit Amount
Waste Source-separated organic household waste tonnes 45,000
Fuel consumption Front loaders and drum sieve litre 55,000
Energy use Electricity
Internal use
Sold to grid
Heat
Sold to district heating network
Digestate heating
Office heating
Peak load heating (oil)
Cooled off
MWh
MWh
MWh
MWh
MWh
MWh
MWh
601
3,849
1,018
837
11
1
2,914
Output
Gaseous emissions Point measurements
CH4
N2O
NH3
Biogas engine
CH4
kg
kg
kg
Nm3
70,910
2,648
19,280
15,883*
Products Biogas
CH4
CO2
Compost
Residues
Nm3
Nm3
tonnes
tonnes
1,323,560
958,440
18,600
4,100
Energy production Electricity
Heat
MWh
MWh
4,450
4,781
Compost composition Water
TS
VS
Total-N
Total-P
As
Pb
Cd
Ca
Cr
K
Cu
Hg
Mg
Ni
Zn
TOC
C/N-ratio
%
%
% TS
mg/kg TS
mg/kg TS
mg/kg TS
mg/kg TS
mg/kg TS
mg/kg TS
mg/kg TS
mg/kg TS
mg/kg TS
mg/kg TS
mg/kg TS
mg/kg TS
mg/kg TS
mg/kg TS
42
58
27
11,000
3,300
3.1
22
0.32
28,000
16
10,000
41
0.053
3,000
5.9
160
100,000
9.1
*Calculated using biogas engine data from Nielsen et al. (2003).

41
Figure 11. Downwind plumes of CH4 and tracer gas from the waste treatment facility and CH4 plumes from two farms near to the facility (Jensen et al., IV).
CH4 emissions from the facility were successfully measured using the mobile tracer dispersion method. Emission measurements were conducted over a pe-riod of three days. In total, 80 plume traverses were obtained during the three-day measuring campaign. Plumes passing through the visual screening were integrated individually to find the methane/tracer gas ratio for each plume transect, as this has been found to be the most accurate method for ob-taining the CH4/tracer gas ratio (Mønster et al., 2014). This was also done in cases where the CH4 and tracer gas plumes did not overlap. The ratio of the areas can be used, as measurements were taken far from the plant and all gas-es (CH4, N2O and C2H2) undergo the same atmospheric dispersion. The emis-sion rate from the individual days was calculated by taking the average of all the emission rates calculated from the accepted plume ratios.
On-site screening showed that important processes resulting in CH4 emissions were the aerobic composting reactor, the anaerobic digester reactor, the com-posting windrows and the biofilter. The average CH4 emissions measured during the three days were 27.5±7.4, 28.5±6.1 and 30.1±11.4 kg CH4 h
-1, re-spectively.
In general, average emissions measured during the three days were very comparable. However, daily changes in operations at the facility influenced
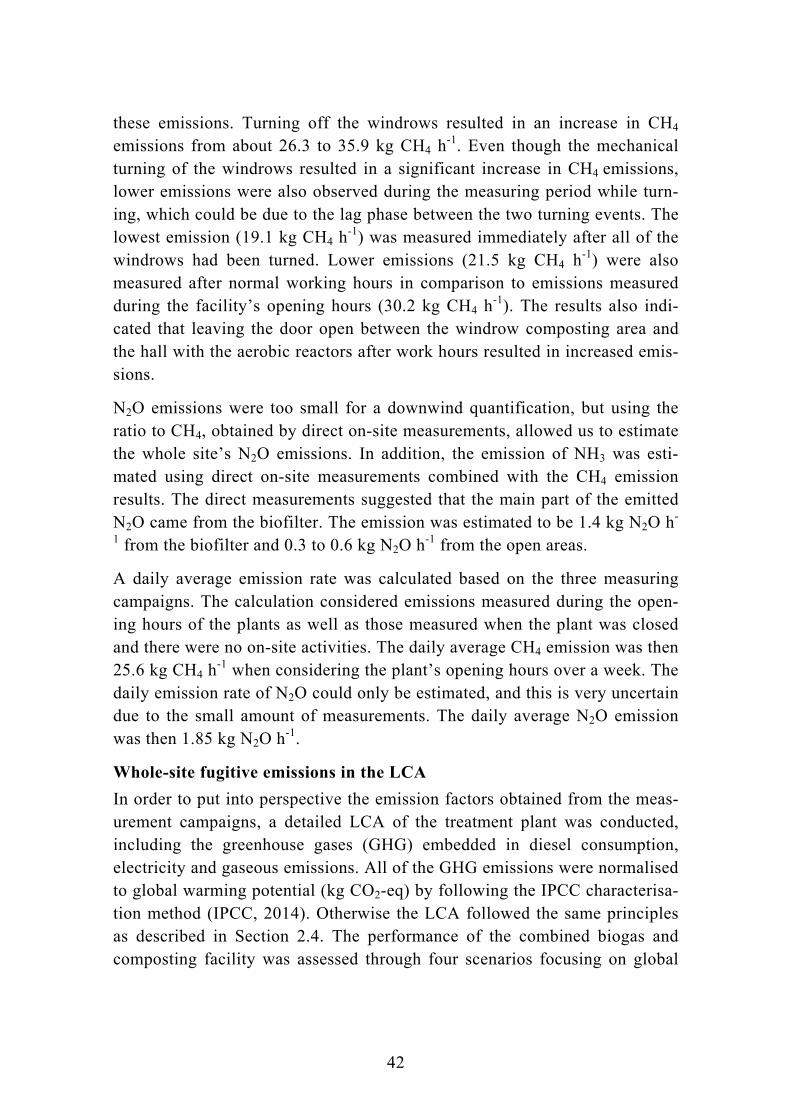
42
these emissions. Turning off the windrows resulted in an increase in CH4 emissions from about 26.3 to 35.9 kg CH4 h-1. Even though the mechanical turning of the windrows resulted in a significant increase in CH4 emissions, lower emissions were also observed during the measuring period while turn-ing, which could be due to the lag phase between the two turning events. The lowest emission (19.1 kg CH4 h
-1) was measured immediately after all of the windrows had been turned. Lower emissions (21.5 kg CH4 h-1) were also measured after normal working hours in comparison to emissions measured during the facility’s opening hours (30.2 kg CH4 h
-1). The results also indi-cated that leaving the door open between the windrow composting area and the hall with the aerobic reactors after work hours resulted in increased emis-sions.
N2O emissions were too small for a downwind quantification, but using the ratio to CH4, obtained by direct on-site measurements, allowed us to estimate the whole site’s N2O emissions. In addition, the emission of NH3 was esti-mated using direct on-site measurements combined with the CH4 emission results. The direct measurements suggested that the main part of the emitted N2O came from the biofilter. The emission was estimated to be 1.4 kg N2O h-
1 from the biofilter and 0.3 to 0.6 kg N2O h-1 from the open areas.
A daily average emission rate was calculated based on the three measuring campaigns. The calculation considered emissions measured during the open-ing hours of the plants as well as those measured when the plant was closed and there were no on-site activities. The daily average CH4 emission was then 25.6 kg CH4 h
-1 when considering the plant’s opening hours over a week. The daily emission rate of N2O could only be estimated, and this is very uncertain due to the small amount of measurements. The daily average N2O emission was then 1.85 kg N2O h-1.
Whole-site fugitive emissions in the LCA
In order to put into perspective the emission factors obtained from the meas-urement campaigns, a detailed LCA of the treatment plant was conducted, including the greenhouse gases (GHG) embedded in diesel consumption, electricity and gaseous emissions. All of the GHG emissions were normalised to global warming potential (kg CO2-eq) by following the IPCC characterisa-tion method (IPCC, 2014). Otherwise the LCA followed the same principles as described in Section 2.4. The performance of the combined biogas and composting facility was assessed through four scenarios focusing on global

43
warming potential and using the on-site and whole-site fugitive measure-ments.
The goal of the LCA was to compare the current performance of the com-bined biogas and composting facility, using different on-site and whole-site fugitive measurements. The assessment focused on global warming potential.
The different scenarios were all based on the current performance of the combined biogas and composting facility, the only change being methane and nitrous oxide emissions. On-site measurements of methane and nitrous oxide were used in scenario 1; on-site measurements of nitrous oxide and whole-site fugitive emissions of methane were used in scenario 2; scenario 3 used on-site measurements of methane and whole-site fugitive measurements of nitrous oxide and scenario 4 used whole-site fugitive measurements for both methane and nitrous oxide. Finally, a fifth scenario was added, including an upgraded version of the facility as described in section 3.1 which increased biogas production, thus increasing electricity and heat substitution. Further-more, heat substitution was increased by utilising all of the heat. Higher bio-gas production also led to higher amounts of methane slipping through the stack, as the slip is a percentage of the biogas combusted in the biogas en-gine. Compost substitution was a bit lower due to the increased degradation of carbon as a result of higher biogas production. Lastly, the fugitive emis-sions used herein were the average annual emissions of CH4 and N2O.
Figure 12 shows the global warming potential for five scenarios. The first four scenarios all have the same savings and loadings when it comes to elec-tricity and heat substitution, substitution with compost, emissions from inter-nal transport and the biogas engine. Differences between the scenarios are found in air emissions measured either by on-site emissions or whole-site fu-gitive emissions. The savings in all cases were due to electricity, heat and compost substitution. Electricity substitution saw the largest saving, due to CO2-intensive marginal electricity production. The substitution of conven-tional fertiliser with compost had the second largest saving, primarily due to carbon sequestration, but also as a result of the provision of conventional fer-tilisers. Finally, savings made from heat substitution, which were quite low, were due to the low substitution rate (lack of capacity of the district heating network). Loadings, to a small extent, came from the engine slip of biogas and internal transportation, while the largest loadings came from air emis-sions of CH4 and N2O. The on-site measurements gave loadings of 39 and 18 kg CO2-equivalent/tonne for CH4 and N2O, respectively, while the whole-site
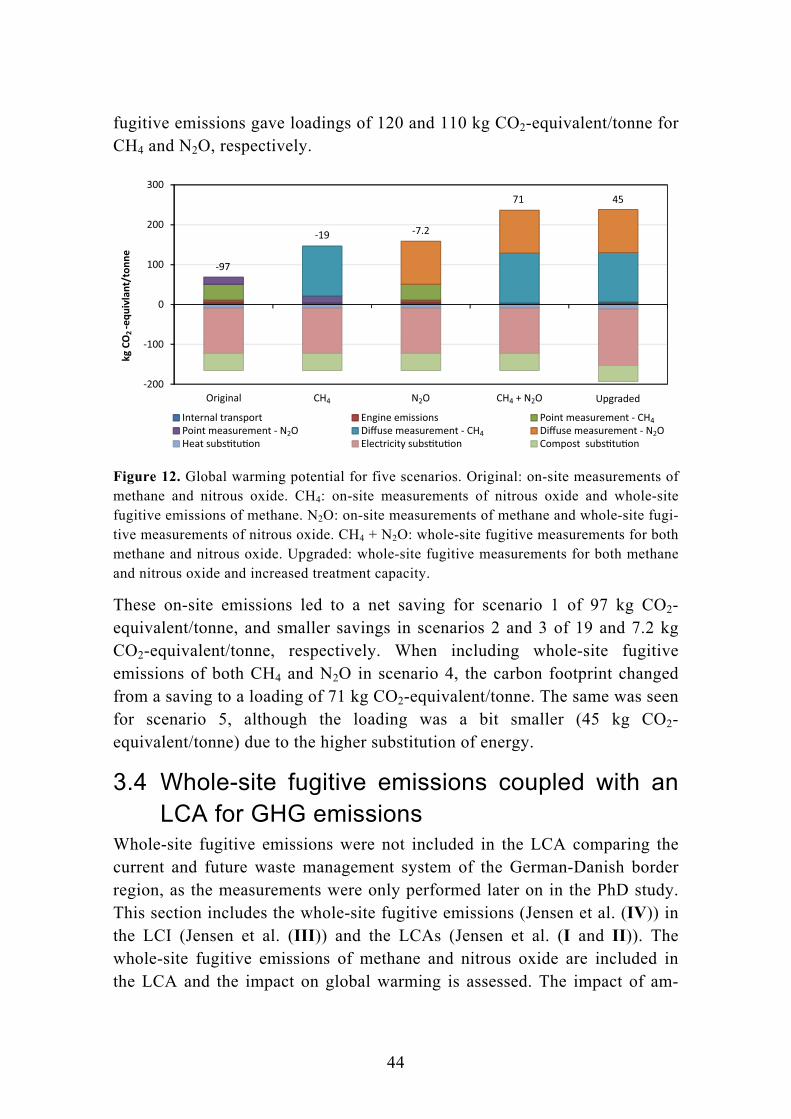
44
fugitive emissions gave loadings of 120 and 110 kg CO2-equivalent/tonne for CH4 and N2O, respectively.
Figure 12. Global warming potential for five scenarios. Original: on-site measurements of methane and nitrous oxide. CH4: on-site measurements of nitrous oxide and whole-site fugitive emissions of methane. N2O: on-site measurements of methane and whole-site fugi-tive measurements of nitrous oxide. CH4 + N2O: whole-site fugitive measurements for both methane and nitrous oxide. Upgraded: whole-site fugitive measurements for both methane and nitrous oxide and increased treatment capacity.
These on-site emissions led to a net saving for scenario 1 of 97 kg CO2-equivalent/tonne, and smaller savings in scenarios 2 and 3 of 19 and 7.2 kg CO2-equivalent/tonne, respectively. When including whole-site fugitive emissions of both CH4 and N2O in scenario 4, the carbon footprint changed from a saving to a loading of 71 kg CO2-equivalent/tonne. The same was seen for scenario 5, although the loading was a bit smaller (45 kg CO2-equivalent/tonne) due to the higher substitution of energy.
3.4 Whole-site fugitive emissions coupled with an LCA for GHG emissions
Whole-site fugitive emissions were not included in the LCA comparing the current and future waste management system of the German-Danish border region, as the measurements were only performed later on in the PhD study. This section includes the whole-site fugitive emissions (Jensen et al. (IV)) in the LCI (Jensen et al. (III)) and the LCAs (Jensen et al. (I and II)). The whole-site fugitive emissions of methane and nitrous oxide are included in the LCA and the impact on global warming is assessed. The impact of am-
-200
-100
0
100
200
300
Upgraded
kg
CO
2-e
qu
ivla
nt/
ton
ne
Original CH4 N O2 CH + N O4 2
Internal transport Engine emissions Point measurement - CH4
Point measurement - N O2 Diffuse measurement - CH4 Diffuse measurement - N O2
Heat subs�tu�on Electricity subs�tu�on Compost subs�tu�on
-97
-19 -7.2
71 45

45
monia is not included, though, as the measurements are very uncertain. Fur-thermore, the LCI from Jensen et al. (III) was updated with values from whole-site fugitive emission measurements. The latter is presented first.
3.4.1 LCI update Whole-site fugitive measurements for all three emissions were higher than for the on-site measurements. For methane, the whole-site fugitive emission was 224,410 kg/year compared to 70,910 kg/year from the on-site measurements, or about three times more. The increase in nitrous oxide was 600%, from 2,648 kg/year to 16,220 kg/year, when comparing the on-site to the whole-site fugitive measurements. For ammonia an increase from 19,280 kg/year to 147,270 kg/year was observed, which equates to 800%. Both on-site point measurements and whole-site fugitive emissions are presented in the LCI in Table 8, and the values should be used together with the values presented in Table 7.
Table 8. Updated gaseous emissions of an LCI of the combined biogas and composting facility.
Gaseous emissions On-site point measurements
CH4
N2O
NH3
kg
kg
kg
70,910
2,648
19,280
Biogas engine
CH4
Nm3
15,883*
Whole-site fugitive emissions
CH4
N2O
NH3
kg
kg
kg
224,410
16,220
147,270
*Calculated using biogas engine data from Nielsen et al. (2003), which assumes a slip of 1.2%. Emissions from the biogas engine should not be used together with the whole-site fugitive emissions, as this would be double-counting.
3.4.2 LCA update The impact of replacing the emissions measured from on-site point sources with the whole-site fugitive emissions was examined by performing two comparisons. These comparisons follow the same LCA method and assump-tions as described in section 3.1 but show the results as CO2-equivalents. The first comparison compared the impact of whole-site fugitive emissions to on-site point measurements for the current German system in the “Global warm-ing” impact category. Two scenarios were compared: scenario 1 used on-site point emission measurements, whereas scenario 2 used whole-site fugitive emissions measured by the tracer dispersion method. The result was a large
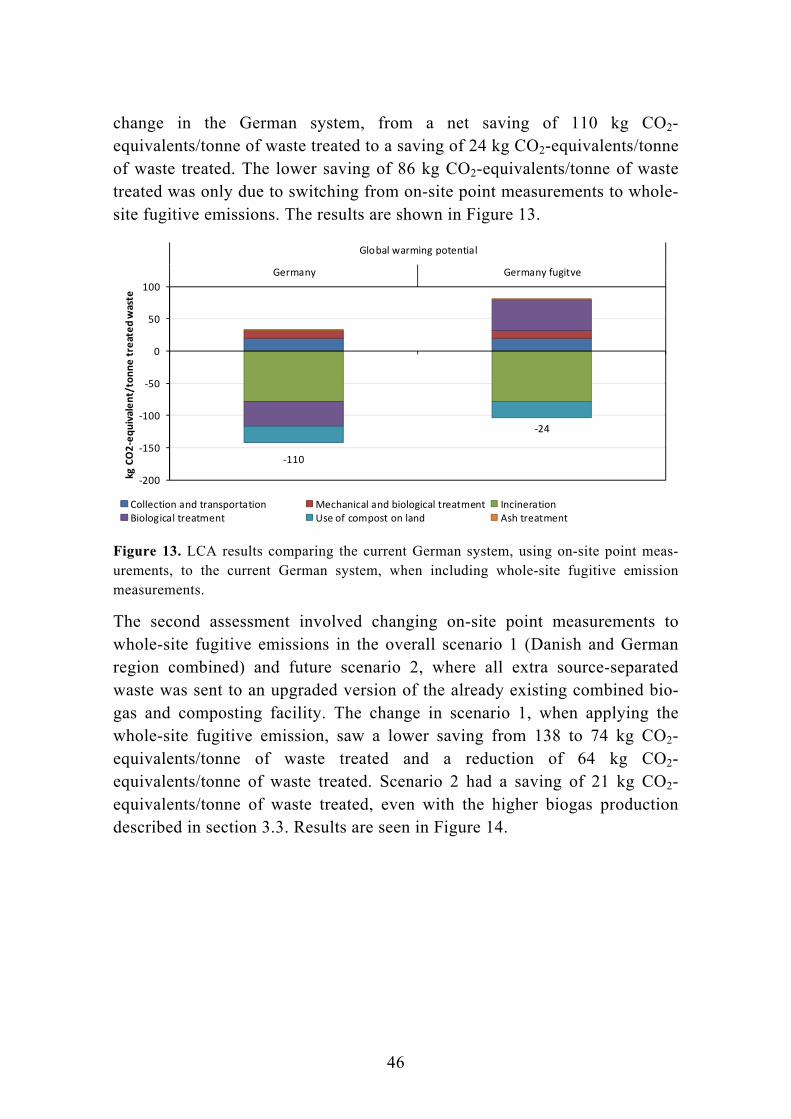
46
change in the German system, from a net saving of 110 kg CO2-equivalents/tonne of waste treated to a saving of 24 kg CO2-equivalents/tonne of waste treated. The lower saving of 86 kg CO2-equivalents/tonne of waste treated was only due to switching from on-site point measurements to whole-site fugitive emissions. The results are shown in Figure 13.
Figure 13. LCA results comparing the current German system, using on-site point meas-urements, to the current German system, when including whole-site fugitive emission measurements.
The second assessment involved changing on-site point measurements to whole-site fugitive emissions in the overall scenario 1 (Danish and German region combined) and future scenario 2, where all extra source-separated waste was sent to an upgraded version of the already existing combined bio-gas and composting facility. The change in scenario 1, when applying the whole-site fugitive emission, saw a lower saving from 138 to 74 kg CO2-equivalents/tonne of waste treated and a reduction of 64 kg CO2-equivalents/tonne of waste treated. Scenario 2 had a saving of 21 kg CO2-equivalents/tonne of waste treated, even with the higher biogas production described in section 3.3. Results are seen in Figure 14.
‐110
‐24
‐200
‐150
‐100
‐50
0
50
100
Germany Germany fugitve
Global warming potential
kg CO2‐equivalent/tonne treated waste
Collection and transportation Mechanical and biological treatment IncinerationBiological treatment Use of compost on land Ash treatment
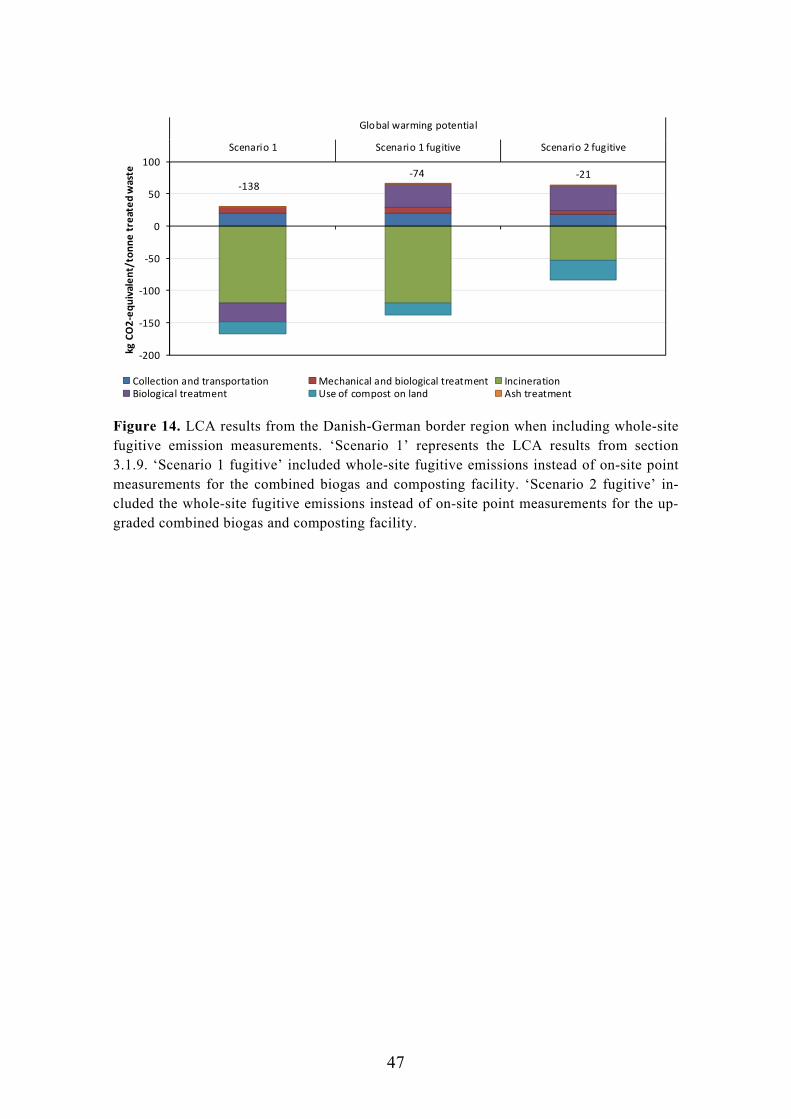
47
Figure 14. LCA results from the Danish-German border region when including whole-site fugitive emission measurements. ‘Scenario 1’ represents the LCA results from section 3.1.9. ‘Scenario 1 fugitive’ included whole-site fugitive emissions instead of on-site point measurements for the combined biogas and composting facility. ‘Scenario 2 fugitive’ in-cluded the whole-site fugitive emissions instead of on-site point measurements for the up-graded combined biogas and composting facility.
‐138‐74 ‐21
‐200
‐150
‐100
‐50
0
50
100
Scenario 1 Scenario 1 fugitive Scenario 2 fugitive
Global warming potentialkg CO2‐equivalent/tonne treated waste
Collection and transportation Mechanical and biological treatment IncinerationBiological treatment Use of compost on land Ash treatment

48
49
4 Conclusions and recommendations The goal of this PhD was to provide an environmental assessment of current and future biowaste management in the Danish-German border region. The main findings of the research are summarised in three subcategories.
4.1 Organic waste management The requirements of the EU, national targets for increasing recycling and the wishes of municipalities to increase recycling are all drivers towards chang-ing the current Danish incineration-heavy system to a system with more recy-cling (biogas production and/or composting). The LCA results, though, did not support any one of the treatment alternatives as an overall best solution, i.e. none of the treatment alternatives was best in all environmental impact categories. This means that municipalities and waste management companies need to prioritise between impact categories, in order to use the LCA to choose between treatment options; for example, “Global warming” mitigation is favoured by incineration, but saving abiotic resources is favoured by bio-logical treatment. Larger differences between scenarios were seen in some case when focussing on one municipality rather than the entire system. It is therefore of utmost importance to display the LCA results in the highest de-gree of detail, when wanting to use LCA as a planning tool. One of the rea-sons for the relatively similar performance in the different scenarios was the fact that the current system and the future options are well-functioning tech-nologies – much greater differences are seen when moving from a ‘bad’ tech-nology (such as open-waste dumping or open-waste fires) to almost any kind of ‘good’ technology. In this respect, the presence of a well-functioning waste management system makes decision-making more difficult. Other fac-tors like cost-benefit analyses or socio-economical assessments and opera-tional stability of the facilities might also influence the decision.
Ultimately, decision-makers need to weigh up the different impact categories according to their priorities and decide which are most important. If the polit-ical goal is to reduce global warming, incineration offers the biggest saving, while political goals for nutrient recycling favour biological treatment facili-ties.
50
4.2 Recommendations Moving towards increasing source separation of organic household waste can be a viable option in the Danish-German border region if a few recommenda-tions are followed.
Increasing source separation will reduce the use of the MBT, which only serves as a stabilisation process for organic waste and hence no substitution or environmental savings take place.
Using optimised combined biogas and composting facilities or co-digestion are preferred over composting alone as the energy production (and related substitution) has a large influence on the LCA results. If wanting to use the existing combined biogas and composting facility it should be optimised. Op-timisation of the combined biogas and composting facility depends on the focus of the facility, namely whether it wants to increase compost or increase biogas production. First, biogas production could potentially be increased through several steps, i.e. increasing retention time during anaerobic diges-tion, shredding the organic waste to improve surface area, increasing the ca-pacity of anaerobic digesters, etc. Increasing the capacity of anaerobic digest-ers to cope with all of the waste received, from 30,000 tonnes/year to 45,000 tonnes/year (an increase of 50%), would potentially raise biogas production by 50%. The increase would be from 51 Nm3 biogas/tonne waste received (29 Nm3 methane) to 76 Nm3 biogas/tonne waste received (44 Nm3 methane). This would however potentially reduce the amount of carbon going into the final compost by up to as much as 50% according to STAN. A reduction of fugitive emissions should also be encouraged as much as possible. One op-tion could be covering the windrow composting area and collecting and treat-ing off-gases in order to reduce methane and ammonia.

51
5 Further research The findings of this PhD provide the basis for further investigations into the following topics.
Whole-site fugitive emissions measurements
The whole-site fugitive emission measurements made as part of this PhD are a major setback for the international wish to source separate organic house-hold waste and promote biological treatment. Emissions potentially flip the environmental performance of a biological treatment facility when looking at global warming potential. Whole-site fugitive emission measurements, how-ever, represent a newly developed field, and so many more measurement campaigns at biological treatment facilities are required, in order to verify the results presented herein.
Improved modelling for compost benefits in LCAs
Compost benefits have been a discussion in LCA circles for more than a dec-ade. Two major pinch points exist. Firstly, many benefits from applying compost on land are not yet quantified from an LCA point of view. Martínez-Blanco et al. (2013) showed how most benefits are not currently possible to implement in an LCA, including crop yield, weed and pest suppression, soil erosion and biodiversity. Secondly, the characterisation of the metals found in compost gives rise to very large (and very uncertain) impacts when using the USEtox model recommended by ILCD. This makes compost-based sys-tems look much worse in ecotoxicity and human toxicity compared to sys-tems not using compost on land.

52
53
6 References Abrahamsen, P., Hansen, S., 2000. Daisy: An open soil-crop-atmosphere system model.
Environ. Model. Softw. 15, 313–330. doi:10.1016/S1364-8152(00)00003-7
Andersen, J.K., Boldrin, a., Christensen, T.H., Scheutz, C., 2012. Home composting as an alternative treatment option for organic household waste in Denmark: An environmental assessment using life cycle assessment-modelling. Waste Manag. 32, 31–40. doi:10.1016/j.wasman.2011.09.014
Andersen, J.K., Boldrin, a., Christensen, T.H., Scheutz, C., 2011. Mass balances and life cycle inventory of home composting of organic waste. Waste Manag. 31, 1934–1942. doi:10.1016/j.wasman.2011.05.004
Arena, U., Mastellone, M.L., Perugini, F., 2003. Arena 2003 The environmental performance of alternative solid waste management options a life cycle assessment study. Chem. Enginering J. 96, 207–222.
Bernstad, a, la Cour Jansen, J., 2012a. Review of comparative LCAs of food waste management systems--current status and potential improvements. Waste Manag. 32, 2439–55. doi:10.1016/j.wasman.2012.07.023
Bernstad, a, la Cour Jansen, J., 2012b. Separate collection of household food waste for anaerobic degradation - Comparison of different techniques from a systems perspective. Waste Manag. 32, 806–815. doi:10.1016/j.wasman.2012.01.008
Bernstad, A., la Cour Jansen, J., Aspegren, H., 2011. Life cycle assessment of a household solid waste source separation programme: a Swedish case study. Waste Manag. Res. 29, 1027–42. doi:10.1177/0734242X11406170
Beta Analytic, 2016a. Radiocarbon Dating, Miami AMS Lab - Beta Analytic [WWW Document]. URL http://www.radiocarbon.com/ (accessed 1.21.16).
Beta Analytic, 2016b. Beta Analytic [WWW Document]. URL http://www.radiocarbon.com/iso-certified.htm (accessed 12.23.15).
Björklund, A., Finnveden, G., Roth, L., 2011. Application of LCA in Waste Management, in: Solid Waste Technology and Management. pp. 137–160.
Bleicherode, 2015. Stowing Mine BLEICHERODE.
Blengini, G.A., 2008. Using LCA to evaluate impacts and resources conservation potential of composting: A case study of the Asti District in Italy. Resour. Conserv. Recycl. 52, 1373–1381. doi:10.1016/j.resconrec.2008.08.002
Blok, K., Huijbregts, M., Patel, M., Hertwich, E., Hauschild, M., Sellke, P., Autunes, P., Hellweg, S., Ciroth, A., Mays, C., Harmelink, M., Ramirez, A., 2013. Handbook on a Novel Methodology for the Sustainability Impact Assessment of New Technologies.
54
Boldrin, A., Andersen, J.K., Møller, J., Christensen, T.H., Favoino, E., 2009. Composting and compost utilization: accounting of greenhouse gases and global warming contributions. Waste Manag. Res. 27, 800–812. doi:10.1177/0734242X09345275
Boldrin, A., Christensen, T.H., 2010. Seasonal generation and composition of garden waste in Aarhus (Denmark). Waste Manag. 30, 551–557. doi:10.1016/j.wasman.2009.11.031
Bruninx, K., Madzharov, D., Delarue, E., William, D., 2013. Impact of the German nuclear phase-out on Europe ’ s electricity generation — A comprehensive study. Energy Policy 1–11. doi:10.1016/j.enpol.2013.05.026
Brunner, P.H., Rechberger, H., 2004. Practical Handbook of Material Flow Analysis.
Bruun, S., Hansen, T.L., Christensen, T.H., Magid, J., Jensen, L.S., 2006. Application of processed organic municipal solid waste on agricultural land – a scenario analysis. Environ. Model. Assess. 11, 251–265. doi:10.1007/s10666-005-9028-0
Bundesministeriums der Justiz, 2013. Dreizehnte Verordnung zur Durchführung des Bundes-Immissionsschutzgesetzes 1–29.
Buratti, C., Barbanera, M., Testarmata, F., Fantozzi, F., 2015. Life Cycle Assessment of organic waste management strategies: an Italian case study. J. Clean. Prod. 89, 125–136. doi:10.1016/j.jclepro.2014.11.012
Börjesson, G., Samuelsson, J., Chanton, J., 2007. Methane oxidation in Swedish landfills quantified with the stable carbon isotope technique in combination with an optical method for emitted methane. Environ. Sci. Technol. 41, 6684–6690. doi:10.1021/es062735v
Börjesson, G., Samuelsson, J., Chanton, J., Adolfson, R., Galle, B., Svenson, B.H., 2009. A national landfill methane budget for Sweden based on field measurements, and an evaluation of IPCC models. Tellus B 61, 424–435. doi:10.1111/j.1600-0889.2008.00409.x
Cencic, O., Rechberger, H., 2008. Material Flow Analysis with Software STAN. EnviroInfo 2008 - Environ. Informatics Ind. Ecol. 2008, 440–447.
Clavreul, J., Baumeister, H., Christensen, T.H., Damgaard, A., 2014. An environmental assessment system for environmental technologies. Environ. Model. Softw. 60, 18–30. doi:10.1016/j.envsoft.2014.06.007
Cleary, J., 2010. The incorporation of waste prevention activities into life cycle assessments of municipal solid waste management systems: methodological issues. Int. J. Life Cycle Assess. 15, 579–589. doi:10.1007/s11367-010-0186-1
Danish Energy Agency, 2016. Ramses [WWW Document]. URL http://www.ens.dk/info/tal-kort/fremskrivninger-analyser-modeller/modeller/ramses (accessed 1.21.16).
EcoInvent, 2016. ecoinvent [WWW Document]. URL http://ecoinvent.ch/ (accessed 1.18.16).
55
Edjabou, M.E., Jensen, M.B., Götze, R., Pivnenko, K., Petersen, C., Scheutz, C., Astrup, T.F., 2015. Municipal solid waste composition: Sampling methodology, statistical analyses, and case study evaluation. Waste Manag. 36, 12–23. doi:10.1016/j.wasman.2014.11.009
Edjabou, V.M.E., Petersen, C., Scheutz, C., Astrup, T.F., 2015. Seasonal variation of household food waste in Denmark.
Eurofins, 2016a. Eurofins Sweden [WWW Document]. URL http://www.eurofins.se/ (accessed 1.21.16).
Eurofins, 2016b. Eurofins Denmark.
Eurofins, 2016c. Eurofins.
European Commission, 2010. Communication on future steps in bio-waste management in the European Union {SEC(2010) 577} 11.
European Commission -- Joint Research Centre -- Institute for Environment and Sustainability, 2010. International Reference Life Cycle Data System (ILCD) Handbook -- General guide for Life Cycle Assessment -- Detailed guidance, Constraints. doi:10.2788/38479
European Parliament, 2008. Directive 2008/98/EC.
Eurostat, 2016. Eurostat [WWW Document]. URL http://ec.europa.eu/eurostat/web/waste/data (accessed 1.21.16).
Franchetti, M., 2013. Economic and environmental analysis of four different configurations of anaerobic digestion for food waste to energy conversion using LCA for: A food service provider case study. J. Environ. Manage. 123, 42–48. doi:10.1016/j.jenvman.2013.03.003
Frischknecht, R., Braunschweig, A., 2000. Human health damages due to ionising radiation in life cycle impact assessment. Environ. Impact Assess. Rev. 20, 159–189.
Frischknecht, R., Editors, N.J., Althaus, H., Doka, G., Dones, R., Heck, T., Hellweg, S., Hischier, R., Nemecek, T., Rebitzer, G., Spielmann, M., 2007. Overview and Methodology.
Fruergaard, T., Christensen, T.H., Astrup, T., 2010. Energy recovery from waste incineration: assessing the importance of district heating networks. Waste Manag. 30, 1264–72. doi:10.1016/j.wasman.2010.03.026
Galle, B.O., Samuelsson, J., Svensson, B.H., Borjesson, G., 2001. Measurements of methane emissions from landfills using a time correlation tracer method based on FTIR absorption spectroscopy. Environ. Sci. Technol. 35, 21–25. doi:10.1021/es0011008
German Environmental Protection Agency, 2016. Abfallaufkommen [WWW Document]. URL http://www.umweltbundesamt.de/daten/abfall-kreislaufwirtschaft/abfallaufkommen (accessed 1.21.16).

56
Goedkoop, M., Heijungs, R., Huijbregts, M., Schryver, A. De, Struijs, J., Zelm, R. Van, 2009. ReCiPe : A life cycle impact assessment method which comprises harmonised category indicators at the midpoint and the endpoint level.
Greco, S.L., Wilson, A.M., Spengler, J.D., Levy, J.I., 2007. Spatial patterns of mobile source particulate matter emissions-to-exposure relationships across the United States. Atmos. Environ. 41, 1011–1025. doi:10.1016/j.atmosenv.2006.09.025
Grosso, M., Nava, C., Testori, R., Rigamonti, L., Vigano, F., 2012. The implementation of anaerobic digestion of food waste in a highly populated urban area: an LCA evaluation. Waste Manag. Res. 30, 78–87. doi:10.1177/0734242X12453611
Guinée, J., 2002. Handbook on Life Cycle Assessment - Operational Guide to the ISO standards.
Gy, P., 1998. Sampling for Analytical Purposes.
Hauschild, M.Z., Barlaz, M.A., 2011. LCA of Waste Management Systems LCA in Waste Management : Introduction to Principle and Method.
IPCC, 2014. Climate Change 2014: Synthesis Report. Contribution of Working Groups I, II and III to the Fifth Assessment Report of the Intergovernmental Panel on Climate Change, Ipcc.
ISO, 2008. Environmental management - Life cycle assessment - Principles and framework.
Jacobsen, J.B., Neidel, T.L., Kromann, M., Jensen, M.B., Møller, J., 2013. Miljø- og samfundsøkonomisk vurdering af muligheder for øget genanvendelse af papir , pap , plast , metal og organisk affald fra dagrenovation.
JRC, 2011. Supporting Environmentally Sound Decisions for Bio-Waste Management. I. doi:10.2788/53942
Justesen, J.S., Nielsen, L.L., 2014. Danmark uden affald Ressourceplan for affaldshåndtering 2013-2018, Miljøstyrelsen, Vejledning fra Miljøstyrelsen nr. 4.
Kim, M.-H., Kim, J.-W., 2010. Comparison through a LCA evaluation analysis of food waste disposal options from the perspective of global warming and resource recovery. Sci. Total Environ. 408, 3998–4006. doi:10.1016/j.scitotenv.2010.04.049
Kirkeby, J.T., Birgisdottir, H., Hansen, T.L., Christensen, T.H., Bhander, G.S., Hauschild, M., 2006. Environmental assessment of solid waste systems and technologies: EASEWASTE. Waste Manag. Res. 24, 3–15. doi:10.1177/0734242X06062580
Larsen, A.W., Vrgoc, M., Christensen, T.H., Lieberknecht, P., 2009. Diesel consumption in waste collection and transport and its environmental significance. Waste Manag. Res. 27, 652–659. doi:10.1177/0734242X08097636
57
Martínez-Blanco, J., Colón, J., Gabarrell, X., Font, X., Sánchez, A., Artola, A., Rieradevall, J., 2010. The use of life cycle assessment for the comparison of biowaste composting at home and full scale. Waste Manag. 30, 983–994. doi:10.1016/j.wasman.2010.02.023
Martínez-Blanco, J., Lazcano, C., Christensen, T.H., Muñoz, P., Rieradevall, J., Møller, J., Antón, A., Boldrin, A., 2013. Compost benefits for agriculture evaluated by life cycle assessment. A review. Agron. Sustain. Dev. 33, 721–732. doi:10.1007/s13593-013-0148-7
Ministry of Environment and Food of Denmark, 2013. Vejledning om gødsknings- og harmoniregler.
Montejo, C., Tonini, D., Márquez, M.D.C., Astrup, T.F., 2013. Mechanical-biological treatment: performance and potentials. An LCA of 8 MBT plants including waste characterization. J. Environ. Manage. 128, 661–73. doi:10.1016/j.jenvman.2013.05.063
Møller, J., Boldrin, A., Christensen, T.H., 2009. Anaerobic digestion and digestate use: accounting of greenhouse gases and global warming contribution. Waste Manag. Res. 27, 813–824. doi:10.1177/0734242X09344876
Mønster, J.G., Samuelsson, J., Kjeldsen, P., Rella, C.W., Scheutz, C., 2014. Quantifying methane emission from fugitive sources by combining tracer release and downwind measurements - A sensitivity analysis based on multiple field surveys. Waste Manag. 34, 1416–1428. doi:10.1016/j.wasman.2014.03.025
Naroznova, I., Møller, J., Scheutz, C., 2013. Life Cycle Assessment of pretreatment technologies for anaerobic digestion of source-separated organic household waste. Proc. Sardinia 2013, Fourteenth Int. Waste Manag. Landfill Symp.
Nielsen, M., Illerup, J., Eltra, P., 2003. Emissionsfaktorer og emissionsopgørelse for decentral kraftvarme, Ministry of Environment (Denmark).
NOAH, 2015. NOAH [WWW Document]. URL http://www.noah.no/For-kunder/Behandlingssteder/Lang%C3%B8ya (accessed 12.7.15).
Posch, M., Seppala, J., Hettelingh, J.P., Johansson, M., Margni, M., Jolliet, O., 2008. The role of atmospheric dispersion models and ecosystem sensitivity in the determination of characterisation factors for acidifying and eutrophying emissions in LCIA. Int. J. Life Cycle Assess. 13, 477–486. doi:10.1007/s11367-008-0025-9
Rabl, A., Spadaro, J. V., 2014. Riskpoll. Igarss 2014 1–5. doi:10.1007/s13398-014-0173-7.2
Riber, C., Christensen, T.H., 2006. Måling af tungmetaller i dansk dagrenovation og småt brændbart. Miljøprojekt nr. 1085.
Rigamonti, L., Grosso, M., Giugliano, M., 2009. Life cycle assessment for optimising the level of separated collection in integrated MSW management systems. Waste Manag. 29, 934–944. doi:10.1016/j.wasman.2008.06.005
58
Rosenbaum, R.K., Bachmann, T.M., Gold, L.S., Huijbregts, M. a J., Jolliet, O., Juraske, R., Koehler, A., Larsen, H.F., MacLeod, M., Margni, M., McKone, T.E., Payet, J., Schuhmacher, M., Van De Meent, D., Hauschild, M.Z., 2008. USEtox - The UNEP-SETAC toxicity model: Recommended characterisation factors for human toxicity and freshwater ecotoxicity in life cycle impact assessment. Int. J. Life Cycle Assess. 13, 532–546. doi:10.1007/s11367-008-0038-4
Scheutz, C., Samuelsson, J., Fredenslund, a. M., Kjeldsen, P., 2011. Quantification of multiple methane emission sources at landfills using a double tracer technique. Waste Manag. 31, 1009–1017. doi:10.1016/j.wasman.2011.01.015
Seppälä, J., Posch, M., Johansson, M., Hettelingh, J.-P., 2006. Country-dependent Characterisation Factors for Acidification and Terrestrial Eutrophication Based on Accumulated Exceedance as an Impact Category Indicator. Int. J. Life Cycle Assess. 11, 403–416. doi:10.1065/lca2005.06.215
Sonesson, U., Björklund, a., Carlsson, M., Dalemo, M., 2000. Environmental and economic analysis of management systems for biodegradable waste. Resour. Conserv. Recycl. 28, 29–53. doi:10.1016/S0921-3449(99)00029-4
Turconi, R., 2014. Life Cycle Assessment of Electricity Systems. Technical University of Denmark.
Turconi, R., Butera, S., Boldrin, A., Grosso, M., Rigamonti, L., Astrup, T., 2011. Life cycle assessment of waste incineration in Denmark and Italy using two LCA models. Waste Manag. Res. 29, 78–90. doi:10.1177/0734242X11417489
van Zelm, R., Huijbregts, M.A.J., den Hollander, H.A., van Jaarsveld, H.A., Sauter, F.J., Struijs, J., van Wijnen, H.J., van de Meent, D., 2008. European characterization factors for human health damage of PM10 and ozone in life cycle impact assessment. Atmos. Environ. 42, 441–453. doi:10.1016/j.atmosenv.2007.09.072
Weidema, B.P., Wesnæs, M.S., 1996. Data quality management for LCI - an example of using data quality indicators. J. Clean. Prod.
Wittmaier, M., Langer, S., Sawilla, B., 2009. Possibilities and limitations of life cycle assessment (LCA) in the development of waste utilization systems - Applied examples for a region in Northern Germany. Waste Manag. 29, 1732–8. doi:10.1016/j.wasman.2008.11.004
Witzenhausen-Institut, 2012. Messung und Bewertung klimarelevanter Emissionen der Bioabfallvergärungsanlage Borgstedt.
Witzenhausen-Institut, 2009. Durchführung von Restmüllanalysen im Durchführung von Restmüllanalysen im Landkreis Rendsburg-Eckernförde August 2009.
Yoshida, H., Mønster, J., Scheutz, C., 2014. Plant-integrated measurement of greenhouse gas emissions from a municipal wastewater treatment plant. Water Res. 61, 108–118. doi:10.1016/j.watres.2014.05.014
59
7 Papers
I Jensen, M. B., Møller, J. & Scheutz, C. 2016. Comparison of the organic waste management systems in the Danish-German border region using life cycle assessment (LCA). Waste Management. DOI: 10.1016/j.wasman.2016.01.035
II Jensen, M. B., Møller, J. & Scheutz, C. 2016. Life cycle assessment (LCA) as an environmental planning tool for an organic waste management system in the Danish-German border region. Submitted to Waste Management.
III Jensen, M. B., Møller, J. & Scheutz, C. 2016. Assessment of a combined anaerobic and aerobic treatment facility for source-separated organic household waste using material and substance flow analysis and life cycle inventory. Submitted to Waste Management.
IV Jensen, M. B., Møller, J., Mønster, J. & Scheutz, C. 2016. Quantification of greenhouse gas emissions from a biological waste treatment facility. Submitted to Waste Management.
In this online version of the thesis, papers I-IV are not included but can be obtained from electronic article databases, e.g. www.orbit.dtu.dk or on request from:
DTU Environment Technical University of Denmark Miljoevej, Building 113 2800 Kgs. Lyngby Denmark [email protected]


Technical University of Denmark
DTU Environment
Department of Environmental Engineering
Miljoevej, building 113
2800 Kgs. Lyngby
Denmark
Phone: +45 4525 1600
Fax: +45 4593 2850
e-mail: [email protected]
www.env.dtu.dk
The Department of Environmental Engineering (DTU Environment) conducts
science-based engineering research within four sections:
Water Resources Engineering, Urban Water Engineering,
Residual Resource Engineering and Environmental Chemistry & Microbiology.
The department dates back to 1865, when Ludvig August Colding, the
founder of the , gave the first lecture on sanitary engineering as
response to the cholera epidemics in Copenhagen in the late 1800s.
department