toppling
TRANSCRIPT

International Journal of Rock Mechanics & Mining Sciences 38 (2001) 421–435
A general analytical solution for the required anchor forcein rock slopes with toppling failure
C. Sagaseta*, J.M. S!anchez, J. Ca *nizal
Department of Ground Engineering and Material Sciences. University of Cantabria. Avda. de Los Castros, s/n. 39005 Santander, Spain
Accepted 5 February 2001
Abstract
A general analytical solution is presented for the limit equilibrium of block toppling failure in rock slopes. The method followsthe well-known solution of Goodman and Bray, but with infinitesimal thickness of blocks. This leads to a set of ordinary differentialequations that can be integrated in cases of simple geometry. The case of a uniform slope is analysed in detail. Two main failure
modes have been identified: sliding toe (ST), and tension toe (TT), depending on the relative values of the dip, cut slope and frictionangle. The solution can be considered as accurate enough for slopes higher than 20–30 times the average block thickness. For thickerblocks, a linear reduction of the force is proposed. The method has been applied to a number of actual cases and a particular
example is presented in detail. # 2001 Elsevier Science Ltd. All rights reserved.
1. Introduction
Toppling failure of rock slopes is associated with rockmasses with a dominant discontinuity set (usuallybedding or foliation) with strike nearly parallel to theslope, dipping inwards. This mode of failure has beenobserved at different scales either in natural slopes or inopen cuts for mining or civil engineering works.The most frequent corrective measures to increase the
stability are the installation of anchors or bolts, orlowering the slope angle by excavation. The determina-tion of the necessary anchor force to stabilise the slope isrequired (even in the cases where the second solution ischosen), for the evaluation of the relative costs involved.For this purpose, the limit equilibrium method proposedby Goodman and Bray [1] is often used, althoughnumerical analyses based on the distinct element methodhave also an increasing application.
2. Limit Equilibrium of blocks
In the limit equilibrium method, the unstable mass isassumed bounded by a basal plane, at some angle y withthe horizontal (Fig. 1). The equilibrium of the blocks
delimited by bedding planes and transverse joints isanalysed from the top of the slope downwards. Theforce transmitted by each block to the next one (P, Q) isdetermined from the conditions of stability againsttoppling and sliding, with the maximum of these twovalues defining the mode of instability of the block. Atthe toe of the slope, the force required to maintain theequilibrium, F , is obtained. This anchor force can beapplied at some angle d to the horizontal.The analysis is performed in two dimensions (plane
strain). All the forces, denoted in the following withuppercase letters, are in fact line loads in the directionperpendicular to the slope. Their values are understoodas loads per unit length of slope.The features of the solution in a typical case are
shown in Fig. 1. The first few upper blocks are usuallystable (the forces required for stability are negative),until the toppling condition is reached for a given block.The toppling zone can extend to the entire slope, orchange to sliding near the toe, as in the case of Fig. 1.Kinematical constraints mean that once a block slides, itforces the sliding of all the blocks situated below it.Since its publication, this method has been generalised
by different authors to include factors such as obliquejoints, seismic forces, water pressures in the joints orprobabilistic analysis for random distribution of some ofthe involved parameters [2]. Zanbak [3] has used themethod to produce non-dimensional design charts.
*Corresponding author. Tel.: +34-942-20-18-22; fax: +34-942-20-
18-21.
E-mail address: [email protected] (C. Sagaseta).
1365-1609/01/$ - see front matter # 2001 Elsevier Science Ltd. All rights reserved.
PII: S 1 3 6 5 - 1 6 0 9 ( 0 1 ) 0 0 0 1 1 - 9

Fig. 2 shows a parametric study of a particuglar case.A 508 slope is analysed for two values of the dip of thedominant discontinuity set, 658 and 808. The angles offriction are 308 along the bedding planes (fi) and 358along the transverse joints (fb). The basal plane formsan angle of 58 with the line normal to the dip. Thenecessary anchor force in non-dimensional form isplotted against the thickness of the strata, t, represented
by a slenderness parameter (l ¼ H=t, where H is theheight of the slope). There is a threshold value of H/t ofabout 10, below which the slope is stable without ananchoring force. The necessary force increases withdecreasing block thickness, and for slenderness of 20–30,it reaches about 80% of the asymptotic value for t ! 0.But the most striking result is perhaps the existence ofpeaks in the curve for a dip of 808, in contrast with thesmooth variation of the force in the other case.These results illustrate the practical interest calculat-
ing the asymptotic force for H=t ! 1. It is an upperbound, but in many cases it is not too far from theactual value. It can also be useful for identifying somefeatures of the solution and the role of the differentgoverning parameters (for instance, to determine thereason and range of the two behaviours depicted inFig. 2).This sort of calculation was undertaken by the writers
a few years ago, and the results were presented in a formsuitable for practical use, in equations and design charts[4]. Since then, the method has gained some diffusion inSpain, and it has been applied to a number of actualcases. Working independently, Bobet [5] has recentlypublished a similar analysis, but the results cover only agroup of cases, namely: (i) the slope angle is lower than agiven critical value (b5aþ fi) (see Figs. 1 and 4 fornotation), and (ii) the basal plane is normal to the strata(y ¼ a).
Nomenclature
h height of individual blockst block thicknessF anchor load per unit length of slopeH height of slopekT coefficient for anchor load per unit
length of slope (Eq. (24))L total length of the unstable mass
along OX (abscissa of the toe)P normal force per unit length of slope
transmitted between blocksPT normal force per unit length of slope
transmitted to the toe wedgeWT weight of the toe wedge per unit
length of slopexB abscissa of the slope crestxT abscissa of the toe wedgea inclination of the line normal to dip
(¼ 908� Z)b slope anglebg slope of the natural ground above the
crest
g unit weight of the rock massd inclination of the anchor forceZ dip of the stratal slenderness ratio (¼ H=t)lcr critical slenderness ratio for insta-
bilityfb friction angle along transverse jointsfi friction angle between bedding
planesr angle of the anchor load with the line
normal to dip (¼ d� a)c angle of the slope with the line normal
to dip (¼ b� a)s; t normal and shear stresses at the base
of the blocksy inclination of the basal planex angle of the basal plane with the line
normal to dip (¼ y� a)o angle of the natural ground with the
line normal to dip (¼ bg � a)f0b, f
0i, c
0, o0 see Eq. (6)
Fig. 1. Limit equilibrium of blocks (Goodman and Bray [1], adapted
notation).
C. Sagaseta et al. / International Journal of Rock Mechanics & Mining Sciences 38 (2001) 421–435422

The first of these restrictions is linked to difficulties inthe analytical solution and this is commented below indetail. A literature survey of actual cases of topplingslopes shows that about half of them are above thislimit. This justifies the extension of the solution to coveralso this case.With respect to the second restriction and the basal
plane, its observed inclination y (or its selected designvalue) is usually steeper than a, typically at 35–458 to thehorizontal. This means a considerable deviation fromthe normal to the strata, especially in cases with highvalue of the dip angle. In any case, the base of eachblock is always inclined an angle a with the horizontal,and hence the base plane is in fact a stepped surface, asin Fig. 1. This limits the modes of failure to toppling andsliding of blocks, in contrast with the plane base linecase, in which many other mechanisms are possible, asdiscussed by Goodman and Bray [1]. A significantreduction of the necessary anchor force at the toe isobserved when the angle xð¼ y� aÞ increases. As it willbe shown later (Fig. 11), the force calculated for thedesign value of x in some selected cases is significantlyless than the value for x ¼ 0. Hence, the inclusion of y asan additional independent variable, different from a, isjustified.For these reasons, and given that the publication [4]
was only of National scope, the general solution ispresented here.
3. Continuum approach
3.1. General assumptions
When the spacing of discontinuities t decreasesindefinitely (H=t ! 1), the blocks transform into
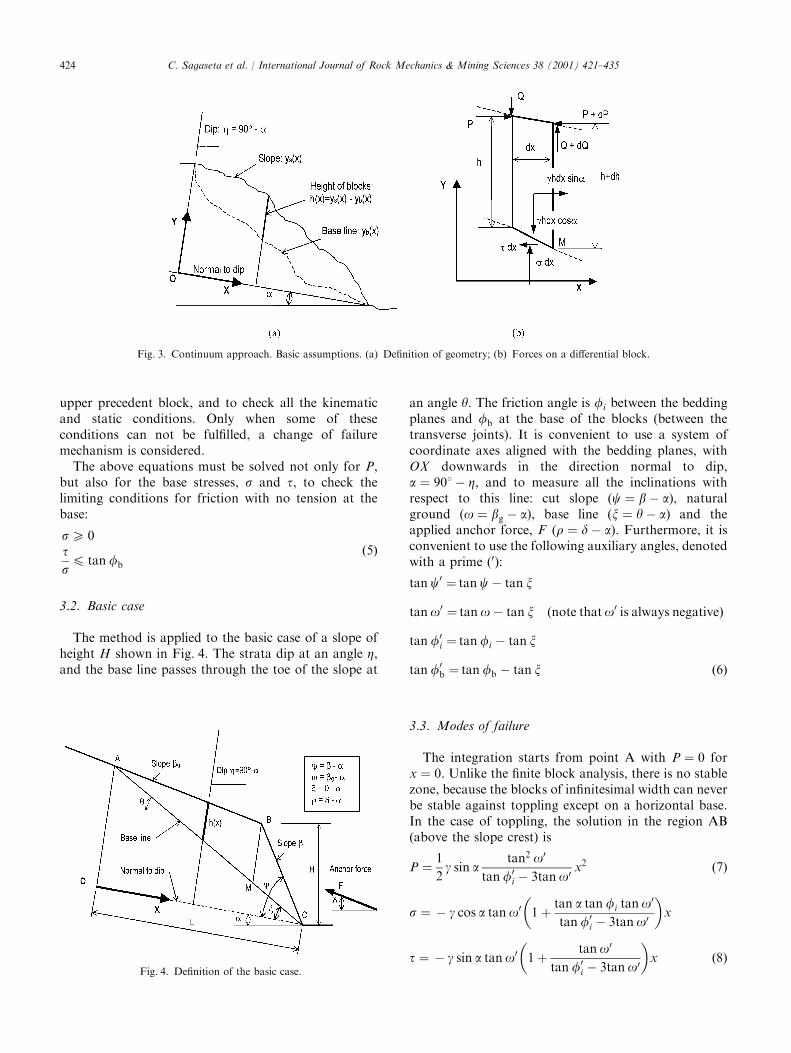
differential slices of width dx (Fig. 3), and hence theequilibrium equations in the Goodman and Bray [1]method lead to ordinary differential equations that canbe easily integrated in many cases.The geometry and the forces acting on a differential
block are given in Fig. 3. The slope surface and the baseline can have any irregular shape, defined by ysðxÞ andybðxÞ, respectively. In any case, the base of each block isalways normal to dip, at an angle a with the horizontal(the base line has an infinitesimally stepped nature).The axes OX and OY are taken normal and parallel todip.The analysis retains the basic assumptions in Good-
man and Bray [1] method about the transmitted forces(full mobilisation of friction fi, point of force applica-tion at the top of the blocks). The equilibrium of thedifferential block (forces and moments about M) gives,after solving for the normal force, P, and base stresses,s and t:
* For toppling:
dP
dxþ1
h
dysdx
þ tan fi
� �P ¼
1
2gh sin a ð1Þ
s ¼ gh cos a�dP
dxtan fi
t ¼ gh sin a�dP
dxð2Þ
* For sliding:
dP
dx¼ gh cos a
tan a� tan fb1� tan fb tan fi
ð3Þ
s ¼ gh cos a1� tan a tan fi
1� tan fb tan fi
t ¼ s tan fb ¼ gh cos a tan fb1� tan a tan fi
1� tan fb tan fi
ð4Þ
In all the formulation, all the forces, denoted withuppercase letters (P, Q, F , W) are in fact line loads inthe direction perpendicular to the slope. Their values areunderstood as loads per unit length of slope.The ordinary differential equations (1) and (3) are
easy to integrate from top of the slope downwards forany given geometry (functions ysðxÞ and ybðxÞ), startingfrom the initial condition P ¼ 0 for x ¼ 0.When different failure modes are possible in a given
system, it is usual to analyse all of them in parallel, andto select the one giving the maximum force. However,this must be done with caution, even in apparentlysimple cases. In fact, only one of the possible modessatisfies all the kinematic and static constraints [6]. So, incases like the present one, in which an infinite series ofunstable blocks is analysed, it is better to assume thatthe failure mode of each block is the same as of the
Fig. 2. Influence of block thickness in a typical case.
C. Sagaseta et al. / International Journal of Rock Mechanics & Mining Sciences 38 (2001) 421–435 423
upper precedent block, and to check all the kinematicand static conditions. Only when some of theseconditions can not be fulfilled, a change of failuremechanism is considered.The above equations must be solved not only for P,
but also for the base stresses, s and t, to check thelimiting conditions for friction with no tension at thebase:
s5 0ts4 tan fb
ð5Þ
3.2. Basic case
The method is applied to the basic case of a slope ofheight H shown in Fig. 4. The strata dip at an angle Z,and the base line passes through the toe of the slope at
an angle y. The friction angle is fi between the beddingplanes and fb at the base of the blocks (between thetransverse joints). It is convenient to use a system ofcoordinate axes aligned with the bedding planes, withOX downwards in the direction normal to dip,a ¼ 908� Z, and to measure all the inclinations withrespect to this line: cut slope (c ¼ b� a), naturalground (o ¼ bg � a), base line (x ¼ y� a) and theapplied anchor force, F (r ¼ d� a). Furthermore, it isconvenient to use the following auxiliary angles, denotedwith a prime (0):
tan c0 ¼ tan c� tan x
tano0 ¼ tano� tan x ðnote thato0 is always negativeÞ
tan f0i ¼ tan fi � tan x
tan f0b ¼ tan fb � tan x ð6Þ
3.3. Modes of failure
The integration starts from point A with P ¼ 0 forx ¼ 0. Unlike the finite block analysis, there is no stablezone, because the blocks of infinitesimal width can neverbe stable against toppling except on a horizontal base.In the case of toppling, the solution in the region AB(above the slope crest) is
P ¼1
2g sin a
tan2 o0
tan f0i � 3tano0
x2 ð7Þ
s ¼ � g cos a tano0 1þtan a tan fi tano
0
tan f0i � 3tano0
� �x
t ¼ � g sin a tano0 1þtano0
tan f0i � 3tano0
� �x ð8Þ
Fig. 3. Continuum approach. Basic assumptions. (a) Definition of geometry; (b) Forces on a differential block.
Fig. 4. Definition of the basic case.
C. Sagaseta et al. / International Journal of Rock Mechanics & Mining Sciences 38 (2001) 421–435424

The conditions (5), in particular the sliding limit, implyan upper bound for a, defined by
tan a� tan fb ¼ �tano0 tan a1� tan fi tan fbtan f0
i � 3tano0ð9Þ
The right-hand side of Eq. (9) is always positive, sothe range of a for toppling extends beyond the apparentlimit (a ¼ fb).If this condition is not satisfied, sliding occurs. Then
the whole wedge ABC slides, and the solution is trivial.This mode is called ‘general sliding’ (GS). The trans-mitted force from A to C is in this case:
P ¼ �1
2g cos a tano0 tan a� tan fb
1� tan fi tan fbx2 ð10Þ
At the slope crest (point B), the normal force is giveneither by Eqs. (7) or (10) for x ¼ xB, where
xB ¼ L�Hcos csin b
¼ �Hcoso sin c0
sin b sino0 ð11Þ
Beyond this point (and excluding the trivial case ofgeneral sliding) the solution for the slope face BC in thecase of toppling is:
P ¼1
2g sin a
tan2 c0
tan f0i � 3tan c
0 ðL� xBÞ2 L� x
L� xB
� �2"
�3tan c0 � tano0
tan f0i � 3tano0
L� x
L� xB
� �tan f0i=tan c0�1
#ð12Þ
s ¼ g cos a tan c0 L� xð Þ � tan fi
dP
dx
t ¼ g sin a tan c0 L� xð Þ �dP
dxð13Þ
The variation of the transmitted forces and the basestresses is shown in Fig. 5. Two different situations arisedepending of the sign of the exponent in the last termof Eq. (12). This condition, (c5fi) or (c > fi), coin-cides with the so-called kinematic criterion by Goodmanand Bray [1]. In the present analysis, it does notdefine a limit for stability but the transition betweentwo different mechanisms of failure, as describedbelow.
3.3.1. Case 1 (c5fi) ‘sliding toe’ (ST)The exponent is positive, and the force tends to zero
at the toe (x ! L) (Fig. 5a). The ratio t/s increases fromB to C, reaching the sliding condition (t=s ¼ tan fb) atsome point M. Hence, the lower part of the slope slides.In the following, this case is called ‘sliding toe’ (ST).The position of the transition point M, xT, and thecorresponding normal force, PT, are defined by the
sliding condition imposed by the base stresses (13):
L� xTL� xB
� �tan f0i=tan c0�3
¼2ðtan f0
i � 3tano0Þtan c0
3 tan c0 � tano0� �
tan f0i � tan c
0� �
1þ3tan c0 � tan f0
i
tan a tan c0 tan fb � tan a1� tan fi tan fb
� �ð14Þ
PT is then given by (12) with x ¼ xT.Equilibrium below this point can be analysed using
the differential equation for sliding (3), with the result:
P ¼PT �1
2g cos a tan c0 tan fb � tan a
1� tan fb tan fi
L� xTð Þ2� L� xð Þ2� �
ð15Þ
Alternatively, the force at the toe (x ¼ L) can beobtained from the global equilibrium of the slidingwedge below xT. This leads to the same result as Eq. (15)with x ¼ L.There is a slope angle for which the force at the toe is
zero, and hence the slope is stable. This condition is
Fig. 5. Transmitted forces and base stresses. (a) Sliding toe (ST)
(c5fi); (b) Tension toe (TT) (c > fi).
C. Sagaseta et al. / International Journal of Rock Mechanics & Mining Sciences 38 (2001) 421–435 425
given by
tan c0 ¼tan f0
i
3þ tan a1� tan fb tan fi
tan fb � tan a
ð16Þ
It will be noted that this is a relatively flat slope, withan angle less than fi=3 above the normal to dip (a) line.In the case of base line normal to the strata (y=a), the
above results coincide with the expressions given byBobet [5].
3.3.2. Case 2 (c > fi) ‘tension toe’ (TT)The exponent of (L� x) is negative, and the toppling
force tends to infinite at the toe (x ! L) (Fig. 5b). In thesolution presented by Bobet [5], this case is not analysedfurther. However, an infinite force is unrealistic, and inpractice it must be possible to stabilise the slope with theaction of some finite force. A possible way of solvingthis difficulty could be to stop the integration at somepoint before reaching the toe and to consider the force atthis point. However, this would mean unacceptabledifferences in the resulting load depending on the preciseposition of the selected point.The analysis of the base stresses throws some light
into the problem (Fig. 5b). The shear stress decreasestowards the toe, and it even becomes negative, so thefriction condition is never violated (the shear stress isnot bounded in the upward direction, due to the steppednature of the base line). However, the normal stress alsodecreases and before reaching the toe it becomes zeroand then negative from a given point M. As the rockmass can not sustain these tensile stresses, the obtainedsolution (with the force tending to infinity) is not validbelow this point, thus the equilibrium condition must bereformulated for this zone. This case is denoted as‘tension toe’ (TT). The position of the point of tensilefailure M, xT, and the corresponding force, PT, areobtained by imposing the limit condition (s ¼ 0) to thebase stresses (13):
L� xTL� xB
� �tan f0i=tan c0�3
¼2
3
tan f0i � 3tano
0
tan c0 � tano0
tan c0
tan f0i � tan c
0
1�3tan c0 � tan f0
i
tan a tan c0 tan fi
ð17Þ
and then PT is given by (12) with x ¼ xT.There is no possibility of self-equilibrium below the
tension point without the action of the external anchorforce, which must be distributed along that part of theslope. As a result, the blocks below the tension pointmove together as a monolithic wedge. The globalequilibrium of this wedge against either sliding ortoppling gives the necessary force. These two sub-casesare called ‘tension toe-sliding wedge’ (TT–SW) and‘tension toe-toppling wedge’ (TT–TW), depending onthe critical mode for the toe wedge.
3.3.3. Singular casesThere are two singular cases, evident from the
structure of expression (12). The first one (tan f0i=
tan c0 ¼ 1) corresponds to the limit between ST andTT cases, when the limit points for base sliding andtension are both located precisely at the toe of the slope(xT ¼ L). The force at this point is given by
PT ¼3
4g sin a tan f0
i
tan f0i � tano
0
tan f0i � 3tano0
ðL� xBÞ2 ð18Þ
The second case (tan f0i=tan c
0 ¼ 3) falls within therange for ST, and it has no particular interest. Solvingfor the limit, Eq. (14) leads to
L� xTL� xB
¼
exptan c0
tan f0i � 3tano0
�1
tan atan fb � tan a1� tan fi tan fb
�1
2
ð19Þ
and PT is then given by (12) as in the general case.The above results explain the differences found
between the two cases presented in Fig. 2. The casewith 658 dip is of ST type (c0 ¼ 108, f0
i ¼ 268), and the808 dip is of TT type (c0 ¼ 378, f0
i ¼ 268). The existenceof peaks in the load variation is always associated withTT cases, while the sliding toe condition produces asmooth variation of load.Laboratory tests have provided evidence of both the
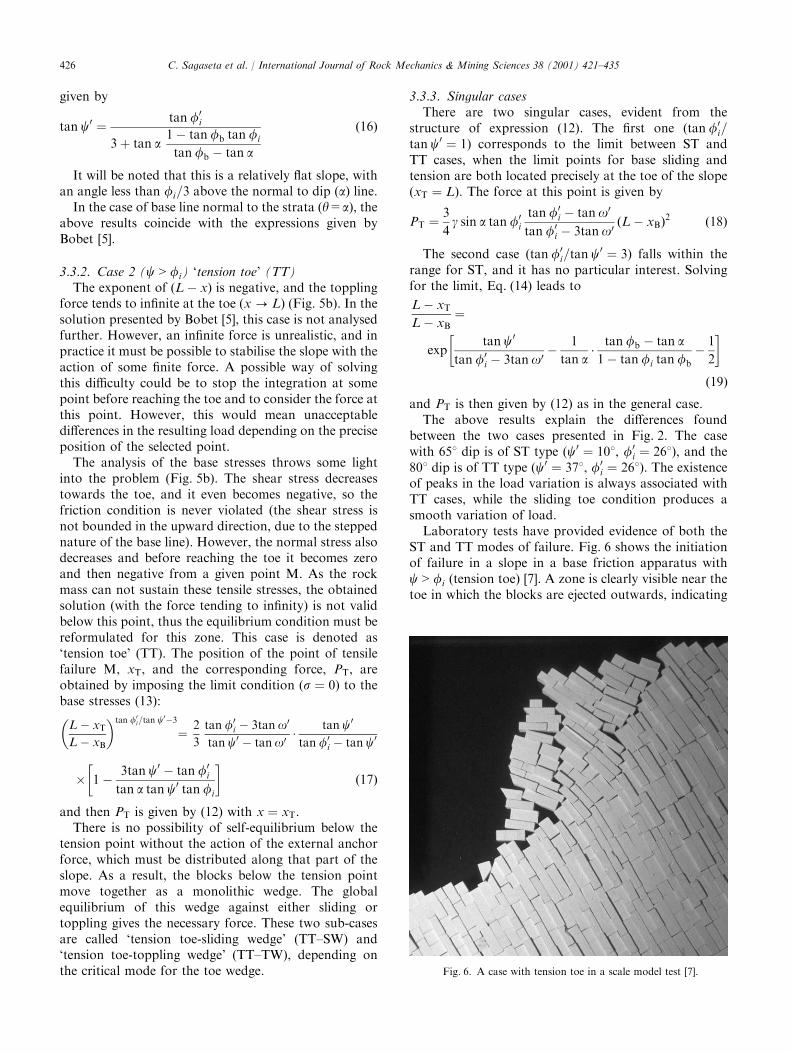
ST and TT modes of failure. Fig. 6 shows the initiationof failure in a slope in a base friction apparatus withc > fi (tension toe) [7]. A zone is clearly visible near thetoe in which the blocks are ejected outwards, indicating
Fig. 6. A case with tension toe in a scale model test [7].
C. Sagaseta et al. / International Journal of Rock Mechanics & Mining Sciences 38 (2001) 421–435426

tensile failure. Aydan et al. [8] present some examplesof sliding and toppling slopes, although all thephotographs shown correspond to late stages ofthe failure, and the details of incipient failure modeare lost.
3.4. Equilibrium of the toe wedge
In all the cases a wedge is found at the slope toe(Fig. 7), between x ¼ xT and x ¼ L. The wedge movesmonolithically, either sliding or toppling, under theaction of the force exerted by the upper blocks, PT, andits own weight, WT:
WT ¼ 12 g tan c
0ðL� xTÞ2 ð20Þ
The external anchor force, F , required for equilibriumis:
* For stability against sliding:
FSW ¼PT 1� tan fi tan fb
� �þWT sin a� cos a tan fb
� �cos r� tan fb sin r
ð21Þ
This force is zero if the slope angle is lower than thecritical value for a stable slope (16).
* For stability against toppling, the force depends onits point of application xF (xT4xF4L):
FTW ¼ FTWminL� xTL� xF
: ð22Þ
The minimum occurs if the force is applied at the top ofthe wedge (xF ¼ xT):
FTWmin ¼
PT tan c� tan fi
� �þ 13WT sin a tan cþ tan xð Þ � 2cos a½ �
cos r tan c� sin r:
ð23Þ
The highest of the two values FSW and FTWmin definesthe mode of failure of the toe wedge. It can be provedthat in both cases all the equilibrium conditions arefulfilled, with all the forces applied within theirrespective valid ranges.
4. Application procedure
4.1. Continuous solution
The application of the above solution to the generalbasic case of Fig. 4 takes the following steps:Step 1. Selection of the relevant mode of failure:
* If (9) does not hold, general sliding (GS) along thetransverse joints
* If (9) holds, then:* If c5fi, sliding toe (ST),* If c > fi, tension toe (TT),* If c ¼ fi, transition ST–TT (singular case).
Step 2. Definition of the toe wedge:
* Dimension xT : xT ¼ L in GS mode; Eq. (14) or (19)in ST mode; Eq. (17) in TT mode; xT ¼ L intransition ST–TT.
* Force exerted by the upper blocks, PT: Eq. (10) withx ¼ L in GS mode; Eq. (12) with x ¼ xT in ST andTT modes; Eq. (18) in transition ST–TT.
* Weight, WT: Eq. (20) in all cases
Step 3. Determination of anchor force:
* In GS, ST or transition ST–TT modes: F ¼ FSW fromEq. (21)
* In TT mode, F is the highest value of FSW fromEq. (21) (mode TT–SW) and FTWmin from Eq. (23)(mode TT–TW).
The continuum approach has proven to be a veryuseful tool in the past few years. Stability charts, such asthe ones presented in Fig. 8, have been given [4]. Theanchor load per unit length of slope is scaled to the slopeheight H as a non-dimensional factor, kT:
F ¼ 12 gkTH
2: ð24Þ
This factor is similar to an earth pressure coefficient,and its value in actual cases is in the range 0.05–0.20. Itis more meaningful than other previously proposed
Fig. 7. Definition of the toe wedge.
C. Sagaseta et al. / International Journal of Rock Mechanics & Mining Sciences 38 (2001) 421–435 427

formulations. For instance, Zanbak [3] uses the thick-ness of strata, t, instead of the height of the slope,resulting in very high factors (range 0–200), which arethen multiplied by a very small number ð1=2gt2Þ.The charts in Fig. 8 correspond to the case of
horizontal ground surface (o ¼ �a), base line 58 abovethe normal to dip line (x ¼ 58), horizontal anchors(d ¼ 0), and friction angle along the transverse joints 58higher than along the bedding planes (fb ¼ fi þ 58). Allthe modes of failure (GS, ST, TT–SW and TT–TW) areconsidered. As the dip angle increases, the mode of
failure passes from general sliding to sliding toe andthen to tension toe. The range for sliding toe decreaseswith the slope angle, and for relatively steep slopes(b > 558 for a friction angle of 258) it vanishes, and onlytension toe modes are possible.
4.2. Influence of finite block thickness
The continuum approach is a reasonable upperbound, close enough to the ‘exact’ solution in mostpractical cases. However, in order to assess the degree of
Fig. 8. Design charts [4]. Horizontal ground surface (o ¼ a); horizontal anchors (r ¼ a); base line: x ¼ y� a ¼ 58.
C. Sagaseta et al. / International Journal of Rock Mechanics & Mining Sciences 38 (2001) 421–435428

accuracy, the influence of finite block thickness can beinvestigated with the Goodman–Bray method (Fig. 1).As shown in Fig. 2, there is always a threshold value
for the slenderness (l ¼ H=t) for stability withoutexternal anchor forces, lcr. Fig. 9 shows the results forthe same basic cases studied in Fig. 8. Excluding extremesituations (almost vertical dip, or very gentle slopes), thethreshold slenderness lcr shows very small variations,being always in the range 5–10.A number of calculations have been run for a wide
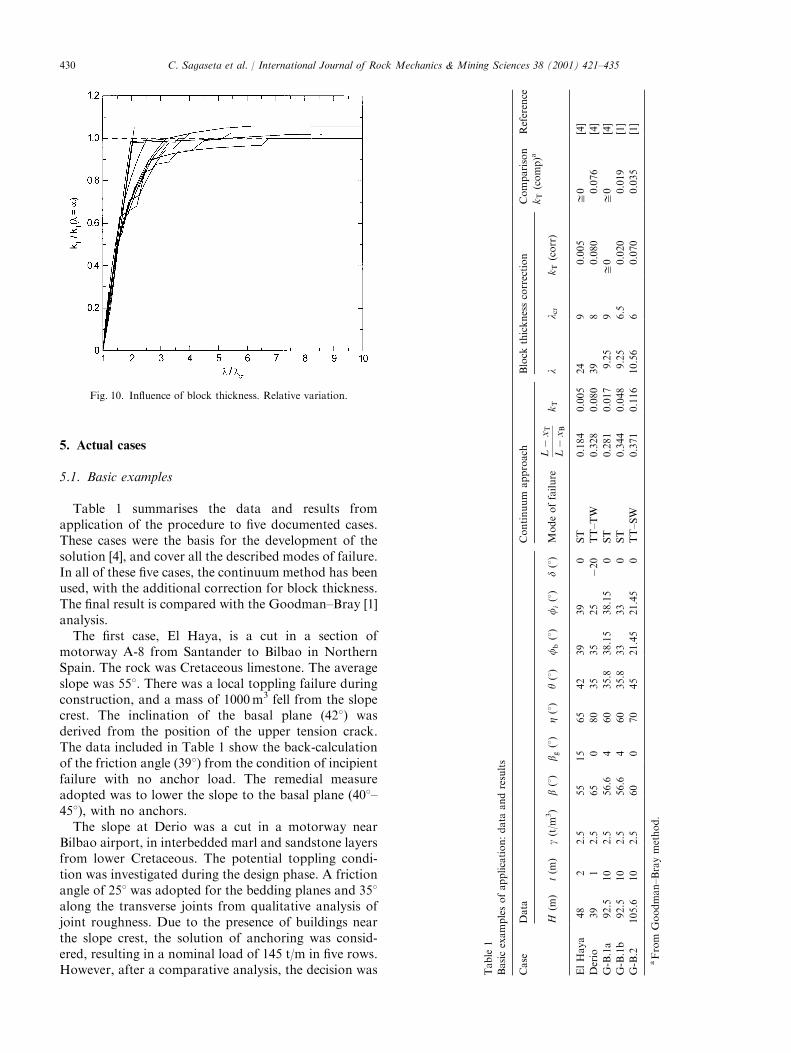
range of cases, with values of l above lcr, with the resultshown in Fig. 10. The force increases linearly with l andfor a slenderness between 2 and 3 times lcr it is veryclose to the asymptotic value. Hence, a linear reduction
of the force determined by the continuum approach canbe applied for this intermediate range of l.
4.3. Some possible extensions
The solution presented can be easily extended to coverother situations different from the basic case considered,such as water pressures (Bobet [5] has considered thecase of seepage parallel to the slope), seismic actions(quasi-static body forces), or forces and distributedpressures on the slope face (anchors, bolts, wire meshes).The consideration of all these factors requires only a
slight modification of the equilibrium diagrams in Fig. 3,with some additional terms in the resulting Eqs. (1)–(5).
Fig. 9. Critical slenderness for stability.
C. Sagaseta et al. / International Journal of Rock Mechanics & Mining Sciences 38 (2001) 421–435 429
5. Actual cases
5.1. Basic examples
Table 1 summarises the data and results fromapplication of the procedure to five documented cases.These cases were the basis for the development of thesolution [4], and cover all the described modes of failure.In all of these five cases, the continuum method has beenused, with the additional correction for block thickness.The final result is compared with the Goodman–Bray [1]analysis.The first case, El Haya, is a cut in a section of
motorway A-8 from Santander to Bilbao in NorthernSpain. The rock was Cretaceous limestone. The averageslope was 558. There was a local toppling failure duringconstruction, and a mass of 1000m3 fell from the slopecrest. The inclination of the basal plane (428) wasderived from the position of the upper tension crack.The data included in Table 1 show the back-calculationof the friction angle (398) from the condition of incipientfailure with no anchor load. The remedial measureadopted was to lower the slope to the basal plane (408–458), with no anchors.The slope at Derio was a cut in a motorway near
Bilbao airport, in interbedded marl and sandstone layersfrom lower Cretaceous. The potential toppling condi-tion was investigated during the design phase. A frictionangle of 258 was adopted for the bedding planes and 358along the transverse joints from qualitative analysis ofjoint roughness. Due to the presence of buildings nearthe slope crest, the solution of anchoring was consid-ered, resulting in a nominal load of 145 t/m in five rows.However, after a comparative analysis, the decision was
Fig. 10. Influence of block thickness. Relative variation.
Table1
Basicexamplesofapplication:dataandresults
Case
Data
Continuumapproach
Blockthicknesscorrection
Comparison
kT(comp)a
Reference
H(m)
t(m)
g(t/m3)
b(8)
b g(8)
Z(8)
y(8)
fb(8)
fi(8)
d(8)
Modeoffailure
L�
xT
L�
xB
kT
ll cr
kT(corr)
ElHaya
48
22.5
55
15
65
42
39
39
0ST
0.184
0.005
24
90.005
ffi0
[4]
Derio
39
12.5
65
080
35
35
25
�20
TT–TW
0.328
0.080
39
80.080
0.076
[4]
G-B.1a
92.5
10
2.5
56.6
460
35.8
38.15
38.15
0ST
0.281
0.017
9.25
9ffi0
ffi0
[4]
G-B.1b
92.5
10
2.5
56.6
460
35.8
33
33
0ST
0.344
0.048
9.25
6.5
0.020
0.019
[1]
G-B.2
105.6
10
2.5
60
070
45
21.45
21.45
0TT–SW
0.371
0.116
10.56
60.070
0.035
[1]
aFromGoodman–Braymethod.
C. Sagaseta et al. / International Journal of Rock Mechanics & Mining Sciences 38 (2001) 421–435430

taken of lowering the slope to 3(H) : 2(V), with noanchoring.The last three cases in Table 1 are not actual slopes,
but the three examples (1a, 1b and 2) presented byGoodman and Bray [1] to illustrate the applicability ofthe limit equilibrium method.As can be seen, the slenderness in the two actual cases
is well above the critical value, and hence the continuumsolution is valid. Only in the three last illustrativeexamples the ratio l=lcr is in the range 1–3, justifyingthe correction for block thickness. The agreement withthe block analysis is good. The largest differences are inthe last case (example GB.2), associated to the strongvariations of the load with the particular blockdistribution in cases with tension toe (TT), andslenderness ratio l=lcr in the range 2–3 (Fig. 2).In all these cases, the inclination of the basal plane
(either observed or assumed) is well above the normal todip line. A sensitivity analysis of the influence of thisinclination is presented in Fig. 11. The force decreasessignificantly as the angle xð¼ y� aÞ increases. The forcecalculated for the design value of x ranges between 70%and 50% of the value for x ¼ 0.
5.2. Further applications
As stated above, the outlined method has been usedby different designers in a number of actual slopes in thelast four years. Three cases were presented in a NationalSymposium on Slopes and Landslides in Spain and theseare summarised in Table 2.The first case [9], Cereixal, is a cut in a motorway
section in North-western Spain, in Cambrian shale,schist and sandstone, dipping at 558 with an averagejoint spacing of 1m parallel to the slope. The slope was
Fig. 11. Basic cases. Influence of the inclination of the base line on
anchor force. Table2
Furtherapplicationstoactualcases
Case
Data
Continuumapproach
Applied
corrective
measures
Reference
H(m)
t(m)
g(t/m3)
b(8)
b g(8)
Z(8)
y(8)
fb(8)
fi(8)
d(8)
Modeof
failure
L�
xT
L�
xB
kT
Cereixal
cut
36
12.2
62
45
12
55
40
30
28
–15
ST
ST
0.262
0.910
0.104
0.020
Slopeb¼458.
Anchors:F¼34t/m
(kT¼0:024)
[9]
Paracuellos
tunnel
portal
13
0.2
2.5
45
15
65
76
30
35
25
0ST
TT–SW
0.266
0.196
0.049
0.089
Anchors:F¼15t/m
(kT¼0:071)
[10]
RiverSil
viaduct
25
12.6
72
30
70
80
47
37
35
35
0TT–SW
TT–TW
0.444
0.508
0.070
0.134
Anchors:F¼1202155t/m
(kT¼0:14020:190)
[11]
C. Sagaseta et al. / International Journal of Rock Mechanics & Mining Sciences 38 (2001) 421–435 431

excavated with an angle 1(H) : 2(V) (b ¼ 628), and atoppling failure was observed. The inclination of thebasal plane was inferred from the tension crack at thecrest. The required anchor load was evaluated as afactor kT of 0.104, that was reduced to 0.024 if the slopewas lowered to 1 : 1. This solution was finally adopted,with rock bolts 125mm, length 5m, with a density ofone bolt every 12m2, with a total anchor load per meterof slope of 34 t/m.The second case [10] is the North portal of the
Paracuellos tunnel (length 4670m) in the high-speedrailway under construction between Madrid and Barce-lona. Some cracks appeared in the front slope, inmetamorphic schist, indicating incipient toppling fail-ure. Further site investigation with exploration test pitsshowed a discontinuity set parallel to the slope, withvariable dip from 658 to 768. The solution adopted wasto install horizontal anchors, 25m long, with a totalforce of 15 t/m, corresponding to a factor kT ¼ 0:071,average of the values calculated for the two extremevalues of the dip. No further movements were recorded.The last case [11] involved the design provisions for
the open excavation with very steep slopes (b ¼ 728) forthe foundations of a viaduct over the River Sil, inNorthwestern Spain, in slightly weathered granite.There is a family of sub-vertical joints (J4), parallel tothe slope and dipping 70–808, that could lead to topplingfailure, favoured by the presence of a transverse set (J3),orthogonal to it. The inclination of the potential basalplane was inferred as 478 from the analysis of thespacing of the two families J3 and J4 involved. Theangle of friction (358) was determined from tilt tests ofrock cores. Several distributions of anchors and boltswere considered, with a force per unit length ofslope between 120 and 155 t/m, corresponding to kTbetween 0.140 and 0.190, above the calculated values(0.070–0.134).
5.3. A particular case
Fig. 12 shows a front view of the San Antol!ın cut inthe motorway A-8 in Northern Spain [12]. There wasalready a cut, 70m high, for the existing road, runningparallel to the shore. The enlargement to four lanesimplied that a further excavation, with a maximumheight of 110m with five intermediate berms would berequired. The rock consists of Ordovician quartzite,with a dip direction of 1608 and a dip of 808 in the upperpart of the slope, decreasing to 608 in the lower part.There is a fault, parallel to the bedding, clearly visible inthe upper part of the slope. Above the fault the rock ismassive, with bedding planes spaced at more than 5m.However, below the fault, the spacing between openbedding planes is less than 1m, and there are someinterbedded layers of shale.The road alignment is N708W, forming an angle of
408 with the strike of the bedding planes. It is usuallyconsidered that this obliquity is enough to prevent thepossibility of toppling failure. However, the present casehas some particular features in this respect. Due to thedifferences in rock mass quality, different slope angleswere adopted, decreasing from the upper part to the toe,and also decreasing longitudinally from East to West.The average angle was 418 in the western part of theslope, and 528 in the eastern end (see Fig. 12). Thetransition between these two zones resulted in anunfavourable orientation, with an obliquity of less than208 with the bedding strike.During the excavation, several local toppling
failures were observed in the transition zone, belowthe fault. This led to a detailed analysis of the failuremechanisms.The analyses were performed by the consultant [12]
using the Goodman and Bray [1] method, taking intoaccount the presence of the fault, and the particular
Fig. 12. San Antol!ın cut. General front view.
C. Sagaseta et al. / International Journal of Rock Mechanics & Mining Sciences 38 (2001) 421–435432
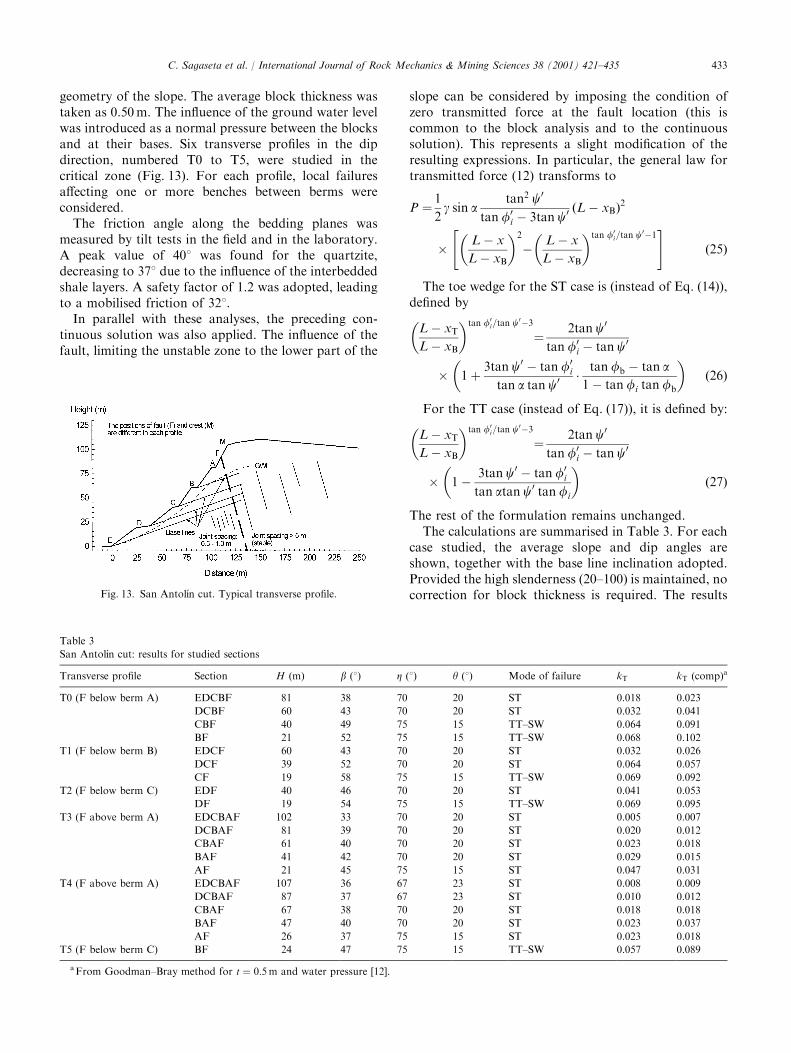
geometry of the slope. The average block thickness wastaken as 0.50m. The influence of the ground water levelwas introduced as a normal pressure between the blocksand at their bases. Six transverse profiles in the dipdirection, numbered T0 to T5, were studied in thecritical zone (Fig. 13). For each profile, local failuresaffecting one or more benches between berms wereconsidered.The friction angle along the bedding planes was
measured by tilt tests in the field and in the laboratory.A peak value of 408 was found for the quartzite,decreasing to 378 due to the influence of the interbeddedshale layers. A safety factor of 1.2 was adopted, leadingto a mobilised friction of 328.In parallel with these analyses, the preceding con-
tinuous solution was also applied. The influence of thefault, limiting the unstable zone to the lower part of the
slope can be considered by imposing the condition ofzero transmitted force at the fault location (this iscommon to the block analysis and to the continuoussolution). This represents a slight modification of theresulting expressions. In particular, the general law fortransmitted force (12) transforms to
P ¼1
2g sin a
tan2 c0
tan f0i � 3tan c
0 ðL� xBÞ2
L� x
L� xB
� �2�
L� x
L� xB
� �tan f0i=tan c0�1
" #ð25Þ
The toe wedge for the ST case is (instead of Eq. (14)),defined by
L� xTL� xB
� �tan f0i=tan c0�3
¼2tan c0
tan f0i � tan c
0
1þ3tan c0 � tan f0
i
tan a tan c0 tan fb � tan a1� tan fi tan fb
� �ð26Þ
For the TT case (instead of Eq. (17)), it is defined by:
L� xTL� xB
� �tan f0i=tan c0�3
¼2tan c0
tan f0i � tan c
0
1�3tan c0 � tan f0
i
tan atan c0 tan fi
� �ð27Þ
The rest of the formulation remains unchanged.The calculations are summarised in Table 3. For each
case studied, the average slope and dip angles areshown, together with the base line inclination adopted.Provided the high slenderness (20–100) is maintained, nocorrection for block thickness is required. The resultsFig. 13. San Antol!ın cut. Typical transverse profile.
Table 3
San Antol!ın cut: results for studied sections
Transverse profile Section H (m) b (8) Z (8) y (8) Mode of failure kT kT (comp)a
T0 (F below berm A) EDCBF 81 38 70 20 ST 0.018 0.023
DCBF 60 43 70 20 ST 0.032 0.041
CBF 40 49 75 15 TT–SW 0.064 0.091
BF 21 52 75 15 TT–SW 0.068 0.102
T1 (F below berm B) EDCF 60 43 70 20 ST 0.032 0.026
DCF 39 52 70 20 ST 0.064 0.057
CF 19 58 75 15 TT–SW 0.069 0.092
T2 (F below berm C) EDF 40 46 70 20 ST 0.041 0.053
DF 19 54 75 15 TT–SW 0.069 0.095
T3 (F above berm A) EDCBAF 102 33 70 20 ST 0.005 0.007
DCBAF 81 39 70 20 ST 0.020 0.012
CBAF 61 40 70 20 ST 0.023 0.018
BAF 41 42 70 20 ST 0.029 0.015
AF 21 45 75 15 ST 0.047 0.031
T4 (F above berm A) EDCBAF 107 36 67 23 ST 0.008 0.009
DCBAF 87 37 67 23 ST 0.010 0.012
CBAF 67 38 70 20 ST 0.018 0.018
BAF 47 40 70 20 ST 0.023 0.037
AF 26 37 75 15 ST 0.023 0.018
T5 (F below berm C) BF 24 47 75 15 TT–SW 0.057 0.089
aFrom Goodman–Bray method for t ¼ 0:5m and water pressure [12].
C. Sagaseta et al. / International Journal of Rock Mechanics & Mining Sciences 38 (2001) 421–435 433

are given in terms of the anchor force factor kT and therelevant failure mode. Most of the cases are of ST type,due to the relatively low values of the slope angle. Only
the analyses for the upper part of the slope, immediatelybelow the fault, result in a TT–SW failure mode.The results of the block analysis are also given for
each case. Both results are compared in Fig. 14. Theagreement is good, and the scatter is associated with thesimplification of the geometry of each case to a uniformslope for the continuous solution. It must be noticedthat no water pressure was considered in the continuoussolution. The cases with tension toe give the highest kTvalues, as expected, but in these cases, the block analysisgives abnormally high values. The reason for this is thatin the cases of tension toe, the numerical analysis isstopped when tension failure occurs at a given block,and so the stabilising effect of the wedge of the toewedge is neglected, whilst in the case of sliding toe, theanalysis is continued to the toe. This is better under-stood with the aid of Fig. 15, where the values of kTobtained with both methods are plotted against theslope angle, b. For the block analysis, there is adiscontinuity in the change from ST to TT modes, andin the continuous analysis there is a smooth transitionbetween the two modes of failure.The final decision was to reinforce the slope with a
high strength steel wire mesh anchored with rockbolts,12m long, spaced on a 3 3m pattern, pretensioned to30% of the yield load. The average active force appliedcorresponds to a value of kT of 0.040. No furthermovements were observed after the corrective measures.
6. Conclusions
A general analytical solution has been presented fortoppling failure in rock slopes. The governing differ-ential equations are integrated in the general case andpresented in terms of the slope geometry. For the basiccase of a uniform slope, explicit expressions are given,covering the whole range of parameters: cut and naturalground surface slopes, angle of friction along thebedding planes and transverse joints, base line inclina-tion, and orientation of anchors. Two main failuremodes have been identified: sliding toe (ST), and tensiontoe (TT), depending on the relative values of the dip, cutslope and friction angle. The solution can be consideredas accurate enough for slenderness greater than 20 or 30.For thicker blocks, a linear reduction of the force isproposed. The method has been applied to a number ofactual cases and a particular example is presented indetail.
Acknowledgements
The authors wish to thank Mr. I. Garc!ıa-Arango,Mr. J.A. Herrero and Mr. C. Gasc !on, chief engineersfor the works at San Antol!ın, El Haya and Derio,
Fig. 14. San Antol!ın cut. Comparison of results.
Fig. 15. San Antol!ın cut. Required anchor force vs. slope angle.
(a) Block analysis; (b) Continuous analysis.
C. Sagaseta et al. / International Journal of Rock Mechanics & Mining Sciences 38 (2001) 421–435434
respectively, for their help and permission to publishthe data.
References
[1] Goodman RE, Bray JW. Toppling of rock slopes. In:
Proceedings, Spec Conference on Rock Engineering for
Foundations and Slopes, vol. 2. Boulder, CO: ASCE, 1977,
p. 201–234.
[2] Scavia C, Barla G, Bernardo V. Probabilistic stability analysis of
block toppling failure in rock slopes. Int J Rock Mech Min Sci
1990;27:465–78.
[3] Zanbak C. Design charts for rock slopes susceptible to toppling.
ASCE J Geot Eng 1983;109:1039–62.
[4] Sagaseta C, S!anchez JM, Ca *nizal J. Dimensionamiento de
anclajes en taludes con vuelco de estratos (‘Calculation of anchor
force in slopes with toppling failure’). In: Simposio sobre
Estructuras de Contenci !on de Terrenos. Santander. Sociedad
Espa *nola de Mec!anica del Suelo y Cimentaciones, 1996;159–76
[in Spanish].
[5] Bobet A. Analytical solutions for toppling failure. Int J Rock
Mech Min Sci 1999;36:971–80.
[6] Sagaseta C. On the modes of instability of a rigid block on an
inclined plane. Rock Mech Rock Eng 1986;19:261–6.
[7] S!anchez JM, Celem!ın M, Sagaseta C. Simulaci !on en modelo
reducido de taludes en rocas diaclasadas (‘Scale model simulation
of slopes in jointed rock’). In: Simposio sobre Obras de
Superficie en Mec!anica de Rocas, vol. 1. Madrid. Sociedad
Espa *nola de Mec!anica del Suelo y Cimentaciones, 1982;63–6 [in
Spanish].
[8] Aydan .O, Shimizu Y, Ichikawa Y. The effective failure modes and
stability of slopes in rock mass with two discontinuity sets. Rock
Mech Rock Eng 1989;22:163–88.
[9] Portillo E, Ferreiro E. An!alisis y soluciones constructivas para
rotura por vuelco de dos desmontes del tramo de Autov!ıa
Villartel!ın-Cereixal de la Autov!ıa del Noroeste (‘Analysis and
constructive solutions for two toppling failures in cut slopes. . .’).In: Alonso E, Corominas J, Chac !on J, Oteo C, P!erez J, editors.
IV Simposio Nacional sobre Taludes y Laderas Inestables, vol. 1.
Granada, Spain, 1997;121–34 [in Spanish].
[10] Romana M, Almaz!an JF. Correcci !on del talud de la boquilla
Norte del t !unel de Paracuellos en la nueva L!ınea de Alta
Velocidad Madrid-Zaragoza (Tramo Calatayud-Ricla)
(‘Correction of the frontal slope of the North portal of
Paracuellos tunnel. . .’). In: Alonso E, Corominas J, Chac!on J,Oteo C, P!erez J, editors. IV Simposio Nacional sobre Taludes
y Laderas Inestables, vol. 2. Granada, Spain, 1997;457–69
[in Spanish].
[11] Portilla R, De Juan P. Problem!atica de taludes excavados para la
cimentaci !on de las pilas de grandes viaductos (‘Problems of cut
slopes for the foundations of piers of large viaducts’). In: Alonso
E, Corominas J, Chac !on J, Oteo C, P!erez J, editors. IV Simposio
Nacional sobre Taludes y Laderas Inestables, vol. 2. Granada,
Spain, 1997;573–81 [in Spanish].
[12] Norcontrol SA. Informe sobre la estabilidad al vuelco de estratos
en el desmonte de San Antol!ın. Soluci!on propuesta. (‘Report on
the stability against toppling in San Antol!ın cut. Proposed
solutions’). Unpublished report. 1999 [in Spanish].
C. Sagaseta et al. / International Journal of Rock Mechanics & Mining Sciences 38 (2001) 421–435 435