topics review mtf question noise receiver operating
TRANSCRIPT

1
Image Quality, T.T. Liu, Spring 2006
Image QualityLecture 2
Thomas LiuUCSD Center for Functional MRI
Resident Physics CourseApril 3, 2006
Image Quality, T.T. Liu, Spring 2006
Topics
Review MTF question
Noise
Receiver Operating Characteristics
Sampling and Aliasing

2
Image Quality, T.T. Liu, Spring 2006
MTF = Fourier Transform (LTF)
Bushberg et al 2001
Image Quality, T.T. Liu, Spring 2006
3
Image Quality, T.T. Liu, Spring 2006
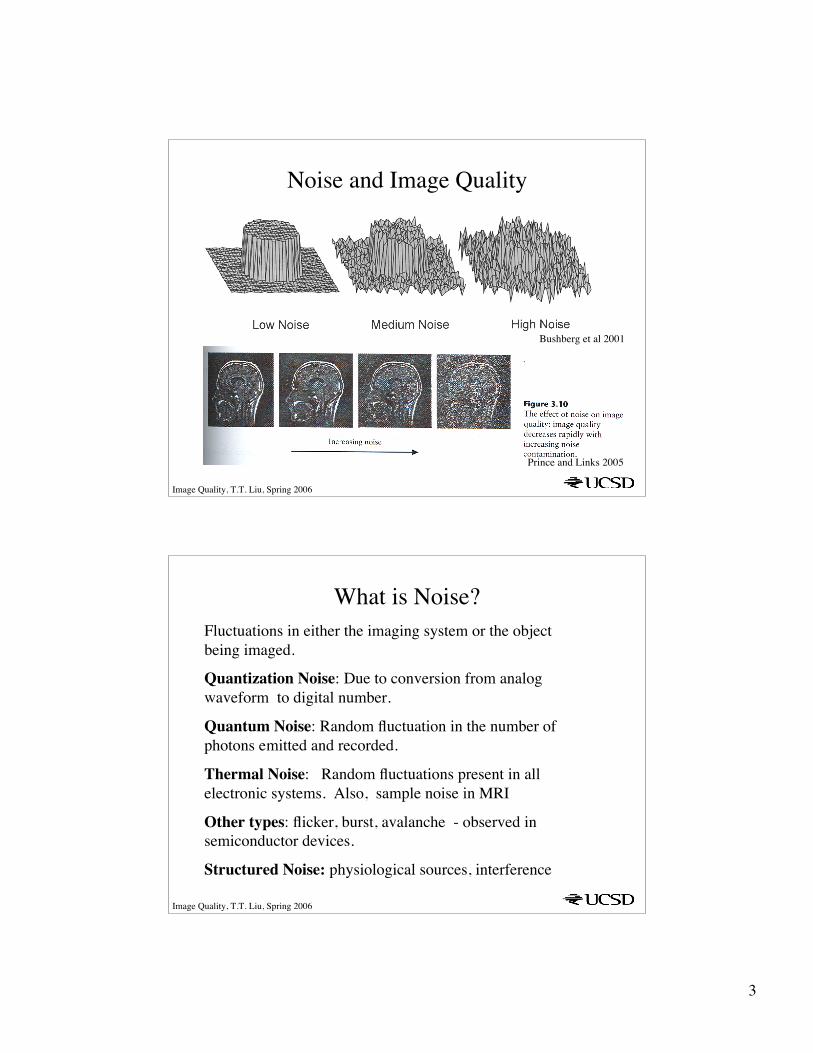
Noise and Image Quality
Prince and Links 2005
Bushberg et al 2001
Image Quality, T.T. Liu, Spring 2006
What is Noise?Fluctuations in either the imaging system or the objectbeing imaged.
Quantization Noise: Due to conversion from analogwaveform to digital number.
Quantum Noise: Random fluctuation in the number ofphotons emitted and recorded.
Thermal Noise: Random fluctuations present in allelectronic systems. Also, sample noise in MRI
Other types: flicker, burst, avalanche - observed insemiconductor devices.
Structured Noise: physiological sources, interference

4
Image Quality, T.T. Liu, Spring 2006
Histograms and Distributions
3rd grade heights 6th grade heightsBushberg et al 2001
Image Quality, T.T. Liu, Spring 2006
Gaussian Distribution
1, 2, and 3 standard deviation intervals correspond to 68%,95%, and 99% of the observations
Bushberg et al 2001

5
Image Quality, T.T. Liu, Spring 2006
Poisson ProcessEvents occur at random instants of time at an average rate
of λ events per second.
Examples: arrival of customers to an ATM, emission ofphotons from an x-ray source, lightning strikes in athunderstorm.
!
" = Average rate of events per second
"t = Average number of events at time t
"t = Variance in number of events
Image Quality, T.T. Liu, Spring 2006
Quantum Noise
!
For a Poisson process, the mean = variance, i.e. X ="2
Therefore, the standard deviation is given by " = X
For X - ray systems, if the mean number of counts is N, then the
standard deviation in the number of counts is " = N .
SNR=N
"= N .

6
Image Quality, T.T. Liu, Spring 2006
Image Quality, T.T. Liu, Spring 2006!
Poisson Distribution describes x - ray counting statistics.
Gaussian distribution is good approximation to Poisson when " = X
Bushberg et al 2001

7
Image Quality, T.T. Liu, Spring 2006
Image Quality, T.T. Liu, Spring 2006

8
Image Quality, T.T. Liu, Spring 2006
Image Quality, T.T. Liu, Spring 2006

9
Image Quality, T.T. Liu, Spring 2006
Contrast Resolution
Bushberg et al 2001
Lower row shows effect of structure noise
Image Quality, T.T. Liu, Spring 2006

10
Image Quality, T.T. Liu, Spring 2006
!
Sensitivity = TP
TP + FN
= Fraction of people who have the disease who test positive
Specificity = TN
TN + FP
= Fraction of people who do not have the disease who test negative
Positive Predictive Value = TP
TP + FP
= Probability patient is actually abnormal when diagnosed as abnormal
Negative Predictive Value = TN
TN + FN
= Probability patient is actually normal when diagnosed as normal.
Image Quality, T.T. Liu, Spring 2006
!
True Positive Fraction = TP
TP + FN
= Sensitivity
= Probability of Detection
False Positive Fraction =FP
FP + TN
=1-Specificity
= Probability of False Alarm
Receiver operating characteristic (ROC) curve plots TruePositive Fraction vs. False Positive Fraction

11
Image Quality, T.T. Liu, Spring 2006
Detection
Image Quality, T.T. Liu, Spring 2006
Detection
Area is a measure of detectability

12
Image Quality, T.T. Liu, Spring 2006
Image Quality, T.T. Liu, Spring 2006

13
Image Quality, T.T. Liu, Spring 2006
!
Nyquist Frequency = FN
=1
2"
If f > FN, then aliasing will occur
Sampling Pitch
Image Quality, T.T. Liu, Spring 2006
14
Image Quality, T.T. Liu, Spring 2006
Image Quality, T.T. Liu, Spring 2006
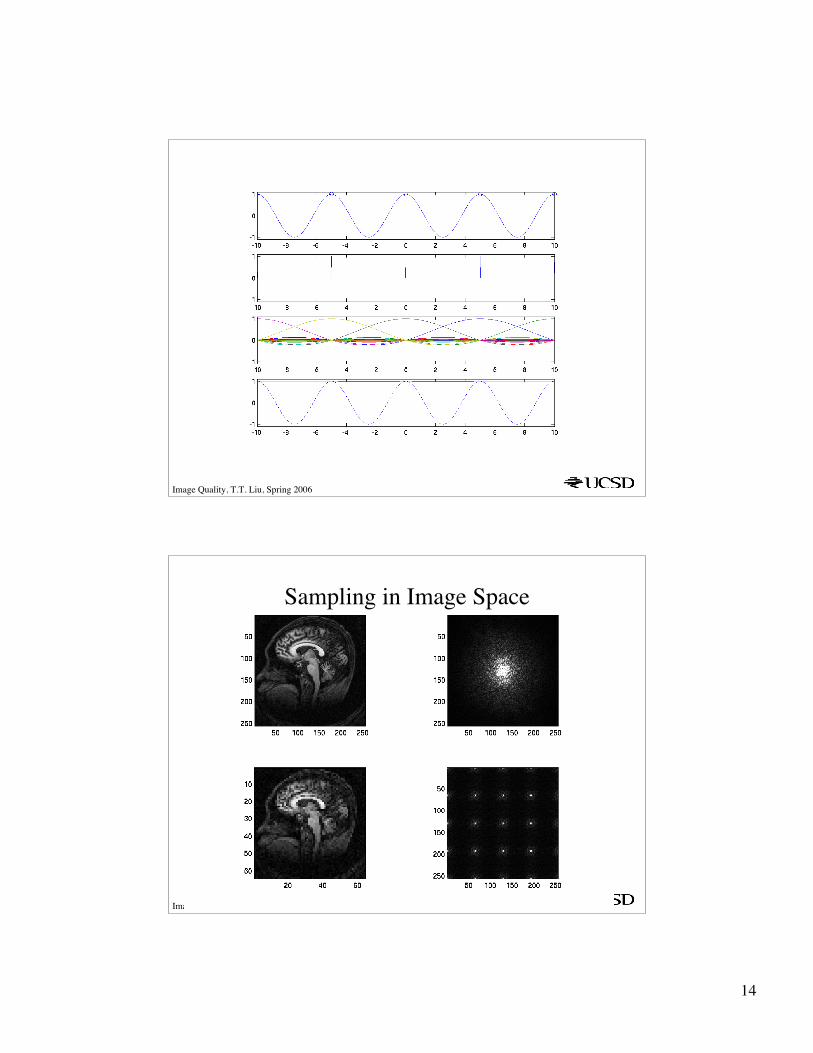
Sampling in Image Space

15
Image Quality, T.T. Liu, Spring 2006
Sampling in k-space
Image Quality, T.T. Liu, Spring 2006

16
Image Quality, T.T. Liu, Spring 2006
Smoothing of Projections in CT
Suetens 2002
Projection
Beam Width
SmoothedProjection
2/(Δs)
W= 2/(Δs)δ=1/W= Δs/2