topic: scientific method aim: explain the steps of the scientific method. do now: explain how you...
TRANSCRIPT
TOPIC: Scientific MethodAim: Explain the steps of the Scientific Method.
Do Now: Explain how you would find your lost science text book
HW: Textbook. Read pgs. 6-13, p. 13 #’s 1-5 (Copy questions and write answers underneath each question. )p. 6 copy and define vocabulary

What is the Scientific Method?
•Model, or guide used to solve problems and to get information

12 3
45
6

STEPS
1.Problem: in the form of a QUESTION
• What you want to solve

ProblemUnder what color light will
plants grow best?

2. Hypothesis: EDUCATED GUESS
•Suggested answer to the problem
•HOW? Research problem

Hypothesis I think the plant under
green light will grow best because plants are green.

3. Experiment: TEST IF HYPOTHESIS IS RIGHT OR WRONG– Gather materials– Design procedures– Record results

Experiment
Grow the plants for 5 weeks. Each is placed under a certain color light. They will get the same amount of light, & will be watered every 2 days. Their height will be measured (in centimeters) once a week.
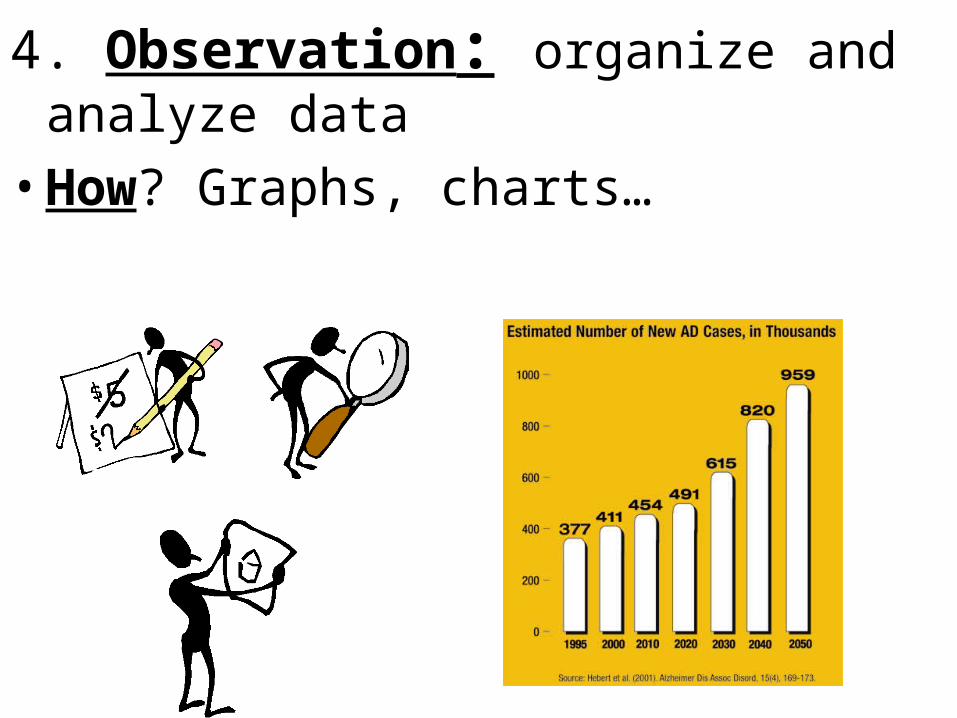
4. Observation: organize and analyze data
•How? Graphs, charts…

2
4
6
8
10
12
He
igh
t (c
m)
PLANTS
1 2 3 4 5 6
Observations Growth of plants


5. Conclusion•Is hypothesis right or wrong?•Answers the question stated in the
problem

Conclusion My hypothesis was wrong. Plants grow
best under blue light, not green light. The plant under green light grew 11cm while the plant under green
light grew only 2 cm.

THEORY•A hypothesis
supported by MANY experiments
•Thought to be true but can be changed

LAW
• A statement that is believed to be true
• Does not give an explanation

PROBLEM
HYPOTHESIS
EXPERIMENT
OBSERVATION
CONCLUSION
People
Hate
Elephants
On
Couches

Let’s summarize…
1. List the steps of the scientific method.
2. Explain the difference between the problem and the hypothesis.
3. What are you testing when performing an experiment?
4. Describe an example of an observation.
5. What are some ways to organize your data?
6. Explain the difference between a theory and law.

Review:
1. The first step in the scientific method is
a. to state the problem b. experimentation
c. to state the hypothesis d. observation
2. Information gained from experimentation and observation is known as
a. theory b. data c. laws d. hypothesis

3. An educated guess to the problem of an experiment is known as a
a. variable b. theoryc. hypothesis d. law
4. When performing an experiment, you are testing the
a. problem b. hypothesisc. data d. conclusion
5. Your senses can be used to make a(n)a. observation b. conclusion c. hypothesis d. problem

Topic: Scientific MethodMI: Explain how a controlled
experiment is performed.
Do Now: (PASS UP HOMEWORK)Complete Review Questions on the
notes sheet from yesterday.
HW: Ditto – Lab Safety (Quiz is tomorrow!!!!)

Does fertilizer X help plant growth?


Variable• The one factor that is
different • Factor that changes in each
set up


Controlled Experiment• 2 groups:1.Experimental group = contains
the VARIABLE2. Control group = DOES NOT
contain the variable – used to compare (normal setup)

Control Group Experimental Group

Everything between the 2 groups must be exactly the same except for the variable!!!


Topic: Scientific MethodMI: Explain how a controlled
experiment is performed.
Do Now: Explain the difference between the experimental group and the control group.
HW: Work on developing your science fair problem.

2 types of variables
1. Independent Variable: the 1 factor that’s different between exp. group and control group

Independent variable = ?
SUNLIGHT

2. Dependent Variable = what is MEASURED
•data or results obtained
HEIGHT

Height = 21 cmHeight = 12 cm

What must be done to make results of an experiment more reliable or valid?
•Repeat experiment
•Use a larger sample size
•Use only one variable

Experiment
1.What is the independent variable?
2.What is the dependent variable?
3.Explain the difference between the control group and experimental groups in this experiment.

Let’s summarize…
1. Explain the difference between the control and experimental groups.
2. Explain the difference between the independent and dependent variables.
3. How can the results of an experiment be more accurate?

Review:To investigate how temperature affects seed
germination, a student placed 10 radish seeds of the same variety on moist paper in each of 3 petri dishes and placed the dishes in the following environments:
Dish # 1: Refrigerator, 5ºC
Dish # 2: Room Temperature, 20ºC
Dish # 3: Incubator, 37ºC
1. Which factor is the variable in this investigation?
a. temperature b. kind of seeds
c. moisture d. number of seeds

To investigate how temperature affects seed germination, a student placed 10 radish seeds of the same variety on moist paper in each of 3 petri dishes and placed the dishes in the following environments:
Dish # 1: Refrigerator, 5ºC
Dish # 2: Room Temperature, 20ºC
Dish # 3: Incubator, 37ºC
2. The control group is
a. Dish #1 b. Dish #2 c. Dish #3
3. The dependent variable is the
a. temperature b. how many days till germination
c. The # of seeds d. the amount of water
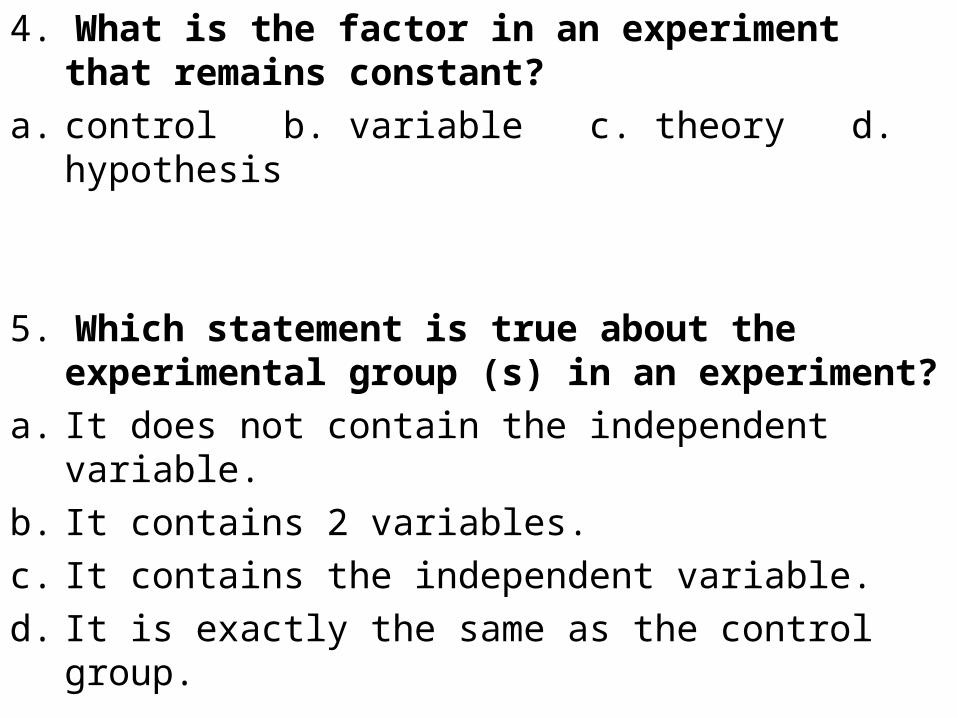
4. What is the factor in an experiment that remains constant?
a. control b. variable c. theory d. hypothesis
5. Which statement is true about the experimental group (s) in an experiment?
a. It does not contain the independent variable.
b. It contains 2 variables.
c. It contains the independent variable.
d. It is exactly the same as the control group.

6. The results of one experiment carried out by a research team would be considered valid if
a. the experiment had no control setup
b. all the members of the research team came to the same conclusion
c. the experiment had more than one variable
d. the experiment was repeated and the same results were obtained each time

Topic: Scientific Method
Aim: How do we graph data?
Do Now: Complete the review questions from yesterday's notes.
HW: Graphing Ditto

Beta-carotene supplements have been thought to protect against cancer. A study was conducted with 39,000 women aged 45 and up. Group A received a beta-carotene supplement. Group B received a placebo. Their health was studied over their lifetime. Cancer rates for women taking the beta-carotene supplement did not really differ from the cancer rates of those women taking the placebo.
Identify the independent variable, dependent variable, control group, and experimental group.

Students of different ages were given the same jigsaw puzzle to put together. They were
timed to see how long it took to finish the puzzle.
What was the independent variable?
•Ages of the students•Different ages were tested by the scientist

What was the dependent variable?
•The time it to put the puzzle together
•The time was measured by the scientist
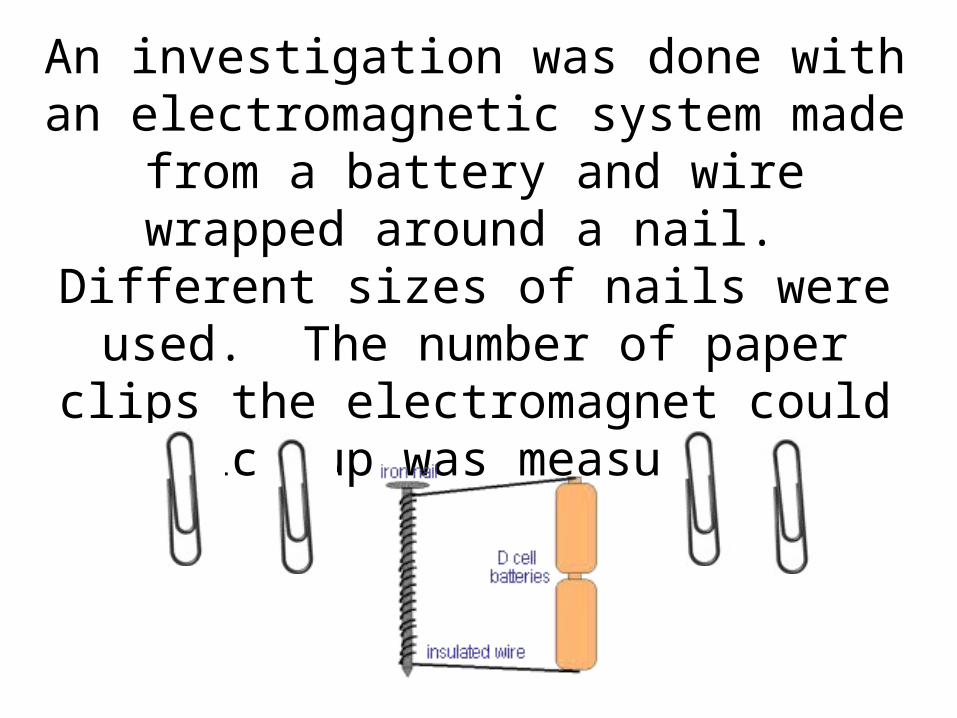
An investigation was done with an electromagnetic system made from a battery and wire wrapped around a nail. Different sizes of nails were used. The number of paper clips the electromagnet could pick up
was measured.

Independent variable:
•Sizes of nails•These were changed by the scientist
Dependent variable:
•Number of paper clips picked up

The higher the temperature of
water, the faster an egg will boil.

•Independent variable?•temperature of water•Dependent variable?•time to cook an egg

•Visual display of information or data
•Organize and arrange data to be easily understood
Graphs

•Independent variable = “x” axis•Dependent variable = “y” axis•Title should compare the
independent to the dependent

As the independent variable increases, the dependent variable...


3 main graphs (used in science) are bar, line, & pie
1. Bar : Comparing information collected by counting


2. Circle Graph (or Pie Chart)
• Different parts of a whole quantity
• Slices represent percentages of the total


3. Line: Data changes over time
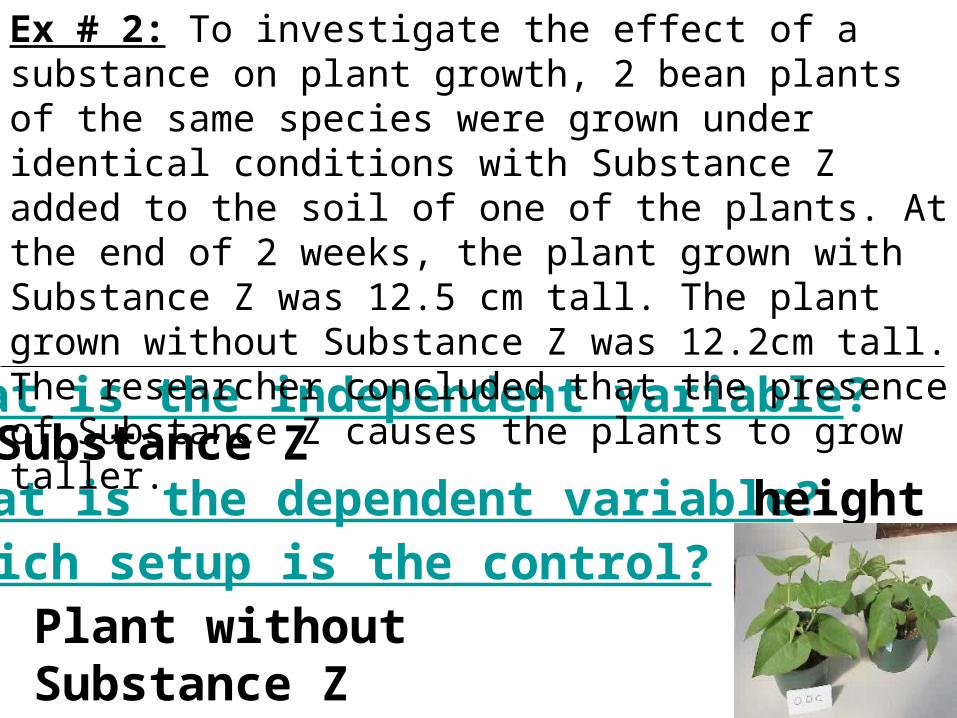
What is the independent variable?Substance ZWhat is the dependent variable? height
Ex # 2: To investigate the effect of a substance on plant growth, 2 bean plants of the same species were grown under identical conditions with Substance Z added to the soil of one of the plants. At the end of 2 weeks, the plant grown with Substance Z was 12.5 cm tall. The plant grown without Substance Z was 12.2cm tall. The researcher concluded that the presence of Substance Z causes the plants to grow taller.
Which setup is the control?Plant without Substance Z

What is the independent variable?What is the dependent variable?Which setup is the experimental group?
Ex #3: A student placed 5 geranium plants of equal size in 5 environmental chambers. Growing conditions were the same for each plant except for the amount of water each received. At the end of 20 days, the width of the leaves was measured.

5. An investigation was designed to determine the effect of ultraviolet light on mold spore growth. Two groups of mold spores were grown under identical conditions, except one group was exposed only to ultraviolet light, while the other group was grown in total darkness. In this investigation, the group of mold spores grown without receiving any ultraviolet light is known as the
a. experimental variableb. hypothesisc. controld. limiting factor