top new features 10 of oracle business - apps associates · a new feature in obiee 11g called ......
TRANSCRIPT

Page | 1
TABLE OF CONTENTS
Feature 1 New Chart Choices
Funnel Chart 2
Trellis Chart 3
Waterfall 4
Tile Diagram 5
Feature 2 Recommended Visualization 6
Feature 3 Bread Crumbs 7
Feature 4 Dashboard Export to Excel 8
Feature 5 Freeze Column and Multiple Column Selector 9
Feature 6 Hierarchical Column Display 10
Feature 7 BI Publisher Integration 11
Feature 8 Mobile Development 12
Feature 9 User Interface Changes 13
Feature 10 Nomenclature Changes 14
Page | 2
1 NEW CHART CHOICES
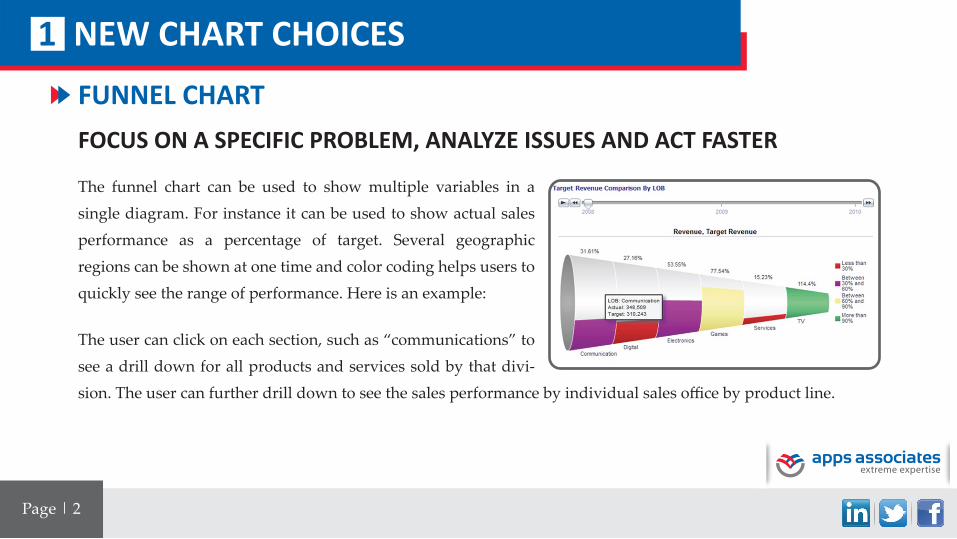
FUNNEL CHART
FOCUS ON A SPECIFIC PROBLEM, ANALYZE ISSUES AND ACT FASTER
The funnel chart can be used to show multiple variables in a single diagram. For instance it can be used to show actual sales performance as a percentage of target. Several geographic regions can be shown at one time and color coding helps users to quickly see the range of performance. Here is an example:
The user can click on each section, such as “communications” to see a drill down for all products and services sold by that divi-sion. The user can further drill down to see the sales performance by individual sales office by product line.

Page | 3
TRELLIS CHART
The trellis chart can show several graphs with data grouped, for example, by region or by order stage. Each of the smaller charts can display multiple variables like revenue and unit price over time.
It enables users to rapidly understand trends so problems can be quickly identified and addressed.
Page | 4
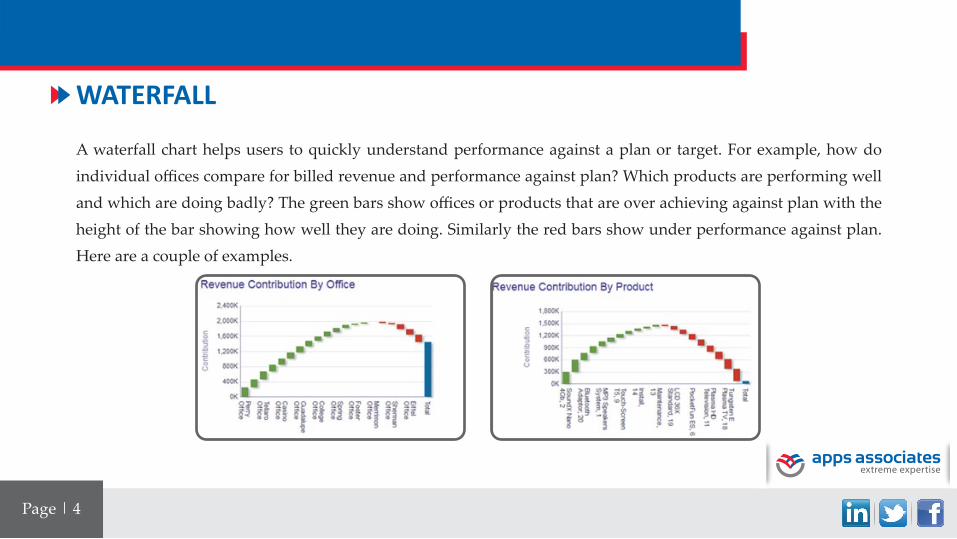
WATERFALL
A waterfall chart helps users to quickly understand performance against a plan or target. For example, how do individual offices compare for billed revenue and performance against plan? Which products are performing well and which are doing badly? The green bars show offices or products that are over achieving against plan with the height of the bar showing how well they are doing. Similarly the red bars show under performance against plan. Here are a couple of examples.

Page | 5
TILE DIAGRAM
The tile Diagram can be used to focus the reader’s attention on a single high level aggregate measure in a manner that is both visually simple and prominent. The figure below shows the performance tiles for the measures Discount Ratio, Average Order size and Unit Price. It also shows what is desired for each of those measures. This design highlights the key numbers that will be of interest to the audience.
Page | 6
A new feature in OBIEE 11g called “Best Visualization” will recommend the most suitable chart to display your data. You can now spend your time analyzing the information in your data rather than wasting time trying to choose the most appropriate graph.
2 RECOMMENDED VISUALIZATION

Page | 7
The “Bread Crumbs” feature enables users to know their current location within Oracle BI and the path that they have used to get there. Bread Crumbs are active links that users can click on to return to the place from which they started. They are displayed at the bottom of the page (as shown in the highlighted box), and users can click a breadcrumb to navigate to a spe-cific location on their breadcrumb trail.
3 BREAD CRUMBS
Page | 8
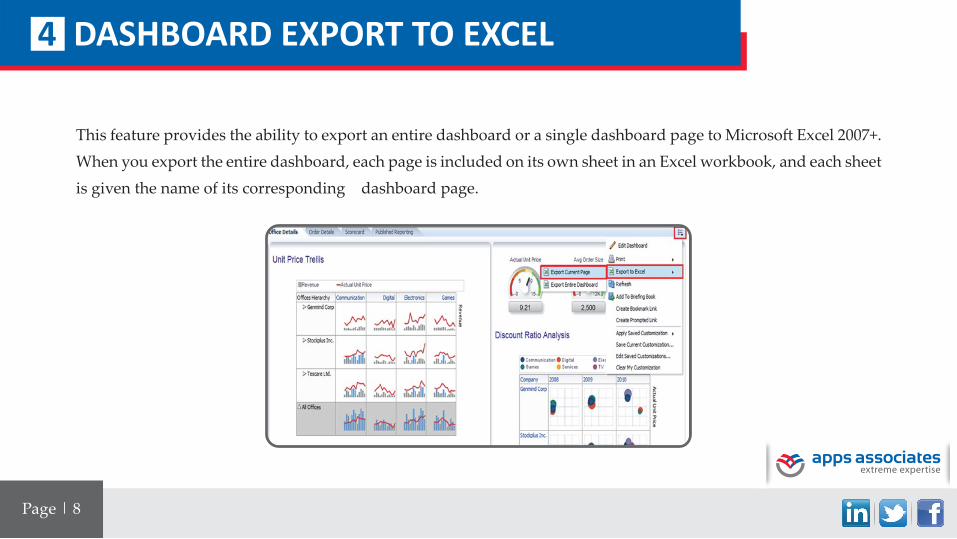
This feature provides the ability to export an entire dashboard or a single dashboard page to Microsoft Excel 2007+. When you export the entire dashboard, each page is included on its own sheet in an Excel workbook, and each sheet is given the name of its corresponding dashboard page.
4 DASHBOARD EXPORT TO EXCEL

Page | 9
These features make it easier to scroll around large data tables keeping column headers and row titles visible at all times. The multiple column selector feature allows users to freely add or remove columns of data to reports very easily and quickly.
FREEZE COLUMN ANDMULTIPLE COLUMN SELECTOR5

Page | 10
Hierarchical Column Display: Hierarchical columns are displayed inline in OBI 11g whereas in 10g they were displayed in separate columns. This enables the user to see more data at the same time which allows for instant comparisons and speeds up analysis
Hierarchical 10g
Hierarchical 11g
6 HIERARCHICAL COLUMN DISPLAY

Page | 11
Oracle BI Publisher is an easy to use tool that is now fully integrated into OBIEE 11g. The tool has an inbuilt report designer and layout editor giving users a much faster and simpler interactive reporting experience. BI Publisher is the enterprise reporting platform for Oracle E-Business Suite and it is fully integrated with Microsoft Excel 2007. Here is an example report from BI Publisher.
7 BI PUBLISHER INTEGRATION

Page | 12
With OBI 11g, Oracle has introduced a Mobile Application Designer that enables you to design reports that will work with your mobile devices such as tablets and smart phones. The tool makes it easy to create charts and tables that are rendered appropriately for mobile devices so employees can make informed decisions based on accurate data wherever they are, in the office, at home or on the road.
8 MOBILE DEVELOPMENT

Page | 13
a. Home Page: In version 11g, Oracle has added new features to the home page to enable users to access BI objects more easily. As the following screen shot shows, the user can easily access recently accessed analysis or most popular reports with one click. Alternatively the user can setup all their favorite analysis right on the home page. Additional features simplify the download of theclient’s tools like OBIEE client, BI Publisher Desktop, Analyzer for Excel etc.
b. Full Text Search Capability: A full text search capability has been introduced to enable users to search all the objects across the entire catalog.
9 USER INTERFACE CHANGES

Page | 14
Answers are now called Analysis in 11g
Reports are now referred to as BI Publisher Reports
Dimensions are now called Attribute Columns
Facts are now called Measure Columns
iBots are described in 11g as Agents
10 NOMENCLATURE CHANGES

Page | 15
Kshitij KumarCTO, Apps Associates
kshitij[email protected]
www.youtube.com/user/AppsAssociates
www.linkedin.com/company/Apps-Associates
@AppsAssociates
www.facebook.com/AppsAssociatesGlobal
www.plus.google.com/+AppsAssociatesGlobal/
CONNECT WITH US

ABOUT APPS ASSOCIATESFounded in 2002, Apps Associates is a global provider of business and technology consulting services that partners with companies to help them maximize the value from their IT investments. Services range from new technology deployments to 24x7 global support services with practices in BI, ERP, CRM, Integration, Cloud Services, Infrastructure, Testing Services and Custom Development.
© Copyright 2016,V3.0-0614, Apps Associates LLC. All rights reserved.
www.shipconsole.comwww.appsassociates.com
Europe Asia North America (HQ)
OUR STRATEGIC PARTNERS