top 10 payment trends to watch in 2014
TRANSCRIPT
Top 10 payment trends towatchin 2014
The payments industry is in the midst of significant change on many
fronts, and companies are finding themselves dealing with an array
of new challenges. Over the past year, one of the most visible of
these was security, as data breaches hit several major retailers—and
made headlines for weeks.
With payments, change is the new normal
Part of the Vantiv Insight Series 2014, featuring proprietary research performed by Vantiv Inc., and Mercator Advisory Group
© 2014 by Vantiv LLC. All rights reserved.
top 10 payment trends in 2014
1. Omnicommerce Takes Hold
2. More Omniconsumers, More Expectations
3. E-Commerce: Popular, with Room for Improvement
4. Mobile Inroads at the Point of Sale
5. Mobile Payments: Still Unfolding
6. Loyalty, Rewards, and the Mobile Opportunity
7. Small Merchants Moving Forward
8. Prepaid: Broadening Its Reach
9. Change in a Competitive Landscape
10. Coping with High-Profile Security Issues
However, as significant as those events were, the industry is contending with a range of more fundamental changes that are likely to keep reshaping the landscape for years to come. Many of these are driven by constantly evolving technology. With the mobile revolution solidly underway, events are unfold-ing quickly: Consumers have woven their smartphones and tablets deeply into their daily lives—and they are beginning to use them to make mobile payments, both in the store and online. The number of consumers who have used their smartphones to make in-store payments jumped to 11%, from just 2% last year. As mobile payments move ahead, the industry needs to sort out questions about standards, tech-nologies, and what it needs to do to drive consumer adoption.
Technology also continues to bring more customer-interaction channels into the mix. This is driving the need for multi-
channel capabilities. Companies need to be able to take advantage of each indi-vidual channel for relationship building while providing a good customer experi-ence across all channels, seamlessly.
Technology comes together with security concerns to create another challenge, the rollout of EMV capabili-ties. Companies are trying to determine how to efficiently bring EMV on board, with a minimum of disruption—and how to balance schedules, costs, and the risks of fraud and noncompliance.
Perhaps the most important source of change is the consumer, who brings rising expectations to the world of payments. In particular, we are see-ing the emergence of omniconsumers, who operate across all channels. Today, these omniconsumers are typically found in key segments—the young, the technologically proficient, the af-fluent. But the expectations of these
3
omniconsumers are likely to become mainstream attitudes in the near future, crossing all demographic lines. That means the bar for superior experience and consistency in all channels will be set very high.
Altogether, these changes create a complex, moving mosaic—and it can be difficult to understand how to proceed. To help, Vantiv and Merca-tor Advisory Group conduct annual research into consumer attitudes about evolving payment methods. The Vantiv/Mercator Insight Series combines those consumer views with perspectives from executives repre-senting merchants, financial institu-tions, and independent sales organiza-tions (ISOs). The series is now in its third year, and once again, the most recent findings have been distilled into 10 key industry trends. These are presented in this publication.
These findings provide a picture of how the industry has evolved over the past year. More important, they provide insight into the ongoing evolu-tion of payments—and underscore the fact that change is now a given in the industry. The key is to understand its direction and move with it—or ahead of it.
1. Omnicommerce Takes HoldMerchants work in an increasingly multichannel world, and omnicom-merce—the ability to work holistically across channels—has been a discus-sion topic for some time. But the concept of omnicommerce is quickly becoming a reality, as merchants at-tempt to integrate electronic channels into their operations.
A key factor in this, of course, is the mobile revolution. Today, 66% of con-sumers have a tablet or smartphone, according to Vantiv/Mercator research. That number is even higher for young adults age 18 to 34 (86%) and consum-ers earning $100,000 or more (74%). Because of this prevalence, merchant executives made it clear in our inter-views that they expect mobile and multichannel shopping to grow quickly. And in another Vantiv/Mercator study, 52% of the independent sales organiza-tions (ISOs) that serve merchants said that they expect their clients’ inter-est in omnicommerce to increase over the next two years, particularly among smaller merchants. “Consumers are now enabled with smart handsets, and merchants are refining their capabilities
0% 10% 20% 30% 40%
35%18%
34%16%
31%15%
28%
20%
24%9%
13%
■ Occasionally or more ■ Frequently/always
9%
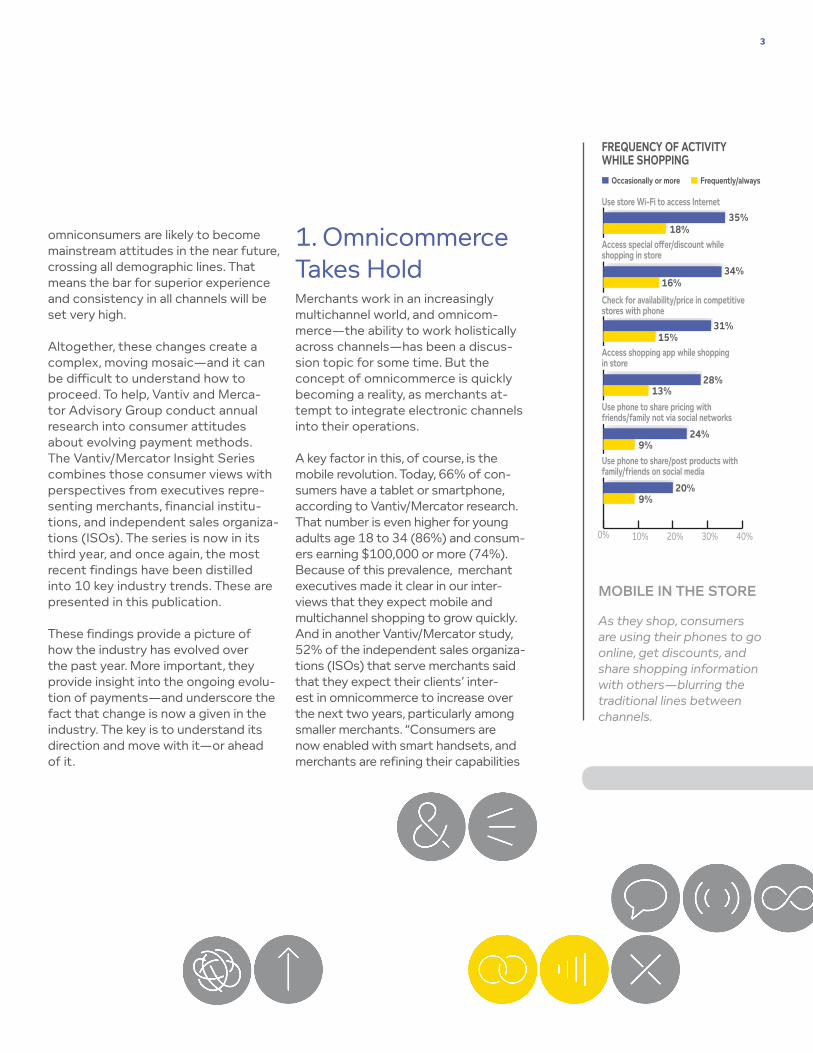
Access special o�er/discount while shopping in store
Check for availability/price in competitive stores with phone
Use store Wi-Fi to access Internet
Access shopping app while shopping in store
Use phone to share pricing with friends/family not via social networks
Use phone to share/post products with family/friends on social media
FREQUENCY OF ACTIVITY WHILE SHOPPING
Mobile in the Store
As they shop, consumers are using their phones to go online, get discounts, and share shopping information with others—blurring the traditional lines between channels.
4
0% 10% 20% 30%
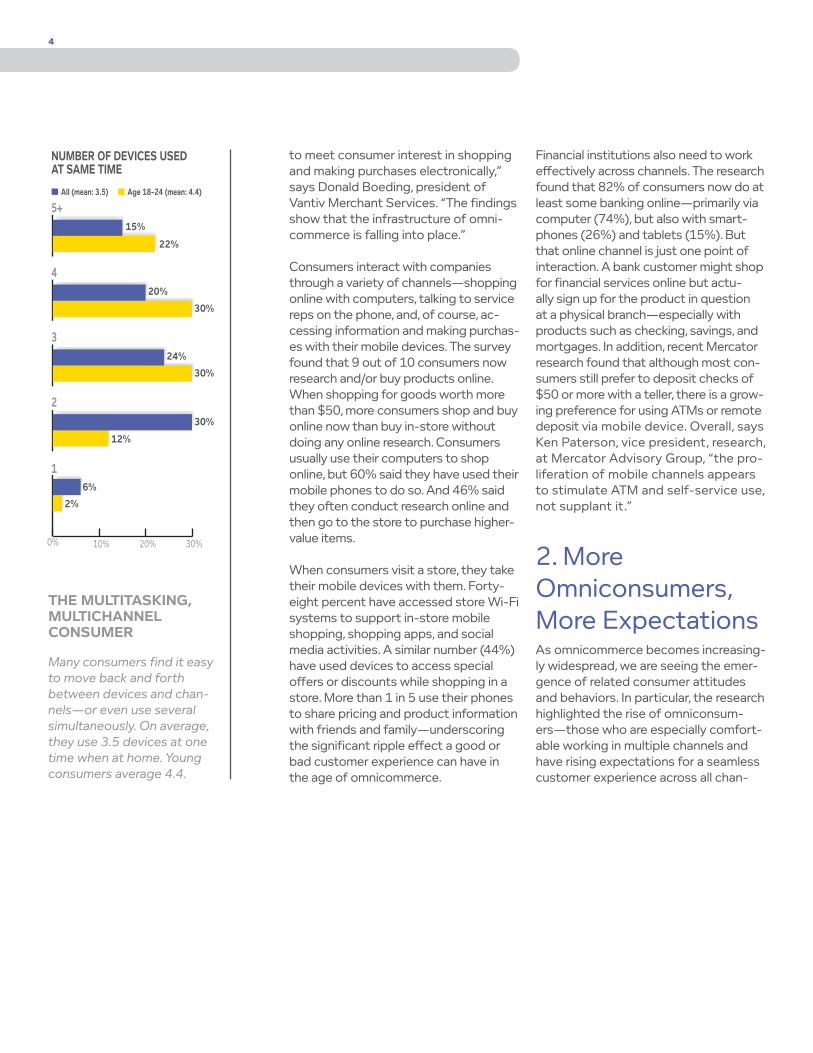
15%
22%
20%
30%
24%
30%
6%
30%
12%
■ All (mean: 3.5) ■ Age 18-24 (mean: 4.4)
2%
4
3
5+
2
1
NUMBER OF DEVICES USED AT SAME TIME
the multitasking, multichannel consumer
Many consumers find it easy to move back and forth between devices and chan-nels—or even use several simultaneously. On average, they use 3.5 devices at one time when at home. Young consumers average 4.4.
to meet consumer interest in shopping and making purchases electronically,” says Donald Boeding, president of Vantiv Merchant Services. “The findings show that the infrastructure of omni-commerce is falling into place.”
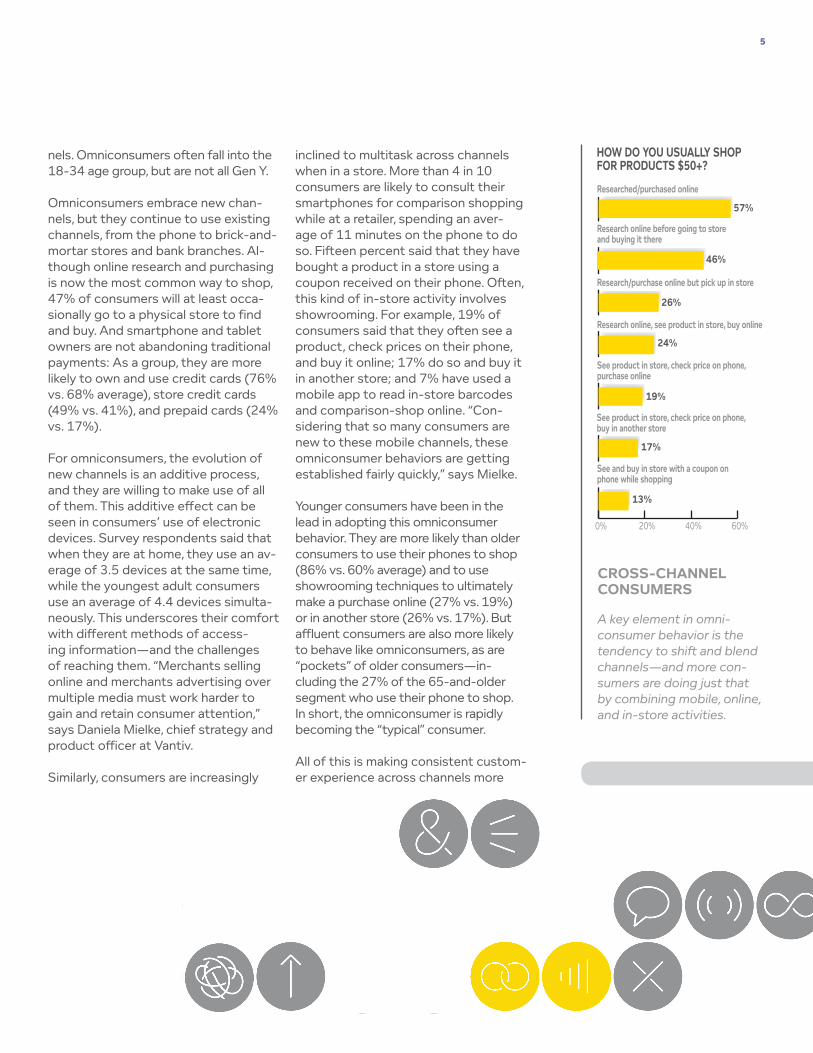
Consumers interact with companies through a variety of channels—shopping online with computers, talking to service reps on the phone, and, of course, ac-cessing information and making purchas-es with their mobile devices. The survey found that 9 out of 10 consumers now research and/or buy products online. When shopping for goods worth more than $50, more consumers shop and buy online now than buy in-store without doing any online research. Consumers usually use their computers to shop online, but 60% said they have used their mobile phones to do so. And 46% said they often conduct research online and then go to the store to purchase higher-value items.
When consumers visit a store, they take their mobile devices with them. Forty-eight percent have accessed store Wi-Fi systems to support in-store mobile shopping, shopping apps, and social media activities. A similar number (44%) have used devices to access special offers or discounts while shopping in a store. More than 1 in 5 use their phones to share pricing and product information with friends and family—underscoring the significant ripple effect a good or bad customer experience can have in the age of omnicommerce.
Financial institutions also need to work effectively across channels. The research found that 82% of consumers now do at least some banking online—primarily via computer (74%), but also with smart-phones (26%) and tablets (15%). But that online channel is just one point of interaction. A bank customer might shop for financial services online but actu-ally sign up for the product in question at a physical branch—especially with products such as checking, savings, and mortgages. In addition, recent Mercator research found that although most con-sumers still prefer to deposit checks of $50 or more with a teller, there is a grow-ing preference for using ATMs or remote deposit via mobile device. Overall, says Ken Paterson, vice president, research, at Mercator Advisory Group, “the pro-liferation of mobile channels appears to stimulate ATM and self-service use, not supplant it.”
2. More Omniconsumers, More ExpectationsAs omnicommerce becomes increasing-ly widespread, we are seeing the emer-gence of related consumer attitudes and behaviors. In particular, the research highlighted the rise of omniconsum-ers—those who are especially comfort-able working in multiple channels and have rising expectations for a seamless customer experience across all chan-
5
0% 20% 40% 60%
57%
46%
26%
19%
24%
Research online before going to store and buying it there
Research/purchase online but pick up in store
Researched/purchased online
HOW DO YOU USUALLY SHOP FOR PRODUCTS $50+?
17%
13%
Research online, see product in store, buy online
See product in store, check price on phone, purchase online
See product in store, check price on phone, buy in another store
See and buy in store with a coupon on phone while shopping
cross-channel consumers
A key element in omni-consumer behavior is the tendency to shift and blend channels—and more con-sumers are doing just that by combining mobile, online, and in-store activities.
nels. Omniconsumers often fall into the 18-34 age group, but are not all Gen Y.
Omniconsumers embrace new chan-nels, but they continue to use existing channels, from the phone to brick-and-mortar stores and bank branches. Al-though online research and purchasing is now the most common way to shop, 47% of consumers will at least occa-sionally go to a physical store to find and buy. And smartphone and tablet owners are not abandoning traditional payments: As a group, they are more likely to own and use credit cards (76% vs. 68% average), store credit cards (49% vs. 41%), and prepaid cards (24% vs. 17%).
For omniconsumers, the evolution of new channels is an additive process, and they are willing to make use of all of them. This additive effect can be seen in consumers’ use of electronic devices. Survey respondents said that when they are at home, they use an av-erage of 3.5 devices at the same time, while the youngest adult consumers use an average of 4.4 devices simulta-neously. This underscores their comfort with different methods of access-ing information—and the challenges of reaching them. “Merchants selling online and merchants advertising over multiple media must work harder to gain and retain consumer attention,” says Daniela Mielke, chief strategy and product officer at Vantiv.
Similarly, consumers are increasingly
inclined to multitask across channels when in a store. More than 4 in 10 consumers are likely to consult their smartphones for comparison shopping while at a retailer, spending an aver-age of 11 minutes on the phone to do so. Fifteen percent said that they have bought a product in a store using a coupon received on their phone. Often, this kind of in-store activity involves showrooming. For example, 19% of consumers said that they often see a product, check prices on their phone, and buy it online; 17% do so and buy it in another store; and 7% have used a mobile app to read in-store barcodes and comparison-shop online. “Con-sidering that so many consumers are new to these mobile channels, these omniconsumer behaviors are getting established fairly quickly,” says Mielke.
Younger consumers have been in the lead in adopting this omniconsumer behavior. They are more likely than older consumers to use their phones to shop (86% vs. 60% average) and to use showrooming techniques to ultimately make a purchase online (27% vs. 19%) or in another store (26% vs. 17%). But affluent consumers are also more likely to behave like omniconsumers, as are “pockets” of older consumers—in-cluding the 27% of the 65-and-older segment who use their phone to shop. In short, the omniconsumer is rapidly becoming the “typical” consumer.
All of this is making consistent custom-er experience across channels more
6
0% 20% 40% 60%
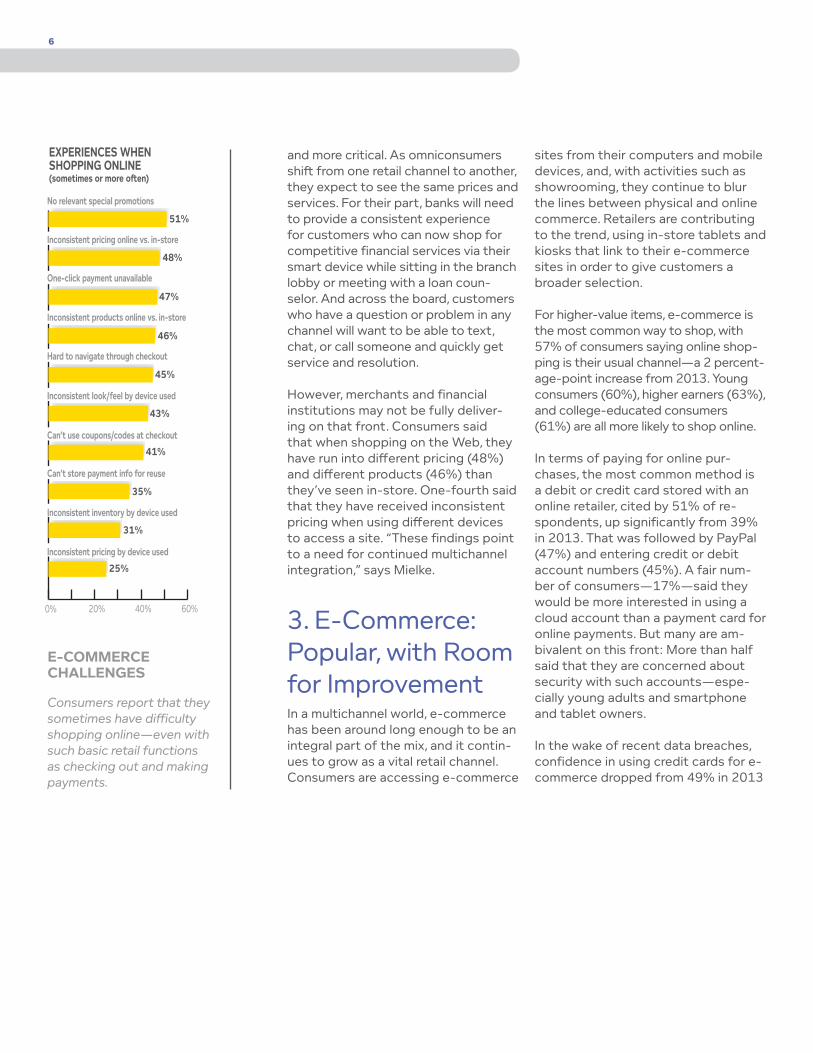
51%
48%
47%
31%
46%
EXPERIENCES WHEN SHOPPING ONLINE(sometimes or more o�en)
25%
45%
43%
41%
35%
Inconsistent pricing online vs. in-store
No relevant special promotions
One-click payment unavailable
Inconsistent products online vs. in-store
Hard to navigate through checkout
Inconsistent look/feel by device used
Can’t use coupons/codes at checkout
Can’t store payment info for reuse
Inconsistent inventory by device used
Inconsistent pricing by device used
e-commerce challenges
Consumers report that they sometimes have difficulty shopping online—even with such basic retail functions as checking out and making payments.
and more critical. As omniconsumers shift from one retail channel to another, they expect to see the same prices and services. For their part, banks will need to provide a consistent experience for customers who can now shop for competitive financial services via their smart device while sitting in the branch lobby or meeting with a loan coun-selor. And across the board, customers who have a question or problem in any channel will want to be able to text, chat, or call someone and quickly get service and resolution.
However, merchants and financial institutions may not be fully deliver-ing on that front. Consumers said that when shopping on the Web, they have run into different pricing (48%) and different products (46%) than they’ve seen in-store. One-fourth said that they have received inconsistent pricing when using different devices to access a site. “These findings point to a need for continued multichannel integration,” says Mielke.
3. E-Commerce: Popular, with Room for ImprovementIn a multichannel world, e-commerce has been around long enough to be an integral part of the mix, and it contin-ues to grow as a vital retail channel. Consumers are accessing e-commerce
sites from their computers and mobile devices, and, with activities such as showrooming, they continue to blur the lines between physical and online commerce. Retailers are contributing to the trend, using in-store tablets and kiosks that link to their e-commerce sites in order to give customers a broader selection.
For higher-value items, e-commerce is the most common way to shop, with 57% of consumers saying online shop-ping is their usual channel—a 2 percent-age-point increase from 2013. Young consumers (60%), higher earners (63%), and college-educated consumers (61%) are all more likely to shop online.
In terms of paying for online pur-chases, the most common method is a debit or credit card stored with an online retailer, cited by 51% of re-spondents, up significantly from 39% in 2013. That was followed by PayPal (47%) and entering credit or debit account numbers (45%). A fair num-ber of consumers—17%—said they would be more interested in using a cloud account than a payment card for online payments. But many are am-bivalent on this front: More than half said that they are concerned about security with such accounts—espe-cially young adults and smartphone and tablet owners.
In the wake of recent data breaches, confidence in using credit cards for e-commerce dropped from 49% in 2013
7
0% 10% 20% 30% 40% 50%
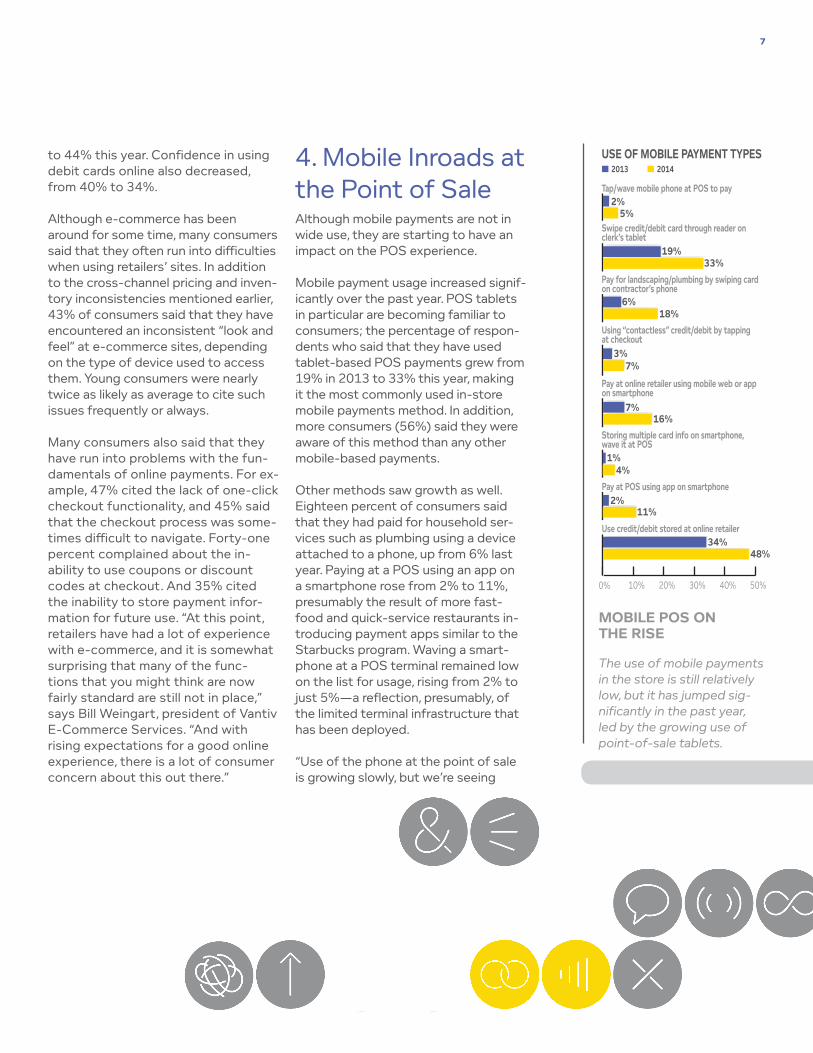
2%5%
19%33%
3%7%
7%
2%
1%4%
16%
■ 2013 ■ 2014
11%
Tap/wave mobile phone at POS to pay
Pay at online retailer using mobile web or app on smartphone
USE OF MOBILE PAYMENT TYPES
Pay for landscaping/plumbing by swiping card on contractor’s phone
Using “contactless” credit/debit by tapping at checkout
Swipe credit/debit card through reader on clerk’s tablet
6%18%
34%48%
Storing multiple card info on smartphone, wave it at POS
Pay at POS using app on smartphone
Use credit/debit stored at online retailer
mobile pos on the rise
The use of mobile payments in the store is still relatively low, but it has jumped sig-nificantly in the past year, led by the growing use of point-of-sale tablets.
to 44% this year. Confidence in using debit cards online also decreased, from 40% to 34%.
Although e-commerce has been around for some time, many consumers said that they often run into difficulties when using retailers’ sites. In addition to the cross-channel pricing and inven-tory inconsistencies mentioned earlier, 43% of consumers said that they have encountered an inconsistent “look and feel” at e-commerce sites, depending on the type of device used to access them. Young consumers were nearly twice as likely as average to cite such issues frequently or always.
Many consumers also said that they have run into problems with the fun-damentals of online payments. For ex-ample, 47% cited the lack of one-click checkout functionality, and 45% said that the checkout process was some-times difficult to navigate. Forty-one percent complained about the in-ability to use coupons or discount codes at checkout. And 35% cited the inability to store payment infor-mation for future use. “At this point, retailers have had a lot of experience with e-commerce, and it is somewhat surprising that many of the func-tions that you might think are now fairly standard are still not in place,” says Bill Weingart, president of Vantiv E-Commerce Services. “And with rising expectations for a good online experience, there is a lot of consumer concern about this out there.”
4. Mobile Inroads at the Point of SaleAlthough mobile payments are not in wide use, they are starting to have an impact on the POS experience.
Mobile payment usage increased signif-icantly over the past year. POS tablets in particular are becoming familiar to consumers; the percentage of respon-dents who said that they have used tablet-based POS payments grew from 19% in 2013 to 33% this year, making it the most commonly used in-store mobile payments method. In addition, more consumers (56%) said they were aware of this method than any other mobile-based payments.
Other methods saw growth as well. Eighteen percent of consumers said that they had paid for household ser-vices such as plumbing using a device attached to a phone, up from 6% last year. Paying at a POS using an app on a smartphone rose from 2% to 11%, presumably the result of more fast-food and quick-service restaurants in-troducing payment apps similar to the Starbucks program. Waving a smart-phone at a POS terminal remained low on the list for usage, rising from 2% to just 5%—a reflection, presumably, of the limited terminal infrastructure that has been deployed.
“Use of the phone at the point of sale is growing slowly, but we’re seeing
8
mobile interest
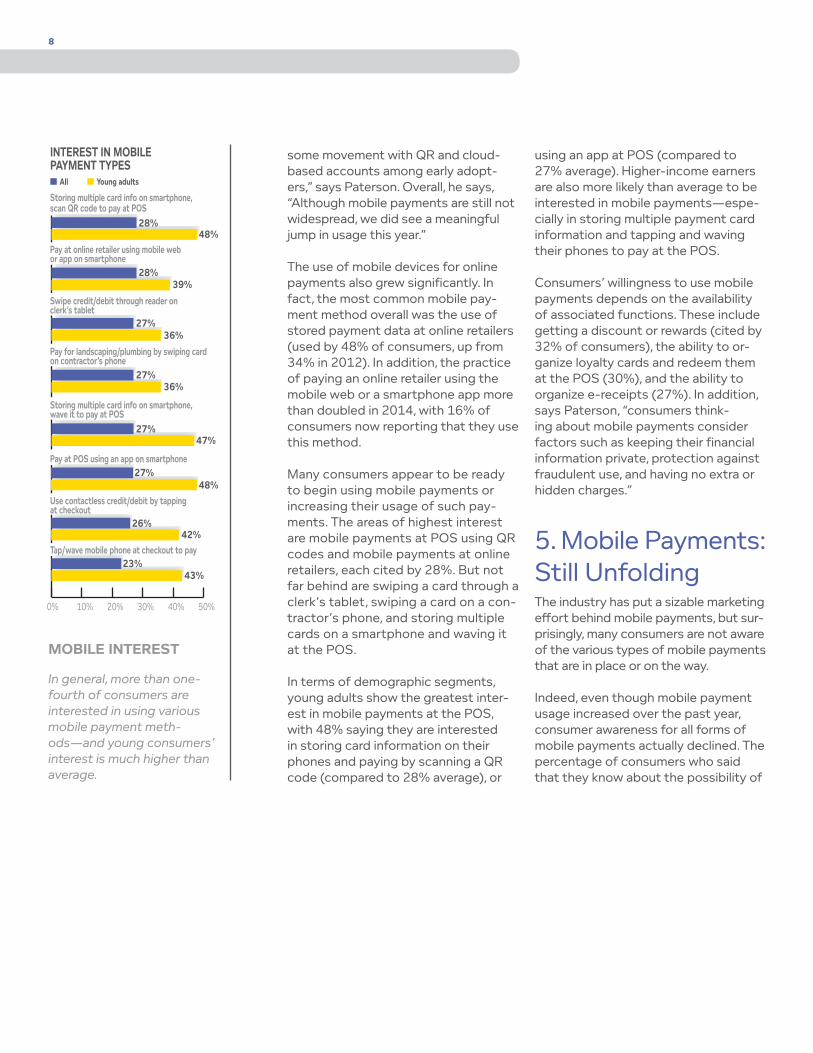
In general, more than one-fourth of consumers are interested in using various mobile payment meth-ods—and young consumers’ interest is much higher than average.
some movement with QR and cloud-based accounts among early adopt-ers,” says Paterson. Overall, he says, “Although mobile payments are still not widespread, we did see a meaningful jump in usage this year.”
The use of mobile devices for online payments also grew significantly. In fact, the most common mobile pay-ment method overall was the use of stored payment data at online retailers (used by 48% of consumers, up from 34% in 2012). In addition, the practice of paying an online retailer using the mobile web or a smartphone app more than doubled in 2014, with 16% of consumers now reporting that they use this method.
Many consumers appear to be ready to begin using mobile payments or increasing their usage of such pay-ments. The areas of highest interest are mobile payments at POS using QR codes and mobile payments at online retailers, each cited by 28%. But not far behind are swiping a card through a clerk’s tablet, swiping a card on a con-tractor’s phone, and storing multiple cards on a smartphone and waving it at the POS.
In terms of demographic segments, young adults show the greatest inter-est in mobile payments at the POS, with 48% saying they are interested in storing card information on their phones and paying by scanning a QR code (compared to 28% average), or
using an app at POS (compared to 27% average). Higher-income earners are also more likely than average to be interested in mobile payments—espe-cially in storing multiple payment card information and tapping and waving their phones to pay at the POS.
Consumers’ willingness to use mobile payments depends on the availability of associated functions. These include getting a discount or rewards (cited by 32% of consumers), the ability to or-ganize loyalty cards and redeem them at the POS (30%), and the ability to organize e-receipts (27%). In addition, says Paterson, “consumers think-ing about mobile payments consider factors such as keeping their financial information private, protection against fraudulent use, and having no extra or hidden charges.”
5. Mobile Payments: Still UnfoldingThe industry has put a sizable marketing effort behind mobile payments, but sur-prisingly, many consumers are not aware of the various types of mobile payments that are in place or on the way.
Indeed, even though mobile payment usage increased over the past year, consumer awareness for all forms of mobile payments actually declined. The percentage of consumers who said that they know about the possibility of
0% 10% 20% 30% 40% 50%
28%48%
28%39%
27%36%
27%
26%
27%48%
47%
■ All ■ Young adults
42%
Storing multiple card info on smartphone, scan QR code to pay at POS
Storing multiple card info on smartphone, wave it to pay at POS
INTEREST IN MOBILE PAYMENT TYPES
Swipe credit/debit through reader on clerk’s tablet
Pay for landscaping/plumbing by swiping card on contractor’s phone
Pay at online retailer using mobile web or app on smartphone
27%36%
23%43%
Pay at POS using an app on smartphone
Use contactless credit/debit by tapping at checkout
Tap/wave mobile phone at checkout to pay
9
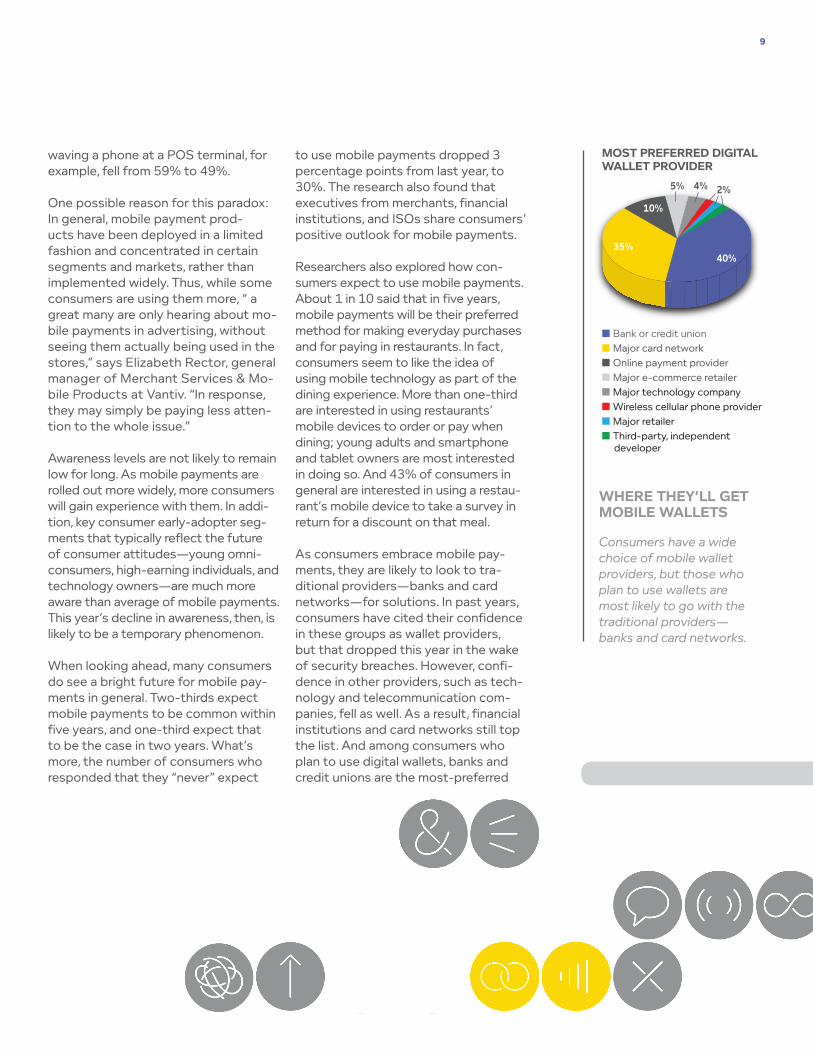
MOST PREFERRED DIGITAL WALLET PROVIDER
35%40%
10%
4%
■ Bank or credit union■ Major card network■ Online payment provider■ Major e-commerce retailer■ Major technology company■ Wireless cellular phone provider■ Major retailer■ Third-party, independent developer
5% 2%
Where they’ll get mobile Wallets
Consumers have a wide choice of mobile wallet providers, but those who plan to use wallets are most likely to go with the traditional providers—banks and card networks.
waving a phone at a POS terminal, for example, fell from 59% to 49%.
One possible reason for this paradox: In general, mobile payment prod-ucts have been deployed in a limited fashion and concentrated in certain segments and markets, rather than implemented widely. Thus, while some consumers are using them more, “ a great many are only hearing about mo-bile payments in advertising, without seeing them actually being used in the stores,” says Elizabeth Rector, general manager of Merchant Services & Mo-bile Products at Vantiv. “In response, they may simply be paying less atten-tion to the whole issue.”
Awareness levels are not likely to remain low for long. As mobile payments are rolled out more widely, more consumers will gain experience with them. In addi-tion, key consumer early-adopter seg-ments that typically reflect the future of consumer attitudes—young omni-consumers, high-earning individuals, and technology owners—are much more aware than average of mobile payments. This year’s decline in awareness, then, is likely to be a temporary phenomenon.
When looking ahead, many consumers do see a bright future for mobile pay-ments in general. Two-thirds expect mobile payments to be common within five years, and one-third expect that to be the case in two years. What’s more, the number of consumers who responded that they “never” expect
to use mobile payments dropped 3 percentage points from last year, to 30%. The research also found that executives from merchants, financial institutions, and ISOs share consumers’ positive outlook for mobile payments.
Researchers also explored how con-sumers expect to use mobile payments. About 1 in 10 said that in five years, mobile payments will be their preferred method for making everyday purchases and for paying in restaurants. In fact, consumers seem to like the idea of using mobile technology as part of the dining experience. More than one-third are interested in using restaurants’ mobile devices to order or pay when dining; young adults and smartphone and tablet owners are most interested in doing so. And 43% of consumers in general are interested in using a restau-rant’s mobile device to take a survey in return for a discount on that meal.
As consumers embrace mobile pay-ments, they are likely to look to tra-ditional providers—banks and card networks—for solutions. In past years, consumers have cited their confidence in these groups as wallet providers, but that dropped this year in the wake of security breaches. However, confi-dence in other providers, such as tech-nology and telecommunication com-panies, fell as well. As a result, financial institutions and card networks still top the list. And among consumers who plan to use digital wallets, banks and credit unions are the most-preferred
10
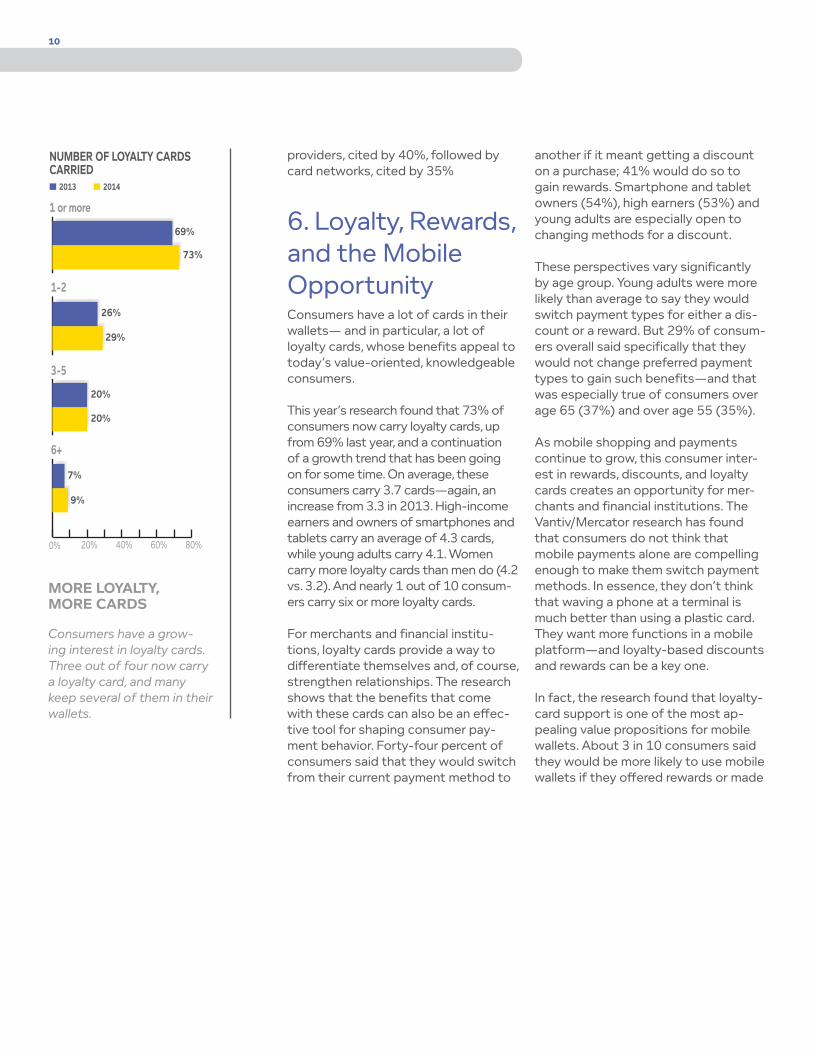
0% 20% 40% 60% 80%
69%
73%
26%
29%
20%
20%
7%
9%
■ 2013 ■ 2014
1-2
3-5
1 or more
NUMBER OF LOYALTY CARDS CARRIED
6+
more loyalty, more cards
Consumers have a grow-ing interest in loyalty cards. Three out of four now carry a loyalty card, and many keep several of them in their wallets.
providers, cited by 40%, followed by card networks, cited by 35%
6. Loyalty, Rewards, and the Mobile OpportunityConsumers have a lot of cards in their wallets— and in particular, a lot of loyalty cards, whose benefits appeal to today’s value-oriented, knowledgeable consumers.
This year’s research found that 73% of consumers now carry loyalty cards, up from 69% last year, and a continuation of a growth trend that has been going on for some time. On average, these consumers carry 3.7 cards—again, an increase from 3.3 in 2013. High-income earners and owners of smartphones and tablets carry an average of 4.3 cards, while young adults carry 4.1. Women carry more loyalty cards than men do (4.2 vs. 3.2). And nearly 1 out of 10 consum-ers carry six or more loyalty cards.
For merchants and financial institu-tions, loyalty cards provide a way to differentiate themselves and, of course, strengthen relationships. The research shows that the benefits that come with these cards can also be an effec-tive tool for shaping consumer pay-ment behavior. Forty-four percent of consumers said that they would switch from their current payment method to
another if it meant getting a discount on a purchase; 41% would do so to gain rewards. Smartphone and tablet owners (54%), high earners (53%) and young adults are especially open to changing methods for a discount.
These perspectives vary significantly by age group. Young adults were more likely than average to say they would switch payment types for either a dis-count or a reward. But 29% of consum-ers overall said specifically that they would not change preferred payment types to gain such benefits—and that was especially true of consumers over age 65 (37%) and over age 55 (35%).
As mobile shopping and payments continue to grow, this consumer inter-est in rewards, discounts, and loyalty cards creates an opportunity for mer-chants and financial institutions. The Vantiv/Mercator research has found that consumers do not think that mobile payments alone are compelling enough to make them switch payment methods. In essence, they don’t think that waving a phone at a terminal is much better than using a plastic card. They want more functions in a mobile platform—and loyalty-based discounts and rewards can be a key one.
In fact, the research found that loyalty-card support is one of the most ap-pealing value propositions for mobile wallets. About 3 in 10 consumers said they would be more likely to use mobile wallets if they offered rewards or made
11
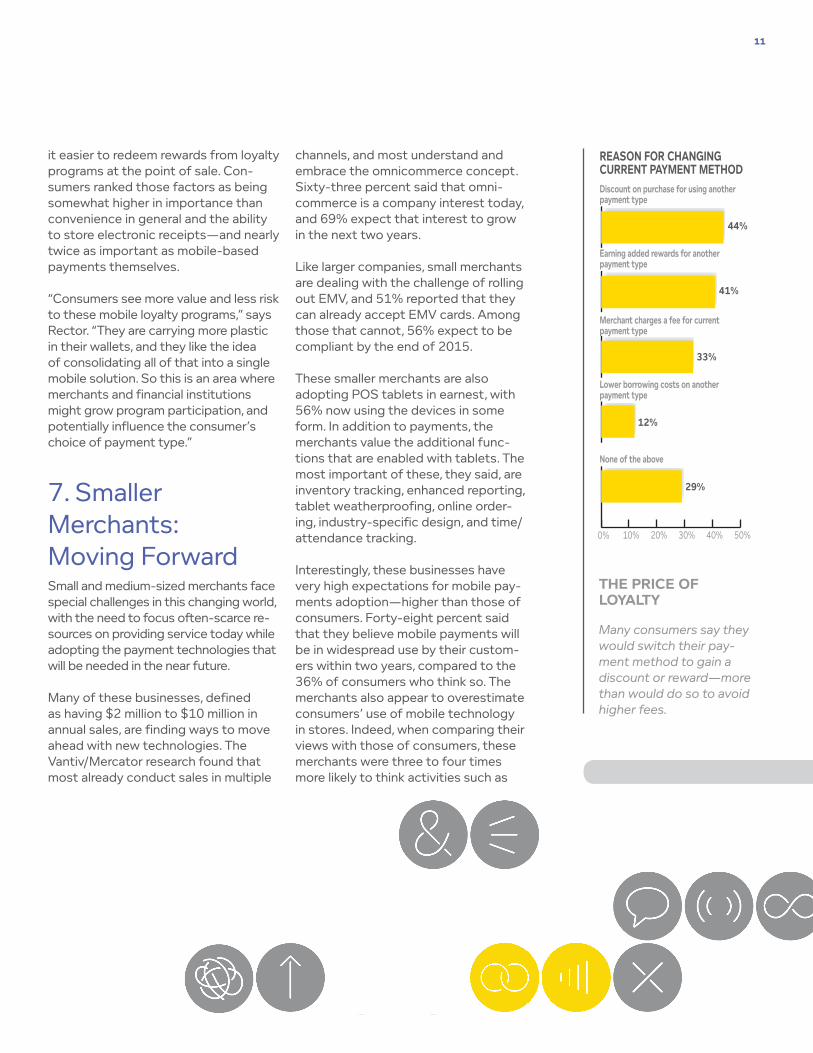
0% 10% 20% 30% 40% 50%
44%
41%
33%
29%
12%
Earning added rewards for another payment type
Merchant charges a fee for current payment type
Discount on purchase for using another payment type
Lower borrowing costs on another payment type
None of the above
REASON FOR CHANGING CURRENT PAYMENT METHOD
the price of loyalty
Many consumers say they would switch their pay-ment method to gain a discount or reward—more than would do so to avoid higher fees.
it easier to redeem rewards from loyalty programs at the point of sale. Con-sumers ranked those factors as being somewhat higher in importance than convenience in general and the ability to store electronic receipts—and nearly twice as important as mobile-based payments themselves.
“Consumers see more value and less risk to these mobile loyalty programs,” says Rector. “They are carrying more plastic in their wallets, and they like the idea of consolidating all of that into a single mobile solution. So this is an area where merchants and financial institutions might grow program participation, and potentially influence the consumer’s choice of payment type.”
7. Smaller Merchants: Moving ForwardSmall and medium-sized merchants face special challenges in this changing world, with the need to focus often-scarce re-sources on providing service today while adopting the payment technologies that will be needed in the near future.
Many of these businesses, defined as having $2 million to $10 million in annual sales, are finding ways to move ahead with new technologies. The Vantiv/Mercator research found that most already conduct sales in multiple
channels, and most understand and embrace the omnicommerce concept. Sixty-three percent said that omni-commerce is a company interest today, and 69% expect that interest to grow in the next two years.
Like larger companies, small merchants are dealing with the challenge of rolling out EMV, and 51% reported that they can already accept EMV cards. Among those that cannot, 56% expect to be compliant by the end of 2015.
These smaller merchants are also adopting POS tablets in earnest, with 56% now using the devices in some form. In addition to payments, the merchants value the additional func-tions that are enabled with tablets. The most important of these, they said, are inventory tracking, enhanced reporting, tablet weatherproofing, online order-ing, industry-specific design, and time/attendance tracking.
Interestingly, these businesses have very high expectations for mobile pay-ments adoption—higher than those of consumers. Forty-eight percent said that they believe mobile payments will be in widespread use by their custom-ers within two years, compared to the 36% of consumers who think so. The merchants also appear to overestimate consumers’ use of mobile technology in stores. Indeed, when comparing their views with those of consumers, these merchants were three to four times more likely to think activities such as
12
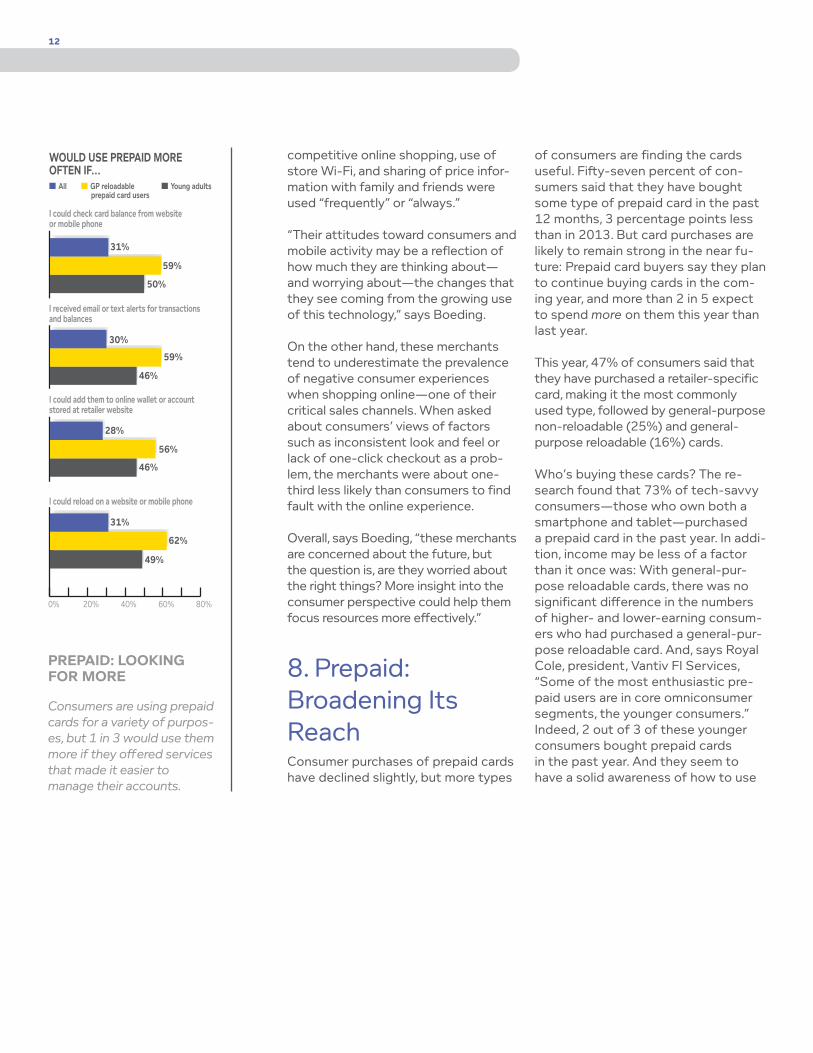
0% 20% 40% 60% 80%
31%
59%
50%
30%
59%
56%
28%
46%
WOULD USE PREPAID MORE OFTEN IF…
I received email or text alerts for transactions and balances
46%
31%
62%
49%
I could check card balance from website or mobile phone
I could add them to online wallet or account stored at retailer website
I could reload on a website or mobile phone
■ All ■ GP reloadable ■ Young adults prepaid card users
prepaid: looking for more
Consumers are using prepaid cards for a variety of purpos-es, but 1 in 3 would use them more if they offered services that made it easier to manage their accounts.
competitive online shopping, use of store Wi-Fi, and sharing of price infor-mation with family and friends were used “frequently” or “always.”
“Their attitudes toward consumers and mobile activity may be a reflection of how much they are thinking about—and worrying about—the changes that they see coming from the growing use of this technology,” says Boeding.
On the other hand, these merchants tend to underestimate the prevalence of negative consumer experiences when shopping online—one of their critical sales channels. When asked about consumers’ views of factors such as inconsistent look and feel or lack of one-click checkout as a prob-lem, the merchants were about one-third less likely than consumers to find fault with the online experience.
Overall, says Boeding, “these merchants are concerned about the future, but the question is, are they worried about the right things? More insight into the consumer perspective could help them focus resources more effectively.”
8. Prepaid: Broadening Its ReachConsumer purchases of prepaid cards have declined slightly, but more types
of consumers are finding the cards useful. Fifty-seven percent of con-sumers said that they have bought some type of prepaid card in the past 12 months, 3 percentage points less than in 2013. But card purchases are likely to remain strong in the near fu-ture: Prepaid card buyers say they plan to continue buying cards in the com-ing year, and more than 2 in 5 expect to spend more on them this year than last year.
This year, 47% of consumers said that they have purchased a retailer-specific card, making it the most commonly used type, followed by general-purpose non-reloadable (25%) and general-purpose reloadable (16%) cards.
Who’s buying these cards? The re-search found that 73% of tech-savvy consumers—those who own both a smartphone and tablet—purchased a prepaid card in the past year. In addi-tion, income may be less of a factor than it once was: With general-pur-pose reloadable cards, there was no significant difference in the numbers of higher- and lower-earning consum-ers who had purchased a general-pur-pose reloadable card. And, says Royal Cole, president, Vantiv FI Services, “Some of the most enthusiastic pre-paid users are in core omniconsumer segments, the younger consumers.” Indeed, 2 out of 3 of these younger consumers bought prepaid cards in the past year. And they seem to have a solid awareness of how to use

13
general-purpose reloadable cards and are more likely than average to have actually reloaded one of their cards.
Consumers are using prepaid cards for various reasons. Many said that the cards are helpful in managing household budgets. Others see them as offering high levels of security. Although confi-dence in the security of prepaid cards declined this year—presumably the re-sult of high-profile data breaches—con-sumers still see them as being the most secure form of payment. With that in mind, nearly half said that prepaid cards are useful for online purchases.
A sizable number of prepaid buyers expect to use their cards in place of traditional checking and debit ac-counts. Twenty percent said they plan to use prepaid for purchases they would have made with a debit card, and 29% expect to use prepaid as a complete substitute for debit. More than 20% think that general-purpose reloadable cards are cheaper than debit accounts, or that using them is easier than dealing with a bank to use a debit card. Young people are most interested in making these substitu-tions, and men are more interested in doing so than women (24% vs. 16%, respectively). Here again, there is no significant difference in the percent-ages of higher- and lower-income earners who are interested in doing so. “Consumers are clearly expecting to use prepaid products at the expense of debit, and financial institutions
should be thinking about how to serve those customers and contend with this shift,” says Cole.
The research also shed light on what merchants and financial institutions can do to increase prepaid usage. Among all consumers, about 3 out of 10 said that they would use prepaid cards more if they could more eas-ily check card balances via Web or phone; get alerts about transactions and balances; use them in a mobile wallet or online retailer account; or use a website or phone to reload their cards. Among consumers who already own general-purpose reload-able cards, that figure was closer to 6 out of 10. “The flat growth that we’ve seen in prepaid cards over the last year may be the result of consumers wanting more convenience and ease in managing their accounts,” says Cole. “So there is a real business op-portunity for the industry here.”
9. Change in a Competitive LandscapeVantiv/Mercator research shows that industry executives see opportunity in technology-driven change and innova-tion. But they are also concerned about focusing their efforts on the right things and keeping pace with those technologies—as well with evolving
eXecutiVe VieWson prepaid cards
In Vantiv/Mercator interviews, many executives expressed enthusiasm for prepaid.
“We’re looking to GPR cards as an alternative [to check-ing]. There are segments...who want it for budgeting, online purchases, and compartmen-talized spending.“
—Regional bank
“For most of our prepaid customers now, their prepaid card is their primary card.”
—Regional bank
“Our gift or cash card busi-ness is an important one, and we make sure it’s reloadable.”
—Large retailer
“We sell gift cards online, in our restaurants, and through third parties. We offer incen-tives to buy directly from us during the holidays.”
—Restaurant chain
“We market them for person-al use instead of debit cards or cash with our mobile app.”
—Quick-serve restaurant chain
14
0% 10% 20%
16%
16%
15%
20%
14%
15%
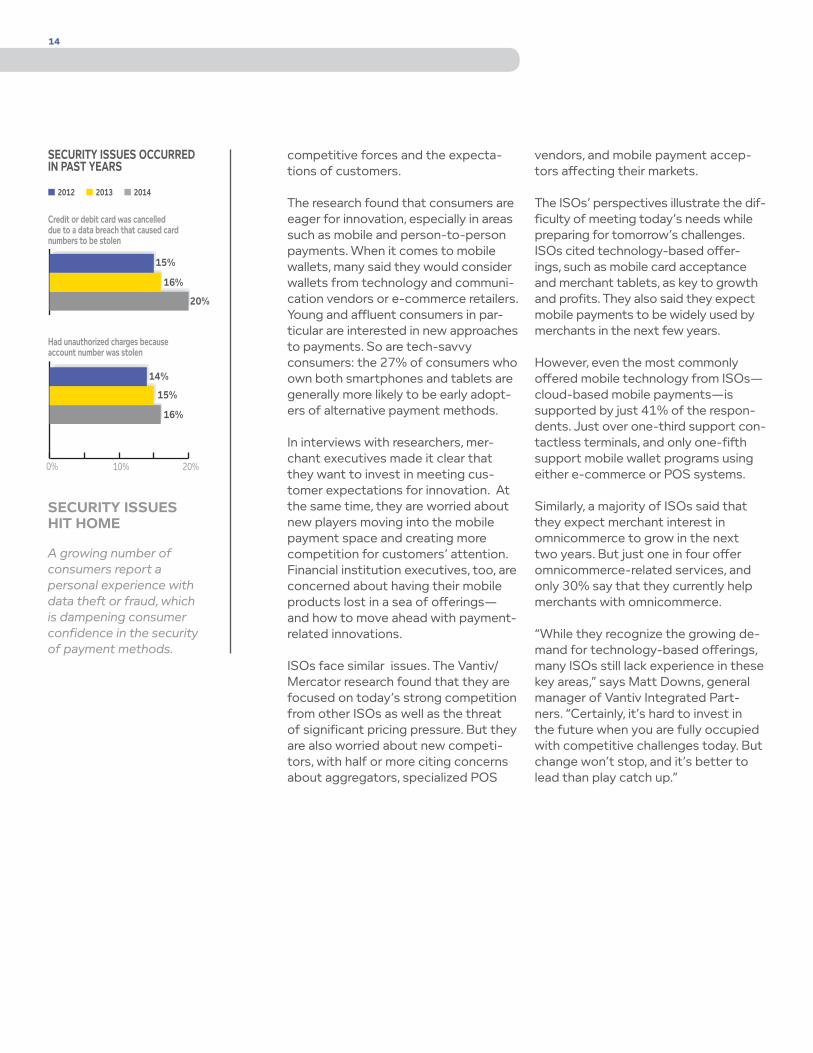
Credit or debit card was cancelled due to a data breach that caused card numbers to be stolen
SECURITY ISSUES OCCURRED IN PAST YEARS
■ 2012 ■ 2013 ■ 2014
Had unauthorized charges because account number was stolen
security issues hit home
A growing number of consumers report a personal experience with data theft or fraud, which is dampening consumer confidence in the security of payment methods.
competitive forces and the expecta-tions of customers.
The research found that consumers are eager for innovation, especially in areas such as mobile and person-to-person payments. When it comes to mobile wallets, many said they would consider wallets from technology and communi-cation vendors or e-commerce retailers. Young and affluent consumers in par-ticular are interested in new approaches to payments. So are tech-savvy consumers: the 27% of consumers who own both smartphones and tablets are generally more likely to be early adopt-ers of alternative payment methods.
In interviews with researchers, mer-chant executives made it clear that they want to invest in meeting cus-tomer expectations for innovation. At the same time, they are worried about new players moving into the mobile payment space and creating more competition for customers’ attention. Financial institution executives, too, are concerned about having their mobile products lost in a sea of offerings—and how to move ahead with payment-related innovations.
ISOs face similar issues. The Vantiv/Mercator research found that they are focused on today’s strong competition from other ISOs as well as the threat of significant pricing pressure. But they are also worried about new competi-tors, with half or more citing concerns about aggregators, specialized POS
vendors, and mobile payment accep-tors affecting their markets.
The ISOs’ perspectives illustrate the dif-ficulty of meeting today’s needs while preparing for tomorrow’s challenges. ISOs cited technology-based offer-ings, such as mobile card acceptance and merchant tablets, as key to growth and profits. They also said they expect mobile payments to be widely used by merchants in the next few years.
However, even the most commonly offered mobile technology from ISOs—cloud-based mobile payments—is supported by just 41% of the respon-dents. Just over one-third support con-tactless terminals, and only one-fifth support mobile wallet programs using either e-commerce or POS systems.
Similarly, a majority of ISOs said that they expect merchant interest in omnicommerce to grow in the next two years. But just one in four offer omnicommerce-related services, and only 30% say that they currently help merchants with omnicommerce.
“While they recognize the growing de-mand for technology-based offerings, many ISOs still lack experience in these key areas,” says Matt Downs, general manager of Vantiv Integrated Part-ners. “Certainly, it’s hard to invest in the future when you are fully occupied with competitive challenges today. But change won’t stop, and it’s better to lead than play catch up.”
15
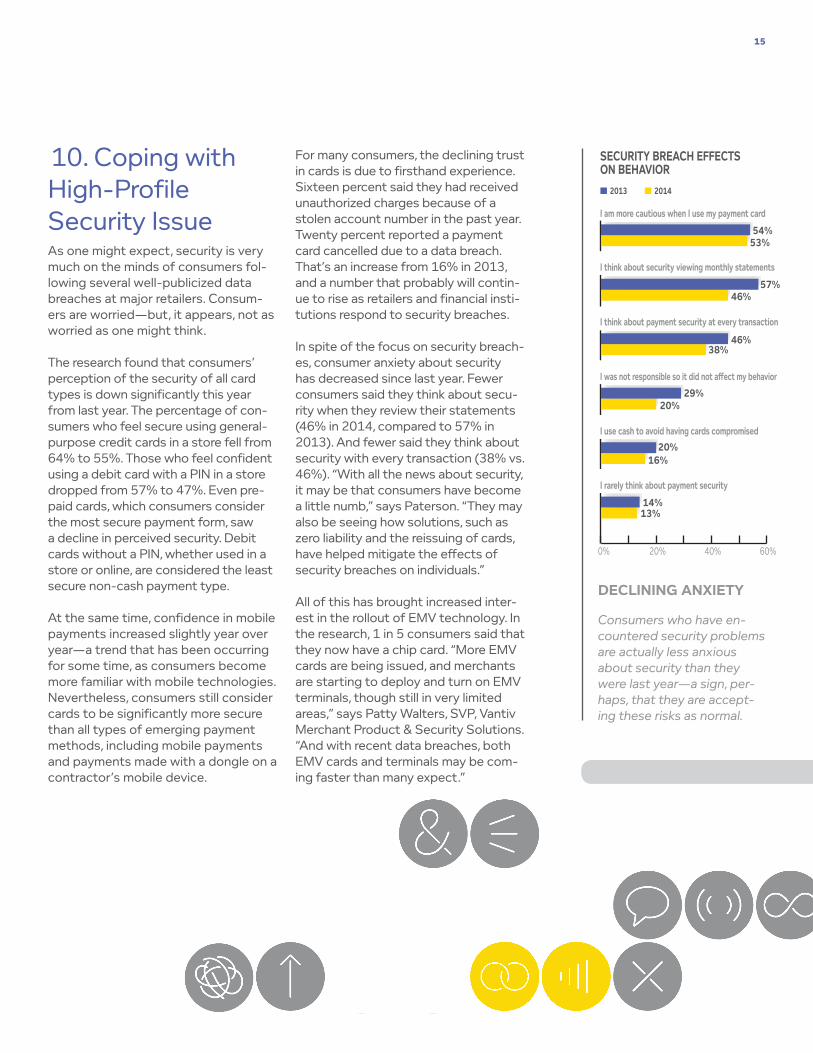
declining anXiety
Consumers who have en-countered security problems are actually less anxious about security than they were last year—a sign, per-haps, that they are accept-ing these risks as normal.
10. Coping with High-Profile Security Issue As one might expect, security is very much on the minds of consumers fol-lowing several well-publicized data breaches at major retailers. Consum-ers are worried—but, it appears, not as worried as one might think.
The research found that consumers’ perception of the security of all card types is down significantly this year from last year. The percentage of con-sumers who feel secure using general-purpose credit cards in a store fell from 64% to 55%. Those who feel confident using a debit card with a PIN in a store dropped from 57% to 47%. Even pre-paid cards, which consumers consider the most secure payment form, saw a decline in perceived security. Debit cards without a PIN, whether used in a store or online, are considered the least secure non-cash payment type.
At the same time, confidence in mobile payments increased slightly year over year—a trend that has been occurring for some time, as consumers become more familiar with mobile technologies. Nevertheless, consumers still consider cards to be significantly more secure than all types of emerging payment methods, including mobile payments and payments made with a dongle on a contractor’s mobile device.
For many consumers, the declining trust in cards is due to firsthand experience. Sixteen percent said they had received unauthorized charges because of a stolen account number in the past year. Twenty percent reported a payment card cancelled due to a data breach. That’s an increase from 16% in 2013, and a number that probably will contin-ue to rise as retailers and financial insti-tutions respond to security breaches.
In spite of the focus on security breach-es, consumer anxiety about security has decreased since last year. Fewer consumers said they think about secu-rity when they review their statements (46% in 2014, compared to 57% in 2013). And fewer said they think about security with every transaction (38% vs. 46%). “With all the news about security, it may be that consumers have become a little numb,” says Paterson. “They may also be seeing how solutions, such as zero liability and the reissuing of cards, have helped mitigate the effects of security breaches on individuals.”
All of this has brought increased inter-est in the rollout of EMV technology. In the research, 1 in 5 consumers said that they now have a chip card. “More EMV cards are being issued, and merchants are starting to deploy and turn on EMV terminals, though still in very limited areas,” says Patty Walters, SVP, Vantiv Merchant Product & Security Solutions. “And with recent data breaches, both EMV cards and terminals may be com-ing faster than many expect.”
0% 20% 40% 60%
54%53%
57%46%
46%38%
29%
14%
20%16%
20%
■ 2013 ■ 2014
13%
I think about security viewing monthly statements
I think about payment security at every transaction
I am more cautious when I use my payment card
I was not responsible so it did not a�ect my behavior
I use cash to avoid having cards compromised
I rarely think about payment security
SECURITY BREACH EFFECTS ON BEHAVIOR
Vantiv corporate headquarters
8500 Governors Hill Drive, Cincinnati, OH 45249866-622-2880 | www.vantiv.com
about Vantiv
Vantiv is one of the leading integrated payment processors in the United States. Known as Fifth Third Processing Solutions since 1971, the company, headquartered in Cincinnati, Ohio, changed its name to Vantiv in 2011, and became a public company in 2012. Vantiv’s credit, debit, prepaid, and data security solutions help businesses and financial institutions of all sizes get the most out of payment activities.
TL0002 4/14
The question is, how prepared are con-sumers for this rollout? Issuers appear to be marketing the chip cards better, as fewer consumers are now unsure whether they have one (16% this year, down from 19% last year). But there is still considerable confusion. Most EMV card owners (63%) mistakenly think that their chip cards are more secure than payment cards without chips even when swiping it like any other payment card in a terminal. (Interestingly, seniors appear to have a better understanding than younger adults that this isn’t so.) And 42% of EMV card owners mistak-enly think their cards are more secure for online purchases. “This all suggests that there is still a lot of education that needs to be done by both issuers and merchants to help consumers under-stand the importance of their EMV cards,” says Walters.
Conclusion In looking at these trends, it is clear that merchants and financial institutions operate in a dynamic environment. It is also clear that these changes are not temporary. Constant change will be with us for the foreseeable future.
Technology continues to move ahead, reaching more consumers and more companies—and even small merchants and financial institutions will need to take advantage of more-sophisticated tools. Mobile payments are opening the
door to new competitors. An increas-ingly multichannel world creates new opportunities for reaching customers. Challenges to data and payments secu-rity keep evolving—as does an already complex regulatory environment.
“Change is the new normal, and com-panies need to factor that into their plans,” says Mielke. “That can make it difficult to know how to move for-ward—what new capabilities to deploy, and when and how to deploy them.”
In response, many merchants and finan-cial institutions have held back, preferring to wait until technologies, standards, and consumer attitudes reach a kind of end state. But when change is normal, there is no end state. The traditional “wait-and-see” strategy is not viable—and execu-tives are recognizing that. This year’s research uncovered a shift away from the wait-and-see mind-set and toward taking action. Many in the industry are implementing new programs, piloting new technologies, and collaborating with their ecosystems of partners to move forward.
As companies act, consumer attitudes and behaviors can provide a road map for directing and prioritizing efforts. As this year’s research shows, consum-ers are no longer passive recipients of the industry’s offerings. They are often leading the way. Understanding what they want and where they are going will be key to success.
source for all charts: Vantiv/mercator insights research 2014
®