tools and techniques for management of … · peñaranda, gonzalo huaylla, hugo weisser, iván...
TRANSCRIPT

L E A R N I N G G U I D E2 0 1 8
Project Management Associate(PMA) Certification
TOOLS ANDTECHNIQUES FORMANAGEMENT OFDEVELOPMENTPROJECTS PM4R

AUTHORS
TECHNICAL REVISION
FOURTH EDITION
IDB COLLABORATORS
SPECIAL RECOGNITION
Rodolfo Siles, PMP,and Ernesto Mondelo, PMP.
Harald Modis, PMP; Galileo Solís, PMP;John Cropper, Prince2; Victoria Galeano,PMP,and Roberto Toledo, PMP.
Ricardo Sánchez Orduña, PMP.
Matilde Neret; Carolina Aclan; Nydia Díaz;Rafael Millan; Juan Carlos Sánchez;Jorge Quinteros; Roberto García; BeatrizJellinek; Eugenio Hillman; MasamiYamamori; Víctor Shiguiyama; Juan ManuelLeano; Gabriel Nagy, PMP; Samantha Pérez;Cynthia Smith, and Pablo Rolando.
To the team members that contributedto the validation of the course contentsand methodology.
Paraguay
Ada Verna, Adilio Celle, Alcides Moreno, Álvaro Carrón, Amado Rivas, Amilcar Cazal, Carmiña Fernández, Carolina Centurión, Carolina Vera, Cesar David Rodas, Daniel Bogado, Diana Alarcón, Eduardo Feliciangeli, Félix Carballo, Fernando Santander, Gloria Rojas, Gonzalo Muñoz, Hernán Benítez, Hugo García, Ignacio Correa, Joaquín Núñez, Jorge Oyamada, Jorge Vergara, José Demichelis, Juan Jacquet, Laura Santander, Lourdes Casanello, Luz Cáceres, Mabel Abadiez, Malvina Duarte, Mariano Perales, Marta Corvalán, Marta Duarte, Nelson Figueredo, Nilson Román, Noel Teo-doro, Nohora Alvarado, Norma López, Norma Ríos, Oscar Charotti, Patricia Ruiz, Reinaldo Peralta, Roberto Bogado, Roberto Camblor, Rocío González, Simón Zalim-ben, and Sonia Suárez.
Bolivia
Alex Saldías, Amelia López, Ana Meneses, Boris Gonzáles, Christian Lündstedt, Debbie Morales, Edgar Orellana, Fernando Portugal, Francisco Zegarra, Freddy Acebey, Freddy Gómez, Gabriela Sandi, Georgia Peláez, Gilberto Moncada, Gina Peñaranda, Gonzalo Huaylla, Hugo Weisser, Iván Iporre, Jorge Cossio, Joyce Elliot, Karin Daza, Leticia Flores, Luis Yujra, Marcelino Aliaga, Margarita Ticona, María Fer-nanda Padrón, Mónica Sanabria, Nicolás Catacora, Rommy Verástegui, Rossana Fernández, Rossina Alba, Salvador Torrico, and Santiago Rendón.
1T h i s d o c u m e n t i s i n t e l l e c t u a l p r o p e r t y o f t h e I n t e r - A m e r i c a n D e v e l o p m e n t B a n k ( I D B ) a n d t h e I n t e r - A m e r i c a n I n s t i t u t e f o r E c o n o m i c a n d S o c i a l D e v e l o p m e n t ( I N D E S ) . A n y p a r t i a l o r f u l l r e p r o d u c t i o n o f t h i s d o c u m e n t m u s t b e r e p o r t e d t o : B I D - I N D E S @ i a d b . o r g
L E A R N I N G G U I D E - 2 0 1 8

El Salvador
Alfonso Salazar, Alirio González, Ana Cabrera, Augusto Hernández, Carla Recinos, Carlos Navarrete, Carmen Álvarez, Carolina Flores, Eduardo Hernández, Eduardo Rivera, Elsye Guzmán, Felipe Ricas, Fidelina Mendoza, Fidia Echeverría, Frida Mejía, Gabriel Castillo, Gabriela Molina, Jaime Siliezar, Jenny Fuentes, Jorge Hernández, Juan Meléndez, Karen Fernández, Karla Sandoval, Lilena Martínez, Luis Barrera, Mario Castaneda, Mario Pérez, Nelson Estrada, Nidia Hidalgo, Orlando Valeriano, Pedro Pérez, Rafael Huezo, Regina Cuéllar, Ricardo Olmos, Ronny Rodríguez, Santiago Cas-tillo, Susana Castillo, and Yolanda Núñez.
This document represents the intellectual property of the InterAmerican Development Bank (IDB) and the Inter American Institutefor Social and Economic Development (INDES). Any partial or fullreproduction of this document must be reported to:
4th Edition
2T h i s d o c u m e n t i s i n t e l l e c t u a l p r o p e r t y o f t h e I n t e r - A m e r i c a n D e v e l o p m e n t B a n k ( I D B ) a n d t h e I n t e r - A m e r i c a n I n s t i t u t e f o r E c o n o m i c a n d S o c i a l D e v e l o p m e n t ( I N D E S ) . A n y p a r t i a l o r f u l l r e p r o d u c t i o n o f t h i s d o c u m e n t m u s t b e r e p o r t e d t o : B I D - I N D E S @ i a d b . o r g
L E A R N I N G G U I D E - 2 0 1 8

TA B L E O F C O N T E N T S
CHAPTER 1. INTRODUCTION TO PROJECT MANAGEMENT AND PROJECT START-UP
Unit I. Management of development projects
Learning objectives
I.1. Projects and development
I.2. The concept of management of development projects
Unit summary
Unit II. Project start-up
Learning objectives
II.1. Project governance
II.2. Results matrix (RM)
II.3. Stakeholders matrix
II.4. Project Charter
II.5. Project management tools
Unit summary
Bibliographical references
7
9
9
9
12
24
25
25
25
28
32
37
40
42
43
List of figures
List of tables
CHAPTER 2. PROJECT MANAGEMENT TOOLS (PART I)
Unit I. Step 1: Breaking down the project scope
Learning objectives
I.1. Work Breakdown Structure (WBS)
44
44
45
47
47
47
3T h i s d o c u m e n t i s i n t e l l e c t u a l p r o p e r t y o f t h e I n t e r - A m e r i c a n D e v e l o p m e n t B a n k ( I D B ) a n d t h e I n t e r - A m e r i c a n I n s t i t u t e f o r E c o n o m i c a n d S o c i a l D e v e l o p m e n t ( I N D E S ) . A n y p a r t i a l o r f u l l r e p r o d u c t i o n o f t h i s d o c u m e n t m u s t b e r e p o r t e d t o : B I D - I N D E S @ i a d b . o r g
L E A R N I N G G U I D E - 2 0 1 8

I.2. Inputs
I.3. Techniques
I.4. Outputs
Unit summary
Unit II. Step 2: The project schedule
Learning objectives
II.1. The Project schedule
II.2. Inputs
II.3. Techniques
II.4. Outputs
Unit summary
Unit III. Step 3: Resource utilization curve
Learning objectives
III.1. S Curve
III.2. Inputs
48
49
50
52
53
53
53
54
54
61
62
63
63
63
III.3. Techniques
III.4. Outputs
Unit summary
Bibliographical references
List of figures
List of tables
65
65
69
71
72
73
73
CHAPTER 3. PROJECT MANAGEMENT TOOLS (PART II)
Unit I. Step 4: The procurement matrix
74
76
4T h i s d o c u m e n t i s i n t e l l e c t u a l p r o p e r t y o f t h e I n t e r - A m e r i c a n D e v e l o p m e n t B a n k ( I D B ) a n d t h e I n t e r - A m e r i c a n I n s t i t u t e f o r E c o n o m i c a n d S o c i a l D e v e l o p m e n t ( I N D E S ) . A n y p a r t i a l o r f u l l r e p r o d u c t i o n o f t h i s d o c u m e n t m u s t b e r e p o r t e d t o : B I D - I N D E S @ i a d b . o r g
L E A R N I N G G U I D E - 2 0 1 8

Learning objectives
I.1. The procurement matrix
I.2. Inputs
I.3. Techniques
I.4. Outputs
Unit summary
Unit II. Step 5: The risk matrix
Learning objectives
II.1. The risk matrix
II.2. Inputs
II.3. Techniques
II.4. Outputs
Unit summary
Unit III. Step 6: The communications matrix
Learning objectives
76
76
77
77
79
80
81
81
81
83
83
90
91
92
92
III.1. The communications matrix
III.2. Inputs
III.3. Techniques
III.4. Outputs
Unit summary
Bibliographical references
92
93
93
97
97
5
Unit summary
Unit IV. Step 7: The responsibility assignment matrix
97
98
T h i s d o c u m e n t i s i n t e l l e c t u a l p r o p e r t y o f t h e I n t e r - A m e r i c a n D e v e l o p m e n t B a n k ( I D B ) a n d t h e I n t e r - A m e r i c a n I n s t i t u t e f o r E c o n o m i c a n d S o c i a l D e v e l o p m e n t ( I N D E S ) . A n y p a r t i a l o r f u l l r e p r o d u c t i o n o f t h i s d o c u m e n t m u s t b e r e p o r t e d t o : B I D - I N D E S @ i a d b . o r g
95
L E A R N I N G G U I D E - 2 0 1 8

Learning objectives
IV.1. Assignment of responsibilities
IV.2. Inputs
IV.3. Techniques
IV.4. Outputs
Unit summary
Bibliographical references
List of figures
List of tables
CHAPTER 4. PROJECT MONITORING AND CONTROL
Unit I. Project execution plan
Learning objectives
I.1. The planning matrix
I.2. Inputs
I.3. Techniques
98
98
99
99
102
103
104
105
105
106
108
108
108
110
110
I.4. Outputs
I.5. Project execution plan
I.6. Relationship with results-oriented planning
Unit summary
Unit II. Earned value analysis
Learning objectives
111
111
114
117
118
118
6
II.1. Earned value (EV) analysis
II.2. Inputs
118
118
T h i s d o c u m e n t i s i n t e l l e c t u a l p r o p e r t y o f t h e I n t e r - A m e r i c a n D e v e l o p m e n t B a n k ( I D B ) a n d t h e I n t e r - A m e r i c a n I n s t i t u t e f o r E c o n o m i c a n d S o c i a l D e v e l o p m e n t ( I N D E S ) . A n y p a r t i a l o r f u l l r e p r o d u c t i o n o f t h i s d o c u m e n t m u s t b e r e p o r t e d t o : B I D - I N D E S @ i a d b . o r g
L E A R N I N G G U I D E - 2 0 1 8

96
II.3. Techniques
II.4. Outputs
Unit summary
Bibliographical references
List of figures
List of tables
GLOSSARY
119
123
125
126
127
127
128
T h i s d o c u m e n t i s i n t e l l e c t u a l p r o p e r t y o f t h e I n t e r - A m e r i c a n D e v e l o p m e n t B a n k ( I D B ) a n d t h e I n t e r - A m e r i c a n I n s t i t u t e f o r E c o n o m i c a n d S o c i a l D e v e l o p m e n t ( I N D E S ) . A n y p a r t i a l o r f u l l r e p r o d u c t i o n o f t h i s d o c u m e n t m u s t b e r e p o r t e d t o : B I D - I N D E S @ i a d b . o r g
L E A R N I N G G U I D E - 2 0 1 8

7
Introduction to project managementand project start up
CHAPTER 1
T h i s d o c u m e n t i s i n t e l l e c t u a l p r o p e r t y o f t h e I n t e r - A m e r i c a n D e v e l o p m e n t B a n k ( I D B ) a n d t h e I n t e r - A m e r i c a n I n s t i t u t e f o r E c o n o m i c a n d S o c i a l D e v e l o p m e n t ( I N D E S ) . A n y p a r t i a l o r f u l l r e p r o d u c t i o n o f t h i s d o c u m e n t m u s t b e r e p o r t e d t o : B I D - I N D E S @ i a d b . o r g
L E A R N I N G G U I D E - 2 0 1 8

This chapter presents basic concepts of development projects, a brief analysis of the environment in which they unfold, their unique characteristics, and the relationship between development projects and strategies.
This chapter is divided into two units: the first illustrates the project relationship with a country’s development and financing strategies; the second unit presents the basic concepts and definitions of project management, a brief introduction to the most important planning tools and their use within development projects. This chapter also includes a series of guiding questions on the main challenges of the lesson. The corre-sponding answers will emerge as the subjects raised in each unit are addressed in depth. These questions are formulated as an invitation to investigate and get involved in these subjects based on other points of view and sources of information.
C H A P T E R I N T R O D U C T I O N
8T h i s d o c u m e n t i s i n t e l l e c t u a l p r o p e r t y o f t h e I n t e r - A m e r i c a n D e v e l o p m e n t B a n k ( I D B ) a n d t h e I n t e r - A m e r i c a n I n s t i t u t e f o r E c o n o m i c a n d S o c i a l D e v e l o p m e n t ( I N D E S ) . A n y p a r t i a l o r f u l l r e p r o d u c t i o n o f t h i s d o c u m e n t m u s t b e r e p o r t e d t o : B I D - I N D E S @ i a d b . o r g
L E A R N I N G G U I D E - 2 0 1 8
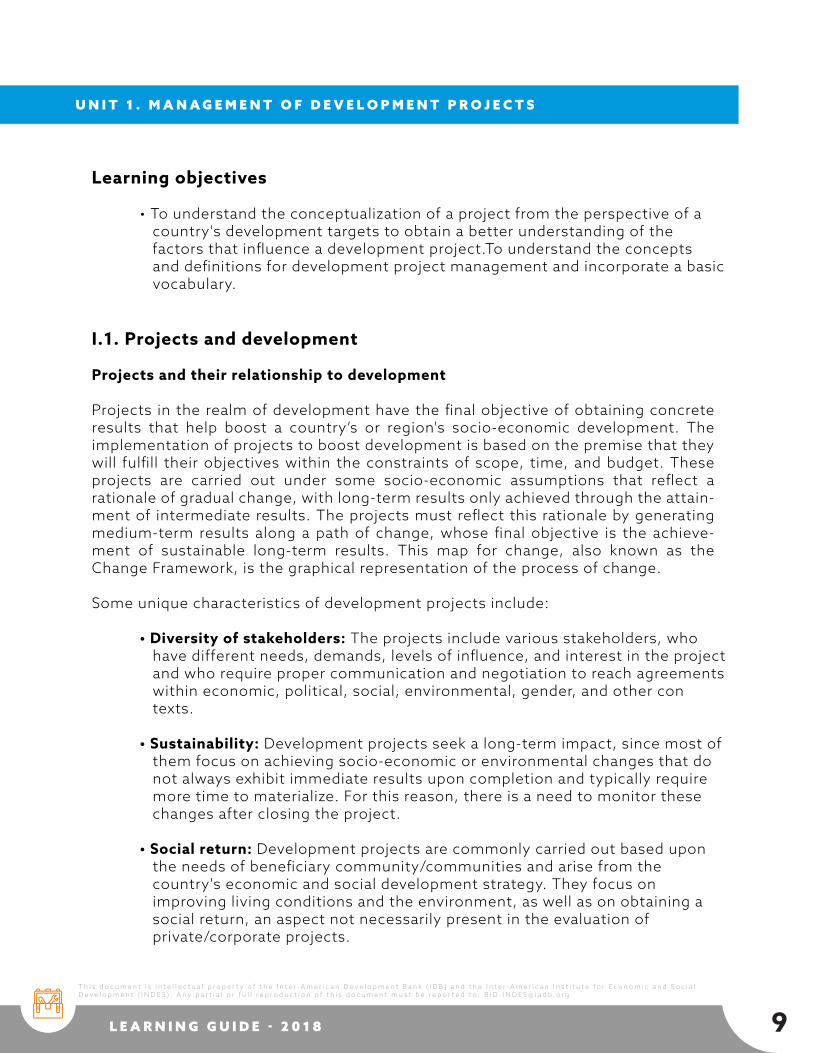
Learning objectives
• To understand the conceptualization of a project from the perspective of a country's development targets to obtain a better understanding of the factors that influence a development project.To understand the concepts and definitions for development project management and incorporate a basic vocabulary.
I.1. Projects and development
Projects and their relationship to development
Projects in the realm of development have the final objective of obtaining concrete results that help boost a country’s or region's socio-economic development. The implementation of projects to boost development is based on the premise that they will fulfill their objectives within the constraints of scope, time, and budget. These projects are carried out under some socio-economic assumptions that reflect a rationale of gradual change, with long-term results only achieved through the attain-ment of intermediate results. The projects must reflect this rationale by generating medium-term results along a path of change, whose final objective is the achieve-ment of sustainable long-term results. This map for change, also known as the Change Framework, is the graphical representation of the process of change.
Some unique characteristics of development projects include:
• Diversity of stakeholders: The projects include various stakeholders, who have different needs, demands, levels of influence, and interest in the project and who require proper communication and negotiation to reach agreements within economic, political, social, environmental, gender, and other con texts.
• Sustainability: Development projects seek a long-term impact, since most of them focus on achieving socio-economic or environmental changes that do not always exhibit immediate results upon completion and typically require more time to materialize. For this reason, there is a need to monitor these changes after closing the project.
• Social return: Development projects are commonly carried out based upon the needs of beneficiary community/communities and arise from the country's economic and social development strategy. They focus on improving living conditions and the environment, as well as on obtaining a social return, an aspect not necessarily present in the evaluation of private/corporate projects.
U N I T 1 . M A N A G E M E N T O F D E V E L O P M E N T P R O J E C T S
9L E A R N I N G G U I D E - 2 0 1 8
T h i s d o c u m e n t i s i n t e l l e c t u a l p r o p e r t y o f t h e I n t e r - A m e r i c a n D e v e l o p m e n t B a n k ( I D B ) a n d t h e I n t e r - A m e r i c a n I n s t i t u t e f o r E c o n o m i c a n d S o c i a l D e v e l o p m e n t ( I N D E S ) . A n y p a r t i a l o r f u l l r e p r o d u c t i o n o f t h i s d o c u m e n t m u s t b e r e p o r t e d t o : B I D - I N D E S @ i a d b . o r g

The country's development strategy
Each country has a series of social and economic needs and priorities by which it decides how to allocate public investment through development projects financed with domestic and foreign funds. The government determines and identifies these needs within the country's development strategy, which includes development objectives, strategic priorities, an international cooperation plan, and the analysis of the socio-economic environment. This strategy is revisited periodically and is related to government cycles and, in some cases, with a longer-term vision (10 years).
Organizations that fund development projects, in turn, have key areas of support that supplement the analysis of the country's social and economic development, and form part of the negotiations between a government and that entity to identify the common areas of support (Figure I.1). Both parties seek to:
• Implement development strategies through adequate operational frameworks in the areas of planning, budgeting, and performance evaluation.
• Prioritize the alignment of international cooperation objectives.
• Intensify synergies and collaboration with respect to development policies, strategies, and performance.
• Eliminate the redundancy of efforts to achieve the greatest possible return.
• Reform and simplify policies and procedures to foster progressive collaboration and alignment.
• Undertake concrete and effective actions in the search for development results.
• Combat corruption and the lack of transparency, which prevent mobilization and effective resource allocation, and divert vital resources intended for poverty eradication and sustainable economic development.
10T h i s d o c u m e n t i s i n t e l l e c t u a l p r o p e r t y o f t h e I n t e r - A m e r i c a n D e v e l o p m e n t B a n k ( I D B ) a n d t h e I n t e r - A m e r i c a n I n s t i t u t e f o r E c o n o m i c a n d S o c i a l D e v e l o p m e n t ( I N D E S ) . A n y p a r t i a l o r f u l l r e p r o d u c t i o n o f t h i s d o c u m e n t m u s t b e r e p o r t e d t o : B I D - I N D E S @ i a d b . o r g
L E A R N I N G G U I D E - 2 0 1 8

Development projects represent vehicles to help a country improve its development indicators. In this sense, all development parties are constantly establishing working frameworks that facilitate collaboration and the efficiency of their actions to achieve a greater impact. One of current standards representative of this effort is the devel-opment effectiveness framework. 1
Development effectiveness
The effectiveness of development investments is measured based upon the results achieved by projects. Most funding organizations have developed tools to achieve greater effectiveness in development; these canmeasure the results obtained with available resources and justify if funds raised are achieving the expected results.Or-ganizations receiving financing (entities executing the projects) use these tools not only as requirements established by the same funding bodies but also as instruments to measure results and progress in the achievement of project development targets. The tools that are part of the development effectiveness framework are characteris-tic of a new culture of results-oriented management, which includes four areas: i)strategic planning, ii) risk management, iii) result-based performance monitor-ing,andiv) evaluation of results.
1 For further information, refer to the Paris Declaration document (OECD-DAC) at www.oecd.org.
Figure I.1.Joint development strategies
Jointdevelopment
strategies
C o u n t r y
Developmentstrategies
Developmentstrategies
F i n a n c e r
Source: Compiled by author
11T h i s d o c u m e n t i s i n t e l l e c t u a l p r o p e r t y o f t h e I n t e r - A m e r i c a n D e v e l o p m e n t B a n k ( I D B ) a n d t h e I n t e r - A m e r i c a n I n s t i t u t e f o r E c o n o m i c a n d S o c i a l D e v e l o p m e n t ( I N D E S ) . A n y p a r t i a l o r f u l l r e p r o d u c t i o n o f t h i s d o c u m e n t m u s t b e r e p o r t e d t o : B I D - I N D E S @ i a d b . o r g
L E A R N I N G G U I D E - 2 0 1 8

Basic concepts
Project management, also known as project administration or direction,is a disci-pline that serves to guide and integrate the processes necessary to initiate, plan, execute, control and close projects to complete all the work required to execute a project and fulfill the stipulated scope within defined cost and time constraints.
Development project management encompasses various disciplines of administra-tion, finance, human resources, communication, risk, procurement, etc. Manage-ment entails not only completing a project on time and per the established budget, but it also seeks to achieve results that meet the final objectives (expected socio-economic impact).
Management of development projects is defined as the use of a combination of tools and techniques arising from good practices and international standards to ensure the achievement of the project’s final specific objectives (outcome, product, or service) within the planned timeline (schedule), cost (budget), and scope.
Origin of international good practices and standards
In general terms, the need for project management procedures and methodologies was initially recognized by the construction and technology industries. This was based on the rationale that substantial savings in money and resources would be pro-duced by completing their projects in the shortest possible time and by implement-ing the most efficient processes, which would permit the creation of economies of scale and boost profit margins.
In the past 20 years, this concept has proliferated globally in the business world through the development of various organizations led by the Project Management Institute (PMI). Through its broad distribution and influence in the Americas, the PMI has been pivotal in the development and growth of the supply and demand of profes-sionals with project management expertise, endorsed by an international accredita-tion issued by said institution.
I . 2 . T H E C O N C E P T O F M A N A G E M E N T O F D E V E L O P M E N T P R O J E C T S
12T h i s d o c u m e n t i s i n t e l l e c t u a l p r o p e r t y o f t h e I n t e r - A m e r i c a n D e v e l o p m e n t B a n k ( I D B ) a n d t h e I n t e r - A m e r i c a n I n s t i t u t e f o r E c o n o m i c a n d S o c i a l D e v e l o p m e n t ( I N D E S ) . A n y p a r t i a l o r f u l l r e p r o d u c t i o n o f t h i s d o c u m e n t m u s t b e r e p o r t e d t o : B I D - I N D E S @ i a d b . o r g
L E A R N I N G G U I D E - 2 0 1 8

The need to rely upon management methodologies or project management in the development sector haslargely emerged in the past decade in response to the search for results both from the international development community and from countries receiving development assistance. There are currently various international organi-zations dedicated to establishing project management standards. In order of rele-vance to the Americas, the following are worthy of mention:
• Project Management Institute (PMI).Founded in 1969, it initially focused on the field of engineering and has continued to change and adapt to the needs of the business world. To date, through its standards committee and collaborators (including companies, universities, professional associ-ations, specialists, and project consultants), the Project Management Institute has created generally accepted international standards, most notably the Project Man-agement Institute, A Guide to the Project Management Body of Knowledge, (PM-BOK® Guide)- Fifth Edition, Project Management Institute, Inc., 2013.
• Projects in Controlled Environments (PRINCE). The PRINCE (Projects in Controlled Environments)method was originally established in 1989 by the Office of Government Commerce in the United Kingdom and is cur-rently used as a standard, especially in that country.Its latest version, PRINCE2, is compatible with any project type.
• The International Project Management Association (IPMA).Based in the Netherlands, it was founded in 1965 and currently represents more than 50 project management associations in 50 countries.
• Association for Project Management (APM).Founded in 1972 as INTERNET UK (predecessor to IPMA), this organization grants cer-tifications and provides opportunities to create social networks among its members and partners.
13T h i s d o c u m e n t i s i n t e l l e c t u a l p r o p e r t y o f t h e I n t e r - A m e r i c a n D e v e l o p m e n t B a n k ( I D B ) a n d t h e I n t e r - A m e r i c a n I n s t i t u t e f o r E c o n o m i c a n d S o c i a l D e v e l o p m e n t ( I N D E S ) . A n y p a r t i a l o r f u l l r e p r o d u c t i o n o f t h i s d o c u m e n t m u s t b e r e p o r t e d t o : B I D - I N D E S @ i a d b . o r g
L E A R N I N G G U I D E - 2 0 1 8
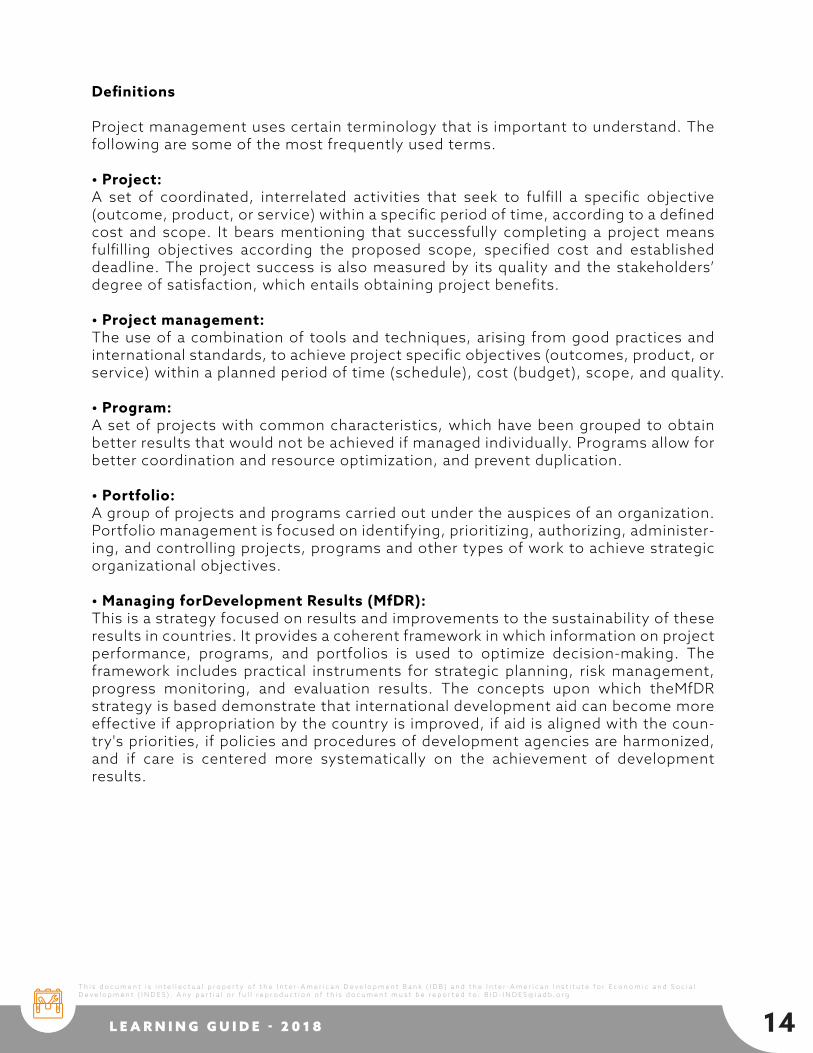
Definitions
Project management uses certain terminology that is important to understand. The following are some of the most frequently used terms.
• Project: A set of coordinated, interrelated activities that seek to fulfill a specific objective (outcome, product, or service) within a specific period of time, according to a defined cost and scope. It bears mentioning that successfully completing a project means fulfilling objectives according the proposed scope, specified cost and established deadline. The project success is also measured by its quality and the stakeholders’ degree of satisfaction, which entails obtaining project benefits.
• Project management:The use of a combination of tools and techniques, arising from good practices and international standards, to achieve project specific objectives (outcomes, product, or service) within a planned period of time (schedule), cost (budget), scope, and quality.
• Program:A set of projects with common characteristics, which have been grouped to obtain better results that would not be achieved if managed individually. Programs allow for better coordination and resource optimization, and prevent duplication. • Portfolio: A group of projects and programs carried out under the auspices of an organization. Portfolio management is focused on identifying, prioritizing, authorizing, administer-ing, and controlling projects, programs and other types of work to achieve strategic organizational objectives.
• Managing forDevelopment Results (MfDR): This is a strategy focused on results and improvements to the sustainability of these results in countries. It provides a coherent framework in which information on project performance, programs, and portfolios is used to optimize decision-making. The framework includes practical instruments for strategic planning, risk management, progress monitoring, and evaluation results. The concepts upon which theMfDR strategy is based demonstrate that international development aid can become more effective if appropriation by the country is improved, if aid is aligned with the coun-try's priorities, if policies and procedures of development agencies are harmonized, and if care is centered more systematically on the achievement of development results.
14T h i s d o c u m e n t i s i n t e l l e c t u a l p r o p e r t y o f t h e I n t e r - A m e r i c a n D e v e l o p m e n t B a n k ( I D B ) a n d t h e I n t e r - A m e r i c a n I n s t i t u t e f o r E c o n o m i c a n d S o c i a l D e v e l o p m e n t ( I N D E S ) . A n y p a r t i a l o r f u l l r e p r o d u c t i o n o f t h i s d o c u m e n t m u s t b e r e p o r t e d t o : B I D - I N D E S @ i a d b . o r g
L E A R N I N G G U I D E - 2 0 1 8

The IDB uses the Project Portfolio concept to refer to projects executed in the region or a country that support regional or national development strategies.
The project rationale
Within the context of managing for development results, whose objective is to pro-vide financial resources, technical instruments, and knowledge to implement initia-tives conducive to achieving a chain of successful results, project management is one of the key forms of knowledge. On one hand, because it ensures that selected projects contribute to strategic objectives of the countries and the project funding bodies; on the other hand, because it makes it possible to evaluate whether expected results have been defined based upon adequate prioritization: first the results are determined, and then the combination of resources to achieve them. 2
The IDB has migrated toward a new way of managing the project cycle under a results-based rationale.
It is a logical framework that includes all cycles and parties of public management, which provides the ordering of cause effect relationships between a strategic objec-tive and the program that will be carried out to achieve it, the inputs that entities exe-cuting the project must create or produce to achieve it, and how to do all this; namely, the rationale for the entire IDB project aims to adopt a focus on results rather than on activities and the budgetary cycle in order that the priority may cease to control such activities (IDB, 2010).
Based on the above, it is clear that in project management it is necessary to define the results upon which the entire development operation should focus. "Results" are based on performance indicators and evaluations. A successful result is one that has been well-planned and has occurred as scheduled in strategic planning, participatory planning, and operational planning (Figure I.2).
2 For further information, see IDB. 2010. Managing for Development Results. Progress and Challenges in Latin Ameri-ca and the Caribbean. Washington, DC: IDB.
15T h i s d o c u m e n t i s i n t e l l e c t u a l p r o p e r t y o f t h e I n t e r - A m e r i c a n D e v e l o p m e n t B a n k ( I D B ) a n d t h e I n t e r - A m e r i c a n I n s t i t u t e f o r E c o n o m i c a n d S o c i a l D e v e l o p m e n t ( I N D E S ) . A n y p a r t i a l o r f u l l r e p r o d u c t i o n o f t h i s d o c u m e n t m u s t b e r e p o r t e d t o : B I D - I N D E S @ i a d b . o r g
L E A R N I N G G U I D E - 2 0 1 8

Considering the elements above, especially planning as a participatory process, it is clear that all of the project stakeholders, and particularly the final beneficiaries, must agree upon its results. If the expected results do not meet the expectations and needs of final beneficiaries, such results will not be successful even if fulfilled as planned.Another element to take into account when defining results in this context is the generation of a sustainable impact, which results in the formation of a results chain. In this way, a process is causally linked to its predecessors and dependents, as defined by the IDB (Figure I.3).
Figure I.2. Elements of results-based planning
Figure I.3. Concept of causality. Results chain
Washington, DC: IDB, p. 23.
Source: Various authors (2009) Presentation Integrated Project Management Program (PGIP),7-Step Methodology. Washington, DC: IDB
Where are we?Where do we want to go?
How can we get there?
StrategicPlanning
ParticipatoryPlanning
OperationalPlanning
Inputs /Activities
Inputs /Activities
Inputs /Activities
Inputs /Activities
Inputs /Activities
Products
Products
Products
FinalResults
IntermediateResults
IntermediateResults
I M P A C T
16T h i s d o c u m e n t i s i n t e l l e c t u a l p r o p e r t y o f t h e I n t e r - A m e r i c a n D e v e l o p m e n t B a n k ( I D B ) a n d t h e I n t e r - A m e r i c a n I n s t i t u t e f o r E c o n o m i c a n d S o c i a l D e v e l o p m e n t ( I N D E S ) . A n y p a r t i a l o r f u l l r e p r o d u c t i o n o f t h i s d o c u m e n t m u s t b e r e p o r t e d t o : B I D - I N D E S @ i a d b . o r g
L E A R N I N G G U I D E - 2 0 1 8

Given that development projects operate in complex environments surrounded by various stakeholders, difficult operating environments and constraints upon access to resources and technologies, it is necessary to seriously consider such aspects when designing the project.
To effectively manage these complex situations, those responsible for the different project phases must have a holistic vision of the project that involves understanding the form in which itwill develop during its life cycle. By relying upon this assessment, those responsible for projects are better equipped to understand the factors that will impact the project at any given moment.
Projects never exist in isolation and are always influenced by two factors:
• Internal environment: These are the circumstances that are relatively controllable by the entities or organizations responsible for project formulation and execution, such as the organizational culture, technical and managerial skills, financial solvency, staff competence, and portfolio analysis.
• External environment: These are the conditions that are not controllable by those responsible for the projects, such as natural events, political uncertainty and instability, or perceptions and expectations not expressed by the project stakeholders.
Project restrictions
According to the most well-known conceptualization in the realm of project manage-ment, every project is subject to three constraints: scope (products), time (sched-ule), and cost (budget). The project success depends on managers’ skills and knowl-edge to consider these restrictions and develop plans and processes to keep them in balance. It is not sufficient for a project to achieve objectives according to budget or to report that all activities and products have been executed on time. Apart from balancing the three constraints at all times, the expected objectives (impact) must be fulfilled (Figure I.4).
17T h i s d o c u m e n t i s i n t e l l e c t u a l p r o p e r t y o f t h e I n t e r - A m e r i c a n D e v e l o p m e n t B a n k ( I D B ) a n d t h e I n t e r - A m e r i c a n I n s t i t u t e f o r E c o n o m i c a n d S o c i a l D e v e l o p m e n t ( I N D E S ) . A n y p a r t i a l o r f u l l r e p r o d u c t i o n o f t h i s d o c u m e n t m u s t b e r e p o r t e d t o : B I D - I N D E S @ i a d b . o r g
L E A R N I N G G U I D E - 2 0 1 8

Figure I.4. Project restrictions
Lewis, James P. (2005). Project Planning, Scheduling & Control. 4th ed. McGraw Hill.
S C O P EC
OS
TTIM
E
P R O J E C T
This figure represents the relationships of dependency between the project restric-tions, given that if one changes, at least one other restriction will be affected as well. For example, a change to the project plan, which shortens the timeline, can result in higher costs or a reduced scope.
• Scope: This refers to work (products) required to deliver project results as well as the processes used to produce them; it is the project raisond'être. One of the main reasons for a project failure is mismanagement of its scope, either because the time necessary to define the work was not expended, because there was no agreement between the stakeholders concerning the project scope or because there was a lack of management regarding the scope. These deficiencies lead to unauthorized or unbudgeted work known as “scope creep.” Scope creep or uncontrolled changes to scope result in a project incorporating more work than originally authorized, which typically results in higher-than-anticipated costs and postponement of the initial completion date.
• Time: This pertains to the duration required for all activities needed to complete the project, and is usually represented by a Gantt chart, a milestone chart, or a network chart. Despite its importance, this is often the most frequent omission in develop-ment projects. The absence of control over a project time is reflected in unmet dead-lines, incomplete activities, and general delays. Adequate control over the timeline requires a careful identification of the tasks to be executed, a precise estimate of theirduration, the sequence under which such tasks will be applied, and the way the project team and resources will be utilized. The timeline approximates the duration of all the project activities. It is not difficult to discern that initial forecasts do not apply once the project advances and more knowledge is obtained concerning its environment; thus, control of time expended as well as the timeline are iterative pro-cesses. At any time, the project team must verify the specific time restrictions or requirements for the project stakeholders.
18T h i s d o c u m e n t i s i n t e l l e c t u a l p r o p e r t y o f t h e I n t e r - A m e r i c a n D e v e l o p m e n t B a n k ( I D B ) a n d t h e I n t e r - A m e r i c a n I n s t i t u t e f o r E c o n o m i c a n d S o c i a l D e v e l o p m e n t ( I N D E S ) . A n y p a r t i a l o r f u l l r e p r o d u c t i o n o f t h i s d o c u m e n t m u s t b e r e p o r t e d t o : B I D - I N D E S @ i a d b . o r g
L E A R N I N G G U I D E - 2 0 1 8

19T h i s d o c u m e n t i s i n t e l l e c t u a l p r o p e r t y o f t h e I n t e r - A m e r i c a n D e v e l o p m e n t B a n k ( I D B ) a n d t h e I n t e r - A m e r i c a n I n s t i t u t e f o r E c o n o m i c a n d S o c i a l D e v e l o p m e n t ( I N D E S ) . A n y p a r t i a l o r f u l l r e p r o d u c t i o n o f t h i s d o c u m e n t m u s t b e r e p o r t e d t o : B I D - I N D E S @ i a d b . o r g
• Cost: These are the financial resources approved for the execution of project activi-ties and include all expenses required to achieve the results according to the planned timeline. In development projects, inadequate costs management may result in com-plex situations involving the return of resources and budget allocated to the fiscal year and, therefore, can result in difficulty appropriating resources in subsequent fiscal years. There are important factors to consider in development projects: budg-etary restrictions, budgetary allocation policies, procurement standards and proce-dures, etc. These standards affect the acquisition of personnel, equipment, services, and materials that must be acquired for the project. Those responsible for executing and supervising the project must be informed of all the existing policies, guidelines, and procedures applicable to the acquisition of these resources. Information on pre-vious similar projects may be useful for improving budget management strategies.
• Quality: In development projects, this normally refers to the achievement of the expected impact through involvement in terms of fulfillment of socio-economic development targets. It is, therefore, a key factor to consider in evaluating the pro-ject success.
Delivery of development projects according to scope, time, and budget is insufficient if the needs and expectations of stakeholders, who are the final judges of their quali-ty, are not satisfied. Managing these restrictions requires a careful analysis and agreement on the priorities for the organization, funding body, and final beneficiar-ies. Depending on these factors, a project may place more emphasis on cost and quality than on time and scope. This type of decision and the establishment of priori-ties at the start of the project have a fundamental impact on all subsequent findings and plans.
An understanding of the relationship between these three restrictions allows for better decision-making if changes need to be made within the project.
L E A R N I N G G U I D E - 2 0 1 8

The project life and management cycles Considering a project as a series of interrelated phases ensures a greater likelihood of its success. In fact, the sum of the project phases is its life cycle. For this reason, the best practice of dividing the project into several phases renders each of them more manageable. As the life cycle structure varies depending on the industry and project nature, there is no ideal way of organizing a project.However, a development project usually has the following life cycle:
A project must successfully complete one phase before proceeding to the next, allowing the project cycle better control and creating the construction of appropriate links with the internal and external environment. Each phase should not be viewed independently but rather as a continuous, interdependent effort, since results from one phase are used as inputs for the following.
P R O G R A M M I N G I N D E N T I F I C AT I O N D E S I G N E VA L U AT I O N C L O S EI M P L E M E N TAT I O NM O N I T O R I N G A N D C O N T R O L
M O N I T O R I N G A N D C O N T R O L
ST
AR
T
PL
AN
NIN
G
IMP
LE
ME
NT
AT
ION
CL
OS
E
T I M E
Figure I.5. Development project life cycle
Source: Project Management Institute, A Guide to the Project Management Body of Knowledge,(PMBOK® Guide)- Fifth Edition, Project Management Institute, Inc., 2013, Figure 2-8, page 39.
20T h i s d o c u m e n t i s i n t e l l e c t u a l p r o p e r t y o f t h e I n t e r - A m e r i c a n D e v e l o p m e n t B a n k ( I D B ) a n d t h e I n t e r - A m e r i c a n I n s t i t u t e f o r E c o n o m i c a n d S o c i a l D e v e l o p m e n t ( I N D E S ) . A n y p a r t i a l o r f u l l r e p r o d u c t i o n o f t h i s d o c u m e n t m u s t b e r e p o r t e d t o : B I D - I N D E S @ i a d b . o r g
L E A R N I N G G U I D E - 2 0 1 8

The project management cycle is in the implementation, and monitoring and control phases, and it consists of five stages necessary to complete the project successfully: i) start, ii) planning, iii) implementation, iv) monitoring and v) close (Figure I.5).
The start-up stage leads to planning; once plans are developed and approved, the project execution or implementation stage begins. As the project progresses, the control or monitoring process reviews whether the project is fulfilling its goals and objectives; thus, if changes are needed, the original plans are adapted and the imple-mentation process is restarted. Once the project has met all of its objectives, and deliverables have been accepted, the closing stage begins.
Each management stage entails a different level of effort. Figure I.7 shows the stages of project execution during the implementation and monitoring and control phases from the beginning. The level of effort gradually increases from start-up until reach-ing its inflection point during implementation. This figure is particularly useful to see the level of financial impact if the project is exposed to risks or changes. Since the greatest level of effort, including cost, within the project life occurs during imple-mentation, any change or risk during this stage can have a greater impact on the pro-ject and demand greater resources and efforts. The figure also helps to illustrate the level of effort required in the planning phase. Many projects invest very little time and effort in this stage and, therefore, face various problems during implementation.
P L A N N I N GS TA R T
I M P L E M E N TAT I O N
M O N I T O R I N GA N D C O N T R O L C L O S EC Y C L E
Figure I.6.Project management stages
Source: Project Management Institute, A Guide to the Project Management Body of Knowledge,(PMBOK® Guide)- Fifth Edition, Project Management Institute, Inc., 2013, Figure 2-10, page 42.
21T h i s d o c u m e n t i s i n t e l l e c t u a l p r o p e r t y o f t h e I n t e r - A m e r i c a n D e v e l o p m e n t B a n k ( I D B ) a n d t h e I n t e r - A m e r i c a n I n s t i t u t e f o r E c o n o m i c a n d S o c i a l D e v e l o p m e n t ( I N D E S ) . A n y p a r t i a l o r f u l l r e p r o d u c t i o n o f t h i s d o c u m e n t m u s t b e r e p o r t e d t o : B I D - I N D E S @ i a d b . o r g
L E A R N I N G G U I D E - 2 0 1 8

S TA R T P L A N N I N G C L O S EI M P L E M E N TAT I O N
M O N I T O R I N G A N D C O N T R O L
T I M E
EF
FO
RT
Figure I.7.Effort and time levels during the implementation, and monitoring and control phases
Source: Compiled by author
C U M M U L AT I V E E F F O R TE F F O R T B Y P H A S E
Some organizations standardize the way in which they execute projects, whereas others allow project teams to determine whether the tasks to be performed are treat-ed as a separate project or as a single phase in the project life cycle. For example, while a feasibility study could be treated as a separate project, it could also be con-sidered the first phase of a project.
When dealing with very complex projects that include multiple components, there may be various cycles which are dependent upon one another, conditional upon one another, or which occur in parallel.
Below is an example of a project with two cycles. Figure I.8 shows the beginning and end of the project albeit with two planning, implementation,and monitoring cycles.
22T h i s d o c u m e n t i s i n t e l l e c t u a l p r o p e r t y o f t h e I n t e r - A m e r i c a n D e v e l o p m e n t B a n k ( I D B ) a n d t h e I n t e r - A m e r i c a n I n s t i t u t e f o r E c o n o m i c a n d S o c i a l D e v e l o p m e n t ( I N D E S ) . A n y p a r t i a l o r f u l l r e p r o d u c t i o n o f t h i s d o c u m e n t m u s t b e r e p o r t e d t o : B I D - I N D E S @ i a d b . o r g
L E A R N I N G G U I D E - 2 0 1 8

P L A N N I N GS TA R T
I M P L E M E N TAT I O N
M O N I T O R I N GA N D C O N T R O L C L O S EC Y C L EP L A N N I N GS TA R T
I M P L E M E N TAT I O N
M O N I T O R I N GA N D C O N T R O L C L O S EC Y C L E
Figure I.8.Example of a two-cycle project
Source: Compiled by author
Large or complex projects may require various cycles, which we will call “phases.” In some cases, the completion of a phase may lead to the start of the next one. This allows for review of the original premises and assumptions that emerged during pro-ject design, as a precursor for starting the next implementation phase and to include improvements inproject managementprocesses without needing to wait until the end of the project. There is an opportunity to learn, adjust and improve the project team's practices, skills and dynamics at the end of each implementation phase.
23T h i s d o c u m e n t i s i n t e l l e c t u a l p r o p e r t y o f t h e I n t e r - A m e r i c a n D e v e l o p m e n t B a n k ( I D B ) a n d t h e I n t e r - A m e r i c a n I n s t i t u t e f o r E c o n o m i c a n d S o c i a l D e v e l o p m e n t ( I N D E S ) . A n y p a r t i a l o r f u l l r e p r o d u c t i o n o f t h i s d o c u m e n t m u s t b e r e p o r t e d t o : B I D - I N D E S @ i a d b . o r g
L E A R N I N G G U I D E - 2 0 1 8

One of the objectives of development projects is to benefit the greatest number of parties in society; specifically, apart from generating an economic benefit, every development project normally seeks to produce the greatest impact or social return. Accordingly, development projects must be related to each country's development strategies to ensure a greater impact. Funding organizations contribute to the financing of those projects that correspond to the country's development strategies and the sectoral program priorities. Project management allows for expectations and results to be communicated clearly and concisely, fosters a teamwork spirit, since it facilitates communication with a common language, and provides the necessary tools to use project resources as efficiently as possible. In particular, project manage-ment provides a roadmap for the project, including all of its alternatives, describing how to navigate from beginning to end.
The most important concept related to project management is the assimilation of the intimate relationship between the three constraints of the project: cost, time, and scope. These constraints occur in a complex environment of internal and exter-nal factors that can have an impact requiring constant change; consequently, every development project must be characterized by its flexibility to adjust to these condi-tions without affecting the achievement of expected results.
U N I T S U M M A R Y
24T h i s d o c u m e n t i s i n t e l l e c t u a l p r o p e r t y o f t h e I n t e r - A m e r i c a n D e v e l o p m e n t B a n k ( I D B ) a n d t h e I n t e r - A m e r i c a n I n s t i t u t e f o r E c o n o m i c a n d S o c i a l D e v e l o p m e n t ( I N D E S ) . A n y p a r t i a l o r f u l l r e p r o d u c t i o n o f t h i s d o c u m e n t m u s t b e r e p o r t e d t o : B I D - I N D E S @ i a d b . o r g
L E A R N I N G G U I D E - 2 0 1 8
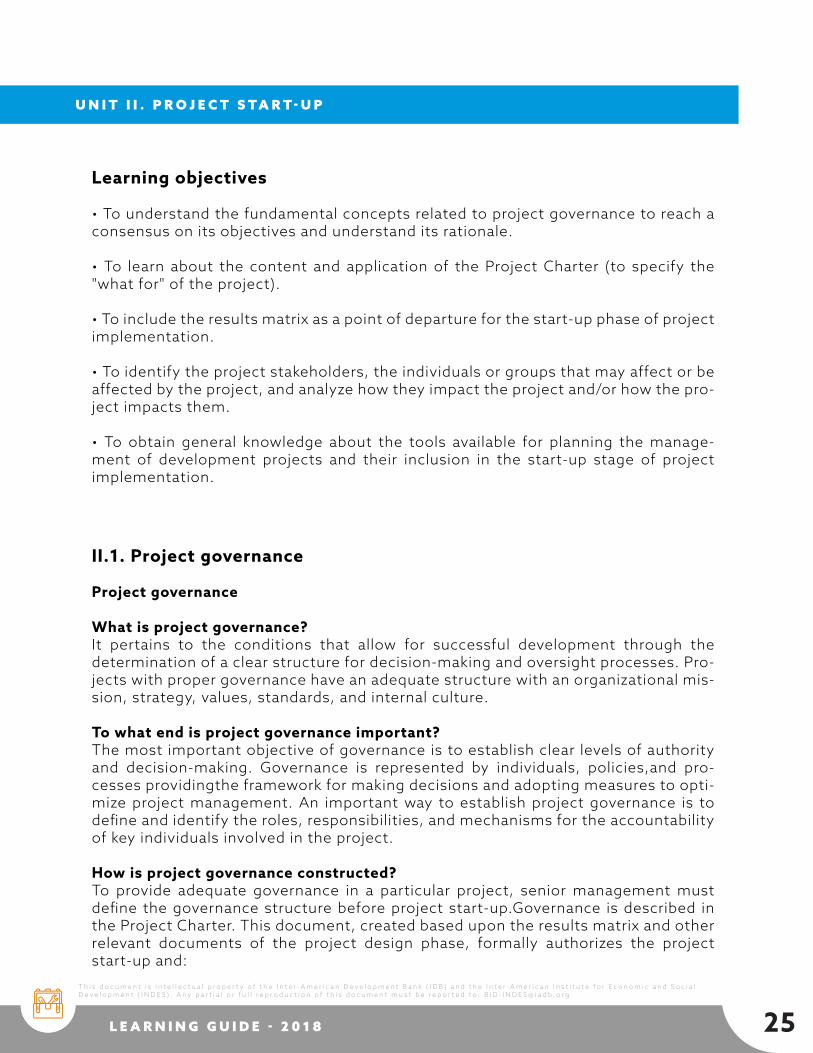
Learning objectives
• To understand the fundamental concepts related to project governance to reach a consensus on its objectives and understand its rationale.
• To learn about the content and application of the Project Charter (to specify the "what for" of the project).
• To include the results matrix as a point of departure for the start-up phase of project implementation.
• To identify the project stakeholders, the individuals or groups that may affect or be affected by the project, and analyze how they impact the project and/or how the pro-ject impacts them.
• To obtain general knowledge about the tools available for planning the manage-ment of development projects and their inclusion in the start-up stage of project implementation.
II.1. Project governance
Project governance
What is project governance?It pertains to the conditions that allow for successful development through the determination of a clear structure for decision-making and oversight processes. Pro-jects with proper governance have an adequate structure with an organizational mis-sion, strategy, values, standards, and internal culture.
To what end is project governance important?The most important objective of governance is to establish clear levels of authority and decision-making. Governance is represented by individuals, policies,and pro-cesses providingthe framework for making decisions and adopting measures to opti-mize project management. An important way to establish project governance is to define and identify the roles, responsibilities, and mechanisms for the accountability of key individuals involved in the project.
How is project governance constructed?To provide adequate governance in a particular project, senior management must define the governance structure before project start-up.Governance is described in the Project Charter. This document, created based upon the results matrix and other relevant documents of the project design phase, formally authorizes the project start-up and:
U N I T I I . P R O J E C T S TA R T- U P
25T h i s d o c u m e n t i s i n t e l l e c t u a l p r o p e r t y o f t h e I n t e r - A m e r i c a n D e v e l o p m e n t B a n k ( I D B ) a n d t h e I n t e r - A m e r i c a n I n s t i t u t e f o r E c o n o m i c a n d S o c i a l D e v e l o p m e n t ( I N D E S ) . A n y p a r t i a l o r f u l l r e p r o d u c t i o n o f t h i s d o c u m e n t m u s t b e r e p o r t e d t o : B I D - I N D E S @ i a d b . o r g
L E A R N I N G G U I D E - 2 0 1 8

• presents the project scope, time, and cost at the aggregate level;
• analyzes the relationships between the project and various stakeholders;
• describes the project governance structure, particularly, mechanisms for monitoring and control of significant changes; and
• assigns the team responsible for project management.
Project Steering Committee
This is the highest level of the project governance structure and is comprised of indi-viduals with the authority to make high-level decisions. Normally, this group is made up of an organization's executive management and may include representatives from project funding organizations and key stakeholders. The Committee's decisions are typically strategic and non-operational, since they focus on providing support and facilitation so that the team responsible for project management has the interdepart-mental resources and collaboration necessary for proper implementation.One of the Committee's primary responsibilities is to ensure that the project objectives are con-sistent with the strategies and priorities defined during its design and approval pro-cess. Other responsibilities include:
• Appointment of the project manager • Approval of the Project Charter
• Authorization to use the resources necessary for project execution
• Authorization of changes to the original scope of the project.
• Resolution of conflicts and issues or incidents beyond the project manager's authority.
Selection and appointment of the project manager
If the project manager does not participate in the project design, as occurs in the majority of cases, one of the Steering Committee's first decisions is to appoint the manager, that is, the individual appointed to administer the project resources and achieve its objectives.
Project manager’s skills
It is not only necessary for the individual responsible for project management to have a good understanding of its technical aspects, but they must also possess sound management skills, such as communication, planning, negotiation, group manage-ment, decision-making, and leadership (Table I.1).
26T h i s d o c u m e n t i s i n t e l l e c t u a l p r o p e r t y o f t h e I n t e r - A m e r i c a n D e v e l o p m e n t B a n k ( I D B ) a n d t h e I n t e r - A m e r i c a n I n s t i t u t e f o r E c o n o m i c a n d S o c i a l D e v e l o p m e n t ( I N D E S ) . A n y p a r t i a l o r f u l l r e p r o d u c t i o n o f t h i s d o c u m e n t m u s t b e r e p o r t e d t o : B I D - I N D E S @ i a d b . o r g
L E A R N I N G G U I D E - 2 0 1 8

SKILLS DESCRIPTION
LeadershipEncourage individuals assigned to the project to work as ateam with the aim of implementing the plan and achievingthe objective in the most satisfactory manner.
CommunicationConstant communication with the team, as well as thebeneficiaries, funding bodies, and the organization's seniormanagement.
Problem solvingRapidly identify problems and develop a well-plannedsolution, make decisions with sound judgment, settingaside emotions.
Focused on results
Develop a results-based focus, without wasting resourcesor efforts on the administration of details correspondingto activities and project tasks, concentrating efforts onensuring that results are always aligned with the projectobjectives.
Project manager's authority
Since they are responsible for the project, project managers must make decisions related to the management and handling of resources available for the project; con-sequently, when project managersare appointed, their responsibilities, authority, and specific levels of decision-making for project administration and control must be defined. These levels of responsibility and power may vary from one project to anoth-er. Authority is based upon an organization's standards and policies, which determine personnel's roles and responsibilities. The organization's culture, style, type and structure affect the level of authority in project management, especially concerning the influence of functional management (performed in functional organizations).
TableI.1. Description of the project manager's skills
27T h i s d o c u m e n t i s i n t e l l e c t u a l p r o p e r t y o f t h e I n t e r - A m e r i c a n D e v e l o p m e n t B a n k ( I D B ) a n d t h e I n t e r - A m e r i c a n I n s t i t u t e f o r E c o n o m i c a n d S o c i a l D e v e l o p m e n t ( I N D E S ) . A n y p a r t i a l o r f u l l r e p r o d u c t i o n o f t h i s d o c u m e n t m u s t b e r e p o r t e d t o : B I D - I N D E S @ i a d b . o r g
L E A R N I N G G U I D E - 2 0 1 8

First actions of project managers
Once new managers receive confirmation of their responsibilities, they must take the first steps to begin the project. These steps are not related to implementation but rather to project planning, i.e., the detailed development ofproject management plans, for whichreason managers must know and understand all project dimensions. In other words, they must review the design documents (the profile, purpose, results matrix, original contract, etc.), preliminary estimates of execution times, etc.
The manager must initiate the review of these documents with the team selected to take part in the project. In some cases, the team may be incomplete, in which case the manager must temporary include individuals within the organization who can assist in the review and development of project plans.
II.2. Results matrix (RM)
Definition
The RM is a tool prepared during the project design that enables the development and presentation of the correlation between the project objectives and sectoral results indicators aligned with the country's development targets. The RM provides a logical model (the logical framework is used in some cases) to achieve project results. It is a widely used tool among development funding organizations (particu-larly at the IDB) and is an essential input for the Project Charter, which, as mentioned above, is the most commonly used project management document. The RM plays a key role in the start-up stage of project implementation, since it provides inputs into the planning process while serving as a monitoring tool during project implementa-tion.
One of the project manager's responsibilities is to verify the results matrix validity and timeliness. Any discrepancies, questions, or proposed changes must be submit-ted to the project Steering Committee for approval.
The RM offers relevant information for the project team to familiarize itself very quickly with the project objectives and contribute more strategically during the exe-cution of activities and in obtaining results.The results matrix is composed of the following elements:
1. Project objective: This is the expected outcome(final target), expressed as a physical, financial, institutional, social or environmental development, or other type of development relative to the project’s or program's expected contributions. The objective must correspond to the “what” and the “what for” of the project.
2. Result indicators: These indicators measure progress of expected outcome(). Indicators must be specific, measurable, achievable, relevant, and time-specific.
28T h i s d o c u m e n t i s i n t e l l e c t u a l p r o p e r t y o f t h e I n t e r - A m e r i c a n D e v e l o p m e n t B a n k ( I D B ) a n d t h e I n t e r - A m e r i c a n I n s t i t u t e f o r E c o n o m i c a n d S o c i a l D e v e l o p m e n t ( I N D E S ) . A n y p a r t i a l o r f u l l r e p r o d u c t i o n o f t h i s d o c u m e n t m u s t b e r e p o r t e d t o : B I D - I N D E S @ i a d b . o r g
L E A R N I N G G U I D E - 2 0 1 8

29T h i s d o c u m e n t i s i n t e l l e c t u a l p r o p e r t y o f t h e I n t e r - A m e r i c a n D e v e l o p m e n t B a n k ( I D B ) a n d t h e I n t e r - A m e r i c a n I n s t i t u t e f o r E c o n o m i c a n d S o c i a l D e v e l o p m e n t ( I N D E S ) . A n y p a r t i a l o r f u l l r e p r o d u c t i o n o f t h i s d o c u m e n t m u s t b e r e p o r t e d t o : B I D - I N D E S @ i a d b . o r g
3. Baseline: This represents the values or status of the result indicators at the start of the project. They serve to measure the changes the project has achieved.
4. Target: The values or status of indicators upon project conclusion; what the project is expected to achieve.
5. Components:
o Products: Capital goods or services that are produced with the intervention.
o Intermediate results: The effects from an intervention that leads to the desired result.
o Result: The events, conditions, or occurrences that indicate the achievement of the project objective.
6. Year: Degree of progress in the delivery or execution of product(s) in the year during which progress is recorded.
7. Comments: Explanations about the indicators used, the degree of progress, or any type of explanatory note (project assumptions to achieve the objective are also included).
The RM presents and explains the manner in which the development objective must be achieved; it also includes causal relations between the execution of activities, the delivery of products, and the achievement of results. The RM also sets forth indica-tors, baselines, and targets to document achievements. The matrix is one of the inputs/requirements to prepare the risk plan. Table I.2 shows how the different RM components are related to each other.
L E A R N I N G G U I D E - 2 0 1 8

R E S U LT I N D I C AT O R S
C O M P O N E N T 1 B A S E L I N E Y E A R 1 Y E A R 2 Y E A R 3 TA R G E T C O M M E N T S
Products,capital goodsor servicesthat areproducedwith theintervention
Currentvalue/statusof productsat the startof the project
Degree of progress indelivery/execution of product(s)
Expectedvalue/status
of products atthe end of the
project
Explanationsabout the
indicators used,the degree ofprogress, orany type ofexplanatory
note
B A S E L I N E TA R G E T
Measure the achievementof expected result(s)
Values/status of result indicatorsat the start of the project
Values/status of result indicatorsat the end of the project
Table I.2. Results matrix
Source: Various authors (2009). Presentation entitled Integrated Project Management Program (PGIP), 7 Step Methodology. Washington, DC: IDB
SMART indicators
There are various factors that enable projects to achieve results. They are: i) specifi-cally defining objectives, ii) determining the specific scope of project involvement, and iii) identifying beneficiaries. These factors must facilitate the measurement and designation of specific results derived from the project activities. Poorly defined objectives represent an obstacle to achieving the management of results-oriented projects and evaluating whether such results have been reached. Vague objectives and dubious interpretations should be avoided when defining the project objectives. A more detailed objective leads to greater comprehension and improves the likeli-hood that it will be achieved.
Objectives are measured through indicators, including SMART, which use the follow-ing basic principles:
• S: Specific. The objective to be defined must be absolutely clear and precise through the indicator, with no potential ambiguity or interpretation. As a result, it is understood and has greater chances of beingachieved.
Project objective: This is the expected impact in terms of physical, financial, institutional, social, environmen-tal, or other type of development relative to the project’s or program's expected contributions. It must correspond to the “what” and the “what for” of the program/project.
30T h i s d o c u m e n t i s i n t e l l e c t u a l p r o p e r t y o f t h e I n t e r - A m e r i c a n D e v e l o p m e n t B a n k ( I D B ) a n d t h e I n t e r - A m e r i c a n I n s t i t u t e f o r E c o n o m i c a n d S o c i a l D e v e l o p m e n t ( I N D E S ) . A n y p a r t i a l o r f u l l r e p r o d u c t i o n o f t h i s d o c u m e n t m u s t b e r e p o r t e d t o : B I D - I N D E S @ i a d b . o r g
L E A R N I N G G U I D E - 2 0 1 8
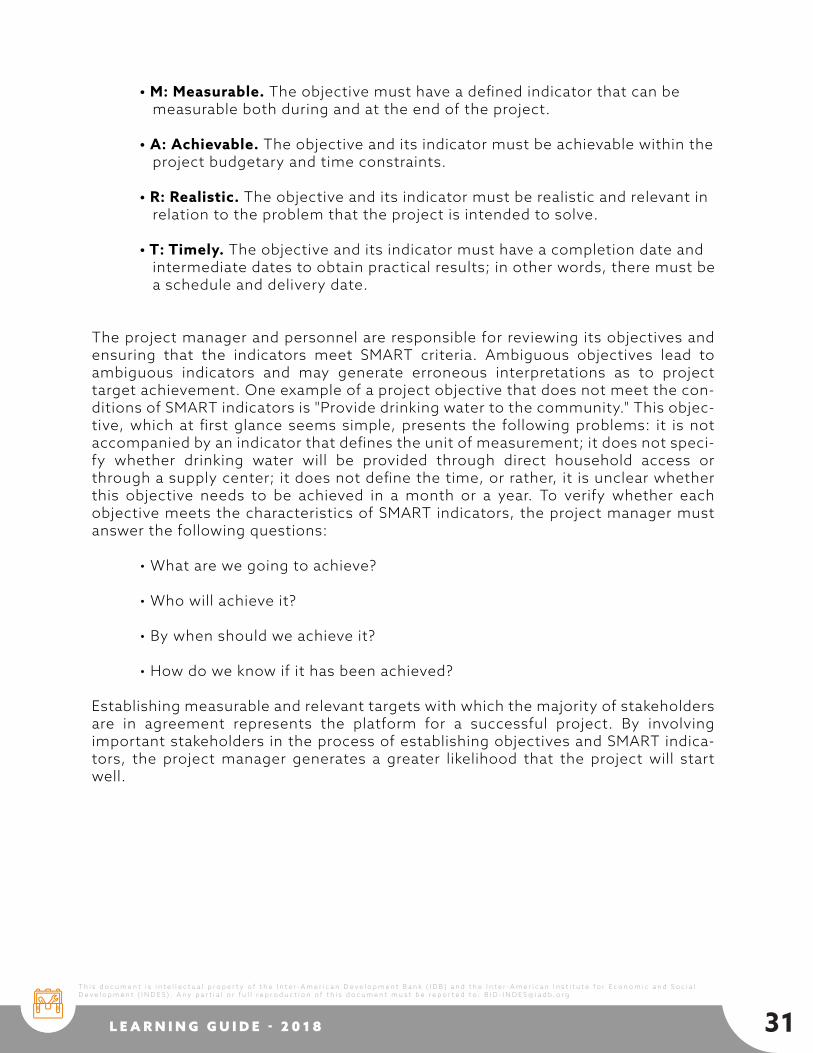
• M: Measurable. The objective must have a defined indicator that can be measurable both during and at the end of the project.
• A: Achievable. The objective and its indicator must be achievable within the project budgetary and time constraints.
• R: Realistic. The objective and its indicator must be realistic and relevant in relation to the problem that the project is intended to solve.
• T: Timely. The objective and its indicator must have a completion date and intermediate dates to obtain practical results; in other words, there must be a schedule and delivery date.
The project manager and personnel are responsible for reviewing its objectives and ensuring that the indicators meet SMART criteria. Ambiguous objectives lead to ambiguous indicators and may generate erroneous interpretations as to project target achievement. One example of a project objective that does not meet the con-ditions of SMART indicators is "Provide drinking water to the community." This objec-tive, which at first glance seems simple, presents the following problems: it is not accompanied by an indicator that defines the unit of measurement; it does not speci-fy whether drinking water will be provided through direct household access or through a supply center; it does not define the time, or rather, it is unclear whether this objective needs to be achieved in a month or a year. To verify whether each objective meets the characteristics of SMART indicators, the project manager must answer the following questions:
• What are we going to achieve?
• Who will achieve it?
• By when should we achieve it?
• How do we know if it has been achieved?
Establishing measurable and relevant targets with which the majority of stakeholders are in agreement represents the platform for a successful project. By involving important stakeholders in the process of establishing objectives and SMART indica-tors, the project manager generates a greater likelihood that the project will start well.
31T h i s d o c u m e n t i s i n t e l l e c t u a l p r o p e r t y o f t h e I n t e r - A m e r i c a n D e v e l o p m e n t B a n k ( I D B ) a n d t h e I n t e r - A m e r i c a n I n s t i t u t e f o r E c o n o m i c a n d S o c i a l D e v e l o p m e n t ( I N D E S ) . A n y p a r t i a l o r f u l l r e p r o d u c t i o n o f t h i s d o c u m e n t m u s t b e r e p o r t e d t o : B I D - I N D E S @ i a d b . o r g
L E A R N I N G G U I D E - 2 0 1 8

II.3. Stakeholders matrix
Stakeholders
Stakeholdersare groups or individuals that may be impacted positively or negatively by the project or project results. The management of stakeholders is crucial to the success of development projects. The process of identifying stakeholders and defin-ing their levels of interest and influence in the project is the point of departure for developing strategies intended to achieve the necessary support from key stakehold-ers, thus enabling project success. Depending on project type, stakeholders may vary both in number and level of influence and interest. By classifying stakeholders, the project manager will be in a better position to use time more efficiently in the development of relationships and project communications with the most important stakeholders.
Given that stakeholders are individuals or organizations whose interests (for or against the project) may affect the project successful completion, a stakeholder management plan that generates a project communications plan is strongly advised.
As shown in Figure I.9, the process for developing the stakeholders matrix begins by identifying the agencies or individuals that will provide the information needed as process inputs, the techniques or tools and, finally, the process outputs for clients or users.
Figure I.9.Development of the stakeholders’ matrix
S O U R C E
- Financer- Organization
I N P U T S
- Project profile (PP)- Results matrix
- Project approvaldocuments
- Stakeholdersmatrix
T E C H N I Q U E S
- CharterDevelopment
- Expert opinion
O U T P U T S
- Project charter
U S E R
- Project team- Organization- Stakeholders
Source: Project Management Institute, A Guide to the Project Management Body of Knowledge,(PMBOK® Guide)- Fifth Edition, Project Management Institute, Inc., 2013, Figure 13-2, page 393.
32T h i s d o c u m e n t i s i n t e l l e c t u a l p r o p e r t y o f t h e I n t e r - A m e r i c a n D e v e l o p m e n t B a n k ( I D B ) a n d t h e I n t e r - A m e r i c a n I n s t i t u t e f o r E c o n o m i c a n d S o c i a l D e v e l o p m e n t ( I N D E S ) . A n y p a r t i a l o r f u l l r e p r o d u c t i o n o f t h i s d o c u m e n t m u s t b e r e p o r t e d t o : B I D - I N D E S @ i a d b . o r g
L E A R N I N G G U I D E - 2 0 1 8

Identification of stakeholders
The identification of stakeholders involves selecting all individuals, groups, or enti-ties that will be impacted by the project or its results. This involves not only identify-ing those who will benefit from the project, but also those who will be negatively impacted by it. As in any type of social intervention, not all development projects are viewed positively. Instead, there are always individuals, groups, or institutions opposingthem due to an array of political, economic, social, religious, and other mo-tives.
Each project has a group of key stakeholders whose level of impact may significantly impact the project success. For this reason, the project manager and team must identify the stakeholders at the start of the project and determine strategies to miti-gate any negative influence or maximize their collaboration and support.
The identification of stakeholders is a process in which the management team, along with other individuals with experience in similar projects and issues, participate in a brainstorming process and create a list of all potential stakeholders. Bear in mind that the list created will not be static, because, as the project progresses, new stakehold-ers may emerge while others who were initially identified will cease to be relevant.
Stakeholders may be internal, such as the personnel of executing entities, adminis-trative or executive personnel of the organization, or the personnel of funding bodies with a high level of power and influence on the project and its resources; or external, such as project beneficiaries, the sector's institutions, or civil society organizations that will be impacted by the project results in one way or another. Given the social nature of development projects, the involvement of civil society should not only be an exercise of unidirectional communications but also an opportunity to gather sup-port for the project.
During brainstorming, the project manager, the team, and any other individuals who may have relevant information use the information produced during the project approval process, such as the project profile, the financing proposal, contracts, etc. Besides identifying the individuals and organizations, it will be very important to obtain information from each stakeholder about its influence or power over the pro-ject. A stakeholder is any individual or group with some degree of interest in the pro-ject. To identify them, the following information is needed:
33T h i s d o c u m e n t i s i n t e l l e c t u a l p r o p e r t y o f t h e I n t e r - A m e r i c a n D e v e l o p m e n t B a n k ( I D B ) a n d t h e I n t e r - A m e r i c a n I n s t i t u t e f o r E c o n o m i c a n d S o c i a l D e v e l o p m e n t ( I N D E S ) . A n y p a r t i a l o r f u l l r e p r o d u c t i o n o f t h i s d o c u m e n t m u s t b e r e p o r t e d t o : B I D - I N D E S @ i a d b . o r g
L E A R N I N G G U I D E - 2 0 1 8

• Name or identification of the stakeholder.
• Project objectives or results that will impact the stakeholder.
• Level of stakeholder interest.
• Stakeholder influence or power.
• Positive impact: the result that benefits the stakeholder.
• Negative impact: result that negatively impacts the stakeholder.
• Project strategies: a list of actions that may be carried out to reduce the neg-ative impact on the project or bolster the stakeholders’ interest in the project.
Table I.3 shows the interrelation of the stakeholders’ matrix components.
Stakeholders classification matrix
The stakeholders’ classification matrix is an analysis tool that allows for the classifica-tion of the project stakeholders according to their levels of interest and influence on the project. This matrix facilitates the ranking of the most important stakeholders to develop the corresponding strategies.
Table I.3. Stakeholders identification matrix
O B J E C T I V E SO R TA R G E T S
Successfulproject
management
L E V E L O FI N T E R E S T
Low
Medium
High
L E V E L O FI N F L U E N C E
P R O J E C T S U P E R V I S O R
Low
Medium
High
P O S S I B L E S TA K E H O L D E RA C T I O N S
Positive:Meet project
objectives
Negative:Project delays
S T R AT E G I E S
Keep supervisorinformed of all
progress,changes,and risks
Source: Various authors (2009). Presentation entitled Integrated Project Management Program (PGIP), 7 Step Methodology. Washington, DC: IDB
34T h i s d o c u m e n t i s i n t e l l e c t u a l p r o p e r t y o f t h e I n t e r - A m e r i c a n D e v e l o p m e n t B a n k ( I D B ) a n d t h e I n t e r - A m e r i c a n I n s t i t u t e f o r E c o n o m i c a n d S o c i a l D e v e l o p m e n t ( I N D E S ) . A n y p a r t i a l o r f u l l r e p r o d u c t i o n o f t h i s d o c u m e n t m u s t b e r e p o r t e d t o : B I D - I N D E S @ i a d b . o r g
L E A R N I N G G U I D E - 2 0 1 8

The process for analyzing and building this matrix is somewhat subjective and greatly depends on the quality of information that the project has with respect to the stake-holders. Similar to our comments on the list of stakeholders, their classification can change during the project life. Thus, those that were initially identified as having a high level of influence on the project can be reclassified at a lower level at other points during the project life. The stakeholder analysis is an ongoing task during pro-ject implementation.
Once the stakeholder information is complete, the project manager must graph this information using a 2-x-2 matrix that enables each stakeholder to be classified within the group for which different strategies are defined (Figure I.10).
Each of the figure's quadrants contains a strategy that facilitates management of stakeholder relations.
• Low power/low interest = Monitor.
• High power/low interest = Keep satisfied.
• Low power/high interest = Keep informed.
• High power/high interest = Manage closely.
Figure I.10.Stakeholders classification matrix
Source: Project Management Institute, A Guide to the Project Management Body of Knowledge,(PMBOK® Guide)- Fifth Edition, Project Management Institute, Inc., 2013, Figure 13-4, page 397.
K E E PS AT I S F I E D
M O N I T O R K E E PI N F O R M E D
M A N A G EC L O S E L Y
H
IGH
PO
WE
RL
OW
PO
WE
R
A LT O I N T E R É SB A J O I N T E R É S
35T h i s d o c u m e n t i s i n t e l l e c t u a l p r o p e r t y o f t h e I n t e r - A m e r i c a n D e v e l o p m e n t B a n k ( I D B ) a n d t h e I n t e r - A m e r i c a n I n s t i t u t e f o r E c o n o m i c a n d S o c i a l D e v e l o p m e n t ( I N D E S ) . A n y p a r t i a l o r f u l l r e p r o d u c t i o n o f t h i s d o c u m e n t m u s t b e r e p o r t e d t o : B I D - I N D E S @ i a d b . o r g
L E A R N I N G G U I D E - 2 0 1 8

The strategies that the project team identifies will be directed toward increasing sup-port for the project and minimizing the negative impact upon stakeholders. These strategies may include:
• Participation in the project activities or events.
• Communications to improve information about the project.
• Third-party collaboration that can positively influence a stakeholder.
• Mitigation of a stakeholder's negative actions.
Given that the information presented in the stakeholders identification matrix may be sensitive or confidential, the project manager must apply good judgment to the type of information presented and the level of access to information.
Informational needs of stakeholders
Each stakeholder has different needs for project-related information. In some cases, a contractual requirement is in place, i.e., the stakeholder and the project have a formal agreement to deliver information that often includes a specific format and schedule. For example, the project funding body requires information from the pro-ject for use as a tool to analyze the progress and scheduling of the disbursement of required funds. In other cases, stakeholder needs are tied to the fulfillment of the country's standards or regulations, e.g., to use funds for the organization's financial scheduling or to comply with fiduciary or legal standards.
The project manager must identify and classify these needs to plan the time required to generate and distribute information. The list below serves not only for this pur-pose but also as an input for the creation of the project communications plan:
• Stakeholder name.
• Type of information required.
• Date or period in which the information is required.
• Information presentation format.
• Information approval.
Sending or presenting information
Stakeholders need information to form an opinion about the project to decide their support for the project, to coordinate activities with it, and, above all, to make deci-sions concerning the project. The project manager must plan informational activities based upon the stakeholders’ priorities and identify those individuals who will be responsible for developing
36T h i s d o c u m e n t i s i n t e l l e c t u a l p r o p e r t y o f t h e I n t e r - A m e r i c a n D e v e l o p m e n t B a n k ( I D B ) a n d t h e I n t e r - A m e r i c a n I n s t i t u t e f o r E c o n o m i c a n d S o c i a l D e v e l o p m e n t ( I N D E S ) . A n y p a r t i a l o r f u l l r e p r o d u c t i o n o f t h i s d o c u m e n t m u s t b e r e p o r t e d t o : B I D - I N D E S @ i a d b . o r g
L E A R N I N G G U I D E - 2 0 1 8

and delivering information. Among the most important concepts of information management are the use of right information, which must reach the right person at the right time.
In this instance, it should be noted that stakeholders at all levels should not only be kept informed but also involved. Thus, for example, given that civil society or citizen participation are essential elements in project development, project leads must not only keep communities affected by the project informed, but they must also secure their involvement in the process of establishing or validating the project objectives, determine the indicators of success, set schedules, etc. When these involved parties do not have the appropriate support or level of leadership and empowerment in the project, this compromises the sustainability of interventions. Depending on the pro-ject type, the civil society may be one of the most important stakeholders and should remain active throughout the project life.
II.4. Project Charter
What is the Project Charter?
It is an initial/start-up document for project implementation in which the following elements, among others, are defined: i) scope, time and costs, ii) analysis of stake-holders, iii) governance structure, and iv) the team responsible for the project.
The Project Charter offers a preliminary vision of the roles and responsibilities of the primary stakeholders and defines the authority of the project manager. It serves as a reference for the future of the project and for communicating the project purpose to different stakeholders.The creation and approval of the Charter by the Steering Com-mittee marks the formal start of the project and assigns authority to use the resourc-es in project activities.
This document generally includes:
• Rationale and purpose of the project: The reason for the project, or rather, what the project seeks to achieve and the problem that it must solve.
• Project objectives: A brief description of the project objectives and the expected impact.
• Project strategy:
o Brief description of the intervention model.
o Scope (most important products) and limits to scope (what the project will not produce).
o Summarized schedule of milestones.
o Summarized budget.
37T h i s d o c u m e n t i s i n t e l l e c t u a l p r o p e r t y o f t h e I n t e r - A m e r i c a n D e v e l o p m e n t B a n k ( I D B ) a n d t h e I n t e r - A m e r i c a n I n s t i t u t e f o r E c o n o m i c a n d S o c i a l D e v e l o p m e n t ( I N D E S ) . A n y p a r t i a l o r f u l l r e p r o d u c t i o n o f t h i s d o c u m e n t m u s t b e r e p o r t e d t o : B I D - I N D E S @ i a d b . o r g
L E A R N I N G G U I D E - 2 0 1 8

o High-level risks, assumptions, and restrictions.
• Structure of governance.
• Management and team.
• Change control and monitoring mechanisms.
The Charter is not a document that exhaustively describes the project, nor does it attempt to replace other documents from the project design and approval phase. The content of the Charter may vary according to the area of application, characteristics, and complexity of the project and may include other components besides those pre-viously identified.
Development of the Project Charter
Developing the Project Charter involves the creation of a document that organizes the project information generated during the design phase, presented in a simple and easy-to-use format (Figure I.11).
38T h i s d o c u m e n t i s i n t e l l e c t u a l p r o p e r t y o f t h e I n t e r - A m e r i c a n D e v e l o p m e n t B a n k ( I D B ) a n d t h e I n t e r - A m e r i c a n I n s t i t u t e f o r E c o n o m i c a n d S o c i a l D e v e l o p m e n t ( I N D E S ) . A n y p a r t i a l o r f u l l r e p r o d u c t i o n o f t h i s d o c u m e n t m u s t b e r e p o r t e d t o : B I D - I N D E S @ i a d b . o r g
L E A R N I N G G U I D E - 2 0 1 8

Figure I.11.Project Charter Creation Process
S O U R C E
- Financer- Organization
I N P U T S
- Project profile (PP)- Results matrix
- Project approvaldocuments
- Stakeholdersmatrix
T E C H N I Q U E S
- Charterdevelopment
- Expert opinion
O U T P U T S
- Project charter
U S E R
- Project team- Organization- Stakeholders
Source: Project Management Institute, A Guide to the Project Management Body of Knowledge,(PMBOK® Guide)- Fifth Edition, Project Management Institute, Inc., 2013, Figure 4-2, page 66.
In the majority of cases, the project sponsor creates and approves the Charter. A sponsor is an individual or group that provides or authorizes the use of financial resources for the project. When a project is designed, the sponsor proposes and per-forms the role of the project spokesperson before the organization's senior manage-ment to secure their support and promote the benefits that it will provide. The spon-sor guides the project through the hiring or selection of the manager until he/she is formally appointed and authorized.
Expert opinions are often used to analyze the information necessary to prepare the Project Charter, and such opinions and experience are applied to technical details. Expert opinions include the experience provided by any group or individual with spe-cialized knowledge or training. This is normally available from various places, such as other units within the organization, aswell as from consultants, stakeholders (includ-ing funding bodies), professional and technical associations, in addition to experts on the relevant subject matter.
The Project Charter is an excellent tool for disseminating information about the pro-ject to internal and external parties participating in the project, such as project part-ners, beneficiaries, team members, participating groups and departments, as well as individuals and organizations considered to be stakeholders.
39T h i s d o c u m e n t i s i n t e l l e c t u a l p r o p e r t y o f t h e I n t e r - A m e r i c a n D e v e l o p m e n t B a n k ( I D B ) a n d t h e I n t e r - A m e r i c a n I n s t i t u t e f o r E c o n o m i c a n d S o c i a l D e v e l o p m e n t ( I N D E S ) . A n y p a r t i a l o r f u l l r e p r o d u c t i o n o f t h i s d o c u m e n t m u s t b e r e p o r t e d t o : B I D - I N D E S @ i a d b . o r g
L E A R N I N G G U I D E - 2 0 1 8

II.5. Project management tools
The importance of planning in project management
Planning is not a process that occurs only once during the project, but rather is a con-tinuous process throughout its life, given that every plan requires changes and adjustments and that such modifications, provided that they are properly authorized, alter the original planning.
Figure I.12presents the cyclical function of planning within project management, especially in the context of external and internal environments thatconstantly change initial assumptions on which original plans are based, which is frequent in any development project.Changes in the project environment impose a review of plans and adjustments to stick to the original plan.
Planning entails the processes required to define and establish the project total scope, determine and refine objectives, and develop the course of action necessary to achieve them. This planning stage addresses the development of the Multi-Year Execution Plan (MEP) and other documents necessary to implement the project. The MEP consolidates and integrates all subsidiary plans and the baselines of other plan-ning processes (scope, time, cost, risks, etc.). The planning stage occurs immediate-ly after project start-up.
Project management tools
In the next three modules, this course presents a series of basic tools for planning and managing the development project. To facilitate their use and application through a simple, easy-to-learn method, the tools are laid out in seven steps that follow a sequential structure from an executing entity's perspective.
C Y C L E I
C Y C L E I I
I M P L E M E N TAT I O N
M O N I T O R I N GA N D C O N T R O L
P L A N N I N G
C L O S E S TA R T
Figure I.12. Planning phase during two project cycles
Source: Compiled by author
40T h i s d o c u m e n t i s i n t e l l e c t u a l p r o p e r t y o f t h e I n t e r - A m e r i c a n D e v e l o p m e n t B a n k ( I D B ) a n d t h e I n t e r - A m e r i c a n I n s t i t u t e f o r E c o n o m i c a n d S o c i a l D e v e l o p m e n t ( I N D E S ) . A n y p a r t i a l o r f u l l r e p r o d u c t i o n o f t h i s d o c u m e n t m u s t b e r e p o r t e d t o : B I D - I N D E S @ i a d b . o r g
L E A R N I N G G U I D E - 2 0 1 8

The steps are:
• Step 1: Creation ofthe work breakdown structure (WBS)
• Step 2: Preparation of the project schedule
• Step 3: Development of the resource utilization curve (S curve)
• Step 4: Preparation of the procurement matrix
• Step 5: Preparation of the risk matrix
• Step 6: Preparation of the communications matrix
• Step 7: Creation of the responsibilities assignment matrix (RAM).
The sequence of these seven steps allows for the identification of inputs, techniques and outputs todevelop each tool for planning and managing development projects.
41T h i s d o c u m e n t i s i n t e l l e c t u a l p r o p e r t y o f t h e I n t e r - A m e r i c a n D e v e l o p m e n t B a n k ( I D B ) a n d t h e I n t e r - A m e r i c a n I n s t i t u t e f o r E c o n o m i c a n d S o c i a l D e v e l o p m e n t ( I N D E S ) . A n y p a r t i a l o r f u l l r e p r o d u c t i o n o f t h i s d o c u m e n t m u s t b e r e p o r t e d t o : B I D - I N D E S @ i a d b . o r g
L E A R N I N G G U I D E - 2 0 1 8

U N I T S U M M A R Y
The project governance is a fundamental aspect for successfully managing deci-sion-making in development projects. This structure facilitates a clear definition of roles, responsibilities, and mechanisms for the accountability of the project results.
The tools discussed in this module, which are broadly used in the development sector, are:
• The results matrix
• The stakeholders matrix
• The Project Charter
The use of the results matrix and shareholders matrix is recommended for the prepa-ration of a good Project Charter.
Apart fromthe three tools above, we have learned in this module about the cyclical concept of planning, or rather, we sought to understand effective planning within project management as a recurrent process extending beyond the planning phase.
42T h i s d o c u m e n t i s i n t e l l e c t u a l p r o p e r t y o f t h e I n t e r - A m e r i c a n D e v e l o p m e n t B a n k ( I D B ) a n d t h e I n t e r - A m e r i c a n I n s t i t u t e f o r E c o n o m i c a n d S o c i a l D e v e l o p m e n t ( I N D E S ) . A n y p a r t i a l o r f u l l r e p r o d u c t i o n o f t h i s d o c u m e n t m u s t b e r e p o r t e d t o : B I D - I N D E S @ i a d b . o r g
L E A R N I N G G U I D E - 2 0 1 8

B I B L I O G R A P H I C A L R E F E R E N C E S
Inter-American Development Bank (2010).2008-2009 Development effectiveness overview. Working document. March.
García López, Roberto and Mauricio García Moreno (2010).Managing for development results: Progress and challenges in Latin America and the Caribbean. Washington, DC: IDB.
Gardiner, Paul (2005).Project Management: A Strategic Planning Approach. New York: Palgrave-Macmillan.
Meredith, Jack and Samuel Mantel (2003).Project Management: A Managerial Approach. 5th edition. New York: John Wiley Ed.
Mindtools.com (2011). Página Project Management and Planning Tools. United King-dom.
Mulcahy, Rita (2009). PMP Exam Prep. 6th edition. United States: RMC Publications.
OECD (Organization for Co-operation and Economic Development) and the World Bank (2007).Sourcebook on Emerging Good Practice in Managing for Development Results,2nd edition. Washington, DC: World Bank.
Pereña Brand, Jaime (2008).Dirección y gestión de proyectos[Project administration and management]. 2ndedition. Madrid: Ediciones Díaz De Santos.
PM4DEV (2008) Fundamentals of project management. United States: PM4DEV.
Project Management Institute (2013) A Guide to the Project Management Body of Knowledge, (PMBOK® Guide)- Fifth Edition, United States.
SIPOC Diagram, Six Sigma, available athttp://www.isixsigma.com.
Several authors (2009). Presentation entitled Integrated Project Management Pro-gram (PGIP), 7-Step Methodology. Washington, DC: IDB.
Turley, Frank (2010).The PRINCE2®process model: a magnificent introduction to PRINCE2. United Kingdom: Creative Commons. Available atwww.bubok.es
Westland, Jason (2006).Project Management Life Cycle. London: Kogan Page Limit-ed.
43T h i s d o c u m e n t i s i n t e l l e c t u a l p r o p e r t y o f t h e I n t e r - A m e r i c a n D e v e l o p m e n t B a n k ( I D B ) a n d t h e I n t e r - A m e r i c a n I n s t i t u t e f o r E c o n o m i c a n d S o c i a l D e v e l o p m e n t ( I N D E S ) . A n y p a r t i a l o r f u l l r e p r o d u c t i o n o f t h i s d o c u m e n t m u s t b e r e p o r t e d t o : B I D - I N D E S @ i a d b . o r g
L E A R N I N G G U I D E - 2 0 1 8

L I S T O F F I G U R E S
Figure I.1. Joint development strategies
Figure I.2. Elements of results-based planning
Figure I.3. Concept of causality. Results chain
Figure I.4. Project restrictions
Figure I.5. Development project life cycle
Figure I.6. Project management stages
Figure I.7. Effort and time levels during the implementation, and monitoring and control phases
Figure I.8. Example of a two-cycle project
Figure I.9. Development of the stakeholders matrix
Figure I.10. Stakeholders classification matrix
Figure I.11. Project Charter Creation Process
Figure I.12. Planning phase during two project cycles
11
16
16
18
20
21
22
23
32
35
39
40
L I S T O F TA B L E S
Table I.1. Description of the project manager's skills
Table I.2. Results matrix
Table I.3. Stakeholders identification matrix
27
30
34
44T h i s d o c u m e n t i s i n t e l l e c t u a l p r o p e r t y o f t h e I n t e r - A m e r i c a n D e v e l o p m e n t B a n k ( I D B ) a n d t h e I n t e r - A m e r i c a n I n s t i t u t e f o r E c o n o m i c a n d S o c i a l D e v e l o p m e n t ( I N D E S ) . A n y p a r t i a l o r f u l l r e p r o d u c t i o n o f t h i s d o c u m e n t m u s t b e r e p o r t e d t o : B I D - I N D E S @ i a d b . o r g
L E A R N I N G G U I D E - 2 0 1 8

Project management tools(Part I)
CHAPTER 2
45T h i s d o c u m e n t i s i n t e l l e c t u a l p r o p e r t y o f t h e I n t e r - A m e r i c a n D e v e l o p m e n t B a n k ( I D B ) a n d t h e I n t e r - A m e r i c a n I n s t i t u t e f o r E c o n o m i c a n d S o c i a l D e v e l o p m e n t ( I N D E S ) . A n y p a r t i a l o r f u l l r e p r o d u c t i o n o f t h i s d o c u m e n t m u s t b e r e p o r t e d t o : B I D - I N D E S @ i a d b . o r g
L E A R N I N G G U I D E - 2 0 1 8

The second course chapter outlines the steps to develop tools that manage the scope, time, and cost of a project. For each of these tools, the building process will be presented, which will allow for inputs, techniques, and outputs (results) to be identi-fied.
The chapter is structured in three learning units, each part dealing with one step in the process (steps 1, 2, and 3) of planning a project. The first unit (step 1) focuses on generating a Work Breakdown Structure (WBS); the second unit (step 2) looks at creat-ing a timeline; and the third unit (step 3) examines how an S curve is created to con-trol project costs.
C H A P T E R I N T R O D U C T I O N
To know and apply the steps required to develop management tools and how they can be applied to project management.
Guiding Questions
• What are the criteria for breaking down the project scope?
• What are the techniques for reaching a good estimate of project activity duration?
• What techniques are used to generate an S curve that allows for effective control of a budget?
L E A R N I N G O B J E C T I V E S
46T h i s d o c u m e n t i s i n t e l l e c t u a l p r o p e r t y o f t h e I n t e r - A m e r i c a n D e v e l o p m e n t B a n k ( I D B ) a n d t h e I n t e r - A m e r i c a n I n s t i t u t e f o r E c o n o m i c a n d S o c i a l D e v e l o p m e n t ( I N D E S ) . A n y p a r t i a l o r f u l l r e p r o d u c t i o n o f t h i s d o c u m e n t m u s t b e r e p o r t e d t o : B I D - I N D E S @ i a d b . o r g
L E A R N I N G G U I D E - 2 0 1 8

Learning objectives
• To take the first step in planning a project by applying the tool that breaks down the scope of the project: the Work Breakdown Structure (WBS):
o To identify the inputs that are needed to create a WBS.
o To understand and apply the techniques to break downwork in a project.
• To understand the relevance of the WBS tool within the context of project scope management.
I.1. Work Breakdown Structure (WBS)
The work breakdown structure (WBS) is the first step in planning a project. It is a tech-nical tool that involves the hierarchical breakdownof work to achieve the project objectives and to generate the required deliverables. The WBS organizes and defines the overall scope of the project; however, it is not functional when it is turned into a list of hundreds of activities that would require one or more people to periodically update.
The purpose of developing a WBS is to use it as a daily work tool and not as a docu-ment that is updated once a year to justify project costs. For the WBS to be a useful document, it needs to be easily modified, which focuses on results that are SMART 3 defined, that have been designed or approved by the team responsible for imple-menting the project or by the people who are accountable for these results. The WBS should not include activities (activity definition and management is carried out when preparing the schedule), but a higher level called work packages. The work package, the last level included in the WBS, has a duration and cost that can be estimated, monitored and controlled. Another feature of the work package is that it can be used to assign responsibility. There is no rule as to the number of levels that the WBS can have; however, three to five levels are recommended. The project team decides the level of detail required, based on project complexity. The WBS does not represent sequential execution, but a hierarchical organization of project deliverables. In the WBS, verbs, times, costs, or resources should not be included.
3 As seen in Unit II.2, these are indicators that use the following basic principles to be outlined: Specific; Measurable; Achievable; Relevant; Time-bound.
U N I T 1 . S T E P 1 : B R E A K I N G D O W N T H E P R O J E C T S C O P E
47T h i s d o c u m e n t i s i n t e l l e c t u a l p r o p e r t y o f t h e I n t e r - A m e r i c a n D e v e l o p m e n t B a n k ( I D B ) a n d t h e I n t e r - A m e r i c a n I n s t i t u t e f o r E c o n o m i c a n d S o c i a l D e v e l o p m e n t ( I N D E S ) . A n y p a r t i a l o r f u l l r e p r o d u c t i o n o f t h i s d o c u m e n t m u s t b e r e p o r t e d t o : B I D - I N D E S @ i a d b . o r g
L E A R N I N G G U I D E - 2 0 1 8

Figure II.1. Process to develop a WBS
S O U R C E
- Financer- Organization
I N P U T S
- Results matrix- Project approval
documents-Historical
information
T E C H N I Q U E S
- Breakdown ofproject work
O U T P U T S
- Work breakdownstructure
U S E R
- Project team
Source: Project Management Institute, A Guide to the Project Management Body of Knowledge,(PMBOK® Guide)- Fifth Edition, Project Management Institute, Inc., 2013, Figure 5-9, page 125.
Process to create a WBS
During the planning phase, the first process that is commonly used by development projects to manage the scope is creating the WBS. To do so, the documents created during project design are used as inputs (Figure II.1).
I.2. Inputs
The most important document produced during the project design is the results matrix (RM), since it describes the project objectives and the indicators to check if the objectives have been met.
It is important to understand the logic of the matrix, which moves from inputs to products, since it is used to identify intermediary objectives and activities that help create the project timeline and budget.
Another input to create the WBS is the historical Information, i.e., the project manag-er can use information from similar previous projects that could give guidelines for determining the work components of an objective. This can significantly reduce the breakdownprocess.
48T h i s d o c u m e n t i s i n t e l l e c t u a l p r o p e r t y o f t h e I n t e r - A m e r i c a n D e v e l o p m e n t B a n k ( I D B ) a n d t h e I n t e r - A m e r i c a n I n s t i t u t e f o r E c o n o m i c a n d S o c i a l D e v e l o p m e n t ( I N D E S ) . A n y p a r t i a l o r f u l l r e p r o d u c t i o n o f t h i s d o c u m e n t m u s t b e r e p o r t e d t o : B I D - I N D E S @ i a d b . o r g
L E A R N I N G G U I D E - 2 0 1 8
I.3. Techniques
Creating the WBS is not an exercise or job for only one person. To achieve an effec-tive WBS, the project team and other stakeholders should participate so that every-one can identify the WBS components according to the type of work. The project manager should be sure to get the support of the people that understand the project best during this development process.
A WBS should be detailed enough so that work can be assigned to third parties easily and can adequately monitor their progress. To determine if this level of clarity has been achieved, the variables of time and cost should be easily identifiable. If this is not the case, it should continue to be subdivided until it is useful for estimating time and costs.
The project team starts breaking down the activities from the project final objective until they have reached the level of work packages. A structure that can facilitate ordering the different levels of the WBS is as follows:
1. Project objective: The desired impact of the project components.
2. Components: The set of outputs grouped by type.
3. Outputs: The result of the project deliverables.
4. Deliverables: The services, products, or work that the project creates by means of work packages.
5. Work packages: Group of activities/tasks that are performed to create project deliverables; this is the WBS lowest level.
Figure II.2 shows a hierarchical order diagram of the WBS. It should be kept in mind that the WBS has as many components, outputs, deliverables, and work packages as necessary; one of these components is project management, as well as the products and the management work needed to carry out the project.
49T h i s d o c u m e n t i s i n t e l l e c t u a l p r o p e r t y o f t h e I n t e r - A m e r i c a n D e v e l o p m e n t B a n k ( I D B ) a n d t h e I n t e r - A m e r i c a n I n s t i t u t e f o r E c o n o m i c a n d S o c i a l D e v e l o p m e n t ( I N D E S ) . A n y p a r t i a l o r f u l l r e p r o d u c t i o n o f t h i s d o c u m e n t m u s t b e r e p o r t e d t o : B I D - I N D E S @ i a d b . o r g
L E A R N I N G G U I D E - 2 0 1 8

Figure II.2. Example of a hierarchical order diagram of the WBS
Source: Project Management Institute, A Guide to the Project Management Body of Knowledge,(PMBOK® Guide)- Fifth Edition, Project Management Institute, Inc., 2013, Figure 5-11, page 129.
ProjectObjective
Co mpo nent 1 Co mpo nent 2
P r o duc t 1 . 1 P r o duc t 1 . 2
D el i verabl e 1 . 1 . 1 D el i verabl e 1 . 1 . 2 D el i verabl e 1 . 1 . 3
Wo r k P ac kage 1 . 1 . 2. 1
Wo r k P ac kage1 . 1 . 2. 2
Wo r k P ac kage1 . 1 . 2. 3
I.4. Outputs
As a result, the project will have a hierarchical list of all the required work in the form of deliverables and work packages. In the WBS, a deliverable is the result of effort, not the effort itself; therefore no verbs should be used when preparing the WBS. This list is a baseline that allows project times and costs to be estimated.
The most important aspect in developing a WBS, even more so than inputs, is the process by which it is performed. This process should be participatory and focused on obtaining results, rather than on listing activities.
In addition, the WBS helps establish the relationship of each work package with the final goal and identify 100% of the work required to carry out the project.
50T h i s d o c u m e n t i s i n t e l l e c t u a l p r o p e r t y o f t h e I n t e r - A m e r i c a n D e v e l o p m e n t B a n k ( I D B ) a n d t h e I n t e r - A m e r i c a n I n s t i t u t e f o r E c o n o m i c a n d S o c i a l D e v e l o p m e n t ( I N D E S ) . A n y p a r t i a l o r f u l l r e p r o d u c t i o n o f t h i s d o c u m e n t m u s t b e r e p o r t e d t o : B I D - I N D E S @ i a d b . o r g
L E A R N I N G G U I D E - 2 0 1 8

It is common to find that activities defined for a project do not represent 100% of its scope. Oftentimes, required activities are omitted and rarely are activities related to project management; these require project resources to be used, and therefore, should be part of the WBS.
As previously mentioned, the WBS is the first step in planning a project and serves as the foundation for developing the project timeline and budget.
One of its most important uses is to support the project scope verification process.
This verification includes activities, such as measuring, examining, and verifying, and aims to determine if the services, products, and deliverables meet the requirements and the acceptance criteria. Formal acceptance also means that the project has met its objective and that no additional work or effort is needed. The WBS is applied to verify that the services or products and deliverables are included within the approved project scope and authorized changes.
51T h i s d o c u m e n t i s i n t e l l e c t u a l p r o p e r t y o f t h e I n t e r - A m e r i c a n D e v e l o p m e n t B a n k ( I D B ) a n d t h e I n t e r - A m e r i c a n I n s t i t u t e f o r E c o n o m i c a n d S o c i a l D e v e l o p m e n t ( I N D E S ) . A n y p a r t i a l o r f u l l r e p r o d u c t i o n o f t h i s d o c u m e n t m u s t b e r e p o r t e d t o : B I D - I N D E S @ i a d b . o r g
L E A R N I N G G U I D E - 2 0 1 8
One of the most useful tools for managing the scope of work is breakingit downinto components, which allows for it to be performed, verified, and controlled.
The WBS is a tool that allows the project team to define more precisely the scope of work, by breaking downeach project objective into different levels until reaching a level at which work time and cost can be estimated.
The WBS is used in particular to verify the project work and as an input for the next planning steps: creating a timeline (Step 2), and creating a resource utilization curve (Step 3).
U N I T S U M M A R Y
52T h i s d o c u m e n t i s i n t e l l e c t u a l p r o p e r t y o f t h e I n t e r - A m e r i c a n D e v e l o p m e n t B a n k ( I D B ) a n d t h e I n t e r - A m e r i c a n I n s t i t u t e f o r E c o n o m i c a n d S o c i a l D e v e l o p m e n t ( I N D E S ) . A n y p a r t i a l o r f u l l r e p r o d u c t i o n o f t h i s d o c u m e n t m u s t b e r e p o r t e d t o : B I D - I N D E S @ i a d b . o r g
L E A R N I N G G U I D E - 2 0 1 8

Learning objectives
• To use the output of Step 1 (WBS) to plan project times. • To identify the process to create a project schedule.
o To understand the inputs that are needed to create a timeline.
o To understand the techniques to estimate the duration of project activities.
• To determine the schedule critical path.
II.1. The Project schedule
A schedule is more than the total of the activity times of a project, since it presents the entire logical sequence and the steps to follow to achieve the results. Given that time is one of the most important project constraints, the schedule becomes the tool that the manager will use most often, not only to control the project progress, but also to perform analyses and make adjustments as necessary.
Creating a schedule is an iterative process; it is not linear. During this schedule crea-tion process, the project manager and team will better understand the relationships, dependencies, and the total duration of the project, which allows for information to be analyzed to optimize resource utilization and to meet the goals within the project-ed time period. During the project planning process, the development of a detailed budget, a risk matrix, and procurement and communication plans provide additional information that allow for adjustments and changes to be made to the schedule. Figure II.3 shows the process to create the project schedule.
U N I T I I . S T E P 2 : T H E P R O J E C T S C H E D U L E
FigureII.3. Process to create the schedule
S O U R C E
- Financer- Organization- Stakeholders
I N P U T S
- WBS- Constraints
- Externaldependencies
- Resource calendar- Project approval
documents
T E C H N I Q U E S
- Time estimation- Sequence of
activities- Network chart
- Critical path- Gantt path
- Compression
O U T P U T S
- Project schedule
U S E R
- Project team- Stakeholders- Contractors
Source: Project Management Institute, A Guide to the Project Management Body of Knowledge,(PMBOK® Guide)- Fifth Edition, Project Management Institute, Inc., 2013, Figure 6-16, page 173.
53T h i s d o c u m e n t i s i n t e l l e c t u a l p r o p e r t y o f t h e I n t e r - A m e r i c a n D e v e l o p m e n t B a n k ( I D B ) a n d t h e I n t e r - A m e r i c a n I n s t i t u t e f o r E c o n o m i c a n d S o c i a l D e v e l o p m e n t ( I N D E S ) . A n y p a r t i a l o r f u l l r e p r o d u c t i o n o f t h i s d o c u m e n t m u s t b e r e p o r t e d t o : B I D - I N D E S @ i a d b . o r g
L E A R N I N G G U I D E - 2 0 1 8

II.2. Inputs
As the figure shows, the inputs for creating the schedule are as follows:
• Work Breakdown Structure (WBS): Organizes and defines the overall scope of the project. The activities that are not included in the WBS fall outside the scope of the project.
• Constraints: These are factors that limit the project team's options; for example, a project end date is a constraint that limits team options.
• External dependencies: They can be mandatory, discretionary, or external, i.e., out of the project team’s control.
• Resource calendar: It is the availability of resources to be used during the project.
II.3. Techniques
Estimating activity durations
Based on the list of work packages identified in the work breakdown structure, which corresponds to the lowest level of the WBS, the project manager and team start to estimate the duration of each activity. This process does not have to be complicated. The most frequent techniques used to estimate activity duration are:
• Expert Opinion: Based on previous experience, experts can provide duration estimates. This technique is useful for those activities in which the team has significant experience.
• Analogous Estimation: This technique estimates an activity/project duration or cost using historical information. It uses parameters that are similar to those of a previous similar project, such as duration, budget, and complexity. In general, it costs less than other techniques, but it is less exact.
• Parametric Estimation: It uses a statistical relationship between historical data and other variables to calculate an estimate of the activity parameters, such as cost, budget, and duration - e.g. man hours or square meters. This technique can achieve greater levels of exactness, but it takes more time and is more costly.
• Three-point Technique: It can achieve greater accuracy taking into consideration the level of uncertainty and risk. To perform this estimation, the PERT2 method is used, in which the expected duration is calculated by using the following formula:
4 The Project Evaluation and Review Technique (PERT) is a project management model designed to analyze and represent project tasks.
54T h i s d o c u m e n t i s i n t e l l e c t u a l p r o p e r t y o f t h e I n t e r - A m e r i c a n D e v e l o p m e n t B a n k ( I D B ) a n d t h e I n t e r - A m e r i c a n I n s t i t u t e f o r E c o n o m i c a n d S o c i a l D e v e l o p m e n t ( I N D E S ) . A n y p a r t i a l o r f u l l r e p r o d u c t i o n o f t h i s d o c u m e n t m u s t b e r e p o r t e d t o : B I D - I N D E S @ i a d b . o r g
L E A R N I N G G U I D E - 2 0 1 8

De = (O + 4M + P) / 6
In which:
De = expected duration
O = optimistic duration
M = most probable duration (realistic)
P = pessimistic duration
Furthermore, to determine duration estimates, contingency reserves and time reserves should be included. This can be a percentage of the expected duration of an activity, a fixed amount of work periods, or it can be calculated by analyzing project risks. As better information becomes available, the reserve can be used, reduced, or eliminated. The contingency should be clearly identified on the timeline or be includ-ed as a factor in the activities that, at the discretion of the project team, are difficult to estimate accurately.
4 The Project Evaluation and Review Technique (PERT) es un modelo de la gestión de proyectos diseñado para analizar y representar tareas de un proyecto.
55T h i s d o c u m e n t i s i n t e l l e c t u a l p r o p e r t y o f t h e I n t e r - A m e r i c a n D e v e l o p m e n t B a n k ( I D B ) a n d t h e I n t e r - A m e r i c a n I n s t i t u t e f o r E c o n o m i c a n d S o c i a l D e v e l o p m e n t ( I N D E S ) . A n y p a r t i a l o r f u l l r e p r o d u c t i o n o f t h i s d o c u m e n t m u s t b e r e p o r t e d t o : B I D - I N D E S @ i a d b . o r g
L E A R N I N G G U I D E - 2 0 1 8

Determining the logical sequence of activities
The first step in creating a schedule is to determine the logical sequence of activities. These should be carefully sequenced, since these establish the support for a realistic and attainable project. The sequence also determines the dependencies between activities; for example, there are activities that cannot be started until the previous activity has been completed. There are three types of dependencies between activi-ties:
• Mandatory dependencies: These are inherent to the nature of the work to be performed. For example, walls cannot be constructed unless the foundations are ready.
• Discretionary dependencies: These are defined by the project team and entail changing the logical sequencing without affecting the outcome. For example, if we wished to refurbish a meeting room changing the carpet and painting walls in a different color, the logical sequence would be to start by painting the walls and then placing the carpet. However, this order can be reversed. We might place the carpet first, but we would need to protect it and do the painting very carefully to prevent paint spots.
• External dependencies: These imply a relationship between the project activities with those of another project. These are out of the project team’s control, like obtaining approval fora construction license.
Once the dependencies are identified, it will be apparent that some activities have multiple dependencies.
Precedence diagram
The precedence diagram is a technique used to create a project network chart. This uses boxes or rectangles called nodes to represent the activities, and are connected with arrows to show the dependencies (Figure II.4).
Figure II.4. Precedence chart
Source: Compiled by author
C
B
F
E
A D G
56T h i s d o c u m e n t i s i n t e l l e c t u a l p r o p e r t y o f t h e I n t e r - A m e r i c a n D e v e l o p m e n t B a n k ( I D B ) a n d t h e I n t e r - A m e r i c a n I n s t i t u t e f o r E c o n o m i c a n d S o c i a l D e v e l o p m e n t ( I N D E S ) . A n y p a r t i a l o r f u l l r e p r o d u c t i o n o f t h i s d o c u m e n t m u s t b e r e p o r t e d t o : B I D - I N D E S @ i a d b . o r g
L E A R N I N G G U I D E - 2 0 1 8

E
C
F
GA
B
D
Source: Compiled by author
Figure II.5. Network chart
S TA R T E N D
Project network chart
The project network chart is a diagramming technique that allows activity dependen-cies to be visualized and the total project duration to be calculated.
This chart uses the Technique called activity on node (AON), which is used by the ma-jority of software packages for project management.
A network diagram can be created manually or with a computer program, which makes it easier to analyze the necessary changes to optimize the project. This type of chart is based on using a network with nodes (on which the activities appear) and with arrows that not only represent the sequence and the relationships that connect them, but they also show the dependencies that exist between them. The network allows the various precedence relationships between tasks to be shown. Figure II.5 shows an example of a simple project network diagram.
The network chart includes four types of dependencies or precedence (Table II.1).
57T h i s d o c u m e n t i s i n t e l l e c t u a l p r o p e r t y o f t h e I n t e r - A m e r i c a n D e v e l o p m e n t B a n k ( I D B ) a n d t h e I n t e r - A m e r i c a n I n s t i t u t e f o r E c o n o m i c a n d S o c i a l D e v e l o p m e n t ( I N D E S ) . A n y p a r t i a l o r f u l l r e p r o d u c t i o n o f t h i s d o c u m e n t m u s t b e r e p o r t e d t o : B I D - I N D E S @ i a d b . o r g
L E A R N I N G G U I D E - 2 0 1 8

Source: Compiled by author
Table II.1. Types of dependencies in a network chart
(FS) Finish-to-start:The start of the next activitydepends on the completion ofthe previous activity.
(FF) Finish-to-finish:The completion of the next activitydepends on the completion ofthe previous activity.
(SS) Start-to-start:The start of the next activity depends on the start of the previous activity.
(SF) Start-to-finish:The completion of the next activity depends on the start of the previous activity.
TYPE OF DEPENDENCY FIGURE
A
B
A
B
A
B
A
B
The most commonly used type of precedence relationship is the finish-to-start (FS); the start-to-finish (SF) relationships are rarely used.
The critical path
Once the project team has finished diagramming the activity network, the critical path needs to be determined. The critical path is defined as the path that goes from start to end of the project and takes the most time in comparison to all the other routes. It is also the path that does not have spaces or lapses between activities, which means that any delay in any of the activities along this path would result in a project delay.Calculating the values to find the critical path is a complex process, since the duration of each activity should be determined as it is related to the esti-mates that include lapse times, so that an activity can begin and end. This process can be facilitated by using software, particularly in the case of large-scale projects. Figure II.6 shows a project network chart that has four paths; in this example, the crit-ical path is determined by activities 1, 2, 4, and 7, adding up to a total of 90 days, the longest duration.
58T h i s d o c u m e n t i s i n t e l l e c t u a l p r o p e r t y o f t h e I n t e r - A m e r i c a n D e v e l o p m e n t B a n k ( I D B ) a n d t h e I n t e r - A m e r i c a n I n s t i t u t e f o r E c o n o m i c a n d S o c i a l D e v e l o p m e n t ( I N D E S ) . A n y p a r t i a l o r f u l l r e p r o d u c t i o n o f t h i s d o c u m e n t m u s t b e r e p o r t e d t o : B I D - I N D E S @ i a d b . o r g
L E A R N I N G G U I D E - 2 0 1 8

Figure II.6. Critical path chart
Figure II.7. Gantt Chart
Source: Project Management Institute, A Guide to the Project Management Body of Knowledge,(PMBOK® Guide)- Fifth Edition, Project Management Institute, Inc., 2013, Figure 6-18, page 177.
Source: Compiled by author
S TA R T E N D
Ac tivity 1
20 da ys
Ac tivity 3
1 0 da ys
Ac tivity 4
30 da ys
Ac tivity 5
20 da ys
Ac tivity 6
30 da ys
Ac tivity 8
1 0 da ys
Ac tivity 2
30 da ys
Ac tivity 7
1 0 da ys
Gantt Chart
The Gantt chart is a widely-used graphical representation that aims to show the esti-mated amount of time for the different activities throughout the entire project. It is frequently used to show the project timeline to those involved (stakeholders), because it is easier to understand when graphically represented. Basically, the diagram is comprised of a vertical axis, on which the activities that represent the work to be performed are shown, and a horizontal axis that shows the duration of each of the activities on a calendar. Each activity is shown using a bar or a line that shows the beginning and end of each activity, the groups of activities that are relat-ed, and the dependencies between them. Figure II.7 shows an example of a project Gantt chart.
59T h i s d o c u m e n t i s i n t e l l e c t u a l p r o p e r t y o f t h e I n t e r - A m e r i c a n D e v e l o p m e n t B a n k ( I D B ) a n d t h e I n t e r - A m e r i c a n I n s t i t u t e f o r E c o n o m i c a n d S o c i a l D e v e l o p m e n t ( I N D E S ) . A n y p a r t i a l o r f u l l r e p r o d u c t i o n o f t h i s d o c u m e n t m u s t b e r e p o r t e d t o : B I D - I N D E S @ i a d b . o r g
L E A R N I N G G U I D E - 2 0 1 8

Schedule compression
The creation of a timeline is a process that requires constant revisions of estimates to achieve a timeline that reflects project constraints. The first version can provide results that do not fall within the budget, the resources, and the dependencies of other projects. The project manager should make various adjustments to create a final schedule. Optimizing the schedule by reducing durations is a special case that uses mathematical analysis to find ways to shorten the project duration without changing its scope. Duration compression includes techniques (Figure II.8) such as:
• Crashing: This implies reducing the original estimate of an activity by using additional resources. The trade-off of costs and duration is analyzed to determine the greatest amount of compression for the least possible increase in costs. Crashing does not always produce viable alternatives and many times results in increased costs.
• Fast Tracking: This means carrying out activities in parallel that would normally be performed in sequential order, which implies using additional resources. This technique oftentimes disproportionately increases the risk associated with the project and is limited by the dependency relationships between activities.
MONTH 4MONTH 1
Original schedule
MONTH 2 MONTH 3
A C T I V I T Y 1
A C T I V I T Y 2
Figure II.8. Schedule compression techniques
Source: Compiled by author
MONTH 4MONTH 1
Fast tracking
MONTH 2 MONTH 3
A C T I V I T Y 1
A C T I V I T Y 2 A C T I V I T Y 2
MONTH 4MONTH 1
Crashing
MONTH 2 MONTH 3
A C T I V I T Y 1
A C T I V I T Y 2
60T h i s d o c u m e n t i s i n t e l l e c t u a l p r o p e r t y o f t h e I n t e r - A m e r i c a n D e v e l o p m e n t B a n k ( I D B ) a n d t h e I n t e r - A m e r i c a n I n s t i t u t e f o r E c o n o m i c a n d S o c i a l D e v e l o p m e n t ( I N D E S ) . A n y p a r t i a l o r f u l l r e p r o d u c t i o n o f t h i s d o c u m e n t m u s t b e r e p o r t e d t o : B I D - I N D E S @ i a d b . o r g
L E A R N I N G G U I D E - 2 0 1 8

II.4. Outputs
The result of Step 2 is a schedule, a tool that allows the project manager to monitor project progress and to determine any compensatory actions, in the event that there are delays in the scheduled activities. The schedule is a tool that is used continuously and that should be consulted on a regular basis.
The schedule not only identifiesthe activities that should be performed, but it also serves as a record of completed tasks. As project activities are started and complet-ed, the manager should update the schedule information with regard to the actual start and end date of each activity. This information is used to compare the original schedule dates with the actual dates, which, in turn, allows delays and deviations to be detected and allows the project manager to develop and implement corrective measures. The schedule is an input to carry out the project cost planning (Step 3), since it provides the start and end dates for each activity, the work package, the deliverable, the outputs, and the project component.
G U Í A D E L P A R T I C I P A N T E - 2 0 1 8 61T h i s d o c u m e n t i s i n t e l l e c t u a l p r o p e r t y o f t h e I n t e r - A m e r i c a n D e v e l o p m e n t B a n k ( I D B ) a n d t h e I n t e r - A m e r i c a n I n s t i t u t e f o r E c o n o m i c a n d S o c i a l D e v e l o p m e n t ( I N D E S ) . A n y p a r t i a l o r f u l l r e p r o d u c t i o n o f t h i s d o c u m e n t m u s t b e r e p o r t e d t o : B I D - I N D E S @ i a d b . o r g
L E A R N I N G G U I D E - 2 0 1 8

Managing the schedule starts by estimating the duration of the activities defined in the WBS (Step 1), defining the dependencies, and verifying the availability of resourc-es to be used during the project.
The schedule shows the duration of all the activities and the total duration of the pro-ject. A schedule can have various networks that are formed by the relationships of dependency among activities. The network with the longest duration is the project critical path. A project duration can be optimized by applying techniques such as crashing and fast tracking.
U N I T S U M M A R Y
62T h i s d o c u m e n t i s i n t e l l e c t u a l p r o p e r t y o f t h e I n t e r - A m e r i c a n D e v e l o p m e n t B a n k ( I D B ) a n d t h e I n t e r - A m e r i c a n I n s t i t u t e f o r E c o n o m i c a n d S o c i a l D e v e l o p m e n t ( I N D E S ) . A n y p a r t i a l o r f u l l r e p r o d u c t i o n o f t h i s d o c u m e n t m u s t b e r e p o r t e d t o : B I D - I N D E S @ i a d b . o r g
L E A R N I N G G U I D E - 2 0 1 8

Learning objectives
• To use the output of Step 2 (schedule) to plan project costs.
• To identify the steps to create the resource utilization curve (S curve):
o To understand the necessary inputs to create the S curve.
o To understand the techniques to estimate the cost of activities.
• To understand the application of the S curve to monitor project costs.
III.1. S Curve
Managing costs entails organizing all of the project financial resources to complete and achieve the objectives within the approved budget. To follow this rule, a series of processes, namely those of planning, estimating, analysis, preparation, and coordi-nation with other project management processes, need to be followed. The most important techniques to create a resource utilization curve are estimating costs, ana-lyzing the budget, and creating a baseline.
The correct estimation of costs consists in assigning a cost/value to each of the activities needed to produce a result. All of these, in turn, are needed to produce a deliverable or project objective.
Cost management implies effective control of project costs; to achieve this, one must plan for the involved resources, estimate the cost of using these resources, prepare a project budget, control cash flow, and control the variations in budget disbursements. A tool that can aid in cost management is the resource utilization curve, also known as the S curve. It is a graphical representation of all the resources that are consumed as a function of time. Normally, it is in the shape of the letter S, since at the beginning of the project, expenses are low, then they increase, and then they taper off as the project comes to an end.
Figure II.9 shows an example of an S curve of a project with a total budget of $1,200,000 and a duration of 12 months. The Y axis represents the accumulated value of the budget, whereas the X axis represents the project time.
U N I T I I I . S T E P 3 : R E S O U R C E U T I L I Z AT I O N C U R V E
63T h i s d o c u m e n t i s i n t e l l e c t u a l p r o p e r t y o f t h e I n t e r - A m e r i c a n D e v e l o p m e n t B a n k ( I D B ) a n d t h e I n t e r - A m e r i c a n I n s t i t u t e f o r E c o n o m i c a n d S o c i a l D e v e l o p m e n t ( I N D E S ) . A n y p a r t i a l o r f u l l r e p r o d u c t i o n o f t h i s d o c u m e n t m u s t b e r e p o r t e d t o : B I D - I N D E S @ i a d b . o r g
L E A R N I N G G U I D E - 2 0 1 8

M O N T H S
BU
DG
ET
Figure II.9. Resource utilization curve
Note: Adapted from Milošević, Dragan Z. (2003).Project Management Toolbox: Tools andTechniques for the Practicing Project Manager,Figure 7-13 S Curve. New Jersey: John Wiley & Sons.
1,200,000
1,000,000
800,000
600,000
400,000
200,000
0
1 2 3 4 5 6 7 8 9 10 11 12
The S curve is very important to any organization and currently represents a financial strategy that should be kept in mind to develop a project, since it allows for resources to be monitored.
Process to create an S curve
Figure II.10 shows the basic elements in the process of creating an S curve.
Figure II.10. Process to create an S curve
S O U R C E
- Financer- Organization
- Market
I N P U T S
- WBS- Schedule
- Restrictions- Project approval
documents- Finantial
information
T E C H N I Q U E S
- Cost estimation- Budget analysis
O U T P U T S
- Resourceutilization curve
U S E R
- Project team- Organization
- Financer
Source: Project Management Institute, A Guide to the Project Management Body of Knowledge,(PMBOK® Guide)- Fifth Edition, Project Management Institute, Inc., 2013, Figure 7-6, page 208.
64T h i s d o c u m e n t i s i n t e l l e c t u a l p r o p e r t y o f t h e I n t e r - A m e r i c a n D e v e l o p m e n t B a n k ( I D B ) a n d t h e I n t e r - A m e r i c a n I n s t i t u t e f o r E c o n o m i c a n d S o c i a l D e v e l o p m e n t ( I N D E S ) . A n y p a r t i a l o r f u l l r e p r o d u c t i o n o f t h i s d o c u m e n t m u s t b e r e p o r t e d t o : B I D - I N D E S @ i a d b . o r g
L E A R N I N G G U I D E - 2 0 1 8

III.2. Inputs
The inputs required to create a resource utilization curve are:
• Project approval documents: They contain information about the total project budget.
• Work Breakdown Structure (WBS): It includes information about the scope of work.
• Schedule: It outlines the duration estimates and the sequence of project activities.
• Restrictions: They are those constraints that limit the use of resources.
• Financial information from the organization: It includes historical information about the costs of different projects.
III.3. Techniques
Estimating costs
The total project cost is estimated during the start-up phase�the design phase in international cooperation projects�in which the project budget is approved. During this phase, cost information is full of assumptionsthat require a detailed review to ensure that the project can begin with a realistic budget.
The project manager has the responsibility of reviewing the project budget to deter-mine if the assumptions and the original estimates are still valid.
Estimation techniques
Although there are various techniques to estimate project costs, the most common and widely-used are:
• Analogous estimation: It uses historical values of completed projects. This information should be analyzed based on the potential differences between the previous project and the current one. Analogous estimation is frequently used when the quantity and quality of detailed information on the project is limited. This technique is more reliable when previous projects are similar(not just in appearance), and the people or groups that prepare estimates have sufficient experience in similar projects.
65T h i s d o c u m e n t i s i n t e l l e c t u a l p r o p e r t y o f t h e I n t e r - A m e r i c a n D e v e l o p m e n t B a n k ( I D B ) a n d t h e I n t e r - A m e r i c a n I n s t i t u t e f o r E c o n o m i c a n d S o c i a l D e v e l o p m e n t ( I N D E S ) . A n y p a r t i a l o r f u l l r e p r o d u c t i o n o f t h i s d o c u m e n t m u s t b e r e p o r t e d t o : B I D - I N D E S @ i a d b . o r g
L E A R N I N G G U I D E - 2 0 1 8
• Rate determination: It implies using the rates of unit costs, such as personnel per hour, services and materials per unit, that correspond to each resource in an attempt to estimate the cost of an activity. A method to achieve this is by requesting quotes that allow for rates to be obtained. To establish the cost of products, services, or other results that should be rendered by contract, standard rates used by the organization, commercial databases, and price lists published by vendors can also be included.
• Estimation based on indices: It involves using indices that determine the unit cost of a good or service in relation to the materials, the equipment and the personnel that are required to complete a unit of work. It is used in construction projects. The unit cost is multiplied by the instances of the work unit in the project to determine the total cost.
These techniques for cost estimation can be performed using a top-down or bot-tom-up approach. A top-down approach starts at the level of the objectives or pro-ject goal from a set budget and is broken down based on the project components or activities. In other words, it seeks to determine how much can be achieved with a fixed budget. The bottom-up approach, in contrast, starts at the level of the activity. For this approach, the project is divided into activities, and the required effort is calculated to complete each of these activities; then the costs are totaled until reaching a total budget.
The disadvantages that the top-down approach presents are the advantages of the bottom-up approach, and vice versa. The top-down estimation does not take into account all of the project activities and tends to underestimate costs due to the small amount of analysis dedicated to theproject. In contrast, the bottom-up estimation takes into consideration each activity and takes longer to perform. In addition, to use this approach, an initial project WBS is needed to identify the components to be esti-mated.
Classifying costs
Costs can be classified into several categories; the most common of these is to con-sider its level of use. Classifying costs helps determine their impact on the project during the implementation phase.
• Classification according to the level of use: This classification is important to perform studies of planning and operations management. It is linked to the variations of costs, or lack thereof, according to the activity levels.
o Fixed costs: These are costs that remain a constant amount, regardless of the project activity level.
o Variable costs: These are costs that vary proportionally, according to the level of use or activity.
66T h i s d o c u m e n t i s i n t e l l e c t u a l p r o p e r t y o f t h e I n t e r - A m e r i c a n D e v e l o p m e n t B a n k ( I D B ) a n d t h e I n t e r - A m e r i c a n I n s t i t u t e f o r E c o n o m i c a n d S o c i a l D e v e l o p m e n t ( I N D E S ) . A n y p a r t i a l o r f u l l r e p r o d u c t i o n o f t h i s d o c u m e n t m u s t b e r e p o r t e d t o : B I D - I N D E S @ i a d b . o r g
L E A R N I N G G U I D E - 2 0 1 8

• Classification according to allowance:
o Direct costs: These are costs that are assigned directly to an activity. In general, they are similar to variable costs.
o Indirect costs: These are costs that cannot be directly assigned to an activity, but rather are distributed among the various activities by means of some distribution criteria. In most cases, the indirect costs are fixed.
Contingencies
The greater the amount of uncertainty of estimating project costs, the greater the need to have contingencies or reserves. This avoids unpleasant surprises when the project is in the implementation phase and an estimated cost is discovered to be well under the actual cost. The amount of the budget assigned to contingencies can vary according to the method used, such as the statistical analyses or information based on experience from similar projects. Reserves for contingencies should only be used for changes that were not planned for in the scope and the cost of the project. It is considered best practice for the project manager to obtain approval before using this reserve.
Determining the S curve
Once the estimation of all project costs has been completed, the next step involves determining the cost as a function of units of time. For example, a month could be used as the measure of time to calculate the project cost for each month of the pro-ject. To determine the cost of activities that will be performed each month, the total cost of the project is distributed based on resource utilization.
Table II.2 shows an example of a project with a total cost of $174,000 and a duration of ten months. The cost per month is obtained by adding the costs of all the activi-ties that are planned during that period. The information is compiled each mon-thuntil the end of the project is reached. This information is used to graph the distri-bution of resource utilization throughout the project (Figure II.11).
67T h i s d o c u m e n t i s i n t e l l e c t u a l p r o p e r t y o f t h e I n t e r - A m e r i c a n D e v e l o p m e n t B a n k ( I D B ) a n d t h e I n t e r - A m e r i c a n I n s t i t u t e f o r E c o n o m i c a n d S o c i a l D e v e l o p m e n t ( I N D E S ) . A n y p a r t i a l o r f u l l r e p r o d u c t i o n o f t h i s d o c u m e n t m u s t b e r e p o r t e d t o : B I D - I N D E S @ i a d b . o r g
L E A R N I N G G U I D E - 2 0 1 8

Table II.2. Distribution of project costs
M O N T H 1
5.000
5.000
M O N T H 2
10.000
15.000
M O N T H 3
17.000
32.000
M O N T H 4
25.000
57.000
M O N T H 5
30.000
87.000
M O N T H 6
30.000
117.000
M O N T H 7
25.000
142.000
M O N T H 8
17.000
159.000
M O N T H 9
10.000
169.000
M O N T H 1 0
5.000
174.000
T I M E
CO
ST
S
Figure II.11. Example of an S curve
Note: Adapted from Milošević, Dragan Z. (2003). Project Management Toolbox: Tools andTechniques for the Practicing Project Manager, Figure 7-13 S Curve.New Jersey: John Wiley & Sons.
200,000
180,000
160,000
140,000
120,000
100,000
80,000
60,000
40,000
20,000
0
MO
NT
H 1
MO
NT
H 2
MO
NT
H 3
MO
NT
H 4
MO
NT
H 5
MO
NT
H 6
MO
NT
H 7
MO
NT
H 8
MO
NT
H 9
MO
NT
H 1
0
Types of budget estimates
The total project budget can be classified in three levels, according to its level of pre-cision (Table II.3). This classification is useful to define the assumptionsthat are made when performing project estimates.
Table II.3. Classification of types of budget estimates
Order of magnitude
Definitive
TYPE
During the initial phase andproject planning, when exact
information is still unavailable.
When the project has moreinformation about the originalconditions and assumptions.
USE
25% to +75%
-5% to +10%
RANGE
Source: Project Management Institute, A Guide to the Project Management Body of Knowledge,(PMBOK® Guide)- Fifth Edition, Project Management Institute, Inc., 2013, page 201.
68T h i s d o c u m e n t i s i n t e l l e c t u a l p r o p e r t y o f t h e I n t e r - A m e r i c a n D e v e l o p m e n t B a n k ( I D B ) a n d t h e I n t e r - A m e r i c a n I n s t i t u t e f o r E c o n o m i c a n d S o c i a l D e v e l o p m e n t ( I N D E S ) . A n y p a r t i a l o r f u l l r e p r o d u c t i o n o f t h i s d o c u m e n t m u s t b e r e p o r t e d t o : B I D - I N D E S @ i a d b . o r g
L E A R N I N G G U I D E - 2 0 1 8

III.4. Outputs
The result of Step 3, the S curve, should be designed in such a way that it is easy to use and interpret, so that it can function as a tool to control resource utilization. An analysis is performed each month (or the period of time defined by the project) to evaluate the project performance in relation to what was planned to determine any variations and make any relevant decisions. It should be emphasized that a poorly-es-timated budget is the responsibility of the project manager. If there are material vari-ations, the project manager needs to justify these to the stakeholders (in particular those that approve finances and that are involved in the project) and propose solu-tions to adjust other project constraints (time and scope) without affecting the rest of the budget, or negotiate the impact of potential significant imbalances in the budget.
Figure II.12 shows the planned resource utilization curve and the actual resource utili-zation curve. Comparisons such as this one allows for deviations to be identified in the project in order to take corrective or preventive measures.
It is important to note that once the plan is approved, as reflected in the S curve, it is fixed as a baseline, which the project management uses to monitor the project, and reports are generated based on this plan; changes can only be made when authorized by the appropriate monitoring mechanism.
M O N T H S
BID
GE
T
Figure II.12. Planned S curve vs. actual S curve
Note: Adapted from Milošević, Dragan Z. (2003). Project Management Toolbox: Tools andTechniques for the Practicing Project Manager, Figure 7-13 S Curve.New Jersey: John Wiley & Sons.
1,200,000
1,000,000
800,000
600,000
400,000
200,000
0
1 2 3 4 5 6 7 8 9 10 11 12
P L A N N E DA C T U A L
69T h i s d o c u m e n t i s i n t e l l e c t u a l p r o p e r t y o f t h e I n t e r - A m e r i c a n D e v e l o p m e n t B a n k ( I D B ) a n d t h e I n t e r - A m e r i c a n I n s t i t u t e f o r E c o n o m i c a n d S o c i a l D e v e l o p m e n t ( I N D E S ) . A n y p a r t i a l o r f u l l r e p r o d u c t i o n o f t h i s d o c u m e n t m u s t b e r e p o r t e d t o : B I D - I N D E S @ i a d b . o r g
L E A R N I N G G U I D E - 2 0 1 8

The S curve allows for project cost variations between what was planned and what was performed to be visually shown. With this information, the manager can deter-mine if the project performance requires adjustments or not. Identifying variations quickly allows for actions to be taken on time and, in doing so, avoids project risks. For example, if the curve shows that expenses are higher than planned, the manager should analyze if the cost estimates in the budget are lower than actual costs. Anoth-er reason for variation can be attributed to starting activities ahead of schedule, which tends to increase initial project costs.
70T h i s d o c u m e n t i s i n t e l l e c t u a l p r o p e r t y o f t h e I n t e r - A m e r i c a n D e v e l o p m e n t B a n k ( I D B ) a n d t h e I n t e r - A m e r i c a n I n s t i t u t e f o r E c o n o m i c a n d S o c i a l D e v e l o p m e n t ( I N D E S ) . A n y p a r t i a l o r f u l l r e p r o d u c t i o n o f t h i s d o c u m e n t m u s t b e r e p o r t e d t o : B I D - I N D E S @ i a d b . o r g
L E A R N I N G G U I D E - 2 0 1 8

Managing a budget requires an estimation and cost classification process that allows for total project costs to be valued, and that will serve as a control and monitoring tool.
There are various estimation techniques, which should be used depending on the type of project and the availability of information.
The S curve is a summary of the budget in relation to its use during the project life cycle and is an important tool for budget control.
U N I T S U M M A R Y
71T h i s d o c u m e n t i s i n t e l l e c t u a l p r o p e r t y o f t h e I n t e r - A m e r i c a n D e v e l o p m e n t B a n k ( I D B ) a n d t h e I n t e r - A m e r i c a n I n s t i t u t e f o r E c o n o m i c a n d S o c i a l D e v e l o p m e n t ( I N D E S ) . A n y p a r t i a l o r f u l l r e p r o d u c t i o n o f t h i s d o c u m e n t m u s t b e r e p o r t e d t o : B I D - I N D E S @ i a d b . o r g
L E A R N I N G G U I D E - 2 0 1 8

B I B L I O G R A P H I C A L R E F E R E N C E S
Fleming, Quentin W. and Joel M. Koppleman (2000).Earned Value Project Manage-ment.2nd edition. United States: Project Management Institute.
Gardiner, Paul (2005).Project Management: A Strategic Planning Approach. New York: Palgrave-Macmillan.
Haugan, Gregory T. (2002).Effective Work Breakdown Structures. Vienna, VA: Man-agement Concepts.
Kloppenborg, Timothy J. (2008).Contemporary Project Management. Mason, OH: South Western Cengage Learning.
Lewis, James P. (1997).Fundamentals of Project Management. New York: AMACOM.
Meredith, Jack and Samuel Mantel (2003).Project Management: A Managerial Approach. 5th edition. New York: John Wiley Ed.
Mulcahy, Rita (2009).PMP Exam Prep. 6th edition in English. United States: RMC Publi-cations.
Pereña Brand, Jaime (2008).Dirección y gestión de proyectos. 2nd edition. Madrid: Ediciones Díaz De Santos.
PM4DEV (2010).Mastering Project Management. United States: PM4DEV.
Project Management Institute (2007).Practice Standard for Work Breakdown Struc-tures. United States: PMI.
Project Management Institute (2013) Guía de los Fundamentos para la Gestión de Proyectos (Guía del PMBOK®)-Quinta Edición. Estados Unidos.
Several Authors (2009). Presentation entitled Integrated Project Management Pro-gram (PGIP), 7-Step Methodology. Washington, DC: IDB.
Verzuh, Eric (2007). The Fast Forward MBA in Project Management. New Jersey: John Wiley & Sons.
72T h i s d o c u m e n t i s i n t e l l e c t u a l p r o p e r t y o f t h e I n t e r - A m e r i c a n D e v e l o p m e n t B a n k ( I D B ) a n d t h e I n t e r - A m e r i c a n I n s t i t u t e f o r E c o n o m i c a n d S o c i a l D e v e l o p m e n t ( I N D E S ) . A n y p a r t i a l o r f u l l r e p r o d u c t i o n o f t h i s d o c u m e n t m u s t b e r e p o r t e d t o : B I D - I N D E S @ i a d b . o r g
L E A R N I N G G U I D E - 2 0 1 8

L I S T O F F I G U R E S
Figure II.1. Process to develop a WBS
Figure II.2. Example of a hierarchical order diagram of the WBS
Figure II.3. Process to create the schedule
Figure II.4. Precedence chart
Figure II.5. Network chart
Figure II.6. Critical path chart
Figure II.7. Gantt Chart
Figure II.8. Schedule compression techniques
Figure II.9. Resource utilization curve
Figure II.10. Process to create an S curve
Figure II.11. Example of an S curve
Figure II.12. Planned S curve vs. actual S curve
48
50
53
56
57
59
59
60
64
64
68
69
L I S T O F TA B L E S
Table II.1. Types of dependencies in a network chart
Table II.2. Distribution of project costs
Table II.3. Classification of types of budget estimates
58
68
68
73T h i s d o c u m e n t i s i n t e l l e c t u a l p r o p e r t y o f t h e I n t e r - A m e r i c a n D e v e l o p m e n t B a n k ( I D B ) a n d t h e I n t e r - A m e r i c a n I n s t i t u t e f o r E c o n o m i c a n d S o c i a l D e v e l o p m e n t ( I N D E S ) . A n y p a r t i a l o r f u l l r e p r o d u c t i o n o f t h i s d o c u m e n t m u s t b e r e p o r t e d t o : B I D - I N D E S @ i a d b . o r g
L E A R N I N G G U I D E - 2 0 1 8

Project management tools (Part II)
CHAPTER 3
74T h i s d o c u m e n t i s i n t e l l e c t u a l p r o p e r t y o f t h e I n t e r - A m e r i c a n D e v e l o p m e n t B a n k ( I D B ) a n d t h e I n t e r - A m e r i c a n I n s t i t u t e f o r E c o n o m i c a n d S o c i a l D e v e l o p m e n t ( I N D E S ) . A n y p a r t i a l o r f u l l r e p r o d u c t i o n o f t h i s d o c u m e n t m u s t b e r e p o r t e d t o : B I D - I N D E S @ i a d b . o r g
L E A R N I N G G U I D E - 2 0 1 8

Chapter three continues the presentation of the basic project management tools, which include: the procurement matrix, the risk matrix, the communications matrix, and the responsibility assignment matrix.
The chapter is organized in four units. The first focuses on the development of a matrix for procuring goods and services for the project; the second, on developing the risk matrix; the third, on developing the matrix for communication with the pro-ject stakeholders; and the fourth unit focuses on the development of the responsibil-ity assignment matrix for the project.
C H A P T E R I N T R O D U C T I O N
75T h i s d o c u m e n t i s i n t e l l e c t u a l p r o p e r t y o f t h e I n t e r - A m e r i c a n D e v e l o p m e n t B a n k ( I D B ) a n d t h e I n t e r - A m e r i c a n I n s t i t u t e f o r E c o n o m i c a n d S o c i a l D e v e l o p m e n t ( I N D E S ) . A n y p a r t i a l o r f u l l r e p r o d u c t i o n o f t h i s d o c u m e n t m u s t b e r e p o r t e d t o : B I D - I N D E S @ i a d b . o r g
L E A R N I N G G U I D E - 2 0 1 8

U N I T I . S T E P 4 : T H E P R O C U R E M E N T M AT R I X
Figure III.1 shows the procurement matrix creation process.
S O U R C E
- Financer- Organization
- Market
I N P U T S
- WBS- Schedule- Contract
- Rules andregulations
- Marketconditions
T E C H N I Q U E S
- Analysis ofrequirements
O U T P U T S
- Procurementmatrix
U S E R
- Project team- Organization
- Financer
Source: Project Management Institute, A Guide to the Project Management Body of Knowledge,(PMBOK® Guide)- Fifth Edition, Project Management Institute, Inc., 2013, Figure 12-2, page 358.
76
Learning objectives
• To identify the steps for creating a procurement matrix.
• To understand the benefits of having a procurement matrix.
I.1. The procurement matrix
The procurement matrix is a guide for managing the contracting for goods or servic-es during the project life and is used as an input to develop the purchasing plan. This plan identifies and defines the goods and services to be acquired, the types of con-tracts that will be used, the contract approval process, and the decision criteria.The matrix also defines the contracting methods�and their time periods�which are specified in the project calendar, and relates these contracts with products and/or deliverables in the WBS. The procurement matrix must be detailed enough to clearly identify the necessary steps and the contracting responsibilities from the beginning to the end of a project. The project manager must ensure that the plan facilitates the procurement process and does not become an overwhelming task.The project man-ager will also work with the project team, the organization's purchasing department, and other key players to manage procurement activities.With the team, the manager defines and identifies all the goods and services that will be acquired for successful project execution.
The main purpose of the procurement matrix is to generally describe all the goods and services required by the project and its relation to the products and/or delivera-bles in the WBS.
T h i s d o c u m e n t i s i n t e l l e c t u a l p r o p e r t y o f t h e I n t e r - A m e r i c a n D e v e l o p m e n t B a n k ( I D B ) a n d t h e I n t e r - A m e r i c a n I n s t i t u t e f o r E c o n o m i c a n d S o c i a l D e v e l o p m e n t ( I N D E S ) . A n y p a r t i a l o r f u l l r e p r o d u c t i o n o f t h i s d o c u m e n t m u s t b e r e p o r t e d t o : B I D - I N D E S @ i a d b . o r g
L E A R N I N G G U I D E - 2 0 1 8

77T h i s d o c u m e n t i s i n t e l l e c t u a l p r o p e r t y o f t h e I n t e r - A m e r i c a n D e v e l o p m e n t B a n k ( I D B ) a n d t h e I n t e r - A m e r i c a n I n s t i t u t e f o r E c o n o m i c a n d S o c i a l D e v e l o p m e n t ( I N D E S ) . A n y p a r t i a l o r f u l l r e p r o d u c t i o n o f t h i s d o c u m e n t m u s t b e r e p o r t e d t o : B I D - I N D E S @ i a d b . o r g
I.2. Inputs
The inputs required for developing the procurement matrix are:
• Work Breakdown Structure (WBS): Information about the project needs and strategies.
• Schedule: Information needed to determine the time periods for the delivery of project results and the requirement of goods and services for the project.
• Rules and regulations of the organization: Regulations on the processes for purchasing goods and services and the financing entity's rules.
• Contract: The clauses of the project contract with the financing entity.
• Market conditions: Information that determines the local options for the pro vision of goods and services.
I.3. Techniques
The team and the project manager together identify all the goods or services to be procured from third parties. This list is based on the WBS information that identifies the project deliverables. In some cases, the project team may have the support of experts in identifying the components and technical specifications of each good or service. The list helps in planning the times for the start of contracting, and thus helps meet the schedule.
The project must define the system that will be used to procure goods and services; in many cases this will depend on purchase amounts. The maximum amounts may also be objected to by the organization and/or the financing entity’s procurement unit, the main objective of which is to guarantee transparency, equity, speed, and efficiency in the procurement process.
The procurement systems are:
1. Public bidding: A formal, competitive procedure by means of which bids for the acquisition of goods, works, or services are publicly solicited, received, and eval-uated and the respective contract is awarded to the bidder that offers the most advantageous proposal. This system has two modes:
a) Domestic public bidding: It is only advertised domestically; it may be the most effective and low-cost system when, given the type and amount (local or financers’ regulations) of procurement, international competition is not necessary.
b) International public bidding: It is advertised internationally.
L E A R N I N G G U I D E - 2 0 1 8

2. Private bidding: Only certain companies are invited to participate; no public announcement is made.
3. Price comparison: Price quotes are obtained from three or more domestic or foreign vendors.
4. Direct contracting: Contracting with a firm without following a competitive process.
5. Direct administration: The borrower itself executes a certain work, using its own personnel and machinery.
Steps for creating the procurement matrix
• Make a complete list of the goods and services to be procured for the project.
• Determine the procurement system.
• Determine the percentage of the source of financing for procurement.
• Calculate an estimated budget.
• Establish the estimated date for advertising the procurement process.
• Agree on the date for signing the contract.
• Establish the estimated contract termination date.
The matrix is summarized in a list that facilitates tracking the procurement of the various goods and services required by the project. It is also an input for creating a procurement plan, which should be updated regularly, after consulting with the pro-curement unit and/or the financing entity regarding any change in the dates or allo-cated budgets.
78T h i s d o c u m e n t i s i n t e l l e c t u a l p r o p e r t y o f t h e I n t e r - A m e r i c a n D e v e l o p m e n t B a n k ( I D B ) a n d t h e I n t e r - A m e r i c a n I n s t i t u t e f o r E c o n o m i c a n d S o c i a l D e v e l o p m e n t ( I N D E S ) . A n y p a r t i a l o r f u l l r e p r o d u c t i o n o f t h i s d o c u m e n t m u s t b e r e p o r t e d t o : B I D - I N D E S @ i a d b . o r g
L E A R N I N G G U I D E - 2 0 1 8

Table III.1. Procurement matrix
F E C H A S E S T I M A D A S
W B S C O D E
1.1.1
1.1.2
1.1.3
1.1.4
O U T P U T O RD E L I V E R A B L E
Trainedteam
Project planscompleted
Project portalinstalled
Project portalContent published
P R O C U R E M E N TT Y P E
Services
Services
Goods
Services
Publicbidding
Privatebidding
Directcontracting
Directadministration
P R O C U R E M E N TM O D E S TA R T
1/1/2012
10/1/2012
10/2/2012
21/4/2012
E N D
10/1/2012
10/2/2012
20/4/2012
30/6/2012
E S T I M AT E DB U D G E T
$50.000,00
$50.000,00
$50.000,00
$50.000,00
Source: Compiled by authors
I.4. Outputs
As a result of the analysis of requirements, the project has a matrix that determines the method, amounts, dates, and sources of financing for each project purchase. This matrix should be updated regularly, especially if there are changes in the project schedule or budget.
The matrix is more than a list, since it makes it possible to identify the sequence of activities for each type of procurement method and helps the organization's procure-ment unit plan and adhere to the project schedule.
The benefit to the project of having a procurement matrix is that it has easily accessi-ble information that makes it possible to properly monitor the procurement plan and ensure that the project meets the requirements, rules, and policies established by the organization and the project financing entity. The matrix makes it possible to maintain a level of confidence and certainty in the procurement process and avoid any risk related to the improper use of project resources.
79T h i s d o c u m e n t i s i n t e l l e c t u a l p r o p e r t y o f t h e I n t e r - A m e r i c a n D e v e l o p m e n t B a n k ( I D B ) a n d t h e I n t e r - A m e r i c a n I n s t i t u t e f o r E c o n o m i c a n d S o c i a l D e v e l o p m e n t ( I N D E S ) . A n y p a r t i a l o r f u l l r e p r o d u c t i o n o f t h i s d o c u m e n t m u s t b e r e p o r t e d t o : B I D - I N D E S @ i a d b . o r g
L E A R N I N G G U I D E - 2 0 1 8
The procurement matrix is a living document. It is the most important tool for the procurement plan, since it identifies and defines the goods and services that must be obtained and their relation to the products and/or services in the WBS.
This matrix makes it possible to develop a detailed procurement plan and enables the project to plan the steps required to obtain the goods and services in accordance with the procurement rules and policies of the organization and the project financing entity. The matrix lists,in an aggregated way, the dates for the start of the procure-ment process and delivery of the goods and services.
The matrix is also a tool that communicates the status of procurement to all stake-holders and makes it possible for the project and the organization's procurement unit to coordinate their activities.
U N I T S U M M A R Y
80T h i s d o c u m e n t i s i n t e l l e c t u a l p r o p e r t y o f t h e I n t e r - A m e r i c a n D e v e l o p m e n t B a n k ( I D B ) a n d t h e I n t e r - A m e r i c a n I n s t i t u t e f o r E c o n o m i c a n d S o c i a l D e v e l o p m e n t ( I N D E S ) . A n y p a r t i a l o r f u l l r e p r o d u c t i o n o f t h i s d o c u m e n t m u s t b e r e p o r t e d t o : B I D - I N D E S @ i a d b . o r g
L E A R N I N G G U I D E - 2 0 1 8

Learning objectives
• To identify the project risk management processes.
• To know the definitions of risks, probability, and impact, and identify the inputs needed to recognize and quantify the project risks. To know the techniques for classifying the project risks by means of a Risk Breakdown Structure (RBS) and understand the elements of a risk mitigation plan and the importance of constantly updating it.
II.1. The risk matrix
Project risks
The identification, analysis, and classification of risks enable the manager to have information for prompt detection of their causes and potential consequences for the project objectives and expected resultsto eliminate or mitigate the risks and their consequences.
Some basic definitions 5
Risk management is defined as the set of processes that enable the parties involved in the project results and impacts to understand and recognize the scenarios of uncertainty, assess the consequences of those scenarios, and take coordinated, cost-effective actions to address the risks and track those actions.
Risk is the foreseen or unforeseen event(s) that could affect the achievement of the project objectives and expected results. It is generally expressed in terms of the con-sequences of the events (impact) and the probability of their occurrence. Risks in development projects originate in the uncertainty present in all projects.
5 Project Management Institute, A Guide to the Project Management Body of Knowledge, (PMBOK® Guide)- Fifth Edition, Project Management Institute, Inc., 2013, pages 314-353.
U N I T I I . S T E P 5 : T H E R I S K M AT R I X
81T h i s d o c u m e n t i s i n t e l l e c t u a l p r o p e r t y o f t h e I n t e r - A m e r i c a n D e v e l o p m e n t B a n k ( I D B ) a n d t h e I n t e r - A m e r i c a n I n s t i t u t e f o r E c o n o m i c a n d S o c i a l D e v e l o p m e n t ( I N D E S ) . A n y p a r t i a l o r f u l l r e p r o d u c t i o n o f t h i s d o c u m e n t m u s t b e r e p o r t e d t o : B I D - I N D E S @ i a d b . o r g
L E A R N I N G G U I D E - 2 0 1 8

A risk in a project is an event or condition whichmay have anegative or positive effect in one or more project objectives, such as time,cost, and quality. This is why risks with a negative anda positive impact are also known as threats and opportunities, respectively. There are known risks, in other words, those that have been identified and for which it is possible to plan actions to reduce their impact. However, there are also unknown risks, which cannot be managed proactively.
In some cases, projects may view certain risks as opportunities to improve the possi-bility of success. For example, the use of an expeditious project methodology may entail the risk of increasing the cost, but there may be a benefit from completing the project ahead of schedule. In these cases, a manager analyzes and calculates the costs and benefits of taking an action and evaluates the risks in terms of the potential benefits.
Probability is a parameter that measures the likelihood that a risk will occur. The data used to consider the probability of risks in the project come from historical informa-tion, statistical data on risks in similar projects, and expert opinions.
Impact is the effect�positive or negative�of a risk on the project objectives, and is measured as a factor of its importance to the project. The objectives are related to three project constraints:
• Cost: A risk that involves an increase in project costs or a saving.
• Time: A risk that entails an increase in the project duration and, consequently, a delay in its conclusion, or a risk that entails finishing the project ahead of schedule.
• Scope: A risk that affects the project scope.
• Quality: Failure to meet the stakeholders’ requirements.
Risks are always defined as a probability that they may or may not occur during the project life. The objective is not merely to identify the risks and prepare action plans, but to take a proactive attitude and initiate actions that will reduce their impact on the project, especially for risks that are more likely to occur. To succeed, the team must be committed to managing risks proactively and consistently throughout the project life cycle.
82T h i s d o c u m e n t i s i n t e l l e c t u a l p r o p e r t y o f t h e I n t e r - A m e r i c a n D e v e l o p m e n t B a n k ( I D B ) a n d t h e I n t e r - A m e r i c a n I n s t i t u t e f o r E c o n o m i c a n d S o c i a l D e v e l o p m e n t ( I N D E S ) . A n y p a r t i a l o r f u l l r e p r o d u c t i o n o f t h i s d o c u m e n t m u s t b e r e p o r t e d t o : B I D - I N D E S @ i a d b . o r g
L E A R N I N G G U I D E - 2 0 1 8
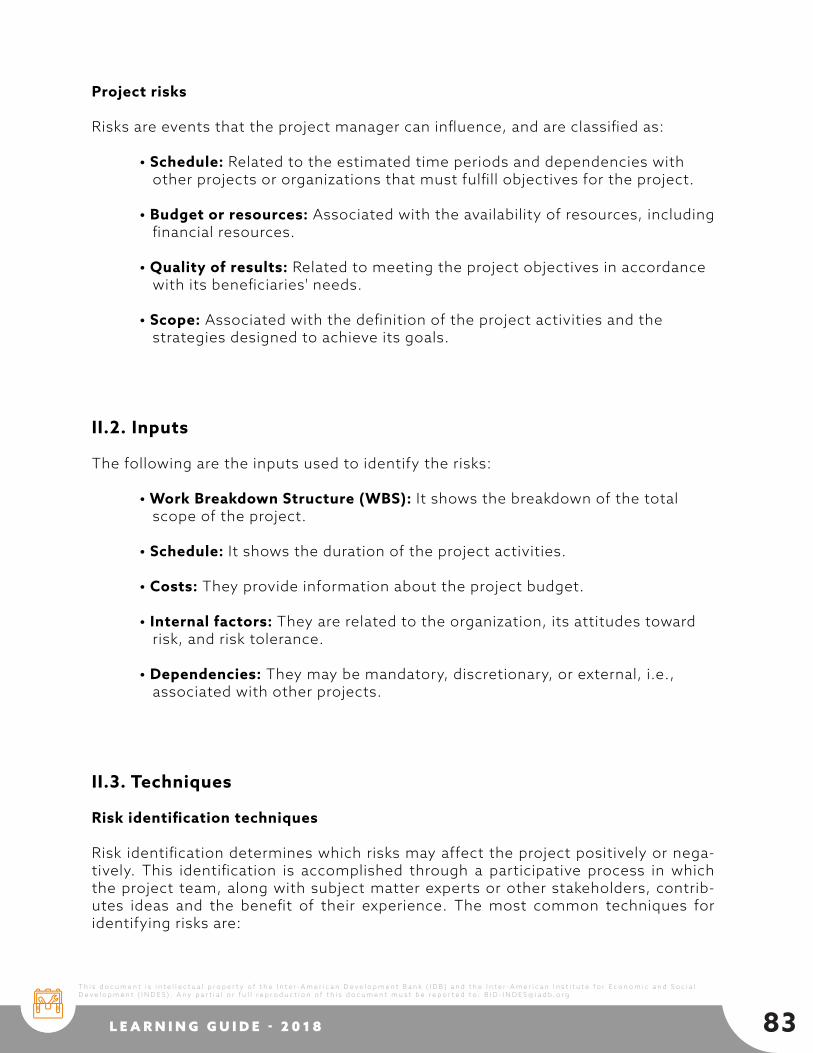
Project risks
Risks are events that the project manager can influence, and are classified as:
• Schedule: Related to the estimated time periods and dependencies with other projects or organizations that must fulfill objectives for the project.
• Budget or resources: Associated with the availability of resources, including financial resources.
• Quality of results: Related to meeting the project objectives in accordance with its beneficiaries' needs.
• Scope: Associated with the definition of the project activities and the strategies designed to achieve its goals.
II.2. Inputs
The following are the inputs used to identify the risks:
• Work Breakdown Structure (WBS): It shows the breakdown of the total scope of the project.
• Schedule: It shows the duration of the project activities.
• Costs: They provide information about the project budget.
• Internal factors: They are related to the organization, its attitudes toward risk, and risk tolerance.
• Dependencies: They may be mandatory, discretionary, or external, i.e., associated with other projects.
II.3. Techniques
Risk identification techniques
Risk identification determines which risks may affect the project positively or nega-tively. This identification is accomplished through a participative process in which the project team, along with subject matter experts or other stakeholders, contrib-utes ideas and the benefit of their experience. The most common techniques for identifying risks are:
83T h i s d o c u m e n t i s i n t e l l e c t u a l p r o p e r t y o f t h e I n t e r - A m e r i c a n D e v e l o p m e n t B a n k ( I D B ) a n d t h e I n t e r - A m e r i c a n I n s t i t u t e f o r E c o n o m i c a n d S o c i a l D e v e l o p m e n t ( I N D E S ) . A n y p a r t i a l o r f u l l r e p r o d u c t i o n o f t h i s d o c u m e n t m u s t b e r e p o r t e d t o : B I D - I N D E S @ i a d b . o r g
L E A R N I N G G U I D E - 2 0 1 8

• Brainstorming: In one or more sessions, the participants generate a list of risks, which may occur, based on the objectives, scope, schedule, budget, and other project conditions. This list may be divided into risk categories.
• SWOT Analysis: Project strengths, weaknesses, opportunities, and threats are analyzed to identify the risks.
• Delphi technique: It seeks to reach consensus based onthe information provided by experts through questionnaires. The conclusions are drawn based on statistics from the data obtained.
Risk identification and classification
The project manager or a facilitator can guide the process of identifying project risks. This process can be facilitated with the use of a Risk Breakdown Structure (RBS), which identifies the different areas where risks may arise. Figure III.2shows an exam-ple of an RBS.
Each identified risk should have information about its characteristics, since that will help define its probability and analyze its impact on the project. The classification of risks provides a structure that guarantees a complete process of systematic identifi-cation with a uniform level of detail. It also helps enhance the quality and effective-ness of risk identification and the possible analysis and quantification of risks.
It is a good practice to review the various classifications during risk identification. It may be necessary to adapt, adjust, or expand the classifications based on previous projects before those categories can be used in the current project.
Figure III.2. Example of a risk breakdown structure
Source: Compiled by author
Risk
Tec hni c a l Sc o pe
M anagement Sc hedul e
Qual i t y B udget
84T h i s d o c u m e n t i s i n t e l l e c t u a l p r o p e r t y o f t h e I n t e r - A m e r i c a n D e v e l o p m e n t B a n k ( I D B ) a n d t h e I n t e r - A m e r i c a n I n s t i t u t e f o r E c o n o m i c a n d S o c i a l D e v e l o p m e n t ( I N D E S ) . A n y p a r t i a l o r f u l l r e p r o d u c t i o n o f t h i s d o c u m e n t m u s t b e r e p o r t e d t o : B I D - I N D E S @ i a d b . o r g
L E A R N I N G G U I D E - 2 0 1 8

The risk matrix
This tool makes it possible to capture the most important information about the identified risks and classify them according to their likelihood of occurrence and their level of impact on the project.
Figure III.3 shows the risk matrix creation process.
The risk matrix has eight columns, corresponding to the following elements:
1. Risk identification number.
2. Component/Output: Based on the WBS.
3. Type of risk: Risk classification or taxonomy.
4. Risk: Description of the risk.
5. Impact: Value that determines the impact on the project. It is measured on a scale of 1-3, with 1 being the lowest and 3 the highest.
6. Probability: Value that determines the likelihood of the risk occurrence. Like impact, it is measured on a scale of 1-3.
7. Rating: Value which makes it possible to rate the risk by impact and probability of occurrence. It is calculated by multiplying the impact value by the probability.
8. Classification: Value which makes it possible to rank the risks according to their value and level.
Figure III.3. Risk matrix development process
S O U R C E
- Financer- Organization
I N P U T S
- WBS- Schedule- Budget
- Stakeholdersmatriz
- Historicalinformation
T E C H N I Q U E S
- Risk identification,analyisis andquanification
- Risk classification
O U T P U T S
- Risk matrix- Risk contingency
plan
U S E R
- Project team- Organization
- Financer
Source: Project Management Institute, A Guide to the Project Management Body of Knowledge,(PMBOK® Guide)- Fifth Edition, Project Management Institute, Inc., 2013, Figure 11-2, page 313.
85T h i s d o c u m e n t i s i n t e l l e c t u a l p r o p e r t y o f t h e I n t e r - A m e r i c a n D e v e l o p m e n t B a n k ( I D B ) a n d t h e I n t e r - A m e r i c a n I n s t i t u t e f o r E c o n o m i c a n d S o c i a l D e v e l o p m e n t ( I N D E S ) . A n y p a r t i a l o r f u l l r e p r o d u c t i o n o f t h i s d o c u m e n t m u s t b e r e p o r t e d t o : B I D - I N D E S @ i a d b . o r g
L E A R N I N G G U I D E - 2 0 1 8

Table III.2. Risk matrix example
C L A S S I F I C AT I O N
N º C / O T Y P E O FR I S K
Newtechnology
Externaldependencies
Use ofproject control
techniques
Changes inrequirements
1
2
3
4
Technical
Schedule
Experience
Scope
3
3
2
3
3
2
2
1
9
6
4
3
3
3
2
2
Alto
Alto
Medio
Medio
R I S K VA L U E L E V E L
Source: Modification ofthe GPR Table Appendix 503. GPR, IDB Workshop Presentation
I CP
To facilitate risk assessment, tables can be used to assign values that determine the probability and impact of this risk. Probability can be classified using a simple three-level scale, wherein each level has a predetermined value (Table III.3).
Impact may be classified using a three-level scale (Table III.4).
Table III.3. Classification of probability
High
Average
LEVEL
There are risk factors (previous experience orevaluation results) that together indicate a
high probability of occurrence.
The risk could occur, but there areno factors indicating highlikelihood of occurrence.
MEANING
3
2
Low
Experience makes it possible to concludethat the possibility of risk occurrence
is low, or it may not provide sufficient basisto consider it an average or high level.
1
VALUE
Source: GPR Appendix 5-3. IDB Workshop Presentation, Risk Management in Projects with Sovereign Guarantee, IDB
86T h i s d o c u m e n t i s i n t e l l e c t u a l p r o p e r t y o f t h e I n t e r - A m e r i c a n D e v e l o p m e n t B a n k ( I D B ) a n d t h e I n t e r - A m e r i c a n I n s t i t u t e f o r E c o n o m i c a n d S o c i a l D e v e l o p m e n t ( I N D E S ) . A n y p a r t i a l o r f u l l r e p r o d u c t i o n o f t h i s d o c u m e n t m u s t b e r e p o r t e d t o : B I D - I N D E S @ i a d b . o r g
L E A R N I N G G U I D E - 2 0 1 8

Table III.4. Impact classification
High
Average
LEVEL
Critical effect on projectresults and sustainability.
Although the consequence is consideredsignificant, its significance is less
than in the high level.
MEANING
3
2
Low
The effect is not considered significant, orthere are insufficient reasons to believe
that the risk is a threat to the results.1
VALUE
Source: GPR Appendix 5-3. IDB Workshop Presentation, Risk Management in Projects with Sovereign Guarantee, IDB
Once the risk matrix is completed and the risks have been identified and quantified in accordance with their level of impact and probability, the project manager should develop a chart of risks that will enable him to identify those that require mitigation actions. The following risk analysis matrix organizes the risk classification values by their levels of impact and probability (Figure III.4). The values are obtained by multi-plying the impact value by the probability value.
Figure III.4. Risk classification matrix
Source: Several authors. (2009).Presentation: IntegratedProject Management Program, 7-Step Methodology. Washington, DC: IDB
1 32
2 64
3 96
IMP
AC
T
PROBABILITY
87T h i s d o c u m e n t i s i n t e l l e c t u a l p r o p e r t y o f t h e I n t e r - A m e r i c a n D e v e l o p m e n t B a n k ( I D B ) a n d t h e I n t e r - A m e r i c a n I n s t i t u t e f o r E c o n o m i c a n d S o c i a l D e v e l o p m e n t ( I N D E S ) . A n y p a r t i a l o r f u l l r e p r o d u c t i o n o f t h i s d o c u m e n t m u s t b e r e p o r t e d t o : B I D - I N D E S @ i a d b . o r g
L E A R N I N G G U I D E - 2 0 1 8

The risks whose values are classified between 6 and 9 need action to eliminate, trans-fer, or mitigate the risk impact on the project. Table III.5 helps to determine the pro-ject actions for the different risk levels.
Risk classification makes it possible to identify the risks which would have a major impact on the project, and thus to be able to implement mitigation actions with a view to improving opportunities and reducing threats. It is neither practical nor finan-cially viable to implement mitigation actions for all risks.
Table III.5. Project actions for the different risk levels
6 and 9
3 and 4
VALUE
Manage: Mitigationactions required.
Monitor: The project must trackthe risk to analyze whether
the probability or impact has changed.
ACTIONS
High
Average
1 and 2Accept: It is better to accept the risk
because the impact is insignificant andthe probability of occurrence is low.
Low
LEVEL
Source: GPR Appendix 5-3. IDB Workshop Presentation, Risk Management in Projects with Sovereign Guarantee, IDB
88T h i s d o c u m e n t i s i n t e l l e c t u a l p r o p e r t y o f t h e I n t e r - A m e r i c a n D e v e l o p m e n t B a n k ( I D B ) a n d t h e I n t e r - A m e r i c a n I n s t i t u t e f o r E c o n o m i c a n d S o c i a l D e v e l o p m e n t ( I N D E S ) . A n y p a r t i a l o r f u l l r e p r o d u c t i o n o f t h i s d o c u m e n t m u s t b e r e p o r t e d t o : B I D - I N D E S @ i a d b . o r g
L E A R N I N G G U I D E - 2 0 1 8

Risk mitigation planning
Once the project team has analyzed the potential risks based on their impact and probability, mitigation actions should be planned. The decisions concerning these actions are based mainly on finding a balance between the cost of mitigating a risk and its potential impact. In many cases, the mitigation cost could be higher than the project cost if the risk were to occur.
Risk mitigation planning is the process of developing alternatives and defining actions to decrease the impact and/or probability of occurrence of threats and boost the impact and/or probability of opportunities. Risk mitigation actions must be con-sistent with the importance of the risk, applied at the proper time, realistic, agreed to by all the involved parties, and cost-effective in relation to the risk.
The four strategies for mitigating risks with a negative impact (threats) are the following:
• Avoiding: Making plan changes to eliminate risks. This may involve changing the schedule or the scope of the project to eliminate the threat of the risk.
• Transferring: Assigning the entire risk to third parties and make them responsible for mitigation.
• Mitigating: Decreasing the probability and/or impact that the risk will occur.
• Accepting: Not taking any action unless the risk occurs. This strategy is suitable when it is not feasible or profitable to address the risk otherwise. Acceptance may be of two types: passive, i.e., no action is taken, or active, i.e. a time or money contingency is reserved.
Mitigation actions or strategies for risks with a positive impact (opportunities) are the following:
• Exploiting: Materializing the opportunity.
• Enhancing: Increasing the probability and/or impact of an opportunity.
• Sharing: Passing the opportunity on to a third party that will seize it to benefit the project.
• Accepting: Seizing the opportunity without having done anything to create it.
89T h i s d o c u m e n t i s i n t e l l e c t u a l p r o p e r t y o f t h e I n t e r - A m e r i c a n D e v e l o p m e n t B a n k ( I D B ) a n d t h e I n t e r - A m e r i c a n I n s t i t u t e f o r E c o n o m i c a n d S o c i a l D e v e l o p m e n t ( I N D E S ) . A n y p a r t i a l o r f u l l r e p r o d u c t i o n o f t h i s d o c u m e n t m u s t b e r e p o r t e d t o : B I D - I N D E S @ i a d b . o r g
L E A R N I N G G U I D E - 2 0 1 8

II.4. Outputs
The risk matrix is a tool that provides information that enables the project to employ a more strategic approach to the use of resources to prevent, transfer, or mitigate risks.
With a complete risk matrix, the manager will be able to plan the actions needed to mitigate the risks that are of the highest priority for the project. To do this, the man-ager can use the Risk Mitigation Matrix (RMM) to identify the actions that will be taken to prevent, transfer, or mitigate the critical risks, determine who is responsible for carrying them out, specify a budget and schedule for their execution, and check the results of the actions based on the result indicators.
The risk mitigation matrix consists of the following elements:
• Risk identification.
• Description of the mitigation activity.
• Allocated budget.
• Mitigation action starting date.
• Estimated mitigation action ending date.
• Name of responsible party or owner of the mitigation action.
• Indicator of compliance that determines whether the actions were implement-ed correctly.
Project risks are not static. In other words, the assumptions used to determine the risk probability and impact change as the project moves forward. Besides, new risks may appear throughout the project life cycle. The manager and the team must con-stantly monitor the conditions and assumptions about the risks to determine wheth-er they are undergoing changes that needreclassification on the basis of the original information and to identify new risks.The manager should periodically review the information about the project risks to update the probability and impact levels.
90T h i s d o c u m e n t i s i n t e l l e c t u a l p r o p e r t y o f t h e I n t e r - A m e r i c a n D e v e l o p m e n t B a n k ( I D B ) a n d t h e I n t e r - A m e r i c a n I n s t i t u t e f o r E c o n o m i c a n d S o c i a l D e v e l o p m e n t ( I N D E S ) . A n y p a r t i a l o r f u l l r e p r o d u c t i o n o f t h i s d o c u m e n t m u s t b e r e p o r t e d t o : B I D - I N D E S @ i a d b . o r g
L E A R N I N G G U I D E - 2 0 1 8

The project risks are uncertain events or conditions that impact positively or nega-tively at least one project constraint: scope, time, or cost.
The purpose of the risk matrix is to identify and quantify the risks to manage themin a way that decreases the probability and/or impact of threats and increases the prob-ability and/or impact of opportunities.
Much of risk management consists in preparing a contingency plan, also called strat-egies, for which it is very important to identify risks in advance using methods like brainstorming. As risks occur, they must be confronted and managed appropriately. One could say that the speed with which risks are managed is the other major focus of proper risk management.
The risk matrix is a very helpful tool formanaging risks. It facilitates risk identification and analysis as a part of planning and maximizes opportunities to ensure that risks are managed timely, so that threats have a minimum negative impact on the project and opportunities materialize.
U N I T S U M M A R Y
91T h i s d o c u m e n t i s i n t e l l e c t u a l p r o p e r t y o f t h e I n t e r - A m e r i c a n D e v e l o p m e n t B a n k ( I D B ) a n d t h e I n t e r - A m e r i c a n I n s t i t u t e f o r E c o n o m i c a n d S o c i a l D e v e l o p m e n t ( I N D E S ) . A n y p a r t i a l o r f u l l r e p r o d u c t i o n o f t h i s d o c u m e n t m u s t b e r e p o r t e d t o : B I D - I N D E S @ i a d b . o r g
L E A R N I N G G U I D E - 2 0 1 8

Learning objectives
• To understand the need for good communication requirements on the part of the project stakeholders.
• To know the steps for creating a communications matrix
III.1. The communications matrix
The main objective of project communication is to ensure that information is gener-ated with the appropriate quality and breadth and that it reaches the various stake-holders at the proper time.
The project manager bears ultimate responsibility for developing and implementing the communications matrix. This matrix addresses the project stakeholders' needs and establishes what information will be given and how often to the involved parties, since each has a different interest in the project and a different need for information. Thus, information must be presented in various formats and at different times. The communications matrix contains a description of all the information that must be conveyed to the various project stakeholders. The matrix identifies the parties who will be responsible for collecting, editing, and distributing the information. This is especially important for the project financers, which have specific information needs and criteria concerning the presentation format. Dissemination of information goes beyond the act of furnishing it, since it includes steps for ensuring that the target audience receives and understands the information. This is important, especially when reports are prepared for the project financers or to comply with local regula-tions or laws.
U N I T I I I . S T E P 6 : T H E C O M M U N I C AT I O N S M AT R I X
Figure III.5. Communications matrix development process
S O U R C E
- Financer- Organization
I N P U T S
- Stakeholdersmatrix
- Schedule- Organizational
factors
T E C H N I Q U E S
- Analysis ofcommunications
requirements
O U T P U T S
- Communicationsmatrix
U S E R
- Stakeholders- Financers
Source: Project Management Institute, A Guide to the Project Management Body of Knowledge,(PMBOK® Guide)- Fifth Edition, Project Management Institute, Inc., 2013, Figure 10-2, page 289.
92T h i s d o c u m e n t i s i n t e l l e c t u a l p r o p e r t y o f t h e I n t e r - A m e r i c a n D e v e l o p m e n t B a n k ( I D B ) a n d t h e I n t e r - A m e r i c a n I n s t i t u t e f o r E c o n o m i c a n d S o c i a l D e v e l o p m e n t ( I N D E S ) . A n y p a r t i a l o r f u l l r e p r o d u c t i o n o f t h i s d o c u m e n t m u s t b e r e p o r t e d t o : B I D - I N D E S @ i a d b . o r g
L E A R N I N G G U I D E - 2 0 1 8

III.2. Inputs
The inputs needed to develop the communications matrix are:
• Stakeholders matrix: It contains information on the project’s most important stakeholders. This information is one of the bases for determining the main recipients of project communications.
• Schedule: It includes information for determining the time periods for the delivery of project reports and communications.
• Organizational factors: They determine the internal project obligations for communication at the executive levels and with other entities.
III.3. Techniques
The communications matrix determines the information and communication needs of those involved in the project. In general, the matrix defines the medium to be used for communication, specifies the method for collecting information, the distribution lists of the various reports that must be disseminated, the formats for producing the information with the appropriate quantity and quality, and the schedule for updating reports.
Analysis of communication requirements
Analyzing the requirements entails identifying all the stakeholders' information needs. This includes defining the necessary types of data and formats, since what is involved is not just recognizing the needs but also the stakeholders who are to receive information, as a strategy for obtaining their support or maintaining their interest in the project. The requirements define, above all, the format, frequency, and content of communication, and the medium that the project will employ to facili-tate its distribution.
Project resources are used only to convey information that will contribute to success or fulfill a contractual or legal need. It is important to emphasize that the project has limited resources, which must be used strategically to convey the most precise, rele-vant, and high-value information. It is not necessary to convey information that is not indispensable, since in many cases too much information can be a disincentive to the stakeholders.The steps for creating the communications matrix are the following:
93T h i s d o c u m e n t i s i n t e l l e c t u a l p r o p e r t y o f t h e I n t e r - A m e r i c a n D e v e l o p m e n t B a n k ( I D B ) a n d t h e I n t e r - A m e r i c a n I n s t i t u t e f o r E c o n o m i c a n d S o c i a l D e v e l o p m e n t ( I N D E S ) . A n y p a r t i a l o r f u l l r e p r o d u c t i o n o f t h i s d o c u m e n t m u s t b e r e p o r t e d t o : B I D - I N D E S @ i a d b . o r g
L E A R N I N G G U I D E - 2 0 1 8

• The project manager contacts the principal stakeholders to learn what the communication requirements are. Many of these requirements may already be defined in the project documents�e.g., the obligation to the project financing entity. In other cases, the various stakeholders should be inter viewed to determine their needs.
• The requirements of each stakeholder, including the project internal communication requirements, are listed. These are grouped as follows:
o Objective: It includes the main message and the specific data required for communication, i.e., what do we communicate? It also determines why the project must distribute the communication. In some cases, it will be in compliance with project obligations; in others, to support the strategies for managing relationships with the various stakeholders.
o User: It indicates the name of the person or groups that will receive the communication. It also describes the method to be used to send the communication; for example, e-mail, in-person presentations, recording, and other means that the stakeholders or the project have defined as standard, including the formats for delivery.
o Responsibility: It indicates the name of the person or member of the project team who will be responsible for preparing the communication and sending the information.
o Time: It indicates the requirements that define the frequency of communication. This includes the initial dissemination date and the dissemination frequency.
The understanding of the stakeholders' requirements is set forth in writing to avoid misunderstandings that could cause problems to the project. To that end, the stake-holders should conduct a review and inform the project manager on any change to their requirements in the matrix, including communication content, method, and frequency.
94P A R T I C I P A N T ’ S G U I D E - 2 0 1 8
T h i s d o c u m e n t i s i n t e l l e c t u a l p r o p e r t y o f t h e I n t e r - A m e r i c a n D e v e l o p m e n t B a n k ( I D B ) a n d t h e I n t e r - A m e r i c a n I n s t i t u t e f o r E c o n o m i c a n d S o c i a l D e v e l o p m e n t ( I N D E S ) . A n y p a r t i a l o r f u l l r e p r o d u c t i o n o f t h i s d o c u m e n t m u s t b e r e p o r t e d t o : B I D - I N D E S @ i a d b . o r gT h i s d o c u m e n t i s i n t e l l e c t u a l p r o p e r t y o f t h e I n t e r - A m e r i c a n D e v e l o p m e n t B a n k ( I D B ) a n d t h e I n t e r - A m e r i c a n I n s t i t u t e f o r E c o n o m i c a n d S o c i a l D e v e l o p m e n t ( I N D E S ) . A n y p a r t i a l o r f u l l r e p r o d u c t i o n o f t h i s d o c u m e n t m u s t b e r e p o r t e d t o : B I D - I N D E S @ i a d b . o r g
L E A R N I N G G U I D E - 2 0 1 8

Table III.6. Communications matrix
Source: Several authors (2009).Presentation: Integrated Project Management Program, 7-Step Methodology. Washington, DC: IDB
O B J E C T I V E U S E R R E S P O N S I B I L I T Y T I M EW
HA
T T
OC
OM
MU
NIC
AT
E?
Projectoprogress
reportControl Supervisor Written in
format Coordinator Manager January 1 Every 3months
WH
Y?
REC
IPIE
NT
CO
MM
UN
ICA
TIO
NM
ETH
OD
PR
EPA
RA
TIO
N
SEN
DIN
G
STA
RT
DA
TE
FREQ
UEN
CY
III.4. Outputs
The result of the process is a communications matrix that describes the stakeholders' communication requirements and the actions of the parties responsible for the pro-ject to ensure that the correct communication reaches the right person at the appro-priate time.
A complete communication plan requires a feedback process to fine tune the stake-holders’ information needs and improve content, frequency, formats, and delivery methods.
The matrix is more than a list of what the project communicates; it is a strategy that makes it possible to focus resources on the most important communications. A good matrix will enable the project and its stakeholders to receive practical, reliable, and, above all, pertinent information in relation to the needs of the various involved par-ties who make their decisions and form their opinions based on the communications they receive.
95T h i s d o c u m e n t i s i n t e l l e c t u a l p r o p e r t y o f t h e I n t e r - A m e r i c a n D e v e l o p m e n t B a n k ( I D B ) a n d t h e I n t e r - A m e r i c a n I n s t i t u t e f o r E c o n o m i c a n d S o c i a l D e v e l o p m e n t ( I N D E S ) . A n y p a r t i a l o r f u l l r e p r o d u c t i o n o f t h i s d o c u m e n t m u s t b e r e p o r t e d t o : B I D - I N D E S @ i a d b . o r g
L E A R N I N G G U I D E - 2 0 1 8

The main objective of communication is to ensure that all the project information meets appropriate standards for quality and breadth and reaches the various stake-holders at the proper time in accordance with their requirements.
Successful communication depends largely on the responsibility and skill of the pro-ject manager, who uses the communications matrix, which contains a detailed description of all the information requirements of the project participants and stake-holders.
The practice of identifying those who will be responsible for collecting, editing, and distributing the information is one of the most vital aspects of the communication process, because the information should, ideally, be verified and reliable.
The communications matrix is a guide for satisfying the communication needs of the various stakeholders. Therefore, it presents, in a simple and easy-to-use manner, the requirements concerning who needs what information and when, how it will be pro-vided, and by whom. Correctly identifying the stakeholders' information needs and determining the appropriate way to satisfy those needs is an important factor for project success.
U N I T S U M M A R Y
97T h i s d o c u m e n t i s i n t e l l e c t u a l p r o p e r t y o f t h e I n t e r - A m e r i c a n D e v e l o p m e n t B a n k ( I D B ) a n d t h e I n t e r - A m e r i c a n I n s t i t u t e f o r E c o n o m i c a n d S o c i a l D e v e l o p m e n t ( I N D E S ) . A n y p a r t i a l o r f u l l r e p r o d u c t i o n o f t h i s d o c u m e n t m u s t b e r e p o r t e d t o : B I D - I N D E S @ i a d b . o r g
L E A R N I N G G U I D E - 2 0 1 8

Learning objectives
• To plan the human resources requirements for executing the project based on the WBS and define the necessary profiles and skills.
• To assign responsibilities to the project team members for the delivery and achievement of each work package.
IV.1. Assignment of responsibilities
Human Resource (HR) management consists in carrying out all the necessary pro-cesses to ensure that the best available human resources have been identified and assigned to achieve all the project objectives within their respective constraints of time, scope, and cost. One of the most-used tools in HR management is the Respon-sibility Assignment Matrix (RAM). This matrix is used to show the connections among the work that must be accomplished and the members of the project team and other stakeholders. It also identifies what project team group or unit is responsible for each component of the WBS. With the matrix, the manager has information that enables him to identify the roles, responsibilities, and levels of authority for the specific pro-ject activities. Figure III.6 shows the process to create a responsibility matrix.
U N I T I V . S T E P 7 : T H E R E S P O N S I B I L I T Y A S S I G N M E N T M AT R I X
Figure III.6. Responsibility assignment matrix creation process
S O U R C E
- Financer- Organization
I N P U T S
- WBS- Schedule
- Risks- Organiztional
factors
T E C H N I Q U E S
- Identificationof roles
- Analysis offunctions and skills
O U T P U T S
- Responsibilityassigment matrix
U S E R
- Project team- Organization
- Financer
Source: Project Management Institute, A Guide to the Project Management Body of Knowledge,(PMBOK® Guide)- Fifth Edition, Project Management Institute, Inc., 2013, Figure 9-2, page 258.
98T h i s d o c u m e n t i s i n t e l l e c t u a l p r o p e r t y o f t h e I n t e r - A m e r i c a n D e v e l o p m e n t B a n k ( I D B ) a n d t h e I n t e r - A m e r i c a n I n s t i t u t e f o r E c o n o m i c a n d S o c i a l D e v e l o p m e n t ( I N D E S ) . A n y p a r t i a l o r f u l l r e p r o d u c t i o n o f t h i s d o c u m e n t m u s t b e r e p o r t e d t o : B I D - I N D E S @ i a d b . o r g
L E A R N I N G G U I D E - 2 0 1 8
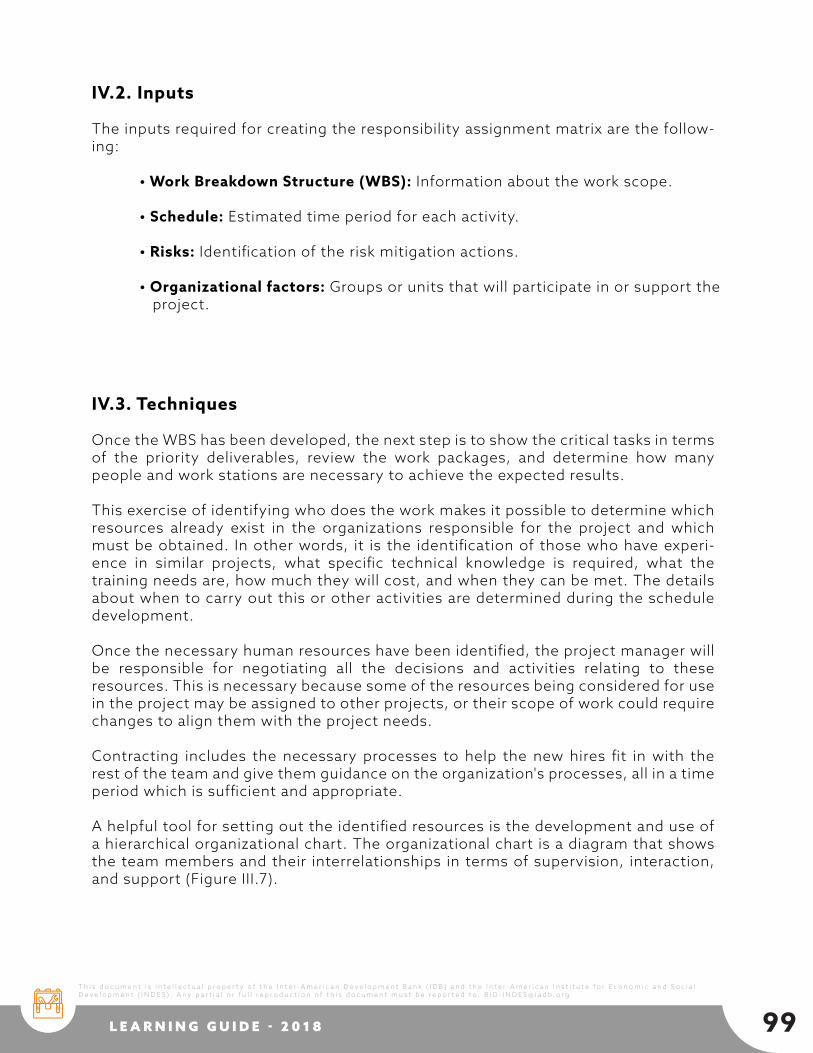
IV.2. Inputs
The inputs required for creating the responsibility assignment matrix are the follow-ing:
• Work Breakdown Structure (WBS): Information about the work scope.
• Schedule: Estimated time period for each activity.
• Risks: Identification of the risk mitigation actions.
• Organizational factors: Groups or units that will participate in or support the project.
IV.3. Techniques
Once the WBS has been developed, the next step is to show the critical tasks in terms of the priority deliverables, review the work packages, and determine how many people and work stations are necessary to achieve the expected results.
This exercise of identifying who does the work makes it possible to determine which resources already exist in the organizations responsible for the project and which must be obtained. In other words, it is the identification of those who have experi-ence in similar projects, what specific technical knowledge is required, what the training needs are, how much they will cost, and when they can be met. The details about when to carry out this or other activities are determined during the schedule development.
Once the necessary human resources have been identified, the project manager will be responsible for negotiating all the decisions and activities relating to these resources. This is necessary because some of the resources being considered for use in the project may be assigned to other projects, or their scope of work could require changes to align them with the project needs.
Contracting includes the necessary processes to help the new hires fit in with the rest of the team and give them guidance on the organization's processes, all in a time period which is sufficient and appropriate.
A helpful tool for setting out the identified resources is the development and use of a hierarchical organizational chart. The organizational chart is a diagram that shows the team members and their interrelationships in terms of supervision, interaction, and support (Figure III.7).
99T h i s d o c u m e n t i s i n t e l l e c t u a l p r o p e r t y o f t h e I n t e r - A m e r i c a n D e v e l o p m e n t B a n k ( I D B ) a n d t h e I n t e r - A m e r i c a n I n s t i t u t e f o r E c o n o m i c a n d S o c i a l D e v e l o p m e n t ( I N D E S ) . A n y p a r t i a l o r f u l l r e p r o d u c t i o n o f t h i s d o c u m e n t m u s t b e r e p o r t e d t o : B I D - I N D E S @ i a d b . o r g
L E A R N I N G G U I D E - 2 0 1 8

100
Figure III.7. Project organizational chart
Fuente: Elaboración propia.
Manager
L eve l 4
L eve l 3 L eve l 3
L eve l 2 L eve l 2
L eve l 4
L eve l 3 L eve l 3
L eve l 2
L eve l 3
L eve l 4 L eve l 4
Responsibility assignment matrix
The Responsibility Assignment Matrix (RAM) is one of the most useful HR manage-ment tools. The matrix connects the organizational chart of the project or the organi-zation(s) responsible for the project with the WBS to ensure that each and every component of the work packages is assigned to a person on the organizational chart.The most common RAM formats are the following:
• Narrative: It describes in detail all aspects of responsibility, authority, skills, work relationships, interactions, role duplication and overlap, and the qualifications required.
• Diagram: It is based on the four most important HR variables and known as the RACI matrix:
o R: Responsible for execution (responsible): Someone who is responsible. In this way, for every product and deliverable defined in the WBS there is normally a person responsible for its execution or for ensuring execution.
o A: Approves (accountable): Someone assumes final responsibility for the correct and complete execution of a product or deliverable and receives the reports from those responsible for its execution.
o C: Consulted: Someone who is not directly involved in the execution of a product or deliverable, but provides some type of input for the process or is consulted about his opinion, or is asked for advice.
o I: Informed: Someone receives the results of a product or deliverable or is informed about progress made.
T h i s d o c u m e n t i s i n t e l l e c t u a l p r o p e r t y o f t h e I n t e r - A m e r i c a n D e v e l o p m e n t B a n k ( I D B ) a n d t h e I n t e r - A m e r i c a n I n s t i t u t e f o r E c o n o m i c a n d S o c i a l D e v e l o p m e n t ( I N D E S ) . A n y p a r t i a l o r f u l l r e p r o d u c t i o n o f t h i s d o c u m e n t m u s t b e r e p o r t e d t o : B I D - I N D E S @ i a d b . o r g
L E A R N I N G G U I D E - 2 0 1 8

101
Depending on the type of project, the matrix may take different forms: in large pro-jects, the matrix focuses on assigning responsibilities for the delivery of results or components; in small projects, it may focus on the activities.
Other uses of the matrix include the identification of responsibilities for the execu-tion of the project internal processes, such as the approval of changes, and the preparation and delivery of reports.
The manager is responsible for managing the participative development of the matrix using the information about the project members' roles and responsibilities. Based on the different functions, the manager will identify one person responsible for completing the task; then he will identify a person to approve the work delivery. Then, the manager will assign the people who will be consulted and informed to carry out the product or deliverable.It is not necessary to assign the four roles for each activity; however, the role of the person responsible for completing the task is essen-tial.
Table III.7. Example of a RACI matrix format
T E A M M E M B E R SR A C I D I A G R A M
P R O D U C T/D E L I V E R A B L E
Project plan
Collected requirements
Preliminary design
Tests
A N A
A
I
I
A
B E N I T O
R
A
A
I
I
R
R
R
C A R L O S E D U A R D O
I
C
C
I
Source: Project Management Institute, A Guide to the Project Management Body of Knowledge,(PMBOK® Guide)- Fifth Edition, Project Management Institute, Inc., 2013, Figure 9-5, page 262.
T h i s d o c u m e n t i s i n t e l l e c t u a l p r o p e r t y o f t h e I n t e r - A m e r i c a n D e v e l o p m e n t B a n k ( I D B ) a n d t h e I n t e r - A m e r i c a n I n s t i t u t e f o r E c o n o m i c a n d S o c i a l D e v e l o p m e n t ( I N D E S ) . A n y p a r t i a l o r f u l l r e p r o d u c t i o n o f t h i s d o c u m e n t m u s t b e r e p o r t e d t o : B I D - I N D E S @ i a d b . o r g
L E A R N I N G G U I D E - 2 0 1 8

102
IV.4. Outputs
Above all, the responsibility assignment matrix provides clarity about the responsi-bilities of the various team members for its different activities. In this way, the team knows with certainty who is responsible for each activity, so duplication of functions or the existence of activities without a responsible party are avoided. The matrix format enables a person to see all the activities associated with one person, or see all the people associated with an activity. The responsibility assignment matrix improves communication and reduces conflict. This list should be updated whenev-erthere are changes in the activities or the project team.
T h i s d o c u m e n t i s i n t e l l e c t u a l p r o p e r t y o f t h e I n t e r - A m e r i c a n D e v e l o p m e n t B a n k ( I D B ) a n d t h e I n t e r - A m e r i c a n I n s t i t u t e f o r E c o n o m i c a n d S o c i a l D e v e l o p m e n t ( I N D E S ) . A n y p a r t i a l o r f u l l r e p r o d u c t i o n o f t h i s d o c u m e n t m u s t b e r e p o r t e d t o : B I D - I N D E S @ i a d b . o r g
L E A R N I N G G U I D E - 2 0 1 8

103
The most important aspect of human resource management is to identify and assign the best human resources available to carry out all the project objectives set forth within their respective constraints of time, scope, and cost. This can be done by using tools, such as the Responsibility Assignment Matrix (RAM), which illustrates the connections among the work to be done and the members of the project team and other stakeholders.
The matrix connects the organizational chart of the project or the organization(s) responsible for the project with the WBS to ensure that each component of the work packages is assigned to a person on the organizational chart. The matrix identifies the people who are responsible for the project results, the people who are accounta-ble to, who are consulted onproducts and deliverables, and who should be informed about any project change or risk.
Using the RAM significantly facilitates human resource management because it clari-fies roles, which is generally one of the greatest challenges in projects that lack this kind of tool. The RAM also improves communication and reduces conflict.
U N I T S U M M A R Y
T h i s d o c u m e n t i s i n t e l l e c t u a l p r o p e r t y o f t h e I n t e r - A m e r i c a n D e v e l o p m e n t B a n k ( I D B ) a n d t h e I n t e r - A m e r i c a n I n s t i t u t e f o r E c o n o m i c a n d S o c i a l D e v e l o p m e n t ( I N D E S ) . A n y p a r t i a l o r f u l l r e p r o d u c t i o n o f t h i s d o c u m e n t m u s t b e r e p o r t e d t o : B I D - I N D E S @ i a d b . o r g
L E A R N I N G G U I D E - 2 0 1 8

104
B I B L I O G R A P H I C A L R E F E R E N C E S
Cobb, Anthony T. (2011).Leading Project Teams: The Basics of Project Management and Team Leadership. 2nd edition. London: Sage Publications.
Gardiner, Paul (2005).Project Management: A Strategic Planning Approach. New York: Palgrave-Macmillan.
Kendrick, Tom (2004).Identifying and Managing Project Risk: Essential Tools for Fail-ure-Proofing Your Project. New York: AMACOM.
Lewis, James P. (1997). Fundamentals of Project Management. New York: AMACOM.
Lewis, James P. (2004).Team-Based Project Management. New York: Beard Books.
Meredith, Jack and Samuel Mantel (2003).Project Management: A Managerial Approach. 5thedition. New York: John Wiley & Sons.
Pellerin, Charles (2009).How NASA Builds Teams: Mission Critical Soft Skills for Scien-tists, Engineers, and Project Teams. New Jersey: John Wiley & Sons.
PM4DEV(2008).Fundamentals of Project Management. United States: PM4DEV.
Project Management Institute (2007).Practice Standard for Scheduling. United States: PMI.
Project Management Institute (2013) Guía de los Fundamentos para la Gestión de Proyectos (Guía del PMBOK®)-Quinta Edición. Estados Unidos.
Several authors (2009). Presentation entitled Integrated Project Management Pro-gram (PGIP), 7-Step Methodology. Washington, D.C.: IDB.
Verma, Vijay K. (1995).The Human Aspects of Project Management: Organizing Pro-jects for Success, Volume One.United States: PMI.
Verzuh, Eric (2007).The Fast Forward MBA in Project Management. New Jersey: John Wiley & Sons.
T h i s d o c u m e n t i s i n t e l l e c t u a l p r o p e r t y o f t h e I n t e r - A m e r i c a n D e v e l o p m e n t B a n k ( I D B ) a n d t h e I n t e r - A m e r i c a n I n s t i t u t e f o r E c o n o m i c a n d S o c i a l D e v e l o p m e n t ( I N D E S ) . A n y p a r t i a l o r f u l l r e p r o d u c t i o n o f t h i s d o c u m e n t m u s t b e r e p o r t e d t o : B I D - I N D E S @ i a d b . o r g
L E A R N I N G G U I D E - 2 0 1 8

105
L I S T O F F I G U R E S
Figure III.1. Procurement matrix development process
Figure III.2. Example of a risk breakdown structure
Figure III.3. Risk matrix development process
Figure III.4. Risk classification matrix
Figure III.5. Communications matrix development process
Figure III.6. Responsibility assignment matrix creation process
Figure III.7. Project organizational chart
76
84
85
87
92
98
100
L I S T O F TA B L E S
Table III.1. Procurement matrix
Table III.2. Risk matrix example
Table III.3. Classification of probability
Table III.4. Impact classification
Table III.5. Project actions for the different risk levels
Table III.6. Communications matrix
Table III.7. Example of a RACI matrix format
79
86
86
87
88
95
101
T h i s d o c u m e n t i s i n t e l l e c t u a l p r o p e r t y o f t h e I n t e r - A m e r i c a n D e v e l o p m e n t B a n k ( I D B ) a n d t h e I n t e r - A m e r i c a n I n s t i t u t e f o r E c o n o m i c a n d S o c i a l D e v e l o p m e n t ( I N D E S ) . A n y p a r t i a l o r f u l l r e p r o d u c t i o n o f t h i s d o c u m e n t m u s t b e r e p o r t e d t o : B I D - I N D E S @ i a d b . o r g
L E A R N I N G G U I D E - 2 0 1 8

106
Project monitoring and control
CHAPTER 4
T h i s d o c u m e n t i s i n t e l l e c t u a l p r o p e r t y o f t h e I n t e r - A m e r i c a n D e v e l o p m e n t B a n k ( I D B ) a n d t h e I n t e r - A m e r i c a n I n s t i t u t e f o r E c o n o m i c a n d S o c i a l D e v e l o p m e n t ( I N D E S ) . A n y p a r t i a l o r f u l l r e p r o d u c t i o n o f t h i s d o c u m e n t m u s t b e r e p o r t e d t o : B I D - I N D E S @ i a d b . o r g
L E A R N I N G G U I D E - 2 0 1 8
107
Chapter four will introduce some of the tools available to control and track projects, including the planning matrix, the multi-annual execution plan (MEP), the annual operating plan (AOP), and the earned value management techniques.
The chapter is divided into two units. The first concentrates on the development and analysis of planning matrices, and introduces the MEP and the AOP. The second unit focuses on earned value development as a means of project monitoring and control.
C H A P T E R I N T R O D U C T I O N
T h i s d o c u m e n t i s i n t e l l e c t u a l p r o p e r t y o f t h e I n t e r - A m e r i c a n D e v e l o p m e n t B a n k ( I D B ) a n d t h e I n t e r - A m e r i c a n I n s t i t u t e f o r E c o n o m i c a n d S o c i a l D e v e l o p m e n t ( I N D E S ) . A n y p a r t i a l o r f u l l r e p r o d u c t i o n o f t h i s d o c u m e n t m u s t b e r e p o r t e d t o : B I D - I N D E S @ i a d b . o r g
L E A R N I N G G U I D E - 2 0 1 8

108
Learning objectives
• To identify the processes for developing a planning matrix.
• To learn the content and applications of a multi-annual execution plan (MEP) and an annual operating plan (AOP).
I.1. The planning matrix
The course will present seven tools that form the basis of project plans. The planning matrix is an instrument that consolidates information from these seven tools in a format that facilitates application of that information. It is a device that the project team can use to track operations and it provides the inputs needed to prepare and update the MEP/AOP. The planning matrix is designed in accordance with the project manager’s and team’s needs and its most important function is to facilitate project management,monitoring and control.
Consolidating the information in a single matrix simplifies the analysis of the project components and is particularly helpful in enabling the user to recognize the close dependent relationships between components. Using a matrix improves understand-ing of the project objectives, because it provides a visual representation of the rela-tionship between results and costs, time, risk, responsibilities, etc.
The purpose of the matrix is to show a simple view of the project execution plan data. It does not matter how large or complicated the project is because the matrix can express the most essential planning elements and allow the user to track the project without getting lost in the details. The matrix also functions as a tool for communi-cating with other stakeholders, since it presents information in an easily understand-able format. Essentially, the matrix is an instrument designed for project managers to manage the project more successfully.
Every project is different, so the information needed also varies. Table IV.1 is an example that shows the individual elements that the planning matrix might contain.
U N I T I . P R O J E C T E X E C U T I O N P L A N
T h i s d o c u m e n t i s i n t e l l e c t u a l p r o p e r t y o f t h e I n t e r - A m e r i c a n D e v e l o p m e n t B a n k ( I D B ) a n d t h e I n t e r - A m e r i c a n I n s t i t u t e f o r E c o n o m i c a n d S o c i a l D e v e l o p m e n t ( I N D E S ) . A n y p a r t i a l o r f u l l r e p r o d u c t i o n o f t h i s d o c u m e n t m u s t b e r e p o r t e d t o : B I D - I N D E S @ i a d b . o r g
L E A R N I N G G U I D E - 2 0 1 8

109
Source: Compiled by author
Table IV.1. Planning matrix example
S C O P E ( W B S )C
om
po
nen
t
Pro
du
cto
T I M E
Del
iver
able
s
Du
rati
on
End
Pro
gres
s (%
)
C O S T
Bu
dge
t
P R O C U R E -M E N T
Mo
de
of
pro
cure
men
t
R I S K S
Ris
k le
vel
R E S P O N -S I B I L I T Y
Nam
e
C O M M U N I -C AT I O N
CO
MP
ON
EN
T 1
PR
OD
UC
T 1
.1P
RO
DU
CT
1.2
D e l i v e r a b l e1 . 1 . 1 2 0 d a y s 2 1 / 0 1 / 2 0 1 2 1 0 0 % 1 0 0 . 0 0 L P I H i g h E MR e p o r t
D e l i v e r a b l e1 . 1 . 2 4 0 d a y s 1 0 / 0 2 / 2 0 1 2 8 0 % 5 0 . 0 0 L P I A v e r a g e R SN e w s l e t t e r
D e l i v e r a b l e1 . 1 . 3 3 0 d a y s 1 0 / 0 1 / 2 0 1 2 4 0 % 4 0 0 . 0 0 L P N A v e r a g e S AR e p o r t
D e l i v e r a b l e1 . 1 . 4 1 0 d a y s 1 0 / 0 1 / 2 0 1 2 1 2 0 % 1 0 0 . 0 0 L P I H i g h B EP r e s e n t a t i o n
D e l i v e r a b l e1 . 1 . 5 2 0 d a y s 2 0 / 0 1 / 2 0 1 2 0 % 2 0 0 . 0 0 L P N L o w E MR e p o r t
D e l i v e r a b l e1 . 1 . 6 1 0 d a y s 1 0 / 0 1 / 2 0 1 2 0 % 5 0 0 . 0 0 L P I A v e r a g e S AN e w s l e t t e r
D e l i v e r a b l e1 . 1 . 7 4 0 d a y s 3 0 / 0 1 / 2 0 1 2 0 % 5 0 . 0 0 L P N L o w R SN e w s l e t t e r
D e l i v e r a b l e1 . 1 . 8 2 0 d a y s 1 0 / 0 1 / 2 0 1 2 0 % 2 0 0 . 0 0 L P I A v e r a g e P RP r e s e n t a t i o n
Typ
e o
fco
mm
un
icat
ion
The following sections explain the steps to create the planning matrix, including entries or inputs, techniques, and results or outputs (Figure IV.1).
Figure IV.1. Planning matrix development process
S O U R C E
- Financer- Organization- Project team- Stakeholders
I N P U T S
- Results matrix- Project approval
documents- Historical data- Project plans
T E C H N I Q U E S
- Organization ofthe project plan
information
O U T P U T S
- MEP and AOP
U S E R
- Project team- Organization
- Financer
Source: SIPOC Process Diagram, Six Sigma.
T h i s d o c u m e n t i s i n t e l l e c t u a l p r o p e r t y o f t h e I n t e r - A m e r i c a n D e v e l o p m e n t B a n k ( I D B ) a n d t h e I n t e r - A m e r i c a n I n s t i t u t e f o r E c o n o m i c a n d S o c i a l D e v e l o p m e n t ( I N D E S ) . A n y p a r t i a l o r f u l l r e p r o d u c t i o n o f t h i s d o c u m e n t m u s t b e r e p o r t e d t o : B I D - I N D E S @ i a d b . o r g
L E A R N I N G G U I D E - 2 0 1 8

110
I.2. Inputs
• Work Breakdown Structure (WBS): It provides details about the total scope of the project.
• Schedule: It indicates the duration of project activities.
• Costs: It provides information on the project budget.
• Procurement matrix.
• Risk matrix.
• Communications matrix.
• Responsibility assignment matrix.
I.3. Techniques
Creating the matrix requires teamwork. The project manager and the team review the project information and start to create the matrix content. This tool summarizes, in a simple format, the most important information about a project so that the team can control and track the information without having to refer to all of the project plans and documents. The matrix uses a spreadsheet to facilitate information man-agement and to reorganize and sort the data.
The planning matrix contains the following elements:
• Project components.
• Project products.
• Step 1: Scope; that is, the project results.
• Step 2: Time (including the project duration and due dates for results).
• Step 3: Cost of results.
• Step 4: Procurement and amounts budgeted for it.
• Step 5: Risks (including the probability and impact risk and mitigation actions).
• Step 6: Communication related to results or components.
• Step 7: Individuals responsible for the results.
T h i s d o c u m e n t i s i n t e l l e c t u a l p r o p e r t y o f t h e I n t e r - A m e r i c a n D e v e l o p m e n t B a n k ( I D B ) a n d t h e I n t e r - A m e r i c a n I n s t i t u t e f o r E c o n o m i c a n d S o c i a l D e v e l o p m e n t ( I N D E S ) . A n y p a r t i a l o r f u l l r e p r o d u c t i o n o f t h i s d o c u m e n t m u s t b e r e p o r t e d t o : B I D - I N D E S @ i a d b . o r g
L E A R N I N G G U I D E - 2 0 1 8

111
I.4. Outputs
The project has a planning matrix, which the project manager uses as a basis for following up on project progress and determining whether tasks are being completed as designed.
The project team uses the matrix as a guide for beginning scheduled tasks in a given period, since the matrix links each result with the person responsible for carrying it out. Additionally, the matrix is regularly used in project team meetings, where each team member reports on the progress of activities planned for the corresponding period. The matrix must be updated every time there are changes or approved modi-fications.
I.5.Project execution plan
One of the most common practices in project management is to create an execution plan that covers all the years the project will last to better understand the results. This type of plan is usually called a multi-annual execution plan (MEP). As part of an MEP, an annual operating plan (AOP) is usually developed, depending on the period selected.
Organizations such as the European Union, the World Bank, the UN Development Program (UNDP), the Inter-American Development Bank (IDB), and other develop-ment institutions employ this type of approach in planning their development pro-jects and programs. The result is a plan that shows the main results, tasks, indica-tors, risks, and clauses that allow for close monitoring and oversight of project exe-cution.Since a multi-year project is too broad, it is necessary to break down or "divide" the MEP into smaller parts, so they are easier to supervise. This is done using annual operating plans, which allow the user to establish goals and deadlines for a 12-month period. A review of results at the end of the year forms the basis for plan-ning the following year's operations.In general, conducting a review and evaluation just once a year is not a good practice and it is preferable to do this periodically at least on a quarterly basis. However, determining the optimal frequency for reviewing, evaluating, and adjusting the project depends on its complexity, the planning strate-gy, the importance of resources, the cost, and the staff available to do it.
T h i s d o c u m e n t i s i n t e l l e c t u a l p r o p e r t y o f t h e I n t e r - A m e r i c a n D e v e l o p m e n t B a n k ( I D B ) a n d t h e I n t e r - A m e r i c a n I n s t i t u t e f o r E c o n o m i c a n d S o c i a l D e v e l o p m e n t ( I N D E S ) . A n y p a r t i a l o r f u l l r e p r o d u c t i o n o f t h i s d o c u m e n t m u s t b e r e p o r t e d t o : B I D - I N D E S @ i a d b . o r g
L E A R N I N G G U I D E - 2 0 1 8

112
Multi-annual execution plan (MEP)
The multi-annual execution plan mainly includes the objectives and results that the project should achieve over its total lifespan. As the name indicates, this plan may include several years of plan execution. The plan includes the list of tools as well as the necessary information about objectives, costs, and timeframes for comple-tingthe project. The MEP constitutes the reference point for drafting annual operat-ing plans and is the tool used for the overall tracking of the project.
Annual operating plan (AOP)
The AOP is built on the information organized in the MEP and presents a detailed view of the activities planned over a period of 12 months. The level of detail in the AOP allows for more accurate control and monitoring, which, in turn, makes it easier to take corrective actions. The sum of all of the AOPs for the project is the MEP.One of the basic reasons why it is useful to develop an annual operating plan is that it ena-bles a thorough tracking of the plan, preventing deviations from the project objec-tives. The level of detail in the AOP shows the small deviations that occur over the short term, and this helps identify the affected activities more accurately so that the necessary changes can be made to reduce discrepancies. The AOP is used by groups or individuals responsible for supervision, to track and evaluate the project, and should be considered a helpful and useful tool for project implementation.In addition to enabling project tracking over a period of 12 months, the AOP also reflects the budget planning cycles of the organizations implementing the project. This allows for monitoring project performance based on the goals established for those 12 months. Monitoring includes delivery of results, fulfillment of procurement plan activities, actions in the risk mitigation plan, and communications with stakeholders.
The AOP covers the same aspects as the MEP objectives, costs, and times to com-plete the project�but it does so with a greater level of detail.
As mentioned above, the annual operating plan allows the user to define a detailed list of the actions or tasks necessary to achieve the desired results for the year within the timeframe allotted, a key capability for monitoring and controlling the project. Therefore, the AOP should not be viewed as just another "control" mechanism, but as a tool to help in decision-making during project execution.
T h i s d o c u m e n t i s i n t e l l e c t u a l p r o p e r t y o f t h e I n t e r - A m e r i c a n D e v e l o p m e n t B a n k ( I D B ) a n d t h e I n t e r - A m e r i c a n I n s t i t u t e f o r E c o n o m i c a n d S o c i a l D e v e l o p m e n t ( I N D E S ) . A n y p a r t i a l o r f u l l r e p r o d u c t i o n o f t h i s d o c u m e n t m u s t b e r e p o r t e d t o : B I D - I N D E S @ i a d b . o r g
L E A R N I N G G U I D E - 2 0 1 8

113
Relationship between the MEP and the AOP
The relationship between the MEP and the AOP is based on the dynamics of ongoing planning over the life of the project. Both the MEP and the AOP must be updated periodically as information changes. The MEP is the basis for developing the AOP, but both are closely related and should not be treated as independent plans. The AOP presents the same information as the MEP, but limited to one year of operations and with greater detail about project activities.
The AOP should not be an exercise carried out at the end of the year, but rather a practice for continual planning. The AOP is not just a means for reporting the tasks planned for a given year; rather, the project manager should use it as a tactical tool for directing the project and making the necessary adjustments when deviations occur.
The value of an up-to-date AOP is the ability to plan and re-plan activities, tactics, and methods based on experiences, changes, and conditions in the project environ-ment. In other words, the AOP should be reviewed more frequently than once a year and any changes made should serve as the basis for modifying, adjusting, and making changes to the MEP. For multi-year projects, the manager should have the AOP updated every three months. Figure IV.2 shows the relationship between the AOP and the MEP, not as an annual exercise but as a more detailed view of the project tasks over a 12-month period.
Figure IV.2. Relationship between the MEP and the AOP
Source: Compiled by author
T h i s d o c u m e n t i s i n t e l l e c t u a l p r o p e r t y o f t h e I n t e r - A m e r i c a n D e v e l o p m e n t B a n k ( I D B ) a n d t h e I n t e r - A m e r i c a n I n s t i t u t e f o r E c o n o m i c a n d S o c i a l D e v e l o p m e n t ( I N D E S ) . A n y p a r t i a l o r f u l l r e p r o d u c t i o n o f t h i s d o c u m e n t m u s t b e r e p o r t e d t o : B I D - I N D E S @ i a d b . o r g
L E A R N I N G G U I D E - 2 0 1 8

114
I.6. Relationship with results-oriented planning
Project management is one of the components for managing results in development; its purpose is to enable public-sector organizations to achieve the designated results in terms of the country's development goals. A clear example of this relationship can be seen in the IDB PRODEV6 Evaluation System (PES), which uses five pillars of the management cycle to assess institutional capabilities. This system examines the elements needed to design a results-oriented process for creating public value. Figure IV.3 shows the scores for each PES pillar for Paraguay and for the region.
The program and project management scores show an average of 1.9 points out of a possible 5 points.
The data for the region, in general, show that the score for the project management pillar is lower than expected, with only two countries scoring higher than 3. Figure IV.4 shows the regional data.
6 Program to Implement the External Pillar of the Medium Term Action Plan for Development Effective-ness.
Figure IV.3. MfDR Scores by pillar
Source: García López, Roberto and Mauricio García Moreno (2010).La gestión pararesultados en el desarrollo: Avances y desafíos en América Latina y el Caribe. Washington, DC: IDB
T h i s d o c u m e n t i s i n t e l l e c t u a l p r o p e r t y o f t h e I n t e r - A m e r i c a n D e v e l o p m e n t B a n k ( I D B ) a n d t h e I n t e r - A m e r i c a n I n s t i t u t e f o r E c o n o m i c a n d S o c i a l D e v e l o p m e n t ( I N D E S ) . A n y p a r t i a l o r f u l l r e p r o d u c t i o n o f t h i s d o c u m e n t m u s t b e r e p o r t e d t o : B I D - I N D E S @ i a d b . o r g
L E A R N I N G G U I D E - 2 0 1 8

115
Figure IV.4. Program and project management scores
Source: García López, Roberto and Mauricio García Moreno (2010).La gestión para resultadosen el desarrollo: Avances y desafíos en América Latina y el Caribe. Washington, DC: IDB
From the perspective of managing for development results, project management requires that the executing institutions align their plans with national strategies, with annual and multi-annual plans to meet those objectives and the designation of offi-cials responsible for meeting them.
Good project management is essential for a country to be able to achieve its develop-ment goals. Having tools that facilitate project planning is a step forward in improv-ing development project management. In general, a project that has complete and up-to-date plans can increase its likelihood of success.
The benefits of results-based project management are the following:
• It enables users to adapt to and manage changes.
• It informs all members of an organization about their responsibilities.
• It improves coordination between the organization's different internal and external resources.
• It optimizes communication with stakeholders.
T h i s d o c u m e n t i s i n t e l l e c t u a l p r o p e r t y o f t h e I n t e r - A m e r i c a n D e v e l o p m e n t B a n k ( I D B ) a n d t h e I n t e r - A m e r i c a n I n s t i t u t e f o r E c o n o m i c a n d S o c i a l D e v e l o p m e n t ( I N D E S ) . A n y p a r t i a l o r f u l l r e p r o d u c t i o n o f t h i s d o c u m e n t m u s t b e r e p o r t e d t o : B I D - I N D E S @ i a d b . o r g
L E A R N I N G G U I D E - 2 0 1 8

116
• It enables users to define priorities from among the different pending tasks.
• It helps identify risks and problems at an early stage, so that corrective measures can be designed in a timely fashion.
• It ensures quality, because it delivers results in line with requirements and appropriate to their intended use.
Having a plan is only the first step in project management, but is it important for implementing actions to achieve the results that the countries need to achieve their development goals.
T h i s d o c u m e n t i s i n t e l l e c t u a l p r o p e r t y o f t h e I n t e r - A m e r i c a n D e v e l o p m e n t B a n k ( I D B ) a n d t h e I n t e r - A m e r i c a n I n s t i t u t e f o r E c o n o m i c a n d S o c i a l D e v e l o p m e n t ( I N D E S ) . A n y p a r t i a l o r f u l l r e p r o d u c t i o n o f t h i s d o c u m e n t m u s t b e r e p o r t e d t o : B I D - I N D E S @ i a d b . o r g
L E A R N I N G G U I D E - 2 0 1 8
117
The planning matrix is a summary of seven planning tools that provides the inputs for the MEP/AOP and is the basis for project control and monitoring from a project man-agement standpoint. It is useful because it allows the manager and the team to use the information to initiate planned actions and achieve greater project control.
The MEP is a document that can include several or all years of the project lifespan. Its primary characteristic is the time it covers, so it is one of the few tools that provide a global view of the project. It shows in a simple fashion the most important perfor-mance aspects, such as objectives, costs, and timeframes, which can easily be over-looked if only annual documents are available.
The development of the MEP requires having complete information about the project scope, objectives, schedule, budget, risks, procurement, and responsibilities. The AOP,in turn, requires that this information be complete so that it can provide greater detail about the activities for a period of 12 months. The AOP is used as a tool to monitor and control the completion of planned activities.
U N I T S U M M A R Y
T h i s d o c u m e n t i s i n t e l l e c t u a l p r o p e r t y o f t h e I n t e r - A m e r i c a n D e v e l o p m e n t B a n k ( I D B ) a n d t h e I n t e r - A m e r i c a n I n s t i t u t e f o r E c o n o m i c a n d S o c i a l D e v e l o p m e n t ( I N D E S ) . A n y p a r t i a l o r f u l l r e p r o d u c t i o n o f t h i s d o c u m e n t m u s t b e r e p o r t e d t o : B I D - I N D E S @ i a d b . o r g
L E A R N I N G G U I D E - 2 0 1 8

118
Learning objectives
• To identify the necessary inputs to determine and quantify the project earned value.
• To understand the products for analyzing earned value to evaluate project performance.
II.1. Earned value (EV) analysis
Analyzing earned value helps control project execution through its scope, schedule, and resources, which simplifies the measurement of project performance against planned targets. An earned value analysis compares the work planned with what was actually completed to determine whether costs, deadlines, and tasks performed are in compliance with plans.
The term “earned value” stems from the concept that each project deliverable and/or product has an associated cost, and costs can only be assigned to a project at the time the result is delivered. This means that if a project has to deliver 10 housing units each month, and each one costs $50,000, the project can only credit the value of $50,000 once the complete housing unit is delivered, regardless of whether the cost is more or less than planned. The project cannot account for materials, services, or unfinished housing units as part of the earned value, since those elements are not the deliverables and/or products but rather the inputs used to create the result. Thus, the EV uses a metric that is free from interpretations, because it calculates only completed deliverables and/or products and not efforts or partially completed prod-ucts.
II.2. Inputs
The inputs needed to analyze the earned value are the following:
• Project schedule.
• Accounting information on expenditures as of the date of the analysis.
• Information on the project completed deliverables and/or products.
• Project budget.
U N I T I I . E A R N E D VA L U E A N A L Y S I S
T h i s d o c u m e n t i s i n t e l l e c t u a l p r o p e r t y o f t h e I n t e r - A m e r i c a n D e v e l o p m e n t B a n k ( I D B ) a n d t h e I n t e r - A m e r i c a n I n s t i t u t e f o r E c o n o m i c a n d S o c i a l D e v e l o p m e n t ( I N D E S ) . A n y p a r t i a l o r f u l l r e p r o d u c t i o n o f t h i s d o c u m e n t m u s t b e r e p o r t e d t o : B I D - I N D E S @ i a d b . o r g
L E A R N I N G G U I D E - 2 0 1 8

119
II.3. Techniques
Earned value techniques use project data to compare tasks that have been complet-ed at a given moment in time with the initial project estimate. The result is a meas-urement of how far the project has progressed and how much remains to be complet-ed. This technique helps estimate the time and budget that are still needed to com-plete a project if conditions remain unchanged.The earned value technique as a con-trol system requires the use of three values:
• Actual cost (AC):These are the costs that the project has incurred to date to obtain earned value. The costs are obtained from the project accounting management system.
• Planned value (PV): This is the authorized budget allocated to the work planned to date.
• Earned value (EV):This is the budgeted cost of work done to date. These values are used to calculate and obtain variance values for project costs, schedule, and performance to establish whether the activities are being carried out according to plan:
• Cost variance (CV): This determines the difference between what the project was expected to spend at a specific point in time and what was actually spent; that is, it measures whether the project has spent more or less than budgeted by a certain date. The formula for calculating cost variance is earned value (EV) minus the actual cost (AC): [CV = EV - AC].
• Schedule variance (SV): This measures the variance in time that the project used to deliver the results on a certain date in relation to planned delivery; that is, it determines whether the project is delayed or ahead of schedule. The formula for calculating schedule variance isearned value (EV) minus planned value (PV): [SV = EV - PV].
• Cost performance index (CPI): This measures cost efficiency in terms of completed work. The formula to calculate this is earned value (EV) divided by the period actual cost (AC): [CPI = EV/AC]. If the result is less than 1, it means that the costs exceeded the amount budgeted, i.e. this is an over budget. For example, CPI = 0.67 means that for each dollar 67 cents have been generated according to the work completed. If the value is greater than 1, the costs are below the performance to date, i.e. this is an under budget. Ideally, the CPI should be 1, meaning that for each dollar a value of one dollar is generated.
T h i s d o c u m e n t i s i n t e l l e c t u a l p r o p e r t y o f t h e I n t e r - A m e r i c a n D e v e l o p m e n t B a n k ( I D B ) a n d t h e I n t e r - A m e r i c a n I n s t i t u t e f o r E c o n o m i c a n d S o c i a l D e v e l o p m e n t ( I N D E S ) . A n y p a r t i a l o r f u l l r e p r o d u c t i o n o f t h i s d o c u m e n t m u s t b e r e p o r t e d t o : B I D - I N D E S @ i a d b . o r g
L E A R N I N G G U I D E - 2 0 1 8

120
• Schedule Performance Index (SPI): This measures the schedule efficiency; it shows how the project team is spending time. This is calculated using the formula earned value (EV) divided by planned value (PV): [SPI = EV/PV]. If the result is less than one, the amount of work carried out is less than planned and there is a delay in the estimated schedule. On the other hand, a result greater than one means that the project is ahead of the estimated schedule. Ideally, the SPI should be 1, which means that work is on schedule. For example, SPI = 0.80 means there is 80% progress to date or a 20% delay.
Figure IV.5shows an example of the relationships between the different components of the earned value analysis.
T I M E
A C T U A L C O S T ( A C )
E A R N E D VA L U E ( E V )
P L A N N E D VA L U E ( P V )
AC
CU
MU
LA
TE
D V
AL
UE
($
)
Figure IV.5. Earned value analysis
Source: Development Project Integrated Management Course, Earned Value figure, IDB
T h i s d o c u m e n t i s i n t e l l e c t u a l p r o p e r t y o f t h e I n t e r - A m e r i c a n D e v e l o p m e n t B a n k ( I D B ) a n d t h e I n t e r - A m e r i c a n I n s t i t u t e f o r E c o n o m i c a n d S o c i a l D e v e l o p m e n t ( I N D E S ) . A n y p a r t i a l o r f u l l r e p r o d u c t i o n o f t h i s d o c u m e n t m u s t b e r e p o r t e d t o : B I D - I N D E S @ i a d b . o r g
L E A R N I N G G U I D E - 2 0 1 8

121
Example: applying earned value (EV)
A project with a total value of $1 million is scheduled to last 10 months. In this time, it must deliver 10 schools, one per month, with an estimated cost of $100,000 each. Three months after the project begins, the manager decides to perform an earned value analysis using the following data: by the end of the third month there must be three completed schools, with a planned value (PV) of $300,000 ($100,000 each). However, after three months only two schools have been delivered, which represents the earned value (EV) of $200,000. To build these two schools, a total of $250,000 was spent (AC). The calculations yield the following results:
• Cost variance: [CV = EV - AC]
CV = $200,000 - $250,000 = -$50,000
That is, the project has spent $50,000 more than budgeted by that date, based on the work completed.
• Schedule variance: [SV = EV - PV]
SV = $200,000 - $300,000 = -$100,000
The value is negative, which means that the project is behind schedule. The amount of $100,000 represents a school, since by the end of the third month three schools are scheduled to be delivered, but only two have been completed, i.e., there is a one-school delay.
• Cost Performance Index: [CPI = EV/AC]
CPI = 200,000/250,000 = 0.8
Since the value is less than 1, this confirms that the project is only getting results from 80 cents of every dollar spent; that is, the funds are not being used efficiently. That is why $250,000 have been spent, but only two schools have been completed. • Schedule Performance Index: [SPI = EV/PV]
SPI = 200,000/300,000 = 0.67
The value is less than 1, which confirms that the project has taken longer than planned to complete the two schools.
According to the plan, after three months three schools should have been complet-ed; however, only two were actually completed, i.e., the 67% of the work scheduled to date. This can also be interpreted as having a 33% delay as to the scheduled work to date.
T h i s d o c u m e n t i s i n t e l l e c t u a l p r o p e r t y o f t h e I n t e r - A m e r i c a n D e v e l o p m e n t B a n k ( I D B ) a n d t h e I n t e r - A m e r i c a n I n s t i t u t e f o r E c o n o m i c a n d S o c i a l D e v e l o p m e n t ( I N D E S ) . A n y p a r t i a l o r f u l l r e p r o d u c t i o n o f t h i s d o c u m e n t m u s t b e r e p o r t e d t o : B I D - I N D E S @ i a d b . o r g
L E A R N I N G G U I D E - 2 0 1 8

122
Graphic representation of earned value
Figure IV.6represents the previous example. The Budget at Completion (BAC) curve represents the planned project costs from start to completion. The actual cost (AC) curve represents the actual costs ($250,000) incurred by the project to complete the two schools as of the analysis date (third month). The EV curve ($200,000) shows the earned value represented by the two schools that the project has completed, with an estimated value of $100,000 each. Project progress stands at 20%, which is calculat-ed as follows: $200,000/$1,000,000 = 20%.
Projections
An earned value analysis also allows the user to develop projections to determine the funds or time needed to finalize a project, if the execution proceeds at the same rate.
Using the example above, the costs to complete a project are calculated using the following formulas:
• Estimated cost at completion (EAC): This is calculated by dividing the project budget (BAC) by the cost performance index (CPI): [EAC = BAC/CPI].Using the values from the above example, the estimated cost at completion for the project is EAC = 1,000,000/0.8 = $1,250,000; that is, given the rate at which resources are being used, the project will need an additional $250,000 to be completed. In other words, if $250,000 were needed to complete two schools, each wouldcost $125,000; therefore, to complete 10 schools $1,250,000 would be necessary.
Figure IV.6. Earned value illustration
Source: Compiled by author
140,000
120,000
100,000
80,000
60,000
40,000
20,000
0
MO
NT
H 1
MO
NT
H 2
MO
NT
H 3
MO
NT
H 4
MO
NT
H 5
MO
NT
H 6
MO
NT
H 7
MO
NT
H 8
MO
NT
H 9
MO
NT
H 1
0
T h i s d o c u m e n t i s i n t e l l e c t u a l p r o p e r t y o f t h e I n t e r - A m e r i c a n D e v e l o p m e n t B a n k ( I D B ) a n d t h e I n t e r - A m e r i c a n I n s t i t u t e f o r E c o n o m i c a n d S o c i a l D e v e l o p m e n t ( I N D E S ) . A n y p a r t i a l o r f u l l r e p r o d u c t i o n o f t h i s d o c u m e n t m u s t b e r e p o r t e d t o : B I D - I N D E S @ i a d b . o r g
L E A R N I N G G U I D E - 2 0 1 8

123
• Estimated time to completion (EAT): This value is calculated as follows: pro-ject schedule (total planned duration) minus time elapsed to date, divided by the Schedule Performance Index (SPI).
Using the values in this example, the additional time estimated until project comple-tion is:
TTC [10 (project budget (planned total time)) - 3 (time spent to date)]/0.67 = 10.44 months.
This means that, at the rate the results are being reached, the project will need another 10.44 months to be completed. In other words, the total project time will be 10.44 + 3 = 13.44 months.
The projections only use project-generated information to estimate future values, but they are not a prediction of what will actually occur when the project is complet-ed. They are useful for determining future project values and for taking necessary action to improve performance.
II.4. Outputs
With the earned value, the manager may begin a more detailed analysis to determine why the project is running behind schedule and why it is using more resources than originally budgeted.
One of the areas that the project manager can analyze is the original estimates, since in many cases that is where the manager will find the reason for variances from the plans. In other cases, the reasons may lie in the estimates for completing the activi-ties, since originally the project may have been very optimistic in its estimates and may have failed to consider certain factors, such as risks, delays in contracting with businesses and consultants, delays in contract approval, and changes to the project scope, which can delay activities.
T h i s d o c u m e n t i s i n t e l l e c t u a l p r o p e r t y o f t h e I n t e r - A m e r i c a n D e v e l o p m e n t B a n k ( I D B ) a n d t h e I n t e r - A m e r i c a n I n s t i t u t e f o r E c o n o m i c a n d S o c i a l D e v e l o p m e n t ( I N D E S ) . A n y p a r t i a l o r f u l l r e p r o d u c t i o n o f t h i s d o c u m e n t m u s t b e r e p o r t e d t o : B I D - I N D E S @ i a d b . o r g
L E A R N I N G G U I D E - 2 0 1 8

124
A 1990 study by Beach illustrated that, as early as 15% of project completion, EV met-rics can predict the ultimate completion date and project cost. However, EV measure-ments cannot be tracked closely during early project performance. Therefore, man-agement should not be too hasty in demanding corrective measures if initial reports show unfavorable variances.
Another area of analysis is accounting information, which must show precisely all the expenses incurred for work carried out during a specific period. Once the project manager has identified the reasons for variances and performance, he or she should plan actions that will lead to a reduction in variances. All proposed changes will have to be approved using the established change control mechanisms, since in some cases those changes could have an impact on cost, time, and scope.
T h i s d o c u m e n t i s i n t e l l e c t u a l p r o p e r t y o f t h e I n t e r - A m e r i c a n D e v e l o p m e n t B a n k ( I D B ) a n d t h e I n t e r - A m e r i c a n I n s t i t u t e f o r E c o n o m i c a n d S o c i a l D e v e l o p m e n t ( I N D E S ) . A n y p a r t i a l o r f u l l r e p r o d u c t i o n o f t h i s d o c u m e n t m u s t b e r e p o r t e d t o : B I D - I N D E S @ i a d b . o r g
L E A R N I N G G U I D E - 2 0 1 8

125
Earned value (EV) compares the work planned with what has actually been completed to determine whether the costs and timeframes are as set on the schedule. Since the project cannot account for inputs, materials, services or partially completed delivera-bles, the EV can only be interpreted as a measure of the results delivered/fully com-pleted, and not the efforts or partially finished results.
To calculate the EV it is imperative to have a schedule, accounting information on actual costs as of the analysis date, information on project results completed, and the total project budget.
Earned value analysis is a useful tool for tracking projects, since it provides the man-ager with a quick and easy way to estimate variances in project costs and time to be able to make decisions for the future (costs and time projections at project comple-tion).
U N I T S U M M A R Y
T h i s d o c u m e n t i s i n t e l l e c t u a l p r o p e r t y o f t h e I n t e r - A m e r i c a n D e v e l o p m e n t B a n k ( I D B ) a n d t h e I n t e r - A m e r i c a n I n s t i t u t e f o r E c o n o m i c a n d S o c i a l D e v e l o p m e n t ( I N D E S ) . A n y p a r t i a l o r f u l l r e p r o d u c t i o n o f t h i s d o c u m e n t m u s t b e r e p o r t e d t o : B I D - I N D E S @ i a d b . o r g
L E A R N I N G G U I D E - 2 0 1 8

126
B I B L I O G R A P H I C A L R E F E R E N C E S
Budd, Charles and Charlene Budd (2005).A Practical Guide to Earned Value Project Management. Vienna (VA): Management Concepts.
García López, Roberto and Mauricio García Moreno (2010) La gestión para resultados en el desarrollo: Avances y desafíos en América Latina y el Caribe. Washington, DC: IDB.
Gardiner, Paul (2005).Project Management: A Strategic Planning. New York: Palgrave-Macmillan.
Marshall, Robert (2007). “The Contribution of Earned Value Management to Project Success of Contracted Efforts”, Journal of Contract Management, September.
Meredith, Jack and Samuel Mantel (2003).Project Management: A Managerial Approach. 5th edition. New York: John Wiley & Sons.
Mulcahy, Rita(2009). PMP Exam Prep. 6th edition. United States: RMC Publications.
PM4DEV (2008).Fundamentos de Gerencia de Proyectos. United States: PM4DEV.
Project Management Institute (2013) Guía de los Fundamentos para la Gestión de Proyectos (Guía del PMBOK®)-Quinta Edición. Estados Unidos.
Several authors(2009).Presentation entitled Integrated Project Management Pro-gram (PGIP), 7-Step Methodology. Washington, DC: IDB.
Verzuh, Eric (2007).The Fast Forward MBA in Project Management. New Jersey: John Wiley & Sons.
T h i s d o c u m e n t i s i n t e l l e c t u a l p r o p e r t y o f t h e I n t e r - A m e r i c a n D e v e l o p m e n t B a n k ( I D B ) a n d t h e I n t e r - A m e r i c a n I n s t i t u t e f o r E c o n o m i c a n d S o c i a l D e v e l o p m e n t ( I N D E S ) . A n y p a r t i a l o r f u l l r e p r o d u c t i o n o f t h i s d o c u m e n t m u s t b e r e p o r t e d t o : B I D - I N D E S @ i a d b . o r g
L E A R N I N G G U I D E - 2 0 1 8

127
L I S T O F F I G U R E S
Figure IV.1. Planning matrix development process
Figure IV.2. Relationship between the MEP and the AOP
Figure IV.3. MfDR Scores by pillar
Figure IV.4. Program and project management scores
Figure IV.5. Earned value analysis
Figure IV.6. Earned value illustration
109
113
114
115
120
122
L I S T O F TA B L E S
Table IV.1. Planning matrix example 109
T h i s d o c u m e n t i s i n t e l l e c t u a l p r o p e r t y o f t h e I n t e r - A m e r i c a n D e v e l o p m e n t B a n k ( I D B ) a n d t h e I n t e r - A m e r i c a n I n s t i t u t e f o r E c o n o m i c a n d S o c i a l D e v e l o p m e n t ( I N D E S ) . A n y p a r t i a l o r f u l l r e p r o d u c t i o n o f t h i s d o c u m e n t m u s t b e r e p o r t e d t o : B I D - I N D E S @ i a d b . o r g
L E A R N I N G G U I D E - 2 0 1 8

128
G L O S S A R Y
AcceptanceFormal process whereby project beneficiaries or financing entities accept a product or service delivery.
Acceptance criteriaExecution requirements and essential conditions that must be met before project projections are accepted.
ActivityActivities or work carried out with inputs,such as funds, technical assistance, and other types of resources mobilized to produce specific results. AlternativesNumber of solutions or different proposals that must be assessed and adopted to achieve the project objectives.
Analogous estimationEstimation based on similar previous projects or activities used to determine the duration, effort, and/or cost of a current project. Top-down estimations are frequently used.
Annual Operating Plan (AOP)Detailed plan showing implementation methods, schedules, goals, deadlines, objectives, and assessment time points.
AssumptionSomething assumed to be true without proof of it. When planning, assumptions about staff, task complexity, learning curves, as well as many other factors are used to develop possible scenarios.
BaselinePlan used as a way of comparison for project control reports, i.e., this is a benchmark. There are three project bases: schedule, cost and scope; their combination is known as the execu-tion baseline.
BeneficiaryIndividual or organization benefiting from the project results. The beneficiary has usually significant authority over the acceptance of project results.
BudgetAmount allocated to a project, representing estimated incomes and expenditures. It may be expressed in terms of money or resource units (effort).
ChangeVariation in an event as compared to the expect-ed value. The most important changes in project management are connected to the definition of the project scope, resource availability, schedule and budget.
Change controlProcess ensuring that all changes in scope, schedule, quality objectives, or benefits agreed upon are identified and assessed to approve, reject or postpone them.
Change in scopeAny modification in the definition of the project scope, resulting from changes in the needs of beneficiaries or financing entities, the acknowl-edgement of flaws or omissions, regulatory changes, etc.
Change requestDocumented request to ask for a change in scope or other plan elements.
CloseProcess whereby the formal acceptance of the final results of a phase or project is obtained in an orderly fashion. It entails the creation of project information filesand a project post-com-pletion assessment.
CommunicationGiving, receiving, or processing and interpreting information. Communication may be verbal or non-verbal, active or passive, formal or informal, conscious or unconscious.
T h i s d o c u m e n t i s i n t e l l e c t u a l p r o p e r t y o f t h e I n t e r - A m e r i c a n D e v e l o p m e n t B a n k ( I D B ) a n d t h e I n t e r - A m e r i c a n I n s t i t u t e f o r E c o n o m i c a n d S o c i a l D e v e l o p m e n t ( I N D E S ) . A n y p a r t i a l o r f u l l r e p r o d u c t i o n o f t h i s d o c u m e n t m u s t b e r e p o r t e d t o : B I D - I N D E S @ i a d b . o r g
L E A R N I N G G U I D E - 2 0 1 8
129
Communication management
Collection, storage, dissemination, and filing of project information.
Submitted reports collect information and present it in an adequate format, including formal communication for stakeholders.
ConsensusUnanimous agreement among decision-makers.
ContingenciesPlanned actions to minimize the impact of a problem, in case the problem arises.
Contingency reserveTime and/or budget allocated for events that cannot be completely foreseen.
ContractFormal document granting the project manager authority to manage a project within the restric-tions of scope, quality, schedule and budget, all provided for in the document.
CrashingEstimated schedule compression technique, which reduces one or several activities in the critical path using additional resources.
Critical pathPath covering from start to end of the project and taking longer than other paths. There may be more than one critical path and it may change during the project.
DependencyLogical relationship among activities or between an activity and a landmark.
DurationRequired or planned period of time for the execution of an activity or project. It is measured in units of calendar time: days, weeks, months.
Earned valuePlanned costs of completed work at a specific date.
Earned value managementControl process based on a structured proposal for planning, cost recovery, and execution measurement. It makes it possible to integrate scope, schedule and budget objectives, and establish a plan for measuring execution.
EffectShort- or mid-term results, expected or achieved with the intervention; they usually require the collective effort of beneficiaries. Results repre-sent changes in development conditions, occur-ring between completion and the achievement of an impact.
EffortHuman resource time required to execute an activity. It is measured in terms of hour/person, days/person, etc.
EstimatesUse of a set of tools and techniques to make projections. It is an approximation of the sched-ule and budget objectives, which is adjusted during the project life cycle.
EstimationAssessment of the duration, effort, and/or cost required to complete a task or project. Since estimations are not updated, they must be expressed with some parameter indicating their degree of reliability.
EvaluationAnalysis of relevance, effectiveness, and efficien-cy of project interventions and their impact (expected or unexpected) in relation to set objectives.
Expert in the fieldSpecialist in some project aspect, who is expect-ed to provide information on social, scientific, engineering, or other aspects. Information may be in the form of requirements, planning, situa-tion-specific solutions, and/or project result review.
Fast TrackingSchedule compression techniques, which entail performing activities in parallel instead of sequentially with additional resources. Risks may be higher in this case.
T h i s d o c u m e n t i s i n t e l l e c t u a l p r o p e r t y o f t h e I n t e r - A m e r i c a n D e v e l o p m e n t B a n k ( I D B ) a n d t h e I n t e r - A m e r i c a n I n s t i t u t e f o r E c o n o m i c a n d S o c i a l D e v e l o p m e n t ( I N D E S ) . A n y p a r t i a l o r f u l l r e p r o d u c t i o n o f t h i s d o c u m e n t m u s t b e r e p o r t e d t o : B I D - I N D E S @ i a d b . o r g
L E A R N I N G G U I D E - 2 0 1 8

130
Gantt chartBar chart describing the schedule of key activity events, whose goalis to show the time allocated to different activities along the total project time span. Activities (projects, operational activities, project activities, tasks, etc.) are placed in the vertical axis and time in the horizontal axis. Activities are shown as horizontal bars, whose length is equivalent to the activity duration. Gantt charts can be completed with dependency relations and other schedule-related information. GoalHigher-level objective for which a development intervention is necessary.
GovernancePlanning and managing project policies and affairs.
Governance modelProcesses, roles and responsibilities agreed upon to govern the project progress and direction.
Human resource managementUnderstanding and application of the policies and procedures directly affecting individuals working in the project team and the work team as a whole. These policies include recruitment, retention, reward, recognition, personal develop-ment, training and career development.
ImpactLong-term positive and negative effects on groups that can be identified by means of a direct or indirect development intervention. These effects may be financial, socio-cultural, institu-tional, environmental, technological, etc.
ImplementationThird phase in the project life cycle, during which the multi-annual execution plan (MEP) is execut-ed, monitored and controlled. In this phase, the design is completed and used to obtain results.
LapseTime period available so that a task can be carried out without a delay in the project comple-tion date. It is the difference between the early and late dates of task initiation.
LeadershipSkill to set the project vision and direction, to influence and align others toward a common goal, and to delegate and inspire other people to achieve project success. It helps the project develop in an environment of change and uncer-tainty.
Lessons learnedSet of experiences obtained after the completion of the project or part of it. Experiences describe neutrally what worked and what did not, and include a report of the risk of not following the lessons learned. Understanding and sharing the lessons learned is an important part of the improvement process.
LinkRelationship between two or more tasks.
Logical frameworkManagement tool used to improve intervention design, often at project level. It entails identify-ing elements and causal relations, indicators, assumptions, and risks impacting on success or failure. It facilitates the planning, execution and evaluation of a development intervention.
Management for resultsManagement strategy used by an organization to ensure that its processes, products and services contribute to the achievement of expected results (outputs, results, and impact). This strategy entails assigning clearly defined respon-sibilities to achieve results; it requires monitoring and progress self-evaluationand execution reports.
Methods and proceduresThey detail the standards to be used to manage projects throughout their life cycle. Methods provide a consistent framework for project management. Procedures cover individual aspects of project management and are an integral part of a method.
MitigationActions carried out to eliminate or reduce a risk by reducing the probability and impact of an occurrence.
Mitigation strategiesIdentification of the steps to follow to reduce risks by reducing the probability of occurrence or impact of a risky event.
T h i s d o c u m e n t i s i n t e l l e c t u a l p r o p e r t y o f t h e I n t e r - A m e r i c a n D e v e l o p m e n t B a n k ( I D B ) a n d t h e I n t e r - A m e r i c a n I n s t i t u t e f o r E c o n o m i c a n d S o c i a l D e v e l o p m e n t ( I N D E S ) . A n y p a r t i a l o r f u l l r e p r o d u c t i o n o f t h i s d o c u m e n t m u s t b e r e p o r t e d t o : B I D - I N D E S @ i a d b . o r g
L E A R N I N G G U I D E - 2 0 1 8

131
MonitoringRoutine process of collection, storage, analysis and report of project information used to make decisions for project control. Monitoring provides the project and stakeholders with the necessary information to assess the project progress, identify tendencies, patterns or deviations, and keep the schedule focused on expected goals.
Monitoring and evaluation systemsIntegrated set of support tools, processes, and methods to manage project information. It must be applied consistently to support decision-mak-ing and the information needs of the project and its stakeholders.
Multi-Annual Execution Plan (MEP)Plan listing project objectives, results and costs with a duration of several years.
NegotiationSeeking an agreement by means of acceptance, consensus and alignment of ideas. In a project, negotiation may be informal along the project life cycle or formal during procurement processes and among contract parties.
Network chartGraphic tools to chart the sequence of project tasks and their relations. This technique presents visually project activity dependencies and makes it possible to calculate their total duration. PERT, critical path, arrow and precedence charts are examples of network charts.
ObjectiveSomething to be achieved. In project manage-ment, objectives are the expected results of a project or part of it, in terms of concrete responses (e.g. improved service, more crops, health improvement, etc.).
ParametersEstimation using an algorithm, where parameters representing different project attributes are used to calculate project effort, cost and/or duration. Estimation with parameters is frequently used in top-down estimation.
PERTThe Project Evaluation and Review Technique uses an analysis of dependency and critical path to determine the duration of the project and priority activities. With this too, which makes estimations based on three values, the task duration is calculated as follows: D = (O + 4A + P) / 6; that is: (optimistic duration + 4 x average duration + pessimistic duration) / 6.
PERT chartType of network chart receiving its name from the PER technique (see PERT). The term is often used as a synonym of network chart.
PhaseSet of project products, deliverables and work packages necessary to achieve the objectives by attaining significant results, such as the defini-tion of requirements or documents for product design. A project is divided into a set of phases for control purposes. The phase is usually the highest level of project division in the work breakdown structure.
PlanningProcess to establish and maintain the definition of a project scope, project execution modes (procedures and tasks), roles and responsibilities, and estimated time and costs.
PortfolioSet of projects and programs carried out under the auspices of an organization. Portfolios may be managed at an organization, program or functional levels.
Portfolio managementSelecting and managing all organization’s projects, programs and related activities consid-ering resource restrictions.
Predecessor taskTask (or activity) that must be started and completed before another task is executed.
ProbabilityProbability of a risk occurrence. It is usually expressed as a percentage or a three-level scale–low, average, or high.
ProcessSeries of steps or actions to achieve something. A natural series of changes or occurrences.
T h i s d o c u m e n t i s i n t e l l e c t u a l p r o p e r t y o f t h e I n t e r - A m e r i c a n D e v e l o p m e n t B a n k ( I D B ) a n d t h e I n t e r - A m e r i c a n I n s t i t u t e f o r E c o n o m i c a n d S o c i a l D e v e l o p m e n t ( I N D E S ) . A n y p a r t i a l o r f u l l r e p r o d u c t i o n o f t h i s d o c u m e n t m u s t b e r e p o r t e d t o : B I D - I N D E S @ i a d b . o r g
L E A R N I N G G U I D E - 2 0 1 8

132
ProcurementProcess whereby the resources (goods and services) required for a project are procured. It includes the development of a procurement strategy, contract preparation, vendor selection and contract management.
ProductsGoods or services resulting from completed activities.
ProgramSet of related projects and continuous operation-al activities managed as a whole.
Program managerPerson managing program planning and execu-tion, responsible for the program success.
ProjectEffort in time to produce a unique product, service or result.
Project assumptionsWritten project declarations clarifying its scope, objectivesand other relevant factors not known at a certain time.
Project CharterDocument that concisely describes the project used to authorize the project manager to begin work. It is also known as “project summary”, among other names.
Project contextThe environment where the project is executed. Projects do not exist out of context; understand-ing the project execution context helps manage development projects.
Project environmentCombination of external and internal forces, both individually and collectively, which may contrib-ute to or hinder the achievement of project objectives.
Project life cycleSet of phases, usually sequential, used to imple-ment the project.
Project managementProcess whereby a project is defined, planned, monitored, controlled, and delivered. Projects are unique and seek to achieve an expected result. Since project effect changes, project management is the most effective way of dealing with these changes.
Project management governanceDeals with the areas of corporate governance specifically related with project activities. Effec-tive governance ensures that the organization’s project portfolio is aligned with the organization’s objectives and is completed effectively and sustainably.
Project managerIndividual responsible for project planning, execution, and success.
Project objectivesWhat is obtained from a project activity or phase. A clearly defined objective must be specific, measurable, attainable, realistic, and timely.
Project risk managementStructured process which allows for individual risks or project risksto be understood and man-aged proactively, optimizing the project success, reducing threats and maximizing opportunities.
Project scope declarationConcise and accurate description of work, products and expected deliverables. It includes the work and products not included in the project.
Project stakeholdersPeople who are interested in the project result or are impacted by it. All the people participating in the project: beneficiaries, financing entities, collaborators, general public and local organiza-tion.
Project stakeholder managementIdentification, analysis and systematic planning of actions to communicate, negotiate and influence stakeholders.
Project successMeeting the stakeholders’ needs. It is measured based on success criteria, identified and agreed upon at the beginning of the project.
T h i s d o c u m e n t i s i n t e l l e c t u a l p r o p e r t y o f t h e I n t e r - A m e r i c a n D e v e l o p m e n t B a n k ( I D B ) a n d t h e I n t e r - A m e r i c a n I n s t i t u t e f o r E c o n o m i c a n d S o c i a l D e v e l o p m e n t ( I N D E S ) . A n y p a r t i a l o r f u l l r e p r o d u c t i o n o f t h i s d o c u m e n t m u s t b e r e p o r t e d t o : B I D - I N D E S @ i a d b . o r g
L E A R N I N G G U I D E - 2 0 1 8

133
Project team membersMembers of the project central team and other individuals appointed to develop and/or support project work.
Required approvalNecessary authorizations, usually from a high-level authority.
ResourceAny tangible support (human resources, tools, provided items, etc.) used in project execution.
Resource allocationProcess whereby resources (financial, human, equipment-or skill-related) are allocated to a project, on a one-by-one activity basis.
Resource managementIdentifies and allocates resources so that the project starts with the right level of resources with reasonable duration. Resource distribution, leveling and scheduling are techniques used to adequately determine and manage resource levels.
ResponsibilityObligation to execute or take care of something, usually becoming accountable in case of failure. Responsibility may be delegated, but delegation does not eliminate responsibility.
Responsibility Assignment Matrix (RAM)Tool that relates each project activity in the work breakdown structureto the organizational unit responsible for it. Its purpose is to ensure that work is assigned to one or more individuals (only one of them is responsible) and that they are aware of their roles.
RestrictionCondition that may limit or affect the project, e.g. a fixed delivery date may be a schedule restriction. In general, restrictions are out of the project team’s control, e.g., a schedule may be restricted by limited available resources.
ResultAny item produced by a project or any part of it. The project result is different from the time result deriving from its activities. A result must be tangible and verifiable. Each element (activity or task) in the work breakdown structure must have one or more results.
Results Matrix (RM)Tool to develop and present the correlation between the project objectives and the sectoral result indicators aligned with a country’s devel-opment goals.
RiskForeseen or unforeseen events capable of affecting the expected project objectives and results. It is usually expressed in terms of the consequence of events (impact) and the proba-bility of their occurrence. In general, the event is negative, like the project failure, but it may be possible, like the early completion of a task.
Risk analysisEvaluation of risk areas or events with a view to analyzing the probable consequences of each event or their combination. Determination of the possible options to prevent risks.
Risk assessmentPart of risk management whereby planners identify potential risks and describe them, usually in terms of their symptoms, causes, probability of occurrence and potential impact.
Risk impactDamage or consequences suffered by a project in case the risk occurs. It is normally expressed as a three-level scale: low, average and high.
Risk indicatorsIndicators specifying when an action must be carried out, like the implementation of a risk contingency plan.
Risk responseActions taken to manage risk occurrences. Contingency plans are a set of risk responses.
Risk probabilityProbability of a risk occurrence. It is normally expressed as a percentage on a three-level scale: low, average and high.
ScheduleIndication of dates (absolute or relative) when project tasks will be started and completed, and when required resources will be obtained and events achieved.
ScopeWork that must be done to deliver project products and deliverables.
T h i s d o c u m e n t i s i n t e l l e c t u a l p r o p e r t y o f t h e I n t e r - A m e r i c a n D e v e l o p m e n t B a n k ( I D B ) a n d t h e I n t e r - A m e r i c a n I n s t i t u t e f o r E c o n o m i c a n d S o c i a l D e v e l o p m e n t ( I N D E S ) . A n y p a r t i a l o r f u l l r e p r o d u c t i o n o f t h i s d o c u m e n t m u s t b e r e p o r t e d t o : B I D - I N D E S @ i a d b . o r g
L E A R N I N G G U I D E - 2 0 1 8

134
Scope change controlThis process, also known as “scope change management,” ensures that all the changes in the project scope are consciously evaluated and that their implications for the project plan are consid-ered in decision-making in order to make the change, postpone it or reject it.
Scope CreepUncontrolled changes in scope, which make the project use up more work than originally expect-ed. This often results in higher costs than expect-ed and a delay in the initial completion date.
Scope definitionDivision of the largest project deliverables into smaller and more manageable components to verify and control the project more easily. This may be part of the definition of requirements and/or the design.
Scope managementProcess whereby results and work done to produce them are identified and defined. Scope identification and definition must describe what the project will include and exclude, i.e., what is in and out of scope.
Scope verificationProcessto ensure that all the project results have been completed successfully. It is associated with product acceptance on the part of benefi-ciaries and financing entities.
Sequential tasksPart of the schedule process where tasks are in a series or in parallel based on the dependencies among them. The sequence produces a task network.
SpecificationsDetailed declarations of project results deriving from the design and definition of requirements. Specifications usually describe results in terms of occurrences, operational restrictions and quality attributes; they are the basis for acceptance criteria used in scope verification and quality control.
Steering CommitteeGroup of people supporting the project and guiding the project/program manager.
Strategic planPlan strongly linked to the organization’s mission, vision, values and objectives. It greatly depends on the management level of coordination and influence to achieve its goals.
TaskPart of work requiring an effort and resources to obtain a concrete result.
TeamworkPeople collaborating toward a common goal.
Top-down estimationEstimation of size (duration and cost) and risk of a project or part of it, considering the project as a whole and comparing it with similar previous projects. The analogy can be made directly using an “analogous estimation,” an algorithm, like the “parametric estimation,” or resorting to estima-tion experts.
VarianceDifference between estimated cost and duration, or the effort of the actual execution result. It may also be the difference between the scope of the initial product and the actually delivered product. VendorOrganization or individual providing the project or its beneficiaries with products or services by means of contracts. Also called subcontractor and supplier.
Work Breakdown Structure (WBS)Hierarchical organization of work developed by breaking downthe project into products, delivera-bles and work packages. The WBS is a diagram (hierarchical chart) or a list of detailed items which are subordinated to other higher-level items.
Work estimationEvaluation of the size (duration and cost) and risk of a project or part of it by dividing activities, tasks and subareas to estimate effort, duration and cost individually or as a whole to make a complete evaluation. Determining duration in this way requires leveling resources sequentially as part of a scheduled process.
T h i s d o c u m e n t i s i n t e l l e c t u a l p r o p e r t y o f t h e I n t e r - A m e r i c a n D e v e l o p m e n t B a n k ( I D B ) a n d t h e I n t e r - A m e r i c a n I n s t i t u t e f o r E c o n o m i c a n d S o c i a l D e v e l o p m e n t ( I N D E S ) . A n y p a r t i a l o r f u l l r e p r o d u c t i o n o f t h i s d o c u m e n t m u s t b e r e p o r t e d t o : B I D - I N D E S @ i a d b . o r g
L E A R N I N G G U I D E - 2 0 1 8

135
Work packageGroups of activities representing the last level in the work breakdown structure where it is execut-ed. It can be scheduled and controlled, and its cost and duration can be estimated.
It usually lasts a week or more and is carried out by one individual or a small group.
T h i s d o c u m e n t i s i n t e l l e c t u a l p r o p e r t y o f t h e I n t e r - A m e r i c a n D e v e l o p m e n t B a n k ( I D B ) a n d t h e I n t e r - A m e r i c a n I n s t i t u t e f o r E c o n o m i c a n d S o c i a l D e v e l o p m e n t ( I N D E S ) . A n y p a r t i a l o r f u l l r e p r o d u c t i o n o f t h i s d o c u m e n t m u s t b e r e p o r t e d t o : B I D - I N D E S @ i a d b . o r g
L E A R N I N G G U I D E - 2 0 1 8

V I S I T O U R W E B S I T E A N D S O C I A L M E D I A