too good to waste - sustainable restaurant association€¦ · too good to waste report contents...
TRANSCRIPT

PUBLICATION: SRA002
VERSION: V001
PUBLISHED: 16/09/10
AUTHOR: SRA
SUSTAINABLE RESTAURANT ASSOCIATION
Too Good to Waste
Restaurant Food Waste Survey
Report (2010)
Too Good to WasteWELCOME
Media reports, prime time TV, political comment, celebrity in-volvement…food waste is suddenly big news.
The numbers are impressive and the agreement universal that “something must be done” but as with most issues, the reality behind the rhetoric is far from straightforward. Food waste is a catch-all phrase which includes consumers at home and on the go, retailers, growers, manufacturers, contract caterers, restau-rants and many areas in between, each subject to its own drivers and issues.
At the Sustainable Restaurant Association, our interest is in res-taurants and their long-term success.
What does food waste mean in a restaurant? What is the scale of the issue and what does it cost? What proportion of food waste is spoilage, what comes from preparation and how much comes back from customers? What are the most cost effective ways for a restaurant to tackle food waste?
To elevate food waste to an issue that receives serious attention, to get restaurants to change the way they do business and to potentially invest in new equipment we need to understand the issue in detail. This research, carried out with the fantastic support member restaurants, is a step in the right direction, helping to demystify restaurant waste and put some serious numbers to the money that could be saved, as well as the environmental impact avoided, through greater awareness and better management of waste.
The results of this research will be publically available for down-load through the SRA website and we hope that it will convince more restaurants that better food waste management is a simple way to cut costs and operate more sustainably. Simon Heppner Managing DirectorSustainable Restaurant Association
September 2010
25 Gerrard Street, London, W1D 6JL0207 479 4224www.thesra.org [email protected]

Too Good to Waste reportINTRODUCTION
Despite the recent surge in mainstream interest, restaurants have been slow to take action on food waste, even though most people are aware of the issues -
The environmental impacts include carbon emissions from the collection and transportation of waste; the impacts from food waste in landfill; and the fact that throwing so much away means we need to grow more in the first place – more land, more energy and inputs to grow and produce it all. Then there are the finan-cial impacts: the vast amount of money caterers and consumers spend on food that is destined for the bin, the cost of waste dis-posal to consider too, from collection fees to landfill tax.
You don’t have to be a genius to see that food waste = lost prof-its, simple as that.
Compare all that to the benefits of reducing food waste, to the planet, to society and to a restaurants’ bottom line and you won-der why more restaurants aren’t doing more to tackle it. Hence the Sustainable Restaurant Association Restaurant Food Waste Survey, designed to take a closer look at food waste in restau-rants and in particular where the food waste is coming from (prep waste, customer plate waste, spoilage etc) in order to help restau-rants tackle their food waste and reap the benefits for planet and profit.
The Sustainable Restaurant Association (SRA) conducted res-taurant food waste surveys throughout late July to early August 2010. The surveys took place in 10 volunteer Member restaurants across London, chosen to represent a broad spectrum of restau-rant types in the UK and thus provide an average representation of restaurant food waste in the UK.
The 10 SRA Member restaurants that participated in our Food Waste Survey were: Petrichor @ The Cavendish; The Three Stags; Sam’s Brasserie; Franklins; Harrison’s; Norman’s Coach and Hors-es; Feng Sushi (Notting Hill); The Breakfast Club (Islington); Simp-son’s on the Strand and The Modern Pantry. These 10 restaurants include a la carte bistros, fine dining establishments and casual dining restaurants with a weekly cover capacity ranging from 230 to 2,300.
The purpose of the survey was to capture real, measured data about restaurant food waste over the course of one day, sepa-rated into three streams: customer plate waste; prep waste and spoilage.
Too Good to Waste reportINTRODUCTION cont.
While comprehensive information is available about supermarket retail and domestic food waste patterns, very little data is avail-able at present that reflects the food waste patterns of UK restau-rants. Information that is known in this area, such as the restaurant industry generates around 3 million tonnes of food waste each year , is illuminating but too general to demonstrate where the balance of food waste is between customer plate, spoilage and preparation waste and determine the real causes of this waste.
The results and information from the Food Waste Survey will be used to encourage restaurants to reduce their food waste, from the preparation stage (ordering and menu planning by the kitchen staff) through to the consumer end (such as customer plate waste due to over-portioning or other factors). These recommendations may range from providing practical tips to restaurants to reduce restaurant food waste through to consumer education about food waste and promotion of waste-reduction activities such as the use of doggy bags.
Restaurant Members that took part in the survey have already commented on the impact the results have had on their food waste output and their commitment to doing more about it. With ongoing support and suggested actions from the SRA, they can continue to reduce food waste and in the process, cut costs to the environment and reduce waste overheads. As three surveyed restaurants confirmed: “The numbers from this survey will really help the staff under-stand exactly how much food waste we produce here, and help them understand why it’s important to try and reduce the waste.”Michael Howie (Head Chef, The Three Stags)
“We didn’t realise how little our customer food waste was compared to other waste types, until doing this survey. We usually just mix it all together. We will now look into doing a full waste audit so we can really understand where our all our waste comes from.”Karolina Dropinska (Assistant Manager, Harrison’s)
“After the food waste survey, my sous chef was surprised that so much prep waste went into the bin, the majority of it was orange skin & potato peelings. Now we have decided to use up the potato peelings still with good potato bits on and doing skin-on chips for the staff canteen and orange marmalade for our breakfast in Petrichor so we will have less prep waste in the kitchen.”Nitin Padwal (Head Chef, Petrichor)
Source 1: WRAP, 2008

Too Good to Waste reportCONTENTS
FAST FACTSPARTICIPATING SRA MEMBER RESTAURANTS:
• Petrichor
• The Three Stags
• Sam’s Brasserie
• Franklins
• Harrison’s
• Norman’s Coach and Horses
• Feng Sushi (Notting Hill)
• The Breakfast Club (Islington)
• Simpson’s on the Strand
• The Modern Pantry
1. EXECUTIVE SUMMARY- 1.0 Top line results- 1.1 Potential savings to restaurants- 1.2 Reduction of potential greenhouse emissions- 1.3 Suggested actions to reduce restaurant food waste
2. METHODOLOGY- 2.0 Scope- 2.1 Measurement- 2.2 Definitions- 2.3 Assumptions and limitations
3. RESULTS- 3.0 Restaurant food waste: breakdown by weight (kg) and waste stream (%)- 3.1 Weight (kg) food waste per cover (person served)- 3.2 Greenhouse Gas Emissions – food waste to landfill, composting and anaerobic digestion- 3.3 Waste management fees for food waste collection- 3.4 Annual £ savings from 20% reduced food waste- 3.5 Reasons given for food waste- 3.6 Practical actions for restaurants to reduce food waste
4. CONCLUSIONS- 4.0 Recommendations- 4.1 Cost savings- 4.2 Restaurant feedback
5. ATTACHMENT A: Full Food Waste Survey results
6. ATTACHMENT B: Food Waste Survey Chart
7. ATTACHMENT C: Restaurant Background Record Sheet
Too Good to Waste report1 EXECUTIVE SUMMARY
FAST FACTS The 10restaurants we surveyed produced an average of 0.48kg of food waste per diner.
This means nearly half a kilo of food waste each time we eat out
The SRA wanted to shed some light on the topical issue of food waste in restaurants to help our Member restaurants reap the many benefits of reducing food waste. Namely, reducing the amount of money spent on waste collection fees, and on food destined for the bin; and reducing the environmental impact of generating so much food waste.
We therefore carried out a series of food waste surveys with 10 Member restaurants across London in July and August 2010 in order to investigate the quantity and types of food waste produced. These restaurants were chosen to represent a broad spectrum of restaurants in the UK in order to collec-tively represent an ‘average restaurant’.
Specifically we aimed to identify how much food waste comes back from customers’ plates, how much is generated during preparation and how much comes from out-of-date or other-wise unusable items.
1.0 Top line results
The restaurants we surveyed produced an average of 0.48kg of food waste per diner. This means that each time diners eat out, they could be party to the generation of nearly 0.5kg of food waste.
Overall, the average food waste balance from the surveyed restaurants was:
• 65%offoodwastecomesfrompreparation– peelings, off cuts and anything ruined while cooking
• 30%offoodwastecomesbackfromcustomers’plates
• 5%offoodwasteisclassifiedas‘spoilage’– out-of-date or unusable items
1.1 Potential savings to restaurants
Restaurants could do a lot to reduce their food waste. It is important for restaurants to make the connection between reducing food waste and cost savings. Restaurants are effectively paying twice for all food items that are thrown out – once for the food that has been purchased but not used and secondly to have it taken away as waste.

Too Good to Waste report1 EXECUTIVE SUMMARY cont.
FAST FACTS The survey showed this breakdown of food waste:
•65%isfrompreparation – peelings, off cuts and any-thing ruined while cooking
•30%comesback from cus-tomers’ plates
•5%is classified as ‘spoilage’ – out-of-date or unusable items
Based on the restaurants we surveyed, waste collection figures and wholesale food costs, if an average restaurant reduced its food waste by just 20% it could generate annual savings of:
• Over4tonnesoffoodwasteperrestaurant • Morethan£2,000fromavoidedfoodcosts,byfrom using food that would normally have been thrown away
• Between£150-£1,700onwastecollectioncosts,iffood waste is collected for anaerobic digestion (AD)
These savings will grow in coming years as waste pick-up fees will rise due to increasing landfill tax.
In June 2010 the UK Government announced that current landfill tax rate of £48 per tonne will increase by £8 per tonne in April 2011, and continue to increase until at least 2014.2
These increased rates will affect all waste management services, which in turn will be passed on as an increased cost to restaurants. So implementing measures to reduce the amount of waste going to landfill now will generate bigger and bigger savings.
The increase in landfill tax will also make it more cost effective to have food waste collected for composting or AD in comparison to sending it to landfill.
1.2 Reduction of potential greenhouse gas emissions
We also used our Restaurant Food Waste Survey results, Defra figures and waste collection service reports to calculate the potential greenhouse gas (GHG) emissions from food waste that was: sent to landfill; collected for composting; collected for anaerobic digestion.
• GHGemissions per restaurant, if food waste is sent to landfill: 7.972 tonnes CO2-equivalent
• GHGsavings per restaurant if food waste is composted instead of landfilled: 7.3 tonnes CO2-equivalent
• GHGsavings per restaurant if food waste is sent for anaerobic digestion instead of landfill: 10.15 tonnes CO2- equivalent
Source 2: June 2010 UK Government Budget announcement http://ww2.defra.gov.uk/2010/06/23/june-2010-budget-key-announcements-for-environment/
Too Good to Waste report 1 EXECUTIVE SUMMARY cont.
FAST FACTS If an average restaurant reduced its food waste by just 20%itcouldgenerate annual savings of:
•Over4tonnesof waste per restaurant •Morethan£2,000 from avoided food purchase costs
•Between £150-£1,700 each year on waste collection costs
The recent count of restaurants in the UK is 27,153 (not including pubs and hotel restaurants).3 If all these restaurants were to send the ‘average’ amount of food waste to landfill (21.842 tonnes / year according to our Too Good to Waste re-port (See Section 3.2)) producing 7.972 tonnes of GHG emissions per restaurant, the annual GHG emissions from food waste in this sector would be 216,473 tonnes.
1.3 Suggested actions to reduce restaurant food waste
Our Too Good to Waste report also includes a number of suggested actions to help restaurants reduce their food waste and reach reduction targets of at least 20%. These are based on what the restaurants were already doing as well as ideas generated by participating in the survey.
By implementing some of these actions, or a combination of them, to reduce food waste, each restaurant could save money on food purchase costs, waste management fees and reduce their restaurant’s greenhouse gas emissions.
General recommendations:• Carryoutarestaurantfoodwastesurveytomeasure waste• Reducewasteatsourceandengagestaffontheissue• Separatefoodwasteforcompostingoranaerobic digestion• JointheSRAforongoingadviceandsupport
Preparation waste:• Carefulorderingandmenuplanning• Workingwithsuppliers• Keepingskinsonvegetablese.g.skin-onpotatochips• Re-usingediblefooditemsthatoftengetthrownout e.g. orange peel from making orange juice can be kept for making marmalade, parsley stalks for stocks • Orderingfishandmeatcutstospecification• Employingnose-to-taileating
Customer plate waste:• Carefulconsiderationofportionsizesaswellasoffering differentportionsizes• Offeringdoggybagswhereappropriate• Menuplanningtoensurethefoodwillmeetwith customer expectations during winter and summer
Source 3: Caterersearch, 2008 http://www.caterersearch.com/Articles/2010/05/06/317292/number-of-hospitality-and-catering-outlets-industry-data.htm

Too Good to Waste report1 EXECUTIVE SUMMARY cont.
FAST FACTSIf all the 27,153 UK restaurants were to send the ‘average’ amount of food waste to land-fill, the annual GHG emissions from food waste in the sec-tor would be 216,473 tonnes.
weather, and observation of any patterns of items that are consistently returned uneaten, such as some salad items or condiments
Spoilage:• Carefulordering• Correctfridgetemperatures–checkedregularly• Duediligencewithlabellingandstorage
Suggested actions to help reduce food waste in restaurants (Top to bottom): Encourage customers to take doggy bags or boxes; Practice nose-to-tail eating; Separate food waste for composting or anaerobic digestion
Too Good to Waste report2 METHODOLOGY
FAST FACTSOur 10 restau-rants, had a seating capacity ranging from 35 to 124 seats and staff numbers from 10 to 46. We aimed for a variety of restaurant types to generate results as close to an ‘average’ restaurant as possible.
The SRA Restaurant Food Waste Survey was designed to be as simple and straightforward as possible - a ‘snapshot’ of food waste in 10 London restaurants for a day.
2.0 Scope
As this was a pilot study, it was agreed that engaging restau-rants geographically close to the SRA office in London was the most efficient use of SRA time and resources. Across the 10 participating restaurants, the seating capacity ranged from 35 to 124 seats and staff numbers ranged from 10 to 46, including both kitchen and front-of-house staff. We aimed for a variety of restaurant types to generate results as close to an ‘average’ restaurant as possible.
It was decided that conducting the Restaurant Food Waste Survey midweek for one day was a better option than a Fri-day, Saturday or Sunday. This ensured that the restaurants would not be at their busiest and therefore would have the time to separate and weigh the food waste on their less-busy days and would also consistently capture customer patterns of a working day lunch and dinner.
2.1 Measurement
The SRA food waste auditor visited the restaurants in the week of the survey to drop off the equipment and gather in-formation on the restaurants’ current food waste actions. The auditor met with kitchen and front-of-house staff to explain what they would need to do the next day for the survey and ensured that one or two staff were designated ‘Survey Lead-ers’ who would take responsibility for ensuring food waste was separated correctly and that the food waste was weighed the next day.
The SRA provided colour-coded bins that were labelled ‘Spoil-age’, ‘Prep waste’ and ‘Customer plate waste’ to capture the three different food waste streams. Bin bags and fish-hook scales for collecting and weighing food waste were provided by the SRA to ensure this survey came at no cost to restaurants.
The three different types of food waste were weighed throughout the selected day and the resulting kilogram weight recorded on a chart provided by the SRA (Attachment B). Following the survey day, the completed charts were returned to the SRA food waste auditor to add to the accumulated survey results.

Too Good to Waste report2 METHODOLOGY cont.
FAST FACTSThe SRA provided the restaurants with colour-coded & labelled bins, bin bags and fish-hook scales for collecting and weighing food waste to ensure this sur-vey came at no cost to restau-rants.
2.2 Definitions: What do we mean by ‘Spoilage’, ‘Prep waste’ and ‘Customer plate waste’?
Spoilage Produce that has gone off or has been contaminated and is unusable. This includes front-of-house items from the dining room e.g. mouldy bread
Prep waste Food waste generated as part of the menu preparation and cooking process, including items that could be used but are thrown out e.g. peelings or off cuts for stock. This includes meals cooked for customers that don’t get served (overcooked or ruined etc). Itisrecognizedthatsomeprepwastecould never be used for service (eg fruit stones) but it is useful to record it as it could still be sent for composting or anaerobic digestion
Customer plate Prepared food that comes back from the waste customer, including meals that have been untouched
2.3 Assumptions and limitations
The Restaurant Food Waste Survey was intended to provide a snapshot overview of food waste in a small sample of restau-rants so all results in this report should be viewed as a guide to the likely numbers involved and the general principles at stake. We wanted to be clear about the limitations of our re-search and so have set these out below, in the name of trans-parency.
Each restaurant food waste survey was conducted in late July or early August, which is the quietest period for most of the participating SRA Member restaurants. The data from this survey will likely be different to the data received if the survey was done at another time of the year.
The food waste measured on one single day is likely to be dif-ferent in volume, weight and type to the food waste produced on the next day – this data has been extrapolated to reflect the food waste from 365 days of the year so this must be seen as a general indicative figure. These calculations are based on the assumption that the participating restaurants operate 365 days of the year and are open for lunch and dinner service seven days a week.
Too Good to Waste report2 METHODOLOGY cont.
FAST FACTSThe Survey Leaders all com-mented, that the survey had been a very simple process and much easier than initially expected to separate the food waste streams and weigh the resulting waste.
Some participating restaurants may be already doing more to reduce their food waste than others and non-SRA-Member restaurants; customer plate waste cannot be measured as accurately for any restaurants that have take-away and deliv-ery customers; larger restaurants may cater for banquets or large parties on top of their usual a la carte diners. However, as these and other anomalies also exist across the restaurant industry we believe that our snapshot survey comes as close as possible to providing an acceptable overview of food waste in restaurants in general.
The Survey Leader from each participating restaurant com-mented, after the survey, that it had been a very simple pro-cess and much easier than initially expected to separate the food waste streams and weigh the resulting waste. While every effort was made by the SRA and the staff from partici-pating restaurants to follow the survey procedure as precisely as possible, we acknowledge a potential for error, e.g. putting food waste in the wrong bin. However the margin for error is small and any minor errors in food waste measurement should not significantly distort the results and conclusions.
To provide estimates on cost savings and greenhouse gas savings as a result of reducing food waste, the calculations are based on 20% food waste reduction, as this figure is a potentially achievable target for most restaurants. This is an indicative number only, to illustrate the benefits of food waste reduction in numerical terms.
Restaurants receive their waste stream bins in preparation for the Res-taurant Food Waste Survey (Left to right): Harrison’s; Simpson’s on the Strand

Too Good to Waste report3 RESULTS
FAST FACTSThe results show poten-tial savings for restaurants in terms of •Foodwastemanagement costs, •Greenhousegas emissions •Costsavingsfrom avoided purchase costs.
The Restaurant Food Waste Survey told us three things: how much food waste was being generated overall, where this food waste was being generated, and what restaurants are, and could be doing to reduce the amount of food waste.
Based on the restaurants we surveyed, waste collection figures and wholesale food costs, if an average restaurant reduced its food waste by just 20% it could generate annual savings of:
• Over4tonnesoffoodwasteperrestaurant • Morethan£2,000fromavoidedfoodcosts,byfrom using food that would normally have been thrown away
• Between£150-£1,700onwastecollectioncosts,iffood waste is collected for anaerobic digestion (AD)
3.0 Restaurant food waste: breakdown by weight (kg) and wastestream(%)
The weight per restaurant and the proportions of spoilage, prep waste and customer plate waste is detailed in Table 1, below:
Table 1: Restaurant food waste: breakdown by waste stream (For more de-tailed results see Attachment A)
Too Good to Waste report3 RESULTS cont.
FAST FACTSThe daily weight of food waste for the 10 restaurants was an average 59.8kg per res-taurant.
The annual fig-ure would be 21 tonnes food waste per restaurant.
Reducing the amount of food waste by just 20%wouldre-sult in 4.36 tonnes less food waste per restaurant a year.
The weight of food waste for the 10 restaurants surveyed, over the course of one day, was a total of 598.43kg – on average 59.8kg per restaurant. If this amount of food was disposed of every day, the annual figure would be 21 tonnes of food waste per restaurant. Thus, reducing the amount of food waste by just 20% would result in 4.36 tonnes less food waste per res-taurant a year.
Across the surveyed restaurants, the average balance of food waste from the three waste streams was:
• 65.7%offoodwastefromprepwaste• 29.6%offoodwastefromcustomerplatewaste• 4.7%offoodwastefromspoilage
As can be seen, food waste from the kitchen preparation process is significantly higher than the other two types of food waste - almost two thirds of all food thrown out. Customer plate waste was just under one-third of food waste, coming close to SRA expectations for the waste stream. Food wasted due to spoilage was of smaller proportion, however this is not an insignificant number – avoiding food waste through spoilage could be easier for restaurants to control and act on than the other two streams of food waste.
3.1 Weight (kg) of food waste per cover (person served)
The weight in kilograms of food waste per cover (person served) is detailed in Table 2, below:
Table 2: Kilogram waste per cover (person served)
*This anomalous number was attributed to a significant amount of prep by the restaurant for a large function on the day following the survey. See Section 2.3: Assumptions and limitations.

Too Good to Waste report3 RESULTS cont.
FAST FACTSRestaurants pay twice for any food wast-ed – once when they buy it and again when they throw it away. Therefore clever reduction in food waste could save on restaurant costs twice by:
a) Providing more money for produce – rather than wasting money on produce that has spoiled or is not used efficiently
b) Reducing food waste collection costs
The figures above illustrate the amount of total food waste, in kilograms, per person or per meal served at the restaurant. The average across all surveyed restaurants was 0.48 kg food waste per person.
Restaurants ultimately pay twice for any food wasted – once when they buy it and again when they throw it away. There-fore clever reduction in food waste could save on restaurant costs twice by:
a) Providing more money for produce – rather than wasting money on produce that has spoiled or is not used efficientlyb) Reducing food waste collection costs
3.2 Greenhouse Gas Emissions – comparing emissions from food waste to landfill, composting and anaerobic digestion
WhiletheUKGovernmentaimsto‘Worktowardsazerowasteeconomy and encourage councils to pay people to recycle and work to reduce littering’4, this is still in the planning stage and will take some years to fully implement, and as such most commercial food waste will continue to be sent to landfill for the short- and medium- term.
Across the 10 participating restaurants, the average green-house gas emissions per restaurant, if the food waste was being sent to landfill, was 7.972 tonnes CO2-equivalent.5 There is significant reduction in GHG emissions if food waste is not sent to landfill. Based on Defra greenhouse gas emissions factors, the potential GHG emissions for a restaurant sending waste to different treatment methods are:
• AnnualGHGemissions for average restaurant, if food waste is sent to landfill: 7.972 tonnes CO2-equivalent.
• AnnualGHGsavings for average restaurant if compost ing instead of landfill: 7.3 tonnes CO2-equivalent
• AnnualGHGsavings for average restaurant if anaerobic digestion instead of landfill: 10.15 tonnes CO2-equivalent*
The recent count of restaurants in the UK is 27,153 (not includ-ing pubs and hotel restaurants).6 If all these restaurants were to send the ‘average’ amount of food waste to landfill, the annual GHG emissions from this sector, in terms of food waste, is 216,473 tonnes.
Source 4: Defra, Waste Policy Review http://ww2.defra.gov.uk/2010/06/15/waste-policy-reviewSource 5: Calculations based on Defra / DECC, 2009 Guidelines for GHG Conversion Factors for Company Reporting, Version 2
Too Good to Waste report3 RESULTS cont.
FAST FACTSThe average greenhouse gas emissions per restaurant, if the food waste was being sent to landfill, was 7.972 tonnes CO2-equivalent.
There is significant reduction in GHG emissions if food waste is not sent to landfill.
Table 3: Greenhouse Gas Emissions – Net kg CO2-eq emitted per tonne of waste treated / disposed of (Based on Defra figures)
* Defra GHG emissions factor for anaerobic digestion accounts for not only the emissions avoided by not sending the waste to landfill but also the emissions avoided by producing en-ergy from anaerobic digestion instead of producing that energy from other sources.
3.3 Waste management fees for food waste collection
It is important for restaurants to make the connection between reducing food waste and waste management cost savings, to motivate restaurants to put waste reduction prac-tices into effect. Restaurants are effectively paying twice for all food items that are thrown out – once for the food that has been purchased but not used and secondly to have it taken away as waste.
Anaerobic digestion / composting
Restaurants can choose to have their food waste collected for anaerobic digestion or composting, as an alternative to being sent to landfill. In June 2010 the UK Government announced that current landfill tax rate of £48 per tonne will increase by £8 per tonne in April 2011, and continue to increase until at least 2014.7 These increased rates will affect all waste manage-ment services, which in turn will be passed on as an increased cost to restaurants.
A number of the restaurants in the SRA Restaurant Food Waste Survey did not separate food waste from other types of restaurant waste that are going to landfill. These restaurants are currently paying waste management fees to their local council. A number of councils, such as City of London, Isling-
Source 6: Caterersearch, 2008 http://www.caterersearch.com/Articles/2010/05/06/317292/number-of-hospitality-and-catering-outlets-industry-dataSource 7: June 2010 UK Government Budget announcement http://ww2.defra.gov.uk/2010/06/23/june-2010-budget-key-announcements-for-environment/
Too Good to Waste report3 RESULTS cont.
FAST FACTSLondon busi-nesses could save £9m by sending all or-ganic material for AD
The planned increase in land-fill tax will be passed on as an increased cost to restaurants, making an AD or composting collection more cost effective.
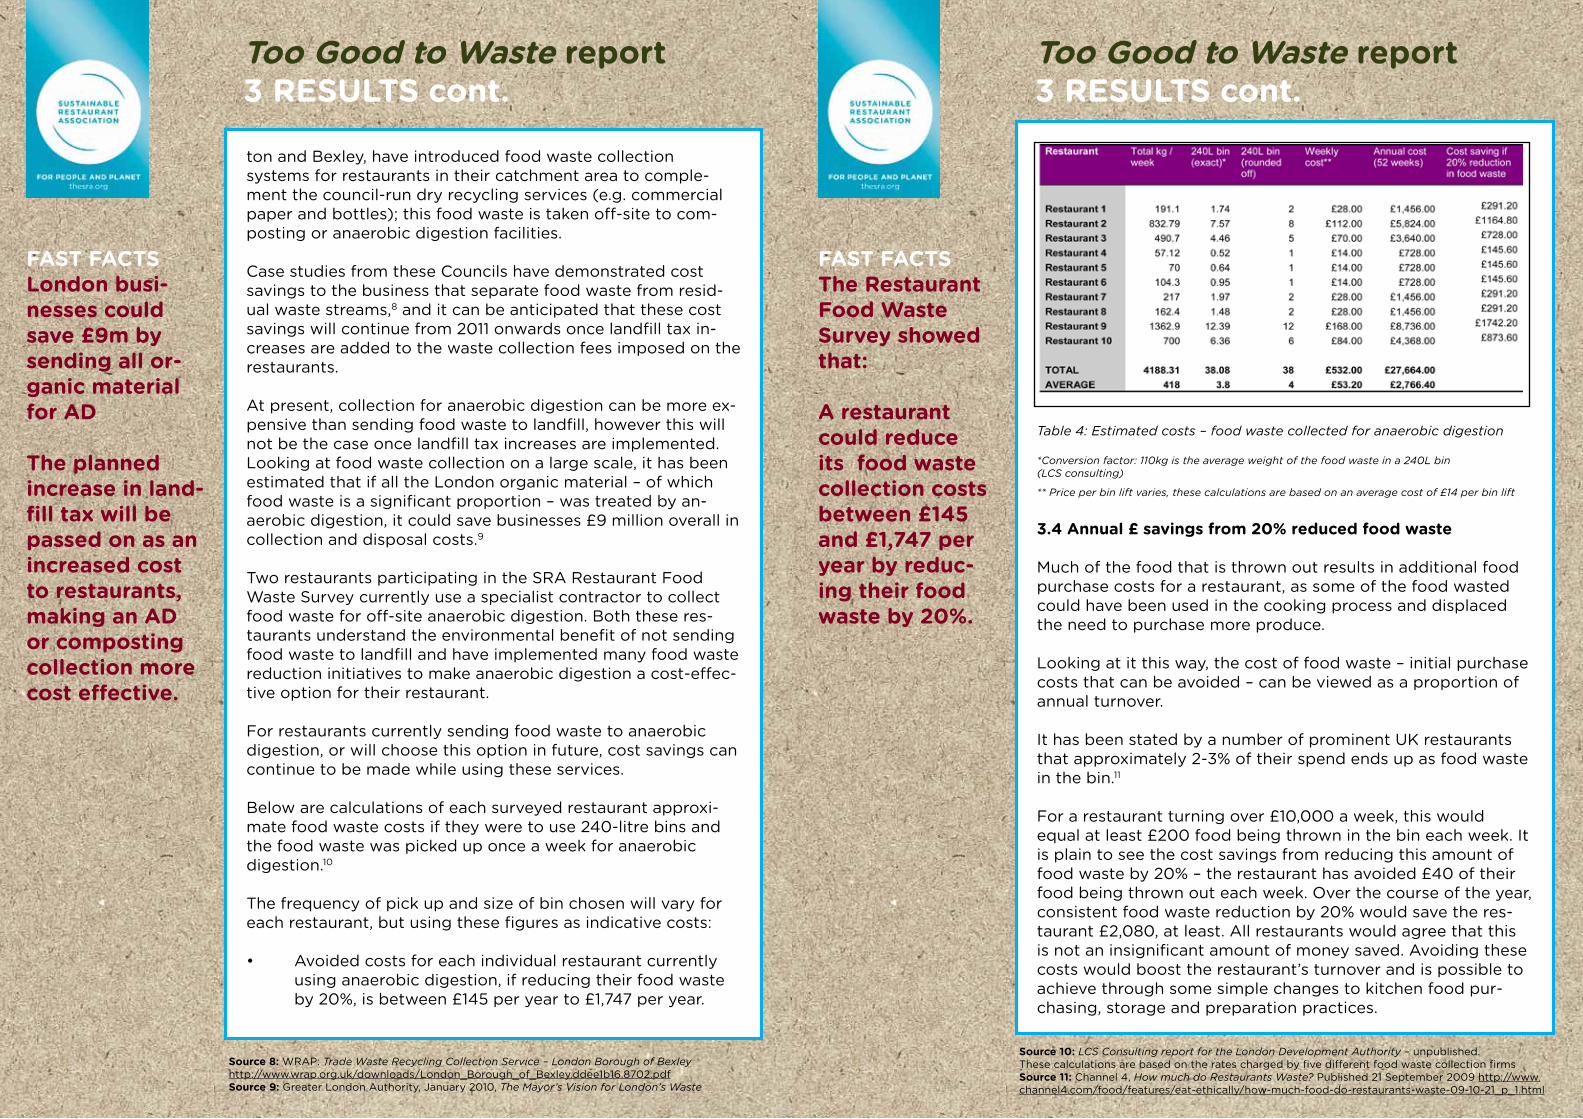
ton and Bexley, have introduced food waste collection systems for restaurants in their catchment area to comple-ment the council-run dry recycling services (e.g. commercial paper and bottles); this food waste is taken off-site to com-posting or anaerobic digestion facilities.
Case studies from these Councils have demonstrated cost savings to the business that separate food waste from resid-ual waste streams,8 and it can be anticipated that these cost savings will continue from 2011 onwards once landfill tax in-creases are added to the waste collection fees imposed on the restaurants.
At present, collection for anaerobic digestion can be more ex-pensive than sending food waste to landfill, however this will not be the case once landfill tax increases are implemented. Looking at food waste collection on a large scale, it has been estimated that if all the London organic material – of which food waste is a significant proportion – was treated by an-aerobic digestion, it could save businesses £9 million overall in collection and disposal costs.9
Two restaurants participating in the SRA Restaurant Food Waste Survey currently use a specialist contractor to collect food waste for off-site anaerobic digestion. Both these res-taurants understand the environmental benefit of not sending food waste to landfill and have implemented many food waste reduction initiatives to make anaerobic digestion a cost-effec-tive option for their restaurant.
For restaurants currently sending food waste to anaerobic digestion, or will choose this option in future, cost savings can continue to be made while using these services.
Below are calculations of each surveyed restaurant approxi-mate food waste costs if they were to use 240-litre bins and the food waste was picked up once a week for anaerobic digestion.10
Thefrequencyofpickupandsizeofbinchosenwillvaryforeach restaurant, but using these figures as indicative costs:
• Avoidedcostsforeachindividualrestaurantcurrently using anaerobic digestion, if reducing their food waste by 20%, is between £145 per year to £1,747 per year.
Source 8: WRAP: Trade Waste Recycling Collection Service – London Borough of Bexley http://www.wrap.org.uk/downloads/London_Borough_of_Bexley.ddee1b16.8702.pdfSource 9: Greater London Authority, January 2010, The Mayor’s Vision for London’s Waste
Too Good to Waste report3 RESULTS cont.
FAST FACTSThe Restaurant Food Waste Survey showed that:
A restaurant could reduce its food waste collection costs between £145 and £1,747 per year by reduc-ing their food wasteby20%.
Table 4: Estimated costs – food waste collected for anaerobic digestion
*Conversion factor: 110kg is the average weight of the food waste in a 240L bin (LCS consulting)
** Price per bin lift varies, these calculations are based on an average cost of £14 per bin lift
3.4Annual£savingsfrom20%reducedfoodwaste
Much of the food that is thrown out results in additional food purchase costs for a restaurant, as some of the food wasted could have been used in the cooking process and displaced the need to purchase more produce.
Looking at it this way, the cost of food waste – initial purchase costs that can be avoided – can be viewed as a proportion of annual turnover.
It has been stated by a number of prominent UK restaurants that approximately 2-3% of their spend ends up as food waste in the bin.11
For a restaurant turning over £10,000 a week, this would equal at least £200 food being thrown in the bin each week. It is plain to see the cost savings from reducing this amount of food waste by 20% – the restaurant has avoided £40 of their food being thrown out each week. Over the course of the year, consistent food waste reduction by 20% would save the res-taurant £2,080, at least. All restaurants would agree that this is not an insignificant amount of money saved. Avoiding these costs would boost the restaurant’s turnover and is possible to achieve through some simple changes to kitchen food pur-chasing, storage and preparation practices.
Source 10: LCS Consulting report for the London Development Authority – unpublished. These calculations are based on the rates charged by five different food waste collection firmsSource 11: Channel 4, How much do Restaurants Waste? Published 21 September 2009 http://www.channel4.com/food/features/eat-ethically/how-much-food-do-restaurants-waste-09-10-21_p_1.html
Too Good to Waste report3 RESULTS cont.
FAST FACTSIf a restaurant turning over £10,000 a week, reduced its food wasteby20%it could save approximately £2,000 per year on food costs.
3.5 Reasons given for food waste
We asked the participating restaurants what the causes of the food waste were, and below is a selection of the most com-mon answers:
• Foodisunusablee.g.radishtops,onionskins, banana skins• Foodisnotdatedproperlyandthereforenotcooked before spoiling• Over-ordering(e.g.Augustisquietermonthsoneedto change regular orders) • Duringabusyservicefoodisleftouttoolongon prep benches • Fridgetemperaturesnotrecordedproperly.• Mistakesincooking,foodfallingonfloor.• Over-portioning• Customerfoodreturnsduetounsuitableflavouringor over-seasoning
3.6 Practical actions for restaurants to reduce food waste
During the Restaurant Food Waste Survey, the SRA captured the current actions taken by participating restaurants to re-duce their food waste. We’ve listed the actions to provide con-text for the results of the survey as well as provide ideas for other restaurants to reduce their waste.
Restaurant 1• Staff meals made from excess food• They did have food waste collection service in the past but
it became prohibitively expensive after the trial period and was cancelled
Restaurant 2• Staff meals made from excess food• Food collection by Juniper for anaerobic digestion• Reuse food that would otherwise be thrown out e.g. orange
skins made into marmalade• Old bread and untouched toast into crumbs and croutons• Environmental policy known to all staff• Full buffet portions left over (e.g. pastries) goes to staff• Skins kept on potatoes for staff canteen chips
Too Good to Waste report 3 RESULTS cont.
FAST FACTSTop actions cur-rently taken by participat-ing restaurants were:
•Makestaffmeals from ex-cess food.•Carefulorder-ing•Foodwastecollected sepa-rately
Restaurant 3• Food separated out and collected separately by Islington
Council• Careful ordering
Restaurant 4• Staff meals made from excess food• Off cuts used for other food types (e.g. tuna off cuts into
fishcakes)
Restaurant 5• Eco-Care food waste system• Carefulorderingandportionsize• Excess bar snacks given out free to customers at the end
of the night
Restaurant 6• Careful ordering from butcher and fishmonger pre-cut so
less waste by the restaurant staff• Careful observation of food patterns e.g. when customers
were consistently not eating the tomato relish it was no longer provided free as a condiment
Restaurant 7• Take away / doggy boxes frequently used• Daily specials change to use excess
Restaurant 8• Staff meals made from excess food• Careful ordering• Diligentcheckingoffridgeandfreezertemperatures
Restaurant 9• Menu planning to ensure seasonal ordering (vegetables
and fish)
Restaurant 10• All food waste separated in the kitchen and weighed and
charted by waste contractor• Regular reports about food waste and other waste streams• Incorporating food waste into staff KPIs.

Too Good to Waste report4 CONCLUSIONS
FAST FACTSBy joining the SRA, restaurants can get ongoing help and advice on how to reap the benefits of reducing food waste.
4.0 Recommendations
The total amount of food waste at 0.48kg per customer is high, even in well managed restaurants such as those we sur-veyed, and there is much that they, and all other restaurants, can do to reduce the waste, and increase profits. We’ve listed our key recommendations, broken down into the three waste streams below. We’ve started with some simple recommenda-tions for all restaurants to consider as a starting point.
General
1. Carry out a food waste audit: Find out how much you’re throwing away and what it consists of. This will help you target your action at the right areas, and will give you a benchmark figure so you could measure improvements.
2. Reduce waste at source: See the ideas below for ways to reduce the amount of waste generated. It is vital to get your staff involved and engaged to ensure that good ideas come forward and good habits are maintained.
3. Get your food waste collected for composting or AD: This is so much better for the environment than landfilling, and crucially as the landfill tax goes up this will become a cheaper option.
4. Become a member of the SRA: If you’re not already, and get ongoing help and advice on how to reap the benefits of reducing food waste.
Across the three food waste streams measured, prep waste is readily identifiable as the most significant source of food waste in a restaurant, at 65% of the total.
Each restaurant that participated in the survey expressed surprise at the amount of prep waste produced on the survey day, as none had exactly measured the waste before. Each surveyed restaurant agreed that anything they were currently doing to reduce food waste would be continued, but they would consider starting new initiatives to further reduce food waste across all three waste streams.
Too Good to Waste reportCONCLUSIONS cont.
FAST FACTSThe restaurants were surprised at the amount of prep waste produced.
They agreed that they would continue any-thing they were currently doing to reduce food waste, and they would consider starting new ini-tiatives to cut it down further.
Prep waste
A number of solutions have been offered from the surveyed restaurants to reduce prep waste. These suggestions are:
• Carefulordering• Closeattentiontomenuplanning• Closeattentiontocustomerdemandsandtrends• Keepingskinsonvegetablese.g.skin-onpotatochips and skin-on roast pumpkin• Re-usingediblefooditemsthatoftengetthrownout e.g. orange skins from making orange juice are kept for making marmalade, parsley stalks retained for stocks and soup flavouring• Orderingfishandmeatcutstospecificationsotheoff cuts are kept with the producer. This should not ‘shift’ the food waste from one premises to an other – the butcher and fishmonger will have these off cuts on a larger scale and are more likely to be able to use these off cuts than throw them out.• Usingnose-to-tailcookingmethods
Customer plate waste
Customer plate waste, at 30%, is significant, and there is substantial potential to reduce the wastage and reduce cus-tomer guilt at leaving food, as well as costs.
A number of solutions have been offered from the audited restaurants to reduce customer plate waste. These suggestions are:
• Carefulconsiderationofportionsizes,andofferingvary ingportionsizes• Offeringdoggyboxeswhereappropriate• Menuplanningtoensurethefoodwillmeetwith customer expectations during winter and summer weather• Observationofcustomereating,noticinganypatterns of food that is consistently returned uneaten, such as some salad items or condiments
Spoilage
As expected, spoilage formed the smallest proportion of food waste at 5%, and you would expect well managed restaurants to keep this number low. However it is worth taking a little

Too Good to Waste reportCONCLUSION cont.
FAST FACTSRestaurants will save money im-mediately by us-ing all food that has been purchased, instead of throwing out food items, resulting in streamlined supply and better purchas-ing practices.
time to think about ways to manage this to avoid money go-ing straight in the bin.
A number of solutions have been offered from the surveyed restaurants to reduce food spoilage. These suggestions are:
• Carefulordering• Correctfridgetemperatures• Duediligencewithlabellingandstorage
4.1 Cost savings
From implementing some of these actions, or a combina-tion of them, to reduce food waste all restaurants can save money on waste management fees and reduce their restau-rant’s greenhouse gas emissions. Cost savings would also be immediately achieved through using all food that has been purchased, instead of throwing out food items, resulting in streamlined supply and better purchasing practices.
4.2 Quotes and feedback from survey participants:
“The numbers from this survey will really help the staff un-derstand exactly how much food waste we produce here, and help them understand why it’s important to try and reduce the waste.”Michael Howie (Head Chef, The Three Stags)
“We didn’t realise how little our customer food waste was compared to other waste types, until doing this survey. We usually just mix it all together. We will now look into doing a full waste audit so we can really understand where our all our waste comes from.”Karolina Dropinska (Assistant Manager, Harrison’s)
“After the food waste survey, my sous chef was surprised that so much prep waste went into the bin, the majority of it was orange skin & potato peelings. Now we have decided to use up the potato peelings still with good potato bits on and do-ing skin-on chips for the staff canteen and orange marmalade for our breakfast in Petrichor so we will have less prep waste in the kitchen.”Nitin Padwal (Head Chef, Petrichor)
Too Good to Waste report5 ATTACHMENT A: FULL FOOD WASTE SURVEY RESULTS
Attachment A: Full food waste audit results

Too Good to Waste report6 ATTACHMENT B: SURVEY CHART
SRA Restaurant Food Waste Survey 2010 – Waste Chart
Date of survey: _______________
Chart filled in by: _______________
Please start the survey as soon as kitchen staff start in the morning until the close of the kitchen at night.
Please help your staff separate food waste into these streams:
- Prep Waste (yellow bin)
- Plate Waste (blue bin)
- Spoilage (small black bin)
Please put any non-food waste (eg plastic) into a separate bin.
Too Good to Waste report7 ATTACHMENT C: RESTAURANT INFO
SRA Restaurant Food Waste Survey 2010 – Restaurant Background Info
Sample form used to collect Information from each of the 10 restaurants participating in the Restaurant Food Waste Survey