to septoria nodorum in a diallel cross · genetics inheritance of leaf and head resistance of...
TRANSCRIPT

Genetics
Inheritance of Leaf and Head Resistance of Winter Wheatto Septoria nodorum in a Diallel Cross
P. M. Fried and E. Meister
Swiss Federal Research Station for Agronomy, 8046 Zurich, Switzerland.We gratefully acknowledge the technical assistance of Heidi Buch, P. Streckeisen, and Rosmarie Zdich, as well as valuable discussions with
G. Popow.Accepted for publication 25 February 1987.
ABSTRACT
Fried, P. M., and Meister, E. 1987. Inheritance of leaf and head resistance of winter wheat to Septoria nodorum in a diallel cross. Phytopathology77:1371-1375.
A diallel analysis of four parents of similar heading date and plant height could be detected. Heritability estimates based on parents and F1 's variedbut differing in resistance to Septoria nodorum on leaves and heads (as between 0.48 and 0.68. Estimates based on the standard-unit method wereestimated by area under the disease progress curves) showed that the 0.30 and 0.26 for flag leaves and heads, respectively. Evidence forgenetic variation is mainly additive. Statistical tests for the nonadditive independent segregation of the genes controlling head and leaf resistancevariation indicated that dominance for susceptibility was significant, but could be found by correlation analysis between F2's and F 3 's.that interaction between nonallelic genes was not. No cytoplasmic effects
Additonal key words: breeding for disease resistance, Septoria nodorum blotch.
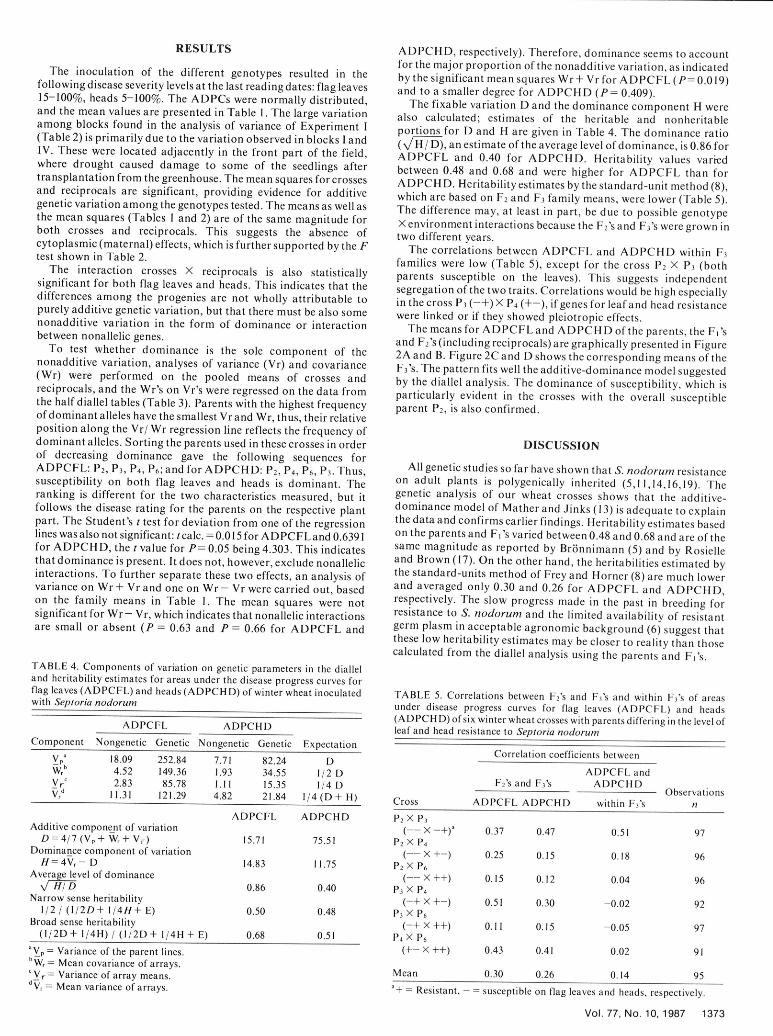
Glume blotch of wheat caused by Phaeosphaeria nodorum measured during the summers of 1978 and 1979. Their response to(MUller) Hedjaroude (teleomorph of Staganospora nodorum S. nodorum infection in 1981 is shown in Figure 1. Even though(Berk.) Cast & Germ.; synonym Septoria nodorum Berk.) is a resistance is quantitative, we have, for easier understanding,widespread wheat disease. It may reduce yield up to 50% assigned a + when the level of resistance was high on the respective(1,3,12,20). Plant breeders and pathologists have worked plant part and a - when it was low. Parent P2 , designated (--), isextensively to incorporate resistance in new cultivars. Disease highly susceptible on leaves and heads. P 3 (-+) shows highresistance, however, has often been found to be highly correlated susceptibility on the leaves and good resistance on the heads, P4with late-maturing, tall cultivars (4,6,18,21). Scott et al (19) (+-) shows the reverse of P 3, and P6 (+±) has good resistance onconcluded that resistance to glume blotch is under polygenic both plant parts. In 19 8 1, average plant heights for the four parentscontrol and that pleiotropy could explain the genetic association of were 109, 120, 103, and 116 cm, and their heading dates were, onresistance with height and ear emergence. Br6nnimann (5) found the average, 7, 6, 6, and 8 June, respectively.high heritability values (66%) for tolerance to the disease.Genotypes were considered tolerant when yield reduction wassmall after inoculation. Heritabilities in the same range (63% and52%, respectively) were reported by Rosielle and Brown (17) for 100Septoria scores on flag leaves and heads. A simpler mode ofinheritance of seedling resistance to S. nodorum was shown by - FFrecha (7), who suggested that in the cultivar Atlas 66 resistance is Flag leavesdetermined by a single dominant gene. 80
In selecting for resistance to glume blotch of wheat, we (9,10) Headsrepeatedly identified genotypes with different quantitativeresistance levels on leaves and heads, respectively. This may, ofcourse, have consequences on the breeding scheme and onselection of both parents and offspring. We therefore made an LU 60effort to investigate the genetic base of these two characteristics. CLFor this, four breeding lines representing all combinations of leafand head resistance were selected. The lines were of almost equal Dheight and nearly identical heading date to overcome the < 40mentioned parental association between resistance to Septoria andplant height and/or time of ear emergence (19). These lines werethen crossed in all possible combinations, including reciprocals, tostudy the mode of inheritance, to test for maternal effects, and toinvestigate interactions between genes governing leaf and head 20resistance.
MATERIALS AND METHODS0
Parents (P 2, P3 , P 4, and P6) were chosen based on the area under P2 P3 P4 P6the disease progress curves (ADPC) for leaves and heads, .+ +_ ++
Fig. 1. Areas under the disease progress curves (ADPC) of four winterwheat parents P 2, P3, P4, and P6 and their designation (+ = resistant, - =susceptible) according to the response to infection with Septoria nodorum
©1987 The American Phytopathological Society on the respective plant part.
Vol. 77, No. 10, 1987 1371

The pedigree of P2 is Moisson/4*Probus//71803, and 71803= F, and F2 seed were produced in the greenhouse after
A273/ Weique/ / Champlein; P 3 and P4 were selected from a cross vernalization of parents and F , seedlings for 42 days at 4 C. The F 2
between Kawkas and 71803, and P 6 = Danubian Roman/ / Heine seed was derived from randomly selected and selfed F, plants. ForVII/71803. The four parents were crossed in all possible each of the 28 treatments (four parents and all their combinations,
combinations to make up a diallel series, including reciprocals in F, and F2 generations) about 160 singleplants were raised in 6-cm Jiffy pots during the winter of
TABLE 1. Diallel table of the areas under disease progress curves for flag 1980-1981. In the spring, 100 of these seedlings were transplanted
leaves (AD PCFL) and heads (ADPCHD) of winter wheat after inoculation into the field. The field experiment (Experiment I) was laid out as a
with Septoria nodorum for the parents (diagonal), F, crosses (above randomized complete block design (RCBD) in which everydiagonal), and F, reciprocal crosses (below diagonal) treatment was replicated five times. In each plot, 20 seedlings were
planted at a distance of 30 cm within the row. Border rows withFemale parent cultivar Zenith (medium resistant) were drill-seeded at 23-cm rowMale
parent P2 (__)a P3 (-+) P4 (+-) P6 (++) Mean spacing to simulate a more realistic environment surrounding the
test plants and to minimize interplot interactions.ADPC FL The plants were inoculated twice, at the late-boot stage and after
P2 (--) 56.6 71.8 58.7 57.9 61.3 heading of two to four tillers per plant. A spore suspension of 500P3 (-+) 69.3 57.4 61.7 48.1 59.1P4 (+-) 62.3 61.6 40.6 37.3 50.4 L/ha was applied with a tractor with boom and nozzles. Spore
P6 (++) 55.7 49.8 34.1 22.5 40.5 concentrations were adjusted to 5 X 10⁶ viable spores per milliliterfor the first inoculation date and to 106 spores per milliliter for the
Mean 61.0 60.1 48.8 41.4 second. Inoculum was produced from a single-spore isolate onautoclaved wheat kernels (3). The percentage of area covered by S.
ADPCHD nodorum was estimated three separate times on all leaves, on theP2 () 52.3 52.8 53.3 49.0 51.8 flag leaf only, and on the heads, at the following growth stages (22):P 3 (-±) 46.6 36.4 47.5 42.0 43.1 61 (6 June), 63 and 65 for all leaves; 65 (1 July), 71 and 72 for flagP 4 (+-) 48.5 51.3 52.9 39.9 48.3 leaves; 71 (8 July), 72 and 73 (24 July) for the heads. The ADPCsP6 (++) 49.9 39.3 41.7 36.0 41.9 for all leaves (ADPCAL), for flag leaves (ADPCFL), and for the
Mean 49.3 45.1 48.8 41.7 heads (ADPCHD) were calculated and used in the analysis of thea+ = Resistant, - = susceptible on flag leaves and heads, respectively. Experiment II was carried out during 1981-1982 with the
parents and the F3 's from the F 2's of the nonreciprocal crosses in
TABLE 2. Analysis of variance of the diallel data for areas under the 1981. From each of the 600 F 2 plants (100/cross) about 20disease progress curves for flag leaves (ADPCFL) and heads (ADPCHD) individual F 3 seedlings were raised during the winter in Jiffy pots.of winter wheat inoculated with Septoria nodorum In the spring five seedlings per F 3 family were randomly chosen
and transplanted next to each other in a field plot. The layout wasVariable Source df MS Fcalc. P again a RCBD with five replications and with border rows and
ADPCFL Blocks 4 347.19 3.84 0.0076 spacings as in Experiment I. As an insurance, an identical RCBD,Crosses 3 1748.47 19.33 <0.0010 with different randomization, was planted in an adjacent field.Reciprocals 3 1795.87 19.86 <0.0010 Because no irregularities were observed in either field, the twoCrosses X reciprocals 9 294.34 3.25 0.0028 disease ratings of each F 3 family were averaged for the geneticError 60 90.45 analysis. We inoculated Experiment 1I at the same growth stages
Maternal effects 6 17.01 0.18 >0.5 (GS) and with the same isolate and equipment as in 1981. ADPCswere calculated on disease assessments as follows: five for
ADPCHD Blocks 4 887.57 23.03 <0.001 ADPCAL at GS 59, 61, 71, 72, and 73; three for ADPCFL at GSCrosses 3 254.61 6.61 <0.001 71, 73, and 81; and four for the heads at GS 72, 73, 81, and 83.Reciprocals 3 438.76 11.38 <0.001 We analyzed the data for the parents and the Fis according toCrosses X reciprocals 9 81.89 2.12 0.041 the diallel method described by Mather and Jinks (13) and for theError 60 38.54 F 2 and F 3 data by the standard-unit method of Frey and Horner
(8). We omit detailed results obtained with the ADPCAL becauseMaternal effects 6 38.37 0.99 >0.5 they were similar to those obtained with the ADPCFL.
TABLE 3. Half diallel tables of the areas under disease progress curves for flag leaves (ADPCFL) and heads (ADPCHD) of winter wheat inoculated withSeptoria nodorum
Female parent
Male P2 P3 P4 P6 Covariance Varianceparent (__)a (-+) (+_) (++) Mean Wr Vr
ADPCFLP2 (--) 56.62 70.56 60.54 56.78 61.125 55.099 42.845P3 (-+) 57.44 61.61 48.93 59.635 110.507 80.890P 4 (+-) 40.56 35.71 49.605 209.642 179.526P6 (++) 22.52 40.985 240.296 227.129
Mean 153.886 132.598
ADPCHDP2 (--) 52.34 49.70 50.89 49.46 50.598 11.030 1.740P3 (-+) 36.40 49.71 40.65 44.115 60.881 44.675P4 (+-) 52.86 40.79 48.563 37.086 28.538P6 (++) 35.96 41.715 36.921 31.698
Mean 36.479 26.663a+ = Resistant, - = susceptible on flag leaves and heads, respectively.
1372 PHYTOPATHOLOGY
RESULTS ADPCHD, respectively). Therefore, dominance seems to accountfor the major proportion of the nonadditive variation, as indicatedThe inoculation of the different genotypes resulted in the bythesignificantmeansquaresWr+VrforADPCFL(P= 0.019)
following disease severity levels at the last reading dates: flag leaves and to a smaller degree for ADPCHD (P= 0.409).15-100%, heads 5-100%. The ADPCs were normally distributed, The fixable variation D and the dominance component H wereand the mean values are presented in Table 1. The large variation also calculated; estimates of the heritable and nonheritableamong blocks found in the analysis of variance of Experiment I portions for D and H are given in Table 4. The dominance ratio(Table 2) is primarily due to the variation observed in blocks I and (N/H/ D), an estimate of the average level of dominance, is 0.86 forIV. These were located adjacently in the front part of the field, ADPCFL and 0.40 for ADPCHD. Heritability values variedwhere drought caused damage to some of the seedlings after between 0.48 and 0.68 and were higher for ADPCFL than fortransplantation from the greenhouse. The mean squares for crosses ADPCH D. Heritability estimates by the standard-unit method (8),and reciprocals are significant, providing evidence for additive which are based on F2 and F 3 family means, were lower (Table 5).genetic variation among the genotypes tested. The means as well as The difference may, at least in part, be due to possible genotypethe mean squares (Tables 1 and 2) are of the same magnitude for X environment interactions because the F 2's and F3 's were grown inboth crosses and reciprocals. This suggests the absence of two different years.cytoplasmic (maternal) effects, which is further supported by the F The correlations between ADPCFL and ADPCH D within F3test shown in Table 2. families were low (Table 5), except for the cross P2 X P 3 (bothThe interaction crosses X reciprocals is also statistically parents susceptible on the leaves). This suggests independentsignificant for both flag leaves and heads. This indicates that the segregation of the two traits. Correlations would be high especiallydifferences among the progenies are not wholly attributable to in the cross P3 (-+) X P 4 (+-), if genes for leaf and head resistancepurely additive genetic variation, but that there must be also some were linked or if they showed pleiotropic effects.nonadditive variation in the form of dominance or interaction The means for ADPCFL and ADPCHD of the parents, the Fi'sbetween nonallelic genes. and F2's (including reciprocals) are graphically presented in FigureTo test whether dominance is the sole component of the 2A and B. Figure 2C and D shows the corresponding means of thenonadditive variation, analyses of variance (Vr) and covariance F 3's. The pattern fits well the additive-dominance model suggested(Wr) were performed on the pooled means of crosses and by the diallel analysis. The dominance of susceptibility, which isreciprocals, and the Wr's on Vr's were regressed on the data from particularly evident in the crosses with the overall susceptiblethe half diallel tables (Table 3). Parents with the highest frequency parent P 2, is also confirmed.of dominant alleles have the smallest Vr and Wr, thus, their relativeposition along the Vr/ Wr regression line reflects the frequency ofdominant alleles. Sorting the parents used in these crosses in order DISCUSSIONof decreasing dominance gave the following sequences forADPCFL: P2 , P 3, P4 , P6 ; and for ADPCHD: P 2, P4 , P 6, P 3. Thus, All genetic studies so far have shown that S. nodorum resistancesusceptibility on both flag leaves and heads is dominant. The on adult plants is polygenically inherited (5,11,14,16,19). Theranking is different for the two characteristics measured, but it genetic analysis of our wheat crosses shows that the additive-follows the disease rating for the parents on the respective plant dominance model of Mather and Jinks (13) is adequate to explainpart. The Student's t test for deviation from one of the regression the data and confirms earlier findings. Heritability estimates basedlines was also not significant: t calc. = 0.015 for ADPCFL and 0.6391 on the parents and Fs's varied between 0.48 and 0.68 and are of thefor ADPCHD, the t value for P= 0.05 being 4.303. This indicates same magnitude as reported by Brtinnimann (5) and by Rosiellethat dominance is present. It does not, however, exclude nonallelic and Brown (17). On the other hand, the heritabilities estimated byinteractions. To further separate these two effects, an analysis of the standard-units method of Frey and Honer (8) are much lowervariance on Wr + Vr and one on Wr - Vr were carried out, based and averaged only 0.30 and 0.26 for ADPCFL and ADPCH D,on the family means in Table 1. The mean squares were not respectively. The slow progress made in the past in breeding forsignificant for Wr- Vr, which indicates that nonallelic interactions resistance to S. nodorum and the limited availability of resistantare small or absent (P = 0.63 and P ---0.66 for ADPCFL and germ plasm in acceptable agronomic background (6) suggest thatthese low heritability estimates may be closer to reality than those
calculated from the diallel analysis using the parents and Fi's.TABLE 4. Components of variation on genetic parameters in the dialleland heritability estimates for areas under the disease progress curves forflag leaves (ADPCFL) and heads (ADPCHD) of winter wheat inoculated TABLE 5. Correlations between F 2's and F 3's and within F3's of areaswith Septoria nodorum under disease progress curves for flag leaves (ADPCFL) and heads
(ADPCH D) of six winter wheat crosses with parents differing in the level ofADPCFL ADPCHD leaf and head resistance to Septoria nodorumComponent Nongenetic Genetic Nongenetic Genetic Expectation_Vp" 18.9 25.84 7.71 82.4 DCorrelation coefficients between
V P 18.09 252.84 7.71 82.24 DWrb 4.52 149.36 1.93 34.55 1/2 D ADPCFL andV 2.83 85.78 1.11 15.35 1/4 D F 2's and F3's ADPCHD ObservationsVrd 11.31 121.29 4.82 21.84 1/4 (D + H) Cross ADPCFL ADPCHD within F3's n
ADPCFL ADPCHD P2 X P3Additive component of variation (__ X -+)a 0.37 0.47 0.51 97D =4/7 (Vp + Wr + Vf) 15.71 75.51 P2 x P4Dominance component of variation (-- X +-) 0.25 0.15 0.18 96H= 4V,- D 14.83 11.75 P2 X P6Average level of dominance (-- X ++) 0.15 0.12 0.04 96\f H1D 0.86 0.40 P3 X P4Narrow sense heritability (-+ X +-) 0.51 0.30 -0.02 921/2 / (1/2D+ 1/4H+ E) 0.50 0.48 P3 X P6Broad sense heritability (-+ X ++) 0.11 0.15 -0.05 97(I/2D + 1/4H) / (I/2D + 1/4H + E) 0.68 0.51 P4 X P6
aVP = Variance of the parent lines. (+- X ++) 0.43 0.41 0.02 91bVr = Mean covariance of arrays.Va= Variance of array means.95
dV, = Mean variance of arrays. a+ = Resistant, - = susceptible on flag leaves and heads, respectively.
Vol. 77, No. 10, 1987 1373

A P3 P2 F2 F1 B P3 F1 F2 P2P2 X P,3 PxP3 I I2II--- -- ÷ --- -- ÷
P4 P2 F1 F2 F1 P2 P4 F2
P2 X P4P 2 X P4X , ,4 p i I ,I I ,-_- .g. , I 1 1i I,
--- 4.-
P6 F2 P2 F1 P6 F2 F1 P2
P2xP I III P2 I P IIP XP6-- ÷-
P4 P3 F1 F2 P3 F2 F1 P4
P3 X P4 P3 X P4
P6 F2 F1 P3 P3 P6 F2 F1
P3- P I -6P3 X P6
P6 F2 F, P4 P6 F1 F2 P4P__P__III ____P___ IIIP4 i I P6I P ÷- 1 4. X P6 III
20 30 40 50 60 70 35 40 45 50 55ADPCFL ADPICHD
C P3 F3 P2 D P3 F3 P2P 2 I I I IP3
P4 F3 P2 P4 F3 P2
P2 X P4 2I _ X P4
P6 F3 P2 P6 F3 P2
P2 ÷+ I -- ÷÷PI I l IP
P4 F3 P3 P3 P4 F3P3 X P4 I I P3 X P4 I I-÷. 4.- I I4- 4 - I I I I I
P6 F3 P3 P6 P3 F3P3 XP6 II IP 3 X P6II- + 4.4. I I -+ 4+ II
P6 F3 P4 P6 F3 P4P4 XP6 I P4 X"P6 I
÷- ÷÷ I I L I---÷ I I
10 20 30 40 25 30 35 40 45ADPCFL ADPCHD
Fig. 2. Mean values of the areas under disease progress curves for flag leaves (ADPCFL) and heads (ADPCH D) of four winter wheat parents, P 2 , P3, P 4 , andP6, the Fi's and F 2's (A, B) and the F3's (C, D) for all crosses. The parents differed in their level of resistance to Septoria nodorum on flag leaves and on theheads (first subscript = leaf reaction, second subscript = head reaction). A and B are based on data taken in 1982, C and D in 1983.
1374 PHYTOPATHOLOGY

Scott et al (19) reported that the variation in resistance was laboratory technique for screening cereals for resistance to Septoriaassociated with plant height and lateness. In most of their crosses, nodorum using detached seedling leaves. Trans. Br. Mycol. Soc.the mean disease rating on F2 plants was intermediate between 77:667-669.parents. In some of them, however, deviations toward partial 3. Brinnimann, A. 19 6 8 . Zur Kenntnis von Septoria nodorum Berk., demdominance for susceptibility or partial dominance for resistance Erreger der Spelzenbr~iune und einer Blattdfirre des Weizens.were also observed. Brinnimann (5) found dominance for Phytopathol. Z. 61:101-146.
4. Br6nnimann, A. 1969. Einfluss einer ziichterisch oder durchsusceptibility in the Fj's in three out of four crosses with the Chlorcholinchlorid bedingten Halmverk~irzung bei Sommerweizencultivar Svenno (most susceptible entry), whereas Nelson and auf den Befall und die Sch~idigung durch Septoria nodorum Berk. Z.Gates' results (16) indicate dominance for resistance because all F1 Acker und Pflanzenbau 129:247-258.glume blotch ratings were lower than those for the more resistant 5. Br6nnimann, A. 1975. Beitrag zur Genetik der Toleranz auf Septoriaparent in each cross. In our study, the average level of dominance nodorum Berk. bei Weizen (Triticum aestivum). Z. Pflanzenzficht.for susceptibility was estimated at 0.86 and 0.40 for ADPCFL and 75:138-160.ADPCHD, respectively. Most of this partial dominance probably 6. Eyal, Z. 1981. Integrated control of Septoria diseases of wheat. Plantoriginates from P 2, the most susceptible entry (Fig. 2). Because all Dis. 65:763-768.
7. Frecha, J. H. 1973. The inheritance of resistance to Septoria nodorumparents used were similar in ear emergence and plant height, the in wheat. Bol. Genet. Inst. Fitotec. Castelar 8:29-30.genetic variation in resistance observed is assumed to be 8. Frey, K. J., and Horner, T. 1957. Heritability in standard units. Agron.independent of these two factors. This, however, does not exclude J. 49:59-62.the possibility of genetic associations in short straw cultivars or in 9. Fried, P. M. 1985. Methods used in breeding for resistance to Septoriaprogenies of short and tall cultivars as shown by Scott et al (19). nodorum in Switzerland. Pages 16-17 in: Septoria of Cereals: Proc.Departure from single autosomal inheritance of resistance had Workshop at Montana State University, Bozeman, MT. 116 pp.been suggested by Nelson (15) butcould not be confirmed (16). Our 10. Fried, P. M., and Brbnnimann, A. 1982. Seplorianodorum Berk. onresults show good evidence that there are no maternal effects. wheat: Effect of inoculation time and peduncle length on yieldreduction and disease development. Z. Pflanzenziicht. 89:312-328.These crosses have shown that both leaf and head resistance are rdcinaddsaedvlpet .Plnezct 93238Theseticrossfixes ithae sh hted blths l heaf andheadresistance ah II. Karajalainen, R. 1985. Host-pathogen interaction between springgenetically fixed in the selected cultivars. The inheritance of both wheat and Septoria nodorum with reference to resistance breeding. J.types of resistance can be sufficiently explained by the additive- Agric. Sci. Finl. 57:1-66.dominance model of Mather and Jinks (13). Evidence for 12. King, J. E., Cook, R.J.,and Melville, S. C. 1983. AreviewofSeptoriaindependent segregation of genes controlling the two traits is given diseases of wheat and barley. Ann. Appl. Biol. 103:345-373.by the low correlation between ADPCFL and ADPCHD of the 13. Mather, K., and Jinks, J. L. 1977. Introduction to BiometricalF 2's and F 3's and by the different ranking of parents along the Genetics. Chapman and Hall Ltd., London. 231 pp.Wr/Vr regression line for the two characteristics. This implies 14. Mullaney, E. J., Martin, J. M., and Scharen, A. L. 1982. Generationabsence of pleiotropic effects and separate sets of genes for leaf and mean analysis to identify and partition the components of genetichead resistance. Even though heritabilities for both are rather low, resistance to Septoria nodorum in wheat. Euphytica 31:539-545.
15. Nelson, L. R. 1980. Inheritance of resistance to Septoria nodorum inthere is a reasonable chance of breeding and identifying wheat wheat. Crop Sci. 20:447-449.genotypes with resistance to S. nodorum on leaves and heads. 16. Nelson, L. R., and Gates, C. E. 1982. Genetics of host plant resistanceHowever, large single plant populations and strong selection of wheat to Septoria nodorum. Crop Sci. 22:771-773.pressure are necessary. To avoid selection of late but susceptible 17. Rosielle, A. A., and Brown, A. G. P. 1980. Selection for resistance togenotypes, grouping in the field as indicated by Fried (9) is helpful. Septoria nodorum in wheat. Euphytica 29:337-346.
Because a combination of head and leaf resistance is required for 18. Scott, P. R. 1973. Incidence and effects of Septoria nodorum on wheata new variety and both seem to be independently inherited, it cultivars. Ann. Appl. Biol. 75:321-329.appears that screening procedures in the field cannot be replaced 19. Scott, P. R., Benedikz, P. W., and Cox, C. J. 1982. A genetic study ofby tests on seedlings or detached leaves (2) in the laboratory. the relationship between height, time of ear emergence and resistance
to Septoria nodorum in wheat. Plant Pathol. 31:45-60.
20. Shipton, W. A., Boyed, W. R. J., Rosielle, A. A., and Shaerer, B. I.LITERATURE CITED 1971. The common Septoria diseases of wheat. Bot. Rev. 37:231-262.
21. Trottet, M., and Merrien, P. 1982. Analysis of the behaviour of twenty1. Ahrens, W., and Fehrmann, H. 1984. Attack of wheat by Septoria lines of soft wheat towards Septoria nodorum Berk. Agronomie
nodorum and Fusarium ear scab. I. Crop loss analysis. J. Plant Dis. 2:727-734.Prot. 91:42-58. 22. Zadoks, I. C., Chang, T. T., and Konzak, C. F. 1974. Decimal code for
2. Benedikz, P. W., Mappledoram, C. J., and Scott, P. R. 1981. A the growth stages of cereals. Weed Res. 14:415-421.
Vol. 77, No. 10, 1987 1375