27. ijasr - diallel cross analysis for earliness, yield, its
TRANSCRIPT
7/23/2019 27. IJASR - Diallel Cross Analysis for Earliness, Yield, Its
http://slidepdf.com/reader/full/27-ijasr-diallel-cross-analysis-for-earliness-yield-its 1/12
www.tjprc.org [email protected]
DIALLEL CROSS ANALYSIS FOR EARLINESS, YIELD, ITS
COMPONENTS AND RESISTANCE TO LATE WILT IN MAIZE
EL-HOSARY A. A. A1& I. A. I. EL-FIKI
2
1 Department of Agronomy, Faculty of Agriculture, Benha University, Egypt
2 Department of Plant Pathology, Faculty of Agriculture, Benha University, Egypt
ABSTRACT
A half diallel set of crosses involved eight yellow maize inbred lines were evaluated in normal and artificial
infection by late wilt environments at the Agricultural Research and Experiment Center, Faculty of Agriculture, Benha
University, Egypt. To estimate combining ability, improve productivity of maize and resistant to late wilt in Egypt. Mean
squares of environments, genotypes and its fractions as well as general and specific combining abilities (GCA and SCA)
reached the significance level of probability for all traits. High GCA/SCA ratios exceeded than unity were obtained for
days to 50% silking and resistance to late wilt% in artificial infection environment and across environments. For remain
cases, non-additive type of gene action seemed to be more prevalent. Ten crosses in both and across experiments, gave
significant superiority over SC 168. The useful superiority over SC 168 ranged from 10.02 to 33.59 %.Two crosses
P1xP2 and P2xP3 in both and across experiments had significant superiority over the best check hybrid Hytech 2055 by
14.68 and 15.49% in the combined analysis. The parental inbred line P2 exhibited the most accurate general combiner
for earliness and grain yield plant-1. The cross P2xP3 was contain most desirable inter and intra-allelic interactions for
most traits.
KEYWORDS: Combining Ability, Diallel Analysis, Yellow Maize, Resistant to Late Wilt
Received: Nov 05, 2015; Accepted: Nov 14, 2015; Published: Nov 19, 2015; Paper Id.: IJASRDEC201527
INTRODUCTION
Great efforts are devoted to increase maize productivity with a high resistance to disease and pests.
Several diseases attack maize fields. One of the most destructive diseases in maize growing areas in lower and
Upper Egypt is late wilt. It is caused by fungi called Cephalosporiummaydis. The degree of lose may be up to 80%
in fields. Late wilt disease is wide spread and serious. Therefore, breeding new resistance hybrids is practical,
inexpensive and effective for controlling this disease.
Several methods are available to study the inheritance yield productivity and disease resistance. One of
the common use in this respect is the diallel cross methodology for its power and versatility. Different approaches
to the diallel analysis for estimating certain genetic parameters in terms of gene models have been developed.
Total genetic variation is portioned into the effects of general (GCA) and specific (SCA) combining ability. In this
context, GCA is the average performance of an inbred line in hybrid combinations and as such it is primarily
recognized as a measure of additive gene action. SCA indicates non-additive gene action and it desirable those
instances in which certain hybrid combinations perform relatively desirable than would be expected on the mean
performance of inbred lines involved
Or i gi n al Ar t i c l e
International Journal of Agricultural
Science and Research (IJASR)
ISSN(P): 2250-0057; ISSN(E): 2321-0087
Vol. 5, Issue 6, Dec 2015, 199-210
© TJPRC Pvt. Ltd.
7/23/2019 27. IJASR - Diallel Cross Analysis for Earliness, Yield, Its
http://slidepdf.com/reader/full/27-ijasr-diallel-cross-analysis-for-earliness-yield-its 2/12
200 El-Hosary A. A. A & I. A. I. El-Fiki
Impact Factor (JCC): 4.7987 NAAS Rating: 3.53
(Sprague and Tatum 1942).
The objective of the present investigation is to evaluate eight maize inbred lines and their F1 hybrid according to
general and specific combining ability for earliness, grain yield, its components and resistance to late wilt disease.
MATERIALS AND METHODS
Eight yellow maize inbred lines i.e. M-201(P1), M-202(P2), M-203(P3), M-204 (P4), M-241(P5), M-224(P6), M-
228(P7) and M-524(P8) were sown in two different sowing dates (2nd and 12th May 2013) in order to make half diallel
crosses by hand pollination giving a total of 28 hybrids.
In the 2013 season, two experiments were carried out. The first was a normal trial and the second involved
artificial infection with late wilt disease. The inculum was prepared by growing the fungus (Cephalosporiummaydis)
isolates in sterilized milk bottles containing wet cracked grain sorghum kept at room temperature for 45 days. The infection
in the field was made according to Shafshaket al. (1986). Each experiment contained 28 crosses and their parents along
with single crosses SC 168 and Hytech 2055 (check hybrids) were grown in a randomized complete block design with
three replications at the Agricultural Research and Experiment Center, Faculty of Agriculture, Benha University, Egypt.
The sowing of the two experiments was on 6th June 2014. Each plot consisted of two ridges, 70-cm between ridges. The
long of ridge was 6-m. Three kernels per hill were sown in one side of the ridge with 25-cm spacing between hills. Normal
cultural practices were followed for maize growing in the area.
The traits studied were: days to 50% silking, plant height, resistance to late wilt disease% (percent of resistant
plants in each plot following 105 days from sowing) according to Sabetet al.(1961), number of kernels row-1, number of
rows ear-1, 100-kernel weight and grain yield plant-1 adjusted to 15.5% grain moisture. Fifteen guarded plants from each
plot were randomly taken as samples tested for the previous traits except days to 50% silking where; the mean basis of plot
was used.
Statistical analysis was done according to Steel and Torri (1980). Relative superiority of grain yield was
estimated for each cross as the percentage deviation of F1 mean performance from check variety SC Hytech 2055 average
value. Genetic analysis was done as described by Griffing (1956) for method 2 model 1. The combined analysis across the
two experiments was carried out according to (Gomez and Gomez, 1984) whenever, homogeneity of error variance was
found.
RESULTS AND DISCUSSIONS
The results obtained from parental inbred lines and their F1's for all traits studied in each and across, the two
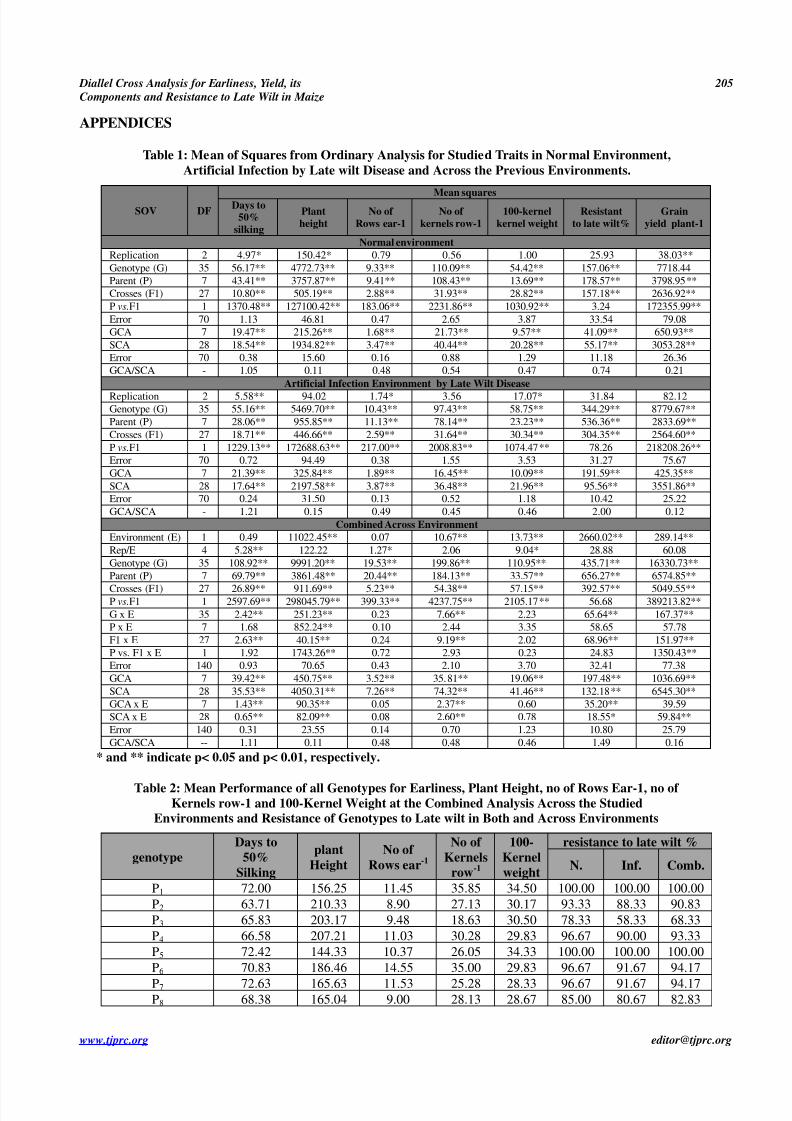
experiments were first subjected to an ordinary analysis of variance as presented in Table 1. The mean squares due to
environments were significant for all studied traits except for days to 50% silking and No. of rows ear-1. These results are
indicated that the plants generally remained symptomless until flowering stage. Also, the number of rows ear-1 was formed
in the ear before the flowering agrees with the findings of Mostafaet al . (1996), Viveket al.(2010) and El-Gonemy(2015).
Genotype mean squares were highly significant for all traits studied. Its fractionsi.e.parents, crosses and parentvscrosses
reached significant levels in most cases.
Appreciable genotypes by environment interaction were detected for all traits except for No. of rows ear-1 and
100-kernel weight indicating that the genotypes behaved rather differently from normal environment to late wilt infection
7/23/2019 27. IJASR - Diallel Cross Analysis for Earliness, Yield, Its
http://slidepdf.com/reader/full/27-ijasr-diallel-cross-analysis-for-earliness-yield-its 3/12
Diallel Cross Analysis for Earliness, Yield, its 201
Components and Resistance to Late Wilt in Maize
www.tjprc.org [email protected]
environment. For the exceptional traits, insignificant genotype by environment was detected revealing that the genotypes
were suspected to environmental changes by nearly similar magnitudes. Insignificant interactions between parental inbred
lines and environments were detected in all traits except plant height. This may reveal the high repeatability of the parental
inbred lines under different environments. Significant interaction between F1 hybrids and environment were detected for
days to 50% silking, No of kernels row-1, late wilt resistance% and grain yield plant-1, indicating that these crosses behave
differently from environment to another. Insignificant interactions occurred between parent vs hybrids and environment for
all studied traits except for grain yield plant-1 revealing that average of heterosis over all crosses was influence by
environmental changes.
Mean Performance and Superiority
The mean performances of tested the eight inbred lines and the 28 hybrids across environments for all traits as
well as grain yield plant-1 and resistance to late wilt % in normal and infection environment and across them and
superiority over both checks (SC 168 and Hytech 2055) are presented in Tables (2 a and b). For days to 50% silking date,
the inbred line No. 2 gave the earliest parents. However, inbred line P7 gave the lateness one. Days to 50% silking for
crosses, ranged from 57.42 for cross P4xP8 to 63.92 for cross P3xP6 while all crosses were earliest than both check
hybrids. For plant height (cm), means ranged from 248.75 for cross P4xP6 to 290.54 for cross P3xP5. The results indicate
that most crosses were shorter than the two check hybrids, for No of rows ear-1, means ranged from 8.9 for P2 to 14.55 for
P6, while, ranged from 11.93 for cross P5xP6 to 15.47 for cross P1xP6. Most crosses gave higher No. of rows ear-1
compared with the two check hybrids. The parental inbred lines P7 gave the lowest number of kernels row-1. However, the
parent inbred line P1 gave the highest one for this trait. The two crosses P1xP2 and P1xP3 gave the highest number of
kernels row-1 and significant differences from two check hybrids. However cross P4xP5 gave the lowest ones, but without
significant difference from check hybrids. The inbred lines P1 and P5 recorded heavier 100-kernel weight. On the other
hand, the parental inbred line P7 gave the lowest one for this trait. For the 100-kerenel weight (g) means of crosses ranged
from 31.0 for P1xP6 to 45.67 for cross P2xP3. For resistance to late wilt disease, means ranged from 76.67 for cross P6xP8
to 100.00 for P1, P5, P2xP4, P2xP6, P3xP8, P5xP6, P5xP7 and P5xP8 at normal condition, Means ranged from 58.33 for
P3 to 100% for P1, P5, P1xP5, P2xP4, P2xP6, P5xP7 at infection trial. However, means ranged from 68.33 for P3 to 100%
for P1, P5, P1xP5, P2xP4, P2xP6 and P5xP7 in the combined analysis.
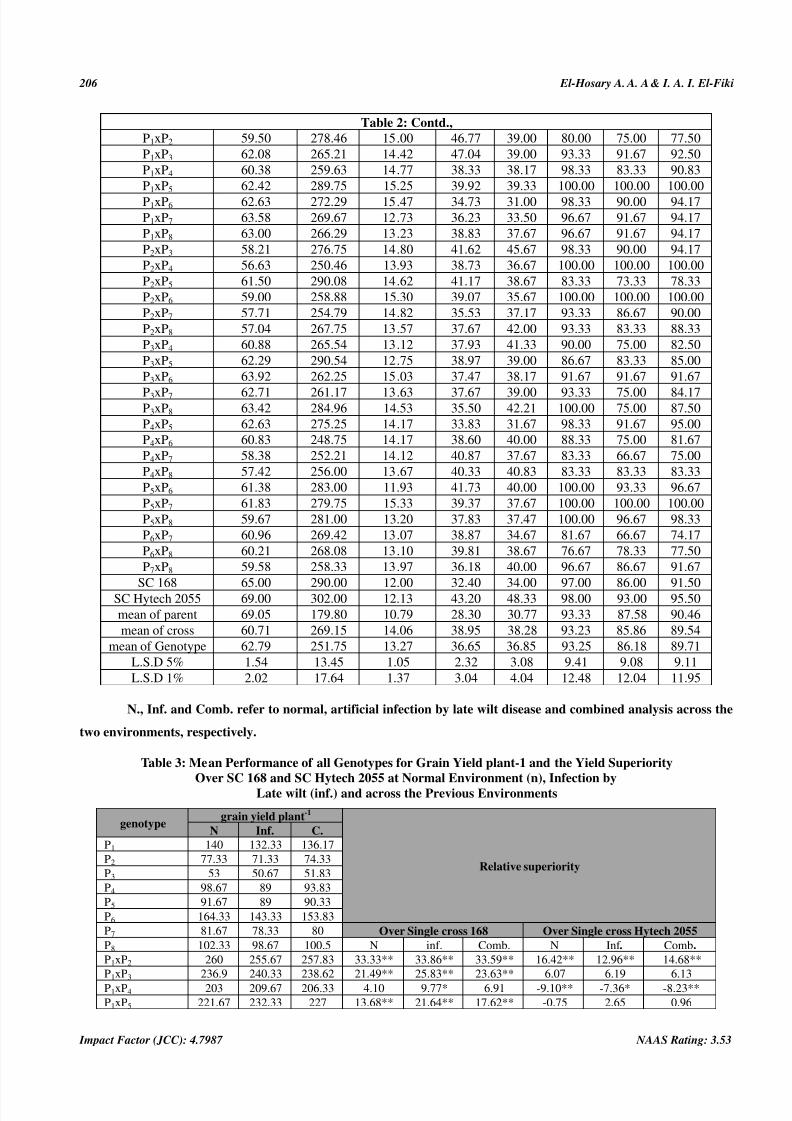
For grain yield plant-1, the two crosses P1xP2 and P2xP3 in both experiments as well as the combined analysis
had significant superiority over the best check hybrid Hytech 2055 by 14.68 and 15.49% in the combined analysis.
The ten crosses of P1xP2, P1xP3, P1xP5, P2xP3, P2xP5, P3xP8, P4xP6, P4xP7, P4xP8 and P5xP7, in both and
across experiments and the combined analysis, gave significant superiority over SC 168 by 33.59, 23.63, 17.62, 34.54,
14.25, 16.23, 11.66, 16.32 and 10.02%, respectively. In addition, the crosses P1xP5 and P5xP7 gave the highest grain yield
with resistance to late wilt. Hence, it could be concluded that these crosses offer possibility for improving grain yield in
maize. These crosses may be released as commercial hybrids after further testing and evaluation. The previous crosses
exhibited significant increase of two or more of traits contributing to grain yield plant-1. The fluctuation of hybrids from
normal and infection environments was detected for most traits.
The mean squares associated with general and specific combining abilities were highly significant in all studied
traits (Table 1). To get an idea about the produced performance of single-cross progeny in each case, the relative size of
7/23/2019 27. IJASR - Diallel Cross Analysis for Earliness, Yield, Its
http://slidepdf.com/reader/full/27-ijasr-diallel-cross-analysis-for-earliness-yield-its 4/12
202 El-Hosary A. A. A & I. A. I. El-Fiki
Impact Factor (JCC): 4.7987 NAAS Rating: 3.53
general to specific combining ability mean squares may be helpful. High ratios which largely exceeded the unity were
obtained for days to 50% silking in both and across environments and resistance to late wilt% in artificial infection
environment as well as the combined analysis. This indicates that the largest part of the total genetic variability was
associated with those traits giving additive and additive by additive gene action. For remain cases, non-additive
type of gene action seemed to be more prevalent. The genetic variance reported by El-Roubyet al.(1973), El-Hosry,
(1989) andEl-Hosaryet al. (2006) to be mostly due to additive type of gene action for earliness. The non-additive genetic
variancewas reported by Singh and Roy (2007), Osmanet al . (2012), Zare et al.( 2011), Goudaet al.(2013), Abdel-
Moneamet al.( 2014), El-Ghonemy (2015) and Kamara (2015)to be most prevalent for grain yield and most of its
components.However other researcher Dereraet al . (2008), Viveket al . (2010), Sibiyaet al . (2011), Ibrahim (2012) , El-
Hosary andElgammaal (2013) and El-Hosary (2014) found that the additive play the major role in inheritance of grain
yield. Akbar et al. (2008) and Hefny (2010)reported that both additive and non-additive effects were equal in expression
of geneticvariability for the yield and its components traits in maize.
Significant GCA and SCA by environments mean squares were obtained for all studied traits except No. of rows
ear-1 and100-kernel weight, indicating that the magnitude of GCA and SCA varied from one environment to another.
These findings agree to a large extent with those obtained from the ordinary analysis of variance.
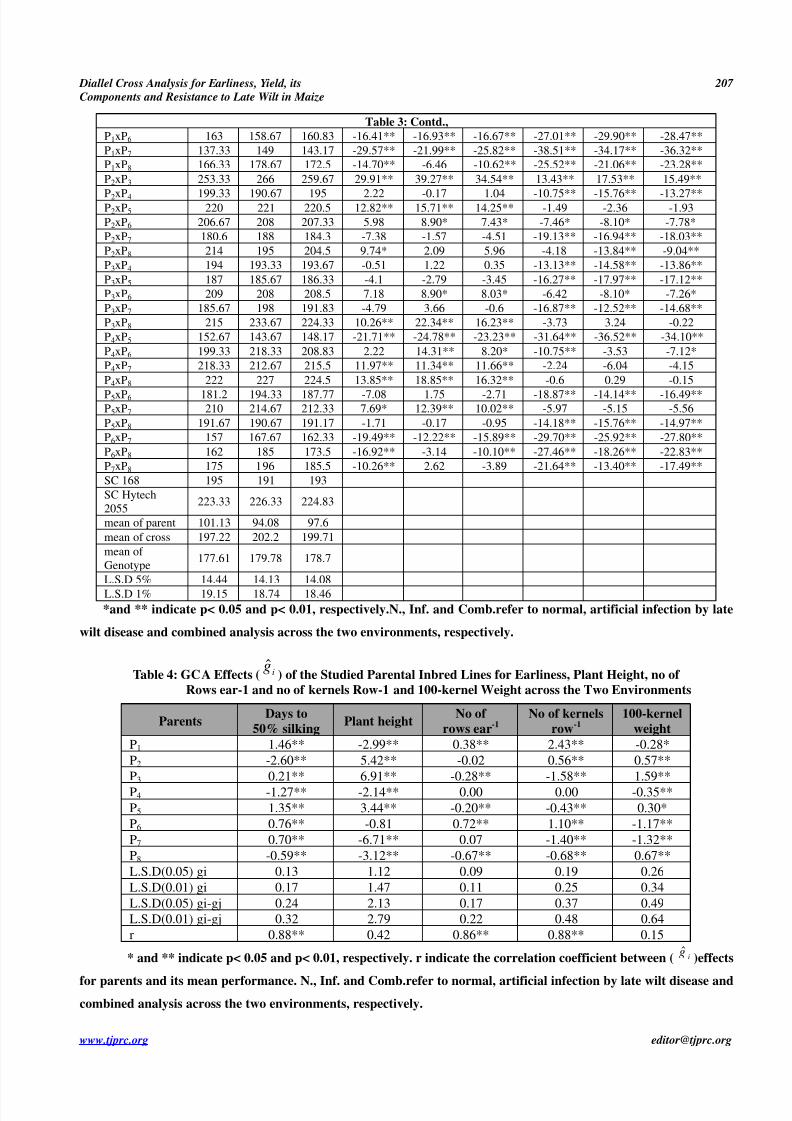
Tables (3a and 3b) illustrate the estimates of ig effects for individual parental inbred lines at the combined across
environment. High positive values would be of interest under all studied traits except days to 50% silking and plant height
where negative one would be useful from the breeder point of view for earliness and lodging resistance. General combining
ability effects computed herein were significantly different from zero in all traits. Significant negative ig effects were
detected by parental inbred lines P1, P4 and P8 for days to 50 % silking and P1, P4, P7 and P8 for plant height.
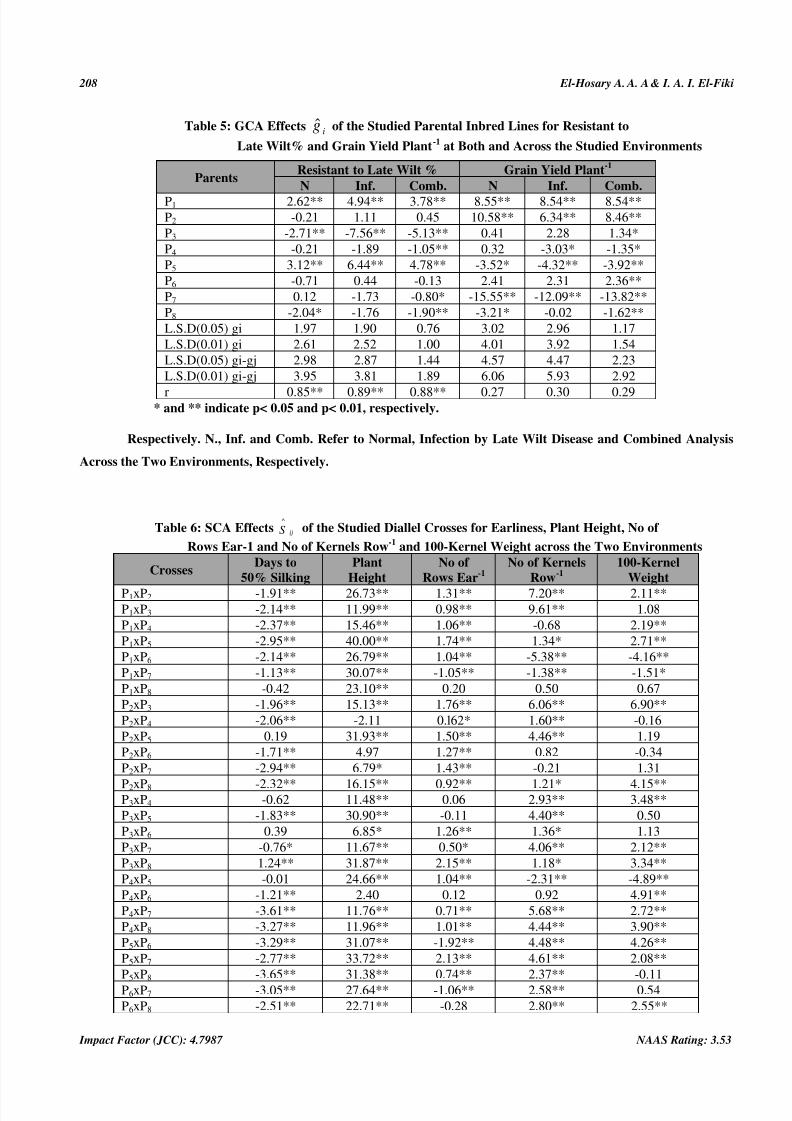
Meanwhile, the significant positive ig effects were detected by parental inbred lines P1, P3, P6 and P8 for No of rows ear-
1; P1, P2 and P6 for No of kernel row-1; P2, P3, P5 and P8 for 100- kernel weight; P1 and P5 for resistant to late wilt and
P1, P2, P3 and P6 for grain yield plant-1.
The aforementioned inbred line which had high ig effects for grain yield plant-1, also, possessed one or more of
the traits contributing to grain yield. It is of interest for plant breeders to ask whether the GCA for parental inbred lines
agrees with its own performance or where some parents are more potent when crossed than would be expected from their
own performance. The results show positive correlation coefficient between the parental performance and the
corresponding ig effects obtained for all studied traits. Therefore, it could be concluded that the high performing hybrids
could be reached except that crossing is carried out between parental inbred lines characterized by high mean
performances. For grain yield plant-1, plant height and 100-kernel weight the insignificant correlation coefficients between
ig effects and mean performance was detected. This disagreement suggests that hybrids characterized by these traits could
be expected by crossing between inbred lines with a low performance for these characters. Also, it could be concluded that
the GCA variance had been with dominance with effects to a certain degree (Jinks 1955). The parental inbred line P2
exhibited the most accurate general combiner for earliness and grain yield plant-1.
7/23/2019 27. IJASR - Diallel Cross Analysis for Earliness, Yield, Its
http://slidepdf.com/reader/full/27-ijasr-diallel-cross-analysis-for-earliness-yield-its 5/12
Diallel Cross Analysis for Earliness, Yield, its 203
Components and Resistance to Late Wilt in Maize
www.tjprc.org [email protected]
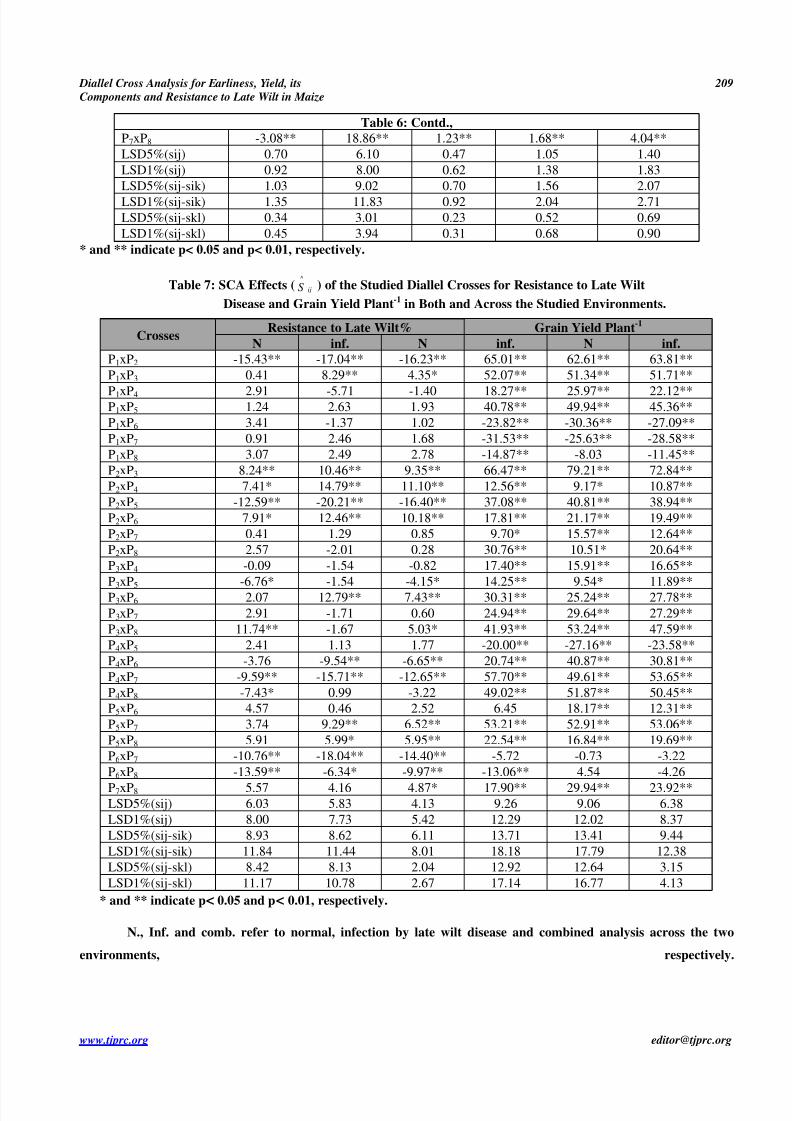
The parental inbred lines combinations specific combining ability ijS ^
effects for all studied traits across
environments are presented in Tables (4 a-b). twenty two, zero, twenty, twenty, fifteen, nine and twenty two crosses give
desirable ijS ^
effects for days to 50% silking, plant height, no of rows ear-1,No of kernels row, 100- kernel weight, resistant
to late wilt% and grain yield plant-1, respectively. The most desirable inter and intra-allelic interactions were represented;
by P4xP7, P4xP8, P5xP6, P5xP8, P6xP7 and P7xP8 for days to 50% silking, P3xP8 and P5xP7 for No of rows
ear-1, P1xP3 for No of kernels row-1, P2xP3 for 100-kerenl weight, P2xP3, P2xP4, P2xP6 and P3xP6 for resistant to late
wilt% and P1xP2 and P2xP3 for grain yield plant-1. Such combinations may be of interest in breeding programs aimed at
excellent hybrids since they surpassed the best performing for these traits or produce new inbred lines as most
combinations involved at least one good combiner parent or produced synthetic varieties.
CONCLUSIONS
The previous results could be showed that the parental inbred line P1was the good general combiner for earliness,
resistant to late wilt and grain yield plant-1. The crosses P1xP2 and P2xP3 had high productivity and these crosses were
superior over the check hybrids. However, the cross P2xP3 was contain most desirable inter and intra-allelic interactions
for most traits.
REFERENCES
1. Abdel-Moneam, M.A., Sultan, M.S., Salama, S.M.G. & El Oraby, A.M. (2014). Evaluation of combining ability
and heterosisfor yield and its components traits of five maize inbreds under normal and stress nitrogen
fertilization. Asian J. Crop Sci., 6: 142-149.
2.
Akbar, M., Saleem, M., Muhammad, F., Ashraf, M.K. & Ahmed, R.A. (2008). Combining ability analysis in
maize undernormal and high temperature conditions. J. Agric. Res., 64: 27-38.
3. Derera, J., Tongoona, P., Pixly, K.V., Vivek, B., Laing, M.D. & Van Rij N.C. (2008). Gene action controlling
gray leaf spotresistance in southern African maize germplasm. Crop Sci. 48: 93-98.
4.
El-Gonemy, M.A.M. (2015). Combining Ability of Seven New White Maize Inbred Lines for Yield and Some
Agronomic Traits. Egyptian Journal of Plant Breeding 19 (1): 15 – 24.
5. El-Hosary, A.A.A. &Elgammaal, A.A. (2013). Combining ability, heterosis and assessing genetic diversity using
rapd markerin maize. Minufiya J. Agric. Res. 38 (1): 109-125
6.
El-Hosary, A.A.A. (2014). Relative values of three different testers in evaluating combining ability of new maize
inbred lines. International J. of Plant Breeding and genetics 5(2): 57-65.
7. El-Hosary, A.A. (1989). Heterosis and combining ability of six inbred lines of maize in diallel crosses over two
years. Egypt. J. Agron. 14(1-2): 47-58
8.
El-Hosary, A.A., El-Badawy, M.EL.M. & Abdel-Tawab, Y.M. (2006). Genetic distance of inbred lines and
prediction of maizesingle-cross performance using RAPD and SSR markers. Egypt. J. Genet. Cytol. 35: 209-224.
9. El-Rouby, M. M., Koraiem, Y.S. and Nawar, A.A. (1973). Estimation of genetic variance and its components in
maize understress and non-stress environment. Egypt. J. Genet. Cyto., 2: 10-19.
7/23/2019 27. IJASR - Diallel Cross Analysis for Earliness, Yield, Its
http://slidepdf.com/reader/full/27-ijasr-diallel-cross-analysis-for-earliness-yield-its 6/12
204 El-Hosary A. A. A & I. A. I. El-Fiki
Impact Factor (JCC): 4.7987 NAAS Rating: 3.53
10. Gomez, K.N. & Gomez, A.A. (1984). Statistical Procedures for Agricultural Research. John.Wiley and Sons. Inc.,
New York,2nded.
11.
Gouda, R.K., Kage, U., Lohithaswa, H.C., Shekara, B.G. and Shobha, D. (2013). Combining ability studies in
maize(Zea mays L.) Mol. Plant Breed., 3: 116-127.
12. Griffing, B. (1956). Concept of general and specific combining ability in relation to diallel crossing systems. Aus.
J. of Biol. Sci. 9: 463-493.
13.
Hefny, M. (2010). Genetic Control of Flowering Traits, Yield and its Components in Maize (Zea mays L.) at
Different SowingDates. Asian J. Crop Sci., 2: 236-249.
14. Ibrahim, Kh.A.M. (2012). Combining analysis of some yellow (Zea mays L.) inbreds for grain yield and other
traits. Egypt J.Agric. Res. 90 (4): 33-46.
15.
Kamara M. Mohamed (2015). Diallel analysis of some yellow maize inbred lines under low and normal nitrogenlevels.International J. of Plant Breeding and genetics 9(2): 32-43.
16. Mostafa, M.A., Abd El-Aziz, A.A., Mahgoub, G.M.A. & El-Sherbieny, H.Y.S. (1996). Diallel analysis of grain
yield andnatural resistance to late wilt disease in newly developed inbred lines of maize. Bull. Fac. Agric., Cairo
Univ. 47: 393- 404.
17.
Osman,M.M.A., Ibrahim Kh.A.M. & El-Ghonemy, M.A.M. (2012). Diallel analysis of grain yield and some
other traits inyellow maize (Zea mays L.) inbred lines. Assuit J. Agric. Sci. 43: 16-26.
18. Sabel, K.A., Samra, A.S. &Hingurani, I.K. (1961). Stalk and root rot of maize in U.A.R. F.A.O. plant protect.
Bull. 9: 121-125.
19.
Shafshak, S.E., Shokr, El-Sayed A., El-Hosary, A.A. &Sedhom, S.A. (1986). Breeding studies on maize I-late
wilt diseaseresistance. Ann. Agric., Sci. Moshtohor 24(3): 1321-1333.
20. Sibiya, J., Tongoona, P., Derera, J. & Van Rij, N. (2011). Genetic analysis and genotype x environment (GxE) for
grey leafspot disease resistance in elite African maize (Zea mays L.) germplasm. Euphytica, 179(1):312-325.
21. Singh, P.K. & Roy, A.K. (2007). Diallel analysis of inbred lines in maize (Zea mays L.). Intl. J. Agric. Sci.
3(1):213-216.
22.
Sprague, G.F. & Tatum, L.A. (1942). General V.S. specific combining ability in single crosses of corn. J. Am. Soc.
Agron. 34: 923-932.
23. Steel, R.G. &Torrie, J.H. (1980). Principles and Procedures of Statistics. McGraw-Hill Book Company, New
York, Toronto, London.
24. Vivek, B.S., Odongo, O., Njuguna, J. ,Imanywoha, J., Bigirwa, G., Diallo, A. &Pixley, K. (2010). Diallel
analysis of grainyield and resistance to seven diseases of 12 African maize (Zea mays L.) inbred lines. Euphytica
172: 329-340.
25. Zare, M., Choukan, R., Heravan, E.M., Bihamta, M.R. and Ordookani, K. (2011). Gene action of some
agronomic traits incorn (Zea mays L.) Using diallel cross analysis. Afr. J. Agric. Res., 6: 693-703
7/23/2019 27. IJASR - Diallel Cross Analysis for Earliness, Yield, Its
http://slidepdf.com/reader/full/27-ijasr-diallel-cross-analysis-for-earliness-yield-its 7/12
Diallel Cross Analysis for Earliness, Yield, its 205
Components and Resistance to Late Wilt in Maize
www.tjprc.org [email protected]
APPENDICES
Table 1: Mean of Squares from Ordinary Analysis for Studied Traits in Normal Environment,
Artificial Infection by Late wilt Disease and Across the Previous Environments.
SOV DFMean squares
Days to
50%
silking
Plant
height
No of
Rows ear-1
No of
kernels row-1
100-kernel
kernel weight
Resistant
to late wilt%
Grain
yield plant-1
Normal environment
Replication 2 4.97* 150.42* 0.79 0.56 1.00 25.93 38.03**
Genotype (G) 35 56.17** 4772.73** 9.33** 110.09** 54.42** 157.06** 7718.44
Parent (P) 7 43.41** 3757.87** 9.41** 108.43** 13.69** 178.57** 3798.95**
Crosses (F1) 27 10.80** 505.19** 2.88** 31.93** 28.82** 157.18** 2636.92**
P vs.F1 1 1370.48** 127100.42** 183.06** 2231.86** 1030.92** 3.24 172355.99**
Error 70 1.13 46.81 0.47 2.65 3.87 33.54 79.08
GCA 7 19.47** 215.26** 1.68** 21.73** 9.57** 41.09** 650.93**
SCA 28 18.54** 1934.82** 3.47** 40.44** 20.28** 55.17** 3053.28**
Error 70 0.38 15.60 0.16 0.88 1.29 11.18 26.36
GCA/SCA - 1.05 0.11 0.48 0.54 0.47 0.74 0.21
Artificial Infection Environment by Late Wilt Disease
Replication 2 5.58** 94.02 1.74* 3.56 17.07* 31.84 82.12
Genotype (G) 35 55.16** 5469.70** 10.43** 97.43** 58.75** 344.29** 8779.67**
Parent (P) 7 28.06** 955.85** 11.13** 78.14** 23.23** 536.36** 2833.69**
Crosses (F1) 27 18.71** 446.66** 2.59** 31.64** 30.34** 304.35** 2564.60**
P vs.F1 1 1229.13** 172688.63** 217.00** 2008.83** 1074.47** 78.26 218208.26**
Error 70 0.72 94.49 0.38 1.55 3.53 31.27 75.67
GCA 7 21.39** 325.84** 1.89** 16.45** 10.09** 191.59** 425.35**
SCA 28 17.64** 2197.58** 3.87** 36.48** 21.96** 95.56** 3551.86**
Error 70 0.24 31.50 0.13 0.52 1.18 10.42 25.22
GCA/SCA - 1.21 0.15 0.49 0.45 0.46 2.00 0.12
Combined Across Environment
Environment (E) 1 0.49 11022.45** 0.07 10.67** 13.73** 2660.02** 289.14**
Rep/E 4 5.28** 122.22 1.27* 2.06 9.04* 28.88 60.08
Genotype (G) 35 108.92** 9991.20** 19.53** 199.86** 110.95** 435.71** 16330.73**
Parent (P) 7 69.79** 3861.48** 20.44** 184.13** 33.57** 656.27** 6574.85**
Crosses (F1) 27 26.89** 911.69** 5.23** 54.38** 57.15** 392.57** 5049.55**P vs.F1 1 2597.69** 298045.79** 399.33** 4237.75** 2105.17** 56.68 389213.82**
G x E 35 2.42** 251.23** 0.23 7.66** 2.23 65.64** 167.37**
P x E 7 1.68 852.24** 0.10 2.44 3.35 58.65 57.78
F1 x E 27 2.63** 40.15** 0.24 9.19** 2.02 68.96** 151.97**
P vs. F1 x E 1 1.92 1743.26** 0.72 2.93 0.23 24.83 1350.43**
Error 140 0.93 70.65 0.43 2.10 3.70 32.41 77.38
GCA 7 39.42** 450.75** 3.52** 35.81** 19.06** 197.48** 1036.69**
SCA 28 35.53** 4050.31** 7.26** 74.32** 41.46** 132.18** 6545.30**
GCA x E 7 1.43** 90.35** 0.05 2.37** 0.60 35.20** 39.59
SCA x E 28 0.65** 82.09** 0.08 2.60** 0.78 18.55* 59.84**
Error 140 0.31 23.55 0.14 0.70 1.23 10.80 25.79
GCA/SCA -- 1.11 0.11 0.48 0.48 0.46 1.49 0.16
* and ** indicate p< 0.05 and p< 0.01, respectively.
Table 2: Mean Performance of all Genotypes for Earliness, Plant Height, no of Rows Ear-1, no ofKernels row-1 and 100-Kernel Weight at the Combined Analysis Across the Studied
Environments and Resistance of Genotypes to Late wilt in Both and Across Environments
genotype
Days to
50%
Silking
plant
Height
No of
Rows ear-1
No of
Kernels
row-1
100-
Kernel
weight
resistance to late wilt %
N. Inf. Comb.
P1 72.00 156.25 11.45 35.85 34.50 100.00 100.00 100.00
P2 63.71 210.33 8.90 27.13 30.17 93.33 88.33 90.83
P3 65.83 203.17 9.48 18.63 30.50 78.33 58.33 68.33
P4 66.58 207.21 11.03 30.28 29.83 96.67 90.00 93.33
P5 72.42 144.33 10.37 26.05 34.33 100.00 100.00 100.00
P6 70.83 186.46 14.55 35.00 29.83 96.67 91.67 94.17
P7 72.63 165.63 11.53 25.28 28.33 96.67 91.67 94.17P8 68.38 165.04 9.00 28.13 28.67 85.00 80.67 82.83
7/23/2019 27. IJASR - Diallel Cross Analysis for Earliness, Yield, Its
http://slidepdf.com/reader/full/27-ijasr-diallel-cross-analysis-for-earliness-yield-its 8/12
206 El-Hosary A. A. A & I. A. I. El-Fiki
Impact Factor (JCC): 4.7987 NAAS Rating: 3.53
Table 2: Contd.,
P1xP2 59.50 278.46 15.00 46.77 39.00 80.00 75.00 77.50
P1xP3 62.08 265.21 14.42 47.04 39.00 93.33 91.67 92.50
P1xP4 60.38 259.63 14.77 38.33 38.17 98.33 83.33 90.83
P1xP5 62.42 289.75 15.25 39.92 39.33 100.00 100.00 100.00
P1xP6 62.63 272.29 15.47 34.73 31.00 98.33 90.00 94.17
P1xP7 63.58 269.67 12.73 36.23 33.50 96.67 91.67 94.17
P1xP8 63.00 266.29 13.23 38.83 37.67 96.67 91.67 94.17
P2xP3 58.21 276.75 14.80 41.62 45.67 98.33 90.00 94.17
P2xP4 56.63 250.46 13.93 38.73 36.67 100.00 100.00 100.00
P2xP5 61.50 290.08 14.62 41.17 38.67 83.33 73.33 78.33
P2xP6 59.00 258.88 15.30 39.07 35.67 100.00 100.00 100.00
P2xP7 57.71 254.79 14.82 35.53 37.17 93.33 86.67 90.00
P2xP8 57.04 267.75 13.57 37.67 42.00 93.33 83.33 88.33
P3xP4 60.88 265.54 13.12 37.93 41.33 90.00 75.00 82.50
P3xP5 62.29 290.54 12.75 38.97 39.00 86.67 83.33 85.00
P3xP6 63.92 262.25 15.03 37.47 38.17 91.67 91.67 91.67
P3xP7 62.71 261.17 13.63 37.67 39.00 93.33 75.00 84.17P3xP8 63.42 284.96 14.53 35.50 42.21 100.00 75.00 87.50
P4xP5 62.63 275.25 14.17 33.83 31.67 98.33 91.67 95.00
P4xP6 60.83 248.75 14.17 38.60 40.00 88.33 75.00 81.67
P4xP7 58.38 252.21 14.12 40.87 37.67 83.33 66.67 75.00
P4xP8 57.42 256.00 13.67 40.33 40.83 83.33 83.33 83.33
P5xP6 61.38 283.00 11.93 41.73 40.00 100.00 93.33 96.67
P5xP7 61.83 279.75 15.33 39.37 37.67 100.00 100.00 100.00
P5xP8 59.67 281.00 13.20 37.83 37.47 100.00 96.67 98.33
P6xP7 60.96 269.42 13.07 38.87 34.67 81.67 66.67 74.17
P6xP8 60.21 268.08 13.10 39.81 38.67 76.67 78.33 77.50
P7xP8 59.58 258.33 13.97 36.18 40.00 96.67 86.67 91.67
SC 168 65.00 290.00 12.00 32.40 34.00 97.00 86.00 91.50SC Hytech 2055 69.00 302.00 12.13 43.20 48.33 98.00 93.00 95.50
mean of parent 69.05 179.80 10.79 28.30 30.77 93.33 87.58 90.46
mean of cross 60.71 269.15 14.06 38.95 38.28 93.23 85.86 89.54
mean of Genotype 62.79 251.75 13.27 36.65 36.85 93.25 86.18 89.71
L.S.D 5% 1.54 13.45 1.05 2.32 3.08 9.41 9.08 9.11
L.S.D 1% 2.02 17.64 1.37 3.04 4.04 12.48 12.04 11.95
N., Inf. and Comb. refer to normal, artificial infection by late wilt disease and combined analysis across the
two environments, respectively.
Table 3: Mean Performance of all Genotypes for Grain Yield plant-1 and the Yield Superiority
Over SC 168 and SC Hytech 2055 at Normal Environment (n), Infection by
Late wilt (inf.) and across the Previous Environments
genotypegrain yield plant-1
Relative superiority
N Inf. C.
P1 140 132.33 136.17
P2 77.33 71.33 74.33
P3 53 50.67 51.83
P4 98.67 89 93.83
P5 91.67 89 90.33
P6 164.33 143.33 153.83
P7 81.67 78.33 80 Over Single cross 168 Over Single cross Hytech 2055
P8 102.33 98.67 100.5 N inf. Comb. N Inf . Comb.
P1xP2 260 255.67 257.83 33.33** 33.86** 33.59** 16.42** 12.96** 14.68**
P1xP3 236.9 240.33 238.62 21.49** 25.83** 23.63** 6.07 6.19 6.13
P1xP4 203 209.67 206.33 4.10 9.77* 6.91 -9.10** -7.36* -8.23**
P1xP5 221.67 232.33 227 13.68** 21.64** 17.62** -0.75 2.65 0.96
7/23/2019 27. IJASR - Diallel Cross Analysis for Earliness, Yield, Its
http://slidepdf.com/reader/full/27-ijasr-diallel-cross-analysis-for-earliness-yield-its 9/12
Diallel Cross Analysis for Earliness, Yield, its 207
Components and Resistance to Late Wilt in Maize
www.tjprc.org [email protected]
Table 3: Contd.,
P1xP6 163 158.67 160.83 -16.41** -16.93** -16.67** -27.01** -29.90** -28.47**
P1xP7 137.33 149 143.17 -29.57** -21.99** -25.82** -38.51** -34.17** -36.32**
P1xP8 166.33 178.67 172.5 -14.70** -6.46 -10.62** -25.52** -21.06** -23.28**
P2xP3 253.33 266 259.67 29.91** 39.27** 34.54** 13.43** 17.53** 15.49**
P2xP4 199.33 190.67 195 2.22 -0.17 1.04 -10.75** -15.76** -13.27**P2xP5 220 221 220.5 12.82** 15.71** 14.25** -1.49 -2.36 -1.93
P2xP6 206.67 208 207.33 5.98 8.90* 7.43* -7.46* -8.10* -7.78*
P2xP7 180.6 188 184.3 -7.38 -1.57 -4.51 -19.13** -16.94** -18.03**
P2xP8 214 195 204.5 9.74* 2.09 5.96 -4.18 -13.84** -9.04**
P3xP4 194 193.33 193.67 -0.51 1.22 0.35 -13.13** -14.58** -13.86**
P3xP5 187 185.67 186.33 -4.1 -2.79 -3.45 -16.27** -17.97** -17.12**
P3xP6 209 208 208.5 7.18 8.90* 8.03* -6.42 -8.10* -7.26*
P3xP7 185.67 198 191.83 -4.79 3.66 -0.6 -16.87** -12.52** -14.68**
P3xP8 215 233.67 224.33 10.26** 22.34** 16.23** -3.73 3.24 -0.22
P4xP5 152.67 143.67 148.17 -21.71** -24.78** -23.23** -31.64** -36.52** -34.10**
P4xP6 199.33 218.33 208.83 2.22 14.31** 8.20* -10.75** -3.53 -7.12*
P4xP7 218.33 212.67 215.5 11.97** 11.34** 11.66** -2.24 -6.04 -4.15
P4xP8 222 227 224.5 13.85** 18.85** 16.32** -0.6 0.29 -0.15
P5xP6 181.2 194.33 187.77 -7.08 1.75 -2.71 -18.87** -14.14** -16.49**P5xP7 210 214.67 212.33 7.69* 12.39** 10.02** -5.97 -5.15 -5.56
P5xP8 191.67 190.67 191.17 -1.71 -0.17 -0.95 -14.18** -15.76** -14.97**
P6xP7 157 167.67 162.33 -19.49** -12.22** -15.89** -29.70** -25.92** -27.80**
P6xP8 162 185 173.5 -16.92** -3.14 -10.10** -27.46** -18.26** -22.83**
P7xP8 175 196 185.5 -10.26** 2.62 -3.89 -21.64** -13.40** -17.49**
SC 168 195 191 193
SC Hytech
2055223.33 226.33 224.83
mean of parent 101.13 94.08 97.6
mean of cross 197.22 202.2 199.71
mean of
Genotype177.61 179.78 178.7
L.S.D 5% 14.44 14.13 14.08
L.S.D 1% 19.15 18.74 18.46
*and ** indicate p< 0.05 and p< 0.01, respectively.N., Inf. and Comb.refer to normal, artificial infection by late
wilt disease and combined analysis across the two environments, respectively.
Table 4: GCA Effects ( ig) of the Studied Parental Inbred Lines for Earliness, Plant Height, no of
Rows ear-1 and no of kernels Row-1 and 100-kernel Weight across the Two Environments
ParentsDays to
50% silkingPlant height
No of
rows ear-1
No of kernels
row-1
100-kernel
weight
P1 1.46** -2.99** 0.38** 2.43** -0.28*
P2 -2.60** 5.42** -0.02 0.56** 0.57**
P3 0.21** 6.91** -0.28** -1.58** 1.59**
P4 -1.27** -2.14** 0.00 0.00 -0.35**
P5 1.35** 3.44** -0.20** -0.43** 0.30*
P6 0.76** -0.81 0.72** 1.10** -1.17**
P7 0.70** -6.71** 0.07 -1.40** -1.32**
P8 -0.59** -3.12** -0.67** -0.68** 0.67**
L.S.D(0.05) gi 0.13 1.12 0.09 0.19 0.26
L.S.D(0.01) gi 0.17 1.47 0.11 0.25 0.34
L.S.D(0.05) gi-gj 0.24 2.13 0.17 0.37 0.49
L.S.D(0.01) gi-gj 0.32 2.79 0.22 0.48 0.64
r 0.88** 0.42 0.86** 0.88** 0.15
* and ** indicate p< 0.05 and p< 0.01, respectively. r indicate the correlation coefficient between ( ig)effects
for parents and its mean performance. N., Inf. and Comb.refer to normal, artificial infection by late wilt disease and
combined analysis across the two environments, respectively.
7/23/2019 27. IJASR - Diallel Cross Analysis for Earliness, Yield, Its
http://slidepdf.com/reader/full/27-ijasr-diallel-cross-analysis-for-earliness-yield-its 10/12
208 El-Hosary A. A. A & I. A. I. El-Fiki
Impact Factor (JCC): 4.7987 NAAS Rating: 3.53
Table 5: GCA Effects ig of the Studied Parental Inbred Lines for Resistant to
Late Wilt% and Grain Yield Plant-1 at Both and Across the Studied Environments
ParentsResistant to Late Wilt % Grain Yield Plant
-1
N Inf. Comb. N Inf. Comb.
P1 2.62** 4.94** 3.78** 8.55** 8.54** 8.54**
P2 -0.21 1.11 0.45 10.58** 6.34** 8.46**
P3 -2.71** -7.56** -5.13** 0.41 2.28 1.34*
P4 -0.21 -1.89 -1.05** 0.32 -3.03* -1.35*
P5 3.12** 6.44** 4.78** -3.52* -4.32** -3.92**
P6 -0.71 0.44 -0.13 2.41 2.31 2.36**
P7 0.12 -1.73 -0.80* -15.55** -12.09** -13.82**
P8 -2.04* -1.76 -1.90** -3.21* -0.02 -1.62**
L.S.D(0.05) gi 1.97 1.90 0.76 3.02 2.96 1.17
L.S.D(0.01) gi 2.61 2.52 1.00 4.01 3.92 1.54
L.S.D(0.05) gi-gj 2.98 2.87 1.44 4.57 4.47 2.23
L.S.D(0.01) gi-gj 3.95 3.81 1.89 6.06 5.93 2.92
r 0.85** 0.89** 0.88** 0.27 0.30 0.29* and ** indicate p< 0.05 and p< 0.01, respectively.
Respectively. N., Inf. and Comb. Refer to Normal, Infection by Late Wilt Disease and Combined Analysis
Across the Two Environments, Respectively.
Table 6: SCA Effects ijS ^
of the Studied Diallel Crosses for Earliness, Plant Height, No of
Rows Ear-1 and No of Kernels Row-1 and 100-Kernel Weight across the Two Environments
CrossesDays to
50% Silking
Plant
Height
No of
Rows Ear-1
No of Kernels
Row-1
100-Kernel
Weight
P1xP2 -1.91** 26.73** 1.31** 7.20** 2.11**P1xP3 -2.14** 11.99** 0.98** 9.61** 1.08
P1xP4 -2.37** 15.46** 1.06** -0.68 2.19**
P1xP5 -2.95** 40.00** 1.74** 1.34* 2.71**
P1xP6 -2.14** 26.79** 1.04** -5.38** -4.16**
P1xP7 -1.13** 30.07** -1.05** -1.38** -1.51*
P1xP8 -0.42 23.10** 0.20 0.50 0.67
P2xP3 -1.96** 15.13** 1.76** 6.06** 6.90**
P2xP4 -2.06** -2.11 0.l62* 1.60** -0.16
P2xP5 0.19 31.93** 1.50** 4.46** 1.19
P2xP6 -1.71** 4.97 1.27** 0.82 -0.34
P2xP7 -2.94** 6.79* 1.43** -0.21 1.31
P2xP8 -2.32** 16.15** 0.92** 1.21* 4.15**P3xP4 -0.62 11.48** 0.06 2.93** 3.48**
P3xP5 -1.83** 30.90** -0.11 4.40** 0.50
P3xP6 0.39 6.85* 1.26** 1.36* 1.13
P3xP7 -0.76* 11.67** 0.50* 4.06** 2.12**
P3xP8 1.24** 31.87** 2.15** 1.18* 3.34**
P4xP5 -0.01 24.66** 1.04** -2.31** -4.89**
P4xP6 -1.21** 2.40 0.12 0.92 4.91**
P4xP7 -3.61** 11.76** 0.71** 5.68** 2.72**
P4xP8 -3.27** 11.96** 1.01** 4.44** 3.90**
P5xP6 -3.29** 31.07** -1.92** 4.48** 4.26**
P5xP7 -2.77** 33.72** 2.13** 4.61** 2.08**
P5xP
8 -3.65** 31.38** 0.74** 2.37** -0.11
P6xP7 -3.05** 27.64** -1.06** 2.58** 0.54
P6xP8 -2.51** 22.71** -0.28 2.80** 2.55**
7/23/2019 27. IJASR - Diallel Cross Analysis for Earliness, Yield, Its
http://slidepdf.com/reader/full/27-ijasr-diallel-cross-analysis-for-earliness-yield-its 11/12
Diallel Cross Analysis for Earliness, Yield, its 209
Components and Resistance to Late Wilt in Maize
www.tjprc.org [email protected]
Table 6: Contd.,
P7xP8 -3.08** 18.86** 1.23** 1.68** 4.04**
LSD5%(sij) 0.70 6.10 0.47 1.05 1.40
LSD1%(sij) 0.92 8.00 0.62 1.38 1.83
LSD5%(sij-sik) 1.03 9.02 0.70 1.56 2.07
LSD1%(sij-sik) 1.35 11.83 0.92 2.04 2.71
LSD5%(sij-skl) 0.34 3.01 0.23 0.52 0.69
LSD1%(sij-skl) 0.45 3.94 0.31 0.68 0.90
* and ** indicate p< 0.05 and p< 0.01, respectively.
Table 7: SCA Effects ( ijS ^
) of the Studied Diallel Crosses for Resistance to Late Wilt
Disease and Grain Yield Plant-1 in Both and Across the Studied Environments.
CrossesResistance to Late Wilt% Grain Yield Plant-1
N inf. N inf. N inf.
P1xP2 -15.43** -17.04** -16.23** 65.01** 62.61** 63.81**
P1xP3 0.41 8.29** 4.35* 52.07** 51.34** 51.71**
P1xP4 2.91 -5.71 -1.40 18.27** 25.97** 22.12**P1xP5 1.24 2.63 1.93 40.78** 49.94** 45.36**
P1xP6 3.41 -1.37 1.02 -23.82** -30.36** -27.09**
P1xP7 0.91 2.46 1.68 -31.53** -25.63** -28.58**
P1xP8 3.07 2.49 2.78 -14.87** -8.03 -11.45**
P2xP3 8.24** 10.46** 9.35** 66.47** 79.21** 72.84**
P2xP4 7.41* 14.79** 11.10** 12.56** 9.17* 10.87**
P2xP5 -12.59** -20.21** -16.40** 37.08** 40.81** 38.94**
P2xP6 7.91* 12.46** 10.18** 17.81** 21.17** 19.49**
P2xP7 0.41 1.29 0.85 9.70* 15.57** 12.64**
P2xP8 2.57 -2.01 0.28 30.76** 10.51* 20.64**
P3xP4 -0.09 -1.54 -0.82 17.40** 15.91** 16.65**
P3xP
5 -6.76* -1.54 -4.15* 14.25** 9.54* 11.89**
P3xP6 2.07 12.79** 7.43** 30.31** 25.24** 27.78**
P3xP7 2.91 -1.71 0.60 24.94** 29.64** 27.29**
P3xP8 11.74** -1.67 5.03* 41.93** 53.24** 47.59**
P4xP5 2.41 1.13 1.77 -20.00** -27.16** -23.58**
P4xP6 -3.76 -9.54** -6.65** 20.74** 40.87** 30.81**
P4xP7 -9.59** -15.71** -12.65** 57.70** 49.61** 53.65**
P4xP8 -7.43* 0.99 -3.22 49.02** 51.87** 50.45**
P5xP6 4.57 0.46 2.52 6.45 18.17** 12.31**
P5xP7 3.74 9.29** 6.52** 53.21** 52.91** 53.06**
P5xP8 5.91 5.99* 5.95** 22.54** 16.84** 19.69**
P6xP7 -10.76** -18.04** -14.40** -5.72 -0.73 -3.22
P6xP8 -13.59** -6.34* -9.97** -13.06** 4.54 -4.26
P7xP8 5.57 4.16 4.87* 17.90** 29.94** 23.92**LSD5%(sij) 6.03 5.83 4.13 9.26 9.06 6.38
LSD1%(sij) 8.00 7.73 5.42 12.29 12.02 8.37
LSD5%(sij-sik) 8.93 8.62 6.11 13.71 13.41 9.44
LSD1%(sij-sik) 11.84 11.44 8.01 18.18 17.79 12.38
LSD5%(sij-skl) 8.42 8.13 2.04 12.92 12.64 3.15
LSD1%(sij-skl) 11.17 10.78 2.67 17.14 16.77 4.13
* and ** indicate p< 0.05 and p< 0.01, respectively.
N., Inf. and comb. refer to normal, infection by late wilt disease and combined analysis across the two
environments, respectively.

7/23/2019 27. IJASR - Diallel Cross Analysis for Earliness, Yield, Its
http://slidepdf.com/reader/full/27-ijasr-diallel-cross-analysis-for-earliness-yield-its 12/12