to my wife, son and parents who have given me unending...
TRANSCRIPT

FLAVOR STABILITY AND OFF-FLAVORS IN THERMALLY PROCESSED ORANGE JUICE
By
J. GLEN DREHER
A DISSERTATION PRESENTED TO THE GRADUATE SCHOOL OF THE UNIVERSITY OF FLORIDA IN PARTIAL FULFILLMENT
OF THE REQUIREMENTS FOR THE DEGREE OF DOCTOR OF PHILOSOPHY
UNIVERSITY OF FLORIDA
2007
1

© 2007 J. Glen Dreher
2

To my wife, son and parents who have given me unending love, support and encouragement
3

ACKNOWLEDGMENTS
I would like to thank my committee members Dr. Charles Sims, Dr. Renee Goodrich, Dr.
Ron Schmidt and Dr. David Powell for their support and guidance throughout this project. I
would also like to thank Dr. Anson Moye and Dr. Kenneth Berger who were original members of
my committee and have since retired. I especially would like to thank my major advisor, Dr.
Russell Rouseff for his mentoring, and most of all, for his continuing support and
encouragement. I have learned a lot from him not only about flavor chemistry but also
perseverance and dedication.
I would like to thank the United States-Israel Binational Agricultural Research and
Development Fund (BARD) for their financial support and O-I Analytical for the use of the
PFPD.
I would like to thank everyone who participated as GC-O panelists including Dr. Kanjana
Mahattanatawee, Aslaug Hognadoittir, and Dr. Jianming Lin as well as Jack Smoot, Kelly Evans
and Dr. Filomena Valim for all their support while working in the lab.
I would like to thank my family for sticking with me and supporting me to finish my goals,
especially my wife, Renee, for her unending encouragement. Finally, I would like to thank God
for giving me the strength and guidance to complete this task.
4

TABLE OF CONTENTS page
ACKNOWLEDGMENTS ...............................................................................................................4
LIST OF TABLES...........................................................................................................................8
LIST OF FIGURES .........................................................................................................................9
ABSTRACT...................................................................................................................................10
1 INTRODUCTION ..................................................................................................................12
2 REVIEW OF LITERATURE.................................................................................................15
Orange Juice ...........................................................................................................................15 Orange Juice Flavor and Processing.......................................................................................16 Flavor Production ...................................................................................................................18
Terpene Glycosides .........................................................................................................19 Shikimic Acid pathway ...................................................................................................20 Maillard Reaction ............................................................................................................21 Strecker Degradation.......................................................................................................22 Microbial .........................................................................................................................22 Packaging ........................................................................................................................23
Gas Chromatography-Olfactometry .......................................................................................25 Extraction Methods.................................................................................................................29 Thiamin as a Source of Potent Sulfur Aroma Compounds.....................................................30
2-methyl-3-furanthiol ......................................................................................................30 Bis(2-methyl-3-furyl) disulfide .......................................................................................31 Thiamin Degradation Pathway ........................................................................................31 Alternate Pathways for the Production of 2-Methyl-3-furanthiol ...................................32
3 AN AROMA COMPARISON BETWEEN ORANGE JUICES OF DIFFERING ORGANOLEPTIC QUALITIES............................................................................................35
Introduction.............................................................................................................................35 Materials and Methods ...........................................................................................................36
Survey of Commercial orange juice................................................................................36 Chemicals ........................................................................................................................37 Sample Preparation..........................................................................................................37 Gas Chromatography-olfactometry Conditions ..............................................................38 Time-intensity Analysis...................................................................................................39 Sulfur Analysis ................................................................................................................39
Results and Discussion ...........................................................................................................39 α-Terpineol, Furaneol, and 4-vinylguaiacol....................................................................41 α-Terpineol......................................................................................................................42 4-Vinylguaiacol ...............................................................................................................44
5

Methional.........................................................................................................................45 Conclusions.............................................................................................................................46
4 ORANGE JUICE FLAVOR STORAGE STUDY: DIFFERENCES BETWEEN GLASS AND PET PACKAGING OVER TIME AND TEMPERATURE...........................54
Introduction.............................................................................................................................54 Materials and Methods ...........................................................................................................56
Chemicals ........................................................................................................................56 Orange Juice.....................................................................................................................57 Visual and Organoleptic Evaluation ................................................................................57 Sample Preparation..........................................................................................................57 Gas chromatography-olfactometry Cnditions .................................................................58 GC-olfactometry..............................................................................................................58 Gas Chromatography-mass spectrometry (GC-MS) .......................................................59
Results and Discussion ...........................................................................................................60 Aroma Changes over time...............................................................................................61 Off-Flavor Compounds ...................................................................................................61
Methional .................................................................................................................62 Furaneol and 4-vinylguaiacol...................................................................................62 2-Methyl-3-furanthiol and bis(2-methyl-3-furyl) disulfide......................................62 M-cresol ...................................................................................................................63 Sulfur Compounds ...................................................................................................63 Carvone ....................................................................................................................64 Vanillin.....................................................................................................................64
Changes in Fresh Juice Compounds................................................................................65 (Z)-3-Hexenal...........................................................................................................65 Linalool ....................................................................................................................65 Ethyl butyrate ...........................................................................................................65 Octanal .....................................................................................................................66 Acetic and butanoic acids.........................................................................................66 Trans-4,5-epoxy-(E)-2-decenal ................................................................................67
Container Comparison......................................................................................................67 Conclusions.............................................................................................................................67
5 GC-OLFACTOMETRIC CHARACTERIZATION OF AROMA VOLATILES FROM THE THERMAL DEGRADATION OF THIAMIN IN MODEL ORANGE JUICE............78
Introduction.............................................................................................................................78 Materials and Methods ...........................................................................................................79
Preparation of Model orange juice solutions ................................................................. .80 Sample Preparation..........................................................................................................80 Gas Chromatography-pulse flame photometric detector (GC-PFPD) .............................80 Quantitative Analysis .......................................................................................................81 Gas Chromatography........................................................................................................81 GC-olfactometry...............................................................................................................81 Gas Chromatography-mass Spectrometry (GC-MS) .......................................................82
6

7
Injector Decomposition Study .........................................................................................83 Microbiological Analysis ................................................................................................83
Results and Discussion ...........................................................................................................83 Day 7 and 42 Aromagrams..............................................................................................84 Aroma Volatile identifications ........................................................................................85 Quantification of MFT and MFT-MFT...........................................................................88 Thiamin as a Source of MFT and MFT-MFT in Citrus Juices........................................89 Possible GC Injector Thermal Artifacts..........................................................................90 Possible Microbiological Artifacts..................................................................................91
Conclusions.............................................................................................................................91
6 CONCLUSIONS ....................................................................................................................97
LIST OF REFERENCES...............................................................................................................99
BIOGRAPHICAL SKETCH .......................................................................................................111

LIST OF TABLES
Table page 3-1 Summary of aroma active compounds found in good and poor quality juice........................47
4-1 Aroma active compounds in orange juice stored at 4 and 35°C over 112 days. ....................69
4-2 Comparison of total overall aroma intensity under various package, time and temperature conditions.......................................................................................................73
5-1 Aroma active compounds detected in model orange juice solution .......................................93
8

LIST OF FIGURES
Figure page 2-1 Pathways for α-terpineol formation from linalool and (+)-limonene ....................................34
2-2 Thiamin thermal degradation pathways A =thiamin hydrochloride, B = pyrimidine moiety, C = thiazoles moiety, D = diaminopyrimidine, E = formic acid, and F = 5-hydroxy-3-mercapto-2-pentanone......................................................................................34
3-1 Normalized aroma peak intensity comparison of good and poor quality orange juice. .........49
3-2 Aldehyde comparison between good and poor quality orange juice......................................50
3-3 Comparison of known off-flavor components in orange juice...............................................51
3-4 Possible pathway formations of α-terpineol...........................................................................51
3-5 Individual response chromatogram of α-terpineol GC/FID aromagram overlay...................52
3-6 GC-O aroma threshold determination of α-terpineol. ............................................................52
3-7 Methional formation through Strecker degradation of methionine ........................................53
4-1 Aroma comparison of day 0 and 112 (35°C) in glass packaging. ..........................................73
4-2 Aroma comparison of day 0 and 112 (35°C) in polyethylene terepthalate packaging...........74
4-4 Aroma comparison of orange juice stored at 4 and 35° for 112 days in polyethylene terepthalate.........................................................................................................................76
5-1 SPME headspace samples of GC-O aromagrams comparing day 7 and 42, where peak intensities were inverted for day 42 data. ..........................................................................93
5-2 Structures of select aroma active sulfur compounds detected in the model orange juice solution...............................................................................................................................94
5-3 Comparison between PFPD chromatogram and corresponding aromagram from a model orange juice solution stored for 7 days at 35°C. ...............................................................95
9

Abstract of Dissertation Presented to the Graduate School of the University of Florida in Partial Fulfillment of the Requirements for the Degree of Doctor of Philosophy
FLAVOR STABILITY AND OFF-FLAVORS IN THERMALLY PROCESSED ORANGE JUICE
By
J. Glen Dreher December 2007
Chair: Russell Rouseff Major: Food Science and Human Nutrition
The aroma active components of thermally processed orange juice were determined and
compared between orange juices of above and below average quality. A loss of aldehydes
including hexanal, heptanal and octanal; imparting aromas such as floral, green and citrus
coupled with the occurrence of potent off-flavor compounds 4-vinylguaiacol and methional
contributed to the differences seen between the above and below average quality juices. Of
significance, the widely reported orange juice storage off-flavor compound α-terpineol was
found in greater concentration than previously reported but without aroma activity.
The aroma active components of orange juice were noted to change over time during
storage at 35°C. Difference in aroma active compounds at 4°C and 35°C were seen, with a loss
and/or diminishing impact of aroma active compounds that contribute to good quality orange
juice flavor including (Z)-3-hexenal, octanal, (Z)-4-octenal and (E)-2-octenal. Qualitative
differences were noted between glass and PET containers, with orange juice stored in PET
forming off-flavor compounds including eugenol, sotolon, 4-mercapto-4-methyl-2-pentanone, 2-
methyl-3-furanthiol as well as higher aroma intensities of the well documented storage off-flavor
4-vinylguaiacol.
10

Through a model orange juice solution, thiamin, the second most abundant water-soluble
vitamin in orange juice, was determined to be the precursor for the off-flavor compound 2-
methyl-3-furanthiol (MFT) and its very potent dimer, bis(2-methyl-3-furyl) disulfide (MFT-
MFT). Both MFT and MFT-MFT impart a meaty aroma have recently been documented as off-
flavors in stored orange juice. MFT and its dimer increased in concentration over time at storage
conditions of 35°C.
The results of this study show the importance of balance in flavor composition and how
packaging and storage can affect the quality of orange juice. Producers can take steps to add
back the specific fresh aroma active compounds lost during processing, while designing the
packaging to minimize storage off-flavors and limiting off-flavor compounds through
fortification.
11

12
CHAPTER 1 INTRODUCTION
Orange production has an enormous impact on the world and U.S. economy both as fresh
fruit and juice. The total dollar amount spent in the US in 1999 was approximately $1.7 billion
on fresh orange and juice combined (2007). Citrus is valued for its balance of sweet and sour
tastes as well as distinctive aroma. Although the orange has its highest monetary value when
sold as fresh fruit, over 90 percent of orange production in Florida is for juice processing
(Chadwell et al., 2006).
The flavor of orange juice is complex and the difference between a good and poor quality
juice starts with the initial flavor quality of the orange. The ripening process for an orange is
non-climacteric, ripening only occurs while on the tree (Alonso et al., 1995). During non-
climacteric maturation, respiration remains level, decay is rapid and no definitive abscission time
exists; whereas climacteric fruit such as bananas have an increased respiration during maturation
and a definitive abscission time. For this reason, oranges are picked for the optimal °Brix
(primarily sugars) to acid ratio. As the orange matures, the acidity decreases while the °Brix, or
soluble solids, increases. Although citrus is a non-climacteric fruit, peel color may be altered
after picking through controlled atmosphere storage. Stewart and Wheaton (1972) found
carotenoid accumulation in Robinson tangerine to increase in the presence of ethylene at 10
µg/mL, with degreening occurring after 1 week followed by carotenoid development from
yellow to orange in weeks 2 and 3. The study also reported that carotenoid development is best
at lower degreening temperatures and is inhibited at temperatures above 30°C.
The proximate analysis of orange juice is 11.27 °Brix, 0.67% citric acid, 12% pulp
(volume by centrifuge) and 0.0123% oil (v/v) (Balaban et al., 1991). As with most foods, the
smallest component of the total, oils/aromas, contributes the most impact to the overall flavor of

the fruit. The °Brix/acid ratio is important, but the aroma composition can profoundly impact
juice quality because much of what humans perceive as flavor is really produced from aroma
components. Aroma active volatiles are secondary metabolites formed during maturation and
are concentrated in the oil glands in the peel as well as in the juice vesicles.
Orange juice flavor is not only produced during fresh fruit maturation but is also affected
by subsequent processing and storage of the finished juice. The main factor which alters flavors
during processing is heat. Thermal processing is necessary to create a stable product; however,
heat can also alter the volatile composition by reducing some of the initial flavor volatiles
through reactions as well as produce off-flavors from non volatile precursors. Aroma
composition will continue to change during storage because of certain chemical reactions. The
extent of these chemical changes will be dependent on storage time and temperature. Packaging
material can also affect juice flavor. Materials such as low and high density polyethylene and
polyethylene terephthalate can cause flavor scalping or addition of compounds to the juice
through migration especially with the major orange juice volatile (+)-limonene (Kutty et al.,
1994; Lune et al., 1997; van Willige et al., 2003; Fauconnier et al., 2001).
There were three objectives in this study. The first objective was a comparison between
orange juices of differing qualities, determining differences in volatile compound composition
and concentrations to identify which components correlate with good quality and which
components correlate with poor quality. Secondly, orange juice aroma impact compounds were
determined in a time/temperature/packaging study to determine the effects of storage time and
temperature as well as packaging materials. Finally, a model orange juice system was employed
to determine possible formation pathways of the off-flavor aroma compounds 2-methyl-3-
furanthiol and bis(2-methyl-3-furyl) disulfide that were detected in the first two studies.
13

By determining the difference between a poor and good quality orange juice as well as
flavor changes associated with different packaging materials during storage, a processor can
tailor the add back flavor package or alter packaging material to improve juice quality. A real
world application of my final model orange juice study solution would be the confirmation of the
source of a potent off-flavor and the information necessary to alter processing, packaging or
storage so as to provide the highest quality of orange juice to the consumer.
14

15
CHAPTER 2 REVIEW OF LITERATURE
Orange Juice
Sweet oranges, Citrus sinensis, have long been prized as a fresh fruit and as juice. As a
fresh fruit, the orange ranks third behind bananas and apples in consumption per year in the U.S.
(USDA, 2006a). As a juice, oranges rank number one, with American’s drinking 2.5 times more
orange juice than the second-ranked apple juice (Pollack et al., 2003). An 8oz serving of orange
juice contains 100% of the daily value (d.v) of Vitamin C, 20% of the d.v. for folic acid, 15% of
the d.v. for potassium and 10% of the d.v. for thiamin.
Oranges are the most important fruit in the citrus family, comprising roughly 65% of the
world’s estimated citrus crop. Prior to the 2004/2005 season, the United States has been
traditionally the second largest producer of citrus behind Brazil. Due to hurricane damage, the
United States is currently the third largest citrus producer behind Brazil and China.
Approximately 68% of citrus produced in the United States is processed into juice, but 95 – 96%
of Florida’s orange crop in used for juice (USDA, 2006b).
The different cultivars of oranges are split into three categories by the ripening season:
early, mid, and late. Early cultivars reach maturity before December and include the “Hamlin,”
“Parson Brown” and navel oranges. Mid-season cultivars reach maturity between December and
March and include “Pineapple,” “Queen,” Sunstar,” “Gardner” and “Midsweet” cultivars. The
late season fruit peak from March to June, with the main cultivar being “Valencia.” The navel
orange is prized for fresh fruit consumption as they can develop a bitter note when processed into
juice. The “Valencia” is the primary sweet orange cultivar grown in Florida and the world and is
mainly processed into juice (Williamson and Jackson, 1993).

Orange Juice Flavor and Processing
There are four main categories in which orange juice can exist: fresh squeezed orange
juice, frozen concentrate orange juice (FCOJ), not-from concentrate orange juice (NFC) and
orange juice from concentrate (RECON). The first group, fresh squeezed, is highly valued for its
fresh flavor and natural quality. The lack of heat treatment sets this group apart from the others
(Schmidt et al., 2005). However, because the juice does not have any heat treatment, its shelf-
life is limited to a few days. Fresh squeezed juice is an important part of the European market
(2006a).
Frozen concentrate orange juice is concentrated by thermal processing, during which
water and volatile flavors are removed. The flavor vapors are cooled and reclaimed in one of the
first stage condensers and fractionated into oil and aqueous phases. A flavor system comprised
of portions of the captured essence is then added back to the concentrated juice to restore some
of the lost flavor.
Not-from concentrate orange juice comprises the largest single segment in the United
States, as it was responsible for 49% of the total orange juice market in the 2004-2005 season
(2006b). NFC is pasteurized but not concentrated or frozen. NFC is the closest thermally treated
juice to fresh squeezed in terms of flavor.
Orange juice from concentrate is FCOJ that has been commercially reconstituted to single
strength orange juice. The advantage of reconstituting FCOJ commercially is reduction in
transportation cost to the producer. However, the main disadvantage from a flavor standpoint is
that RECON receives a second heat treatment when it is repackaged, causing more flavor loss
and degradation. From a flavor standpoint, RECON is the furthest away from the fresh squeezed
juice that is prized for its flavor.
16

Of the four types of processed juice, the two largest groups consist of NFC and FCOJ.
The standards of identity for these types of juices are set in the Code of Federal Regulation
(CFR) Title 21. The USDA has set standards for grading orange juice within the 47 Federal
Register (FR) (USDA, 1983). The orange juice is separated into grades A, B and substandard
within the types of orange juice. The main factors affecting the quality grade include color,
defects, and flavor. Other factors are specific to the type of juice and include appearance,
reconstitution and coagulation. The color is scored as compared to USDA Orange Juice Color
Standards with a max score of 40 points, with Grade A having a minimum of 36 score points.
Defects include juice cells, pulp, seeds or portion of seeds, specks, particles of membrane, core,
peel, or any other distinctive features that adversely affect the appearance or drinking quality of
the orange juice. Defects are scored on a scale with max points of 20. Grade A orange juice is
considered practically free of defects with a minimum score of 18. Flavor is evaluated and
scored on a scale with a maximum of 40 points and separated into three categories: very good
flavor, good flavor and poor flavor. Grade A orange juice has very good flavor with a minimum
of 36 points and defined as fine, distinct, and substantially typical of orange juice extracted from
fresh mature sweet oranges and is free from off flavors of any kind. Grade B orange juice meets
the good flavor standards, ranging from 32 – 35 points, and is similar to the flavor of juice
extracted from fresh mature sweet oranges but may be slightly affected by processing,
packaging, or storage conditions. Poor flavor orange juice would score less than 32 points and is
defined to fail to meet the requirements set for good flavor. As defined, poor flavor juice would
be categorized as substandard orange juice.
The main difference between NFC and FCOJ is the concentration step in FCOJ. FCOJ
takes orange juice through a series of concentration steps taking the juice from approximately
17

11.0 °Brix to 65 °Brix. There are advantages of FCOJ over NFC. The FCOJ process will strip
off-flavors and excess oil in the evaporator. The evaporator cannot be used for NFC production;
therefore a “softer” extraction is used to prevent excess oil addition. The softer squeeze might
result in lower juice yields as compared to FCOJ. One way to remove excess peel oil is to
employ centrifuges, thereby allowing maximum yield. Grade A orange juice has a maximum
limit of 0.035% by volume of recoverable oil (USDA, 1983). By being below this level,
essential oil flavor systems can be added.
Not-from concentrate orange juice undergoes a pasteurization step to reduce
microorganisms and to inactivate enzymes. The main enzyme in orange juice is pectinesterase,
PE. PE activity is a major concern in the citrus industry. PE is naturally present in the peel, rag
and pulp and is released during extraction and finishing. PE leads to cloud loss in single-strength
juice and gelation in concentrate. The thermal process needed to inactivate PE is higher than that
needed for microbial purposes.
A recent trend in the United States has seen the consumption of NFC increase from 183.1
million SSE gallons in 1990 to 629.9 million SSE gallons in 2000. This has in turn increased the
amount of Florida’s orange crop going to NFC to approximately 50% in the 1998-1999 season
(Spreen and Muraro, 2000).
Flavor Production
Off-flavor production in orange juice can be caused by many different pathways.
Sources can include enzymatic off-flavors, microbial off-flavors, packaging, processing, and
storage off-flavors. Storage off-flavors will be discussed in detail, examining the following
possible pathways: precursor development, Shickimic acid pathway, Maillard reaction and
Strecker degradation. Flavor precursors are flavorless compounds that produce flavor
compounds in consequence of enzymatic or chemical reactions that occur during maturation
18

(usually enzymatic driven) or processing (usually chemically driven). Process flavors can
positive or negative depending on the food matrix and desired goal, such as in the formation of
garlic odor from flavorless precursor allin to the garlic odor alliein. In grapefruit juice one
reaction includes the formation of a characteristic grapefruit aroma of 1-p-menthene-8-thiol from
limonene by the acid catalyzed addition of hydrogen sulfide across the external double bond.
Lin et al. (2002) found 1-p-menthene-8-thiol present in concentrated grapefruit juice but not
fresh juice and suggesting that this character impact compound might be a reaction product of
thermally treated juice. The (R)-(+)-enantiomer of the 1-p-menthene-8-thiol is one of the most
potent naturally occurring volatiles with a detection threshold of 0.02 µg/L (Leffingwell, 2002).
Another citrus flavor precursor example is the breakdown of carotenoids, large C40,
tetraterpenoid compounds such as β-carotene into the smaller (C13) β-ionone (dried, fruit woody
aroma). Kanasawud and Crouzet studied the thermal degradation of β-carotene in an aqueous
medium and identified β-ionone as a volatile degradation product, showing an increase in
concentration of β-ionone with an increase in temperature (Kanasawud and Crouzet, 1990).
Terpene glycosides
Another important type of fruit flavor precursors includes terpene glycosides. In this
process, volatile terpene and norisoprenoid compounds are cleaved from nonvolatile terpene
glycosides via enzymatic or acidic hydrolysis. Terpene glycoside reactions have been studied in
many fruits including the peach, yellow plum and apricot (Krammer et al., 1991) and grapes
(Maicas and Mateo, 2005). Phosphate ester reactions are an in vivo source of terpenoid
compounds. One example is the formation of geranyl pyrophosphate (PP), neryl-PP and
dimethyl-allyl-PP from enzymatic breakdown of mevalonic acid-PP (Lindsay, 1985).
19

Terpene alcohols can also be formed through acid catalyzed hydrations. A reported off-flavor
compound in orange juice is α-terpineol (Rymal et al., 1968; Tatum et al., 1975). α-Terpineol
has a floral, lilac-like aroma, but when added to orange juice a stale, musty or piney aroma has
been reported (Tatum et al., 1975). Haleva-Toledo et al. (1999) demonstrate the pathways of the
precursors, linalool and (+)-limonene, present in citrus juice, that can undergo acid catalyzed
hydration to form α-terpineol (Figure 2-1). The conversion of linalool to α-terpineol is much
faster than the reaction with (+)-limonene. However, it was noted that with the high
concentration of (+)-limonene in citrus juice, α-terpineol production is due to both linalool and
(+)-limonene equally. Perez-Lopez et al. (2006), show production of α-terpineol increases after
pasteurization of mandarin juice with a simultaneous decomposition of linalool and (+)-
limonene. Measurement of linalool, (+)-limonene, α-terpineol and terpinen-4-ol were suggested
as a tool to monitor the quality of the mandarin juice.
Shikimic acid pathway
The shikimic acid pathway starts a series of reactions that can lead to several different
classes of flavor compounds. Shikimic acid can produce other precursors such as cinnamic acid
and ferulic acid which can lead to potent aroma compounds such as eugenol, 4-vinylguaiacol and
vanillin (Lindsay, 1985). 4-Vinylguaiacol is described as possessing a peppery/spicy aroma and
is considered a major off-flavor. In orange juice it imparts an old/rotten fruit aroma (Tatum et
al., 1975; Peleg et al., 1992; Naim et al., 1988). Vanillin has also been noted in orange,
tangerine, lemon, lime and grapefruit juices (Goodner et al., 2000). The shikimic acid pathway
also plays an important role in flavor production of wines. Lopez et al. (2004), studied the aroma
compounds from mild acid hydrolysates in Spanish wine grapes. The author found the shikimic
20

acid pathway produced important flavor components in the flavor of red wine such as phenolic
compounds guaiacol, 4-vinylphenol and isoeugenol as well as vanillin.
Maillard reaction
The Maillard reaction, also known as non-enzymatic browning, is a very significant
source of flavors in cooked foods. Depending on the food, Maillard reaction flavors can be
deemed positive or negative. Maillard reaction flavors in food systems such as meat (Mottram
and Leseigneur, 1990), coffee (Montavon et al., 2003), cocoa (Countet et al., 2002) and bread
(Kimpe and Keppens, 1996) are highly important and beneficial. On the other hand, the Maillard
reaction is responsible for off-flavors in food systems like fruit juices and also produce pigments
which darkened juice color (Tatum et al., 1975; Haleva-Toledo et al., 1997).
The Maillard reaction takes place between free amino groups from amino acids and
reducing sugars. Reaction products are dependent on not only the starting reducing sugars and
amino acids but are also dependent on time, temperature, water activity and pH of the system.
As with most chemical reactions, the Maillard reaction rate increases with increasing
temperature. Color formation is much greater in the Maillard reaction when the pH is above 7.
However, at lower pH compounds such as furfural and some sulfur compounds are preferentially
formed (Mottram, 1994; Mottram and Whitfield, 1994; Mottram and Leseigneur, 1990).
Compounds created from the Maillard reaction are classified into three groups: 1) Sugar
dehydration/fragmentation products including furans, pyrones, cyclopentenes, carbonyl
compounds and acids 2) Amino acid degradation products including aldehydes, sufur compounds
(e.g. hydrogen sulfide and methanethiol) and nitrogen compounds (e.g. ammonia and amines) 3)
Volatiles produced by further interactions: pyrroles, pyridines, pyrazines, imidazoles, oxoles,
thiazoles, thiophenes, di- and trithiolanes, di- and trithianes, furanthiols and compounds from
aldol condensations (Mottram, 1994).
21

As previously mentioned, Maillard reaction products can be considered negative in fruit
juices. One of the main off-flavor compounds in orange juice is 2,5-dimethyl-4-hydroxy-3(2H)-
furanone sometimes called Furaneol or DMHF, which has been well documented to increase
with increasing storage time and temperature in orange juice (Tatum et al., 1975). Haleva-
Toledo et al. (1997) determined the production of Furaneol in orange juice is via the Maillard
reaction between rhamnose and arginine in the presence of the acidic matrices of ascorbic acid in
orange juice.
Strecker degradation
A closely related reaction to the Maillard reaction is Strecker degradation. In Strecker
degradation, the reaction is the oxidative deamination and decarboxylation of α-amino acids with
a dicarbonyl compound (Mottram, 1994). One main difference between Strecker degradation
and the Maillard reaction is the lack of browning products produced in Strecker degradation.
Strecker degradations produce amino acid aldehydes with one less carbon including pyrazines,
oxazoles and thiazoles as well as producing α-amino carbonyls. Strecker degradation produces
the potent methional with a potato-like aroma from the odorless amino acid, methionine.
Methional has been noted in diverse matrices including coffee (Czerny and Grosch, 2000),
cooked mussels (Le Guen et al., 2000), cheese (Milo and Reineccius, 1997), aged beer (da Costa
et al., 2004) and cashew apple nectar (Valim et al., 2003). Methional is an off-flavor in citrus
juice as has been found in grapefruit juice (Buettner and Schieberle, 1999; Lin et al., 2002) and
orange juice (Buettner and Schieberle, 2001a; Bezman et al., 2001).
Microbial
Another possible source of off-flavor compounds in orange juice is from microbial
contamination. Alicyclobacillus strains were studied as a source of medicinal off notes in orange
22

juice (Gocmen et al., 2005). Three medicinal aromas were identified and attributed to guaiacol,
2,6-dibromophenol and 2,6-dichlorophenol in orange juice inoculated and incubated with
different Alicyclobacillus strains.
Packaging
An important variable in maintaining the initial orange juice flavor is packaging. A
variety of packages are available, including cans, glass, corrugate, plastics and laminates. An
ideal package would contain the juice and provide an inert system allowing no interaction
between the package, the juice and the outside environment. Glass containers are considered as
close to a totally inert package as possible; however the weight of glass containers is a
disadvantage in terms of transportation costs.
Packaging materials must be evaluated on the basis of cost, weight and ability to protect
the product. Scalping of flavors into the packaging and migration of flavors from the package
into the product are two variables that must be considered. Tetra Brik (Duerr et al., 1981; Marin
et al., 1992) as well as low density polyethylene (LDPE) (Kutty et al., 1994) have been shown to
readily scalp (+)-limonene in orange juice.
Van Lune et al., examined the adsorption of organic compounds in polyethylene
terephthalate (PET) and polyethylene naphthalate (PEN) material (Lune et al., 1997). The
premise of the study examined the importance of absorption of chemicals into plastic bottles and
how the chemicals would effect recycling and reuse by the consumer. If a consumer reuses a
plastic container, absorbed compounds may be present before refilling, causing the possibility of
migration into the product. The migration can add non-typical volatiles to the product thus
producing off-flavors. Absorption of methanol and toluene was reported to increase with an
increase in temperature and is also affected by the composition of the plastic container.
23

Fauconnier et al. (2001) studied migration from high density polyethylene (HDPE) into
various liquids including hexane, ethanol, lemon terpenes and their emulsions. A phenolic
compound was shown to migrate from the HDPE into each test liquid and was most likely
attributed to an antioxidant additive. The organoleptic effect of the migration, however, was not
examined.
Orange juice aroma compounds were compared over time by Berlinet et al. (2005) using
glass and various PET containers. Of note, the study determined no statistical difference in
aroma composition between the packaging types. Aroma composition was determined to be
affected by storage over time by reactions within the juice matrix. The researchers suggest the
inherent acidic matrix of the orange juice produced acid-catalyzed reactions which lead to a loss
of aldehydes, ketones, esters, aliphatic alcohols and terpene alcohols; while increasing levels of
4-vinylguaiacol and furfural.
Van Willige et al. (2003) compared the absorption of orange juice flavor compounds in
LDPE, polycarbonate (PC) and PET containers. Polyethylene terephthalate and PC containers
showed only small decreases in limonene, myrcene and decanal through absorption; while LDPE
had a more significant loss of limonene and a smaller decrease in myrcene, valencene, pinene
and decanal. Organoleptic evaluation through duplicate triangle testing did not show a
significant difference between packages at up to 29 days of dark storage at 20°C.
Glass, monolayer PET and multilayer PET package effects on orange juice quality and
shelf life was recently studied by Ros-Chumillas et al. (2007). Ascorbic acid, vitamin C, was
evaluated as a measure of shelf life with a minimum amount of 200µg/mL. The monolayer PET
had a significantly lower shelf life at 4°C, with ascorbic acid dropping below 200µg/mL at 180
days where the multilayer PET and glass were approximately 300µg/mL levels at 300 days.
24

They concluded that the shelf life of the monolayer PET orange juice can be extended through
use of oxygen scavengers, nitrogen headspace and aluminum foil seals in the closure.
Gas Chromatography-Olfactometry
The use of gas chromatography-olfactometry (GC-O) is a technique where the gas
chromatograph separates aroma mixtures into individual components and the human nose is used
as a detector. Modern GC-O instruments use both human and instrumental detectors by splitting
the GC effluent between the sniffing port and an instrumental detector such as flame ionization
detection (FID), mass spectrometer (MS), or pulsed flame photometric detection (PFPD). GC-O
is used to determine which of the volatile compounds in a food matrix have aroma activity and
thus contribute towards the overall aroma of the sample.
The primary advantage for using a human assessor as a detector is the sensitivity and
selectivity of the human nose. The human nose can detect some volatiles at extremely low
concentrations such as bis(2-methyl-3-furyl) disulfide at a threshold level of 8.9 x 10⁻¹¹ nM
(Buttery et al., 1984). This is significant as the nose is often more sensitive to some aroma-
active compounds than the best instrumental detector. The concept of aroma value has been
developed to determine if a volatile has aroma activity when direct aroma measurement is not
possible or to determine relative aroma strength. Aroma value (sometimes called odor activity
value, OAV) is defined by the ratio of the concentration of an aroma active compound divided
by its detection threshold. Aroma values assigned to a compound in a given matrix will
therefore determine if and by how much the concentration exceeds it threshold value (Mistry et
al., 1997).
How the threshold for a given aroma active compound is calculated can cause a large
variance in the reported threshold. The interaction between a compound and its matrices has an
effect on the threshold. For example, an aroma active compound will have a different threshold
25

if measured in air, water or oil. Generally, a volatile’s threshold will be higher in a food matrix
compared to water because the matrix interacts with the volatile to a greater degree than water.
Plotto et al., (2004) determined the aroma and flavor thresholds for key components in orange
juice using orange pump out (concentrated orange juice whose volatiles have not been restored).
They have reported odor thresholds up to 200 times higher in an orange juice matrix as compared
to published thresholds in water.
GC-O has been used to characterize the odorants in a variety of matrices from coffee
(Holscher and Steinhart, 1995; Akiyama et al., 2002) to wine (Chisholm et al., 1995; Cullere et
al., 2004) to orange juice (Marin et al., 1992; Rouseff et al., 2001a; Schieberle and Buettner,
2001) to orange essence oil (Hognadottir and Rouseff, 2003). Determining which compounds in
a matrix have aroma activity can impact current industrial practices. For example, traditionally
the sesquiterpene valencene is used as an indicator of quality in orange peel oils. However,
Valencene has been recently shown to not have aroma activity at concentrations typically found
in orange oil (Elston et al., 2005).
Early GC-O devices had two main limitations: nasal discomfort caused by hot dry carrier
gas and the lack of sensitivity of the chemical detector as compared to the human nose (Acree
and Barnard, 1994). Dravnieks (1971) enhanced the GC-O technique by using humidified air in
combination with the effluent. Another limitation of GC-O is evaluating individual components
outside of the original matrix (Mistry et al., 1997). GC-O does not take in effect the contribution
of the solubility of the aroma active compounds within the matrix or the interaction of the aroma
active compounds with nonvolatile components within the matrix.
GC-O methods can be categorized into three groups: dilution analysis techniques
including combined hedonic and response measurements (Charm) and aroma extract dilution
26

analysis (AEDA), time-intensity techniques such as OSME, and frequency of detection
techniques including global analysis. Each technique has advantages and disadvantages that will
be discussed.
Dilution techniques operate by sniffing the effluent of an extract in a series of dilutions,
usually in a series of 1:2 or 1:3 dilutions (Acree and Barnard, 1994). Charm analysis (Acree et
al., 1984) constructs a combined response from several experiments where the concentration of
the aroma active compound is directly proportional to the sniffed peak area. Thus a compound
that is detected after more dilutions is considered to be more potent than those compounds which
can be no longer detected after a few dilutions. The relationship between intensity response and
concentration is spelled out in Stevens’ Law: I = k(C-T)n, where I is intensity, k and n are
constants based on the type of compound, C is concentration, and T is threshold (Stevens, 1960).
For aroma, Stevens applies different values to the exponent from 0.55 for coffee odor to 0.6 for
heptane (Stevens, 1961). Charm has been used to study anosmia. Charm values are reportedly
proportional to the amount of stimulus while inversely proportional to the individual subject’s
threshold limit (Marin et al., 1988). AEDA is a dilution technique similar to Charm, where the
flavor dilution, FD, values are comparable to Charm values. However, the main difference being
that AEDA only determines dilution intensity used when calculating FD factor whereas Charm
also takes a compound’s elution duration into effect (Mistry et al., 1997). Another advantage of
AEDA is that it does not require specialized software as in the case of Charm. The main
disadvantage to both dilution techniques is the number of chromatographic runs needed to find
the largest dilution for all compounds in the sample.
Time-intensity techniques are similar to Charm as a compound’s intensity and elution
duration are determined without dilution. The original time-intensity technique is called Osme,
27

developed by da Silva et al. (1994). In Osme the assessor continuously rates the intensity of
aromas using a sliding scale from 0 being no detection to 7 being moderate to 15 being extreme.
The assessor is simultaneously rating the intensity and characterizing the aroma. Panelists need
to be trained to use the equipment as well as develop a common sensory language for
descriptors. Aroma active peaks have to be detected at least 50% of the time by panelists in
order to be considered aroma active. A combined panelist Osmegram is then constructed. An
advantage of Osme over Charm or AEDA is that no dilutions are made and therefore the number
of chromatographic runs is reduced. The main disadvantage of Osme is the aforementioned
training for panelists.
Frequency of detection methods are similar to time-intensity techniques however the
number of panelists is increased while the training per panelist is decreased or in many cases,
eliminated. One main difference between frequency of detection methods and other GC-O
methods is the aroma peak intensity is based on the frequency of detection and not related to the
perceived intensity of the compound. One main disadvantage of this method is the number of
panelists needed, ideally 8 -10 (Pollien et al., 1997). Frequency of detection has been used to
characterize odorants in cooked mussels (Le Guen et al., 2000), red wine vinegar (Charles et al.,
2000), Iberian ham (Carrapiso et al., 2002), French fries (van Loon et al., 2005), leeks (Nielsen
and Poll, 2004), and fresh and smoked salmon (Varlet et al., 2006).
Frequency of detection has also been used in comparing odorants in orange juice of
different cultivars, including blond and blood types (Arena et al., 2006). The study found
difference between blood types (Moro and Tarocco) and blond types (Washington navel and
Valencia late). One of the most intense aroma active compounds found in the blood types,
28

methyl butanoate, was not found in the blond cultivars. Conversely, linalool, was only reported
in blond cultivars
Extraction Methods
Most sample matrices are not able to be directly injected onto a gas chromatograph. The
object then lies to extract the volatile components from the sample and be able to represent the
original matrix. The two main types of extractions are solvent extraction such as liquid-liquid
and direct headspace adsorption of the volatiles onto a solid phase such as Solid Phase Micro
Extraction (SPME).
The solvent used for extraction is dependent on the nature of the food matrix. Organic
solvents are usually used in a matrix that is lipid free and includes matrices such as fruit, berries,
and alcoholic beverages. A separate preparatory procedure is needed to separate lipids from an
organic solvent extraction. When extracting lipids, there is no one standard procedure and the
method and solvent is again dependent on the food matrix (Marinetti, 1962). Often a
combination of different solvents will give the best results. One such matrix that often uses a
combination of solvents is citrus juices, where a common extraction method is with a mixture of
pentane and diethyl ether (Tonder et al., 1998; Lin et al., 2002; Bazemore et al., 2003).
Liquid-liquid extractions can give different results compared to SPME. SPME fibers
have been shown to selectively absorb volatile compounds through competition (Roberts et al.,
2000). For example, Ebeler found in brandy the polydimethylsiloxane SPME extraction was
more selective for esters and acids than liquid-liquid extractions (Ebeler et al., 2000). In citrus,
SPME is more selective for terpenoid compounds as compared to liquid-liquid extractions
(Rouseff et al., 2001a). A SPME fiber (carboxin-polydimethylsiloxane) headspace analysis of
heated orange juice resulted in 86% of the total FID peak area from 3 terpene compounds
(limonene, myrcene, and α-pinene) as compared to 24% in a liquid-liquid extraction of pentane-
29
ether. Rega, et al. (2003) worked to optimize a SPME method for use in orange juice, examining
fiber coatings, exposure time and sample equilibration time. However, the optimized SPME
conditions were skewed to minimize extraction of unpleasant odors and are therefore not fully
representative of the juice.
A recent study (Jordan et al., 2005) compared polydimethylsiloxane (PDMS) and
polyacrylate (PA) SPME fibers in orange juice at different stages in processing (fresh juice,
deaeration and pasteurization. The deaerated process, as compared to fresh juice showed the
greatest processing difference. Both fibers had similar results for alcohols and terpenes.
However, a statistically significant change in aldehydes and esters was noted only with the PA
fiber. The researchers concluded that the PA fiber is more suitable for use in studying
processing affects on orange juice.
Thiamin as a Source of Potent Sulfur Aroma Compounds
Thiamin (vitamin B1) is the second most abundant water-soluble vitamin in orange juice,
and is a more concentrated source than many foods that are better known sources of vitamin B1,
such as whole wheat bread (Nagy and Attaway, 1980; Ting and Rouseff, 1981). Thiamin is
readily degraded by thermal treatment, producing potent sulfur compounds with meaty and
roasted notes. This reaction is important in many food systems, producing flavor impact
compounds typical in meat and breads.
2-methyl-3-furanthiol
2-Methyl-3-furanthiol, MFT, is a significant thermal degradation product of thiamin. This
potent sulfur compound gives an intense savory, meaty aroma. This compound is well known in
meat flavor systems (Mottram, 1991; Grosch and Zeiler-Hilgart, 1992; Kerscher and Grosch,
1998) and has a low aroma threshold of 6.14 x 10⁻⁸ mM/L water (Munch and Schieberle, 1998).
MFT has been found in a number of different flavor systems, including coffee (Hofmann and
30

Schieberle, 2002; Tressl and Silwar, 1981), cooked brown rice (Jezussek et al., 2002), beer
(Lermusieau et al., 2001), reconstituted grapefruit juice (Lin et al., 2002) and as an off-flavor in
orange juice (Bezman et al., 2001).
Bis(2-methyl-3-furyl) disulfide
Thiols are known to readily oxidize into their corresponding disulfide. Hofmann et al.,
1996 (1996) studied the oxidative stability of odor active thiols. Results show that after 10 days
of storage at 6°C, 53% of a dilute ethereal MFT solution was oxidized to its dimer, bis(2-methyl-
3-furyl) disulfide, MFT-MFT. Bis(2-methyl-3-furyl) disulfide has also been reported in meat
flavor systems (Evers et al., 1976; Farmer and Mottram, 1990). Bis(2-methyl-3-furyl) disulfide,
portraying a savory, meaty aroma is responsible for the most potent food aroma to date, having
an odor threshold of 8.9 x 10⁻¹¹ mM water (Buttery et al., 1984). The same study also
determined MFT-MFT to be responsible for the characteristic odor of vitamin B1.
Thiamin degradation pathway
The thermal degradation pathway, determined by van der Linde and coworkers (1979),
involves the rupturing of the C-N bond between the pyrmidine and thiazoles moieties of thiamin
by a hydroxyl ion attack (Figure 2-2). The thiazole moiety (III) then degrades to form other
potent aroma-active thiazoles such as 4,5-dimethylthiazole (roasted meat) and 4-methylthiazole
(green hazelnut).
However, from an aroma perspective, the hydrolysis of the thiazole ring in the thiamin
hydrochloride (Figure 2-2) leads to a key aroma intermediate, 5-hydroxy-3-mercapto-2-
pentanone (VI). This intermediate produces many aroma active thiophenes and furans, including
MFT (van der Linde et al., 1979; Guntert et al., 1990; Guntert et al., 1992).
31

Alternate pathways for the production of 2-methyl-3-furanthiol
Another pathway for the production of MFT is through the Maillard reaction. Meynier et
al. (1995) observed the formation of MFT in a cysteine/ribose model system where the MFT
formation was greatly increased at a lower pH of 4.5 with almost a 2.5 fold increase from pH 5.0
and a 10 fold increase from pH 6.0.
Whitfield et al. (1999), studied the reaction between 4-hydroxy-5-methyl-3(2H)-furanone
(norfuraneol) and cysteine or hydrogen sulfide. MFT was found in both the norfuraneol/cysteine
and norfuraneol/hydrogen sulfide systems at similar concentrations. The author suggests that
this points to only hydrogen sulfide being necessary and not needing other cysteine degradation
compounds. Cerny et al. (2003), further investigated the possible source MFT from norfuraneol
a model system of cysteine, ribose and norfuraneol. A 13C5-labeled ribose and norfuraneol were
reacted with cysteine. The resulting MFT contained some of the 13C-label 93% of the time,
suggesting that the more probable source being the cysteine/ribose reaction.
A study by Bolton et al. (1994) combined thiamin and cysteine in model systems. Four
model systems were examined for MFT formation using combinations of thiamin, cysteine,
labeled cysteine and D-xylose at a pH range of 5.5 to 5.8. Of interest, the only model system
that MFT was not detected in was the only system without thiamin addition, suggesting the
primary mechanism for the formation of MFT, under the conditions of the model system,
involves thiamin degradation. In the two model systems using labeled cysteine, only a net 8% of
the MFT contained the labeled sulfur, 34S, from cysteine as compared to the unlabeled cysteine
model solution.
Of note, much of the thiamin degradation studies have been carried out at elevated
temperatures on meat systems rather than exploring thiamin degradation in other matrices such
as orange juice that would not receive the elevated temperatures as compared to the cooking of
32

meat. Ramaswamy et al. (1990) determined the kinetics of thiamin degradation in an aqueous
solution at temperatures ranging from 110°C to 150°C to be first order reactions. Van der Linde
et al. (1979) determined that MFT is a product of 5-hydroxy-3-mercapto-2-pentanone from a
breakdown of thiamin at 130°C in an aqueous system.
Hartman and co-workers (1984b) studied the effect of water activity, aw, in a model meat
system containing thiamin, with heat treatment at 135°C for 30 minutes. Results show a higher
aw produced more boiled meat-like aroma such as MFT while the lower aw system produced
more roasted meat-like aromas including 2-methylthiophene with a roast beef aroma.
Meynier and Mottroam (1995) studied pH effect in model meat systems with thermal
reactions at 140°C. The study determined a cysteine model system at a lower pH of 4.5
produced the highest amount of MFT.
One study does look at MFT at a lower temperature of 6°C (Hofmann et al., 1996), with
the purpose of determining the oxidative stability of odor-active thiols including MFT. MFT
was shown to have the highest concentration over the 10 day storage in n-pentane and
dichloromethane where the concentration readily decreased in a diethyl ether system.
Conversely, MFT-MFT showed the highest formation rate in diethyl ether, with very little being
formed in a dichloromethane or n-pentane system.
33

34
OH
OH
d-Limonene
α-Terpineol
+HOH -H+
H+, -HOH
Linalool
+
+
H+, HOH
Figure 2-1. Pathways for α-terpineol formation from linalool and (+)-limonene (Haleva-Toledo et al., 1999).
N
N
N+
SOH
NH2
N
NNH2
OH N
SOH
OH-H3O+
N
N
NH
SOH
NH2
CHO
O
SH
OH
H3O+
HCOOH
N
N
NH2
NH2
Cl-
+
(A)
(B) (C)
(D)
++
(E) (F)
Figure 2-2. Thiamin thermal degradation pathways. A =thiamin hydrochloride, B = pyrimidine
moiety, C = thiazoles moiety, D = diaminopyrimidine, E = formic acid, and F = 5-hydroxy-3-mercapto-2-pentanone. Adapted from (van der Linde et al., 1979; Guntert et al., 1990; Mottram, 1991).
CHAPTER 3 AN AROMA COMPARISON BETWEEN ORANGE JUICES OF DIFFERING
ORGANOLEPTIC QUALITIES
Introduction
Orange juice is ranked number one in fruit juice consumption in America (Pollack et al.,
2003). One of the major attributes consumers are looking for is flavor. Considerable research
has been spent examining the volatile components that are responsible for the desired aroma and
flavor in orange juice. Much of this research has involved the use of thermally abusive storage
studies to determine changes in volatile content and formation of off-flavor compounds. The
assumption being that elevated thermal temperatures will produce a larger quantity of storage
off-flavors in a shorter period of time. Thermal abuse studies will also produce storage off-
flavors in higher concentrations making volatile identification easier. Tatum et al. (1975) stored
single-strength canned orange juice at 35°C for up to 12 weeks and identified ten degradation
compounds. Of the degradation compounds, three exhibited negative aroma impact in the
orange juice: α-terpineol, 2,5-dimethyl-3(2H)-furanone (Furaneol or DMHF) and 4-
vinylguaiacol. These three compounds were determined to be above their taste thresholds; and
when added to a control orange juice imparted a characteristic aroma of heat-abused juice.
Moshonas and Shaw (1989) noticed an increase of α-terpineol during storage. Tonder et
al. (1998) studied stored reconstituted orange juice for up to 12 months at 20°C. Earlier studies,
(Walsh et al., 1997; Peleg et al., 1992; Naim et al., 1997) show minimal formation of both 4-
vinyl guaiacol and Furaneol at temperatures under 30°C.
Chemical reaction rates are known to increase with a rise in temperature. This is
explained through the Arrhenius equation and the relationship between temperature and the rate
at which a reaction takes place. The relationship is explained in the following equation:
35

k = Ae-Ea/RT
where k is the rate constant, A is the frequency factor (specific to a particular reaction), e is the
math quantity or exponent, Ea is the activation energy or minimum energy required for the
reaction, R is the gas constant and T is temperature in °K. Through this equation, either a
temperature increase or a decrease in Ea results in an increase in reaction rate. In orange juice,
an increased reaction rate would derive from temperature as a decrease in Ea being would need a
catalyst which would not normally be present in juice. A general rule of thumb for reactions
around ambient temperature states that for every 10°C increase in temperature a reaction rate
doubles. However, in a complex matrix such as orange juice, the reaction rates of competing
reactions can differ considerably. The dominant reaction at a temperature of 40 to 50°C may not
be the dominant reaction at a lower temperature range of 4 to 20°C. The dominant reactions that
produce specific off-flavors at higher storage temperatures may not be the same reactions that
produce off-flavors that develop at lower storage temperatures. Therefore, the reactions that
produce flavor changes under typical industrial storage conditions may not be the same as those
which occur under an accelerated storage study. The purpose of my study was to evaluate flavor
differences in products obtained from supermarkets without subjecting the samples to additional
thermal abuse and determine which aroma active compounds differentiate between poor quality
and good quality flavor.
Materials and Methods
Survey of commercial orange juice
Juices for this survey were collected from local supermarkets and consisted of orange
juice reconstituted from concentrate produced in Florida. All juices were within the product
expiration dates and contained the Florida Seal of Approval on the container. The juices were
formed a market basket survey of orange juice, categorizing each juice into one of three
36

categories: above average, average, and below average flavor quality based on an informal
organoleptic panel. One above average juice and one below average juice were chosen to
compare the extremes between the categories. The above average quality RECON juice was
purchased refrigerated in a gable-top carton; while the below average flavor quality juice was a
canned RECON juice packaged purchased at ambient temperature. Both juices were chilled for
sensory evaluation.
Chemicals
The following chemicals were obtained commercially from Aldrich (Milwaukee, WI): 1-
octen-3-one, 4-hydroxy-2,5-dimethyl-3(2H)-furanone, vanillin, (E,E)-2,4-decadienal, (E)-2-
undecenal, (E)-2-nonenal, methional, (Z)-4-decenal, 4-Vinyl-guaicol, hexanal, octanal, nonanal,
decanal, linalool. The following chemicals were obtained as gifts from SunPure (Lakeland, FL):
myrcene, limonene, 1,8-cineole, geraniol, geranial and β-sinensal. 3a,4,5,7a-tetrahydro-3,6-
dimethyl-2(3H)-benzofuranone (wine lactone), was a gift from Professor Dr. G. Helchmen at the
University of Heidelberg, Heidelberg, Germany. β-Damascenone was obtained from Givaudan.
(Z)-2-nonenal was found as an impurity in (E)-2-nonenal at approximately 5-10%, while (E,Z)-
2,4-decadienal and trans-4,5-epoxy-E-2-decenal was found in an oxidized sample of (E,E)-2,4-
decadienal.
Sample Preparation
Extraction of volatiles was done in a similar method to Parliment (1986) as modified by
Klim and Nagy (1992) and Jella and coworkers (1998). Liquid-liquid extracts were obtained
using 1:1 pentane: diethyl ether. 10 mL of 1:1 pentane: diethyl ether was added to 10 mL of
single strength orange juice from concentrate and vigorously mixed by forcing between syringes
connected with a three-way valve. After mixing, samples were centrifuged at 3000 g for 10
37

minutes. The sample was re-extracted with an additional 10 mL of 1:1 pentane: diethyl ether and
re-centrifuged. Solvent layers were combined, and then dried over anhydrous sodium sulfate.
25 μL of 4000 µg/mL 2-heptadacanone in 1:1 pentane: diethyl ether was added as an internal
standard. Samples were concentrated to 100 μL under a gentle stream of dry N2 and stored in a
septum-sealed vial in a freezer at −15°C until later analysis.
Gas chromatography-olfactometry conditions
A HP-5890A GC (Agilent Technologies, Palo Alto, CA) with a standard FED detector
was used to separate the orange juice volatiles with the following fused silica capillary columns:
DB-Wax (30 m × 0.32 mm id, film thickness 0.5 μm) and DB-1 (30m 0.32 mm id, film thickness
0.5 μm). Column oven temperature was programmed from 40 to 240°C at a linear rate of
7°C/min with no hold. Column injection volume was 0.5 μL and splitless. Injector and detector
temperatures were 225°C and 275°C, respectively. A Gerstel (Baltimore, MD) column splitter
was used to split the effluent with a ratio of 2:1 between the olfactometry and FID detectors
respectively. The olfactometer used in this study is similar to that described by Acree (Acree et
al., 1984). The hot effluent from the capillary column was combined with a large stream of
humidified air in a 1 cm diameter stainless tube. The air was purified by passing through
activated charcoal, Drierite, and molecular sieve 5A (Alltech, Deerfield, IL). The purified air
was then humidified by bubbling through a temperature controlled, water filled round-bottomed
flask. Airflow to the stainless tube was adjusted to 11L/min. Panelists sniffed the effluent as it
passed through the stainless steel tubing and rated the intensity of the volatiles on a 10 cm linear
potentiostat (0-1.0 V output). A panelist rated the intensity on a 0 – 15 scale with “0” being no
aroma detected, “7” a moderate intense aroma and “15” a highly intense aroma. Data was then
collected and recorded using Chrom Perfect Software.
38

Time-intensity analysis
The olfactometry panel consisted of two to four trained panelists, 1 male and 3 females
between the ages of 21-40. Panelists were trained in a manner similar to Rouseff and co-workers
(2001b), with a standard solution of 11 compounds typically found in citrus juice (ethyl
butanoate, cis-3-hexenol, trans-2-hexenal, α−pinene, myrcene, linalool, citronellol, carvone,
terpin-4-ol, geranial, and neral). The standard mixture helped train panelists in a time-intensity
scale, optimum positioning, and breathing techniques. Panelists also were trained by evaluating
at least 10 commercial orange juice flavor extracts in order to gain experience and consistency.
Panelists were not used for this study until they demonstrated the ability to replicate aroma
intensity responses in the practice juice extracts. Panelists ran each experimental sample in
duplicate and summary reports were generated for each aromagram. Only peaks detected at least
50% of the time were included in this study. Results from each panelist’s aromagram were
normalized with their own maximum peak intensity (set to 100) before being averaged.
Sulfur analysis
Methional concentrations were determined using a Sievers chemiluminescence detector
(Boulder, CO) attached to a HP-5890 Series II gas chromatograph (Agilent Technologies, Palo
Alto, CA). A Gerstel (Baltimore, MD) CIS-3 temperature programmable injector was employed
to minimize thermal artifacts that could be generated in the injector port. Injector temperature
was 40°C increasing at 20°C/sec to 150°C after injection. The same column and temperature
program described chromatographic conditions were used.
Results and Discussion
Table 3-1 summarizes the normalized panel responses for the aroma impact compounds
found in the two commercial from concentrate orange juices. Of note, a one word descriptor
consensus for a compounds aroma is not always reached. For example, the panelists describe
39

hexanal as green and bitter in Table 3-1. This shows the challenge in determining if a descriptor
by one panelist is the same compound described differently by another panelist. Use of standard
chemicals is necessary to create a common lexicon and understand how aroma compounds can
be perceived and described differently by panelists.
A total of 42 aroma impact components were detected between the two juices. The good
quality juice had a total of 37 aroma impact components while the poor quality juice had 26. Of
these components, 21 were found in both juices and 20 components were detected in the good
quality juice but not the poor quality juice. It should be noted that several of the components that
were not detected in the poor quality juice were detected by an individual panelist, but failed to
meet the 50% response criteria. This suggests that these components may be present in the poor
quality juice, but at a concentration that is just below the panel’s aroma threshold. Eight aroma
active components were detected in the poor quality juice but not the good quality juice. The
aroma active compounds with the greatest impact, by aroma peak area, in the poor quality orange
juice were vanillin, Furaneol, and 4-vinylguaiacol and (Z)-2-nonenal.
As shown in Figure 3-1, a significant different, p<0.05, exists between the aroma
intensities of the above average and below average juice, with higher normalized aroma intensity
in the above average quality juice. Differences between the juices might be attributed to the
procedures used in the process of reconstituting the juices from concentrate. During the
concentration process, water is evaporated from the juice, as well as most of the volatile
fractions. These volatiles must then be restored to the concentrate juice before packaging for the
consumer. The restoration of the juice volatiles can be an expensive process and some juice
manufactures may use a less expensive flavor package that may not restore the concentrate to its
original full flavor.
40

The difference may also be attributed to the quality of the oranges used in production and
the processing itself. The quality of the orange directly affects the quality outcome of the juice
the consumer purchases; and detrimental processes including possible excess thermal treatment
can cause off-flavor production that will still remain in the juice even with the use of a high
quality add-back flavor package.
From Figure 3-2, it is noticed the above average quality juice has a three fold increase in
aldehydes aroma activity as compared to the poor quality juice. Of the 17 aldehydes found
between the two juices, the below average quality juice contained 7 (hexanal, heptanal, octanal,
(Z)-2-nonenal, (Z)-4-decenal, geranial and trans-4,5-epoxy-E-2-decenal) with a diminished
aroma response as compared to the above average quality juice. Eight aldehydes (nonanal, (E)-
2-octenal, (E,E)-2,4-heptadienal, decanal, undecenal, (E,Z)-2,4-decadienal, (E,E)-2,4-decadienal
and β-sinensal) were only detected in the good quality juice. Two aldehydes were noted only in
the below average quality juice, methional (potent off-flavor) and (E)-2-undecenal.
Buettner and Schieberle (2001a) noted differences in aroma active compounds when
comparing freshly squeezed to reconstituted orange juice, with the main differences being
attributed to higher Flavor Dilution (FD) factors of acetaldehyde, (Z)-3-hexenal in the fresh
juice, while the reconstituted juice had higher FD factors of the terpenoid compounds (limonene,
α-pinene and linalool) as well as 3-isopropyl-2-methoxypyrazine and vanillin.
α-Terpineol, Furaneol, and 4-vinylguaiacol
Much research on off-flavors in orange juice has focused on α-terpineol, Furaneol and 4-
vinylguaiacol. Furaneol is thought to be responsible for the pineapple-like aroma of aged orange
juice (Tatum et al., 1975). It is considered as one of the major flavor impact compounds in both
pineapple and strawberries (Pickenhagen et al., 1981). As seen in Table 3-1, its aroma is
41

described as cotton candy or caramel and it imparts a sweet aroma that altars the flavor balance
in orange juice, causing an off-flavor which many assessors find unacceptable in an orange juice
matrix. The perceived cotton candy aroma, although pleasant on its own, does not contribute a
desired flavor in orange juice. Even though concentrations of 4-vinylguaiacol, methional and
vanillin were profoundly different, (Figure 3-3), it can be seen that Furaneol aroma intensity
concentrations were similar for both the good and poor quality juice. However, with less aroma
impact compounds in the poor quality juice, especially aldehydes and esters, Furaneol may have
a greater relative impact on juice quality.
α-Terpineol
α-Terpineol concentrations are known to increase with increased storage time and
elevated storage temperature (Rymal et al., 1968), therefore, the concentration of α-terpineol has
been proposed as a marker for thermally abused citrus juices (Askar et al., 1973b). α-Terpineol,
Figure 3-4, has been shown to be produced by d-limonene, through acid catalyzed hydration, as
well as through linalool degradation. However, in orange juice, α-terpineol is mainly produced
through linalool degradation (Askar et al., 1973a; Haleva-Toledo et al., 1999). The sensory
contribution of α-terpineol is also unclear.
Tatum and coworkers (1975) described α-terpineol as imparting a musty, stale, or piney
aroma when added to fresh juice. However, other references (Arctander, 1969) list α-terpineol
as having a delicate floral and lilac aroma. It is not uncommon for slight differences in aroma
descriptors for a specific compound in literature; it is unusual to see the kind of range noted for
α-terpineol. Some aroma-active compounds depict different aromas based on the concentration
of the compound. For example, α-terpineol when present in low concentrations can be described
42

as in Arctander with a delicate floral aroma as compared to a piney, musty aroma when present
in higher concentration.
In this study, there was a total lack of aroma activity for α-terpineol in either juice. As
seen in Figure 3-5, there is no aroma activity in the region of α-terpineol. The peak for linalool
has an aroma peak superimposed over the FID peak, indicating the FID peak responsible for
linalool also has aroma activity. Consequently, the lack of an aroma response by α-terpineol by
any assessor in either juice suggests that its aroma threshold in orange juice is much higher than
its threshold in water. This also suggests that α-terpineol is not an off-flavor and therefore not
responsible for the poor quality juice flavor found in orange juices prepared and stored under
commercial conditions. Tatum and coworkers (1975) found α-terpineol to cause a significant
difference (p < 0.001 and p < 0.05) in orange juice at levels of 2.0 and 2.5 µg/mL respectively.
This study found α-terpineol at a level of 2.16µg/mL with no aroma activity.
Tonder and coworkers (1998) compared freshly reconstituted orange juice with
reconstituted orange juice stored for 9-12 months at 20°C. α-Terpineol was detected at 0.33 and
1.15 µg/mL in freshly reconstituted and stored juice respectively. However, they reported an
olfactory response for α-terpineol only in the stored juice, but this was not confirmed using a
second GC column as generally required.
In addition, the levels of α-terpineol were not statistically different. Our current study
differs, in that α-terpineol displayed no aroma activity although being present at a concentration
almost twice as great (2.16 µg/mL) as the Tonder study.
The aroma threshold of α-terpineol using GC-O was determined in the current study
through a series of standards and three assessors. All three respondents first noticed aroma
activity at 0.217g/100mL or 2170 µg/mL, (Figure 3-6). At this level, all three assessors were
43

only able to note a just noticeable difference as an aroma descriptor. The aroma descriptor for α-
terpineol from concentrations of 0.249g/100mL to 0.900g/100mL were all musty.
As seen in Figure 3-6, the aroma intensities of each assessor tend to follow a sigmoidal
path as concentration increases. This sigmoidal relationship is expected of flavors, as reported
originally by Beidler (1954). Beidler explains that when a flavor stimulus reaches a saturation
level, the magnitude of the response will hold constant. Beidler also mentions a minimum
threshold level that must be obtained before a response is noted, being defined as the response is
slightly greater than a given limiting value.
4-Vinylguaiacol
4-Vinylguaiacol is commonly accepted as the single most detrimental compound in
orange juice and has a sensory impact that is quite negative. Previous studies show that this
compound is formed at storage temperatures above 30°C (Peleg et al., 1992; Naim et al., 1997;
Walsh et al., 1997; Marcotte et al., 1998). This study shows (Figure 3-3) that 4-vinylguaiacol
was only detected in the below average quality juice. It should also be noted that 4-
vinylguaiacol had the second highest aroma intensity in the below average quality juice (Figure
3-1). Vanillin exhibited the highest aroma intensity in the below average quality juice but may
not be as important in the complete juice matrix. Other investigators (Goodner et al., 2000) have
noted a relatively high vanillin response with GC-O, however did not find a correlation of
vanillin and flavor score in NFC grapefruit juice. Possible explanations mentioned for the lack
of correlation include: the assessor inflating the intensity score due to vanillin’s distinct aroma or
a possible interaction with another compound/s in the juice matrix (antagonistic or synergistic).
A more likely explanation is that the solvent extraction of the aroma volatiles overemphasizes
this compound which has a relatively low vapor pressure. Therefore, 4-vinylguaiacol is the
44

single most important aroma contributor to the poor quality juice compared with the relative
aroma intensities of other aroma impact compounds. However, it should also be noted that good
quality juice was characterized by the absence of this compound.
Methional
Methional (3-(methylthio)-propanal) is a highly potent sulfur containing aldehyde whose
presence appears to be profoundly negative. Methional is formed through a Strecker degradation
pathway from methionine, Figure 3-7. As seen in Table 3-1, methional imparts a cooked potato
aroma. Research has reported it as producing significant off-flavors in stored orange juice
(Bezman et al., 2001), wine (Escudero et al., 2000), cooked mussels (Le Guen et al., 2000),
cooked spinach (Masanetz et al., 1998), cheddar cheese (Milo and Reineccius, 1997), and beer
(Anderson and Howard, 1974). As shown in Figure 3-1, the aroma of methional was detected
only in the below average quality juice at a mid level range. Its aroma intensity was
approximately one third that of 4-vinylguaiacol, one of the more negative off-flavor compounds
found in stored juice. To quantify the level of this potent sulfur compound, the extract obtained
for GC-O analysis was analyzed for sulfur using a chemiluminescence detector. It was found at
a level of 30μg/L in the poor quality juice. The published threshold for methional is matrix
dependent and ranges from 1.6 μg/L in beer (Jansen et al., 1971), to 0.2 μg/L in tomato (Buttery
et al., 1971). The level detected in this study in the poor quality reconstituted orange juice
considerably exceeds these thresholds, thus confirming the GC-O observations. An interesting
note, Buettner and Schieberle (2001a) detected methional in freshly hand-squeezed juice and
reconstituted juice at the same FD factor of 64. This differs from our results, as methional was
only found in the below average quality reconstituted orange juice and not the above average
quality reconstituted orange juice.
45

Buettner and Schieberle again detected methional in hand squeezed Valencia late and
Navel orange juice at concentrations 0.4μg/kg and 0.3μg/kg and FD factors of 64 and 32,
respectively (Buettner and Schieberle, 2001b). The odor activity values (OAV), or ratio of
concentration to odor threshold in water, both orthonasally and retronasally, were also calculated
for methional. Orthonasally, both Valencia Late and Navel juices reported low OAV values of
<1, while showing 10 and 8 respectively by retronasal evaluation. The low OAVs for methional
in the fresh juices show that its contribution to the overall aroma of the juice is low.
Conclusions
The diminished and or lack of aroma response of aldehydes such as hexanal, heptanal,
octanal, nonanal, (E)-2-octenal, undecanal and in the below average quality juice as compared to
the above average quality juice seems to have played a major role in the overall quality
assessment of the juice. This is also combined with the occurrence of off-flavor compounds such
as methional and 4-vinylguaiacol that were not found in the above average quality juice.
Consequently, the lack and or diminishment of certain aldehydes most likely compounded the
impact of methional and 4-vinylguaiacol. Of note in this study, the often cited orange juice
storage off-flavor α-terpineol (Tatum et al., 1975) was shown to be above previously reported
concentrations but without aroma activity.
46

Table 3-1. Summary of aroma active compounds found in good and poor quality juice. LRI (DB-Wax)
Below Average Quality Juice
Above Average Quality Juice
Descriptor
Tentative ID
1098 1098 Green/bitter Hexanal 1160 1167 Grapefruit/musty Myrcene 1202 1209 Lemon/floral Heptanal 1208 Citrus/sweet Limonene
1223 Citrus/minty Limonene/1,8-cineole
1251 Cooked/fermented beans
Unknown
1299 1299 Citrus/grapefruit Octanal 1309 1309 Mushroom 1-Octen-3-one
1350 Fermented bean/musty
Unknown
1378 1379 Green/musty (E)-3-Hexenol 1400 Oily/bitter Nonanal 1438 Minty/floral (E)-2-Octenal 1451 Sour Acetic acid
1463 Potato Methional 1494 Fatty/oily (E,E)-2,4-
Heptadienal 1505 Fatty/oily Decenal
1515 1515 Green/pungent (Z)-2-Nonenal 1546 1541 Green/pungent (Z)-4-Decenal 1552 1547 Green/floral Linalool
1595 Floral/minty Undecenal 1683 Beef/musty Unknown
1736 Overripe/oats Unknown 1741 1748 Sweet/honey Geranial
1760 Burnt/pepper Unknown 1758 Sweet/citrus (E)-2-Undecenal
1772 Burnt cooked food/spicy
(E,Z)-2,4-Decadienal
1820 Smoky/pepper (E,E)-2,4-Decadienal
1836 1832 Tobacco/sweet β-Damascenone 1855 1855 Fruity/floral Geraniol
1882 Fermented juice/herbal
Unknown
1954 Roses β-Ionone 1981 1983 Bread/cooked rice Unknown 2020 2016 Green/paint Trans-4,5-epoxy-E-
2-decenal
47

Table 3-1. Continued LRI (DB-Wax)
Poor Quality Juice Good Quality Juice
Descriptor
Tentative ID 2036 Candy/burnt sugar Unknown 2056 Spicy/roasty Unknown 2089 Overripe Unknown
2169 2164 Sweet/baked grain Unknown 2184 2178 Honey/burnt candy Eugenol 2212 Spicy/burnt sugar 4-Vinylguaiacol 2212 Pepper Unknown
2242 Fresh β-Sinensal 2269 2263 Spicy/dill Wine lactone
2413 Floral/sweet (Z)-Methyl-jasmonate
2611 2623 Vanilla Vanillin
48

0
20
40
60
80
hexa
nal
hept
anal
1-oc
ten-
3-on
e
(E)-3
-hex
enol
(E)-
2-oc
tena
l
met
hion
al
deca
nal
(Z)-
4-D
ecen
al
unde
cana
l
(E,Z
)-2,
4-de
cadi
enal
ß-da
mas
ceno
ne
trans
-4,5
-epo
xy-2
E-d
ecen
al
Fura
neol
euge
nol
win
e la
cton
e
vani
llinN
orm
aliz
ed A
rom
a Pe
ak In
tens
ity
Good Quality OJ Poor Quality OJm
yrce
ne
limon
ene/
1,8-
cine
ole
octa
nal
nona
nal
(ace
tic a
cid
(E,E
)-2,4
-hep
tadi
enal
(Z)-2
-non
enal
linal
ool
gera
nial
(E)-
2-un
dece
nal
(E,E
)-2,
4-de
cadi
enal
gera
niol
ß-io
none
4-vi
nylg
uaia
col
ß-si
nens
al
(Z)-
met
hyl j
asm
onat
e
Figure 3-1. Normalized aroma peak intensity comparison of good and poor quality orange juice.
49

(Z)-4
-Dec
enal
Ger
ania
l
Und
ecan
al
(E)-2
-Und
ecen
al
(Z)-2
-Non
enal
Dec
anal
(E,E
)-2,4
-Hep
tadi
enal
Met
hion
al
(E)-2
-Oct
enal
Non
anal
Oct
anal
Hex
anal
Hep
tana
l
(E,Z
)-2,4
-Dec
adie
nal
(E,E
)-2,4
-Dde
cadi
enal
Tran
s-4,
5-ep
oxy-
2E-d
ecen
al
b-Si
nens
al
Nor
mal
ized
Pea
k A
rom
a In
tens
ity
Poor quality OJGood quality OJ
Figure 3-2. Aldehyde comparison between good and poor quality orange juice.
50

0
10
20
30
40
50
60
70
80
Furaneol 4-Vinylguaiacol Methional Vanillin
Nor
mal
ized
Aro
ma
Peak
Inte
nsity
Poor Quality OJ Good Quality OJ
Figure 3-3. Comparison of known off-flavor components in orange juice.
OH
OH
H+. HOH
d-Limonene
α-Terpineol
+HOH -H+
H+, -HOH
Linalool
Figure 3-4. Possible pathway formations of α-terpineol (Haleva-Toledo et al., 1999).
51

Vale
ncen
e
14.0 14.5 15.0 15.5 16.0 16.5 17.0 17.5 18.0 18.514.0 14.5 15.0 15.5 16.0 16.5 17.0 17.5 18.0 18.5
Lina
lool
α -Ter
pine
ol-FID Response
Aroma Response
Z-4-
Dec
enal
Ger
ania
l
Retention Time (min)
(E,Z
)-2.
4-D
ecad
iena
l
(E,E
)-2.4
-Dec
adie
nal
β-D
amas
ceno
ne
Vale
ncen
e
14.0 14.5 15.0 15.5 16.0 16.5 17.0 17.5 18.0 18.514.0 14.5 15.0 15.5 16.0 16.5 17.0 17.5 18.0 18.514.0 14.5 15.0 15.5 16.0 16.5 17.0 17.5 18.0 18.514.0 14.5 15.0 15.5 16.0 16.5 17.0 17.5 18.0 18.5
Lina
lool
α -Ter
pine
ol-α -T
erpi
neol
-FID Response
Aroma Response
Z-4-
Dec
enal
Ger
ania
l
Retention Time (min)
(E,Z
)-2.
4-D
ecad
iena
l
(E,E
)-2.4
-Dec
adie
nal
β-D
amas
ceno
ne
Figure 3-5. Individual response chromatogram of α-terpineol GC/FID aromagram overlay.
0.0
50.0
100.0
150.0
200.0
250.0
300.0
350.0
400.0
0.0000 0.1000 0.2000 0.3000 0.4000 0.5000 0.6000 0.7000 0.8000 0.9000 1.0000
g a-Terpineol in 100mL MeOH
Aro
ma
Inte
nsity
Res
pons
e
Assessor 1
Assessor 2
Assessor 3
JustNoticeableDifference
0.0
50.0
100.0
150.0
200.0
250.0
300.0
350.0
400.0
0.0000 0.1000 0.2000 0.3000 0.4000 0.5000 0.6000 0.7000 0.8000 0.9000 1.0000
g a-Terpineol in 100mL MeOH
Aro
ma
Inte
nsity
Res
pons
e
Assessor 1
Assessor 2
Assessor 3
JustNoticeableDifference
Figure 3-6. GC-O aroma threshold determination of α-terpineol.
52

53
R1
R2
O
OOO
NS
-CO2
N
OO
S
R2
R1
O
H
H
NH
S
OH
R1
R2OS
R1
R2
NH2
OH
R1
R2
NH2
O
+
Methionine dicarbonylcompound
-H2O
H2O+
MethionalAminoketone
Figure 3-7. Methional formation through Strecker degradation of methionine (Mottram and Wedzicha, 2002).

CHAPTER 4 ORANGE JUICE FLAVOR STORAGE STUDY: DIFFERENCES BETWEEN GLASS AND
PET PACKAGING OVER TIME AND TEMPERATURE
Introduction
Past studies have looked at the effect of plastic polymers on orange juice flavor. Duerr et
al. studied the effects of Tetra Brik, polyethylene lined cartons on reconstituted orange juice and
found a 40% decrease in (+)-limonene in 6 days as compared to 10% decrease in glass (Duerr et
al., 1981). (+)-Limonene is a known precursor to a widely reported off-flavor compound in
orange juice, α-terpineol (Tatum et al., 1975; Haleva-Toledo et al., 1999). Duerr reported a
linear increase in α-terpineol formed from (+)-limonene that was greater in glass as compared to
the Tetra Brik. The rate of formation of α-terpineol was more relative to temperature as
compared to initial limonene concentration. Marin et al. reported (1992) (+)-limonene producing
only trace aroma activity and not contributing much aroma to orange juice. They concluded that
its adsorption into polyethylene may be considered positive. Marin et al. also studied the effects
of low density polyethylene (LDPE)/Surlyn Brik-Pak on the aroma volatiles of orange juice
(Marin et al., 1992) and noted 70% of the (+)-limonene was scalped by the Brik-Pak within 24
hours at 25°C.
Kutty et al. investigated the oxidation of (+)-limonene in the presence of Low Density
Polyethylene (LDPE). (+)-Limonene was readily absorbed by the LDPE, with 95% absorption
into the polymer in week 0. Higher amounts of headspace oxygen remained in LDPE samples
by week 10 compared to the control, with 95% and 83% headspace oxygen respectively,
indicating higher (+)-limonene oxidation in the control. In both the control and LDPE samples,
degradation products of oxidized limonene were found, including linalool, limonene oxide, α-
54

terpineol, carveol and carvone. Carveol has been reported as an off-flavor in orange juice
(Ahmed et al., 1978).
A recent study by Berlinet et al. (2005) compared the volatile aroma compounds of
orange juice in glass and polyethylene terephthalate, PET, over five month’s storage. The study
showed no statistical difference between volatiles in glass or PET, but rather a similar decrease
in aldehydes, ketones, esters, aliphatic alcohols, sequiterpene and monoterpene alcohols, and an
increase in 4-vinylguaicol and furfural. Overall, no difference in aroma composition was noted
with PET.
Polyethylene terephthalate bottles are commonly used in beverage applications because
of their relatively good barrier against flavor and gas permeation, due to biaxial molecular
orientation (Lune et al., 1997).
In order to hasten results, heat treatment and or accelerated storage studies are a common
method used for determining orange juice aroma impact compounds. Tatum et al. (1975) studied
canned orange juice over 12 weeks at 35°C, and proposed the three most detrimental storage off-
flavor compounds as 4-vinylguaiacol, α-terpineol and Furaneol. Addition of 4-vinylguaiacol to
fresh juice noted an “old fruit/rotten” flavor. α-Terpineol imparted a stale, musty or piney note;
while Furaneol added a pineapple-like aroma. All are considered unfavorable in orange juice.
Bazemore et al. (1999) treated orange juice with extreme heat at 96°C for 60 seconds and
analyzed the volatile composition. The ten most impactful aroma compounds include: ethyl
butanoate, myrcene, (E)-2-nonenal, decanal, octanal, terpin-4-ol, (Z)-3-hexenal and three
unknowns (imparting a metallic, vinyl and nutty notes). Compounds of interest formed after heat
treatment includes 4-vinylguaiacol.
55
Peterson et al. (1998) compared normal storage conditions of 5 and 20°C to accelerated
conditions at 30, 40 and 50°C. Findings show 6 month/20°C samples correlated with either 13
day samples at 40°C or 5 days at 50°C. Peterson et al. showed a decrease in linalool and octanal
while an increase in α-terpineol, comparable with results from Tatum (1975).
The major purpose of this study was to examine storage off-flavor production under
refrigerated conditions at 4°C as compared to elevated thermal conditions of 35°C. Additionally,
the effect of packaging was examined. Storage off-flavor production in PET and glass
containers were compared to determine if increased levels might be observed in juices from the
more gas permeable PET containers.
Materials and Methods
Chemicals
The following chemicals were obtained commercially from Aldrich (Milwaukee, WI): 1-
octen-3-one, 4-hydroxy-2,5-dimethyl-3(2H)-furanone (Furaneol), vanillin, (E,E)-2,4-decadienal,
(E)-2-undecenal, (E)-2-nonenal, methional, (Z)-4-decenal, 4-Vinyl-guaicol, hexanal, octanal,
nonanal, decanal, linalool. The following chemicals were obtained as gifts from SunPure
(Lakeland, FL): myrcene, limonene, 1,8-cineole, geraniol, geranial and β-sinensal. 3a,4,5,7a-
tetrahydro-3,6-dimethyl-2(3H)-benzofuranone (wine lactone), was a gift from Professor Dr. G.
Helchmen at the University of Heidelberg, Heidelberg, Germany. β-Damascenone was obtained
from Givaudan. (Z)-2-nonenal was found as an impurity in (E)-2-nonenal at approximately 5-
10%, while (E,Z)-2,4-decadienal and trans-4,5-epoxy-E-2-decenal was found in an oxidized
sample of (E,E)-2,4-decadienal.
56

Orange Juice
The commercial orange juice from concentrate used in this study was obtained from a
Florida manufacturer in 16 fluid ounce (473mL) glass containers with metal closures. The PET
containers were also obtained from the same Florida manufacturer with polypropylene closures.
Half of the orange juice from concentrate was then transferred to 16 fluid ounce PET containers
by way of sterile transfer. The PET containers were dipped in a 190°F water bath, drained and
filled with the orange juice from the glass container. All samples were then stored at
temperatures of 4, 25, and 35°C for up to 16 weeks. Samples were frozen until analysis at
−38°C.
Visual and organoleptic evaluation
Samples were evaluated at days 7, 14, 28, 56, 84 and 112. Visually, samples were
evaluated against a reference of orange juice for noticeable color change. After visual
evaluation, samples were compared informally by organoleptic evaluation against the reference
at ambient temperature. The informal organoleptic evaluation determined if the sample would
still be considered acceptable for a consumer against the reference.
Sample preparation
Extraction of volatiles was done in a similar method to Parliament (1986) and modified
by Klim and Nagy (1992) and Jella and coworkers (1998). Liquid-liquid extracts were obtained
using 1:1 pentane: diethyl ether. 10 mL of 1:1 pentane: diethyl ether was added to 10 mL of
single strength orange juice from concentrate and vigorously mixed by forcing between syringes
connected with a three-way valve. After mixing, samples were centrifuged at 3000 g for 10
minutes. The solvent layer was re-extracted with an additional 10 mL of 1:1 pentane: diethyl
ether and re-centrifuged. Solvent layers were combined, and then dried over anhydrous sodium
sulfate. 25 μL of 4000 µg/mL 2-heptadacanone in 1:1 pentane: diethyl ether was added as an
57

internal standard. Samples were concentrated to 100 μL under a gentle stream of dry N2 and
stored in a septum sealed vial in a freezer until later analysis.
Gas chromatography-olfactometry conditions
A HP-5890A GC (Agilent Technologies, Palo Alto, CA) with a standard FID detector
was used to separate the orange juice extracts with the following fused silica capillary columns:
DB-Wax (30 m × 0.32 mm id, film thickness 0.5 μm) and DB-5 (30m 0.32 mm id, film thickness
0.5 μm). Column oven temperature was programmed from 40 to 240°C at a linear rate of
7°C/min with no hold. Column injection volume was 0.5 μL and splitless. Injector and detector
temperatures were 225°C and 275°C respectively. A Gerstel (Baltimore, MD) column splitter
was used to split the effluent with a ratio of 2:1 between the olfactometry and FID detectors
respectively. The olfactometer used in this study is similar to that described by Acree (Acree et
al., 1984). The hot effluent from the capillary column was combined with a large stream of
humidified air in a 1 cm diameter stainless tube. The air was purified by passing through
activated charcoal, Drierite, and molecular sieve 5A (Alltech, Deerfield, IL). The purified air
was then humidified by bubbling through a temperature controlled, water filled round-bottomed
flask. Air flow to the stainless tube was adjusted to 1.1L/min. Panelists sniffed the effluent as it
passed through the stainless steel tubing and rated the intensity of the volatiles on a 10 cm linear
potentiostat (0-1.0 V output). Data was then collected and recorded using Chrom Perfect
Software. Samples were evaluated at days 0, 7, 14, 38, 56, 84 and 112.
GC-olfactometry
GC-O equipment and conditions were identical to those described in earlier studies
(Bazemore et al., 1999). The olfactometry panel consisted of two trained panelists, 1 male and 1
female, between 25 and 30 yrs old. Panelists were trained in a manner similar to Rouseff and co-
58

workers (Rouseff et al., 2001b), using a standard solution of 11 compounds typically found in
citrus juice (ethyl butanoate, cis-3-hexenol, trans-2-hexenal, α-pinene, myrcene, linalool,
citronellol, carvone, terpin-4-ol, geranial, and neral). The standard mixture helped train panelists
in a time-intensity scale, optimum positioning, and breathing techniques. Panelists also were
trained by evaluating at least 10 commercial orange juice flavor extracts in order to gain
experience and consistency. Panelists were not used for this study until they demonstrated the
ability to replicate aroma intensity responses in the practice juice extracts. Panelists ran each
experimental sample in duplicate and summary reports were generated for each aromagram.
Only peaks detected at least 50% of the time were included in this study. Results from each
panelist’s aromagram were normalized with their own maximum peak intensity (set to 100)
before being averaged.
Gas chromatography-mass spectrometry (GC-MS)
Sample separation was performed on a Finnigan GCQ Plus system (Finnigan Corp., San
Jose, CA), using a J&W Scientific DB-5 column (60m, 0.25 mm i.d., 0.25 µm film thickness
(Folsom, CA)). The MS was operated under positive ion electron impact conditions: ionization
energy, 70 eV; mass range, 40-300 amu; scan rate, 2 scans/s; electron multiplier voltage, 1050 V.
Transfer line temperature was 275 °C. Initial column oven temperature was 40 °C and increased
at 7 °C/min to a final temperature of 275 °C. Injector temperature was 250 °C. Helium was used
as the carrier gas at a linear velocity of 32 cm/s. When searchable spectra could not be obtained
for compounds of interest because of low signal-to-noise ratio, chromatograms of selected
masses were reconstructed from the MS data matrix. These selected ion chromatograms (SIC)
employed at least three unique m/z values from the mass spectrum of standards were used as
59

identification aides. Whenever possible, the molecular ion (M+) was chosen as one of the three
m/z values.
Results and Discussion
In addition to chromatographic analysis, samples were evaluated visually for color and
organoleptically for overall qualitative acceptance. Samples changed color as time progressed
under heated conditions. Samples, both glass and PET, stored at 25 and 35°C were noted with
increased brown hues as storage time increased, whereas 4°C samples did not visually darken
during storage. This implies that non-enzymatic browning occurred due to increased storage
temperature. In a related manner, 25 and 35°C were deemed unacceptable organoleptically after
112 days storage, imparting brown/cooked notes. 4° samples were still acceptable but had lost a
significant amount of fresh notes.
Table 4-1, shows the results for the aroma active compounds detected over the 16 week
storage. In all, 67 different compounds were detected by GC-O in the orange juices. Juice at
time zero produced 37 aroma active compounds. The number of compounds increased to 41 and
46 respectively for glass and PET packages after 112 days of storage at 35°C.
The most potent aroma active compounds, as measured by normalized peak intensity, in
the day 0 sample include the following in decreasing intensity: vanillin, 4-vinylguaiacol, 4-
mercapto-4-methyl-2-pentanone, 1-octen-3-one, wine lactone, decanal, Furaneol, ethyl vanillin
and linalool. The glass, day 112, 35°C sample measures the following as the strongest aroma
active compounds in decreasing intensity: vanillin, Furaneol, ethyl vanillin, wine lactone, 4-
vinylguaiacol and linalool. The PET, day 112, 35°C sample includes the following as the
highest aroma active intensities: 4-vinylguaiacol, vanillin, ethyl vanillin, Furaneol, wine lactone,
2-methyl-3-furanthiol, linalool and butanoic acid. Of note, all three sets contain the known
orange juice off-flavor components of Furaneol and 4-vinylguaiacol. However, with diminished
60

aroma peak intensities at day 112 as compared to day 0, the occurrence of Furaneol and 4-
vinylguaiacol more profoundly impacted the overall aroma. The impact of vanillin and wine
lactone are also considered as some of the most impactful aroma contributors by Buettner and
Schieberle in reconstituted orange juice (Buettner and Schieberle, 2001a).
Aroma changes over time
Measuring aroma change over time, five compounds were noted at time zero that were
completely lost by olfactometry in either 4 or 35°C regardless of package. Of these compounds,
2 were identified as (E,E)-2,4-heptadienal imparting a pungent/oily aroma and undecanal
imparting a musty aroma. Three unknown peaks imparted skunky, musty and grain notes. The
overall number of compounds was lowest in day 0 juice with 37 aroma active compounds;
however, overall aroma activity, as measured by the sum of normalized aroma peaks, was greater
at day 0 as compared to day 112 samples, Table 4-2. This difference is most evident comparing
juice stored in PET at 35°C with a 28% loss over 112 days storage. The diminished aroma
activity can also be seen in Figures 4-1 and 4-2 comparing day 0 and day 112 aromagrams of
glass and PET respectively. The decrease in aroma activity at day 112 is significantly different
from that at day 0 at p<0.01.
The condition with the highest number of aroma active compounds is day 112 PET stored
at 35°C. When considering temperature, both PET and glass packages had more aroma active
compounds at the higher temperature of 35°C as compared to 4°C.
Off-Flavor Compounds
Of note, known off-note compounds in orange juice were observed starting at day 0,
including methional (18), Furaneol (50), 4-vinylguaiacol (57). α-Terpineol, as discussed in more
detail in chapter 3, was not noted as aroma active in this study at any temperature or packaging
conditions, showing that its concentration is below its aroma threshold.
61

Methional
Methional (18) has been reported as an off flavor in orange juice (Bezman et al., 2001),
grapefruit oil (Lin and Rouseff, 2001) and in grapefruit juice (Lin et al., 2002), imparting a
cooked potato note. As mentioned in chapter 3, methional is a product of Strecker degradation
of the amino acid methionine. When comparing the aroma intensities of methional, the highest
level is in day 0 juice. However, with overall diminished aroma intensity at day 112 as
compared to day 0, methional likely plays a greater role in the overall characteristic of the stored
juice. The highest aroma intensity occurrence at day 0 is notable as compared to the orange juice
studied in chapter 3, where methional was only not found in the good quality orange juice.
Furaneol and 4-vinylguaiacol
Furaneol (50) and 4-vinylguaiacol (57) have long been noted as an off flavor in orange
juice (Tatum et al., 1975). As shown in Table 4-1, both Furaneol and 4-vinylguaiacol are one of
the few compounds that start and remain at a high aroma impact through storage. The constant
intense aroma activity of Furaneol also agrees with the findings in chapter 3, where Furaneol
showed high aroma activity in both the good and poor quality juice. However, 4-vinylguaiacol
was only noted in the poor quality juice; where it was noted at a high aroma intensity starting a
day 0 in this study. Surprisingly, Buettner and Schieberle did not note either compound in their
reconstituted orange juice, which would correspond to the day 0 sample in this study (Buettner
and Schieberle, 2001a).
2-Methyl-3-furanthiol and bis(2-methyl-3-furyl) disulfide
The potent storage off-note 2-methyl-3-furanthiol (11), discussed in detail in chapter 5,
was found under PET packaging at day 112. 2-Methyl-3-furanthiol is a degradation product of
thiamin that imparts a meaty to grainy aroma and has a low aroma threshold of 6.14 x10⁻⁸ mM in
water (Munch and Schieberle, 1998). It has been reported as an off-note in grapefruit (Lin et al.,
62

2002) and orange juice (Bezman et al., 2001). Additionally, the dimer of 2-methyl-3-furanthiol,
bis(2-methyl-3-furyl) disulfide (46), was also noted in glass conditions on day 112 at 4°C and
35°C as well as PET conditions at 35°C. Bis(2-methyl-3-furyl) disulfide is the most potent
aroma compound observed in foods to date at 8.9 x10⁻¹¹ mM in water (Buttery et al., 1984).
With bis(2-methyl-3-furyl) disulfide being found in both glass and PET at day 112, it is
surprising that its monomer is only found in PET. One explanation is 2-methyl-3-furanthiol is
present but at levels below its aroma threshold (as compared to its more potent dimer). Another
explanation is the dimerization during storage in glass is more complete than in PET.
M-cresol
M-Cresol (52) imparted a manure aroma and was present at day 112 in glass and PET.
m-Cresol occurred at the highest normalized aroma intensity in PET at 35°C. It was also found
at PET day 112 at 4°C where at the same day and temperature was not in glass. Hognadoittir
and Rouseff (2003) reported m-cresol in orange essence oil for the first time.
Sulfur compounds
Compound (14), 4-mercapto-4-methyl-2-pentanone is a characteristic aroma compound
in grapefruit (Buettner and Schieberle, 1999; Lin et al., 2002). It was found at day 0 at its
highest aroma impact level and disappears in the glass packaging at day 112, while decreasing by
approximately 50% in PET. However, with the overall decrease of aroma activity as shown in
figure 4-2, 4-mercapto-4-methyl-2-pentanone plays an important role in the overall quality of the
juice. 4-mercapto-4-methyl-2-pentanone gives a pleasant grapefruit aroma when in very small
concentrations. At higher concentrations, the compound is commonly described as sulfury or cat
urine.
Another probable sulfur containing compound is the unknown (21), described as having a
beefy or savory aroma. It is only present at the day 112, 35°C storage conditions. Of note, as
63

with the general trend, the compound has a higher aroma intensity level in the PET packaging as
compared to glass.
Carvone
The main constituent of orange oil is the terpene compound limonene. Limonene has a
very prominent FID peak on the FID chromatogram, but does not produce a major aroma impact.
As seen in Table 4-1, on a wax and DB-5 column it coellutes with the minty 1,8-cineole.
Limonene, however can under go oxidation to form carvone, a reported off-flavor in orange juice
(Papken et al., 1999; Buettner and Schieberle, 2001a). In this study, carvone (32), imparting a
sweet/ licorice aroma, is not noted in day 0 juice but is formed during storage. This agrees with
(Buettner and Schieberle, 2001a) where the comparison of aroma active compounds in fresh
squeezed orange juice and reconstituted orange juice found carvone only in the reconstituted
juice. The aroma descriptor of carvone in this study of sweet/licorice differs from that used by
Buettner as caraway-like. Buettner and Schieberle suggest the carvone found in their study is the
(S)-enatiomer, with the caraway-like aroma, where (R)-carvone has a minty aroma. The minty
descriptor is more in line with the sweet/licorice aroma described in this study. Tonder et al.
(Tonder et al., 1998) also noticed a higher aroma intensity of carvone in stored orange juice.
Vanillin
Vanillin (67) stays at a consistent aroma intensity level in this study, ranging from 9.4 to
10.6. Buettner and Schieberle report a large increase in FD factors of 32 to 1024 in fresh juice
compared to reconstituted juice. The high FD factor in the reconstituted juice agrees with the
high normalized intensity level for vanillin under all conditions in this study.
64

Changes in Fresh Juice Compounds
(Z)-3-Hexenal
One noteworthy difference when comparing juice at 4°C and 35° is the loss of key fresh
aromas. One such compound is (Z)-3-hexenal (5). As can be seen in Figure 4-3 comparing the
aroma activity of 4 and 35°C in glass at day 112, (Z)-3-hexenal is not present in the higher
temperature sample. This phenomenon is also noted by Buettner and Schieberle (2001a), where
(Z)-3-hexenal has a FD factor of 512 in fresh squeezed juice and was not detected in
reconstituted juice.
Linalool
Linalool (23), imparting a floral, lemon-like aroma, is considered a positive compound in
orange juice. Linalool remained at a constant aroma intensity level across time, temperature and
containers; ranging from a normalized aroma intensity of 7.4 to 8.9. Buettner and Schieberle
report a large difference between fresh and reconstituted juice, with FD factors of 16 and 512
respectively (Buettner and Schieberle, 2001a). The likely explanation in this latter case is that
the flavoring added to restore lost juice aroma volatiles contained an excess of linalool, a
relatively inexpensive aroma volatile.
Ethyl butyrate
Ethyl butyrate (3) imparts a fruity aroma was found starting at day 0 and diminished over
time. Ethyl butyrate is noted in orange juice in literature (Marin et al., 1992; Buettner and
Schieberle, 2001a; Tonder et al., 1998). The aroma values noted in this study agree with Tonder
et al. (1998), who reported aroma values decreasing from 180 to 76 in fresh reconstituted and
stored juice respectively. Buettner and Schieberle (2001a) report ethyl butyrate at a FD factor of
1024 in fresh squeezed juice and 2048 in reconstituted orange juice.
65

Octanal
Another key aroma loss is that of octanal (8), with a lemon/green aroma. Octanal is
present at day 0 and at juices stored at 4°C for both glass and PET but observed in juices stored
at 35°C, Figures 4-3 and 4-4. Tonder et al. (1998) found similar results with octanal being
present in freshly reconstituted concentrate but not stored juice. Peterson and Tonder (Petersen
et al., 1998) also report an approximate 50% loss of octanal after 12 days at 30°C. A similar
diminishing of (Z)-4-octenal (12) is noted in glass with a total absence in 35°C stored juice.
However, (Z)-4-ocental is present in 35°C day 112 PET samples, although at a slightly lower
aroma intensity.
Acetic and butanoic acids
Two compounds that were not present in the juice at day 0 are acetic acid (17) and
butanoic acid (27). Acetic acid is present in glass and PET packages at both 4 and 35°C
conditions at day 112. The aroma intensity increases slightly between temperature for both glass
and PET, with the highest amount being noticed in the 35°C PET condition. Butanoic acid is
reported only at the 35°C conditions for glass and PET. Again the highest intensity is reported in
PET with an intensity of 7.8 as compared to 2.8 for glass. The observance of these compounds is
also noted by Tonder et al. (1998), with both butanoic and acetic acids being present in freshly
reconstituted juice and reconstituted juice stored for 9 – 12 months at 20°C. Both acetic and
butanoic acid had a higher aroma intensity in stored orange juice. Buettner and Schieberle
(2001a) reported acetic acid in both fresh and reconstituted orange juice, with slightly higher FD
factor in the reconstituted juice (32 compared to 16). No butanoic acid was reported in their
study.
66

Trans-4,5-epoxy-(E)-2-decenal
Trans-4,5-epoxy-(E)-2-decenal (47) imparting a spicy aroma is found only at 35°C
conditions in this study. Buettner and Schieberle (2001a) report the compound to have a higher
FD factor in fresh juice as compared to reconstituted juice (128 and 16 FD factors respectively).
This differs from this study as trans-4,5-epoxy-(E)-2-decenal was not found at day 0, which
would be the closest variable with Buettner and Schieberle’s fresh juice.
Container comparison
Figure 4-5 displays a comparison between juices stored in glass and PET containers at
day 112, 35°C. Most compounds are found in both packages. However, there were some
differences. Five compounds were detected in glass but not PET. These compounds impart the
following aromas: orange/fruity (1), sour/estery (28), burnt/unripe (guaiacol) (40), green (43)
and smoky/soapy (64). Compounds (40) and (64) are considered off-flavors in orange juice.
The PET samples contain the following 11 compounds that are not in the glass 35°C, day 112
conditions: grainy/savory (2-methyl-3-furanthiol) (11), grainy ((Z)-4-octenal) (12), cat urine (4-
mercapto-4-methyl-2-pentanone) (14), floral/caramel (25), rose/sour (citronellol) (35),
green/plant (41), burnt sugar (eugenol) (55), spicy/cooked (sotolon) (56), green banana (γ-
undecalactone) (58), pepper (60) and herbal/weeds (65). Of these compounds (11), (14),
(41),(55), (56) and (60) are considered negative characteristics in orange juice.
Conclusions
Aroma active compounds change over time and most importantly, temperature. The total
number of aroma active compounds and the normalized aroma intensity between 4°C and 35° in
glass were comparable. However, a loss of important compounds such as (Z)-3-hexenal (green
banana) and octanal (lemon, green) and a decrease in (Z)-3-hexenol (green, citrusy), (E)-2-
ocenal (sour green), (Z)-4-decenal (woody, sharp green) and β-ionone (roses) occurred.
67

Concurrently, negative compounds were formed including butanoic acid, (E,E)-2,4-nonadienal
(fatty, grainy), trans-4,5-epoxy-(E)-2-decenal (spicy) and m-cresol (manure).
Differences exist when comparing glass and PET containers at 35°C day 112. PET has
higher total normalized aroma intensity at 248 compared to glass at 192 as seen in Table 4-2;
however the difference is not statistically different, p>0.10. Main differences include the
following negative compounds found in PET and not glass: 2-methyl-3-furanthiol, eugenol,
sotolon and 4-mercapto-4-methyl-2-pentanone as well as higher normalized intensities for
butanoic acid, trans-4,5-epoxy-(E)-2-decenal and 4-vinylguaiacol. Through the differences
above, glass has shown to be a better container for orange juice by minimizing the number of
off-flavor compounds created during storage.
68

Table 4-1. Aroma active compounds in orange juice stored at 4 and 35°C over 112 days. LRI Descriptor Day 0
Aroma Intensity*
Day 112 Glass
Aroma Intensity*
Day 112 PET Aroma Intensity*
No. Tentative ID DB-Wax
ZB-5
4°C 35°C 4°C 35°C
1 Unknown 982 Orange, fruity
n/a 3.3 3.0 0.9 n/a
2 α-Pinene 1030 935 Citrusy n/a 2.4 2.4 n/a 2.9 3 Ethyl butyrate 1040 795 Fruity 5.1 2.5 2.9 3.9 2.3 4 Unknown 1099 Skunky,
earthy 8.5 n/a n/a n/a n/a
5 (Z)-3-Hexenal 1150 780 Green banana
n/a 2.8 n/a n/a n/a
6 Myrcene 1168 990 Musty, geranium
7.4 4.8 5.1 5.4 3.8
7 Limonene/1,8-cineole
1208 1032 Licorice, minty
8.3 3.0 2.8 4.6 4.1
8 Octanal 1297 1002 Lemon, sharp green
7.7 3.6 n/a 6.1 n/a
9 1-Octen-3-one 1307 977 Mushroom 9.5 4.6 3.4 4.1 4.2 10 Unknown 1310 Cooked
rice 7.8 n/a n/a n/a n/a
11 2-Methyl-3-furanthiol
1317 874 Grainy, savory
n/a n/a n/a 4.4 8.3
12 (Z)-4-Octenal 1345 Grainy 7.1 3.0 n/a 3.8 2.9 13 Unknown 1377 Musty
green, rubbery
7.3 7.8 4.7 5.9 5.4
14 4-Mercapto-4-methyl-2-pentanone
1390 943 Cat urine 9.6 n/a n/a 5.3 5.5
15 (Z)-3-Hexenol 1398 Green, citrusy
n/a 4.0 3.3 3.8 2.9
16 (E)-2-Octenal 1438 1058 Sour green 4.9 4.9 3.7 3.2 2.9 17 Acetic acid 1447 Sour,
vinegar n/a 2.5 2.9 3.1 5.0
18 Methional 1464 908 Potato 8.7 3.1 4.4 6.2 6.5 19 (E,E)-2,4-
Heptadienal 1501 1022 Pungent,
oily 7.0 n/a n/a n/a n/a
20 Decanal 1511 1207 Woody, green
9.4 6.6 6.2 6.5 7.3
21 Unknown 1523 Beefy, savory
n/a n/a 3.3 n/a 5.7
69

22 (Z)-4-Decenal 1541 1198 Woody, sharp green
7.6 5.9 4.9 4.5 5.2
23 Linalool 1548 1101 Lemony, floral
8.9 8.6 7.4 8.4 8.3
24 (E,Z)-2,6-Nonadienal
1593 1161 Cucumber n/a n/a n/a 4.7 n/a
25 Unknown 1601 Floral, caramel
n/a n/a n/a n/a 4.0
26 Undecanal 1623 1277 Musty, moldy
4.6 n/a n/a n/a n/a
27 Butanoic acid 1625 817 Sour butter, manure
n/a n/a 2.9 n/a 7.8
28 Unknown 1669 Sour, estery
n/a n/a 2.8 n/a n/a
29 (E,E)-2,4-Nonadienal
1701 1209 Fatty, grainy
n/a n/a 2.1 3.4 n/a
30 Unknown 1728 Moldy, rubber
6.0 n/a n/a n/a n/a
31 Unknown 1734 Woody, sweet grain
5.1 6.5 7.1 5.2 5.4
32 Carvone 1748 1252 Licorice, sweet
n/a 3.7 2.8 n/a 3.0
33 Unknown 1758 Grain, musty
5.5 n/a n/a n/a n/a
34 (E,Z)-2,4-Decadienal
1772 1297 Grainy, sour
7.8 4.0 3.2 n/a 2.5
35 Citronellol 1773 Rose, sour n/a n/a n/a n/a 2.5 36 Unknown 1815 Sweet
dough 5.6 n/a n/a 4.0 n/a
37 (E,E)-2,4-Decadienal
1820 1327 Fatty green,
cucumber
n/a 4.4 4.2 3.2 3.4
38 β-Damascenone
1834 1393 Tobacco, apple juice
6.8 5.2 4.8 5.4 6.0
39 Geraniol 1852 1258 Rose, floral
6.0 n/a 3.2 6.2 6.1
40 Guaiacol 1863 1087 Burnt, unripe
4.6 2.7 4.5 n/a n/a
41 Unknown 1867 Green, plant
n/a n/a n/a n/a 4.6
42 Unknown 1883 Sweet grain,
toasted
n/a 7.3 5.8 n/a 3.0
70

oats 43 Unknown 1905 Green n/a n/a 2.7 n/a n/a 44 β-Ionone 1956 1491 Raspberry,
roses 5.1 8.2 6.5 6.1 5.3
45 Unknown 1965 Moldy 4.0 n/a n/a n/a n/a 46 Bis(2-methyl-
3-furyl) disulfide
1980 1543 Spicy, grainy
n/a 3.8 4.5 n/a 4.1
47 Trans-4,5-epoxy-(E)-2-
decenal
1996 1384 Spicy, syrup
n/a n/a 3.6 n/a 7.1
48 Unknown 2008 Dusty n/a n/a n/a 4.1 n/a 49 Unknown 2016 Woody,
floral n/a 3.6 4.6 3.3 2.9
50 Furaneol 2041 1061 Cotton candy
9.3 8.5 10.2 9.1 10.4
51 Unknown 2061 Spicy, meaty
6.7 2.6 4.3 n/a 4.6
52 m-Cresol 2088 1087 Manure n/a n/a 3.9 4.0 6.4 53 Unknown 2121 Licorice,
rubbery n/a 3.0 n/a n/a n/a
54 Unknown 2161 Burnt bread
5.6 n/a n/a 5.4 n/a
55 Eugenol 2174 1352 Burnt sugar
n/a 3.4 n/a 5.5 4.1
56 Sotolon 2180 Cooked, spicy
n/a n/a n/a n/a 4.1
57 4-Vinylguaiacol
2205 1323 Spicy, cloves
10.5 8.2 8.0 10.2 11.7
58 γ-Undecalactone
2238 Green banana
7.3 3.8 n/a 4.1 2.8
59 Wine lactone 2260 1469 Dill, buttery
9.5 8.1 8.8 6.6 8.5
60 Unknown 2301 Pepper n/a n/a n/a 4.5 5.2 61 Unknown 2365 Soapy,
floral n/a 3.5 3.5 n/a 4.1
62 Unknown 2416 Perfume, floral
n/a 4.2 n/a n/a n/a
63 Unknown 2437 Soapy, musty
5.4 5.3 3.2 4.8 4.4
64 Unknown 2544 Smoky, soapy
4.7 4.5 4.7 n/a n/a
65 Unknown 2556 Herbal, weeds
n/a n/a n/a n/a 2.6
66 Ethyl vanillin 2575 Vanilla, cocoa
9.2 9.5 9.8 9.7 10.5
71

67 Vanillin 2597 1412 Vanilla, chocolate
10.6 9.4 10.6 9.6 10.5
72

73
Table 4-2. Comparison of total overall aroma intensity under various package, time and temperature conditions.
Packaging Total Normalized
Aroma Intensity
Total Number of Aroma
Active Compounds
Number of Unique
Compounds
Day 0 267 37 5 PET day 112 (4°C)
205 38 3
PET day 112 (35°C)
248 46 1
Glass day 112 (4°C)
196 40 0
Glass day 112 (35°C)
192 41 3
15
10
5
0
5
10
15
LRI (DB Wax)
Nor
mal
ized
Aro
ma
Peak
Inte
nsity
Day 0 Day 112
ethy
l but
yrat
e
myr
cene
octa
nal
α-p
inen
e
limon
ene/
1,8-
cine
ole
1-oc
ten-
3-on
e
(Z)-
4-oc
tena
l
4-m
erca
pto-
4-m
ethy
l-2-p
enta
none
(Z)-
3-he
xeno
l
(E)-
2-oc
tena
lac
etic
aci
d
met
hion
al
deca
nal
(E,E
)-2,
4-he
ptad
iena
l
(Z)-
4-de
cena
l
(E,Z
)-2,6
-non
adie
nal
linal
ool
unde
cena
l
(E,E
)-2,
4-no
nadi
enal
γ-un
deca
lact
one
ethy
l van
illin
vani
llin
m-c
reso
l
4-vi
nylg
uaia
col
win
e la
cton
e
bis-
(2-m
ethy
l-3-fu
ryl)
disu
lfide
trans
-4,5
-epo
xy-(
E)-
2-de
cena
l
β-io
none
(E)-
2-un
dece
nal
β-da
mas
ceno
nege
rani
ol
carv
one
(E,Z
)-2,
4-de
cadi
enal
(E,E
)-2,
4-de
cadi
enal
guai
acol
Figure 4-1. Aroma comparison of day 0 and 112 (35°C) in glass packaging.

15
10
5
0
5
10
15
LRI (DB Wax)
Nor
mal
ized
Aro
ma
Peak
InIn
tens
ity
Day 0 Day 112
ethy
l but
yrat
eα
-pin
ene
myr
cene
limon
ene/
1,8-
cine
ole
(E)-2
-hex
enal
octa
nal
1-oc
ten-
3-on
e2-
met
hyl-3
-fura
nthi
ol(Z
)-4-
octe
nal
4-m
erca
pto-
4-m
ethy
l-2-p
enta
none
(Z)-3
-hex
enol
(E)-2
-oct
enal
acet
ic a
cid
met
hion
al(E
,E)-2
,4-h
epta
dien
alde
cana
l(Z
)-4-d
ecen
allin
aloo
l(E
,Z)-2
,6-n
onad
iena
lun
dece
nal
buta
noic
aci
d
carv
one
citro
nello
l(E
,Z)-2
,4-d
ecad
iena
l(E
,E)-
2,4-
deca
dien
alβ-
dam
asce
none
gera
niol
β-io
none
fura
neol
m-c
reso
leu
geno
lso
tolo
n4-
viny
lgua
iaco
lγ-
unde
cala
cton
ew
ine
lact
one
ethy
l van
illin
vani
llin
guai
acol
(E)-2
-und
ecen
al
bis-
(2-m
ethy
l-3-fu
ryl)-
disu
lfide
trans
-4,5
-epo
xy-(E
)-2-d
ecen
al
Figure 4-2. Aroma comparison of day 0 and 112 (35°C) in PET packaging.
74

15
10
5
0
5
10
15
LRI (DB-Wax)
Nor
mal
ized
Aro
ma
Peak
Inte
nsity
4° C 35°C
ethy
l but
yrat
e
myr
cene
octa
nal
(Z)-
4-oc
tena
l
α-p
inen
e
(Z)-3
-hex
enal
limon
ene/
1,8-
cine
ole
1-oc
ten-
3-on
e
(Z)-
3-he
xeno
l(E
)-2-
octe
nal
met
hion
alde
cana
l
linal
oolac
etic
aci
d
(Z)-
4-de
cena
l
(E,E
)-2,4
-non
adie
nal
buta
noic
aci
d
carv
one
(E,Z
)-2,
4-de
cadi
enal
(E,E
)-2,
4-de
cadi
enal
β-da
mas
ceno
nege
rani
olgu
aiac
ol
β-io
none
bis-
(2-m
ethy
l-3-fu
ryl)
disu
lfide
trans
-4,5
-epo
xy-(E
)-2-d
ecen
al
fura
neol
m-c
reso
l
4-vi
nylg
uaia
col
win
e la
cton
eγ-
unde
cala
cton
e
ethy
l van
illin
vani
llin
euge
nol
Figure 4-3. Aroma comparison of orange juice stored at 4 and 35° for 112 days in glass.
75

15.0
10.0
5.0
0.0
5.0
10.0
15.0
LRI (DB-Wax)
Nor
mal
ized
Aro
ma
Peak
Inte
nsity
PET Day 112 4°C PET Day 112 35°C
α-p
inen
eet
hyl b
utyr
ate
myr
cene
limon
ene/
1,8-
cine
ole
(E)-
2-he
xena
loc
tana
l1-
octe
n-3-
one
2-m
ethy
l-3-fu
rant
hiol
(Z)-
4-oc
tena
l4-
mer
capt
o-4-
met
hyl-
2-pe
ntan
one
(Z)-3
-hex
enol
(E)-
2-oc
tena
lac
etic
aci
dm
ethi
onal
deca
nal
(Z)-
4-de
cena
llin
aloo
l(E
,Z)-
2,6-
nona
dien
al
buta
noic
aci
d(E
,E)-
2,4-
nona
dien
al
carv
one
citro
nello
l
(E,E
)-2,4
-dec
adie
nal
β-da
mas
ceno
nege
rani
ol
β-io
none fu
rane
ol
m-c
reso
l
euge
nol
soto
lon
4-vi
nylg
uaia
col
γ-un
deca
lact
one
win
e la
cton
e
ethy
l van
illin
vani
llin
bis-
(2-m
ethy
l-3-fu
ryl)-
disu
lfide
trans
-4,5
-epo
xy-
(E)-
2-de
cena
l
Figure 4-4. Aroma comparison of orange juice stored at 4 and 35° for 112 days in PET.
76

77
15
10
5
0
5
10
15
LRI (DB-Wax)
Nor
mal
ized
Aro
ma
Peak
Inte
nsity
Glass PET
myr
cene
limon
ene/
1,8-
cine
ole
α-p
inen
eet
hyl b
utyr
ate
(E)-
2-he
xena
l
2-m
ethy
l-3-fu
rant
hiol (Z
)-4-
octe
nal
4-m
erca
pto-
4-m
ethy
l-2-
pent
anon
e
deca
nal
acet
ic a
cid
met
hion
al
linal
ool
buta
noic
aci
d
(E,Z
)-2,
4-de
cadi
enal
(E,Z
)-2,
4-de
cadi
enal
/ci
trone
llol
β-da
mas
ceno
ne
m-c
reso
l
euge
nol
soto
lon
γ-un
deca
lact
one
1-oc
ten-
3-on
e
(Z)-3
-hex
enol
(E)-
2-oc
tena
l
(Z)-4
-dec
enal
carv
one
(E,E
)-2,
4-de
cadi
enal
guai
acol
β-io
none
fura
neol
bis-
(2-m
ethy
l-3-fu
ryl)
disu
lfide
4-vi
nylg
uaia
col
win
e la
cton
e
ethy
l van
illin
vani
llin
trans
-4,5
-epo
xy-(E
)-2-
dece
nal
Figure 4-5. Aroma comparison of orange juice stored at 35° for 112 days in glass and PET .

CHAPTER 5 GC-OLFACTOMETRIC CHARACTERIZATION OF AROMA VOLATILES FROM THE
THERMAL DEGRADATION OF THIAMIN IN MODEL ORANGE JUICE
Introduction
Thiamin (vitamin B1) can thermally decompose to produce highly potent aroma
compounds. Previous studies have focused on identifying and characterizing decomposition
products produced by thiamin under various thermal and pH conditions. The factors determining
which breakdown products will be formed include temperature, pH, processing and storage time
(Dwivedi and Arnold, 1973). The various products formed are the result of different reactions,
which are dependent upon the conditions of pH and temperature (Dwivedi and Arnold, 1973;
Dwivedi and Arnold, 1972; Mulley et al., 1975). Research has shown that a greater number of
degradation products are formed under basic conditions as compared to acidic conditions. A
study by Guntert et al. (1992) examined thiamin degradation in solutions of pH 1.5, 7.0, and 9.5.
Thirty-eight, 32, and 59 compounds were formed under the respective pH conditions. Under
moderately alkaline conditions, the greatest number of thiophenes and fewest furans would be
formed. Acidic conditions showed a greater number of furans, furanones, and furanthiols being
formed. Since orange juice is fairly acidic (typically pH 3.8), the types of compounds formed
would be expected to be similar to those reported from acidic conditions. The primary difference
is that model studies do not contain the vast array of reactive chemicals found in orange juice,
which might produce secondary reactions.
One of the most significant thiamin degradation products is 2-methyl-3-furanthiol. Both
it, and its dimer, bis(2-methyl-3-furyl)disulfide impart a savory meaty flavor. As might be
expected, it is a well documented component of meat flavors (Werkhoff et al., 1990; Farmer and
Mottram, 1990; Kerscher and Grosch, 1998). 2-Methyl-3-furanthiol and bis(2-methyl-3-
furyl)disulfide have also been reported in cooked brown rice (Jezussek et al., 2002), recently
78

reported in grapefruit juice (Lin et al., 2002), and also identified as a possible off-flavor in stored
orange juice (Bezman et al., 2001). Bis(2-methyl-3-furyl)disulfide is a highly potent aroma with
an odor threshold as low as 2 parts in 1014 parts water (Buttery et al., 1984). It is extremely
difficult to analytically measure such potent aroma active components as they are below the
detection of most instrumental techniques.
Thiamin is the second most abundant water-soluble vitamin in orange juice, and is a more
concentrated source for vitamin B1 than many foods that are better known sources of this
vitamin, such as whole wheat bread. The thermal degradation of thiamin at high temperature for
short times has been well studied as have room temperature photochemical degradations, but no
prior work was found on the thermal degradation of thiamin at elevated room temperature.
Because orange juice is a relatively rich source of thiamin, our goal was to determine if thiamin
was the probable source of these observed off-flavors in non-refrigerated juices. To achieve this
goal, the aroma active volatiles formed in thiamin-containing model orange juice solutions stored
at 35 °C for up to 12 weeks in the absence of light will be identified and characterized.
In this study a highly sensitive pulsed flame photometric detector, PFPD, will be
employed with capillary GC to quantify 2-methyl-3-furanthiol and bis(2-methyl-3-furyl)
disulfide in the model orange juices. Aroma active compounds in the stored model orange juice
samples will be assessed using time-intensity GC-Olfactometry.
Materials and Methods
The following compounds were obtained commercially from Acros Chemical (New
Jersey): glucose, sucrose, citric acid, 2-formyl-5-methylthiophene, 2-methyl-3-furanthiol,
dimethyl sulfide, 2-acetylthiophene, and bis(2-methyl-3-furyl) disulfide. Fructose and
tripotassium citrate were obtained from Fisher (New Jersey). Thiamin hydrochloride, 2-methyl-
4,5-dihydro-3(2H)-thiophenone, and 2-Methyl-3-(methyldithio) furan were obtained from Sigma
79

(Steinheim, Germany). 4,5-Dimethylthiazole was a gift from Florida Treatt Inc. Hydrogen
sulfide was obtained from Matheson Gas Products (Montgomeryville, PA).
Preparation of model orange juice solutions
Model orange juice (MOJ) solutions, at an adjusted pH of 3.8, were prepared according
to Peleg and co-workers (1992), with modifications. A 100 g MOJ solution (% w/w) contained
the following compounds: sucrose, 5.0; fructose, 2.5; glucose, 2.5; citric acid, 1.0; tripotassium
citrate, 0.5, double distilled water, 88.5. Thiamin hydrochloride was added at 0.024 mM. Fifty
mL aliquots were transferred to 120 mL amber vials, and a nitrogen atmosphere was added by
gently flowing N2 into the vials before sealing. Samples were then stored in the dark at 35 °C
for up to 8 weeks to eliminate possible photochemical reactions. A control sample was al
prepared under the same conditions, except without thiamin hydrochloride.
so
Sample preparation
Thiamin-MOJ samples were taken on the following days: 0, 1, 7, 14, 28, 42, and 56. Ten
mL aliquots were placed into a 30 mL vial with a septum lid and given a nitrogen headspace.
Samples were placed in a 40 °C water bath and equilibrated for 15 min. Samples were then
exposed to SPME: 50/30ím DVB/Carboxen/PDMS StableFlex (Supelco, Bellefonte, PA) for 30
min.
Gas chromatography-pulse flame photometric detector (GC-PFPD)
Samples were separated by SPME using an HP-5890 series II GC (Palo Alto, CA) using
an O-I-Analytical 5380 PFPD with a DB-5 column (30 m _ 0.32 mm i.d. x 0.25 ím) from J&W
Scientific (Folsom, CA). Initial oven temperature was 40 °C and increased to a final temperature
of 290 °C at 7 °C/min. Injector (Gerstel, Baltimore, MD, model CIS-3) and detector
temperatures were 200 and 250 °C, respectively. Helium was used as the carrier gas at a flow
80

rate of 2 mL/min. Compounds were monitored on the PFPD for sulfur in two different manners:
linear and exponential responses. Chromatograms were recorded using Chromperfect (Justice
Innovations, Inc., Mountain View, CA). Samples were run in triplicate.
Quantitative analysis
2-Methyl-3-furanthiol and MFT-MFT were quantified by means of standard calibration
curves containing 0.007, 0.01, 0.05, 0.1 µg/mL and 0.001, 0.01, 0.1 µg/mL of MFT and MFT-
MFT, respectively. The standards were prepared in MOJ solutions that did not contain thiamin.
The samples were extracted and analyzed in triplicate using the GC-PFPD under identical
conditions as the storage samples that contained thiamin.
Gas chromatography
An HP-5890A GC (Agilent Technologies, Palo Alto, CA) with a standard flame
ionization detector was used to separate the model orange juice extracts using either a DB-5 (30
m _ 0.32 mm i.d., 0.5 ím film thickness, J&W Scientific (Folsom, CA)) or DB-Wax (30 m _
0.25 mm i.d., 0.5 ím film thickness, J&W Scientific (Folsom, CA)). Initial oven temperature
was 40 °C and increased to a final temperature of 265 °C at 7 °C/min with no hold. Injector and
detector temperatures were 220 and 250 °C, respectively. Data were collected and recorded
using Chromperfect Software.
GC-olfactometry
GC-O equipment and conditions were identical to those described in earlier studies
(Bazemore et al., 1999). The olfactometry panel consisted of two trained panelists, 1 male and 1
female, between 25 and 30 yrs old. Panelists were trained in a manner similar to Rouseff and co-
workers (2001b), using a standard solution of 11 compounds typically found in citrus juice (ethyl
butanoate, cis-3-hexenol, trans- 2-hexenal, α-pinene, myrcene, linalool, citronellol, carvone,
81

terpin- 4-ol, geranial, and neral). The standard mixture helped train panelists in a time-intensity
scale, optimum positioning, and breathing techniques. Panelists also were trained by evaluating
at least 10 commercial orange juice flavor extracts in order to gain experience and consistency.
Panelists were not used for this study until they demonstrated the ability to replicate aroma
intensity responses in the practice juice extracts. Panelists ran each experimental sample in
duplicate and summary reports were generated for each aromagram. Only peaks detected at least
50% of the time were included in this study. Results from each panelist’s aromagram were
normalized with their own maximum peak intensity (set to 100) before being averaged.
Gas chromatography-mass spectrometry (GC-MS)
Sample separation was performed on a Finnigan GCQ Plus system (Finnigan Corp., San
Jose, CA), using a J&W Scientific DB-5 column (60m _ 0.25 mm i.d. x 0.25 μm film thickness
(Folsom, CA). The MS was operated under positive ion electron impact conditions: ionization
energy, 70 eV; mass range, 40-300 amu; scan rate, 2 scans/s; electron multiplier voltage, 1050 V.
Transfer line temperature was 275 °C. Initial column oven temperature was 40 °C and increased
at 7 °C/min to a final temperature of 275 °C. Injector temperature was 250 °C. Helium was used
as the carrier gas at a linear velocity of 32 cm/s. When searchable spectra could not be obtained
for compounds of interest because of low signal-to-noise ratio, chromatograms of selected
masses were reconstructed from the MS data matrix. These selected ion chromatograms (SIC)
employed at least three unique m/z values from the mass spectrum of standards were used as
identification aides. Whenever possible, the molecular ion (M+) was chosen as one of the three
m/z values.
82
Injector decomposition study
A standard solution of MFT was injected onto the GC-PFPD under similar
chromatographic conditions outlined above with changes to the injector temperature. Samples
were injected at three temperatures: 160, 180, and 200 °C.
Microbiological analysis
Thiamin MOJ samples from day 0 and day 56 were plated for microbial counts using
standard microbial techniques (Swanson et al., 2001). Samples were run in duplicate using
orange serum agar (OSA), acidified potato dextrose agar (APDA), and plate count agar (PCA)
plates. OSA and PCA plates were incubated at 30 and 35 °C, respectively, for 24 hours, while
APDA plates were incubated at 25 °C for 48 hours. Dehydrated media was purchased from
Difco (Becton, Dickindon and Company, Sparks, MD.). Each medium was prepared according
to manufacturer’s directions, and plates were poured using standard aseptic techniques.
Results and Discussion
This study differs from previous thiamin thermal degradation studies (Guntert et al.,
1992; Guntert et al., 1990; van der Linde et al., 1979; Guntert et al., 1993; Hartman et al., 1984a;
Hartman et al., 1984b) in terms of time-temperatures, sample matrix, detection devices, and
thiamin levels employed. Whereas previous studies were conducted at high temperatures (110-
130 °C) and short times (1-6 hours), this study was conducted at relatively low temperature (35
°C) and long times (8 weeks). The former conditions are typical for cooking and roasting,
whereas the time-temperature conditions chosen for this study represent the most extreme
conditions a juice would likely encounter during storage. In this study, GC-O is employed to
identify the number, quality, and the relative aroma intensity of the thiamin degradation
products. Prior studies primarily employed GC-MS to determine total volatiles without directly
83

determining their aroma activity. Finally, thiamin concentrations chosen for this study are more
typical of those found in citrus juices (0.024 mM), whereas prior studies employed considerably
higher concentrations, some as great as 296 mM or more than 12,000 times higher concentrations
(Jhoo et al., 2002).
Day 7 and 42 aromagrams
Normalized aromagrams from thiamin model orange juice solutions stored at 35 °C for 7
and 42 days are compared in Figure 5-1. These two dates were chosen to represent short and
long-term storage conditions. Thirteen aroma volatiles were observed between the two storage
times; 11 aroma active volatiles were found after 7 day storage, but only 8 aroma volatiles were
observed after 42 days storage. Six of the eight aroma active volatiles found in the day 42
samples were also found in the day 7 samples. Thus almost half of the aroma volatiles observed
after 7 day storage were no longer observed after 42 day storage. This can be explained with
sulfur compounds often being unstable. Although 5 aroma volatiles were lost between day 7 and
day 42 samples (peaks 1, 2, 6, 8, and 11), two new aroma volatiles were generated (peaks 5 and
10). Total aroma intensity also decreased from day 7 to day 42. Of the aroma components
detected, MFT (peak 4), roasted meaty aroma, and its dimer, MFT-MFT (peak 13), roasted
meat/savory aroma, were among the most intense. MFT is a well-established thermal
degradation product of thiamin (Grosch and Zeiler-Hilgart, 1992) and has been reported in stored
orange juice (Bezman et al., 2001).
The intensity of MFT-MFT peaks in the aromagrams in Figure 5-1 is only slightly less
than that of the monomer, MFT, strongly suggesting that it could be a potent storage off-flavor as
well. Combined, these two compounds comprise 33% of the total aroma activity after 7 day
storage and 48% of the aroma peak area after 42 days storage. Because the dimer (peak 13) has
84

only slightly less aroma intensity than MFT (peak 4) at both sampling times and there are fewer
aroma volatiles at day 42, the relative impact of dimer should increase with increased storage
time. Peaks 3, 9, and 12 are common to both sampling times and have been characterized but
not identified (see Table 5-1). These peaks were characterized as having tropical fruity/grape,
fertilizer/ earthy, and savory/meaty/sulfury attributes, respectively.
All three peaks diminish between 7 days storage and 42 days storage. Many of the peaks
that are lost after extended storage also remain to be identified. However, peak 6, with meaty,
cooked attributes; peak 8, with a burnt aroma; and peak 11, with a meaty aroma, have been
identified as 3-thiophenethiol, 2-acetylthiophene, and 2-methyl-3-(methyldithio) furan. The two
new compounds found after 42 days storage, peak 5 with skunky/ earthy attributes and peak 10
with a meaty aroma, have been identified as 4,5 dimethylthiazole and 2-formyl-5-
methylthiophene, respectively. Their structures are shown in Figure 5-2.
Aroma volatile identifications
Table 5-1 lists the aroma active compounds observed, their linear retention index values
(LRI) on DB-5 and DB-Wax columns, aroma descriptors, and identification procedures
employed. Linear retention index values and aroma descriptors were used to make preliminary
identifications; these aroma descriptors and retention values were confirmed using authentic
standards. Final confirmation was achieved by comparing GC-MS data from the sample with
that of standards. The PFPD is one of the most sensitive and selective detectors for studying
sulfur containing volatiles. The responses from this detector were used as further confirmation
for peaks thought to be due to sulfur volatiles. The PFPD peaks in the sample that occurred at
the same retention time as an authentic standard were considered additional proof of the peaks’
identity. Peaks 4 and 13 are the major flavor impact compounds from the thermal degradation of
thiamin and have been identified as 2-methyl-3-furanthiol, MFT, and bis(2-methyl-3-furyl)
85

disulfide, MFT-MFT, the dimer of MFT. Identification was based on the cumulative evidence of
retention matching on both DB-5, carbowax columns, aroma characteristics, PFPD data, and MS
evidence. 2-Methyl-3-furanthiol was confirmed using SIC chromatograms at m/z 114(M+), 106,
and 86. In the case of MFT, all three SIC’s produced distinct peaks at the identical LRI value as
the standard. The first aroma active peak shown in Figure 5-1 occurs in the region where
hydrogen sulfide and dimethyl disulfide would be expected to elute. Both hydrogen sulfide
(Dwivedi and Arnold, 1973; Guntert et al., 1990) and dimethyl disulfide (Guntert et al., 1992;
Guntert et al., 1993) have been reported as thiamin degradation products. Therefore, the first 6
min. of the day 7 aromagram and corresponding PFPD response is shown in Figure 5-3, to better
illustrate which sulfur compound corresponds best with the first aroma peak. Hydrogen sulfide
elutes before dimethyl sulfide and an unidentified sulfur peak. It is readily apparent that the first
aroma peak elutes at the same time as dimethyl sulfide.
As illustrated in Figure 5-1, aroma peaks 1, 2, 6, 8, and 11 were only detected during the
first few days of storage at 35 °C storage. These were weak intensity aroma peaks that were
completely absent after 42 days storage. Peak one has already been identified as dimethyl
sulfide. The second GC-O peak has been tentatively identified as 1-pentanol, based on its aroma
description of fruity/green and its LRI values. Aroma peak 6 had a meaty, cooked aroma. It has
been tentatively identified as 3-thiophenethiol on the basis of its aroma characteristics and
retention characteristics on DB-5. SIC-MS chromatograms using m/z 116(M+) and 71 (the only
major peaks in the Wiley library spectra for this compound) produced peaks at the same
retention time as a PDPF peak and the GC-O peak in question. All of these peaks occur at the
literature LRI for this compound. However, this identification must be considered tentative as no
standard could be obtained for comparison purposes. Aroma peak 8 was identified as 2-
86
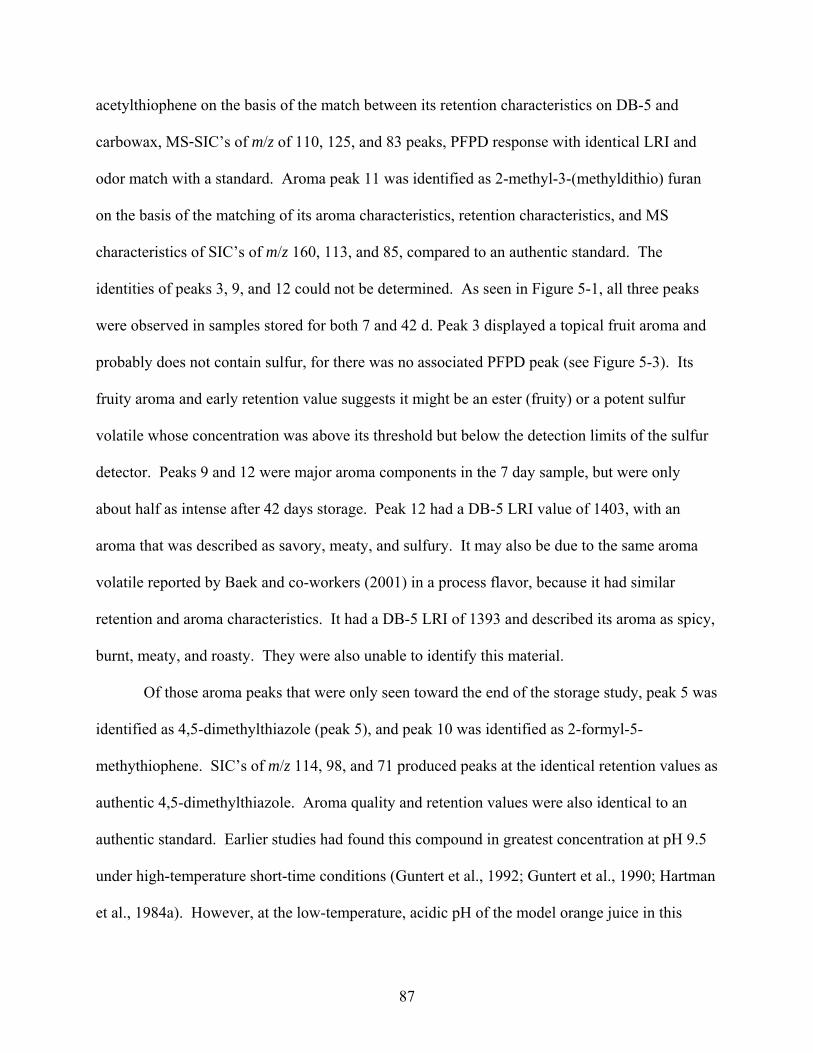
acetylthiophene on the basis of the match between its retention characteristics on DB-5 and
carbowax, MS-SIC’s of m/z of 110, 125, and 83 peaks, PFPD response with identical LRI and
odor match with a standard. Aroma peak 11 was identified as 2-methyl-3-(methyldithio) furan
on the basis of the matching of its aroma characteristics, retention characteristics, and MS
characteristics of SIC’s of m/z 160, 113, and 85, compared to an authentic standard. The
identities of peaks 3, 9, and 12 could not be determined. As seen in Figure 5-1, all three peaks
were observed in samples stored for both 7 and 42 d. Peak 3 displayed a topical fruit aroma and
probably does not contain sulfur, for there was no associated PFPD peak (see Figure 5-3). Its
fruity aroma and early retention value suggests it might be an ester (fruity) or a potent sulfur
volatile whose concentration was above its threshold but below the detection limits of the sulfur
detector. Peaks 9 and 12 were major aroma components in the 7 day sample, but were only
about half as intense after 42 days storage. Peak 12 had a DB-5 LRI value of 1403, with an
aroma that was described as savory, meaty, and sulfury. It may also be due to the same aroma
volatile reported by Baek and co-workers (2001) in a process flavor, because it had similar
retention and aroma characteristics. It had a DB-5 LRI of 1393 and described its aroma as spicy,
burnt, meaty, and roasty. They were also unable to identify this material.
Of those aroma peaks that were only seen toward the end of the storage study, peak 5 was
identified as 4,5-dimethylthiazole (peak 5), and peak 10 was identified as 2-formyl-5-
methythiophene. SIC’s of m/z 114, 98, and 71 produced peaks at the identical retention values as
authentic 4,5-dimethylthiazole. Aroma quality and retention values were also identical to an
authentic standard. Earlier studies had found this compound in greatest concentration at pH 9.5
under high-temperature short-time conditions (Guntert et al., 1992; Guntert et al., 1990; Hartman
et al., 1984a). However, at the low-temperature, acidic pH of the model orange juice in this
87

study, it was only a minor aroma peak. Because citrus juices are highly unlikely to be stored at
this temperature for this length of time, it is also unlikely that this compound would be found in
many commercial juices. The identification of peak 10 was based on its meaty aroma and the
fact that it also produced a PFPD peak at the exact retention time as 2-formyl-5-methythiophene.
This peak also matched the FID-LRI values on DB-5 and carbowax and the MS fragmentation
data of 5-formyl-5-methylthiophene. Peak 7 has been identified as 2-methyl-4,5-dihydro-3(2H)-
thiophenone, because its sensory, chromatographic, and mass spectral properties were identical
to that of an authentic standard. SIC’s of m/z of 116, 88, and 60 produced peaks at the identical
retention value as the standard.
Quantification of MFT and MFT-MFT
Both compounds possess a roasted meat or savory aroma, which is highly desirable in
meat and savory flavors but are definite off flavors in citrus juices. MFT-MFT is one of the most
potent food aromas ever measured. It produces an aroma peak at levels well below that of the
PFPD detector (1 pgS/s) and is thus difficult to quantify even with the most sensitive detectors.
MFT-MFT has been reported in a recent GC-O study of thermally concentrated grapefruit juice
(Lin et al., 2002), but no quantitation was attempted.
Thiols are known to readily oxidize into disulfides (thiol dimers). This was demonstrated
in a model study on the oxidative stability of odor-active thiols, which included MFT (Hofmann
et al., 1996). MFT and its dimer were quantified during the course of this storage study using the
PFPD. Results are shown in Figure 5-4. Even though the PFPD detector is one of the most
sensitive sulfur detectors, appreciable aroma peaks for both MFT and MFT-MFT were perceived
by GC-O before any PFPD peaks were observed. For example, MFT-MFT was first detected on
day 14 using the PFPD, whereas it produced a significant aroma peak on day 7. Using a similar
extraction procedure (SPME), panelists in another GC-O study could detect as little as 270 ng/L
88

MFT in stored orange juice (Bezman et al., 2001). As shown in Figure 5-4, MFT concentration
begins to increase with increasing storage time up to 42 days of storage then decreases from 9.8
x 10-4 mM at day 42 to 7.0 x 10⁻⁴ mM at day 56. As expected, the dimer of MFT, MFT-MFT,
cannot be formed until a certain amount of the monomer has formed. Thus, its concentration
will always lag behind that of the monomer. The dimer is not detected with the PFPD until day
14, with a measured concentration of 2.0 x 10⁻⁵ mM, which increases to 3.0 x 10-4 mM by 28
days and then maintains a roughly constant concentration after that. The constant concentration
after 28 days storage suggests that the dimer also participates in subsequent reactions and the rate
of these subsequent reactions is about the same as the formation from the monomer.
When comparing GC-O and PFPD responses for MFT and MFT-MFT as in comparing
results in Figures 5-1 and 5-4, a few distinctions must be considered. The response from the
PFPD detector will be a function of the atomic sulfur concentration irrespective of the source of
the sulfur, whereas the intensity indicated by human assessors for GC-O aromagrams will be a
function of the human sigmoidal dose-response to aroma. The aroma intensities for both MFT
and MFT-MFT in Figure 5-1 do not change appreciably between 7 and 42 days, whereas changes
in PFPD responses were observed. Human olfactory detection imits for some thiols are
appreciably lower than that of the PFPD. For example, at day 14 the concentration of MFT-MFT
was 2.3 x 10⁵ times greater than its aroma threshold and increased to 3.39 x 10⁶ times greater
than threshold at day 42. At these levels, it should not be surprising that GC-O aroma responses
did not vary as they were saturated, but the PFPD response (being less sensitive) was not
saturated.
Thiamin as a source of MFT and MFT-MFT in citrus juices
It is generally accepted that both MFT and its dimer are formed during the thermal
decomposition of thiamin in acid media at high temperature (van der Linde et al., 1979;
89

Mottram, 1991). However, MFT can potentially be formed from two other pathways. It can be
produced through a Maillard reaction involving cysteine and various simple sugars (Farmer et
al., 1989; Mottram and Whitfield, 1994), as well as from the reaction of norfuraneol and cysteine
(Hofmann and Schieberle, 1998). Bolton et al. (1994) studied a thiamin/cysteine model system
in order to determine the role of cysteine in the formation of MFT. Using labeled 34S-cysteine,
they determined that cysteine can contribute to MFT formation in the presence of thiamin, but
that thiamin was required for the formation of MFT. Few studies have examined orange juice
for the presence of cysteine. However, a recent report by Heems et al. (1998) reported no
measurable amounts of cysteine in orange juice (limits of detection ) 152 íg/L). Because both
alternate pathways for the formation of MFT require the presence of cysteine and cysteine is
apparently absent from orange juice (and probably grapefruit juice), it is therefore unlikely that
MFT can be formed in any way other than the direct decomposition of thiamin. MFT can also
form from the reaction of 4-hydroxy-5-methyl-3(2H)-furanone, norfuraneol, and either cysteine
or hydrogen sulfide (Hofmann and Schieberle, 1998; Whitfield and Mottram, 1999).
Norfuraneol’s presence is considered a degradation product of pentoses; however, a reaction
pathway from hexoses was proposed by Hofmann et al. (1998). The presence of norfuraneol in
the control model orange juice solution could point toward the formation of MFT through the
mechanism with hydrogen sulfide. To test for the presence of norfuraneol, GC-O and GC-MS
analyses were performed on the control model orange juice solution after 56 days storage. No
norfuraneol was detected, thus eliminating the last alternate MFT formation pathway.
Possible GC injector thermal artifacts
Because thiols are unstable and readily dimerize, and because there are literature reports
(Block, 1993) of sulfur artifact creation after exposure to the high temperature of the gas
chromatograph injector, additional experiments were conducted to determine if MFT-MFT was
90
formed from MFT in the GC injector. Three injector temperatures were chosen, 160, 180, and
200 °C. In each case, a standard containing 0.1 µg/mL MFT was injected onto the GC to
determine if any dimer could be detected. In all cases, only MFT was detected by the PFPD, and
its peak height did not increase with decreasing injector temperature. Therefore, it appears that
MFT was not degraded in the injector, and that the MFT-MFT detected in this study was not an
injector port artifact.
Possible microbiological artifacts
Microbial activity is a well-known means of producing of aroma compounds, providing
they are present. However, extensive precautions were observed in this study to maintain
microbial sterility in the storage samples. To confirm that none of the aroma-active compounds
observed in this study were derived from microbial organisms, samples were evaluated for
microbial content. Samples from day 0 and day 56 were plated using OSA for an aciduric count,
APDA for a yeast/mold count, and PCA for a total plate count. Results from all plates indicated
counts less than 10 cfu/mL with no visible growth. Therefore, the aroma compounds detected in
this study were not the result of microbiological contamination.
Conclusions
Thiamin has been shown to be the precursor to the potent aroma compounds MFT and its
dimer, MFT-MFT, in model orange juice solutions stored at 35 °C. Although the study lasted for
eight weeks, both compounds produced major aroma peaks after 7 days storage. Both
compounds have been shown to have a profound impact on the aroma of these stored solutions,
responsible for 33 and 48% of the total aroma at day 7 and 42, respectively. The relative aroma
contribution of these two compounds was shown to change with storage time. Both these meaty
off flavors have been reported in prior stored and/or heated orange and grapefruit juices.
91

Because citrus juices are rich sources of thiamin, and our model juice studies have demonstrated
that, from an olfactory point of view, these two compounds are among the major aroma impact
compounds formed, it appears that thiamin is the precursor for these off flavors in citrus juices.
However, to definitively prove that thiamin is the source of these off flavors in citrus juices, it
remains for isotopically labeled thiamin to be exposed under similar conditions to see if
isotopically labeled MFT or its dimer could be detected.
92

Table 5-1. Aroma active compounds detected in model orange juice solution
no.
LRIa
(DB5)
LRIa
(DB-Wax)
Compound name
Identification method
Aroma descriptor
1 681 Dimethyl sulfidee PFPD Sulfury
2 766 1-Pentanole
LRI, odor Fruity, green 3 843 Unknown Tropical fruity,
grape 4 863 1305 2-Methyl-3-furanthiol LRI, MSc, odor, PFPD Roasted meat 5 928 n.db. 4,5-Dimethylthiazole LRI, MSc, odor Skunky, earthy 6 967 3-Thiophenethiole LRI, MSd, odor, PFPD Meaty, cooked 7 998 1506 2-Methyl-4,5-dihydro-3(2H)-thiophenone LRI, MSc, odor, PFPD Sour-fruity,
musty, green 8 1085 1785 2-Acetylthiophene LRI, MSc, odor, PFPD Burnt 9 1095 Unknown PFPD Fertilizer, earthy 10 1112 1785 2-Formyl-5-methylthiophene LRI, odor, PFPD Meaty 11 1178 n.d. 2-Methyl-3-(methyldithio) furan LRI, MSc, odor, PFPD Meaty 12 1403 Unknown PFPD Savory, meaty,
sulfury 13 1543 2150 Bis(2-methyl-3-furyl) disulfide LRI, MSc, odor, PFPD Roasted meat,
savory
DB-5 Retention Time (min.)
Nor
mal
ized
Pea
k In
tens
ity
2 2010
Day 7
Day 42
1
23
4
5
6
78
9
10
11
1213
Figure 5-1. SPME headspace samples of GC-O aromagrams comparing day 7 and 42, where peak intensities were inverted for day 42 data. Peak number corresponds to compound numbers in Table 5-1.
93

S
SH
3-Thiophenethiol
(peak 6)
SO
2-Acetylthiophene(peak 8)
O
S S
2-methyl-3-(methyldithio) furan
(peak 11)
N
S
4,5-Dimethylthiazole
(peak 5)
SO
2-Formyl-5-methylthiophene
(peak 10)
Figure 5-2. Structures of select aroma active sulfur compounds detected in the model orange juice solution. Peak numbers in parentheses correspond to peak numbers in Table 5-1.
94

2.0 3.0 4.0 5.0 6.01.0
Sul
fury
Frui
ty/g
reen
Trop
ical
frui
ty
Roa
sted
mea
t
2-Methyl-3-furanthiol
Hyd
roge
n su
lfide
Dim
ethy
lsul
fide
Time (min)
GC
-O re
spon
sePF
PD re
spon
se
Figure 5-3. Comparison between PFPD chromatogram and corresponding aromagram from a model orange juice solution stored for 7 days at 35°C. First 6 min shown, to clearly illustrate which of the early PFPD peaks were aroma active as well as to demonstrate that there was no sulfur activity associated with peaks 2 and 3. SPME injection using a DB-5 column. See methods section for additional experimental details.
95

96
0
0.0002
0.0004
0.0006
0.0008
0.001
0.0012
0.0014
0 10 20 30 40 50 60Time (days)
Con
cent
ratio
n (m
M/L
)
2-Methyl-3-furanthiol
Bis-(2-methyl-3-furly) disulfide
Figure 5-4. MFT and MFT-MFT concentrations in thiamin model orange juice solutions stored at 35°C in the absence of light as determined by PFPD.

CONCLUSIONS
The underlying objective for my study was to determine what factors can affect the quality
of orange juice that a consumer purchases and which of these factors can be manipulated to
provide the highest quality of orange juice to the consumer. Factors that can affect the quality
include determining what aroma impact compounds contribute to quality orange juice as well as
compounds that would negatively contribute towards the flavor. Other factors that can affect the
quality of orange juice include temperature, packaging and flavor precursors such as thiamin.
Aroma impact compounds were determined in commercially purchased orange juices that
were determined organoleptically to be of differing quality. Aldehydes including hexanal,
heptanal, octanal, nonanal, decanal, undecanal and geranial were determined to contribute to the
above average quality orange juice; where as known off-flavors 4-vinylguaiacol and methional
contributed to the detriment of the below average juice.
A second study determined how the aroma impact compounds from the above study
change over time, temperature and packaging. Aldehydes including (Z)-3-hexenal (green banana
aroma), octanal (lemon aroma) and decanal (woody, green aroma) diminished and/or were lost
over time and temperature. Off-flavor compounds such as carvone (licorice aroma) and m-cresol
(manure aroma) were not found at day 0 and were formed over time. Polyethylene terephthalate
samples had known off-flavor compounds that were not in glass samples, including 2-methyl-3-
furanthiol (meaty aroma), eugenol (burnt sugar aroma) and sotolon (cooked, spicy aroma).
The last study determined the probable source of the off-flavor compounds 2-methyl-3-
furanthiol and bis(2-methyl-3-furyl) disulfide through a model orange juice study to be the
second most abundant water soluble vitamin in orange juice, thiamin.
Orange juice manufacturers can use the information from this study to tailor add-back
flavor packages with the aroma active compounds that contribute to quality orange juice.
97

Manufacturers can also take into account the type of packaging that is used and the shelf-life of
the product at higher real world temperatures and the affect it has on orange juice quality.
Finally, with a recent trend towards fortification of orange juice and beverages with vitamins and
phytochemicals, for example calcium fortified orange juice; this study shows that the levels of
thiamin present in orange juice can cause off-flavor production in an orange juice matrix.
Additional fortification with thiamin would cause an increase in the off-flavors 2-methyl-3-
furanthiol and bis(2-methyl-3-furyl) disulfide.
98

99
LIST OF REFERENCES
2006a. Citrus Fruit Uses. United Nations Conference on Trade and Development UNCTAD. 2006b. Citrus Reference Book. In: Department, F. D. o. C. E. a. M. R., editor). May 2006.
Florida Department of Citrus Economic and Market Research Department. 2007. Oranges: Quantity purchased, dollars spent, average retail price per pound or pint, and
average price per serving, 1999. USDA Economic Research Service. Acree TE & Barnard J. 1994. Gas chromatography-olfactometry and CharmAnalysis. In:
Maarse, H. & van der Heij, D. G., editors. Trends in Flavour Research. Elsevier Science B. V. p. 211-220.
Acree TE, Barnard J & Cunningham DG. 1984. A procedure for the sensory analysis of gas
chromatographic effluents. Food Chemistry 14:273-286. Ahmed EM, Dennison RA, Dougherty RH & Shaw PE. 1978. Flavor and odor thresholds in
water of selected orange juice components. Journal of Agricultural and Food Chemistry 26(1):187-191.
Akiyama M, Murakami K, Ohtani N, Iwatsuki K, Sotoyama K, Wada A, Tokuno K, Iwabuchi H
& Tanaka K. 2002. Characterization of flavor compounds during grinding of roasted coffee beans. Abstracts of Papers, 224th ACS National Meeting, Boston, MA, United States, August 18-22, 2002:AGFD-068.
Alonso JM, Chamarro J & Granell A. 1995. Evidence for the involvement of ethylene in the
expression of specific RNAs during maturation of the orange, a non-climacteric fruit. Plant Molecular Biology 29(2):385-390.
Anderson RJ & Howard GA. 1974. The origin and occurence of volatile sulphur compounds in
British ales and lagers. J. Inst. Brew. 80:357-370. Arctander S. 1969. Perfume and Flavors. Montclair, NJ. Arena E, Guarrera N, Campisi S & Asmundo CN. 2006. Comparison of odour active compounds
detected by gas-chromatography-olfactometry between hand-squeezed juices from different orange varieties. Food Chemistry 98(1):59-63.
Askar A, Bielig HJ & Treptow H. 1973a. Aroma changes in orange juice III. Model studies on
the losses of linalool and limonene during storage in bottles and cans. Deutsche Lebensmittel Rundschu 69:360-364.
Askar A, Bielig HJ & Treptow H. 1973b. Aroma changes in orange juice. II. Aroma changes
during manufacture and storage of bottled orange juice. Deutsche Lebensmittel Rundschau 69:162-167.

Baek HH, Kim CJ, Ahn BH, Nam HS & Cadwallader KR. 2001. Aroma extract dilution analysis of a beeflike process flavor from extruded enzyme-hydrolyzed soybean protein. Journal of Agricultural and Food Chemistry 49:790-793.
Balaban MO, Arreola AG, Marshall M, Peplow A, Wei CI & Cornell J. 1991. Inactivation of
pectinesterase in orange juice by supercritical carbon dioxide. Journal of Food Science 56(3):743-750.
Bazemore R, Goodner K & Rouseff R. 1999. Volatiles from unpasteurized and excessively
heated orange juice analyzed with solid phase microextraction and GC-olfactometry. Journal of Food Science 64(5):800-803.
Bazemore R, Rouseff R & Naim M. 2003. Linalool in orange juice: origin and thermal stability.
Journal of Agricultural and Food Chemistry 51(1):196-199. Beidler LM. 1954. A theory of taste stimulation. The Journal of Generaly Physiology 38(2):133-
139. Berlinet C, Ducruet V, Brillouet J-M, Reynes M & Brat P. 2005. Evolution of aroma compounds
from orange juice stored in polyethylene terephthalate (PET). Food Additives and Contaminants 22(2):185-195.
Bezman Y, Rouseff R & Naim M. 2001. 2-Methyl-3-furanthiol and methional are possible off-
flavors in stored orange juice: aroma-similarity, NIF/SNIF GC-O, and GC analyses. Journal of Agricultural and Food Chemistry 49:5425-5432.
Block E. 1993. Flavor artifacts. Journal of Agricultural and Food Chemistry 41:692. Bolton TA, Reineccius GA, Liardon R & Huynh Ba T. 1994. Role of cysteine in the formation of
2-methyl-3-furanthiol in a thiamine-cysteine model system. In: Parliment, T. H., Morello, M. J. & McGorrin, R. J., editors. Thermally Generated Flavors: Maillard, Microwave, and Extrusion Processes. Washington, D.C.: ACS. p. 270-278.
Buettner A & Schieberle P. 1999. Characterization of the most odor-active volatiles in fresh,
hand-squeezed juice of grapefruit (Citrus paradisi Macfayden). Journal of Agricultural and Food Chemistry 47:5189-5193.
Buettner A & Schieberle P. 2001a. Application of a comparative aroma extract dilution analysis
to monitor changes in orange juice aroma compounds during processing. In: Leland, J. V., Schieberle, P., Buettner, A. & Acree, T. E., editors. Gas Chromatography-Olfactometry The State of the Art. Washington D. C.: American Chemical Society. p. 33-45.
Buettner A & Schieberle P. 2001b. Evaluation of Aroma Differences between Hand-Squeezed
Juices from Valencia Late and Navel Oranges by Quantitation of Key Odorants and Flavor Reconstitution Experiments. Journal of Agricultural and Food Chemistry 49:2387-2394.
100

Buttery RG, Haddon WF, Seifert RM & Turnbaugh JG. 1984. Thiamin odor and bis(2-methyl-3-furyl) disulfide. Journal of Agricultural and Food Chemistry 32:674-676.
Buttery RG, Seifert RM, Guadagni DG & Ling LC. 1971. Characterization of Additional
Volatile Components of Tomato. Journal of Agricultural and Food Chemistry 19(3):524-529.
Carrapiso AI, Ventanas J & Garcia C. 2002. Characterization of the most odor-active compounds
of Iberian ham headspace. Journal of Agricultural and Food Chemistry 50(7):1996-2000. Cerny C & Davidek T. 2003. Formation of aroma compounds from ribose and cysteine during
the Maillard reaction. Journal of Agricultural and Food Chemistry 51:2714-2721. Chadwell D, Kader L & Romack M. 2006. Annual Report: 2005-2006 season fresh Florida citrus
shipments Lakeland, FL: Citrus Administrative Committee. p.37. Charles M, Martin B, Ginies C, Etievant p, Coste G & Guichard E. 2000. Potent aroma
compounds of two red wine vinegars. Journal of Agricultural and Food Chemistry 48:70-77.
Chisholm MG, Guiher LA & Zaczkiewicz SM. 1995. Aroma characteristics of aged Vidal Blanc
wine. American Journal of Enology and Viticulture 46(1):56-62. Countet C, Callemien D, Ouwerx C & Collin S. 2002. Use of gas chromatography-olfactometry
to identify key odorant compounds in dark chocolate. Comparison of samples before and after conching. Journal of Agricultural and Food Chemistry 50:2385-2391.
Cullere L, Escudero A, Cacho J & Ferreira V. 2004. Gas chromatography-olfactometry and
chemical quantitative study of the aroma of six premium quality Spanish aged red wines. Journal of Agricultural and Food Chemistry 52(6):1653-1660.
Czerny M & Grosch W. 2000. Potent odorants of raw arabica coffee. Their changes during
roasting. Journal of Agricultural and Food Chemistry 48:868-872. da Costa MS, Goncalves C, Ferreira A, Ibsen C, de Pinho PG & Ferreira ACS. 2004. Further
insights into the role of methional and phenylacetaldehyde in lager beer flavor stability. Journal of Agricultural and Food Chemistry 52(26):7911-7917.
da Silva MAAP, Lundahl DS & McDaniel Mr. 1994. The capability and psychophysics of Osme:
a new GC-olfactometry technique. In: Maarse, H. & van der Heij, D. G., editors. Trends in Flavour Research. Elsevier Science B. V. p. 191-209.
Dravnieks A & O’Donnell A. 1971. Principles and some techniques of high-resolution headspace
analysis. Journal of Agricultural and Food Chemistry 19(6):1049-1056.
101

Duerr P, Schobinger U & Waldvogel R. 1981. Aroma quality of orange juice after filling and storage in soft packages and glass bottles. Alimenta 20(4):91-93.
Dwivedi BK & Arnold RG. 1972. Chemistry of thiamine degradation: mechanisms of thiamine
degradation in a model system. J. Food Science 37:886-888. Dwivedi BK & Arnold RG. 1973. Chemistry of thiamine degradation in food products and
model systems: A review. Journal of Agricultural and Food Chemistry 21(1):54-60. Ebeler SE, Terrien MB & Butzke CE. 2000. Analysis of brandy aroma by solid-phase
microextraction and liquid-liquid extraction. Journal of the Science of Food and Agriculture 80(5):625-630.
Elston A, Lin JM & Rouseff R. 2005. Determination of the role of valencene in orange oil as a
direct contributor to aroma quality. Flavour and Fragrance Journal 20(4):381-386. Escudero A, Hernandez-Orte P, Cacho J & Ferreira V. 2000. Clues about the role of methional as
character impact odorant of some oxidized wines. Journal of Agricultural and Food Chemistry 48:4268-4272.
Evers WJ, Heinsohn HHJ, Mayers BJ & Sanderson A. 1976. Furans substituted at the three
position with sulfur. In: Charalambous, G. & Katz, I., editors. Phenolic, Sulfur, and Nitrogen Compounds in Food Flavors. Washington D.C.: American Chemical Society. p. 184-193.
Farmer LJ & Mottram DS. 1990. Recent studies on the formation of meat-like aroma
compounds. In: Bessiere, Y. & Thomas, A. F., editors. Flavour Science and Technology. NY: John Wiley & Sons. p. 113-116.
Farmer LJ, Mottram DS & Whitfield FB. 1989. Volatile compounds produced in Maillard
reactions involving cysteine, ribose and phospholipid. Journal of the Science of Food and Agriculture 49:347-368.
Fauconnier M-L, Panhaleux V, Vanzeveren E, Marlier M & Wathelet JP. 2001. Modelling
migration from high-density polyethylene containers into concentrated solutions used as food flavourings. Food Additives and Contaminants 18(11):1040-1045.
Gocmen D, Elston A, Willians T, Parish M & Rouseff RL. 2005. Identification of medicinal off-
flavors generated by Alicyclobacillus species in orange juice using GC-Olfactometry and GC-MS. Letters in Applied Microbiology 40:172-177.
Goodner KL, Jella P & Rouseff RL. 2000. Determination of vanillin in orange, grapefruit,
tangerine, lemon, and lime juices using GC-Olfactometry and GC-MS/MS. Journal of Agricultural and Food Chemistry 48:2882-2886.
102

Grosch W & Zeiler-Hilgart G. 1992. Formation of meatlike flavor compounds. In: Teranishi, R., Takeoka, G. R. & Guntert, M., editors. Flavor Precursors: Thermal and Enzymatic Conversions. Washington, D.C.: ACS. p. 183-192.
Guntert M, Bertram H-J, Hopp R, Silberzahn W, Sommer H & Werkhoff P. 1993. Thermal
generation of flavor compounds from thiamin and various amino acids. In: Hopp, R. & Mori, K., editors. Recent Developments in Flavor and Fragrance Chemistry: Proceedings of the 3rd International haarmann & Reimer Symposium. New York: Weinheim. p. 215-240.
Guntert M, Bruning J, Emberger R, Hopp R, Kopsel M, Surburg H & Werkhoff P. 1992.
Thermally degraded thiamin: a potent source of interesting flavor compounds. In: Teranishi, R., Takeoka, G. R. & Guntert, M., editors. Flavor Precursors: Thermal and Enzymatic Conversions. Washington, D.C.: ACS. p. 140-163.
Guntert M, Bruning J, Emberger R, Kopsel M, Kuhn W, Thielmann T & Werkhoff P. 1990.
Identification and formation of some selected sulfur-containing flavor compounds in various meat model systems. Journal of Agricultural and Food Chemistry 38:2027-2041.
Haleva-Toledo E, Naim M, Zehavi U & Rouseff RL. 1997. 4-hydroxy-2,5-dimethyl-3(2H)-
furanone formation in buffers and model solutions of citrus juice. Journal of Agricultural and Food Chemistry 45(4):1314-1319.
Haleva-Toledo E, Naim M, Zehavi U & Rouseff RL. 1999. Formation of alpha-terpineol in citrus
juices, model and buffer solutions. Journal of Food Science 64(5):838-841. Hartman GJ, Carlin JT, Scheide JD & Ho C-T. 1984a. Volatile products formed from the thermal
degradation of thiamin at high and low moisture levels. Journal of Agricultural and Food Chemistry 32:1015-1018.
Hartman GJ, Scheide JD & Ho C-T. 1984b. Effect of water activity on the major volatiles
produced in a model system approximating cooked meat. Journal of Food Science 49:607-613.
Heems D, Luck G, Fraudeau C & Verette E. 1998. Fully automated precolumn derivatization,
on-line dialysis and high performance liquid chromatographic analysis of amino acids in food, beverages and feedstuff. Journal of Chromatography A 798:9-17.
Hofmann T & Schieberle P. 1998. Quantitative model studies on the effectiveness of different
precursor systems in the formation of the intense food odorants 2-furfurylthiol and 2-methyl-3-furanthiol. Journal of Agricultural and Food Chemistry 46:235-241.
Hofmann T & Schieberle P. 2002. Chemical interactions between odor-active thiols and
melanoidins involved in the aroma staling of coffee beverages. Journal of Agricultural and Food Chemistry 50:319-326.
103

Hofmann T, Schieberle P & Grosch W. 1996. Model studies on the oxidative stability of odor-active thiols occurring in food flavors. Journal of Agricultural and Food Chemistry 44:251-255.
Hognadottir A & Rouseff RL. 2003. Identification of aroma active compounds in orange essence
oil using gas chromatography–olfactometry and gas chromatography–mass spectrometry. Journal of Chromatography A 998:201-211.
Holscher W & Steinhart H. 1995. Aroma compounds in green coffee. Developments in Food
Science 37A:785-803. Jansen HE, Strating J & Westra WM. 1971. Gas-chromatographic determination of traces of
hydrogen sulfide and alkane thiols in beer. Journal of the Institute of Brewing 77:154. Jella P, Rouseff R, Goodner K & Widmer W. 1998. Determination of key flavor components in
methylene chloride extracts from processed grapefruit juice. Journal of Agricultural and Food Chemistry 46:242-247.
Jezussek M, Juliano BO & Schieberle P. 2002. Comparison of key aroma compounds in cooked
brown rice varieties based on aroma extract dilution analyses. Journal of Agricultural and Food Chemistry 50:1101-1105.
Jhoo L-W, Lin M-C, Sang S, Cheng X, Zhu N, Stark RE & Ho C-T. 2002. Characterization of 2-
methyl-4-amino-5-(2-methyl-3-furylthiomethyl)pyrimidine from thermal degradation of thiamin. Journal of Agricultural and Food Chemistry 50(50):4055-4058.
Jordan MJ, Goodner KL, Castillo M & Laencina J. 2005. Comparison of two headspace solid
phase microextraction fibres for the detection of volatile chemical concentration changes due to industrial processing of orange juice. Journal of the Science of Food and Agriculture 85(6):1065-1071.
Kanasawud P & Crouzet JC. 1990. Mechanism of formation of volatile compounds by thermal
degradation of carotenoids in aqueous medium. 1. beta-carotene degradation. Journal of Agricultural and Food Chemistry 38:237-243.
Kerscher R & Grosch W. 1998. Quantification of 2-methyl-3-furanthiol, 2-furfurylthiol, 3-
mercapto-2-pentanone, and 2-mercapto-3-pentanone in heated meat. Journal of Agricultural and Food Chemistry 46:1954-1958.
Kimpe ND & Keppens M. 1996. Novel syntheses of the major flavor components of bread and
cooked rice. Journal of Agricultural and Food Chemistry 44:1515-1519. Klim M & Nagy S. 1992. Analysis of orange juice volatiles: comparison of extraction with Freon
113 and ethyl acetate. Proceedings of the Florida State Horticultural Society 105:110-112.
104

Krammer G, Winterhalter P, Schwab M & Schreier P. 1991. Glycosidically bound aroma compounds in the fruits of Prunus Species: apricot (P. armeniaca, L.), peach (P. persica, L.), yellow plum (P. domestica, L. ssp. Syriaca). Journal of Agricultural and Food Chemistry 39:778-781.
Kutty V, Braddock RJ & Sadler GD. 1994. Oxidation of d-limonene in presence of low density
polyethylene. J. Food Science 59(2):402-405. Le Guen S, Prost C & Demaimay M. 2000. Critical comparison of three olfactometric methods
for the identification of the most potent odorants in cooked mussels (Mytilus edulis). Journal of Agricultural and Food Chemistry 48:1307-1314.
Leffingwell JC. 2002. Chirality & odour perception: the p-menthen-8-thiols. Lermusieau G, Bulens M & Collin S. 2001. Use of GC-Olfactometry to identify the hop aromatic
compounds in beer. Journal of Agricultural and Food Chemistry 49:3867-3874. Lin J & Rouseff RL. 2001. Characterization of aroma-impact compounds in cold-pressed
grapefruit oil using time-intensity GC-olfactometry and GC-MS. Flavour and Fragrance Journal 16(6):457-463.
Lin J, Rouseff RL, Barros S & Naim M. 2002. Aroma composition changes in early season
grapefruit juice produced from thermal concentration. Journal of Agricultural and Food Chemistry 50(4):813-819.
Lindsay RC. 1985. Flavors. In: Fennema, O. R., editor). Food Chemistry Second Edition Revised
and Expanded. New York: Marcel Dekker, Inc. p. 585-627. Lopez R, Ezpeleta E, Sanchez I, Cacho J & Ferreira V. 2004. Analysis of the aroma intensities of
volatile compounds released from mild acid hydrolysates of odourless precursors extracted from Tempranillo and Grenache grapes using gas chromatography-olfactometry. Food Chemistry 88(1):95-103.
Lune FSv, Nijssen LM & Linssen JPH. 1997. Absorption of methanol and toluene by polyester-
based bottles. Packaging Technology and Science 10:221-227. Maicas S & Mateo JJ. 2005. Hydrolysis of terpenyl glycosides in grape juice and other fruit
juices: a review. Applied Microbiology and Biotechnology 67:322-335. Marcotte M, Stewart B & Fustier P. 1998. Abused thermal treatment impact on degradation
products of chilled pasteurized orange juice. Journal of Agricultural and Food Chemistry 46:1991-1996.
Marin AB, Acree TE & Barnard J. 1988. Variation in odor detection thresholds determined by
CharmAnalysis. Chemical Senses 13(3):435-444.
105

Marin AB, Acree TE, Hotchkiss JH & Nagy S. 1992. Gas chromatographic-olfactometry of orange juice to assess the effects of plastic polymers on aroma character. Journal of Agricultural and Food Chemistry 40:650-654.
Marinetti GV. 1962. Chromatographic separation, identification, and analysis of phosphatides.
Journal of Lipid Research 3(1):1-20. Masanetz C, Guth H & Grosch W. 1998. Fishy and hay-like off-flavours of dry spinach. Z
Lebensm Unters Forsch A 206:108-113. Meynier A & Mottram DS. 1995. The effect of pH on the formation of volatile compounds in
meat-related model systems. Food Chemistry 52(4):361-366. Milo C & Reineccius GA. 1997. Identification and quantification of potent odorants in regular-
fat and low-fat mild cheddar cheese. Journal of Agricultural and Food Chemistry 45:3590-3594.
Mistry BS, Reineccius T & Olson LK. 1997. Gas chromatography-olfactometry for the
determination of key odorants in foods. In: Marsili, R., editor). Techniques for Analyzing Food Aroma. NY: Marcel Dekker. p. 265-292.
Montavon P, Duruz E, Rumo G & Pratz G. 2003. Evolution of green coffee protein profiles with
maturation and relationship to coffee cup quality. Journal of Agricultural and Food Chemistry 51:2328-2334.
Moshonas MG & Shaw PE. 1989. Flavor evaluation and volatile flavor constituents of stored
aseptically packaged orange juice. Journal of Food Science 54(1):82-85. Mottram DS. 1991. Meat. In: Maarse, H., editor). Volatile Compounds in Foods and Beverages.
New York: Marcel Dekker, Inc. p. 107-177. Mottram DS. 1994. Flavor compounds formed during the Maillard reaction. In: Parliment, T. H.,
Morello, M. J. & McGorrin, R. J., editors. Thermally Generated Flavors: Maillard, Microwave, and Extrusion Processes. Washington, D.C.: ACS. p. 104-126.
Mottram DS & Leseigneur A. 1990. The effect of pH on the formation of aroma volatiles in
meat-like Maillard systems. In: Bessiere, Y. & Thomas, A. F., editors. Flavour Science and Technology. NY: John Wiley & Sons. p. 121-124.
Mottram DS & Wedzicha B. 2002. Suggested mechanism for suggested mechanism for the
formation of acrylamide the formation of acrylamide in foods. Joint Institute for Food Safety and Applied Nutrition, University of Maryland.
106

Mottram DS & Whitfield FB. 1994. Aroma volatiles from meatlike Maillard systems. In: Parliment, T. H., Morello, M. J. & McGorrin, R. J., editors. Thermally Generated Flavors: Maillard, Microwave, and Extrusion Processes. Washington, D.C.: ACS. p. 180-191.
Mulley EA, Stumbo CR & Hunting WM. 1975. Kinetics of thiamine degradation by heat. Effect
of pH and form of the vitamin on its rate of destruction. Journal of Food Science 40:989-992.
Munch P & Schieberle P. 1998. Quantitative studies on the formation of key odorants in
thermally treated yeast extracts using stable isotope dilution assays. Journal of Agricultural and Food Chemistry 46:4695-4701.
Nagy S & Attaway JA. 1980. Nutrients and nutrition of citrus fruits. In: Comstock, M. J., editor).
Citrus Nutrition and Quality. Washington, D. C.: American Chemical Society. p. 1-24. Naim M, Schutz O, Zehavi U, Rouseff RL & HalevaToledo E. 1997. Effects of orange juice
fortification with thiols on p-vinylguaiacol formation, ascorbic-acid degradation, browning, and acceptance during pasteurization and storage under moderate conditions. Journal of Agricultural and Food Chemistry 45(5):1861-1867.
Naim M, Striem BJ, Kanner J & Peleg H. 1988. Potential of ferulic acid as a precursor to off-
flavors in stored orange juice. Journal of Food Science 53(2):500-503. Nielsen GS & Poll L. 2004. Determination of odor active aroma compounds in freshly cut leek
(Allium ampeloprasum Var. Bulga) and in long-term stored frozen unblanched and blanched leek slices by gas chromatography olfactometry analysis. Journal of Agricultural and Food Chemistry 52(6):1642-1646.
Papken AM, Dechart HM & Guerster D. 1999. Investigations on the origin of carvone in orange
juices as an off-flavour component. Fruit Processing 9(9):338-341. Parliment TH. 1986. A new technique for GLC sample preparation using a novel extraction
device. Perfumer & Flavorist 11(1):1-8. Peleg H, Naim M, Zehavi U, Rouseff RL & Nagy S. 1992. Pathways of 4-vinylguaiacol
formation from ferulic acid in model solutions of orange juice. Journal of Agricultural and Food Chemistry 40(5):764-767.
Perez-Lopez AJ, Saura D, Lorente J & Carbonell-Barrachina AA. 2006. Limonene, linalool,
alpha-terpineol, and terpinen-4-ol as quality control parameters in mandarin juice processing. European Food Research and Technology 222(3-4):281-285.
Petersen MA, Tønder D & Polla L. 1998. Comparison of normal and accelerated storage of
commercial orange juice--changes in flavour and content of volatile compounds. Food Quality and Preference 9(1-2):43-51.
107

Pickenhagen W, Velluz A, Passerat JP & Ohloff G. 1981. Estimation of 2,5-dimethyl-4-hydroxy-3(2H)-furanone (Furaneol) in cultivated and wild strawberries, pineapples and mangoes. Journal of Agricultural and Food Chemistry 32:1132-1134.
Plotto A, Margaria CA, Goodner KL, Goodrich R & Baldwin EA. 2004. Odour and flavor
thresholds for key aroma components in an orange juice matrix: terpenes and aldehydes. Flavour and Fragrance Journal 19(6):491-498.
Pollack SL, Lin B-H & Allshouse J. 2003. Characteristics of U.S. orange consumption.
Electronic Outlook Report from the Economic Research Service. p. 1-17. Pollien P, Ott A, Montigon F, Baumgartner M, Munoz-Box R & Chaintreau A. 1997.
Hyphenated headspace-gas chromatography-sniffing technique: screening of impact odorants and quantitative aromagram comparisons. Journal of Agricultural and Food Chemistry 45: 2630-2637.
Ramaswamy H, Ghazala S & van de Voort F. 1990. Degradation kinetics of thiamine in aqueous
systems at high temperatures. Journal of the Canadian Institute of Food Science and Technology 23(2/3):125-130.
Rega B, Fournier N & Guichard E. 2003. Solid phase microextraction (SPME) of orange juice
flavor: odor representativeness by direct gas chromatography olfactometry (D-GC-O). Journal of Agricultural and Food Chemistry 51:7092-7099.
Roberts DD, Pollien P & Milo C. 2000. Solid-phase microextraction method development for
headspace analysis of volatile flavor compounds. Journal of Agricultural and Food Chemistry 48:2430-2437.
Ros-Chumillas M, Belissario Y, Iguaz An & Lo´pez A. 2007. Quality and shelf life of orange
juice aseptically packaged in PET bottles. Journal of Food Engineering 79:234-242. Rouseff R, Bazemore R, Goodner K & Naim M. 2001a. GC-olfactometry with solid phase
microextraction of aroma volatiles from heated and unheated orange juice. Advances in Experimental Medicine and Biology 488:101-112.
Rouseff R, Jella P, Bazemore R & Yang J. 2001b. Aroma active internal standards for gas
chromatography-olfactometry of grapefruit juices. In: Leland, J. V., Schieberle, P., Buettner, A. & Acree, T. E., editors. ACS Symposium Sereis 782 GC-O The State of the Art. Washington D.C.: ACS. p. 73-87.
Rymal KS, Wolford RW, Ahmed EM & Dennison RA. 1968. Changes in volatile flavor
constituents of canned single-srength juice as influenced by storage temperature. Food Technology 22:96-99.
108

Schieberle P & Buettner A. 2001. Characterization of key aroma compounds in fresh and cooked clementine juices (Citrus reticulata blanco cv. clementine), as well as in canned satsuma segments (Citrus reticulata blanco var. unshiu). Abstracts of Papers, 222nd ACS National Meeting, Chicago, IL, United States, August 26-30, 2001:AGFD-042.
Schmidt RH, Goodrich RM, Sims CA & Parish ME. 2005. Fresh juice processing GMPs. Food
Science and Human Nutrition department, Florida Cooperative Extension Service, Institute of Food and Agricultural Sciences, University of Florida.
Spreen TH & Muraro R. 2000. The world market for citrus products and risk management for
Florida citrus growers. Department of Food and Resource Economics, Florida Cooperative Extension Service, Institute of Food and Agricultural Sciences, University of Florida, Gainesville, FL
Stevens SS. 1960. The psychophysics of sensory function. American Scientist 48:226-253. Stevens SS. 1961. To honor Fechner and repeal his law. Science 133:80-86. Stewart I & Wheaton TA. 1972. Carotenoids in citrus : their accumulation induced by ethylene.
Journal of Agricultural and Food Chemistry 20(2). Swanson K, Petran R & Hanlin J. 2001. Culture methods for enumeration of microorganisms. In:
Downes, F. & Ito, K., editors. Compendium of Methods for the Microbiological Examination of Foods. Washington, DC.: American Public Health Assn.
Tatum JH, Nagy S & Berry RE. 1975. Degradation products formed in canned single-strength
orange juice during storage. Journal of Food Science 40:707-709. Ting SV & Rouseff RL. 1981. B-vitamins in citrus juices. Proceedings of the International
Society of Citriculture 2:905-908. Tonder D, Peterson MA, Poll L & Olsen CE. 1998. Discrimination between freshly made and
stored reconstituted orange juice using GC odour profiling and aroma values. Food Chemistry 61(1):223-229.
Tressl R & Silwar R. 1981. Investigation of sulfur-containing components in roasted coffee.
Journal of Agricultural and Food Chemistry 29:1078-1082. USDA. 1983. United States standards for grades of orange juice. In: Agriculture, D. O., editor).
USDA. 2006a. Fruit and tree nuts yearbook - summary: October 2006, ERS-FTS-2006. Washington D.C.: Economic Research Service, U.S. Department of Agriculture.
USDA. 2006b. Situation and outlook for citrus. 2006. Valim MF, Rouseff Russell L & Lin J. 2003. Gas chromatographic-olfactometric
characterization of aroma compounds in two types of cashew apple nectar. Journal of Agricultural and Food Chemistry 51(4):1010-1015.
109

110
van der Linde LM, van Dort JM, De Valois P, Boelens H & De Rijke D. 1979. Volatile components from thermally degraded thiamine. In: Land, D. G. & Nursten, H. E., editors. Progress in Flavor Research. London: Applied Science. p. 219-224.
van Loon WAM, Linssen JPH, Legger A, Posthumus MA & Voragen AGJ. 2005. Identification
and olfactometry of french fries flavor extracted at mouth conditions. Food Chemistry 90(3):417-425.
van Willige RWG, Linssen JPH, Legger-Huysman A & Voragen AGJ. 2003. Influence of
flavour absorption by food-packaging materials (low-density polyethylene, polycarbonate and polyethylene terephthalate) on taste perception of a model solution and orange juice. Food Additives and Contaminants 20(1):84-91.
Varlet V, Knockaert C, Prost C & Serot T. 2006. Comparison of odor-active volatile compounds
of fresh and smoked salmon. Journal of Agricultural and Food Chemistry 54(9):3391-3401.
Walsh M, Rouseff R & Naim M. 1997. Determination of Furaneol and p-vinylguaiacol in orange
juice employing differential UV wavelength and fluoresence detection with a unified solid phase extraction. Journal of Agricultural and Food Chemistry 45(4):1320-1324.
Werkhoff P, Bruning J, Emberger R, Guntert M, Kopsel M, Kuhn W & Surburg H. 1990.
Isolation and characterization of volatile sulfur-containing meat flavor components in model systems. Journal of Agricultural and Food Chemistry 38:777-791.
Whitfield FB & Mottram DS. 1999. Investigation of the reaction between 4-hydroxy-5-methyl-
3(2H)-furanone and cysteine or hydrogen sulfide at pH 4.5. Journal of Agricultural and Food Chemistry 47:1626-1634.
Williamson JG & Jackson LK. 1993. Fact sheet HS-25: sweet orange. University of Florida,
Institute of Food and Agricultural Sciences (UF/IFAS).

BIOGRAPHICAL SKETCH
J. Glen Dreher grew up in West Palm Beach, FL. He attended Purdue University and
graduated in 1997 with a B.S. in Food Science. In spring 1999 he entered graduate school at the
University of Florida in food science. He spent a year in Gainesville, FL taking course work and
then relocated to Winter Haven, FL for his doctoral research at the Citrus Research and
Education Center in Lake Alfred, FL. He took a job at Jim Beam Brands in Clermont, KY
February, 2003 working in new product development. He has since completed his Ph.D. in
2007.
111