to download our 2015 annual report
TRANSCRIPT

2015 Annual Report 1

Who We ArePHINMA is a proudly Filipino conglomerate that seeks to make lives better and build the nation through successfully run and profitable businesses while remaining consistent with our core values of Integrity, Patriotism, Competence and Professionalism.
PHINMA Group’s Mission StatementThe PHINMA Group’s Mission is to help build our Nation through competitive and well-managed business enterprises that enable FIlipinos to attain a better quality of life. With professional and effective management as our distinctive edge, we aim to give communities, not only in the Philippines but wherever else we might find the need, improved access to the essentials of a dignified life. In the pursuit of our Mission, we look to our tradition, our experience, our reputation, and above all, our people, as the principal factors that will enable us to achieve our lofty goals.
The PHINMA Group will demonstrate that private business can mutually serve the needs of society and the aspirations of shareholders.
TABLE OF CONTENTSFinancial Highlights 1Message to Shareholders 2Business Review Energy 8 Education 12 Housing 16 Steel Products 20 Hotels 22 Strategic Consulting 24Board of Directors 26Executive Officers 30Corporate Governance 32Corporate Social Responsibility 36Financial Report 40
2015 Annual Report 1
Why Invest in PHINMA
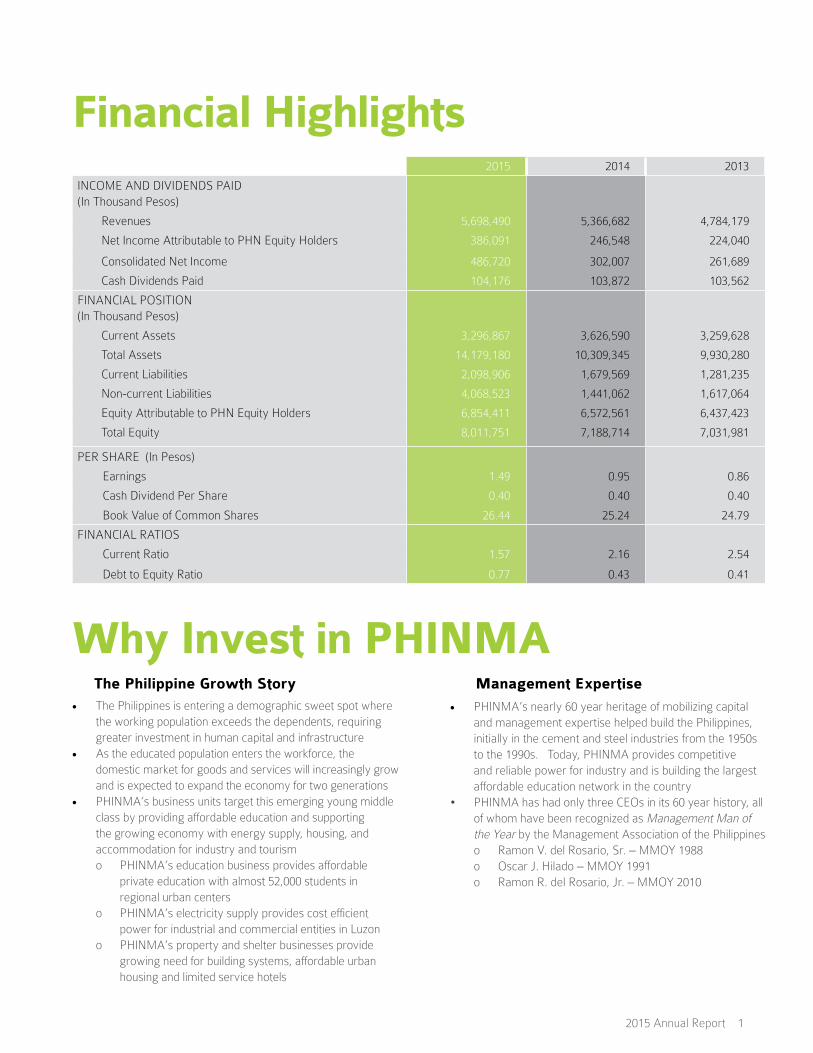
2015 2014 2013
INCOME AND DIVIDENDS PAID (In Thousand Pesos)
Revenues 5,698,490 5,366,682 4,784,179
Net Income Attributable to PHN Equity Holders 386,091 246,548 224,040
Consolidated Net Income 486,720 302,007 261,689
Cash Dividends Paid 104,176 103,872 103,562
FINANCIAL POSITION (In Thousand Pesos)
Current Assets 3,296,867 3,626,590 3,259,628
Total Assets 14,179,180 10,309,345 9,930,280
Current Liabilities 2,098,906 1,679,569 1,281,235
Non-current Liabilities 4,068,523 1,441,062 1,617,064
Equity Attributable to PHN Equity Holders 6,854,411 6,572,561 6,437,423
Total Equity 8,011,751 7,188,714 7,031,981
PER SHARE (In Pesos)
Earnings 1.49 0.95 0.86
Cash Dividend Per Share 0.40 0.40 0.40
Book Value of Common Shares 26.44 25.24 24.79
FINANCIAL RATIOS
Current Ratio 1.57 2.16 2.54
Debt to Equity Ratio 0.77 0.43 0.41
Financial Highlights
• PHINMA’s nearly 60 year heritage of mobilizing capital and management expertise helped build the Philippines, initially in the cement and steel industries from the 1950s to the 1990s. Today, PHINMA provides competitive and reliable power for industry and is building the largest affordable education network in the country
• PHINMA has had only three CEOs in its 60 year history, all of whom have been recognized as Management Man of the Year by the Management Association of the Philippines
o Ramon V. del Rosario, Sr. – MMOY 1988 o Oscar J. Hilado – MMOY 1991 o Ramon R. del Rosario, Jr. – MMOY 2010
Management Expertise • The Philippines is entering a demographic sweet spot where
the working population exceeds the dependents, requiring greater investment in human capital and infrastructure
• As the educated population enters the workforce, the domestic market for goods and services will increasingly grow and is expected to expand the economy for two generations
• PHINMA’s business units target this emerging young middle class by providing affordable education and supporting the growing economy with energy supply, housing, and accommodation for industry and tourism
o PHINMA’s education business provides affordable private education with almost 52,000 students in regional urban centers
o PHINMA’s electricity supply provides cost efficient power for industrial and commercial entities in Luzon
o PHINMA’s property and shelter businesses provide growing need for building systems, affordable urban housing and limited service hotels
The Philippine Growth Story

2 PHINMA CORPORATION
“We reaffirm our belief that through professionally managed business we can make life better.”

2015 Annual Report 3
We remain committedto improveshareholdervalue.Dear Shareholders,
In 2015, the Philippine economy posted growth of 5.8%, still one of the best performances in the region although lower than the previous year. Growth in the agriculture and export sectors was challenged due to effects of El Niño and the global economy respectively. This was offset by strong capital formation, as private and public investment growth more than doubled to 13.6%. Government spending notably increased 9.4% compared to only 1.7% in 2014, led by public construction in particular which grew 20.6% in 2015. Imports, which declined the previous year due to port congestion issues, recovered to post an 11.9% growth rate. Inflation declined to 1.4% from 4.1% in 2014 due to stable food prices and declining oil prices. The local stock market index, after reaching an all time high of 8,127 in April 2015, declined steadily on concerns attributed to the
economic situation in China, interest rate increases in the US, and upcoming Philippine national elections, to close the year just below 7,000 or 4% down from the start of 2015.
In this environment, consolidated revenue of your Company amounted to P5.7 billion in 2015, an increase of 5.7% over the P5.4 billion posted in the previous year due for the most part to increased education revenue from an acquisition by our education group. Consolidated net income of your Company amounted to P486.7 million, an increase of 61% over the net income of P302.0 million posted in the previous year. Increased income contribution from our schools, our energy group, and our steel roofing business offset a decrease in income contribution from our strategic consulting business. Net income attributable to shareholders of the parent amounted to P386.1 million for the year.

4 PHINMA CORPORATION
for energy in line with the robust economic growth as well as lower average prices for power purchases on the Wholesale Electricity Spot Market (WESM). Energy sales of the company’s Energy Supply group increased 30% to 2,216 GWh in 2015 while the Wind Energy group posted sales of 108 GWh from a full years’ operation of the San Lorenzo Guimaras wind farm. Consolidated net income of TA Oil increased to P906 million from P180 million in 2014, of which P240.6 million was equitized by the Company. During the year, TA Oil affiliate South Luzon Thermal Energy Corporation (SLTEC) commenced commercial operation of its first 135 MW clean coal-fired power plant, bringing the total generation capacity of the company to 455 MW in 2015. TA Oil, also during the year, closed the acquisition of three power barges totaling 96 MW from the Power Sector Assets and Liabilities Management Corporation (PSALM). In December 2015, TA Oil subsidiary Trans-Asia Renewable Energy Corporation (TAREC) received from the Energy Regulatory Commission (ERC) a certificate entitling its 54 MW wind farm in San Lorenzo, Guimaras to a Feed-In Tariff rate of P7.40 per KWh.
Your Company’s steel products subsidiary, Union Galvasteel Corporation (UGC), was challenged in 2015 by a surge in imports from the softening of global steel prices as well as a series of typhoons in Northern Luzon in the last quarter of the year. UGC posted revenues of P3.7 billion in 2015, approximately the same level as the previous year. UGC however realized net income of P158.5 million in 2015, a modest increase of 9% over the previous year due to better margins from sales of higher value polyurethane (PU) products used in temperature controlled facilities. In 2015, UGC completed the expansion of its Davao PU line, supplementing its existing PU line in Calamba Laguna.
In 2015, strong growth in the economy and low interest rates encouraged condominium unit sales in a competitive Metro Manila market for affordable units. PHINMA Property Holdings Corporation (PHINMA Properties), your Company’s affordable housing affiliate
2015 Highlights
In 2015, your Company strengthened its education business by acquiring and thereafter transferring to PHINMA Education Holdings, Inc. (PHINMA Education) Southwestern University (SWU), a premier school in Cebu City that brings to PHINMA its strong brand and tradition of excellence in medical and health sciences education. Income for the now-five schools in the network amounted to a total of P407.2 million for 2015, an increase of 112% from P192.0 million in 2014. Total enrollment increased to 51,351 in 2015, due to the acquisition of SWU as well as a 14% increase in enrollment for the existing four schools. In 2015, University of Pangasinan (PHINMA UPang) opened its satellite campus in Urdaneta City, building on the success of similar satellite campuses for PHINMA Cagayan de Oro College and PHINMA Araullo University. PHINMA Education also continued preparations for the first batch of senior high school students in relation to the Government’s K12 program, designing new Senior High School modules based on its existing Active Learning System. In 2015, your Company also completed construction of its niche Senior High School in Manila, Career Academy Asia, which also offers advanced diplomas and course credits in areas including fashion, multimedia design, and hospitality and tourism management. PHINMA Education also focused on improving retention rates, expanding its Student Success Program, which addresses issues such as student adjustment and integration, beyond freshman year.
The PHINMA Education schools continued to focus on academic quality as evidenced in student performance in board examinations. PHINMA Education schools had 17 board exam top placers in 2015, in studies including Secondary Education, Civil and Electrical Engineering, Nursing, Criminology, Medicine, Dentistry, Social Work, and Veterinary Medicine.
Trans-Asia Oil and Energy Development Corporation (TA Oil), your Company’s affiliate in the energy sector, benefitted in 2015 from increased demand
2015 Annual Report 5
offered buyers options for larger units and sold more premier units at international roadshows. Equity in net earnings of PHINMA Properties increased 66% from P12.8 million in 2014 to P21.3 million in 2015. In 2015, PHINMA Properties initiated its expansion into newly emerging urban centers outside Metro Manila with the launch of Arezzo Place Davao and the establishment of the company’s branch sales office in Davao City.
Asian Plaza, Inc., a subsidiary of your Company, invested in a 21% equity stake in Microtel Development Corporation (MDC) in 2015. MDC is the operator of 13 Microtel properties in the Philippines, including Microtel Mall of Asia, where your Company owns a 23.8% equity stake. Net Income of Microtel Mall of Asia for 2015 was P18 million.
2015 was a year of transition as Fuld & Co. repositioned to move into higher value strategic consulting services which required a realignment of staff and an overhaul of the firm’s sales and marketing practice. Revenue of Fuld & Co. and Fuld Philippines Inc. (the Fuld group) decreased to P389 million from P535 million in 2014 and the Fuld group posted a net loss of P66 million in 2015. Fuld looks forward to renewed growth as it repositions to move into higher value consulting services.
PHINMA Corporation ended 2015 with a strong balance sheet, with total assets of P14 billion and a current ratio and debt-to-equity ratio of 1.57:1 and 0.77:1, respectively. Your Company also has funds available for investment, should attractive opportunities arise.

6 PHINMA CORPORATION
We are furthermore pleased to report that, given the favorable results for the year, your Board has declared a cash dividend of P0.40 per share payable on March 31, 2016.
2016 Outlook
For 2016, the Philippine economy is expected to continue its strong fourth quarter 2015 performance, leading to a full year Philippine economic growth rate of at least 6.0%. Public construction will remain robust as government targets this year for upgrading of more national roads and bridges. Exports are expected to recover with the pick-up in the global economy. Continued low oil prices and low inflation, further supported by election related spending,
should lead to strong private consumption, to hopefully offset any concerns arising from uncertainty over the upcoming national elections.
PHINMA Education, in relation to the Department of Education’s K12 education reform, completes preparations for the entry this year of the first batch of senior high school students across its five schools. Your Company will also complete construction of the Cebu and Davao branches of Career Academy Asia, which together with the Manila branch will begin accepting senior high school students later this year. Rather than a challenge, PHINMA Education views K12 as an opportunity to enter new markets and increase system wide enrollment in the long term. Although PHINMA Education is still integrating
2015 Annual Report 7
This year, Coral Way City Hotel Corporation, an investee of your Company and owner of Microtel by Wyndham in Mall of Asia, through its wholly owned subsidiary Krypton Esplanade Hotel Corporation, is scheduled to complete construction on its new TRYP by Wyndham hotel. The new select service 195-room hotel in the bay area will complement Coral Way’s existing 150-room hotel by targeting a younger and trendier clientele.
Your Company remains committed not only to its customers but also to its suppliers, business partners, and creditors, all of whom are invaluable stakeholders in your Company’s mission to provide reliable and renewable power, quality education, clean and comfortable hotel rooms, steel roofing, and affordable homes. We reaffirm our belief that through professionally managed business we can make life better.
We would like to also express our gratitude to our employees and management teams who are our partners in our mission to make life better in the country. It is our conviction that good business leads to good returns. To our shareholders who have always provided steadfast support, we maintain our commitment to improve shareholder values.
OSCAR J. HILADOChairman of the Board
RAMON R. DEL ROSARIO, JR.President and Chief Executive Officer
the newly acquired Southwestern University into its network, the company continues to seek more schools where it feels it can make significant contributions to improve education quality and value.
In February 2016, TA Oil affiliate SLTEC commenced commercial operation of its second 135 MW clean coal-fired power plant. For the remainder of the year, TA Oil will complete the rehabilitation of the three power barges with total capacity of 96 MW acquired from the PSALM. The additional base load and peaking generation capacity of the company enables the company to service a larger client base moving forward as well as provide for the full range of energy needs of its clients. With the expected rehabilitation of the power barges within the year, the total generation capacity of TA Oil should increase further to a total 626 MW by end-2016. Beyond 2016, TA Oil looks forward to the 12 MW project expansion of affiliate Maibarara Geothermal, Inc., scheduled for commercial operation by the third quarter of 2017.
In January 2016, the board of TA Oil approved a proposed change in corporate name to PHINMA Energy Corporation, reflecting PHINMA’s reputation for integrity and professionalism. Moving forward, the rebranded PHINMA Energy Corporation will continue to develop more coal, wind, and geothermal projects, with an overall strategy to double existing generation capacity to 1,200 MW over the next five years.
After expanding its PU line in Davao last year, UGC will commission its expanded PU line in Calamba, Laguna by the first quarter of 2016. These projects will enable the company to be a major player in the PU industry and a market leader in this fast growing segment.
For 2016, in line with the company’s move to emerging urban centers, PHINMA Properties looks forward to a new tropical-themed Hacienda Balai condominium project in Sta. Rosa, Laguna. The project is located in one of the fastest-growing cities in Southern Luzon, and is expected to start selling by the first quarter of 2016. The company is also exploring projects in Cebu, Naga, Lipa, Cagayan de Oro, and Bulacan.

8 PHINMA CORPORATION
PHINMA Corporation, through its affiliate Trans-Asia Oil and Energy Development Corporation (TA Oil), provides sustainable and reliable power to its customers.
In 2015, demand for energy increased in line with continued robust growth in the economy. High plant availabilities led to lower average prices on the Wholesale Electricity Spot Market (WESM), which benefitted power purchases of the company’s Electricity Supply (ES) group. Energy sales volume of the ES group increased 30% to 2,216 GWh over the year. The Wind Energy group posted energy sales of 108 GWh in 2015 from a full year’s operation of the San Lorenzo Guimaras wind farm. Consolidated net income correspondingly increased to P906 million in 2015 from P180 million in the previous year. As of December 31, 2015, total consolidated assets stood at P18.7 billion, total liabilities at P10.7 billion and total equity at P8.0 billion.
In April 2015, TA Oil affiliate South Luzon Thermal Energy Corporation (SLTEC) commenced commercial operation
Business Review | ENERGY
Generating sustainable and reliable power
of its first 135 MW clean coal-fired power plant. SLTEC is TA Oil’s joint venture with Ayala Corporation’s energy arm, AC Energy Holdings Corporation. Subsequently, in February 2016, SLTEC’s second 135-MW clean coal plant passed its performance test and commenced commercial operations. SLTEC units 1 and 2, the first major baseload capacity expansion of TA Oil, significantly reduce the company’s reliance on WESM baseload power.
In July 2015, TA Oil closed the acquisition of Power Barges 101, 102, and 103 from the Power Sector Assets and Liabilities Management Corporation (PSALM). The power barges, once rehabilitated, will provide the company additional peak load generation capacity of up to 96 MW, to complement the new base load generation capacity of the company.
The new base load and additional peaking generation capacity of TA Oil enables the company to provide for the full range of energy needs of its clients as well as service a larger client base moving forward. All told, the additional baseload capacity from

2015 Annual Report 9
P 906MCONSOLIDATED NET INCOME
2014 2015
P 180M
P 906MSLTEC unit 1 resulted in a net total capacity increase from 280 MW in 2014 to 455 MW in 2015. With the commercial operation of SLTEC unit 2 last February 2016 and the expected rehabilitation of the three power barges within the year, the total generation capacity of TA Oil will increase further to 626 MW by end-2016.
In line with the company’s increase in capacity, TA Oil also continued to grow its customer base. In 2015, the company signed a contract with Manila Water Company, Inc. for the supply of power to five pumping stations. During the year, TA Oil also signed energy supply contracts with clients including Amwire, Mondelez, and Asian Transmission Corporation.

10 PHINMA CORPORATION
TA Oil also remains strongly committed toward renewable energy. In December 2015, TA Oil subsidiary Trans-Asia Renewable Energy Corporation (TAREC) received a certificate of compliance from the Energy Regulatory Commission for its 54 MW wind farm in San Lorenzo, Guimaras. The certificate entitles the Guimaras project to a Feed-In Tariff rate of P7.40 per kilowatt hour for 20 years from the start of commercial operations last December 2014. In 2015 the San Lorenzo wind project sold 109 GWh of energy to the grid, posted plant availability of almost 98%, and achieved an average capacity factor of 23%. The project also reduces greenhouse emissions estimated at over 65,000 tons of CO2 per year compared to nonrenewable power plants and also supplements the energy requirements of Panay, reducing the island’s reliance on power from Negros, and improving reliability of the Visayas grid.
Also in renewable energy, in October 2015 the Department of Energy (DOE) issued a confirmation of commerciality for the 12 MW expansion project of
“The rebranded PHINMA Energy Corporation moving forward will expand its energy portfolio, ensure efficient and reliable supply of power to a growing customer base, support continued economic growth, and pursue the PHINMA mission of making lives better.”
Maibarara Geothermal Inc. (MGI) located adjacent to MGI’s existing 20 MW plant. TA Oil owns a 25% stake in MGI. MGI has already awarded the EPC contract for the 12 MW expansion, which is scheduled for commercial operation by the third quarter of 2017. In November 2015, TA Oil and Basic Energy Corporation signed a joint operating agreement on Mabini Geothermal Service Contract Number 8 following the approval by the DOE of the assignment of a 25% interest in the contract to TA Oil. TA Oil and Basic Energy hope to drill the first geothermal well in Mabini in the first half of 2016.
On the Oil & Gas front, in August 2015 TA Oil subsidiary Trans-Asia Petroleum Corporation (TA Pet) disclosed the results of the drilling of the Hawkeye-1 well at Service Contract (SC) 55 in offshore Southwest Palawan. TA Pet has a 6.8% interest in SC 55 through subsidiary Palawan 55 Exploration & Production Corporation. Although the drilling confirmed the presence of a petroleum system in the area, the hydrocarbons inferred by the well were not found to

2015 Annual Report 11
be of economic significance. The operator of SC55 subsequently applied with the DOE for a two year moratorium for further obligations under the service contract. Moving forward, TA Oil continues to develop projects to address the growing power requirements of the country. Projects under long term development include two 300-MW circulating fluidized bed (CFB) coal-fired power plants in Sual, Pangasinan as well as a new 600 MW coal-fired plant in Batangas. The Department of Energy has granted the company clearance to undertake grid impact studies for both projects, the first stage in determining feasibility. On the renewable energy side, TA Oil has also received approval from the DOE to conduct a grid impact study for a 40 MW wind farm in Sibunag, Guimaras. The company’s overall strategy over the next five years is to double existing capacity to 1,200 MW.
In January 2016, the TA Oil board approved an amendment of the company’s corporate name to PHINMA Energy Corporation. The change in name will enhance the integration of PHINMA’s business units and reflects PHINMA’s reputation for integrity and professionalism. The rebranded PHINMA Energy Corporation moving forward will expand its energy portfolio, ensure efficient and reliable supply of power to a growing customer base, support continued economic growth, and pursue the PHINMA mission of making lives better.

12 PHINMA CORPORATION
In 2015, PHINMA completed the reorganization of its education business. In July, PHINMA Corporation incorporated a wholly owned subsidiary, PHINMA Education Holdings, Inc. (PHINMA Education) and transferred via sale its shares in Araullo University (PHINMA AU), Cagayan de Oro College (PHINMA COC), University of Pangasinan (PHINMA UPang) and University of Iloilo (PHINMA UI) to PHINMA Education. The consolidation of our investments under PHINMA Education facilitates financial reporting and capital raising moving forward.
PHINMA Education makes lives better by offering accessible quality education. Through its initial four schools, namely PHINMA AU, PHINMA COC, PHINMA UPang, and PHINMA UI, PHINMA Education continued to provide quality basic and tertiary education to students from low income families in developing urban centers. In addition to offering affordable education, the schools offer
“Through its initial four schools...PHINMA Education continued to provide quality basic and tertiary education to students from low income families in developing urban centers.”
Business Review | EDUCATION
Providing quality education
financial assistance and, through various programs, provide tuition scholarships to underprivileged and deserving students.
In 2015, PHINMA Education entered the middle-income education market with the addition of Southwestern University (SWU)

2015 Annual Report 13
51,351ENROLLED STUDENTS IN 2015
in Cebu City. SWU, a premier university in one of the country’s largest business and education centers, brings to PHINMA Education a strong brand and a tradition of excellence in medical and health sciences programs. PHINMA Corporation acquired a total 73.7% of shares of SWU for approximately P2.5 billion.
PHINMA Education in 2015 continued its focus on academic quality as evidenced by its students’ board examination passing rates. Across the network, the five schools posted passing rates of at least 80% in 26 various board exams. The Accountancy program in PHINMA AU and Civil Engineering in

14 PHINMA CORPORATION
PHINMA UPang posted passing rates of 89% and 85% respectively, while the Social Work program in SWU achieved 80%. In Criminology, PHINMA UPang posted 100% passing rate for the third time and PHINMA AU and PHINMA COC retained their leadership positions in their areas, with an average passing rate of 84%. In Secondary Education, 83% and 89% of exam takers from PHINMA UPang and PHINMA COC passed the board exam. In Elementary Education, passing rates improved further in the September examinations at 100% for PHINMA UI and PHINMA UPang and 91% for PHINMA COC.
In the medical affiliated areas, Nursing posted strong board exam results, with 100% from both PHINMA AU and PHINMA COC and a 98.75% passing rate from PHINMA UPang. PHINMA UPang achieved a passing rate of 100% for Midwifery and Medical Technology, while SWU posted 100% for Medicine, Dentistry, and Optometry and 93% for Medical Technology.
“PHINMA Education continues to innovate and expand, pursuing the continuing mission of your Company to make lives better for its students and their families through education.”
2015 Annual Report 15
on the success of similar campuses for PHINMA COC and PHINMA AU. The Urdaneta City campus offers Accountancy, Tourism, Civil Engineering, and Criminology courses in the rapidly developing eastern region of Pangasinan. In November 2015, PHINMA Education completed the purchase of the ACSAT Gymnasium in Cagayan de Oro, to serve as an additional facility for PHINMA COC. The new campus and gymnasium are valuable additions to a growing education network serving diverse needs of its student market.
PHINMA Education continued preparations for the first batch of senior high school students in 2016, in relation to the Government’s K12 education reform program. New classrooms and facilities have been provided for and scheduled across the entire network, including satellite campuses. New teaching modules for Senior High School based on PHINMA Educations’ Active Learning System have been created. PHINMA Corporation also completed in 2015 the construction of Career Academy Asia, a niche Manila based senior high school which also offers advanced diplomas and course credits in areas including fashion, multimedia design, and hospitality and tourism management. PHINMA Education will complete two more Career Academy branches in Cebu and Davao in 2016.
Preparation allows PHINMA Education to face the massive K12 reform with optimism as it looks forward to opportunities as well as the significant increase in enrollment created by Senior High School over the next several years. PHINMA Education continues to innovate and expand, pursuing the continuing mission of your Company to make lives better for its students and their families through education.
We are pleased to report that PHINMA Education had 17 board exam top placers in 2015, in Secondary Education, Civil and Electrical Engineering, Nursing, Criminology, Medicine, Dentistry, Social Work, and Veterinary Medicine. Other student accomplishments for 2015 include inclusion in the Ayala Young Leaders Congress in February and in the Provincial Youth Development Council’s Outstanding Young Novo Ecijanos in September.
Helping our students achieve success leads to positive operating results for our education business. Total network enrollment grew to 51,351 in 2015, inclusive of enrollment growth from newly-acquired Southwestern University. Excluding SWU, PHINMA Education’s four schools posted enrollment growth of 14% to 41,764 students in 2015. In 2015, income from the five schools amounted to P407.2 million. Excluding SWU, income from the four schools for 2015 amounted to P283 million, a 47 % increase over income of P192 million posted in 2014. The combined assets of the education group grew by 95% to P5.3 billion, primarily due to the SWU acquisition.
In 2015, PHINMA Education focused on improving retention rates in its schools. The Student Success Program addresses nonacademic retention issues such as student adjustment and integration. Activities to improve confidence, motivation, and belongingness were implemented as part of an overall support system. The program was expanded from a freshman only program, to eventually be included across all year levels.
In June 2015, PHINMA UPang opened the doors to its satellite campus in Urdaneta City, Pangasinan. This third satellite campus of PHINMA Education builds

16 PHINMA CORPORATION
PHINMA Property Holdings Corporation (PHINMA Properties), a 35%-owned affiliate of the Company, is a leading developer of affordable medium- rise condominium units in Metro Manila. PHINMA Properties is a triple ISO certified housing developer, recognized for its quality, safety, and environment-friendly designs.
In 2015, strong growth in the Philippine economy and low interest rates encouraged continued property sales in a competitive Metro Manila market for affordable housing. In this environment, PHINMA Properties improved its product, offering customers more facilities and amenities and the option for larger units at minimal incremental cost. The company also conducted roadshows with broker partners in the United States, the Middle East, and Asia, increasing international sales of its
Business Review | HOUSING
Refining our customer offerings
premier products. Equity in net earnings from PHINMA Properties increased from P12.8 million to P21.3 million in 2015. Total assets increased by 33% to P4.8 billion in 2015.
In 2015, PHINMA Properties initiated its expansion into urban centers outside Metro Manila with the launch of Arezzo Place Davao and the establishment of the company’s branch sales office in Davao City. Land development is underway and foundations have been laid for the first two buildings. Arezzo Place Davao was awarded the “Highly Commended Best Residential Development” in Davao at the 2015 Philippines Property Awards, the third such award received by a PHINMA Property development.
In 2015, ASiA Enclaves Alabang launched its SATO III Premiere Suites building which features fully fitted-out multi-bedroom units. The SATO Premiere Suites is the first of a new trend of units with larger living spaces and

2015 Annual Report 17
66% INCREASE IN EQUITIZED EARNINGS
improved amenities. ASiA Enclaves’ Thai-inspired second phase, SENA, continues this trend in 2016 with features including an additional clubhouse, a 25-meter lap pool, landscaped gardens, and private business rooms. In 2015, Arezzo Place Pasig and Solano Hills Sucat both also completed construction of their clubhouses which include amenities such as function rooms and swimming pools.
Moving forward, in line with the company’s move to emerging urban centers, PHINMA Properties has begun land clearing for a new

18 PHINMA CORPORATION
tropical-themed condo called Hacienda Balai Sta. Rosa. The project, located in one of the fastest-growing cities in Southern Luzon, consists of 19 residential buildings in four phases and is expected to start selling by the first quarter of 2016. The company is also exploring projects in Cebu, Naga, Lipa, Cagayan de Oro, and Bulacan.
Aside from the affordable housing market, PHINMA Properties gives equal importance to socialized housing in its mission of making lives better, building units less than half the price of its affordable units, targeting specific beneficiaries in partnership with government units. Strikeville IV is the company’s newest inclusive housing project in Bacoor, Cavite, in partnership with the Bacoor Local Government Unit (LGU). The first

2015 Annual Report 19
300 units are under construction and land development is expected to be completed by the third quarter of 2016. In 2015, PHINMA Properties also completed construction of Pleasant Hills in San Jose Del Monte, Bulacan. Initiated by the Social Housing Financing Corporation (SHFC) and the National Housing Authority (NHA), the project relocates families living in danger zones. The company’s expertise in this area has led to collaboration with the NHA to produce a template for community management for future government housing projects.
In 2015, PHINMA Properties also entered into a joint venture with the Malabon LGU for the L’Oasis housing project which will consist of both socialized and economic housing units for government employees of
Malabon. The first four buildings are scheduled for completion by the fourth quarter of 2016.
PHINMA Properties is scaling up its efforts in the inclusive housing sector in the firm belief that profitability can go hand-in-hand with uplifting lives. Together with its various housing endeavors, PHINMA Properties continues the legacy of integrity, quality, and social responsibility it has fostered for almost thirty years. In its efforts to make home ownership more accessible, the company fulfills PHINMA’s mission of making life better through business and nation-building.
“Together with its various housing endeavors, PHINMA Properties continues the legacy of integrity, quality, and social responsibility it has fostered for almost thirty years.”

20 PHINMA CORPORATION
Union Galvasteel Corporation (UGC), a wholly-owned subsidiary of your Company, is the market leader in the manufacture of pre-painted steel roofing and other galvanized steel products for the building materials industry. The company has the largest and most diversified distribution network in the industry, with roll-forming plants and warehouses in strategic locations throughout the country.
During 2015, the local market was challenged by a series of typhoons in Northern Luzon in the last quarter of the year and by a surge in low-cost imports from China due to the softening of global steel prices. The Company generated revenues of P3.7 billion, flat compared to revenues posted in 2014, due to price pressures from imports. UGC however realized a net income of P158.5 million, a 9% improvement over 2014, due to better margins from increased sales of higher-value polyurethane (PU) products.
Business Review | STEEL PRODUCTS
Implementing operational innovations
UGC has long been the country’s leader in the pre-painted steel roofing business. In 2015, UGC became a major player in the manufacture and distribution of polyurethane (PU) products enabling low energy consumption temperature controlled facilities for commercial and agro-industrial uses. The expansion and commercial operation of the company’s Davao PU line completed in September 2015 supplemented existing capacity at the company’s Calamba PU line. In 2016, the company also looks forward to the expansion of the Calamba PU line which will be commissioned in the first quarter. These facilities will be the first in the Philippines to adopt environment friendly technology utilizing non-ozone depleting substances.
In 2015 the company also introduced to the market Pre-engineered Building Structures (PEBS). Through a strategic alliance with a foreign company with advanced technology, the company is able to design, fabricate, and erect structured steel materials which are components for

2015 Annual Report 21
the construction of warehouses, factories and commercial buildings. UGC has penetrated this segment of the market which should contribute significantly to revenues and profits moving forward.
In its commitment to provide consistent quality service, UGC has continued to pursue its customer-focused strategy of ensuring a consistently remarkable experience for every customer. To sustain this, the company established a customer feedback system and aligned business processes for a seamless operations flow. One notable effect is the significant improvement in service levels resulting in high customer satisfaction. This strategy will continue to be UGC’s competitive advantage in the industry.
The company ended 2015 with total resources of P2.2 billion, a reduction from resources of P2.4 billion in the previous year, due in part to better working capital utilization and
substantial reduction in inventories for materials and finished products. During the year the company paid cash dividends of P140 million bringing stockholders equity to P862 million by year end.
Moving forward, UGC is confident that its strategic initiatives in the past, including the upgrading of the Color Coating Line in Calamba and the expansion of the PU facilities, together with the nationwide distribution network, the motivated and dedicated organization, and the expanded product offerings, will continue to be the company’s comparative advantage in a highly competitive market. UGC remains committed toward making life better for Filipinos through affordable, durable, and innovative roofing and steel building products.

22 PHINMA CORPORATION
The increasing arrivals of international tourists and sustained domestic travel are positive indications that tourism and the prospects for the hotel industry in the Philippines continue to grow. To address the need for affordable quality hotel services in the country, PHINMA Corporation invested in a 23.8% ownership interest in Coral Way City Hotel Corporation (Coral Way), owner of the 150-room Microtel by Wyndham Mall of Asia, which commenced operations in September 2010.
In 2015, Asian Plaza, Inc., a subsidiary of your Company, invested an initial tranche of P73 million for a 21% equity interest in Microtel Development Corporation (MDC), operator of 13 Microtel properties in key regional hubs and resort locations in the Philippines. In addition to managing franchised Microtel properties in the country, MDC is a joint venture owner of several Microtel hotels.
Business Review | HOTELS
Addressing a growth industry
Microtel by Wyndham is an international chain of limited service hotels under Wyndham Hotel Group with more than 300 properties worldwide, including 13 in the Philippines (Acropolis Quezon City, Baguio, Batangas, Boracay Cabanatuan, Cavite, Davao, General Santos, Manila, Puerto Princesa, South Forbes, Tarlac, and UP Technohub Quezon City). Microtel by Wyndham pioneered the no-frills hotel concept in the country that targets the mid-market. Its approach is back-to-basics and focuses on providing consistently clean, comfortable and secure accommodations at value rates.
Microtel by Wyndham Mall of Asia is strategically located near SMX Convention Center, SM Mall of Asia, Mall of Asia Arena, and key business hubs. The hotel enjoys strong patronage from business and leisure travelers in the area, registering a 2015 occupancy of 87% and gross revenue of P187 million. Net income for 2015 was P18 million.

2015 Annual Report 23
For 2016, the company sees increased business and leisure travel in the country. To complement Microtel by Wyndham Mall of Asia and to address the needs of the corporate accounts, leisure travelers, and attendees of meetings, conventions and exhibitions in the area, Coral Way, through its wholly owned subsidiary Krypton Esplanade Hotel Corporation, started construction of a 195-room TRYP by Wyndham hotel along Seaside Avenue, Mall of Asia complex.
TRYP is a sister brand of Microtel by Wyndham with more than 100 properties in many urban cities in Europe, North and Latin America,
and Australia. This select-service hotel complements Microtel’s offering and targets a young and trendy clientele. TRYP by Wyndham Mall of Asia, Manila, the first TRYP hotel in Asia, will open in the fourth quarter of 2016.
With increased foreign and domestic tourism in 2016, Microtel by Wyndham is well positioned to continue to make lives better by providing quality service, and accessible, affordable accommodations.

24 PHINMA CORPORATION
“The Fuld Group looks forward to renewed growth and opportunities on the heels of its revamped marketing and sales practices and improved cost structure while it repositions its business to make lives better by moving into higher value consulting services.”
Business Review | STRATEGIC CONSULTING
Moving into higher value services
Fuld + Company is a competitive strategy and intelligence consulting firm that provides decision-relevant strategic and market insights to clients to help improve business strategies. With offices in Boston and London, Fuld + Company helps clients address competitive challenges and illuminate big opportunities with three key services: competitive intelligence, strategic planning, and market insights. Fuld Philippines Inc., operating under the brand Fuld Omniscope, provides strategic market research and analytics services to clients to help address

2015 Annual Report 25
information needs and support business decisions. From Manila, it provides research to support customer understanding and engagement, and market monitoring and sizing.
2015 was a year of transition for Fuld + Company as it repositioned to move into higher value strategic consulting services to diversify beyond its competitive intelligence research business. This required a realignment of staff and an overhaul of the firm’s sales and marketing practice. The US business improved its cost structure and project delivery capabilities while the UK office undertook a staff overhaul designed to improve project delivery capabilities. Fuld Omniscope continued to grow direct client relationships in the US, Europe, and Asia, in
areas including healthcare, industrial products, consumer products, and life sciences.
The Fuld group posted combined revenue equivalent to P389.2 million, a decrease from the P535 million posted in 2014. The Fuld group posted a net loss of P66.1 million in 2015 compared to a net loss of P13.8 million for the previous year.
The Fuld Group looks forward to renewed growth and opportunities on the heels of its revamped marketing and sales practices and improved cost structure while it repositions its business to make lives better by moving into higher value consulting services.

26 PHINMA CORPORATION
Board of Directors
Oscar J. HiladoChairman
Ramon R. del Rosario, Jr.Vice Chairman
Victor J. del RosarioDirector
Roberto M. LaviñaDirector
Magdaleno B. Albarracin, Jr.Director

2015 Annual Report 27
Board of Directors
Jose L. Cuisia, Jr. Director
Francisco L. VirayDirector
Eric S. LustreDirector
Guillermo D. Luchangco Independent Director
Roberto F. de Ocampo Independent Director
Filomeno G. FranciscoDirector

28 PHINMA CORPORATION
OSCAR J. HILADO, 78, has been the Chairman of the Board of the
Company since 2003. He is also Chairman of the Board of PHINMA, Inc.,
Trans-Asia Oil and Energy Development Corporation *, PHINMA Property
Holdings Corporation, and Union Galvasteel Corporation. He is Vice
Chairman of Trans-Asia Power Generation Corporation and Trans-Asia
Petroleum Corporation. Mr. Hilado is also a Director and Chairman of the
Audit Committee of A. Soriano Corporation*, First Philippine Holdings
Corporation*, Philex Mining Corporation*, Smart Communications,
Inc., and Seven Seas Resort and Leisure, Inc. He is also a Director of
Digital Telecommunications Philippines, Inc. (DIGITEL), Manila Cordage
Company, Beacon Property Ventures, Inc., Pueblo de Oro Development
Corporation, Rockwell Land Corporation*, Roxas Holdings, Inc., and United
Pulp and Paper Co., Inc. He has been a Director of the Company
since 1969 and is also the Chairman of the Executive Committee and
Nomination Committee of the Company. He attended the Business
Continuity Management Training on June 20, 2013, seminar on Corporate
Governance on July 28, 2014 and the Corporate Governance and Risk
Seminar in August 2015. Mr. Hilado is a Certified Public Accountant
with a Bachelor of Science degree in Commerce from the De La Salle
College in Bacolod and a Master’s degree in Business Administration from
Harvard Business School.
RAMON R. DEL ROSARIO, JR., 71, is the President and CEO of
PHINMA, Inc. and PHINMA Corporation. He is Vice Chairman of Trans-
Asia Oil and Energy Development Corporation* and Chairman of Trans-Asia
Power Generation Corporation, Trans-Asia Renewable Energy Corporation,
Trans-Asia Petroleum Corporation*, One Subic Power Generation
Corporation, CIP II Power Corporation, Microtel Inns and Suites (Pilipinas),
Inc. and the Chairman of the Boards of Trustees of PHINMA Education
Holdings, Inc., Araullo University, Cagayan de Oro College, University of
Iloilo, and University of Pangasinan. He is a director of several PHINMA-
managed companies and currently serves as a member of the Board of
Directors of Ayala Corporation* and as Chairman of United Pulp and Paper
Company of the Siam Cement Group. Mr. del Rosario obtained his BSC-
Accounting and AB-Social Sciences degrees (Magna cum Laude) from De
La Salle University and Master’s degree in Business Administration from
the Harvard Business School. He served as Secretary of Finance of the
Philippines from 1992 to 1993. He is the Chairman of the Makati Business
Club, Philippine Business for Education (PBED), the Integrity Initiative, and
the National Museum of the Philippines and is Vice Chairman of the Ramon
Magsaysay Award Foundation and Caritas (Manila). He was selected as
the Most Outstanding Student of the Philippines in 1967, one of the Ten
Outstanding Young Men (TOYM) of the Philippines in 1978 and the MAP
Management Man of the Year in 2010. He is the brother of Mr. Victor J. del
Rosario. He has been a director of the company since 2002.
MAGDALENO B. ALBARRACIN, JR., 79, is the Vice-Chairman
of PHINMA, Inc. He was a former director of Holcim Philippines, Inc.*
and holds directorates in various PHINMA companies. Dr. Albarracin
is a member of the Board of Regents of the University of the Philippines
(UP) as well as Board of Trustees of U.P. Engineering Research and
Development Foundation, Inc. (UPERDF). He is the Chairman of the
Board of Trustees of the University of San Carlos, Cebu City. He served
as Dean of the UP College of Business Administration and was President
of the Asean Federation of Cement Manufacturers. Dr. Albarracin has
a Bachelor of Science degree in Electrical Engineering from the
University of the Philippines and a Master of Science degree in Electrical
Engineering from the University of Michigan. He obtained his Master
in Business Administration degree from the University of the Philippines
and his Doctorate in Business Administration from Harvard University.
He attended the Corporate Governance Seminar conducted by SGV last
August 2015. He has been a Director of the Company since 1980.
ROBERTO M. LAVIÑA, 65, was appointed Senior Executive Vice
President and Chief Operating Officer on July 27, 2012. Mr. Laviña is
also the Senior Executive Vice President and Chief Operating Officer
of PHINMA, Inc. and is concurrently the President and Chief Executive
Officer of PHINMA Property Holdings Corporation. He is a Member of the
Board and the Senior Executive Vice President / Treasurer of Trans-Asia
Oil and Energy Development Corporation*. He also occupies various
executive posts in PHINMA-managed companies and is a Member of
the Board of all the companies in the PHINMA Group which include
companies in power generation, education, hotels, steel roofing, property
development, oil exploration, strategic consulting and insurance brokers.
For the year 2015, he attended various trainings as follows: Crisis
Management and Communication Planning Forum on March 19, 2015,
Executive Coaching Champions to Drive Business Impact on April 29,
2015 , and Corporate Governance Seminar by SGV on August 27, 2015.
He holds a Bachelor of Arts degree in Economics from Ateneo de Manila
University and obtained his Master’s degree in Business Management
from the Asian Institute of Management. He became a Director of the
Company on May 20, 2004.
VICTOR J. DEL ROSARIO, 67, is an Economics and Accounting
graduate of De La Salle University and holds a Master’s degree in
Business Administration from Columbia University. He was elected
as director on September 15, 2008. He is the Vice-Chairman of Union
Galvasteel Corporation and is the Executive Vice President and Chief
Strategic Officer of PHINMA, Inc. For PHINMA Corp, he is Executive Vice
President and Chief Finance Officer. He is also a member of the Board
of Directors of PHINMA Inc., Trans-Asia Oil and Energy Development
Corporation*, Trans-Asia Petroleum Corporation* and other PHINMA-
managed companies. For the year 2015, he attended various trainings
as follows: Crisis Management and Communication Planning Forum on
March 19, 2015, Executive Coaching Champions to Drive Business Impact
on April 29, 2015, and Corporate Governance Seminar by SGV on April 27,
2015. Mr. Del Rosario is the brother of Mr. Ramon R. del Rosario, Jr.
JOSE L. CUISIA, JR., 71, is presently the Philippine Ambassador
Extraordinary and Plenipotentiary to the United States of America and
non-resident Ambassador to Trinidad & Tobago, the US Virgin Islands,
Grenada, Puerto Rico, the Commonwealth of Jamaica and the Republic of
Haiti, Antigua & Barbuda, Barbados, the Commonwealth of Dominica, The
Federation of St. Kitts and Nevis, St. Lucia, St. Vincent and the Grenadines.
Ambassador Cuisia previously served the Philippine Government as
Board ofDIRECTORS

2015 Annual Report 29
Governor of the Philippine Central Bank and Chairman of its Monetary
Board from 1990- 1993, was Governor for the Philippines to the International
Monetary Fund and Alternate Governor to the World Bank. He was also
Administrator and CEO of the Philippine Social Security System from
1986-1990. He was also appointed Commissioner, representative of the
Employer’s Group, for the Social Security System (SSS) from September-
December 2010. He is the Chairman of the Board for The Covenant Car
Company, Inc. (TCI) and the Vice-Chairman of the Board of SM Prime
Holdings (SMPHI)*. He holds directorates in Manila Water Company, Inc.*,
SM Prime Holdings*, Century Properties Group, Inc.*, and PHINMA, Inc.
Ambassador Cuisia was President & CEO of Philam Life for 16 years. He
obtained his BSC-Accounting and AB-Social Sciences degrees (Magna
cum Laude) from De La Salle University and Master’s degree in Business
Administration from University of Pennsylvania. Ambassador Cuisia has
been a Director of the Company since 1994.
FILOMENO G. FRANCISCO, 64, was formerly President and Chief
Operating Officer of AB Capital and Investment Corporation (ABCIC). He
is currently a Director of PHINMA Property Holdings Corporation and
Ginory Holdings Corporation. Mr. Francisco served on the Boards of trade
organizations, Investment House Association of the Philippines, Philippine
Stock Exchange Inc.*, PSE Foundation and Manila Stock Exchange. Mr.
Francisco also held directorates in ABCIC, Cebu Holdings, Inc.*, Philippines
Long-Term Equity Fund, Hi Cement Corporation, and United Pulp and
Paper Company, Inc. He has a Bachelor of Science degree in Management
Engineering from the Ateneo de Manila University. He attended the
PHINMA Group Audit Committee Forum in September 2013 and SGV
Seminar on Corporation Governance in July 2014 as well as the Corporate
Governance and Risk Seminar in August of 2015. Mr. Francisco was
elected as director of PHINMA Corporation on May 14, 2012.
FRANCISCO L. VIRAY, 67, is currently the President and Chief
Executive officer and a director of Trans-Asia Oil and Energy Development
Corporation*. He is concurrently the President and Chief Executive Officer
of Trans-Asia Power Generation Corporation*, Trans-Asia Renewable
Energy Corporation and Trans-Asia Petroleum Corporation* and Vice
Chairman and Chief Executive Officer of CIP II Power Corporation and One
Subic Power Generation Corporation. He is also at present a member
of the Board of Directors of Araullo University, Cagayan de Oro College
and University of Pangasinan. He obtained his Bachelor of Science and
Masters in Electrical Engineering degrees from the University of the
Philippines and his Doctorate in Engineering degree from West Virginia
University. He joined the PHINMA Group in 1999, a year after he served
as Secretary of the Department of Energy from 1994 to 1998. Earlier, he
was President of the National Power Corporation beginning May 1993.
Dr. Viray served on the Board of Directors of Manila Electric Company*,
Petron Corporation*, Union Cement Corporation (now Holcim Philippines,
Inc.*) and United Pulp and Paper Company, Inc. He became a Director of
the Company in April 2013.
ERIC S. LUSTRE, 53, is the Head of Corporate Finance Department of
the Investment Division and the Country Credit Officer of The Philippine
American Life and General Insurance Company. He is also responsible
for the real estate investment portfolio of the Company and is the Chief
Executive Officer of Philam Properties Corporation. Mr. Lustre is a member
of the Board of Directors of Philam-Equitable Life Assurance Company,
ICCP Holdings, Inc., Science Park of the Philippines, Inc., Regatta Properties,
Inc., Beacon Property Ventures, Inc. Pueblo de Oro Development
Corporation, Cebu Light Industrial Park, Inc., and RFM-Science Park of
the Philippines, Inc. He is also the President of the Tower Club, Inc. He has
a Bachelor of Science in Business Management from Ateneo de Manila
University and holds a Master’s degree in Business Management major
in Finance from Asian Institute of Management. He attended the SGV
Corporate Governance and Risk Seminar in August 2015. Mr. Lustre was
elected as director of PHINMA Corporation on November 6, 2013.
GUILLERMO D. LUCHANGCO, 76, is Chairman and Chief Executive
Officer of various companies of The ICCP Group, including Science Park
of the Philippines, Inc., Pueblo de Oro Development Corp., Cebu Light
Industrial Park, Inc., Regatta Properties, Inc., RFM-Science Park of the
Philippines, Inc., and Manila Exposition Complex, Inc. He is Chairman of
Investment & Capital Corporation of the Philippines as well as Chairman and
President of Beacon Property Ventures, Inc. He is an independent director
of Roxas and Company, Inc.* and Trans-Asia Oil and Energy Development
Corp.* and a regular director of Fuld and Company, Ionics, Inc. and Ionics
EMS. He was previously the Vice-Chairman and President of Republic
Glass Corporation and Managing Director of SGV & Co. Mr. Luchangco
received his Bachelor of Science degree in Chemical Engineering (magna
cum laude) from De La Salle University, and holds a Master’s degree in
Business Administration from the Harvard Business School. He became
an Independent Director of the Company on April 11, 2005.
ROBERTO F. DE OCAMPO, OBE, 70, became the first Filipino to
receive the “Global Finance Minister of the Year” award from Euromoney.
The Association of Development Finance Institutions of Asia and Pacific
(ADFIAP) named him as Asian Finance Minister of the Year. He was again
recognized as Asian Finance Minister of the year by Asiamoney. He is
known nationally and internationally for public and international finance,
having been Chairman of the APEC and ASEAN Finance Ministers as
well as member of the Boards of Governors of World Bank, International
Monetary Fund, and the Asian Development Bank. He was Secretary
of Finance during the presidency of Fidel V. Ramos. Prior to these posts,
he also served as Chairman and CEO of the Development Bank of the
Philippines. He is the past president of the Asian Institute of Management
(AIM) and was a member of the AIM Board of Trustees. At present he is
the Chairman of the Philippine Veterans Bank and also Chairman of the
Board of Advisers of the RFO Center for Public Finance and Regional
Economic Cooperation, which is an ADB Regional Knowledge Hub. Dr. de
Ocampo is a recipient of many international and national honors. He was
named to the Ordre National de la Legion d’ Honneur by the Republic of
France with the rank of Chevalier. He was also conferred by Her Majesty
Queen Elizabeth II the Most Excellent Order of the British Empire (OBE).
He has also been awarded the Philippine Legion of Honor, the highest
honor conferred on Filipino civilians by the Republic of the Philippines. He
became an Independent Director of the Company on April 2, 2009.
* Listed company

30 PHINMA CORPORATION
Ramon R. del Rosario, Jr.President and Chief Executive Officer
Roberto M. LaviñaSenior Executive Vice President and Chief Operating Officer
Pythagoras L. Brion, Jr. Senior Vice President and Treasurer
Regina B. AlvarezSenior Vice President - Finance
Juan J. DiazCorporate Secretary
Victor J. del RosarioExecutive Vice President and Chief Financial Officer
ExecutiveOfficers

2015 Annual Report 31
Cecille B. ArenilloVice President - Treasury and Compliance Officer
Rolando D. SolivenAssistant Vice President - Internal Audit
Rizalina P. AndradaVice President - Finance
Giles R. KatigbakInvestor Relations Officer
Nanette P. VillalobosAssistant Vice President - Treasury

32 PHINMA CORPORATION
Corporate GovernanceThe Board of Directors, officers and employees of PHINMA Corporation (PHN) commit themselves to the principles of good governance, as contained in its Manual of Good Corporate Governance approved in August 2002 and as amended in March 2004, February 2008, March 2011 and June 2014. PHN believes that good governance is an integral component of sound business management and exerts every effort necessary to ensure compliance within the organization.
COMPLIANCE OFFICER
The Chairman of the Board designates a Compliance Officer who reports to the Chairman of the Board. Because PHN is a publicly-listed company, the appointment of Compliance Officer is properly disclosed to the Securities and Exchange Commission. The Compliance Officer’s duties include monitoring compliance with the provisions and requirements of the Manual of Good Corporate Governance, identifying compliance risks, determining violations and recommending appropriate penalties. Updates and changes to the Annual Corporate Governance Report (ACGR) and the Consolidated Changes to the ACGR for the Calendar Year 2015 were submitted to the SEC on August 3, 2015, September 22, 2015, October 26, 2015 and January 15, 2016 respectively. As of December 31, 2015, the Company complied with the principles and best practices contained in the Manual on Good Corporate Governance. There were no sanctions imposed on any director, officer or employee for non-compliance.
As required by the Philippine Stock Exchange, the Corporation submitted last March 26, 2015, a Compliance Report on Corporate Governance for Year
2014. For the said year under review, the Corporation is compliant with all guidelines except for those under Sections 2.8 and 5.6. For the year 2015, the Company has yet to submit its Compliance Report on Corporate Governance which is due March 31, 2016.
The Compliance Officer and the Internal Auditor monitor the Corporation’s compliance with the Manual and the timely submission of reports and disclosures to both SEC and PSE. In addition, the Corporation monitors SEC or PSE circulars or memorandum on corporate governance and amends the manual, if necessary.
BOARD OF DIRECTORS Composition As of December 31, 2015, the Board of directors consists of 11 members, nominated in accordance with the By-Laws of the Company. In compliance with the legal requirement of SEC for publicly listed corporations, PHN’s Board of Directors includes 2 independent directors. The independent directors hold no interest or have no relationship with the corporation that may hinder their independence from the corporation or management or would interfere with the exercise of independent judgment in carrying out their responsibilities.
During the year, the Board of Directors held 4 regular board meetings, one special board meeting, and one organizational meeting. The details of the matters taken up during the Board meetings are detailed in the Definitive Information Statement sent to shareholders.
The attendance of the directors in the Board meetings is as follows:
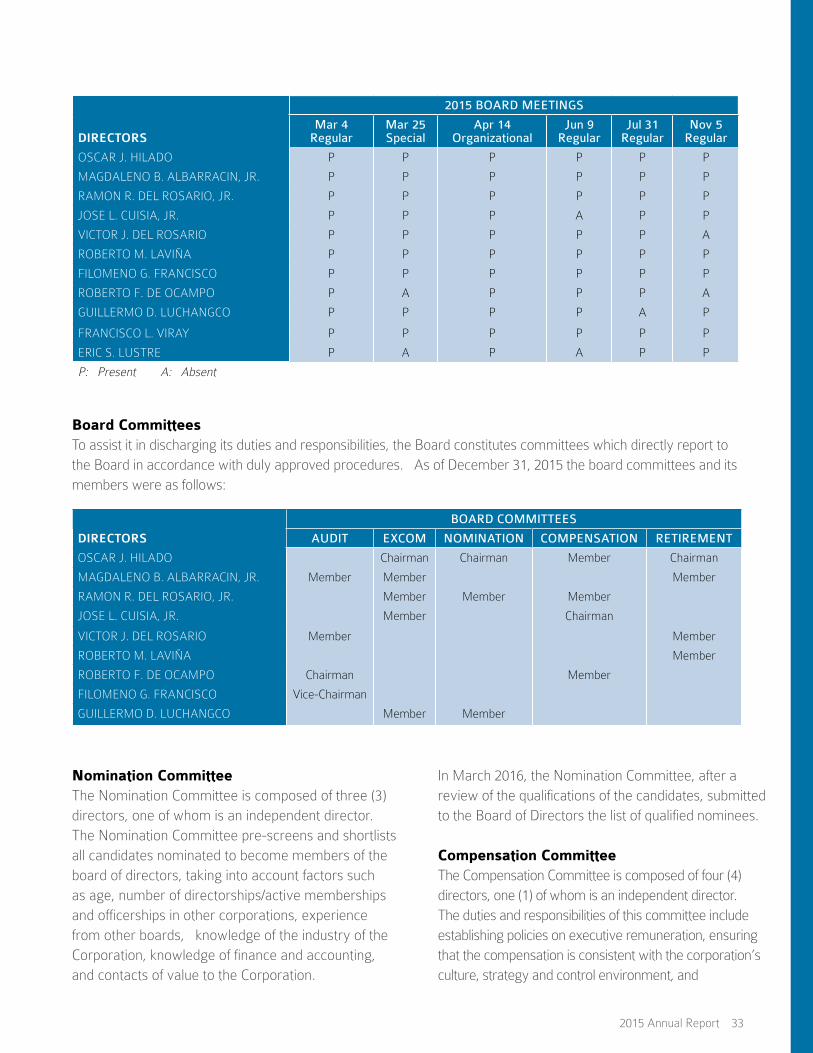
2015 Annual Report 33
2015 BOARD MEETINGS
DIRECTORSMar 4
RegularMar 25 Special
Apr 14 Organizational
Jun 9 Regular
Jul 31 Regular
Nov 5 Regular
OSCAR J. HILADO P P P P P P
MAGDALENO B. ALBARRACIN, JR. P P P P P P
RAMON R. DEL ROSARIO, JR. P P P P P P
JOSE L. CUISIA, JR. P P P A P P
VICTOR J. DEL ROSARIO P P P P P A
ROBERTO M. LAVIÑA P P P P P P
FILOMENO G. FRANCISCO P P P P P P
ROBERTO F. DE OCAMPO P A P P P A
GUILLERMO D. LUCHANGCO P P P P A P
FRANCISCO L. VIRAY P P P P P P
ERIC S. LUSTRE P A P A P P
P: Present A: Absent
BOARD COMMITTEES
DIRECTORS AUDIT EXCOM NOMINATION COMPENSATION RETIREMENT
OSCAR J. HILADO Chairman Chairman Member Chairman
MAGDALENO B. ALBARRACIN, JR. Member Member Member
RAMON R. DEL ROSARIO, JR. Member Member Member
JOSE L. CUISIA, JR. Member Chairman
VICTOR J. DEL ROSARIO Member Member
ROBERTO M. LAVIÑA Member
ROBERTO F. DE OCAMPO Chairman Member
FILOMENO G. FRANCISCO Vice-Chairman
GUILLERMO D. LUCHANGCO Member Member
Board Committees To assist it in discharging its duties and responsibilities, the Board constitutes committees which directly report to the Board in accordance with duly approved procedures. As of December 31, 2015 the board committees and its members were as follows:
Nomination Committee The Nomination Committee is composed of three (3) directors, one of whom is an independent director. The Nomination Committee pre-screens and shortlists all candidates nominated to become members of the board of directors, taking into account factors such as age, number of directorships/active memberships and officerships in other corporations, experience from other boards, knowledge of the industry of the Corporation, knowledge of finance and accounting, and contacts of value to the Corporation.
In March 2016, the Nomination Committee, after a review of the qualifications of the candidates, submitted to the Board of Directors the list of qualified nominees.
Compensation Committee The Compensation Committee is composed of four (4) directors, one (1) of whom is an independent director. The duties and responsibilities of this committee include establishing policies on executive remuneration, ensuring that the compensation is consistent with the corporation’s culture, strategy and control environment, and

34 PHINMA CORPORATION
On April 14, 2015, the stockholders, upon recommendation of the Audit Committee and the endorsement by the Board of directors, approved the appointment of SGV & Co. as PHN’s external auditor. Mr. Johnny F. Ang is the partner in charge for CY 2015. On March 4, 2016, SGV & Co. issued its report on the financial statements for the year ended December 31, 2015, stating that the financial statements present fairly, in all material respects, the financial position of the company and that the same are in accordance with Philippine Financial Reporting Standards.
There have been no disagreements with the independent accountants on any matter pertaining to accounting principles or practices, financial statement disclosures or auditing scope or procedure.
The Company is in compliance with SRC Rule 68, paragraph 3(b) (iv) requiring the rotation of external auditors or engagement partners who have been engaged by the company for a period of five (5) consecutive years or more. Mr. Ang has been the audit partner of the Company for three years.
The Company accrued the following fees for professional services rendered by SGV and Co. for the past two years:
INTERNAL AUDIT
PHN has an independent Internal Audit organization that reports directly to the Board of Directors, through the Audit Committee, and administratively to Senior
strengthening policies on conflict of interest, salaries and benefits and compliance with statutory requirements.
Audit Committee The Audit Committee is composed of four (4) members of the Board, one (1) of whom is an independent director who is also the Chairman of the committee. The Committee assists the board of directors of PHN in fulfilling its oversight responsibilities for the financial reporting process, the system of internal controls, the audit process, risk management process, and the Company’s process for monitoring compliance with laws and regulations.
In 2015, the Audit Committee held six meetings, two of which were on risk management. Overall attendance was 92%. The Committee reviewed the audited financial statements for 2014 and the interim statements for the quarters ending March 31, June 30, and September 30 for the year 2015. The Committee also endorsed to the Board of Directors the nomination of SGV and Co. as the company’s external auditor for 2015. The Committee approved the Internal Audit plan for 2015, reviewed the audit reports, and evaluated Internal Audit’s performance. The Audit Committee reviewed the activities related to the Business Resiliency and Integrity Assurance programs and also performed a self-assessment of the committee’s performance against the approved Audit Committee Charter, in line with the guidelines issued by the Securities and Exchange Commission.
EXTERNAL AUDITOR
The external Auditor contributes to the enforcement of good governance through independent examination of the financial records and reports of PHN.
Attendance
YEAR 2015
AUDIT COMMITTEE Feb 16 Feb 18 Mar 3 May 7 Jul 30 Ot 26
ROBERTO F. DE OCAMPO P P P P P P
FILOMENO G. FRANCISCO P P P P P P
MAGDALENO B. ALBARRACIN, JR. P P P P P P
VICTOR J. DEL ROSARIO P P P P A A
P: Present A: Absent
Year Audit Fees
2015 P3,700,000
2014 3,700,000

2015 Annual Report 35
Management. The Group Internal Audit (GIA) team provides PHN with professional assurance and consulting services that are designed to add value and improve operations. Consistent with its thrust to become better business partners, Group Internal Audit helps PHN accomplish its objectives by bringing a systematic and disciplined approach to evaluating and improving the effectiveness of PHN’s risk management, control, and governance processes.
To ensure the independence of Group Internal Audit, the Audit Committee reviewed and approved the GIA Charter which outlines internal audit’s purpose, reporting relationships, authorities and responsibilities. Through this Charter, the internal auditors are kept free from interference by any element in the organization in matters of audit selection, scope, procedures, frequency, timing, or report content. Likewise, members of Group Internal Audit do not have any direct operational responsibility or authority over any of the activities audited and, as such, are further prohibited from implementing internal controls or engaging in any other activity that may impair the auditor’s judgment.
Under the GIA Charter, GIA performed various internal control reviews of the Company and its subsidiaries and affiliates. Based on the results of these reviews, Group Internal Audit reported that overall controls are adequate and effective.
DISCLOSURE AND TRANSPARENCY
PHINMA Corporation commits itself to high standards of disclosure and transparency. In addition to submitting annual and quarterly financial information and other statutory requirements, the corporation promptly discloses to the SEC and PSE material information such as declaration of dividends, investments and divestments and other items. The disclosures are also uploaded to the company website for the benefit of the public.
CODE OF CONDUCT
We believe that our commitment to ethical business practices, good corporate governance and social responsibility is vital and integral to the pursuit of our Mission to help build our Nation through competitive and well-managed business enterprises.
The PHINMA Code of Business Conduct (the “PHINMA Code”), founded on the PHINMA core values of integrity, patriotism, competence and professionalism, embodies this unwavering commitment, and sets forth policies and guidelines on the following : • Conflict of Interest • Insider Trading • Gifts and Gratuities • Anti-Fraud• Sexual Harassment• Whistleblowing and Non-retaliation
In 2015, the company stepped up the implementation of its Integrity Assurance Program by conducting a series of Integrity Roadshows which highlighted PHINMA Core Values, the PHINMA Code of Business Conduct, and the newly implemented Integrity Hotline. The company also formally launched the Vendor Integrity Program. Under this initiative, accredited vendors and providers entered into an Integrity Pact with PHINMA and committed to sign the Integrity Pledge.
PHINMA Corporation also voluntarily submitted itself to an External Validation by auditors trained and accredited by the Makati Business Club and Integrity Initiative, Inc. PHINMA Corporation was rated to be at the Advanced Level, the highest possible rating given in such a validation. Both the Makati Business Club and Integrity Initiative, Inc. recognized the PHINMA Group’s Integrity Assurance Program, highlighting it as best practice in institutionalizing ethical practices within a professional business organization.
36 PHINMA CORPORATION
Corporate Social ResponsibilityAt PHINMA, our business is our CSR, and our CSR is our business. PHINMA Corporation’s corporate social responsibility initiatives therefore focus on areas in line with our main businesses and contribute to the Company’s mission of making lives better by providing quality education, affordable housing, and reliable and renewable power. The Company also encourages its employees to volunteer and reach out to local communities, in their personal capacity, through socially relevant programs.
Education
PHINMA Education remains committed to its mission, and continues to provide education that allows its students and their families to improve their lives.
PHINMA Education schools have made their contributions felt; on top of its already low fees, the network extends scholarships to about a third of all students. Evacuation and relief programs were set in motion when Typhoon Lando hit the Philippines. Together with the local and non-government units, the PHINMA Education schools continued its annual bloodletting activities and donations to select areas. Each school continues to donate seedlings to chosen areas and continues to provide IT services to barangays in their respective cities. PHINMA AU’s Bulilit University, a program to improve retention and introduce learning among children, currently manages six day care centers. Other college-specific activities include entrepreneurship training. PHINMA COC continues to conduct mass wedding and mass baptism ceremonies for people in their community.
PHINMA’s commitment in providing quality education is also evident in its continued support of the PHINMA National Scholarship (PNS) program, the flagship program of the PHINMA Foundation. From its initial crop of 10 scholars when it began in 2006, the PNS has grown to a total of 96 scholars enrolled in education, accounting, and engineering courses in both Philippine Normal University (PNU) and the University of the Philippines (UP) Diliman. To date, the program has produced 97 graduates, 95 of which have taken their respective board exams, with a 98.95% passing rate. This year, one of the scholars placed 9th in the recent Licensure Examination for Teachers, while another was the topnotcher of the Electronics and Communications Engineering board.
One of the main thrusts of the PNS program is to produce not just graduates but leaders. Year-round activities are therefore made available to the scholars to hone the students’ skills and potential in becoming leaders. On-the-job trainings, leadership conference, and workshops are conducted for the continuing development of the scholars. In 2015, the annual leadership conference theme was “HERO in ME”. The scholars were taught to develop their skills as leaders and given the chance to share and create programs around advocacies that they personally support.
The program continues to provide opportunities for the scholars to be exposed to history, arts, and culture through educational trips. Scholars watched the Noli at Fili Dekada Dos Mil play staged by PETA, and the Ballet Philippine performance of Peter Pan.

2015 Annual Report 37
In 2015, PNS was supported by several individuals and institutions, with 12 scholars sponsored by PHINMA officers, employees, and PHINMA directors and their families; 3 by EMAR Corporation; 3 by Multinational Investment Foundation Inc., and 1 by the Doña Marta T. Hernandez Foundation. PNS is targeting to support 100 scholars every school year.
Union Galvasteel Corporation (UGC) also continues its support for the Education sector by completing the reroofing of Real and Lamesa Elementary Schools in Calamba, Laguna, as well as the Sagrada Community School in Bicol. UGC also granted plant visits and implemented extensive OJT programs for students. At least 6 scholarships were also awarded to numerous talented students in select schools including Laguna
State Polytechnic University (LSPU), Batangas State University (BSU), and Don Mariano Marcos Memorial State University (DMMMSU). UGC employees also volunteered in the annual Brigada Eskwela of Tayud Elementary School in Cebu.
UGC continues to conduct Summer Computer Camps in different elementary schools in the areas surrounding their plant. This year, they catered to students from Real Elementary School. UGC employees also volunteer their time and expertise to assist students from select barangays in Laguna by providing Basic Computer Literacy workshops for incoming Grade 5 and 6 public school students.

38 PHINMA CORPORATION
As part of their waste management program, trash bins and dust pans were fabricated in partnership with LGU’s and public schools in the provinces where UGC’s offices are located.
Shelter
Volunteers from UGC plants completed the construction of housing units as part of its efforts to help families in Palo, Leyte displaced by Typhoon Yolanda in 2013. The blessing and turn-over ceremony of three units was held last December 2015 with Archbishop John Du, Mayor Remedios Petilla, Cannossian Sisters and UGC representatives.
Disaster Response
UGC in Cagayan De Oro took part in boosting disaster preparedness in their area by donating life jackets for use during severe storms. These life jackets were recycled from UGC materials and were sewn by employees.
Environment
In 2015, UGC’s initiatives in the protection of the environment included tree planting, river and coastal cleanups, mangrove propagation, waste recycling, waste management, and active participation in green forums and programs, both public and private.
In partnership with local government units, UGC personnel had three tree planting activities in Canlubang, Calamba City, Laguna, and Mangrovetum Park in Bunawan, Davao City. On the other hand, UGC Visayas assisted in the Highway Greening Project in Brgy. Bagsak Pardo, Cebu City.

2015 Annual Report 39
This year, PHINMA also partnered with the Ateneo de Manila University for a Strategic Management class focused on creating sustainable livelihood opportunities for a partner GK Community. Top executives served as mentors to the students, and guided them as they learned about the basics of starting and running a business, as well as strategy development and management. The mentors also critiqued the business ideas presented by the students. The business, which our volunteer mentors assisted in, will be tested and implemented in 2016 for the benefit of the GK Zabarte community in Quezon City.
In July, PHINMA HERO, in partnership with PNRC, held another blood donation drive at PHINMA Plaza. There were more than 50 people willing to donate blood, and although not all were cleared to donate, the desire to make life better and save a life was evident in all those who went.
The HERO program will continue to collaborate with the different CSR Groups of the company, as well as strengthen its partnership with the various adopted communities and beneficiaries in order to provide more meaningful avenues for employee volunteerism. Through these efforts, HERO continues to work towards achieving 100% volunteer participation within the PHINMA Group in 2016.
When typhoon Lando hit in 2015, UGC Nueva Ecija employees participated in relief operations for fellow employees, their families and other communities affected by the storm.
In Davao, the city government partnered with UGC in providing the motoring public with better, newer street signs for traffic control.
UGC also targeted the repair and restoration of dilapidated sheds located along the highways and near schools. In partnership with local barangay officials, UGC North Mindanao has successfully implemented these initiatives, providing safe haven for commuters during rainy or sunny days.
UGC joined hands with the Philippine National Red Cross (PNRC) in a volunteer bloodletting program for the Blood Bank of the PNRC. Many employees volunteered for this endeavor, and it has since become one of UGC’s regular activities.
Individual Social Responsibility
PHINMA lives up to its mission of making lives better as it continues to empower and encourage its employees to join its efforts towards nation building through the PHINMA HERO Network. PHINMA HERO seeks to inspire, equip, and mobilize PHINMA employees to make life better through volunteering and giving.
In celebration of its 6th year, the HERO Network invited Tony Meloto of Gawad Kalinga to speak to the employee volunteers during the HERO Anniversary. The celebration was a success, attracting more than 100 volunteers to listen to his inspirational message about the importance of doing more for our less fortunate brothers and sisters, and how we should help them become self-sustaining citizens contributing to society.

40 PHINMA CORPORATION
FINANCIAL REPORT
2015 Annual Report 41
Report of Audit Committee to the Board Of DirectorsThe Board of DirectorsPHINMA Corporation
The Audit Committee is composed of one (1) independent director, two (2) non-executive directors and one (1) executive director. An independent director chairs the Audit Committee.The Committee has accounting expertise and adequate understanding of the Company’s business and industry in which it operates.
The roles and responsibilities of the Audit Committee are defined in the Audit Committee Charter approved by the Board of Directors. We assist the Board of Directors in fulfilling its oversight responsibility to the shareholders relating to the financial statements and financial reporting process, internal control system, internal and external auditor’s performance, risk management, and compliance with legal and regulatory matters.
We are pleased to report our activities for Calendar Year 2015.
The Audit Committee had six (6) meetings during the year of which two (2) meetings were on risk management. The first four meetings obtained complete attendance while the last two meetings only had three members in attendance. Overall, attendance is at ninety two percent (92%). The meetings were timed to review the quarterly and yearly financial reporting of the Company. Also, the Committee reviewed the results of the annual audit of the external auditor, SGV & Co., the findings and status of Group Internal Audit’s engagements, the status of Business Resiliency and Integrity Assurance activities and the 2014 Audit Committee Report.
We received information and support from Management, the Compliance Officer and Group Internal Audit to enable us to effectively carry out our functions as defined in the Audit Committee Charter approved by the Board of Directors.
ACTIVITIES
Management’s Financial Report
We reviewed and endorsed to the Board of Directors for approval the 2014 audited consolidated financial statements and the 2015 unaudited quarterly consolidated financial statements.
Informatively, in our first meeting for 2016 held on March 3, 2016, we likewise reviewed and endorsed to the Board of Directors for approval the 2015 audited consolidated financial statements presented in this 2015 annual report. These activities were performed in the following context:• Management has the primary responsibility for the financial statements and the financial reporting process.• SyCip, Gorres, Velayo & Co. (SGV & Co.) is responsible for expressing an opinion on the annual audited consolidated
financial statements in accordance with Philippine Financial Reporting Standards.
The related party transactions were also reviewed for potential conflicts of interest. The Audit Committee found these related party transactions to be part of the regular course of business with terms and conditions based on market and in the best interest of the Company.

42 PHINMA CORPORATION
External Audit
We endorsed to the Board of Directors the nomination of Sycip, Gorres, Velayo & Co. (SGV) as the Company’sexternal auditor for 2015. We reviewed and approved the scope and deliverables of the SGV audit plan. The Committee ensured that SGV’s scope included the review of Company’s compliance to Philippine Financial Reporting Standards (PFRS). Non-audit services and related fees for their services were also reviewed and we concluded that these fees are not significant to impair their independence.
We also approved the endorsement to the Board of Directors to retain SGV & Co. as the external auditor for 2016 as discussed in our Committee meeting held March 3, 2016.
Internal Audit
We reviewed and approved the Internal Audit plan for 2015 and found them to be appropriate. Based on this plan, the Committee received and reviewed the audit reports submitted by Group Internal Auditand found that the Company’s internal control system is adequate and effective. Various audit and control issues including actions taken by management were discussed in the Committee meetings. This is to ensure that management has taken appropriate corrective actions in a timely manner.
We also reviewed the organization and performance of Group Internal Audit for 2015 and found them to be sufficiently independent and effective.
Business Resiliency Program
We reviewed the status of ongoing activities related to the Business Resiliency program as we are tasked to lead and monitor the same. This program encompasses a wide range of disciplines, including Business Continuity Management and Risk Management. We believe the program is both comprehensive and efficient in terms of themanagement and resolution of the company’s risks.
Integrity Assurance Program
We reviewed the status of ongoing activities related to the Integrity Assurance program. This program provides a formal structure for institutionalizing policies, programs and mechanisms based on good corporate governance and ethical business practices, including the adoption of the Code of Business Conduct and the creation of a whistleblower policy and hotline. The Company’s officers and employees have substantially complied with the policies under the Code.
Audit Committee Performance
We performed a self-assessment of the Committee’s performance against the approved Audit Committee Charter in line with the guidelines issued by Securities and Exchange Commission for publicly listed companies.
ROBERTO F. DE OCAMPO FILOMENO G. FRANCISCOChairman, Independent Director Vice Chairman, Non-executive Director
MAGDALENO B. ALBARRACIN, JR VICTOR J. DEL ROSARIONon-executive Director Executive Director
2015 Annual Report 43
Statement of Management’s Responsibility for the Consolidated Financial Statements
OSCAR J. HILADOChairman of the Board
RAMON R. DEL ROSARIOPresident and Chief Executive Officer
VICTOR J. DEL ROSARIOExecutive Vice President and Chief Financial Officer
The management of PHINMA CORPORATION AND SUBSIDIARIES is responsible for the preparation and fair presentation of the consolidated financial statements at December 31, 2015 and 2014 and for the three years in the period ended December 31, 2015, including the additional components attached therein, in accordance with Philippine Financial Reporting Standards. This responsibility includes designing and implementing internal controls relevant to the preparation and fair presentation of the consolidated financial statements that are free from material misstatement, whether due to fraud or error, selecting and applying appropriate accounting policies, and making accounting estimates that are reasonable in the circumstances.
The Board of Directors reviews and approves the consolidated financial statements and submits the same to the stockholders. Sycip Gorres Velayo & Co., the independent auditors, appointed by the stockholders has examined the consolidated financial statements of the company in accordance with Philippine Standards on Auditing and in ts report to the stockholders, has expressed its opinion on the fairness of presentation upon completion of such examination.
Signed on this 4th day of March 2016
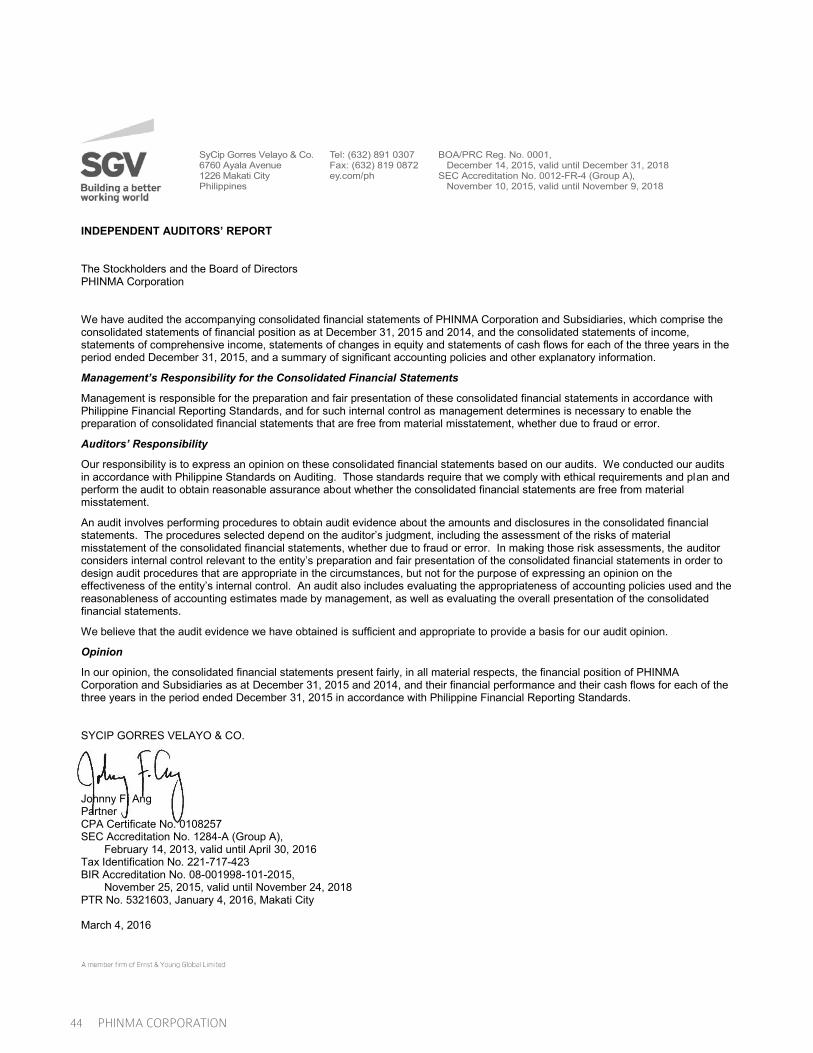
44 PHINMA CORPORATION
INDEPENDENT AUDITORS’ REPORT
The Stockholders and the Board of Directors PHINMA Corporation
We have audited the accompanying consolidated financial statements of PHINMA Corporation and Subsidiaries, which comprise the consolidated statements of financial position as at December 31, 2015 and 2014, and the consolidated statements of income, statements of comprehensive income, statements of changes in equity and statements of cash flows for each of the three years in the period ended December 31, 2015, and a summary of significant accounting policies and other explanatory information.
Management’s Responsibility for the Consolidated Financial Statements
Management is responsible for the preparation and fair presentation of these consolidated financial statements in accordance with Philippine Financial Reporting Standards, and for such internal control as management determines is necessary to enable the preparation of consolidated financial statements that are free from material misstatement, whether due to fraud or error.
Auditors’ Responsibility
Our responsibility is to express an opinion on these consolidated financial statements based on our audits. We conducted our audits in accordance with Philippine Standards on Auditing. Those standards require that we comply with ethical requirements and plan and perform the audit to obtain reasonable assurance about whether the consolidated financial statements are free from material misstatement.
An audit involves performing procedures to obtain audit evidence about the amounts and disclosures in the consolidated financial statements. The procedures selected depend on the auditor’s judgment, including the assessment of the risks of material misstatement of the consolidated financial statements, whether due to fraud or error. In making those risk assessments, the auditor considers internal control relevant to the entity’s preparation and fair presentation of the consolidated financial statements in order to design audit procedures that are appropriate in the circumstances, but not for the purpose of expressing an opinion on the effectiveness of the entity’s internal control. An audit also includes evaluating the appropriateness of accounting policies used and the reasonableness of accounting estimates made by management, as well as evaluating the overall presentation of the consolidated financial statements.
We believe that the audit evidence we have obtained is sufficient and appropriate to provide a basis for our audit opinion.
Opinion
In our opinion, the consolidated financial statements present fairly, in all material respects, the financial position of PHINMA Corporation and Subsidiaries as at December 31, 2015 and 2014, and their financial performance and their cash flows for each of the three years in the period ended December 31, 2015 in accordance with Philippine Financial Reporting Standards.
SYCIP GORRES VELAYO & CO.
Johnny F. Ang Partner CPA Certificate No. 0108257 SEC Accreditation No. 1284-A (Group A),
February 14, 2013, valid until April 30, 2016 Tax Identification No. 221-717-423 BIR Accreditation No. 08-001998-101-2015,
November 25, 2015, valid until November 24, 2018 PTR No. 5321603, January 4, 2016, Makati City
March 4, 2016
SyCip Gorres Velayo & Co. 6760 Ayala Avenue 1226 Makati City Philippines
Tel: (632) 891 0307 Fax: (632) 819 0872 ey.com/ph
BOA/PRC Reg. No. 0001, December 14, 2015, valid until December 31, 2018 SEC Accreditation No. 0012-FR-4 (Group A), November 10, 2015, valid until November 9, 2018

2015 Annual Report 45
PHINMA CORPORATION AND SUBSIDIARIES CONSOLIDATED STATEMENTS OF FINANCIAL POSITION December 31 2015 2014
(Amounts in Thousands)
ASSETS Current Assets Cash and cash equivalents (Notes 9, 33 and 34) P=467,882 P=559,611 Investments held for trading (Notes 10, 33 and 34) 503,088 794,205 Trade and other receivables (Notes 11, 30, 33 and 34) 1,411,003 1,010,277 Inventories (Note 12) 787,114 1,148,898 Input value-added taxes 10,314 17,369 Other current assets 117,466 96,230 Total Current Assets 3,296,867 3,626,590 Noncurrent Assets Investments in associates - at equity (Note 13) 3,268,338 2,533,201 AFS investments (Notes 14, 33 and 34) 71,529 55,515 Property, plant and equipment (Notes 15 and 21) 4,058,496 2,469,337 Investment properties (Note 16 and 21) 1,113,763 431,702 Intangible assets (Notes 6 and 17) 2,216,711 1,072,557 Deferred tax assets - net (Note 31) 118,079 84,611 Other noncurrent assets (Note 18) 35,397 35,832 Total Noncurrent Assets 10,882,313 6,682,755 P=14,179,180 P=10,309,345
LIABILITIES AND EQUITY Current Liabilities Notes payable (Notes 19, 33 and 34) P=280,724 P=390,054 Trade and other payables (Notes 20, 33 and 34) 905,462 561,969 Unearned revenues - inclusive of current portion of deferred rent revenue of P=1.2 million
in 2015 and 2014 (Note 30) 466,531 308,201 Trust receipts payable (Notes 12, 33 and 34) – 200,497 Income and other taxes payable 64,612 41,689 Current portion of long-term debt (Notes 21, 30, 33 and 34) 136,676 132,382 Due to related parties (Notes 30, 33 and 34) 244,901 44,777 Total Current Liabilities 2,098,906 1,679,569 Noncurrent Liabilities Long-term debt - net of current portion (Notes 21, 30, 33 and 34) 3,323,968 912,288 Deferred tax liabilities - net (Note 31) 360,988 252,632 Pension and other post-employment benefits (Notes 30 and 32) 315,946 217,857 Deferred rent revenue - net of current portion (Note 30) 42,563 43,730 Other noncurrent liabilities (Note 30) 25,058 14,555 Total Noncurrent Liabilities 4,068,523 1,441,062 Total Liabilities 6,167,429 3,120,631 Equity Attributable to Equity Holders of the Parent Capital stock (Note 22) 2,604,284 2,604,284 Additional paid-in capital 259,248 259,248 Treasury shares (Note 22) (13,593) – Exchange differences on translation of foreign operations 33,378 5,983 Other reserves (12,033) (4,315) Share in other comprehensive income of associates 25,680 18,372 Retained earnings (Note 22) 3,957,447 3,688,989 Equity attributable to equity holders of the parent 6,854,411 6,572,561 Non-controlling Interests 1,157,340 616,153 Total Equity 8,011,751 7,188,714 P=14,179,180 P=10,309,345 See accompanying Notes to Consolidated Financial Statements.
PHINMA CORPORATION AND SUBSIDIARIES
CONSOLIDATED STATEMENTS OF FINANCIAL POSITION

46 PHINMA CORPORATION
PHINMA CORPORATION AND SUBSIDIARIES CONSOLIDATED STATEMENTS OF INCOME Years Ended December 31 2015 2014 2013 (Amounts in Thousands, Except Per Share Data)
REVENUES Sale of goods P=3,653,504 P=3,639,445 P=3,252,946 Tuition, school fees and other services 1,491,029 1,031,381 824,709 Consultancy services 384,249 534,335 519,849 Hospital routine services 93,278 85,676 81,728 Rental income (Note 16) 62,463 47,048 44,813 Investment income (Note 23) 13,967 28,797 27,277 Animation Services – – 32,857 5,698,490 5,366,682 4,784,179
COSTS AND EXPENSES Cost of sales (Note 24) 2,856,728 2,916,789 2,572,299 Cost of educational, animation, hospital and consultancy service (Note 24) 731,932 582,452 588,382 General and administrative expenses (Note 25) 1,100,427 950,248 913,340 Selling expenses (Note 26) 542,652 534,814 476,565 5,231,739 4,984,303 4,550,586
OTHER INCOME (CHARGES) Equity in net earnings of associates (Note 13) 269,617 65,857 161,691 Interest expense and other financing charges (Note 29) (138,145) (91,498) (84,417) Impairment of goodwill (Notes 5 and 17) (10,343) – – Gain on conversion of investment in preferred shares to common shares
(Note 13) – 23,161 – Loss on sale of investment property (Note 16) (8,296) – – Gain on sale of property, plant and equipment - net (Note 15) 6,838 – – Reversal of (provision for) unrecoverable input value-added tax (Note 18) 3,054 (3,808) 1,807 Foreign exchange gains (losses) - net (Note 33) (376) (3,144) 4,247 Net gains (losses) on derivatives (Note 34) 345 (24) (8,458) Others - net (3,686) 19,458 10,531 119,008 10,002 85,401
INCOME BEFORE INCOME TAX 585,759 392,381 318,994
PROVISION FOR (BENEFIT FROM) INCOME TAX (Note 31) Current 126,689 101,679 71,646 Deferred (27,650) (11,305) (14,341) 99,039 90,374 57,305
NET INCOME P=486,720 P=302,007 P=261,689
Attributable to Equity holders of the Parent P=386,091 P=246,548 P=224,040 Non-controlling interests 100,629 55,459 37,649 Net income P=486,720 P=302,007 P=261,689
Basic/Diluted Earnings Per Common Share - Attributable to Equity Holders of the Parent (Note 36) P=1.49 P=0.95 P=0.86
See accompanying Notes to Consolidated Financial Statements.
PHINMA CORPORATION AND SUBSIDIARIES
CONSOLIDATED STATEMENTS OF INCOME

2015 Annual Report 47
PHINMA CORPORATION AND SUBSIDIARIES CONSOLIDATED STATEMENTS OF COMPREHENSIVE INCOME Years Ended December 31 2015 2014 2013 (Amounts in Thousands, Except Per Share Data)
NET INCOME P=486,720 P=302,007 P=261,689
OTHER COMPREHENSIVE INCOME (LOSS) Items not to be reclassified to profit or loss in subsequent periods Re-measurement gain (loss) on defined benefit obligation (Note 32) (16,108) (7,456) 11,449 Re-measurement gain (loss) on defined benefit obligation of associates
(Note 13) (338) 3,049 (1,196) Income tax effect 3,526 711 (2,687) (12,920) (3,696) 7,566 Items to be reclassified to profit or loss in subsequent periods Exchange differences on translation of foreign operations 27,395 11,833 (4,982) Unrealized gain (loss) on change in fair value of AFS investments (Note 14) 11,411 – (350) Share in unrealized gain (loss) on change in fair value of AFS investments
of associates (Note 13) 7,308 (7,241) 3,022 Share in net other comprehensive loss of a joint venture of an associate
(Note 13) – (1,173) – 46,114 3,419 (2,310) Total other comprehensive income (loss) 33,194 (277) 5,256
TOTAL COMPREHENSIVE INCOME P=519,914 P=301,730 266,945
Attributable to Equity holders of the Parent P=418,748 P=244,087 P=229,783 Non-controlling interests 101,166 57,643 37,162 Total comprehensive income P=519,914 P=301,730 P=266,945 See accompanying Notes to Consolidated Financial Statements.
PHINMA CORPORATION AND SUBSIDIARIES
CONSOLIDATED STATEMENTS OF COMPREHENSIVE INCOME

48 PHINMA CORPORATION
PHIN
MA
CO
RPO
RAT
ION
AN
D S
UB
SID
IAR
IES
CO
NSO
LID
ATED
STA
TEM
ENTS
OF
CH
ANG
ES IN
EQ
UIT
Y
Equi
ty A
ttrib
utab
le to
Equ
ity H
olde
rs o
f the
Par
ent
Ca
pita
l Sto
ck
(Note
22)
Addi
tiona
l Pa
id-in
Ca
pita
l Tr
easu
ry
Shar
es
Exch
ange
Di
ffere
nces
on
Tran
slatio
n of
Fo
reig
n Op
erat
ions
Ot
her
Rese
rves
Shar
e in
Othe
r Co
mpr
ehen
sive
Inco
me o
f As
socia
tes
(Note
13)
Subt
otal
Non-
co
ntro
lling
Inte
rest
s To
tal
Equi
ty
Reta
ined
Ear
ning
s (No
te 22
) Ap
prop
riate
d Un
appr
opria
ted
(A
mou
nts i
n Th
ousa
nds)
Balan
ce, J
anua
ry 1,
2015
P=2
,604,2
84
P=259
,248
P=–
P=5,98
3 (P=
4,315
) P=1
8,372
P=1
,000,0
00
P=2,68
8,989
P=6
,572,5
61
P=616
,153
P=7,18
8,714
Ne
t inco
me
– –
– –
–
– 38
6,091
38
6,091
10
0,629
48
6,720
Ot
her c
ompr
ehen
sive i
ncom
e (los
s)
– –
– 27
,395
11,41
1 7,3
08
– (1
3,457
) 32
,657
537
33,19
4 To
tal co
mpr
ehen
sive i
ncom
e
– –
– 27
,395
11,41
1 7,3
08
– 37
2,634
41
8,748
10
1,166
51
9,914
Ca
sh di
viden
ds (
Note
22)
– –
– –
– –
– (1
04,17
6)
(104
,176)
(5
7,882
) (1
62,05
8)
Acqu
isitio
n of n
on-co
ntroll
ing in
teres
t (No
te 7)
–
– –
– (1
2,241
) –
– –
(12,2
41)
9,241
(3
,000)
Bu
sines
s com
binati
on (N
ote 6)
–
– –
– –
– –
– –
492,0
62
492,0
62
Disp
osal
of sh
ares
in su
bsidi
ary (
Note
7)
– –
– –
(6,88
8)
– –
– (6
,888)
(3
,400)
(1
0,288
) Bu
ybac
k of s
hare
s (No
te 22
) –
– (1
3,593
) –
– –
– –
(13,5
93)
– (1
3,593
) Ba
lance
, Dec
embe
r 31,
2015
P=2
,604,2
84
P=259
,248
(P=13
,593)
P=3
3,378
(P=
12,03
3)
P=25,6
80
P=1,00
0,000
P=2
,957,4
47
P=6,85
4,411
P=1
,157,3
40
P=8,01
1,751
Balan
ce, J
anua
ry 1,
2014
P=2
,596,6
54
P=258
,958
P=–
(P=5,8
50)
P=8,68
2 P=2
6,786
P=1
,000,0
00
P=2,55
2,193
P=6
,437,4
23
P=594
,558
P=7,03
1,981
Ne
t inco
me
– –
– –
– –
– 24
6,548
24
6,548
55
,459
302,0
07
Othe
r com
preh
ensiv
e inc
ome (
loss)
–
– –
11,83
3 –
(8,41
4)
– (5
,880)
(2
,461)
2,1
84
(277
) To
tal co
mpr
ehen
sive i
ncom
e (los
s)
– –
– 11
,833
– (8
,414)
–
240,6
68
244,0
87
57,64
3 30
1,730
Ca
sh di
viden
ds (N
ote 22
) –
– –
– –
– –
(103
,872)
(1
03,87
2)
(45,7
09)
(149
,581)
Ac
quisi
tion o
f non
-contr
olling
inter
est (
Note
7)
– –
– –
(5,19
3)
– –
– (5
,193)
9,6
61
4,468
St
ock p
urch
ase p
lan (N
ote 2
2)
– –
– –
116
– –
– 11
6 –
116
Issua
nces
(Note
22)
7,6
30
290
– –
(7,92
0)
– –
– –
– –
Balan
ce, D
ecem
ber 3
1, 20
14
P=2,60
4,284
P=2
59,24
8 P=–
P=5
,983
(P=4,3
15)
P=18,3
72
P=1,00
0,000
P=2
,688,9
89
P=6,57
2,561
P=6
16,15
3 P=7
,188,7
14
Balan
ce, J
anua
ry 1,
2013
P=2
,588,9
46
P=256
,495
P=–
(P=86
8)
P=13,1
36
P=23,7
64
P=1,00
0,000
P=2
,423,6
62
P=6,30
5,135
P=5
86,03
1 P=6
,891,1
66
Net in
com
e –
– –
– –
– –
224,0
40
224,0
40
37,64
9 26
1,689
Ot
her c
ompr
ehen
sive i
ncom
e (los
s)
– –
– (4
,982)
(3
50)
3,022
–
8,053
5,7
43
(487
) 5,2
56
Total
com
preh
ensiv
e inc
ome (
loss)
–
– –
(4,98
2)
(350
) 3,0
22
– 23
2,093
22
9,783
37
,162
266,9
45
Cash
divid
ends
(Note
22)
– –
– –
– –
– (1
03,56
2)
(103
,562)
(2
8,635
) (1
32,19
7)
Stoc
k pur
chas
e plan
(Note
22)
–
– –
– 6,0
67
– –
– 6,0
67
– 6,0
67
Issua
nces
(Note
22)
7,7
08
2,463
–
– (1
0,171
) –
– –
– –
– Ba
lance
, Dec
embe
r 31,
2013
P=2
,596,6
54
P=258
,958
P=–
(P=5,8
50)
P=8,68
2 P=2
6,786
P=1
,000,0
00
P=2,55
2,193
P=6
,437,4
23
P=594
,558
P=7,03
1,981
Se
e ac
com
pany
ing
Not
es to
Con
solid
ated
Fin
anci
al S
tate
men
ts
PH
INM
A C
OR
PO
RA
TIO
N A
ND
SU
BS
IDIA
RIE
S
CO
NS
OLI
DA
TED
STA
TEM
EN
TS O
F C
HA
NG
ES
IN E
QU
ITY

2015 Annual Report 49
PHINMA CORPORATION AND SUBSIDIARIES CONSOLIDATED STATEMENTS OF CASH FLOWS Years Ended December 31 2015 2014 2013
(Amounts in Thousands)
CASH FLOWS FROM OPERATING ACTIVITIES Income before income tax P=585,759 P=392,381 P=318,994 Adjustments to reconcile income before income tax to net cash flows: Equity in net earnings of associates (Note 13) (269,617) (65,857) (161,691) Depreciation and amortization (Note 28) 209,146 202,368 184,726 Interest expense and other financing charges (Note 29) 138,145 91,498 84,417 Pension and other employee benefits expense (Note 32) 54,985 36,856 38,630 Impairment loss on goodwill (Note 17) 10,343 – – Gain on sale of property and equipment (6,838) (165) 25 Interest income (Note 23) (8,015) (13,548) (22,962) Loss on sale of investment property 8,296 – –
Reversal of provision in input VAT (3,054) – – Dividend income (Note 23) (253) (1,072) (2,034) Gain on conversion of investment in preferred shares to common shares
(Note 13) – (23,161) – Gain on sale of AFS investments – (3,791) (350) Unrealized foreign exchange loss - net 376 549 4,394 Stock purchase plan expense (Note 22) – 116 6,067 Net loss (gain) on derivatives (Note 34) (345) 24 8,458 Operating income before working capital changes 718,928 616,198 458,674 Decrease (increase) in: Inventories 376,704 (345,330) 152,904 Trade and other receivables (356,741) (123,010) (28,007) Investments held for trading 291,899 100,383 (96,587) Other current assets (2,726) (16,214) 3,569 Increase (decrease) in: Trust receipts payable (200,497) 156,450 (511,385) Unearned revenues 139,271 72,622 36,196 Trade and other payables 95,716 (122,288) 101,349 Other taxes payable 194 8,751 (923) Cash from operations 1,062,748 347,562 115,790 Interest paid (127,887) (94,692) (82,123) Income tax paid (76,116) (94,777) (78,655) Net cash provided by (used in) operating activities 858,745 158,093 (44,988)
CASH FLOWS FROM INVESTING ACTIVITIES Additions to: Property, plant and equipment (Note 15) (532,464) (215,026) (462,012) Investments in associates (Notes 13 and 39) (306,813) (1,770) (6,197) AFS investments – – (3,116) Proceeds from sale/settlement of: Property, plant and equipment 108,127 71,677 4,408 Investment properties 16,929 – – AFS investments – 107,447 10,101 Forward currency contracts (Note 34) – (24) (7,930) Dividends received (Note 13) 55,415 56,102 76,514 Adjustments to acquisition cost of subsidiaries (Notes 6 and 16) – 39,361 – Payments of long-term loans payable related to acquisition of a subsidiary – (25,198) (15,938) Interest received 7,545 14,001 29,628 Acquisition of subsidiary - net of cash acquired (Note 6) (2,390,057) – – Decrease (increase) in other noncurrent assets (23,509) (72,518) 34,166 Net cash used in investing activities (3,064,827) (25,948) (340,376)
(Forward)
PHINMA CORPORATION AND SUBSIDIARIES
CONSOLIDATED STATEMENTS OF CASH FLOWS

50 PHINMA CORPORATION
Years Ended December 31 2015 2014 2013
(Amounts in Thousands)
CASH FLOWS FROM FINANCING ACTIVITIES Proceeds from availment of: Long-term debt (Note 21) P=2,479,377 P=– P=745,927 Notes payable (Note 19) 1,950,000 602,900 193,478 Payments of: Notes payable (2,059,330) (359,453) (426,837) Cash dividends (155,219) (145,732) (127,060) Long-term debt (78,403) (132,514) (6,688)
Treasury shares (13,593) – – Increase (decrease) in due to related parties (6,537) (9,604) 13,664 Acquisition of non-controlling interests (Note 7) (3,000) – – Net cash provided by (used in) financing activities 2,113,295 (44,403) 392,484
EFFECT OF EXCHANGE RATE CHANGES ON CASH AND CASH EQUIVALENTS 1,058 (839) 409
NET INCREASE (DECREASE) IN CASH AND CASH EQUIVALENTS (91,729) 86,903 7,529
CASH AND CASH EQUIVALENTS AT BEGINNING OF YEAR (Note 9) 559,611 472,708 465,179
CASH AND CASH EQUIVALENTS AT END OF YEAR (Note 9) P=467,882 P=559,611 P=472,708 See accompanying Notes to Consolidated Financial Statements.

2015 Annual Report 51
PHINMA CORPORATION AND SUBSIDIARIES NOTES TO CONSOLIDATED FINANCIAL STATEMENTS 1. Corporate Information
PHINMA Corporation (PHN or the Parent Company) was incorporated in the Philippines and registered with the Philippine Securities and Exchange Commission (SEC) on March 12, 1957. On August 2, 2006, the Philippine SEC approved the extension of the Parent Company’s corporate life for another 50 years. On May 27, 2010, the Philippine SEC approved the change in the Parent Company’s corporate name from Bacnotan Consolidated Industries, Inc. to PHINMA Corporation. Its principal activity is investment holdings of shares in various subsidiaries, associates and affiliates and other financial instruments.
Following are the subsidiaries of the Parent Company and the nature of their principal business activities:
Calendar/Fiscal Yearend
December 31, 2015 December 31, 2014
Name of Subsidiaries Nature of Business
PHN Direct
Interest
Direct Interest of
Subsidiary
PHN Effective Interest
PHN Direct
Interest
Direct Interest of Subsidiary
PHN Effective Interest
Union Galvasteel Corporation (UGC) Manufacturing and distribution of steel products December 31 98.08 – 98.08 98.08 – 98.08
PHINMA Education Holdings, Inc. (PEHI) (a and b) Holding Company March 31 100.00 – 100.00 – – – Pamantasan ng Araullo (Araullo University), Inc. (AU) (b) Educational institution March 31 – 78.64 78.64 78.64 – 78.64 Cagayan de Oro College, Inc. (COC) (b) Educational institution March 31 – 74.21 74.21 74.21 – 74.21 University of Iloilo (UI) (b) Educational institution March 31 – 69.79 69.79 69.79 – 69.79 University of Pangasinan (UPANG) and Subsidiaries(b and c) Educational institution March 31 – 69.75 69.75 69.75 – 69.75 Southwestern University (SWU) (b and d) Educational Institution May 31 – 73.74 73.74 – – – Fuld & Company, Inc. (Fuld U.S.) and Subsidiary Business research December 31 85.00 – 85.00 85.00 – 85.00 Fuld & Company (Philippines), Inc. (Fuld Philippines) Business research December 31 100.00 – 100.00 85.00 – 85.00 Career Academy Asia, Inc. (CAA)(e) Educational Institution March 31 100.00 – 100.00 100.00 – 100.00 P & S Holdings Corporation (PSHC) Investment and real
estate holdings December 31 60.00 – 60.00 60.00 – 60.00 Asian Plaza, Inc. (API) Lease of real property December 31 57.62 – 57.62 57.62 – 57.62 One Animate Limited (OAL) and Subsidiary (f) Business Process
Outsourcing - Animation services December 31 80.00 – 80.00 80.00 – 80.00
(a) On August 28, 2015, PEHI was incorporated and duly registered with the Philippine SEC as a wholly owned subsidiary of PHN and acts as a
holding company for PHN’s investment in educational institutions. In December 2015, PHN sold to PEHI its ownership interest in AU, COC, UI, UPANG and SWU.
(b) Balances as at and for the year ended December 31 of these subsidiaries were used for consolidation purposes.
In December 2015, PHN sold to PEHI its ownership interest in AU, COC, UI, UPANG and SWU.
(c) On November 11, 2014, UPANG established a new educational institution – PHINMA-UPANG College Urdaneta, Inc. which was incorporated and duly registered with the Philippine SEC as a wholly owned subsidiary of UPANG.
In 2015, UPANG disposed its subsidiary, University of Pangasinan Medical Center, Inc. (UPMCI).
(d) In April to May 2015, PHN acquired a 62.52% controlling interest in SWU. Additional interests were subsequently acquired until August 2015 increasing the total interest of PHN to 73.74%.
(e) On November 28, 2014, CAA was incorporated and duly registered with the Philippine SEC. It will engage in providing technical vocational education and training programs. As at December 31, 2015, the Company has not yet started its commercial operation.
(f) OAL owns 100% interest in Toon City Animation, Inc. (Toon City). OAL and Toon City ceased operations in April 2013.
The Parent Company and its subsidiaries (collectively referred to as “the Company”) are all incorporated in the Philippines, except for OAL and Fuld U.S. OAL is incorporated in Hong Kong while Fuld U.S. is incorporated in the United States of America. The Company’s ultimate parent company is Philippine Investment-Management (PHINMA), Inc., which is also incorporated in the Philippines.
The information on the segments of the Company is presented in Note 37.
The registered office address of the Parent Company is 12th Floor, Phinma Plaza, 39 Plaza Drive, Rockwell Center, Makati City.
The consolidated financial statements as at December 31, 2015 and 2014 and for each of the three years in the period then ended December 31, 2015 were reviewed and recommended for approval by the Audit Committee on March 3, 2016. The same consolidated financial statements were approved and authorized for issuance by the Board of Directors (BOD) on March 4, 2016.
PHINMA CORPORATION AND SUBSIDIARIES
NOTES TO CONSOLIDATED FINANCIAL STATEMENTS

52 PHINMA CORPORATION
2. Basis of Preparation and Statement of Compliance
Basis of Preparation and Compliance The accompanying consolidated financial statements of the Company have been prepared on a historical cost basis, except for investments held for trading, available-for-sale (AFS) investments and derivative financial instruments that are measured at fair values. The consolidated financial statements are presented in Philippine peso (P=) which is the Parent Company’s functional and presentation currency. All values are rounded to the nearest thousand peso, except when otherwise indicated.
The accompanying consolidated financial statements have been prepared in compliance with Philippine Financial Reporting Standards (PFRS). PFRS include statements named PFRS and Philippine Accounting Standards (PAS) and Philippine Interpretations from the International Financial Interpretations Committee (IFRIC) issued by the Financial Reproting Standards Council (FRSC).
The consolidated financial statements provide comparative information in respect of the previous periods.
Basis of Consolidation The consolidated financial statements include the accounts of the Parent Company and all the subsidiaries mentioned in Note 1. Control is achieved when the Company is exposed, or has rights, to variable returns from its involvement with the investee and has the ability to affect those returns through power over the investee. Specifically, the Company controls an investee if and only if the Company has:
power over the investee (i.e. existing rights that give the current ability to direct the relevant activities of the investee); exposure, or rights, to variable returns from its involvement with the investee; and the ability to use its power over the investee to affect its returns.
When the Company has less than majority of the voting rights or similar rights to an investee, the Company considers all relevant facts and circumstances in assessing whether it has power over an investee, including:
the contractual arrangement with the other vote holders of the investee; rights arising from other contractual arrangements; and the Company’s voting rights and potential voting rights.
The Company re-assesses whether or not it controls an investee if facts and circumstances indicate that there are changes to one or more of the three elements of control.
Consolidation of a subsidiary begins, when the Company obtains control over the subsidiary and ceases when the Company loses control of the subsidiary. Assets, liabilities, income and expenses of a subsidiary acquired or disposed of during the year are included in the consolidated statement of income from the date the Company obtains control until the date the Company ceases to control the subsidiary.
Profit or loss and each component of Other Comprehensive Income (OCI) are attributed to the equity holders of the Parent of the Company and to the non-controlling interests (NCI), even if this results in the NCI having a deficit balance. When necessary, adjustments are made to the consolidated financial statements of subsidiaries to bring their accounting policies into line with the Company’s accounting policies.
All intra-group assets and liabilities, equity, income expenses and cash flows relating to transactions between members of the Company are eliminated in full on consolidation.
NCI represents the portion of profit or loss and the net assets not held by owners of the Parent Company and are presented separately in the consolidated statement of comprehensive income and within equity in the consolidated statement of financial position, separately from total equity attributable to owners of the Parent Company.
A change in the ownership interest of a subsidiary, without a loss of control, is accounted for as an equity transaction and is shown as part of “Other reserves” under the consolidated statement of changes in equity. If the Company loses control over a subsidiary, it:
derecognizes the assets (including goodwill) and liabilities of the subsidiary; derecognizes the carrying amount of any NCI; derecognizes the cumulative translation differences, recorded in equity; recognizes the fair value of the consideration received; recognizes the fair value of any investment retained; recognizes any surplus or deficit in profit or loss; reclassifies the parent’s share of components previously recognized in OCI to profit or loss or retained earnings, as
appropriate.

2015 Annual Report 53
3. Changes in Accounting Policies and Disclosures
Current Changes in Accounting Policies and Disclosures The accounting policies adopted are consistent with those of the previous financial year except for the following amendments to PFRS, which were effective beginning January 1, 2015. Except as otherwise stated, the adoption of the following new and amended Standards and Philippine Interpretations did not have any impact on the financial statements:
Amendments to PAS 19, Defined Benefit Plans: Employee Contribution
Annual Improvements to PFRS 2010–2012 Cycle
PFRS 2, Share-Based Payment – Definition of Vesting Condition PFRS 3, Business Combination – Accounting for Contingent Consideration in a Business Combination PRFS 8, Operating Segments – Aggregation of Operating Segments and Reconciliation of the Total of the Reportable
Segments’ Assets to the Entity’s Assets PAS 16, Property, Plant and Equipment, and PAS 38, Intangible Assets – Revaluation Method – Proportionate
Restatement of Accumulated Depreciation and Amortization PAS 24, Related Party Disclosures – Key Management Personnel
Annual Improvements to PFRS 2011–2013 Cycle
PFRS 3, Business Combinations – Scope Exceptions for Joint Arrangements PFRS 13, Fair Value Measurement – Portfolio Exception PAS 40, Investment Property
Standards Issued but not yet Effective The standards and interpretations that are issued, but not yet effective, up to the date of issuance of the Company’s financial statements are disclosed below. The Company intends to adopt these standards, if applicable, when they become effective. Except as otherwise indicated, the Company does not expect the adoption of these new and revised standards and amendments to PFRS and Philippine Interpretations of the IFRIC to have a significant impact on the Company’s financial statements.
Deferred
Philippine Interpretation IFRIC 15, Agreements for the Construction of Real Estate
Effective 2016
Amendments to PFRS 10, Consolidated Financial Statements, and PAS 28, Investment in Associates and Joint Ventures - Investment Entities: Applying the Consolidation Exception
Amendments to PAS 27, Separate Financial Statements - Equity Method in Separate Financial Statements
Amendments to PFRS 11, Joint Arrangements - Accounting for Acquisitions of Interests
Amendments to PAS 1, Presentation of Financial Statements - Disclosure Initiative
The amendments are intended to assist entities in applying judgment when meeting the presentation and disclosure requirements in PFRS. They clarify the following:
that entities shall not reduce the understandability of their financial statements by either obscuring material information with immaterial information; or aggregating material items that have different natures or functions
that specific line items in the statement of income OCI and the statement of financial position may be disaggregated that entities have flexibility as to the order in which they present the notes to financial statements that the share of OCI of associates and joint ventures accounted for using the equity method must be presented in
aggregate as a single line item, and classified between those items that will or will not be subsequently reclassified to profit or loss.
Early application is permitted and entities do not need to disclose that fact as the amendments are considered to be clarifications that do not affect an entity’s accounting policies or accounting estimates.
PFRS 14, Regulatory Deferral Accounts

54 PHINMA CORPORATION
Amendments to PAS 16, Property, Plant and Equipment, and PAS 41, Agriculture - Bearer Plants
Amendments to PAS 16,and PAS 38, Intangible Assets - Clarification of Acceptable Methods of Depreciation and Amortization
Annual Improvements to PFRS (2012–2014 Cycle)
PFRS 5, Noncurrent Assets Held-for-Sale and Discontinued Operations - Changes in Methods of Disposal
PFRS 7, Financial Instruments: Disclosures - Servicing Contracts
PFRS 7, Applicability of the Amendments to PFRS 7 to Condensed Interim Financial Statements
PAS 19, Employee Benefits - Regional Market Issue Regarding Discount Rate
PAS 34, Interim Financial Reporting - Disclosure of Information “Elsewhere in the Interim Financial Report”
Effective in 2018
PFRS 9, Financial Instruments (2014 version)
In July 2014, the IASB issued the final version of IFRS 9, Financial Instruments. The new standard (renamed as PFRS 9) reflects all phases of the financial instruments project and replaces PAS 39, Financial Instruments: Recognition and Measurement, and all previous versions of PFRS 9. The standard introduces new requirements for classification and measurement, impairment, and hedge accounting. PFRS 9 is effective for annual periods beginning on or after January 1, 2018, with early application permitted. Retrospective application is required, but providing comparative information is not compulsory. For hedge accounting, the requirements are generally applied prospectively, with some limited exceptions. Early application of previous versions of PFRS 9 (2009, 2010 and 2013) is permitted if the date of initial application is before February 1, 2015. The Company is currently evaluating the impact of this amendment in the consolidated financial statements.
The following new standards issued by the IASB have not yet been adopted by the FRSC:
International Financial Reporting Standard (IFRS) 15, Revenue from Contract with Customers
IFRS 15 was issued in May 2014 and establishes a new five-step model that will apply to revenue arising from contracts with customers. Under IFRS 15, revenue is recognized at an amount that reflects the consideration to which an entity expects to be entitled in exchange for transferring goods or services to a customer. The principles in IFRS 15 provide a more structured approach to measuring and recognizing revenue. The new revenue standard is applicable to all entities and will supersede all current revenue recognition requirements under IFRS. Either a full or modified retrospective application is required for annual periods beginning on or after January 1, 2018 with early adoption permitted. The Company is currently evaluating the impact of this amendment in the consolidated financial statements.
IFRS 16, Leases
On January 13, 2016, the IASB issued its new standard, IFRS 16, Leases, which will replace International Accounting Standard (IAS) 17, the current leases standard, and the related Interpretations. Under the new standard, lessees will no longer classify their leases as either operating or finance leases in accordance with IAS 17. Rather, lessees will apply the single-asset model. Under this model, lessees will recognize the assets and related liabilities for most leases on their balance sheets, and subsequently, will depreciate the lease assets and recognize interest on the lease liabilities in their profit or loss. Leases with a term of twelve (12) months or less or for which the underlying asset is of low value are exempted from these requirements. The accounting by lessors is substantially unchanged as the new standard carries forward the principles of lessor accounting under IAS 17. Lessors, however, will be required to disclose more information in their financial statements, particularly on the risk exposure to residual value. The new standard is effective for annual periods beginning on or after January 1, 2019. Entities may early adopt IFRS 16 but only if they have also adopted IFRS 15, Revenue from Contracts with Customers. When adopting IFRS 16, an entity is permitted to use either a full retrospective or a modified retrospective approach, with options to use certain transition reliefs. The Company is currently evaluating the impact of this amendment in the consolidated financial statements.
2015 Annual Report 55
4. Summary of Significant Accounting and Financial Reporting Policies
Cash and Cash Equivalents Cash includes cash on hand and in banks. Cash equivalents are short-term, highly liquid investments that are readily convertible to known amounts of cash with original maturities of three months or less from the date of acquisition and are subject to an insignificant risk of change in value.
Financial Instruments - Initial Recognition and Subsequent Measurement
Date of Recognition. The Company recognizes a financial instrument in the consolidated statement of financial position when it becomes a party to the contractual provisions of the instrument. All regular way purchases and sales of financial assets are recognized on the trade date, i.e., the date that the Company commits to purchase the assets. Regular way purchases or sales are purchases or sales of financial assets that require delivery of assets within the period generally established by regulation or convention in the marketplace. Derivatives are recognized on a trade date basis.
Initial Recognition. Financial instruments are recognized initially at fair value, which is the fair value of the consideration given (in case of an asset) or received (in case of a liability). The fair value of the consideration given or received is determined by reference to the transaction price or other market prices. If such market prices are not reliably determinable, the fair value of consideration is estimated as the sum of all future cash payments or receipts, discounted using the prevailing interest rates for similar instruments with similar maturities. The initial measurement of financial instruments, except for financial instruments at fair value through profit or loss (FVPL), includes transaction costs.
The Company classifies its financial instruments into the following categories: financial assets and liabilities at FVPL, loans and receivables, held-to-maturity (HTM) investments, AFS investments, derivatives designated as hedging instruments in an effective hedge and other financial liabilities.
The classification depends on the purpose for which the instruments are acquired and whether they are quoted in an active market. Management determines the classification at initial recognition and, where allowed and appropriate, re-evaluates this classification at every financial reporting date.
Financial instruments are classified as liabilities or equity in accordance with the substance of the contractual arrangement. Interest, dividends, gains and losses relating to a financial instrument or a component that is a financial liability, are reported as expense or income. Distributions to holders of financial instruments classified as equity are charged directly to equity, net of any related income tax benefits.
Day 1 Difference. Where the transaction price in a non-active market is different from the fair value based on other observable current market transactions in the same instrument or based on a valuation technique whose variables include only data from observable market, the Company recognizes the difference between the transaction price and fair value (a ‘Day 1’ difference) in the consolidated statement of income unless it qualifies for recognition as some other type of asset or liability. In cases where unobservable data is used, the difference between the transaction price and model value is only recognized in the consolidated statement of income when the inputs become observable or when the instrument is derecognized. For each transaction, the Company determines the appropriate method of recognizing the ‘Day 1’ difference amount.
Financial Assets and Liabilities at FVPL. This category includes financial assets and liabilities held for trading and those designated upon initial recognition as at FVPL. Financial assets and liabilities are classified as held for trading if they are acquired for the purpose of selling in the near term. Derivatives, including any separated derivatives, are also classified under financial assets or liabilities at FVPL, unless these are designated as hedging instruments in an effective hedge or financial guarantee contracts. Instruments under this category are classified as current assets/liabilities if these are held primarily for the purpose of trading or expected to be realized/settled within 12 months from reporting date. Otherwise, these are classified as noncurrent assets/liabilities.
Financial assets or financial liabilities may be designated at initial recognition as at FVPL when the following criteria are met:
the designation eliminates or significantly reduces the inconsistent treatment that would otherwise arise from measuring the assets or liabilities or recognizing gains or losses on them on a different basis; or
the assets and liabilities are part of a group of financial assets, financial liabilities or both which are managed and their performance evaluated on a fair value basis, in accordance with a documented risk management or investment strategy; or
the financial instrument contains an embedded derivative, unless the embedded derivative does not significantly modify the cash flows or it is clear, with little or no analysis, that it would not be separately recorded.
Financial assets and financial liabilities designated at FVPL are recorded in the consolidated statement of financial position at fair value. Subsequent changes in fair value on financial assets and liabilities designated at FVPL are recorded in the consolidated statement of income as “Net gains from fair value change of investments held for trading” under “Investment income” account. Interest earned or incurred is recorded in “Investment income” account or “Interest expense and other financial charges” account,

56 PHINMA CORPORATION
respectively. Dividend income is recorded according to the terms of the contract, when the right to receive payment has been established.
The Company’s investments held for trading and derivative asset are classified under this category.
Derivative Financial Instruments The Company enters into short-term forward currency contracts to hedge its currency exposure. Such derivative financial instruments are initially recorded at fair value on the date on which the derivative contract is entered into and are subsequently remeasured at fair value. Derivatives are carried as assets when the fair value is positive and liabilities when the fair value is negative. Consequently, gains and losses from changes in fair value of these derivatives are recognized immediately in the consolidated statement of income. The Company has opted not to designate its derivative transactions under hedge accounting. The fair values of freestanding forward currency transactions are calculated by reference to current forward exchange rates for contracts with similar maturity profiles.
Embedded Derivative. An embedded derivative is a component of a hybrid (combined) instrument that also includes a nonderivative host contract with the effect that some of the cash flows of the hybrid instrument vary in a way similar to a stand-alone derivative. An embedded derivative is separated from the host contract and accounted for as a derivative if all of the following conditions are met:
a. the economic characteristics and risks of the embedded derivative are not closely related to the economic characteristics and risks of the host contract;
b. a separate instrument with the same terms as the embedded derivative would meet the definition of a derivative; and c. the hybrid or combined instrument is not recognized as at FVPL.
The Company assesses whether embedded derivatives are required to be separated from the host contracts when the Company becomes a party to the contract. Subsequent reassessment is prohibited unless there is a change in the terms of the contract that significantly modifies the cash flows that otherwise would be required under the contract, in which case reassessment is required. The Company determines whether a modification to cash flows is significant by considering the extent to which the expected future cash flows associated with the embedded derivative, the host contract or both have changed and whether the change is significant relative to the previously expected cash flow on the contract.
Embedded derivatives are measured at fair value and are carried as assets when the fair value is positive and as liabilities when the fair value is negative. Gains and losses from changes in fair value of these derivatives are recognized immediately in the consolidated statement of income.
The Company’s embedded derivatives in loan contracts pertain to interest rate floors. These did not qualify for separate recognition.
Loans and Receivables. Loans and receivables are nonderivative financial assets with fixed or determinable payments that are not quoted in an active market. They are not entered into with the intention of immediate or short-term resale and are not designated as AFS investments or financial assets at FVPL. Loans and receivables are included in current assets if maturity is within 12 months from the end of the financial reporting date. Otherwise, these are classified as noncurrent assets.
After initial measurement, loans and receivables are carried at amortized cost using the effective interest method less any allowance for impairment. Amortized cost is calculated by taking into account any discount or premium on acquisition and fees that are an integral part of the effective interest method. Gains and losses are recognized in the consolidated statement of income when the loans and receivables are derecognized or impaired, as well as through the amortization process.
The Company’s cash and cash equivalents, trade and other receivables and due from related parties are classified under this category.
HTM Investments. HTM investments are quoted nonderivative financial assets with fixed or determinable payments and fixed maturities for which the Company’s management has the positive intention and ability to hold to maturity. When the Company sells other than an insignificant amount of HTM investments, the entire category would be tainted and reclassified as AFS investments. After initial measurement, such assets are carried at amortized cost using the effective interest method less any impairment in value. Gains and losses are recognized in the consolidated statement of income when the HTM investments are derecognized or impaired, as well as through the amortization process. HTM Investments are classified as current if maturity is within 12 months from the reporting date. Otherwise, these are classified as noncurrent assets.
The Company has no financial assets classified as HTM investments as of December 31, 2015 and 2014.
AFS Investments. AFS investments are nonderivative financial assets that are designated in this category or are not classified in any of the three preceding categories. These are purchased and held indefinitely, and may be sold in response to liquidity requirements or changes in market conditions. After initial recognition, AFS investments are carried at fair value in the consolidated statement of financial position. Changes in the fair value of such assets are reported as unrealized gain or loss on

2015 Annual Report 57
change in fair value of AFS investments recognized as OCI in the consolidated statement of comprehensive income until the investment is derecognized or the investment is determined to be impaired. On derecognition or impairment, the cumulative gain or loss previously reported in consolidated statement of comprehensive income is transferred to the consolidated statement of income. AFS investments are classified as current if they are expected to be realized within 12 months from the end of the reporting period. Otherwise, these are classified as noncurrent assets.
The Company’s investments in quoted and unquoted equity securities and other investments are classified under this category.
Other Financial Liabilities. This category pertains to financial liabilities that are not held for trading or not designated as at FVPL upon the inception of the liability. This includes liabilities arising from operations or loans and borrowings.
Other financial liabilities are recognized initially at fair value and are subsequently carried at amortized cost taking into account the impact of applying the effective interest method of amortization (or accretion) for any related premium, discount and any directly attributable transaction costs. Gains and losses are recognized in the consolidated statement of income when the liabilities are derecognized, as well as through the amortization process. Other financial liabilities are classified as current liabilities if settlement is within 12 months from the end of the reporting period. Otherwise, these are classified as noncurrent liabilities.
The Company’s notes payable, trade and other payables, trust receipts payable, due to related parties, long-term loans payable and long-term debts are classified under this category.
Classification of Financial Instruments Between Debt and Equity A financial instrument is classified as debt if it provides for a contractual obligation to:
deliver cash or another financial asset to another entity; exchange financial assets or financial liabilities with another entity under conditions that are potentially unfavorable to the
Company; or satisfy the obligation other than by the exchange of a fixed amount of cash or another financial asset for a fixed number of
own equity shares.
If the Company does not have an unconditional right to avoid delivering cash or another financial asset to settle its contractual obligation, the obligation meets the definition of a financial liability.
The components of issued financial instruments that contain both liability and equity elements are accounted for separately, with the equity component being assigned the residual amount after deducting from the instrument as a whole the amount separately determined as the fair value of the liability component on the date of issue.
Impairment of Financial Assets The Company assesses at each reporting date whether a financial asset or group of financial assets is impaired.
Assets Carried at Amortized Cost. The Company first assesses whether objective evidence of impairment exists individually for financial assets that are individually significant, and individually or collectively for financial assets that are not individually significant. If it is determined that no objective evidence of impairment exists for an individually assessed financial asset, whether significant or not, the asset is included in a group of financial assets with similar credit risk characteristics and that group of financial assets is collectively assessed for impairment. Assets that are individually assessed for impairment and for which an impairment loss is or continues to be recognized are not included in a collective assessment of impairment. For the purpose of specific evaluation of impairment, the Company assesses whether financial assets are impaired through assessment of collectability of financial assets considering the debtor’s capacity to pay, history of payment, and the availability of other financial support. For the purpose of a collective evaluation of impairment, if necessary, financial assets are grouped on the basis of such credit risk characteristics such as debtor type, payment history, past-due status and terms.
If there is objective evidence (such as the probability of insolvency or significant financial difficulties of the debtor) that an impairment loss on loans and receivables carried at amortized cost has been incurred, the amount of the loss is measured as the difference between the asset’s carrying amount and the present value of estimated future cash flows (excluding future credit losses that have not been incurred) discounted at the financial asset’s original effective interest rate (i.e., the effective interest rate computed at initial recognition). The carrying amount of the asset is reduced through the use of an allowance account and the amount of the loss is recognized in the consolidated statement of income. Interest income continues to be accrued on the reduced carrying amount based on the original effective interest rate of the asset. Loans and receivables together with the associated allowance are written off when there is no realistic prospect of future recovery and all collateral, if any, has been realized or has been transferred to the Company. If in a subsequent year, the amount of the estimated impairment loss increases or decreases because of an event occurring after the impairment was recognized, the previously recognized impairment loss is increased or reduced by adjusting the allowance account. If a write-off is later recovered, the recovery is recognized in profit or loss. Any subsequent reversal of an impairment loss is recognized in profit or loss, to the extent that the carrying value of the asset does not exceed its amortized cost at the reversal date.
58 PHINMA CORPORATION
Assets Carried at Cost. If there is objective evidence (such as continuing losses or significant financial difficulties of the investee company) that an impairment loss has been incurred on an unquoted equity instrument that is not carried at fair value because its fair value cannot be reliably measured, the amount of the loss is measured as the difference between the asset’s carrying amount and the present value of estimated future cash flows discounted at the current market rate of return for a similar financial asset.
AFS Investments. In the case of equity instruments classified as AFS investments, evidence of impairment would include a significant or prolonged decline in the fair value of the investments below its cost. Where there is evidence of impairment, the cumulative loss is measured as the difference between the acquisition cost and the current fair value, less any impairment loss on that financial asset previously recognized in profit or loss, is removed from the OCI and recognized in profit or loss. Impairment losses on equity investments are not reversed through the profit or loss. Increases in the fair value after impairment are recognized directly in OCI.
In the case of debt instruments classified as AFS investments, impairment is assessed based on the same criteria as financial assets carried at amortized cost. However, the amount recorded for impairment is the cumulative loss measured as the difference between the amortized cost and the current fair value, less any impairment loss on that investment previously recognized in profit or loss. Future interest income is based on the reduced carrying amount of the asset and is accrued based on the rate of the interest used to discount future cash flows for the purpose of measuring impairment loss. Such accrual is recorded as part of interest income in the profit or loss. If, in the subsequent year, the fair value of a debt instrument can be objectively related to an asset occurring after the impairment loss was recognized in profit or loss, the impairment loss is reversed through profit or loss.
Derecognition of Financial Assets and Liabilities
Financial Assets. A financial asset (or, where applicable, a part of a financial asset or part of a group of similar financial assets) is derecognized when:
the rights to receive cash flows from the asset have expired; or the Company retains the right to receive cash flows from the asset, but has assumed an obligation to pay them in full without
material delay to a third party under a “pass-through” arrangement; or the Company has transferred its rights to receive cash flows from the asset and either (a) has transferred substantially all
the risks and rewards of the asset, or (b) has neither transferred nor retained substantially all the risks and rewards of the asset, but has transferred control of the asset.
Where the Company has transferred its rights to receive cash flows from an asset or has entered into a “pass-through” arrangement, and has neither transferred nor retained substantially all the risks and rewards of the asset nor transferred control of the asset, the asset is recognized to the extent of the Company’s continuing involvement in the asset. Continuing involvement that takes the form of a guarantee over the transferred asset is measured at the lower of the original carrying amount of the asset and the maximum amount of consideration that the Company could be required to repay.
Financial Liabilities. A financial liability is derecognized when the obligation under the liability is discharged, cancelled or has expired. Where an existing financial liability is replaced by another from the same lender on substantially different terms, or the terms of an existing liability are substantially modified, such an exchange or modification is treated as a derecognition of the original liability and the recognition of a new liability, and the difference in the respective carrying amounts is recognized in the consolidated statement of income.
Offsetting Financial Instruments Financial assets and financial liabilities are offset and the net amount reported in the consolidated statement of financial position if and only if there is a currently legal right to offset the recognized amounts and the Company intends to either settle on a net basis, or to realize the asset and settle the liability simultaneously. This is not generally the case with master netting agreements, and the related assets and liabilities are presented at gross amounts in the consolidated statement of financial position.
Determination of Fair Value Fair value is the price that would be received to sell an asset or paid to transfer a liability in an orderly transaction between market participants at the measurement date. The fair value measurement is based on the presumption that the transaction to sell or transfer the liability takes place either:
in the principal market for the asset or liability; or in the absence of a principal market, in the most advantageous market for the asset or liability
The principal or the most advantageous market must be accessible by the Company.
The fair value of an asset or a liability is measured using the assumptions that market participants would use when pricing the asset or liability, assuming that market participants act in their economic best interest. A fair value measurement of a non-

2015 Annual Report 59
financial asset takes into account a market participant’s ability to generate economic benefits by using its highest and best use or by selling it to another market participant that would use the asset in its highest and best use.
The fair value for financial instruments traded in active markets at the reporting date is based on their quoted price or binding dealer price quotations (bid price for long positions and ask price for short positions), without any deduction for transaction costs. Securities defined in these accounts as ‘listed’ are traded in an active market. Where the Company has financial assets and financial liabilities with offsetting positions in market risks or counterparty credit risk, it has elected to use the measurement exception to measure the fair value of its net risk exposure by applying the bid or ask price to the net open position as appropriate. For all other financial instruments not traded in an active market, the fair value is determined by using valuation techniques deemed to be appropriate in the circumstances. Valuation techniques include the market approach (i.e., using recent arm’s length market transactions adjusted as necessary and reference to the current market value of another instrument that is substantially the same) and the income approach (i.e., discounted cash flow analysis and option pricing models making as much use of available an supportable market data as possible).
The Company uses valuation techniques that are appropriate in the circumstances and for which sufficient data are available to measure fair value, maximizing the use of relevant observable inputs and minimizing the use of unobservable inputs. All assets and liabilities for which fair value is measured or disclosed in the consolidated financial statements are categorized within the fair value hierarchy.
All assets and liabilities for which fair value is measure or disclosed in the financial statements are categorized within the fair value hierarchy, described as follows. Based on the lowest level input that is significant to their fair value measurement as a whole:
Level 1 - Quoted (unadjusted) market prices in active markets for identical assets or liabilities Level 2 - Valuation techniques for which the lowest level input that is significant to the fair value measurement is directly or
indirectly observable Level 3 - Valuation techniques for which the lowest level input is significant to their fair value measurement is unobservable
For assets and liabilities that are recognized in the financial statement on a recurring basis, the Company determines whether transfers have occurred between Levels in the hierarchy by re-assessing categorization (based on the lowest level input that is significant to the fair value measurement as a whole) at the end of each reporting period.
For the purpose of the fair value disclosures, the Company has determined classes of assets and liabilities on the basis of the nature, characteristics and risks of the asset or liability and the level of the fair value hierarchy as explained above.
Inventories Inventories are valued at the lower of cost or net realizable value. Costs incurred in bringing each inventory to its present location and conditions are accounted for as follows:
Finished goods – determined using the moving average method; cost includes direct
materials and labor and a proportion of manufacturing overhead costs based on normal operating capacity but excludes borrowing costs;
Raw materials, spare parts and others – determined using the moving average method.
The net realizable value of inventories, except spare parts, is the selling price in the ordinary course of business less the estimated costs of completion and the estimated costs necessary to make the sale. The net realizable value of spare parts is the current replacement cost.
Investments in Associates Investments in associates are accounted for under the equity method. These are entities in which the Company has significant influence and which are neither subsidiaries nor joint ventures of the Company. Investments in associates are initially recognized at the cost paid to acquire the ownership interest in the investee. The investments are then carried in the consolidated statement of financial position at cost plus post-acquisition changes in the Company’s share in net assets of the associates, less any impairment in value. Goodwill relating to the acquisition of an associate is included in the carrying amount of the investment and is neither amortized nor individually tested for impairment.
The consolidated statement of income reflects the Company’s share in the results of operations of the associates. Any change in OCI of those investees is presented as part of the Company’s OCI. In addition, when there has been a change recognized directly in the equity of the associate, the Company recognizes its share of changes, when applicable, in the consolidated statement of changes in equity. Unrealized gains arising from transactions with its associates are eliminated to the extent of the Company’s interest in the associates against the related investments. Unrealized losses are eliminated similarly but only to the extent that there is no evidence of impairment of the asset transferred.

60 PHINMA CORPORATION
The aggregate of the Company’s share in the results of operations of an associate is shown on the face of the consolidated statement of income as “Equity in net earnings of associates” which represents profit or loss after tax and non-controlling interests in the subsidiaries of the associate.
The financial statement of the associate are prepared for the same reporting period as the Company. When necessary, adjustments are made to bring the accounting policies in line with those of the Company.
The Company shall discontinue the use of the equity method from the date when it ceases to have significant influence over an associate and shall account for the investment in accordance to PAS 39 from that date, provided that the associate does not become a subsidiary or joint venture. On the loss of significant influence, the Company shall measure at fair value any investment the Company retains in the former associate. The Company shall recognize in the consolidated statement of income the difference between:
a. the fair value of any retained investment and any proceeds from disposing of the part interest in the associate; and b. the carrying amount of the investment at the date when significant influence is lost.
When the Company’s accumulated share in net losses of an associate equals or exceeds the carrying amount of the investment, including advances for future conversion to equity, the Company discontinues the recognition of its share in additional losses and the investment is reported at nil value. If the associate subsequently reports net income, the Company will resume applying the equity method only after its share in that net income equals the share in net losses not recognized during the period the equity method was suspended.
Property, Plant and Equipment Property, plant and equipment, except land, are carried at cost less accumulated depreciation and any impairment loss. Land is carried at cost less any impairment loss. The cost of property, plant and equipment comprises its purchase price, including any applicable import duties and capitalized borrowing costs (for property, plant and equipment other than land) and other costs directly attributable in bringing the asset to its working condition and location for its intended use. Expenditures incurred after the property, plant and equipment have been put into operation, such as repairs and maintenance, are normally charged to current operations in the year the costs are incurred. In situations where it can be clearly demonstrated that the expenditures have resulted in an increase in the future economic benefits expected to be obtained from the use of an item of property plant and equipment beyond its originally assessed standard of performance, the expenditures are capitalized as additional costs of property plant and equipment.
Depreciation is computed using the straight-line method over the following estimated useful lives of the assets:
Plant site improvements 10–20 years Buildings and improvements 10–25 years Machinery and equipment 5–20 years Transportation and other equipment 2–10 years
The useful lives and depreciation method are reviewed at each financial year-end to ensure that the periods and depreciation method are consistent with the expected pattern of economic benefits from items of property, plant and equipment.
When each major inspection is performed, its cost is recognized in the carrying amount of the property, plant and equipment as a replacement if the recognition criteria are met.
An item of property, plant and equipment is derecognized upon disposal or when no future economic benefits are expected from its use or disposal. Any gain or loss arising on derecognition of the asset (calculated as the difference between the net disposal proceeds and carrying amount of the asset) is credited or charged to consolidated statement of income.
Construction in-progress represents properties and structures under construction/development and is stated at cost. This includes cost of construction, plant and equipment, any borrowing costs directly attributable to such asset during the construction period and other direct costs. Construction in-progress is not depreciated until such time when the relevant assets are completed and ready for operational use.
Investment Properties Investment properties are measured initially at cost, including direct transaction costs. The carrying amount includes the cost of replacing part of an existing investment property at the time the cost is incurred, if the recognition criteria are met, and excludes the costs of day-to-day servicing of an investment property. Subsequent to initial recognition, investment properties (except land) are stated at cost less accumulated depreciation and any impairment loss. Land is carried at cost less any impairment in value.
Depreciation of buildings for lease is calculated on a straight-line basis over the estimated useful lives of 15 to 20 years.

2015 Annual Report 61
Investment property is derecognized when either it has been disposed of or when the investment property is permanently withdrawn from use and no future economic benefit is expected from its disposal. Any gains or losses on the retirement or disposal of an investment property are recognized in the consolidated statement of income in the year of retirement or disposal.
Transfers are made to investment property when, and only when, there is a change in use, evidenced by ending of owner-occupation or commencement of an operating lease to another party. Transfers are made from investment property when, and only when, there is a change in use, evidenced by commencement of owner-occupation or commencement of development with a view to sell.
Business Combinations, Goodwill and Impairment of Goodwill Business combinations are accounted for using the acquisition method. The cost of an acquisition is measured as the aggregate of the consideration transferred, measured at acquisition date fair value and the amount of any NCI in the acquiree. For each business combination, the acquirer measures the NCI in the acquiree either at fair value or at the proportionate share of the acquiree’s identifiable net assets. Acquisition costs incurred are expensed and included in administrative expenses.
When the Company acquires a business, it assesses the financial assets and liabilities assumed for appropriate classification and designation in accordance with the contractual terms, economic circumstances and pertinent conditions as at the acquisition date. This includes the separation of embedded derivatives in host contracts by the acquiree. If the business combination is achieved in stages, the acquisition date fair value of the acquirer’s previously held equity interest in the acquiree is re-measured to fair value at the acquisition date through the consolidated statement of income. It is then considered in the determination of goodwill.
Any contingent consideration to be transferred by the acquirer will be recognized at fair value at the acquisition date. Subsequent changes to the fair value of the contingent consideration which is deemed to be an asset or liability will be recognized in accordance with PAS 39 either in the consolidated statement of income or as a change to OCI. If the contingent consideration is classified as equity, it is not re-measured until it is finally settled, and re-measurement is recognized within equity. For business combinations for which the acquisition date is before January 1, 2010, subsequent adjustments to the consideration transferred are treated as adjustments to goodwill.
Goodwill is initially measured at cost being the excess of the aggregate of the consideration transferred and the amount recognized for NCI over the net identifiable assets acquired and liabilities assumed. If this consideration is lower than the fair value of the net assets of the subsidiary acquired, the difference is recognized in the consolidated statement of income.
After initial recognition, goodwill is measured at cost less any accumulated impairment losses. For the purpose of impairment testing, goodwill acquired in a business combination is, from the acquisition date, allocated to each of the cash-generating units that are expected to benefit from the combination, irrespective of whether other assets or liabilities of the acquiree are assigned to those units.
Where goodwill forms part of a cash-generating unit (CGU) and part of the operation within that unit is disposed of, the goodwill associated with the operation disposed of is included in the carrying amount of the operation when determining the gain or loss on disposal of the operation. Goodwill disposed of in this circumstance is measured based on the relative values of the operation disposed of and the portion of the CGU retained.
If the initial accounting for a business combination is incomplete by the end of the reporting period in which the combination occurs, the acquirer shall report in its financial statements provisional amounts for the items for which the accounting is incomplete. During the measurement period, the acquirer shall retrospectively adjust the provisional amounts recognized at the acquisition date to reflect new information obtained about facts and circumstances that existed as of the acquisition date and, if known, would have affected the measurement of the amounts recognized as of that date. During the measurement period, the acquirer shall also recognize additional assets or liabilities if new information is obtained about facts and circumstances that existed as of the acquisition date and, if known, would have resulted in the recognition of those assets and liabilities as of that date. The measurement period ends as soon as the acquirer receives the information it was seeking about facts and circumstances that existed as of the acquisition date or learns that more information is not obtainable. However, the measurement period shall not exceed one year from the acquisition date.
Intangible Assets The cost of intangible assets acquired separately is measured on initial recognition at cost. The cost of intangible assets (trademarks, student lists, customer contracts and software) acquired in a business combination is measured at the fair value as of date of acquisition. Following initial recognition, intangible assets are carried at cost less accumulated amortization and any accumulated impairment losses. Trademarks have indefinite useful life and are tested annually for impairment. Student lists are amortized over three years and assessed for impairment whenever there is an indication that the student lists acquired may be impaired. Customer contracts are amortized over the estimated economic life of one year. Software is amortized over the estimated life of five years.
The useful lives of intangible assets are assessed to be either finite or indefinite. The amortization periods and method are reviewed at each financial year-end. Changes in the expected useful life or the expected pattern of consumption of future

62 PHINMA CORPORATION
economic benefits embodied in the asset is accounted for by changing the amortization period or method, as appropriate, and treated as changes in accounting estimates. The amortization expense on intangible assets with finite lives is recognized in the consolidated statement of income in the expense category consistent with the function of the intangible asset. Intangible assets with indefinite lives (trademarks) are not amortized, but are tested for impairment annually, either individually or at the CGU level. The assessment of indefinite life is reviewed annually to determine whether the indefinite life continues to be supportable. If not, the change in useful life from indefinite to finite is made on a prospective basis.
Gains or losses arising from de-recognition of an intangible asset are measured as the difference between the net disposal proceeds and the carrying amount of the asset and are recognized in the consolidated statement of income when the asset is derecognized.
Impairment of Nonfinancial Assets (Investments in associates, Property, plant and equipment, Investment properties, Intangible assets and Input value-added tax) The Company assesses at each reporting date whether there is an indication that a nonfinancial asset may be impaired when events or changes in circumstances indicate that the carrying value of a nonfinancial asset may not be recoverable. If any such indication exists, or when annual impairment testing for an asset is required, the Company makes an estimate of the asset’s recoverable amount. An asset’s recoverable amount is the higher of an asset’s or CGU’s fair value less costs to sell and its VIU and is determined for an individual asset, unless the asset does not generate cash inflows that are largely independent of those from other assets or groups of assets. Where the carrying amount of an asset exceeds its recoverable amount, the asset is considered impaired and is written down to its recoverable amount.
In assessing VIU, the estimated future cash flows are discounted to their present value using a pre-tax discount rate that reflects current market assessment of the time value of money and the risks specific to the asset. In determining fair value less costs of disposal, recent market transactions are taken into account. If no such transactions can be identified, an appropriate valuation model is used. These calculations are corroborated by valuation multiples, quoted prices for publicly traded companies or other available fair value indicators.
The Company bases its impairment calculation on detailed budgets and forecast calculations, which are prepared separately for each of the Company’s CGU to which the individual assets are allocated. These budgets and forecast generally cover a period of five years. For longer period, a long-term growth rate is calculated and applied to project future cash flows after the fifth year.
Impairment losses are recognized in the consolidated statement of income in those expense categories consistent with the function of the impaired asset.
For nonfinancial assets excluding goodwill, an assessment is made at each reporting date as to whether there is any indication that previously recognized impairment losses may no longer exist or may have decreased. If such indication exists, the recoverable amount is estimated.
A previously recognized impairment loss is reversed only if there has been a change in the estimates used to determine the asset’s recoverable amount since the last impairment loss was recognized. If that is the case, the carrying amount of the asset is increased to its recoverable amount. However, that increased amount cannot exceed the carrying amount that would have been determined, net of depreciation, had no impairment loss been recognized for the asset in prior years. Such reversal is recognized in consolidated statement of income. After such a reversal, the depreciation charge is adjusted in future periods to allocate the asset’s revised carrying amount, less any residual value, on a systematic basis over its remaining useful life.
After application of the equity method, the Company determines whether it is necessary to recognize any additional impairment loss with respect to the Company’s investments in associates. The Company determines at each reporting date whether there is any objective evidence that the investment in associate is impaired. If this is the case, the Company calculates the amount of impairment being the difference between the fair value and the carrying value of the investee company and recognizes the difference in the consolidated statement of income.
The following assets have specific characteristics for impairment testing:
Goodwill. Goodwill is tested for impairment annually and when circumstances indicate that the carrying value may be impaired. Impairment is determined for goodwill by assessing the recoverable amount of each CGU (or group of CGUs) to which the goodwill relates. When the recoverable amount of the cash generating unit is less than its carrying amount, an impairment loss is recognized. Impairment losses relating to goodwill cannot be reversed in future periods.
Intangible assets. Intangible assets with indefinite useful lives are tested for impairment annually as either individually or at the CGU level, as appropriate, and when circumstances indicate that the carrying value may be impaired.

2015 Annual Report 63
Current versus Non-current Classification The Company presents assets and liabilities in consolidated statement of financial position based on current/non-current classification. An asset as current when it is:
- expected to be realized or intended to be sold or consumed in normal operating cycle; - held primarily for the purpose of trading; - expected to be realized within twelve months after the reporting period or - cash or cash equivalent unless restricted from being exchanged or used to settle a liability for at least twelve months after
the reporting period.
All other assets are classified as non-current.
A liability is current when:
- it is expected to be settled in normal operating cycle; - it is held primarily for the purpose of trading; - it is due to be settled within twelve months after the reporting period or - there is no unconditional right to defer the settlement of the liability for at least twelve months after the reporting period.
The Company classifies all other liabilities as non-current.
Capital Stock Capital stock is measured at par value for all shares issued. When the Company issues more than one class of stock, a separate account is maintained for each class of stock and the number of shares issued.
When the shares are sold at premium, the difference between the proceeds and the par value is credited to the “Additional paid-in capital” account in the consolidated statement of financial position. When shares are issued for a consideration other than cash, the proceeds are measured by the fair value of the consideration received.
Direct costs incurred related to equity issuance, such as underwriting, accounting and legal fees, printing costs and taxes are chargeable to the “Additional paid-in capital” account in the consolidated statement of financial position.
Other Reserves Other reserves are made up of equity transactions other than capital contributions, such as, equity transactions arising from transactions with NCI and share-based payment transactions.
Retained Earnings Retained earnings represent accumulated net profits, net of dividend distributions and other capital adjustments. Retained earnings also included effect of changes in accounting policy as may be required by the standard’s transitional provision.
Dividends The Company recognizes a liability to distribute cash to equity holders of the Parent Company when the distribution is authorized and is no longer at the discretion of the Company. As per the coproate laws in the Philippines, a distribution is authorized when approved by the Board of Directors. A corresponding amount is recognized directly in equity.
Revenue Recognition Revenue is recognized when it is probable that the economic benefits associated with the transaction will flow to the Company and the amount of revenue can be measured reliably, regardless of when the payment is being made. Revenue is measured at the fair value of the consideration received or receivable, excluding discounts, rebates, sales taxes or duty. The Company has concluded that it is principal in all of its revenue arrangements since it is the primary obligor in all the revenue arrangements, has pricing latitude and is also exposed to inventory and credit risks.
The following specific recognition criteria must also be met before revenue is recognized:
Sale of Goods. Revenue from sale of roofing and other steel products, books and incidentals is recognized when the significant risks and rewards of ownership of the goods have passed to the buyer, usually on delivery of the goods.
Tuition and School Fees. Revenue is recognized as income over the corresponding school term to which they pertain. Total assessments of tuition and other school fees, net of monthly amortization, are recorded as part of “Unearned revenues” account in the consolidated statement of financial position.
Consultancy Services. Revenue is recognized when services are rendered.

64 PHINMA CORPORATION
Investment Income. Investment income includes net gains and losses on investments held for trading (see accounting policy on Financial Assets) and interest income. Interest income is recognized as the interest accrues, taking into account the effective yield on the asset.
Animation Services. Income from animation services is recognized by reference to the stage of completion. Stage of completion is measured by reference to labor hours incurred to date as a percentage of total estimated labor hours for each contract. Where the contract outcome cannot be measured reliably, revenue is recognized only to the extent that the expenses incurred are eligible to be recovered.
Rental Income. Revenue is recognized on a straight-line basis over the lease term.
Hospital Routine Services. Revenue is recognized upon rendering of medical services and sale of medicines and other pharmaceutical products.
Cost of Sales, Educational, Hospital, Animation and Consultancy Services Cost of sales includes direct materials used, personnel costs, as well as repair and power and fuel used to run production of steel products. Cost of educational services constitutes costs incurred to administer academic instruction. Cost of hospital sevices includes professional fees paid to medical personnel, utilities and other medical supplies used to render medical services. Costs of animation services include all direct materials, labor costs and indirect costs related to contract performance. Cost of consultancy services includes labor cost and other direct costs related to the performance of consultancy services. These expenses are expensed as incurred.
General and Administrative Expenses General and administrative expenses constitute costs of administering the businesses and are expensed as incurred.
Selling Expenses Selling expenses include costs of distribution of steel products, books, incidentals, personnel costs, freight expenses, commission and advertising. Selling expenses are expensed as incurred.
Pension Costs PHN, UGC, UPANG, AU and SWU have distinct funded, noncontributory defined benefit retirement plans while UI and COC have a defined, unfunded, noncontributory retirement plans covering all permanent employees, each administered by their respective Retirement Committees.
The net pension liability or asset is the aggregate of the present value of the defined benefit obligation at the end of the reporting period reduced by the fair value of plan assets (if any), adjusted for any effect of limiting a net defined benefit asset to the asset ceiling. The asset ceiling is the present value of any economic benefits available in the form of refunds from the plan or reductions in future contributions to the plan.
The cost of providing benefits under the defined benefit plans is actuarially determined using the projected unit credit method.
Net pension cost comprises the following:
- service cost; - net interest on the net defined benefit liability or asset; and - remeasurements of net defined benefit liability or asset
Service costs which include current service costs, past service costs and gains or losses on non-routine settlements are recognized as expense in the consolidated statement of income. Past service costs are recognized when plan amendment or curtailment occurs.
Net interest on the net defined benefit liability or asset is the change during the period in the net defined benefit liabili ty or asset that arises from the passage of time which is determined by applying the discount rate based on government bonds to the net defined benefit liability or asset. Net interest on the net defined benefit liability or asset is recognized as expense or income in the consolidated statement of income.
Remeasurements comprising actuarial gains and losses, return on plan assets and any change in the effect of the asset ceiling (excluding net interest on defined benefit liability) are recognized immediately in OCI in the period in which they arise. Remeasurements are not reclassified to the consolidated statement of income in subsequent periods. These are closed to retained earnings every period end.
Plan assets are assets that are held by a long-term employee benefit fund or qualifying insurance policies. Plan assets are not available to the creditors of the Company, nor can they be paid directly to the Company. Fair value of plan assets is based on market price information. When no market price is available, the fair value of plan assets is estimated by discounting expected

2015 Annual Report 65
future cash flows using a discount rate that reflects both the risk associated with the plan assets and the maturity or expected disposal date of those assets (or, if they have no maturity, the expected period until the settlement of the related obligations).
Employee Leave Entitlement. Employee entitlements to annual leave are recognized as a liability when they are accrued to the employees. The undiscounted liability for leave expected to be settled wholly before twelve months after the end of the annual reporting period is recognized for services rendered by employees up to the end of the reporting period.
Stock Purchase Plan The Company has a stock purchase plan offered to senior officers which gives them the right to purchase shares of the Company set aside by the plan.
The cost of equity-settled transactions with employees is measured by reference to their fair value at the date they are granted, determined using the acceptable valuation techniques. The amount is fixed at grant date.
The cost of equity-settled transactions, together with a corresponding increase in equity, is recognized over the period in which the performance and/or service conditions are fulfilled ending on the date on which the employees become fully entitled to the award (“vesting date”). The cumulative expense recognized for equity-settled transactions at each reporting date up to and until the vesting date reflects the extent to which the vesting period has expired, as well as the Company’s best estimate of the number of equity instruments that will ultimately vest. The consolidated statement of income charge or credit for the period represents the movement in cumulative expense recognized at the beginning and end of that period. No expense is recognized for awards that do not ultimately vest, except for awards where vesting is conditional upon a market condition, which awards are treated as vesting irrespective of whether or not the market condition is satisfied, provided that all other performance conditions are satisfied.
Where the terms of an equity-settled award are modified, as a minimum, an expense is recognized as if the terms had not been modified. An additional expense is likewise recognized for any modification which increases the total fair value of the share-based payment arrangement or which is otherwise beneficial to the employee as measured at the date of modification.
Where an equity-settled award is cancelled, it is treated as if it had vested on the date of cancellation, and any expense not yet recognized for the award is recognized immediately. If a new award, however, is substituted for the cancelled awards and designated as a replacement award, the cancelled and new awards are treated as if they were a modification of the original award, as described in the previous paragraph.
Leases The determination of whether an arrangement is, or contains, a lease is based on the substance of the arrangement and requires an assessment of whether the fulfillment of the arrangement is dependent on the use of a specific asset or assets and the arrangement conveys a right to use the asset. A reassessment is made after inception of the lease only if one of the following applies:
a. there is a change in contractual terms, other than a renewal or extension of the arrangement; b. a renewal option is exercised or extension granted, unless that term of the renewal or extension was initially included in the
lease term; c. there is a change in the determination of whether fulfillment is dependent on a specified asset; or d. there is a substantial change to the asset.
Where a reassessment is made, lease accounting shall commence or cease from the date when the change in circumstances gave rise to the reassessment for scenarios a, c or d above, and at the date of renewal or extension period for scenario b.
Company as Lessee. Leases where the lessor retains substantially all the risks and benefits of ownership of the leased asset are classified as operating leases. Operating lease payments are recognized as an expense in the consolidated statement of income on a straight-line basis over the lease term.
Company as Lessor. Leases where the Company does not transfer substantially all the risks and benefits of ownership of the assets are classified as operating leases. Lease payments received are recognized as an income in the consolidated statement of income on a straight-line basis over the lease term.
Provisions Provisions are recognized when the Company has a present obligation (legal or constructive) as a result of a past event, it is probable that an outflow of resources embodying economic benefits will be required to settle the obligation and a reliable estimate can be made of the amount of the obligation. If the effect of the time value of money is material, provisions are determined by discounting the expected future cash flows at a pre-tax rate that reflects current market assessment of the time value of money and, where appropriate, the risks specific to the liability. Where discounting is used, the increase due to the passage of time is recognized as interest expense in the consolidated statement of income.

66 PHINMA CORPORATION
Borrowing Costs Borrowing costs directly attributable to the acquisition, construction or production of an asset that necessarily takes a substantial period of time to get ready for its intended use or sale are capitalized as part of the cost of the respective assets. All other borrowing costs are expensed in the period they occur. Borrowing cost consists of interest and other costs that an entity incurs in connection with the borrowing of funds.
Foreign Currency-denominated Transactions and Translation The consolidated financial statements are presented in Philippine peso, which is the Parent Company’s functional and presentation currency. The subsidiaries determine their own functional currency and items included in the financial statements of each subsidiary are measured using that functional currency.
Transactions in foreign currencies are recorded using their functional currency exchange rate at the date of the transaction. Monetary assets and liabilities denominated in foreign currencies are retranslated at the functional currency closing rate of exchange at the end of the reporting period. Exchange gains or losses arising from foreign currency translations are credited or charged to current operations. Nonmonetary items that are measured at historical cost in a foreign currency are translated using the exchange rate at the date of the initial transactions. Nonmonetary items measured at fair value in a foreign currency are translated using the exchange rates at the date when the fair value is determined.
Other than OAL and Fuld U.S., the functional and presentation currency of the subsidiaries within the Company is Philippine peso. The functional currency of OAL and Fuld U.S. is U.S. dollar. The assets and liabilities of foreign operations are translated into Philippine peso at the rate of exchange prevailing at the reporting date and their income statements are translated at exchange rates prevailing at the date of the transactions. The exchange differences arising on the translation are recognized in OCI. On disposal of a foreign operation, the component of OCI relating to that particular foreign operation is recognized in the consolidated statement of income.
Taxes
Current Tax. Current tax assets and liabilities for the current and prior periods are measured at the amount expected to be recovered from or paid to the tax authority. The tax rates and tax laws used to compute the amount are those that are enacted or substantively enacted at the end of the reporting period.
Deferred Tax. Deferred tax is provided, using the liability method, on all temporary differences at the end of the reporting period between the tax bases of assets and liabilities and their carrying amounts for financial reporting purposes. Deferred tax liabilities are recognized for all taxable temporary differences, except:
when the deferred tax liability arises from the initial recognition of goodwill or of an asset or liability in a transaction that is not a business combination and, at the time of the transaction, affects neither the accounting profit nor taxable profit or loss; and
in respect of taxable temporary differences associated with investments in subsidiaries and associates, when the timing of the reversal of the temporary differences can be controlled and it is probable that the temporary differences will not reverse in the foreseeable future.
Deferred tax assets are recognized for all deductible temporary differences, carryforward benefits of unused tax credits from excess minimum corporate income tax (MCIT) over the regular corporate income tax (RCIT) and unused net operating loss carryover (NOLCO), to the extent that it is probable that taxable profit will be available against which the deductible temporary differences, and the carryforward benefits of unused excess MCIT and NOLCO can be utilized. Deferred tax however is not recognized when:
when the deferred tax asset relating to the deductible temporary difference arises from the initial recognition of an asset or liability in a transaction that is not a business combination and, at the time of the transaction, affects neither the accounting profit nor taxable profit or loss; and
in respect of deductible temporary differences associated with investments in subsidiaries and associates. Deferred tax assets are recognized only to the extent that it is probable that the temporary differences will reverse in the foreseeable future and taxable profit will be available against which the temporary differences can be utilized.
The carrying amount of deferred tax assets is reviewed at each reporting date and reduced to the extent that it is no longer probable that sufficient taxable profit will be available to allow all or part of the deferred tax assets to be utilized. Unrecognized deferred tax assets are reassessed at each reporting date and are recognized to the extent that it has become probable that future taxable profit will allow the deferred tax assets to be recovered.
Deferred tax assets and liabilities are measured at the tax rates that are expected to apply to the year when the asset is realized or the liability is settled, based on tax rates (and tax laws) that have been enacted or substantively enacted at the end of the reporting period.

2015 Annual Report 67
Deferred tax relating to items recognized outside the consolidated statement of income is recognized outside the consolidated statement of income. Deferred tax items are recognized in correlation to the underlying transaction either in OCI or directly in equity.
Deferred tax assets and deferred tax liabilities are offset, if a legally enforceable right exists to offset current tax assets against current tax liabilities and the deferred taxes relate to the same taxable entity and the same tax authority.
Value-Added Tax (VAT). Revenue, expenses and assets are recognized net of the amount of VAT, except:
where the VAT incurred on a purchase of assets or services are not recoverable from the taxation authority, in which case the VAT is recognized as part of the cost of acquisition of the asset or as part of the expense item as applicable; and
receivables and payables that are stated with the amount of VAT included. The net amount of VAT recoverable from, or payable to, the tax authority is included as part of “Input value-added taxes” or “Income and other taxes payable” accounts in the consolidated statement of financial position.
Earnings Per Common Share (EPS) Attributable to the Equity Holders of the Parent Basic EPS is computed by dividing net income attributable to equity holders of the parent by the weighted average number of issued and outstanding common shares during the year after giving retroactive effect to any stock dividend declared during the year.
Diluted Earnings Per Share Diluted earnings per share amounts are calculated by dividing the net income attributable to equity holders of the Parent (including effect of associates’ potential dilutive shares) by the weighted average number of ordinary shares outstanding during the year plus the weighted average number of ordinary shares that would be issued on the conversion of all dilutive potential ordinary shares into ordinary.
Segment Reporting The Company is organized into five major business segments namely, investment holdings, property development, steel, educational services and BPO. Financial information about the Company’s business segments are presented in Note 37 to the consolidated financial statements.
Contingencies Contingent liabilities are not recognized in the consolidated financial statements. They are disclosed in the notes to the consolidated financial statements unless the possibility of an outflow of resources embodying economic benefits is remote. Contingent assets are not recognized in the consolidated financial statements but are disclosed in the notes to the consolidated financial statements when an inflow of economic benefits is probable.
Events After Financial Reporting Period Post year-end events that provide additional information about the Company’s financial position at the end of the reporting period (adjusting events) are reflected in the consolidated financial statements. Post year-end events that are not adjusting events are disclosed in the notes to the consolidated financial statements when material.
5. Significant Accounting Judgments, Estimates and Assumptions
The accompanying consolidated financial statements prepared in conformity with PFRS require management to make judgments, estimates and assumptions that affect the amounts reported in the consolidated financial statements and related notes. In preparing the Company’s consolidated financial statements, management has made its best judgments, estimates and assumptions of certain amounts, giving due consideration to materiality. The judgments, estimates and assumptions used in the accompanying consolidated financial statements are based upon management’s evaluation of relevant facts and circumstances as of the date of the consolidated financial statements. Actual results could differ from such estimates.
The Company believes the following represents a summary of these significant judgments, estimates and assumptions and related impact and associated risks in its consolidated financial statements.
Judgments In the process of applying the Company’s accounting policies, management has made the following judgments, apart from those involving estimations, which have the most significant effect on the amounts recognized in the Company’s consolidated financial statements:
Material Partly-owned Subsidiaries. The consolidated financial statements include additional information about subsidiaries that have NCI that are material to the Company (see Note 8). Management determined material partly-owned subsidiaries as those with carrying value of NCI greater than 5% of total NCI as at end of the year.

68 PHINMA CORPORATION
Material Associates. The consolidated financial statements include additional information about associates that are material to the Company (see Note 13). Management determined material associates as those associates where the carrying amount of the Company’s investment is greater than 5% of the total investments in associates as at end of the year.
Acquisition of SWU shares as a single-linked transaction. The Company obtained control of SWU by acquiring shares in several tranches (see Note 6). The Company determined that the acquisition at different dates consist of a single-linked transaction by virtue of the Company’s intent to obtain at least a controlling interest in the school.
Estimates and Assumptions The key assumptions concerning the future and other key sources of estimation uncertainty at the end of the reporting period that have a significant risk of causing a material adjustment to the carrying amounts of assets and liabilities within the next financial year are discussed below.
Impairment of Goodwill and Trademarks. The Company performs impairment testing of goodwill and trademarks on an annual basis or more frequently if events or changes in circumstances indicate that the carrying value may be impaired. This requires an estimation of the VIU of the CGU to which the goodwill is allocated. VIU is determined by making an estimate of the expected future cash flows from the CGU and applies a discount rate to calculate the present value of these cash flows. Goodwill acquired through business combination has been allocated to one CGU which is also the operating entity acquired through business combination and to which the goodwill relates. The recoverable amount of the goodwill and trademarks has been determined based on VIU calculation using cash flow projections covering a five-year period. The calculation of VIU for the Company’s goodwill and trademark is sensitive to revenue growth rates and discount rates. Revenue growth rates estimates are based on values achieved in previous years and also takes into account anticipated increase from various market initiatives. Discount rate reflects the current market assessment of the risk specific to each CGU. The discount rate is based on the average percentage of the weighted average cost of capital for the industry. This rate is further adjusted to reflect the market assessment of any risk specific to the CGU for which future estimates of cash flows have not been adjusted.
The carrying amount of goodwill and trademark, pre-tax discount rates and growth rates applied to cash flow projections are as follows:
Goodwill Trademark Pre-tax Discount Growth Rates 2015 2014 2015 2014 2015 2014 2015 2014
(Amounts in Thousands) (Amounts in Thousands) SWU P=1,126,093 P=– P=– P=– 5% 5% 5% 5% UPANG 420,213 420,213 – – 4% 4% 5% 5% Fuld U.S. 295,394* 302,269* 50,435* 47,928* 7% 8% 3% 2% Fuld Phils 14,120 14,120 – – 9% 8% 3% 2% UI 213,995 213,995 – – 5% 4% 5% 5% AU 35,917 35,917 – – 4% 5% 5% 5% COC 20,445 20,445 – – 4% 5% 5% 5%
*transalated using P=47.06 and P=44.72 in 2015 and 2014, respectively
Management believes that no reasonably possible change in these key assumptions would cause the carrying values to materially exceed its recoverable amount. The Company performs its annual testing of goodwill and trademarks every December 31.
Impairment loss on goodwill amounted to P=10.7 million and nil in 2015 and 2014, respectively. The impairment loss pertain to goodwill of Fuld U.S. No impairment loss on trademarks was recognized in 2015 and 2014. The carrying amount of goodwill and trademarks amounted toP=2,176.6 million and P=1,054.9 million as at December 31, 2015 and 2014, and is presented as part of the “Intangible assets” account in the consolidated statements of financial position (see Note 17).
Impairment of Nonfinancial Assets, other than Goodwill. The Company assesses whether there are any indicators of impairment for all nonfinancial assets, other than goodwill, at each reporting date. These nonfinancial assets (investment in associates, property, plant and equipment, investment properties, intangible assets) are tested for impairment whenever events or changes in circumstances indicate that the carrying amount of the asset may not be recoverable. This requires an estimation of the VIU of the CGUs. Estimating the VIU requires the Company to make an estimate of the expected future cash flows from CGU and also to choose a suitable discount rate in order to calculate the present value of those cash flows. In cases where the VIU cannot be reliably estimated, the recoverable amount is based on the fair value less costs to sell. The recoverable amount of investments in associates is based on fair value less cost to sell. Fair value less costs to sell is determined to be the amount obtainable from the sale of the underlying net assets of the associates.

2015 Annual Report 69
6. Business Combination and Goodwill
Acquisition of Southwestern University. SWU is a private educational institution incorporated in the Philippines with campuses located in Cebu City.
PHN offered to acquire shares of SWU from its various shareholders. In April to May 2015, certain shareholders accepted PHN’s offer. As a result, PHN and the shareholders of SWU entered into Share Purchase Agreements for the sale and transfer of 18,084 common shares representing 62.52% of the total issued and outstanding capital stock of SWU for a consideration of P=2.1 billion.
Subsequently in August 2015, other shareholders of SWU also accepted PHN’s offer. As a result, PHN and the shareholders of SWU entered into Share Purchase Agreements for the sale and transfer of additional 3,247 common shares representing 11.22% of the total issued and outstanding capital stock of SWU for a consideration of P=0.4 billion.
These resulted in PHN acquiring a total of 21,331 common shares representing 73.74% ownership interest of the issued and outstanding stock of SWU for a total purchase price of P=2.5 billion.
The Company accounted the acquisitions as a single linked transaction based on the following:
a. The Company’s objective was to acquire at least 67% of SWU which is the Company’s minimum ownership interest on existing investments in educational institutions. In addition, the Parent Company granted certain selling shareholders the option to repurchase shares sold over the excess of 2/3 of the issued and outstanding shares owned by the Company;
b. The offers were sent to all the sellers upfront and that there were no significant differences in the purchase price per between shares acquired in April and May 2015 and shares acquired subsequently in August 2015; and
c. All purchases of shares transpired within relatively short period of time.
The provisional fair value of the identifiable assets and liabilities of SWU as at the date of the acquisition are as follows:
Provisional Fair Values Recognized at Acquisition Date
(Amounts in Thousands)
Total assets: Cash and cash equivalents P=118,019 Trade and other current receivable 59,129 Inventories and supplies 14,920 Prepayments and other current assets 8,056 Property and equipment 1,348,894 Investment property 713,433 Intangibles – students lists 34,518 Advances to affiliates 399 Deferred tax assets – net 10,292 Total assets 2,307,660 Total liabilities: Trade and other current payables 210,337 Deferred revenues 19,059 Income tax payable 13,649 Advances from affiliates 351 Retirement liability – net 58,083 Deferred tax liability – students list 3,452 Deferred tax liability – Property and equipment 118,727 Other noncurrent liabilities 9,957 Total liabilities 433,615 Total identifiable net assets acquired 1,874,045 Proportionate share of NCI in net assets acquired (492,062) Provisional goodwill arising from acquisition (see Note 17) 1,126,093 Purchase consideration transferred P=2,508,076
The net assets recognized in the December 31, 2015 financial statements were based on a provisional assessment of their fair value while the Company sought an independent valuation for the land, buildings and investment properties owned by SWU. The valuation had not been completed by the date the 2015 financial statements were approved for issue by the BOD.
70 PHINMA CORPORATION
The trade and other current receivable amounted to P=59.1 million. The gross amount of trade receivables is P=276.3 million. The difference between the fair value and the gross amount of trade receivables represents the portion expected to be uncollectible.
The deferred tax liability mainly comprises the tax effect of the fair value adjustments on certain property and equipment amounting to P=118.7 million. Deferred tax liability recognized on students list amounted to P=3.5 million.
Goodwill determined provisionally from the acquisition amounted to P=1.1 billion. Goodwill is allocated entirely to the education segment. Student lists amounting to P=34.5 million was separately recognized and meets the criteria for recognition as an intangible asset under PAS 38. None of the goodwill recognized is expected to be deductible for income tax purposes.
Contingent liabilities totaling P=100.0 million was recognized at acquisition date arising from probable claim and contingencies. No further disclosures regarding the contingent liability arising from probable claims are made by SWU at this time as SWU believes that such further disclosures might be prejudicial to its position.
The Company has elected to measure the NCI based on the NCI’s proportionate share in the fair value of the net identifiable assets at acquisition date.
Certain selling shareholders were granted the option to repurchase the shares sold at a price equal to the consideration given by the Parent Company. There are 3,997 options granted which can be exercised over the excess of 2/3 of the issued and outstanding shares owned by the Parent Company. The option may be exercised after the lapse of 6 months from closing date and within 5 years from the said closing date. As at December 31, 2015, the value of the option is not material.
From the date of acquisition, SWU contributed P=387.1 million of revenue and P=120.6 million to profit before tax from continuing operations of the Company. If the acquisition had taken place at beginning of the year, revenue from continuing operation would have been P=561.1 million and profit before tax from continuing operation for the Company would have been P=183.5 million
The cash outflow related to the acquisition is as follows:
Amount (In Thousands)
Cash paid on acquisition dates P=2,508,076 Less cash of acquired subsidiary 118,019 Net cash outflow P=2,390,057
Transaction costs of P=33.8 million were expensed and are included in “General and Administrative Expenses” in the consolidated statement of income and are part of operating cash flows for the year ended December 31, 2015.
In addition to the acquired shares mentioned above, the Parent Company has partially paid 1,682 common shares representing 5.81% ownership interest pending a court ruling to facilitate completion of the purchase. As at December 31, 2015, the Company classified the partial payment of P=60.7 million as advances.
7. Transactions with Non-controlling Interests and Others
Adjustments to Cost of Business Combinations of UPANG (acquired in 2009) andAU (acquired in 2006) In 2014, the Parent Company adjusted its consideration transferred for the acquisition of UPANG by P=39.4 million due to receipt of cash deposits in escrow which pertains to consideration waived by the sellers. The adjustment was recorded as reduction of goodwill in 2014 (see Note 17). The cash received also included interest of P=5.4 million which is recorded as part of “Investment income” account (see Note 23).
The Parent Company also reversed retention payable of P=9.5 million related to the acquisition of AU due to settlement in 2014 of open cases at the time of acquisition. This resulted in reduction of goodwill in AU by the same amount (see Note 17).
Acquisition of NCI in Fuld U.S. and Fuld Philippines The Parent Company invested additional P=9.2 million in Fuld U.S. and P=25.4 million in Fuld Philippines without corresponding increase in its economic interests. The transaction resulted in increase of NCI by P=5.2 million and decrease of “Other reserves” account for the same amount in 2014. In addition, a key officer of Fuld U.S. exercised stock options in 2014 resulting to a further increase in the NCI by P=4.7 million.
In May 2015, the Parent Company acquired the remaining 300 shares representing the remaining 15% NCI in Fuld PH for a cash consideration P=3.0 million.

2015 Annual Report 71
Sale of UPMCI On May 15, 2015, UPANG and PSI Healthcare Development Services (PSI) entered into share and asset purchase agreement whereas UPANG had agreed to sell its 138,407 shares in UPMCI, a subsidiary of UPANG, and certain parcel of land to PSI.
Proceeds from the sale of shares and land amounted to P=61.7 million and P=26.5 million, respectively. Gain on sale of subsidiary amounted to P=1.3 million included in “Others – net” in the consolidated statement of incomewhile loss on sale of land amounted to P=5.6 million included in “Gain on sale of property, plant and equipment – net” in the consolidated statement of income (see Note 15).
As at December 31, 2015, UPANG has retained 6,872 shares in UPMCI recognized as AFS investment amounting to P=3.3 million (see Note 14).
8. Material Partly-owned Subsidiaries
Financial information of subsidiaries that have material NCI are provided below:
Proportion of equity interest held by NCI follows:
Country of Percentage of Ownership Name Incorporation 2015 2014
API Philippines 42.38 42.38 UPANG and subsidiary Philippines 30.25 30.25 UI Philippines 30.21 30.21 COC Philippines 25.79 25.79 OAL and subsidiary Hong Kong 20.00 20.00 AU Philippines 21.36 21.36 PSHC* Philippines 40.00 40.00 SWU Philippines 26.26 –
*Not a material partly-owned subsidiary in 2015
Accumulated balances of material NCI as at December 31 follow:
Name 2015 2014
(Amounts in Thousands)
API P=179,839 P=178,835 UPANG and subsidiaries 164,869 164,013 UI 118,877 117,286 COC 82,927 77,811 OAL and subsidiary (58,300) (57,382) AU 60,601 54,379 PSHC 51,880 49,675 SWU 523,670 –
Profit (loss) allocated to material NCI for the years ended December 31 follows:
Name 2015 2014
(Amounts in Thousands)
API P=1,449 P=2,459 UPANG and subsidiaries 23,680 19,259 UI 20,224 11,966 COC 18,636 12,367 OAL and subsidiary (1,045) 64 AU 13,928 7,652 PSHC 2,205 1,117 SWU 32,697 –

72 PHINMA CORPORATION
The summarized financial information of these subsidiaries are provided below. This information is based on amounts before inter-company eliminations.
Summarized statements of financial position as at December 31, 2015 follow:
API
UPANG and
Subsidiary UI COC OAL and
subsidiary AU SWU PSHC
(Amounts in Thousands)
Current assets P=153,535 P=312,045 P=187,342 P=181,343 P=3,899 P=165,909 P=200,124 P=85,544 Non-current assets 336,612 831,519 388,747 413,898 3,748 518,394 2,107,536 220,000 Current liabilities (134,904) (218,380) (188,862) (211,385) (309,127) (138,497) (243,045) (4,085) Non-current liabilities – (296,556) (26,195) (116,943) (3,201) (136,480) (190,570) (171,757) Total equity P=355,243 P=628,628 P=361,032 P=266,913 (P=304,681) P=409,326 P=1,874,045 P=129,702
Attributable to: Equity holders of parent P=175,404 P=463,758 P=242,155 P=183,986 (P=246,381) P=348,725 P=1,350,375 P=77,822 Non-controlling interests 179,839 164,869 118,877 82,927 (58,300) 60,601 523,670 51,880
Summarized statements of financial position as at December 31, 2014 follow:
API
UPANG and
Subsidiaries UI COC OAL and
subsidiary AU PSHC
(Amounts in Thousands)
Current assets P=345,393 P=208,734 P=166,584 P=185,600 P=3,862 P=138,833 P=80,977 Non-current assets 8,000 1,519,494 970,733 398,607 4,702 541,658 220,000 Current liabilities (1,383) (182,708) (165,336) (156,875) (305,154) (115,478) (4,115) Non-current liabilities (184) (330,581) (139,137) (138,879) (3,201) (139,989) (172,674) Total equity P=351,826 P=1,214,939 P=832,844 P=288,453 (P=299,791) P=425,024 P=124,188
Attributable to: Equity holders of parent P=172,991 P=1,050,926 P=715,558 P=210,642 (P=242,409) P=370,645 P=74,513 Non-controlling interests 178,835 164,013 117,286 77,811 (57,382) 54,379 49,675
Summarized statements of income for 2015 follow:
API
UPANG and
Subsidiaries UI COC OAL and
Subsidiary AU SWU PSHC
(Amounts in Thousands)
Revenues P=4,437 P=344,652 P=284,482 P=321,759 P=2 P=273,755 P=387,096 P=22,621 Cost of sales – (122,620) (141,747) (125,230) – (109,203) (158,312) – Administrative expenses (2,048) (124,088) (72,185) (112,479) (5,214) (87,737) (116,503) (4,121) Finance costs – (12,614) (2) (4,986) – (6,948) – (11,021) Other income - net 1,050 2,903 3,373 281 (14) 1,778 8,323 2 Income before income tax 3,439 88,233 73,921 79,345 (5,226) 71,645 120,604 7,481 Income tax (20) (9,953) (6,976) (7,083) – (6,439) 3,909 (1,969) Net income P=3,419 P=78,280 P=66,945 P=72,262 (P=5,226) P=65,206 P=124,513 P=5,512
Attributable to: Equity holders of parent P=1,920 P=54,600 P=46,721 P=53,625 (P=4,181) P=51,278 P=91,816 P=3,307 Non-controlling interests 1,449 23,680 20,224 18,636 (1,045) 13,928 32,697 2,205
Summarized statements of income for 2014 follow:
API
UPANG and
Subsidiary UI COC OAL and
Subsidiary AU PSHC
(Amounts in Thousands)
Revenues P=7,290 P=393,832 P=246,347 P=259,779 P=16 P=229,300 P=21,195 Cost of sales – (172,077) (112,109) (107,785) – (104,350) – Administrative expenses (1,876) (140,131) (92,309) (93,848) (1,419) (77,454) (3,870) Finance costs – (12,356) (202) (5,220) – (7,434) (13,655) Other income - net 400 612 813 2 1,724 827 – Income before income tax 5,814 69,880 42,540 52,928 321 40,889 3,670 Income tax (10) (8,220) (2,931) (4,975) – (5,067) (878) Net income P=5,804 P=61,660 P=39,609 P=47,953 P=321 P=35,822 P=2,792

2015 Annual Report 73
API
UPANG and
Subsidiary UI COC OAL and
Subsidiary AU PSHC
(Amounts in Thousands)
Attributable to: Equity holders of parent P=3,345 P=42,401 P=27,643 P=35,586 P=257 P=28,170 P=1,675 Non-controlling interests 2,459 19,259 11,966 12,367 64 7,652 1,117
Summarized statements of cash flows for 2015 follow:
API
UPANG and
Subsidiaries UI COC OAL and
subsidiary AU SWU PSHC
(Amounts in Thousands)
Operating P=85,467 P=56,066 P=94,291 P=118,349 (P=4,932) P=85,600 P=36,758 P=6,096 Investing (194,883) (76,424) (26,269) (98,367) 588 (24,321) (42,151) – Financing – 20,804 (59,681) (53,309) 4,000 (58,821) (135) 249 Net increase (decrease)
in cash and cash equivalents (P=109,416) P=446 P=6,341 (P=33,327) (P=344) P=2,458 (P=5,528) P=6,345
Dividends paid to non-controlling interests P=– P=10,501 P=18,186 P=14,047 P=– P=14,792 P=– P=–
Summarized statements of cash flows for 2014 follow:
API
UPANG and
Subsidiary UI COC OAL and
subsidiary AU PSHC
(Amounts in Thousands)
Operating P=75,802 P=131,094 P=62,341 P=122,716 (P=3,326) P=60,474 P=2,350 Investing – (45,821) (17,892) (36,332) 583 217 (68,036) Financing (26,874) (36,998) (35,872) (53,613) (7,176) (50,095) (25,000) Net increase (decrease) in cash and
cash equivalents P=48,928 P=48,275 P=8,577 P=32,771 (P=9,919) P=10,596 (P=90,686)
Dividends paid to non-controlling interests P=7,285 P=7,008 P=11,895 P=9,544 P=– P=7,101 P=–
9. Cash and Cash Equivalents
This account consists of:
2015 2014
(Amounts in Thousands)
Cash on hand and in banks P=267,428 P=180,390 Short-term deposits 200,454 379,221 P=467,882 P=559,611
Cash in banks earn interest at the prevailing bank deposit rates. Short-term deposits are made for varying periods of up to three months depending on the immediate cash requirements of the Company and earn interest at the respective short-term deposit rates.
Interest income from cash and cash equivalents amounted to P=5.3 million, P=3.3 million and P=4.9 million in 2015, 2014, and 2013 respectively (see Note 23).
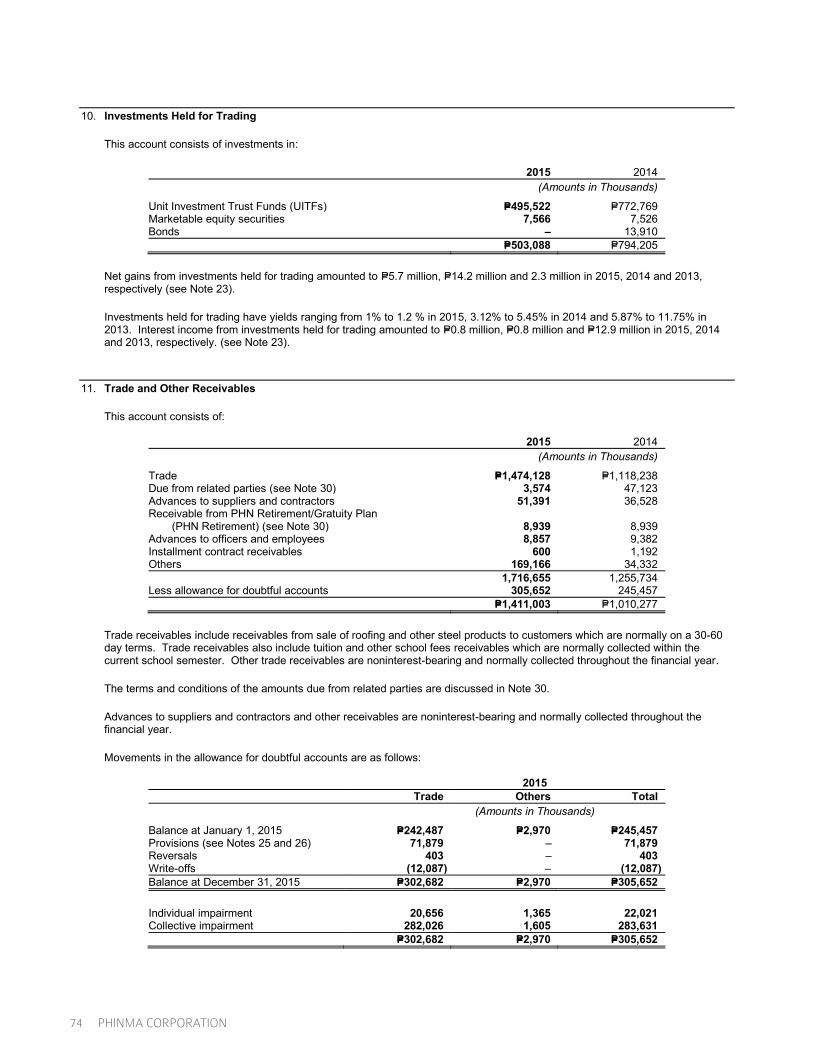
74 PHINMA CORPORATION
10. Investments Held for Trading
This account consists of investments in:
2015 2014
(Amounts in Thousands)
Unit Investment Trust Funds (UITFs) P=495,522 P=772,769 Marketable equity securities 7,566 7,526 Bonds – 13,910 P=503,088 P=794,205
Net gains from investments held for trading amounted to P=5.7 million, P=14.2 million and 2.3 million in 2015, 2014 and 2013, respectively (see Note 23).
Investments held for trading have yields ranging from 1% to 1.2 % in 2015, 3.12% to 5.45% in 2014 and 5.87% to 11.75% in 2013. Interest income from investments held for trading amounted to P=0.8 million, P=0.8 million and P=12.9 million in 2015, 2014 and 2013, respectively. (see Note 23).
11. Trade and Other Receivables
This account consists of:
2015 2014
(Amounts in Thousands)
Trade P=1,474,128 P=1,118,238 Due from related parties (see Note 30) 3,574 47,123 Advances to suppliers and contractors 51,391 36,528 Receivable from PHN Retirement/Gratuity Plan
(PHN Retirement) (see Note 30) 8,939 8,939 Advances to officers and employees 8,857 9,382 Installment contract receivables 600 1,192 Others 169,166 34,332 1,716,655 1,255,734 Less allowance for doubtful accounts 305,652 245,457 P=1,411,003 P=1,010,277
Trade receivables include receivables from sale of roofing and other steel products to customers which are normally on a 30-60 day terms. Trade receivables also include tuition and other school fees receivables which are normally collected within the current school semester. Other trade receivables are noninterest-bearing and normally collected throughout the financial year.
The terms and conditions of the amounts due from related parties are discussed in Note 30.
Advances to suppliers and contractors and other receivables are noninterest-bearing and normally collected throughout the financial year.
Movements in the allowance for doubtful accounts are as follows:
2015 Trade Others Total
(Amounts in Thousands)
Balance at January 1, 2015 P=242,487 P=2,970 P=245,457 Provisions (see Notes 25 and 26) 71,879 – 71,879 Reversals 403 – 403 Write-offs (12,087) – (12,087) Balance at December 31, 2015 P=302,682 P=2,970 P=305,652
Individual impairment 20,656 1,365 22,021 Collective impairment 282,026 1,605 283,631 P=302,682 P=2,970 P=305,652

2015 Annual Report 75
2014 Trade Others Total
(Amounts in Thousands)
Balance at January 1, 2014 P=194,461 P=5,569 P=200,030 Provisions (see Notes 25 and 26) 51,477 – 51,477 Write-offs (3,451) (2,599) (6,050) Balance at December 31, 2014 P=242,487 P=2,970 P=245,457
Individual impairment P=43,652 P=1,268 P=44,920 Collective impairment 198,835 1,702 200,537 P=242,487 P=2,970 P=245,457
12. Inventories
This account consists of:
2015 2014
(Amounts in Thousands)
At cost: Finished goods P=659,317 P=1,073,974 Raw materials 39,719 17,404 Other inventories 48,043 34,934 At net realizable value - Spare parts and others 40,035 22,586 P=787,114 P=1,148,898
Under the terms of the agreements covering liabilities under trust receipts, certain inventories amounting to P=200.5 million as at December 31,2014, have been released to UGC in trust for the banks. UGC is accountable to the banks for the inventories under trust or its sales proceeds.
Finished goods mainly represent roofing and other steel products of UGC.
The cost of spare parts and other inventories carried at net realizable value amounted to P=41.8 million and P=46.8 million as of December 31, 2015 and 2014, respectively. In 2014, the Company recorded provision for inventory obsolescence of P=22.8 million (see Note 24).
Cost of inventories sold, presented as “Inventories used” under “Cost of Sales”, amounted to P=2,565.8 million, P=2,555.6 million and P=2,291.0 million in 2015, 2014 and 2013, respectively (see Note 24).
13. Investments in Associates
This account consists of investments in the following entities:
Percentage of Ownership 2015 2014 PHINMA Property Holdings Corporation (PPHC) 35.42 35.34 Trans-Asia Oil and Energy Development Corporation (TA Oil) 26.41 26.24 ABCIC Property Holdings, Inc. (APHI) 26.51 26.51 Microtel Development Corporation (MDC) 36.23 – Coral Way City Hotel Corporation (Coral Way) 23.75 23.75 Trans-Asia Petroleum Corporation (TA Pet)(**) 12.99 12.99 Academy of Competitive Intelligence 47.50 47.50 Asia Coal Corporation (Asia Coal) (*) 12.08 12.08
(*)Ceased commercial operations and in the process of dissolution. (**)TA Pet is a subsidiary of TA Oil, which is an associate of PHN. Thus, TA Pet is also considered an
associate of PHN even if PHN’s ownership interest is less than 20%.
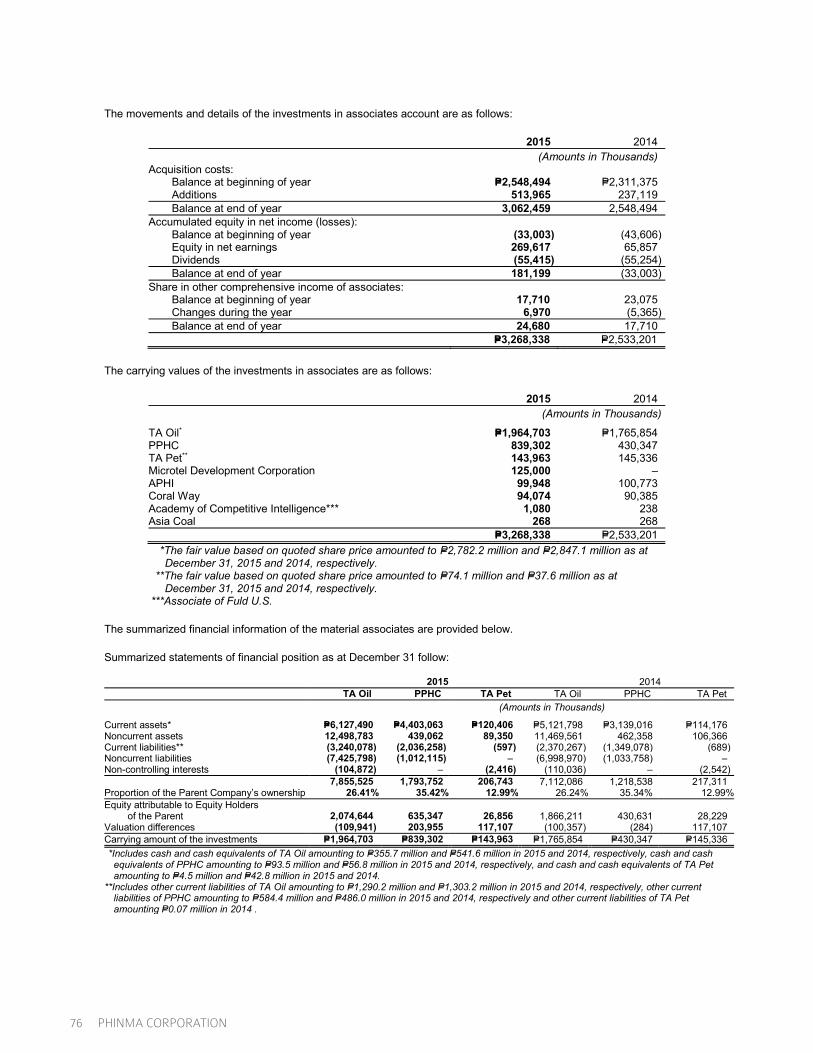
76 PHINMA CORPORATION
The movements and details of the investments in associates account are as follows:
2015 2014 (Amounts in Thousands) Acquisition costs: Balance at beginning of year P=2,548,494 P=2,311,375 Additions 513,965 237,119 Balance at end of year 3,062,459 2,548,494 Accumulated equity in net income (losses): Balance at beginning of year (33,003) (43,606) Equity in net earnings 269,617 65,857 Dividends (55,415) (55,254) Balance at end of year 181,199 (33,003) Share in other comprehensive income of associates: Balance at beginning of year 17,710 23,075 Changes during the year 6,970 (5,365) Balance at end of year 24,680 17,710 P=3,268,338 P=2,533,201
The carrying values of the investments in associates are as follows:
2015 2014
(Amounts in Thousands)
TA Oil* P=1,964,703 P=1,765,854 PPHC 839,302 430,347 TA Pet** 143,963 145,336 Microtel Development Corporation 125,000 – APHI 99,948 100,773 Coral Way 94,074 90,385 Academy of Competitive Intelligence*** 1,080 238 Asia Coal 268 268 P=3,268,338 P=2,533,201 ***The fair value based on quoted share price amounted to P=2,782.2 million and P=2,847.1 million as at
December 31, 2015 and 2014, respectively. ***The fair value based on quoted share price amounted to P=74.1 million and P=37.6 million as at
December 31, 2015 and 2014, respectively. ***Associate of Fuld U.S.
The summarized financial information of the material associates are provided below.
Summarized statements of financial position as at December 31 follow:
2015 2014 TA Oil PPHC TA Pet TA Oil PPHC TA Pet
(Amounts in Thousands)
Current assets* P=6,127,490 P=4,403,063 P=120,406 P=5,121,798 P=3,139,016 P=114,176 Noncurrent assets 12,498,783 439,062 89,350 11,469,561 462,358 106,366 Current liabilities** (3,240,078) (2,036,258) (597) (2,370,267) (1,349,078) (689) Noncurrent liabilities (7,425,798) (1,012,115) – (6,998,970) (1,033,758) – Non-controlling interests (104,872) – (2,416) (110,036) – (2,542) 7,855,525 1,793,752 206,743 7,112,086 1,218,538 217,311 Proportion of the Parent Company’s ownership 26.41% 35.42% 12.99% 26.24% 35.34% 12.99%Equity attributable to Equity Holders
of the Parent 2,074,644 635,347 26,856 1,866,211 430,631 28,229 Valuation differences (109,941) 203,955 117,107 (100,357) (284) 117,107 Carrying amount of the investments P=1,964,703 P=839,302 P=143,963 P=1,765,854 P=430,347 P=145,336 **Includes cash and cash equivalents of TA Oil amounting to P=355.7 million and P=541.6 million in 2015 and 2014, respectively, cash and cash
equivalents of PPHC amounting to P=93.5 million and P=56.8 million in 2015 and 2014, respectively, and cash and cash equivalents of TA Pet amounting to P=4.5 million and P=42.8 million in 2015 and 2014.
**Includes other current liabilities of TA Oil amounting to P=1,290.2 million and P=1,303.2 million in 2015 and 2014, respectively, other current liabilities of PPHC amounting to P=584.4 million and P=486.0 million in 2015 and 2014, respectively and other current liabilities of TA Pet amounting P=0.07 million in 2014 .
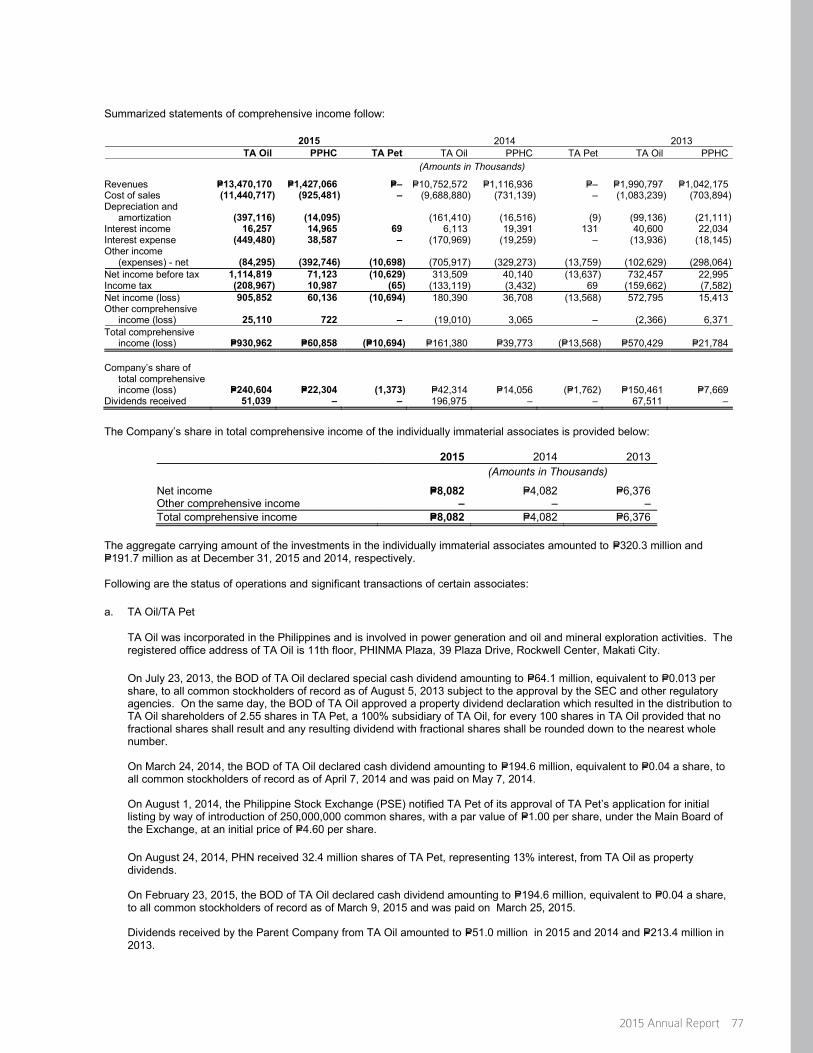
2015 Annual Report 77
Summarized statements of comprehensive income follow:
2015 2014 2013 TA Oil PPHC TA Pet TA Oil PPHC TA Pet TA Oil PPHC
(Amounts in Thousands)
Revenues P=13,470,170 P=1,427,066 P=– P=10,752,572 P=1,116,936 P=– P=1,990,797 P=1,042,175 Cost of sales (11,440,717) (925,481) – (9,688,880) (731,139) – (1,083,239) (703,894) Depreciation and
amortization (397,116) (14,095) (161,410) (16,516) (9) (99,136) (21,111) Interest income 16,257 14,965 69 6,113 19,391 131 40,600 22,034 Interest expense (449,480) 38,587 – (170,969) (19,259) – (13,936) (18,145) Other income
(expenses) - net (84,295) (392,746) (10,698) (705,917) (329,273) (13,759) (102,629) (298,064) Net income before tax 1,114,819 71,123 (10,629) 313,509 40,140 (13,637) 732,457 22,995 Income tax (208,967) 10,987 (65) (133,119) (3,432) 69 (159,662) (7,582) Net income (loss) 905,852 60,136 (10,694) 180,390 36,708 (13,568) 572,795 15,413 Other comprehensive
income (loss) 25,110 722 – (19,010) 3,065 – (2,366) 6,371 Total comprehensive
income (loss) P=930,962 P=60,858 (P=10,694) P=161,380 P=39,773 (P=13,568) P=570,429 P=21,784
Company’s share of total comprehensive income (loss) P=240,604 P=22,304 (1,373) P=42,314 P=14,056 (P=1,762) P=150,461 P=7,669
Dividends received 51,039 – – 196,975 – – 67,511 –
The Company’s share in total comprehensive income of the individually immaterial associates is provided below:
2015 2014 2013
(Amounts in Thousands)
Net income P=8,082 P=4,082 P=6,376 Other comprehensive income – – – Total comprehensive income P=8,082 P=4,082 P=6,376
The aggregate carrying amount of the investments in the individually immaterial associates amounted to P=320.3 million and P=191.7 million as at December 31, 2015 and 2014, respectively.
Following are the status of operations and significant transactions of certain associates:
a. TA Oil/TA Pet
TA Oil was incorporated in the Philippines and is involved in power generation and oil and mineral exploration activities. The registered office address of TA Oil is 11th floor, PHINMA Plaza, 39 Plaza Drive, Rockwell Center, Makati City.
On July 23, 2013, the BOD of TA Oil declared special cash dividend amounting to P=64.1 million, equivalent to P=0.013 per share, to all common stockholders of record as of August 5, 2013 subject to the approval by the SEC and other regulatory agencies. On the same day, the BOD of TA Oil approved a property dividend declaration which resulted in the distribution to TA Oil shareholders of 2.55 shares in TA Pet, a 100% subsidiary of TA Oil, for every 100 shares in TA Oil provided that no fractional shares shall result and any resulting dividend with fractional shares shall be rounded down to the nearest whole number.
On March 24, 2014, the BOD of TA Oil declared cash dividend amounting to P=194.6 million, equivalent to P=0.04 a share, to all common stockholders of record as of April 7, 2014 and was paid on May 7, 2014.
On August 1, 2014, the Philippine Stock Exchange (PSE) notified TA Pet of its approval of TA Pet’s applicat ion for initial listing by way of introduction of 250,000,000 common shares, with a par value of P=1.00 per share, under the Main Board of the Exchange, at an initial price of P=4.60 per share.
On August 24, 2014, PHN received 32.4 million shares of TA Pet, representing 13% interest, from TA Oil as property dividends.
On February 23, 2015, the BOD of TA Oil declared cash dividend amounting to P=194.6 million, equivalent to P=0.04 a share, to all common stockholders of record as of March 9, 2015 and was paid on March 25, 2015.
Dividends received by the Parent Company from TA Oil amounted to P=51.0 million in 2015 and 2014 and P=213.4 million in 2013.

78 PHINMA CORPORATION
The Parent Company acquired additional shares in TA Oil amounting to P=1.8 million and P=2.3 million in 2015 and 2014, respectively. This resulted in increase in ownership interest in TA Oil from 26.24% in 2014 to 26.41% in 2015.
b. PPHC
PPHC was incorporated in the Philippines and is engaged in real estate development, particularly in the development of affordable medium and high-rise condominium units. The registered office address of the PPHC is PHINMA Properties Center, No. 29 EDSA, Mandaluyong City.
The Parent Company and API, a subsidiary, subscribed to additional shares in PPHC amounting to P=183.4 million and P=203.2 million, respectively, in July 2015. This resulted in increase in ownership interest in PPHC from 35.34% in 2014 to 35.42% in 2015. Subscription payables amounting to P=154.7 million is included in “Due to related parties” account in the consolidated statement of financial position.
c. AB Capital/APHI
AB Capital is an investment house that engages in corporate finance, fixed-income securities dealership, stock brokerage and fund management.
Pursuant to an agreement between PHN and Vicsal in March 2011, PHN agreed to sell its shares in AB Capital subject to certain conditions, including the following:
(a) Approval of BSP (b) Removal of assets other than those identified and agreed to be retained by Vicsal in AB Capital, by transfer to a New
Company (APHI) in exchange for shares in APHI and/or by sale or assignment of assets to the APHI; (c) Return of capital to PHN pertaining to shares in APHI; (d) Selling Shareholders shall secure all Government Authorizations, including approvals and clearances, required for the
return of capital of AB Capital to PHN and other sellers; and (e) On Closing Date, PHN shall transmit to the Buyer the Deed of Absolute Sale.
On December 9, 2013, the SEC approved the return of capital of APHI to PHN and other selling shareholders.
On January 16, 2014, after having complied with the other conditions under the Share Purchase Agreement, PHN sold 406,361 shares in AB Capital to Vicsal for P=97.5 million and on the same date signed the Deed of Absolute Sale.
d. Coral Way City Hotel Corporation (Coral Way)
Coral Way was incorporated in the Philippines and registered with the SEC on December 10, 2007. It owns and operates Microtel Mall of Asia (the Hotel) which started commercial operations on September 1, 2010.
In March 2014, PHN entered into a Memorandum of Agreement (MOA) with Coral Way wherein PHN converted its investment in preferred shares to common shares. The conversion resulted in a gain of P=23.2 million, representing mainly of accumulated dividends on the preferred shares.
e. Microtel Development Corporation (MDC)
In 2015, API, a subsidiary of PHN, subscribed to 12,500,000 shares of MDC representing 36.23% of MDC’s outstanding shares for P=125 million. Subscription payable amounting to P=52.0 million is included in “Due to related parties” in the consolidated statement of financial position.
14. AFS Investments
This account consists of:
2015 2014
(Amounts in Thousands)
Unquoted equity securities P=103,885 P=101,032 Quoted equity securities 13,161 – Accumulated impairment losses (45,517) (45,517) P=71,529 P=55,515
AFS investments consist of investment in ordinary shares and proprietary shares.
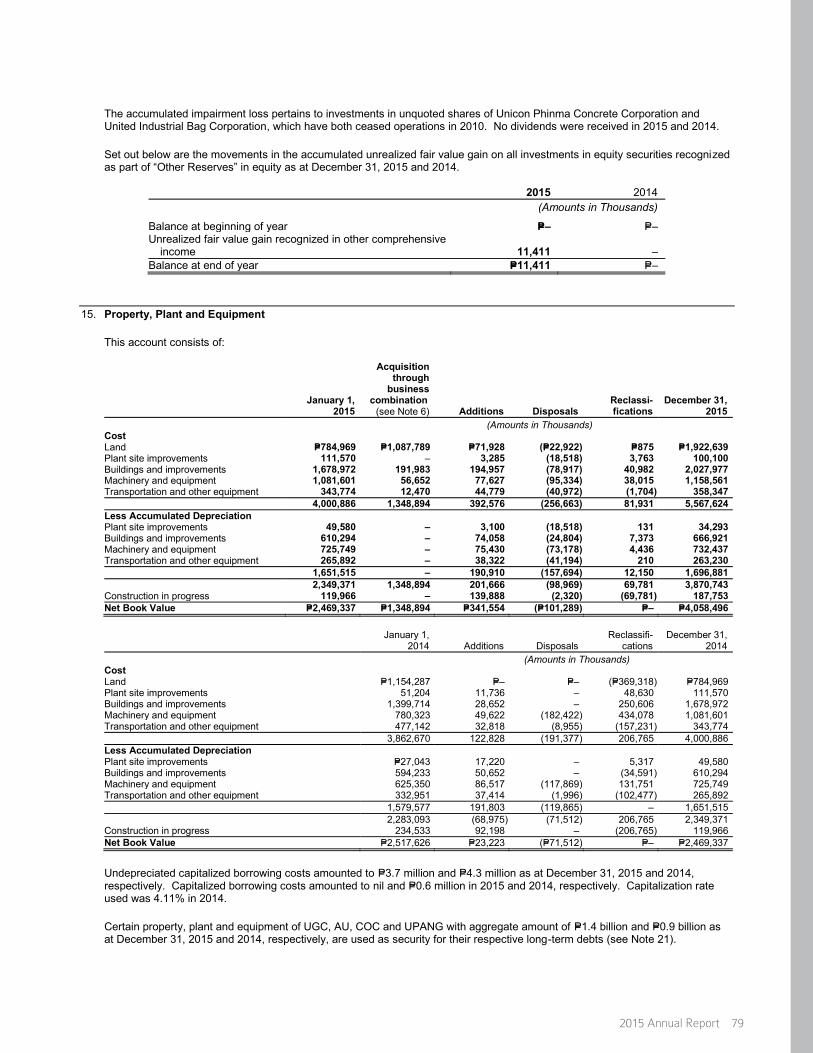
2015 Annual Report 79
The accumulated impairment loss pertains to investments in unquoted shares of Unicon Phinma Concrete Corporation and United Industrial Bag Corporation, which have both ceased operations in 2010. No dividends were received in 2015 and 2014.
Set out below are the movements in the accumulated unrealized fair value gain on all investments in equity securities recognized as part of “Other Reserves” in equity as at December 31, 2015 and 2014.
2015 2014
(Amounts in Thousands)
Balance at beginning of year P=– P=– Unrealized fair value gain recognized in other comprehensive
income 11,411 – Balance at end of year P=11,411 P=–
15. Property, Plant and Equipment
This account consists of:
January 1,
2015
Acquisition through
business combination
(see Note 6) Additions Disposals Reclassi-fications
December 31, 2015
(Amounts in Thousands) Cost Land P=784,969 P=1,087,789 P=71,928 (P=22,922) P=875 P=1,922,639 Plant site improvements 111,570 – 3,285 (18,518) 3,763 100,100 Buildings and improvements 1,678,972 191,983 194,957 (78,917) 40,982 2,027,977 Machinery and equipment 1,081,601 56,652 77,627 (95,334) 38,015 1,158,561 Transportation and other equipment 343,774 12,470 44,779 (40,972) (1,704) 358,347 4,000,886 1,348,894 392,576 (256,663) 81,931 5,567,624 Less Accumulated Depreciation Plant site improvements 49,580 – 3,100 (18,518) 131 34,293 Buildings and improvements 610,294 – 74,058 (24,804) 7,373 666,921 Machinery and equipment 725,749 – 75,430 (73,178) 4,436 732,437 Transportation and other equipment 265,892 – 38,322 (41,194) 210 263,230 1,651,515 – 190,910 (157,694) 12,150 1,696,881 2,349,371 1,348,894 201,666 (98,969) 69,781 3,870,743 Construction in progress 119,966 – 139,888 (2,320) (69,781) 187,753 Net Book Value P=2,469,337 P=1,348,894 P=341,554 (P=101,289) P=– P=4,058,496
January 1,
2014 Additions Disposals Reclassifi-
cations December 31,
2014 (Amounts in Thousands) Cost Land P=1,154,287 P=– P=– (P=369,318) P=784,969 Plant site improvements 51,204 11,736 – 48,630 111,570 Buildings and improvements 1,399,714 28,652 – 250,606 1,678,972 Machinery and equipment 780,323 49,622 (182,422) 434,078 1,081,601 Transportation and other equipment 477,142 32,818 (8,955) (157,231) 343,774 3,862,670 122,828 (191,377) 206,765 4,000,886 Less Accumulated Depreciation Plant site improvements P=27,043 17,220 – 5,317 49,580 Buildings and improvements 594,233 50,652 – (34,591) 610,294 Machinery and equipment 625,350 86,517 (117,869) 131,751 725,749 Transportation and other equipment 332,951 37,414 (1,996) (102,477) 265,892 1,579,577 191,803 (119,865) – 1,651,515 2,283,093 (68,975) (71,512) 206,765 2,349,371 Construction in progress 234,533 92,198 – (206,765) 119,966 Net Book Value P=2,517,626 P=23,223 (P=71,512) P=– P=2,469,337
Undepreciated capitalized borrowing costs amounted to P=3.7 million and P=4.3 million as at December 31, 2015 and 2014, respectively. Capitalized borrowing costs amounted to nil and P=0.6 million in 2015 and 2014, respectively. Capitalization rate used was 4.11% in 2014.
Certain property, plant and equipment of UGC, AU, COC and UPANG with aggregate amount of P=1.4 billion and P=0.9 billion as at December 31, 2015 and 2014, respectively, are used as security for their respective long-term debts (see Note 21).

80 PHINMA CORPORATION
On May 15, 2015, UPANG sold 2,713 square meter parcel of land to PSI. Proceeds from the sale of land amounted to P=26.5 million resulting to a loss of P=5.6 million recognized in 2015 (see Note 7).
The Company has fully depreciated property and equipment still used in operations with cost of P=724.4 million and P=450.1 million as at December 31, 2015 and 2014, respectively.
16. Investment Properties
This account consists of:
January 1,
2015
Acquisition through
business combination
(see Note 6) Additions Disposals December 31,
2015
(Amounts in Thousands)
Cost: Land P=368,741 P=713,433 – (P=25,225) P=1,056,949 Buildings for lease 94,579 – – – 94,579 463,320 713,433 – (25,225) 1,151,528 Less accumulated depreciation - Buildings for lease 31,618 6,147 – 37,765 P=431,702 P=713,433 (P=6,147) (P=25,225) P=1,113,763
January 1,
2014 Additions Disposals Reclassification December 31,
2014
(Amounts in Thousands)
Cost: Land P=368,741 P=– P=– P=– P=368,741 Buildings for lease 94,579 – – – 94,579 463,320 – – – 463,320 Less accumulated depreciation - Buildings for lease 25,471 6,147 – – 31,618 P=437,849 (P=6,147) P=– P=– P=431,702
The profits from the investment properties for the years ended December 31 are as follows:
2015 2014 2013
(Amounts in Thousands)
Rental income P=62,463 P=47,048 P=44,813 Direct costs and expenses (included under
“General and administrative expenses” account) (see Note 25) (6,147) (6,147) (6,147)
P=56,316 P=40,901 P=38,666
As at December 31, 2015 and 2014, the fair values of the investment properties amounted to P=1,455.0 million and P=741.0 million, respectively, based on valuations performed by accredited independent appraisers. The description of the valuation techniques used and key inputs to fair valuation are as follows:
Valuation Technique Significant Unobservable Inputs Range Land Market comparable assets Price per square metre P=350–P=5,300 Buildings for lease Market comparable assets Price per square metre P=107,000–P=120,000
The fair value disclosure is categorized under Level 3.
PSHC’s land amounting to P=220.0 million is used as a security for its long-term debt (see Note 21). Other than this, the Company has no restrictions on the realizability of its investment properties and no contractual obligations to either purchase, construct or develop investment properties.
On January 8, 2015, PHN sold its 21.05% ownership share in a parcel of land in Meycauayan Bulacan for P=16.9 million. The Parent Company recorded a loss on sale of investment property in the amount of P=8.3 million (see Note 16).

2015 Annual Report 81
17. Intangible Assets
Following are the details and movements in this account:
Student List Software
Costs Customer Contracts
Trademarks with
Indefinite Useful Life Goodwill Total
Cost At January 1, 2014 P=131,120 P=– P=22,080 P=47,156 P=1,422,546 P=1,622,902 Additions – 22,088 – – – 22,088 Adjustment – – – 772 (36,918) (36,146) At December 31, 2014 P=131,120 P=22,088 P=22,080 P=47,928 P=1,385,628 P=1,608,844 Additions (see Note 6) 34,518 – – – 1,126,093 1,160,611 Adjustment – – – 2,507 3,468 5,975 At December 31, 2015 P=165,638 P=22,088 P=22,080 P=50,435 P=2,515,189 P=2,775,430
Amortization and Impairment At January 1, 2014 P=131,120 P=– P=22,080 P=– P=378,669 P=531,869 Amortization – 4,418 – – – 4,418 At December 31, 2014 P=131,120 P=4,418 P=22,080 P=– P=378,669 P=536,287 Amortization 7,671 4,418 – – – 12,089 Impairment – – – – 10,343 10,343 At December 31, 2015 P=138,791 P=8,836 P=22,080 P=– P=389,012 P=558,719
Net Book Value At December 31, 2015 P=26,847 P=13,252 P=– P=50,435 P=2,126,177 P=2,216,711 At December 31, 2014 P=– P=17,670 P=– P=47,928 P=1,006,959 P=1,072,557
The Company performs its annual impairment test close to year-end, after finalizing the annual financial budgets and forecasts. The impairment test of goodwill is based on VIU calculations that uses the discounted cash flow model. Cash flow projections are based on most recent financial budgets and forecast. Discount rates applied are based on market weighted average cost of capital with estimated premium over cost of equity. The carrying amount of goodwill allocated to each of the CGUs and key assumptions used to determine the recoverable amount for the different CGUs are discussed in Note 5.
Based on the impairment test performed for each of the CGUs, management identified impairment loss of P=10.3 million and nil in 2015 and 2014, respectively. Goodwill acquired from the Company’s acquisition of SWU in 2015 is based on provisional values (see Note 6) and therefore the amount of goodwill has yet to be allocated to specific CGUs.
18. Other Noncurrent Assets
This account consists of:
2015 2014
(Amounts in Thousands)
Refundable deposits P=20,463 P=18,841 Installment contract receivable 1,200 1,800 Input VAT - net of allowance for impairment of unrecoverable
amount of P=113.7 million and P=116.8 million in 2015 and 2014, respectively (see Note 24) – –
Others - net of allowance for doubtful advances of P=51.5 million in 2015 and 2014 13,734 15,191
P=35,397 P=35,832
19. Notes Payable
This account consists of notes payable of the following subsidiaries:
2015 2014
(Amounts in Thousands)
UGC P=265,724 P=390,054 AU 15,000 – P=280,724 P=390,054
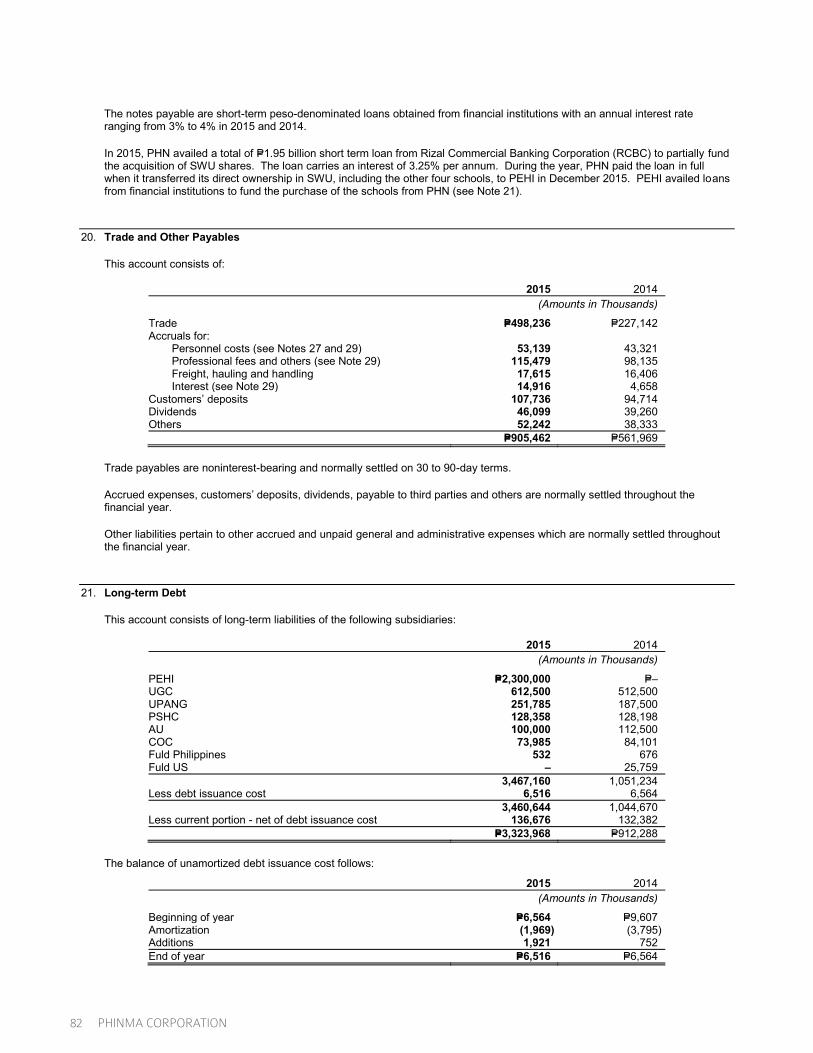
82 PHINMA CORPORATION
The notes payable are short-term peso-denominated loans obtained from financial institutions with an annual interest rate ranging from 3% to 4% in 2015 and 2014.
In 2015, PHN availed a total of P=1.95 billion short term loan from Rizal Commercial Banking Corporation (RCBC) to partially fund the acquisition of SWU shares. The loan carries an interest of 3.25% per annum. During the year, PHN paid the loan in full when it transferred its direct ownership in SWU, including the other four schools, to PEHI in December 2015. PEHI availed loans from financial institutions to fund the purchase of the schools from PHN (see Note 21).
20. Trade and Other Payables
This account consists of:
2015 2014
(Amounts in Thousands)
Trade P=498,236 P=227,142 Accruals for: Personnel costs (see Notes 27 and 29) 53,139 43,321 Professional fees and others (see Note 29) 115,479 98,135 Freight, hauling and handling 17,615 16,406 Interest (see Note 29) 14,916 4,658 Customers’ deposits 107,736 94,714 Dividends 46,099 39,260 Others 52,242 38,333 P=905,462 P=561,969
Trade payables are noninterest-bearing and normally settled on 30 to 90-day terms.
Accrued expenses, customers’ deposits, dividends, payable to third parties and others are normally settled throughout the financial year.
Other liabilities pertain to other accrued and unpaid general and administrative expenses which are normally settled throughout the financial year.
21. Long-term Debt
This account consists of long-term liabilities of the following subsidiaries:
2015 2014
(Amounts in Thousands)
PEHI P=2,300,000 P=– UGC 612,500 512,500 UPANG 251,785 187,500 PSHC 128,358 128,198 AU 100,000 112,500 COC 73,985 84,101 Fuld Philippines 532 676 Fuld US – 25,759 3,467,160 1,051,234 Less debt issuance cost 6,516 6,564 3,460,644 1,044,670 Less current portion - net of debt issuance cost 136,676 132,382 P=3,323,968 P=912,288
The balance of unamortized debt issuance cost follows:
2015 2014
(Amounts in Thousands)
Beginning of year P=6,564 P=9,607 Amortization (1,969) (3,795) Additions 1,921 752 End of year P=6,516 P=6,564

2015 Annual Report 83
UGC
On March 31, 2013, UGC obtained a five-year term loan from Security Bank Corporation (SBC) and Banco de Oro Unibank, Inc. (BDO) in the amount of P=300 million each.
Below is a summary of the terms of the said loans:
Bank BDO
Amount drawn P=300.0 million
Tenure Five (5) - year term loan
Repayment Principal shall be payable in 19 equal quarterly repayment of P=6.25 million and final quarter payment of P=181.3 million
Prepayment Allowed after third year without penalty
Drawdown date March 31, 2013
Start of amortization payment June 21, 2013
End of term loan March 21, 2018
Interest rate Interest shall be fixed at 4.5% for the first 5 years. Repricing on year 4 at lender’s option at 2 year PDST-F +1.375% or 4.5% whichever is higher or repriced on year 5 at lender’s option to 1 year PDST-F + 1.375% or 4.5% whichever is higher
Collateral 50% real estate mortgage on land, building and machinery in Calamba and Davao plants
Use of proceeds Working capital requirements
Bank SBC
Amount drawn P=300.0 million
Tenure Five (5) - year term loan
Repayment Principal shall be payable in 19 equal quarterly repayment of P=6.25 million and final quarter payment of P=181.3 million
Drawdown date March 25, 2013
Start of amortization payment June 21, 2013
End of term loan March 25, 2018
Interest rate Interest shall be fixed at 5.0%
Collateral 50% real estate mortgage on land, building and machinery in Calamba and Davao plants
Use of proceeds Working capital requirements
In 2015, UGC obtained a ten year term loan from SBC and BDO in the amount of P=75 million each. UGC paid P=50.0 million of the loan in 2015. Below is the summary of the said loans.
Bank BDO
Amount drawn P=75.0 million
Tenure Ten (10) - year term loan
Repayment Principal shall be payable in 39 equal quarterly repayment of P=1.9 million
Prepayment Allowed without pernalty provided there is at least Thirty (30) days prior written notice and prepayment shall be done on Interest Repricing Date
Drawdown date November 5, 2015

84 PHINMA CORPORATION
Start of amortization payment December 31, 2015
End of term loan November 5, 2025
Interest rate The interest rate on the BDO loan commencing from the borrowing date up to the last day immediately preceding the interest repricing date is based on a 5-year PDST-R2 plus a 1.4% spread or 5.5%, whichever is higher, and for the interest period commencing from the interest repricing date and each succeeding interest periods until the maturity date, the interest rate is the rate to be negotiated by the parties within 30 banking days prior to interest repricing date.
Collateral A parcel of land with improvements thereon located along Davao-Agusan Highway, Brgy. Ilang, Davao City
Four (4) parcel of land with improvements thereon located along Chipeco Avenue extension corner Villa de Calamba Road, Barangay Real, Calamba City.
Use of proceeds Working capital requirements
Bank SBC
Amount drawn P=75.0 million
Tenure Ten (10) years from initial drawdown date
Repayment Payable in forty (40) equal quarterly installments commencing at the end of the 1st quarter following the initial drawdown date.
Prepayment Allowed subject to the following conditions:
30 days prior notice and said notice shall be irrevocable
Allowed in whole or in part on any interest payment date
Prepayments shall be applied in reverse order
Break funding cost based on the difference between the contracted interest rate and the comparable benchmark, if any, for fixed rate portion shall be for the account of the borrower.
Drawdown date November 5, 2015
Start of amortization payment December 31, 2015
End of term loan November 5, 2025
Interest rate The interest rate on the SBC loan for the first 5 years is based on the 5-year PDST-R2 plus a 1.35% spread or 5.5%, whichever is higher, and to be repriced at the end of the fifth year for the remaining 5 years at an interest rate based on the 3- day average of the 5-year PDST-R2 plus a 1.35% spread or the interest rate set for the first 5 years, whichever is higher.
Collateral A parcel of land with improvements thereon located along Davao-Agusan Highway, Brgy. Ilang, Davao City
Four (4) parcel of land with improvements thereon located along Chipeco Avenue extension corner Villa de Calamba Road, Barangay Real, Calamba City.
Use of proceeds Working capital requirements and capital expenditures
As at December 31, 2015 and 2014, the loans from the lenders are collateralized by a mortgage agreement on the UGC’s land, plantsite improvements, buildings and installations and machinery and equipment of Calamba and Davao plants with carrying value amounting to P=476.4 million and P=399.2 million, respectively. In addition, UGC is required to maintain maximum debt to equity ratio of 2:1 under its loan covenants. As at December 31, 2015, UGC is in compliance with all of its loan covenants.
UPANG
On December 21, 2012, a 7-year Term Loan Agreement was signed by UPANG and China Banking Corporation (CBC) for a maximum principal amount of P=250.0 million. The proceeds were used to refinance existing obligations and to fund the capital expenditures for the school year 2012-2013. The loan proceeds were drawn on February 1, 2013 and February 15, 2013 for

2015 Annual Report 85
P=156.0 million and P=94.0 million, respectively. The loans are collateralized with land costing P=121.8 million and with a revalued amount of P=447.6 million . The terms of the loan are as follows:
Amount drawn P=156.0 million
Tenure Seven (7)-year term loan
Repayment Principal shall be payable in 28 equal quarterly repayment of P=5.6 million
Funding/Interest rate Interest shall be payable quarterly in arrears. Interest from (February 1, 2013–May 1, 2013) 89 days shall be at 5.7766% p.a. computed as 7-year PDSTF of 3.9688 plus spread of 175bps plus GRT of 1%. Starting May 2015, rate shall be at 6.0198%.
Security The facility is secured by Real Estate Mortgage amounting to P=300.0 million on the school assets covering land and land improvements.
Amount drawn P=94.0 million
Tenure Seven (7)-year term loan
Repayment Principal shall be payable in 28 equal quarterly repayment of P=3.4 million
Funding/Interest rate Interest shall be payable quarterly in arrears. Interest from (February 15, 2013–May 15, 2013) 89 days shall be at 5.5787% p.a. computed as 7-year PDSTF of 3.7729 plus spread of 175bps plus GRT of 1%. Starting May 2015, rate shall be at 5.8136%.
Security The facility is secured by Real Estate Mortgage amounting to P=300.0 million on the school assets covering land and land improvements.
The foregoing loan agreements include, among others, certain restrictions and requirements with respect to the following:
No payment of dividends will be allowed in the first three (3) years of the loan. Dividends may be paid starting in the 4th year, provided the Current Ratio (defined as current assets over current liabilities) shall not be less than 1.25:1.00 and Debt-Service Coverage ratio (defined as EBITDA over principal and interest payment) shall be at least 1.50:1.00.
Make or permit material change in the character of business; permit any material change in ownership of control of its stocks; participate in or enter into merger or consolidation which would result in a material change in control; voluntarily suspend its business operations or dissolve its affairs; amend its Articles of Incorporation and By-laws that would cause a material adverse change in financial ability and capacity of UPANG and; re-organize, undertake a quasi-reorganization, reduce its capital, change in its fiscal year, which would cause a material adverse change in the financial ability or capacity of the University.
As at December 31, 2015 and 2014, UPANG was in compliance with the terms of the loan agreement.
UPANG URDANETA
On September 29, 2015, a 10-year Term Loan Agreement was signed by PHINMA-UPANG College Urdaneta, Inc., a subsidiary of UPANG, and RCBC for a maximum principal amount of P=100.0 million. The proceed was used to refinance existing obligations and the improvement of Phinma-Upang College Urdaneta building located at 587 Mac Arthur Highway, Brgy. Nancayasan, Urdaneta City, Pangasinan. The loan proceed was drawn on September 29, 2015 for P=100.0 million. The loans were collateralized with land costing P=121.8 million. The terms of the loan are as follows:
Amount drawn P=100.0 million
Tenure Ten (10)-year term loan with three (3) years grace period
Repayment Principal shall be paid in the amounts of Php 625,000 quarterly in year 4, Php1,700,000 quarterly in year 5, Php2,650,000 quarterly in year 6, Php3,775,000 quarterly in year 7,
Php4,400,000 quarterly in year 8, Php4,375,000 quarterly in year 9, Php7,475,000 in year 10
Funding/Interest rate Interest shall be fixed rate at 5.5926% (5.6485% with GRT) for the first seven (7) years of the term based on 3 day average of 7-year PDST-R2 +1.42% spread, subject to repricing at the end of the seventh (7th) year based on the interest rate then current or the 3 day average of 3-year PDST R-2 plus 1.42% whichever is higher.

86 PHINMA CORPORATION
COC
COC entered into a Ten (10)-year Term Loan Agreement with a local financial institution for P=100.0 million of which P=50.0 million had been drawn on March 27, 2013 and the other P=50.0 million had been drawn on July 18, 2013. The loan is payable quarterly at P=2.5 million with fixed interest rates for the first 7 years and subject to quarterly repricing afterwards.
COC’s land and building improvements in the main campus amounting to P=157.9 million are mortgaged as collateral for its long-term debt.
COC’s debt instruments contain a number of positive covenants that requires COC to comply with specified legal and statutory obligations, including: (a) payment and discharge of all taxes, assessments, and governmental charges levied on the College or the College’s properties; (b) conducting its operations in accordance with sound business practice;(c) continuing all governmental and other approvals obtained relating to the agreement with the lender and obtaining new or additional actions necessary for the performance or enforceability of loan documents; (d) permitting the authorized representatives and agents of the lender to inspect COC’s sites at any reasonable time; and (e) maintaining reasonable collateral business with the lender.
COC’s debt instruments also contain a number of negative covenants that, subject to certain exceptions and qualifications, restrict the COC’s ability to take certain actions. This includes: (a) making or permitting any material change in the charac ter of its business; (b) permitting any material change in ownership or control of its capital stock; (c) participating in or entering into any merger or consolidation which would result in a material change in the control of COC; (d) amending its Articles of Incorporation or By-Laws; and (e) re-organizing, undertaking a quasi-reorganization, reducing its capital, or changing its fiscal year.
As at December 31, 2015 and 2014, COC is in compliance with all of their debt covenants.
AU
On December 11, 2013, a 10-year Term Loan Agreement was signed by the AU and RCBC for a principal amount of P=125.0 million. The proceeds will be used to refinance the short-term loans which was availed to finance the construction of the new campus and to refinance the existing term loan. The loan is payable quarterly at P=3.1 million. The University’s land and buildings and improvements amounting to P=138.2 are mortgaged as collateral for its long-term debt.
Interest is fixed for the first 7 years of the term based on 7-year PDSTF + 1.75% or a floor rate of 5.75%, whichever is higher, subject to repricing at the end of the 7th year. The University’s debt instruments contain a number of positive covenants that requires the University to comply with specified legal and statutory obligations, including: (a) conducting its operations in accordance with sound business practice; (b) payment and discharge of all taxes, assessments, and governmental charges levied on the University or the University’s properties and assets; (c) payment and discharge of all lawful claims which migh t, if unpaid, become a lien upon the properties or assets of the University; (d) maintain adequate insurance on insurable properties and assets with an accredited insurance company; (e) obtaining and maintaining all governmental permits, approvals and consents necessary for the performance of the University’s obligations; and (f) permitting any representatives of the lender to inspect any of the University’s properties and examine its books of accounts.
University’s debt instruments also contain a number of negative covenants that, subject to certain exceptions and qualifications, restrict the University’s ability to take certain actions. This includes: (a) sell, alienate, incur, assume, cause or allow to exist any other mortgage, lien, pledge or other encumbrance with respect to the University’s present or future fixed assets except in the ordinary course of business; (b) assume, guaranty, endorse or become liable in connection with any obligation except in the ordinary course of business; (c) allow its debt-to-equity ratio to exceed 1.75x; (d) allow its current ratio to be less than 1.00x; (e) enter into any merger or consolidation, sell, lease, transfer of substantially or all of its assets or voluntarily suspend its business operation or dissolves its affairs and/ or corporate personality; (f) make any investment of the University’s funds in any enterprise or undertaking not related to the University’s business or allow its investment in any related enterprise or under taking to exceed 25% of the University’s total assets; (g) undertake any capital expenditure outside the ordinary course of business; (h) enter into management contracts or make any major policy change; (i) enter into any long-term contract; (j) incur any additional obligation with maturity of more than one year; (k) purchase or redeem any of the University’s subscribed and outstanding capital stock; (l) grant loans/ advances to the University’s officers, employees and affiliated companies outside the ordinary course of business; and (m) permitting any substantial change in stock ownership.
As at December 31, 2015, the University is in compliance with the debt covenants.

2015 Annual Report 87
PEHI
On December 7 and December 8, 2015, PEHI obtained a ten-year term loan from RCBC and CBC in the amount of P=1.4 billion and P=900 million respectively. Below is a summary of the terms of the said loans:
Bank RCBC
Amount drawn P=900.0 million
Tenure Ten (10) years term loan
Repayment Principal shall be payable in 27 equal quarterly repayment of P=6.75 million and final quarter payment of P=717.8 million
Prepayment Allowed after fifth year without penalty
Drawdown date December 7, 2015
Start of amortization payment March 7, 2019
End of term loan December 7, 2025
Interest rate Repricing after 7th year: interest rate then current (6.0762%) or applicable 3-year benchmark rate + 1.40% spread, or 5.00% floor rate, whichever is higher
Bank RCBC
Amount drawn P=500.0 million
Tenure Ten (10) years term loan
Repayment Principal shall be payable in 27 equal quarterly repayment of P=3.75 million and final quarter payment of P=398.8 million
Drawdown date December 7, 2015
Start of amortization payment March 7, 2019
End of term loan December 7, 2025
Interest rate Repricing after 5th year: interest rate then current (5.3179%) or applicable 5-year benchmark rate + 1.35% spread, or 5.00% floor rate, whichever is higher.
Bank CBC
Amount drawn P=500.0 million
Tenure Ten (10) years term loan.
Repayment Principal shall be payable in 27 equal quarterly repayment of P=3.75 million and final quarter payment of P=398.8 million
Drawdown date December 8, 2015
Start of amortization payment March 8, 2019
End of term loan December 8, 2025
Interest rate Repricing after 5th year: interest rate then current (5.3227%) or applicable 5-year benchmark rate + 1.35% spread, or 5.00% floor rate, whichever is higher.
Bank CBC
Amount drawn P=400.0 million
Tenure Ten (10) years term loan with 3 years grace period on principal repayment from date of intial drawdown.

88 PHINMA CORPORATION
Repayment Principal shall be payable in 28 equal quarterly repayment of P=3.0 million and final quarter payment of P=319.0 million
Drawdown date December 8, 2015
Start of amortization payment March 8, 2019
End of term loan December 8, 2025
Interest rate Repricing after 7th year: interest rate then current (6.1257%) or applicable 3-year benchmark rate + 1.40% spread, or 5.00% floor rate, whichever is higher.
PSHC
This represents interest-bearing loan obtained from United Pulp and Paper Co., Inc. (UPPC) amounting to P=154.0 million arising from the acquisition of land from UPPC. UPPC was a former associate of the Parent Company.
This loan is presented at amortized cost as of the end of the reporting period. The present value of the loan at initial recognition in 2006 was calculated using an effective interest rate of 11.0%. The effective interest rate used in computing for the present value of the loan payable was derived based on the rate inherent to the loan after considering the carrying value and the future value of the loan payable at the coupon rate of 9.1%.
Initially, the said loan is payable in two installments amounting to P=44.0 million on July 15, 2008 and P=110.0 million on July 15, 2013. On July 8, 2008, a Memorandum of Agreement was executed by UPPC and PSHC amending the maturity date of the P=44.0 million from July 15, 2008 to July 15, 2013. A recomputation of the effective interest rate of 10.52% was made in 2008 to reflect the change in the payment terms of the liability in 2013. On December 20, 2012, another Memorandum of Agreement was executed by UPPC and PSHC amending the payment term of the P=154.0 million from July 15, 2013 to July 15, 2018. A recomputation of the effective interest rate of 9.28% was made to reflect the change in the payment terms in the liability. On September 19, 2014, the Company paid P=25 million as partial payment of outstanding balance of land. A recomputation of the effective interest rate of 7.82% was made to reflect the change in the payment terms in the liability. On July 1, 2015, another Memorandum of Agreement was executed amending the interest rate from 9.1% to 7.6% per annum. A recomputation of the effective interest rate of 7.82% was made to reflect the change in the payment terms in the liability. Additional interest expense resulting from the accretion of loan payable amounted to P=0.16 million in 2015 and 2014 (see Note 29).
The details of the loan are as follows:
2015 2014
(Amounts in Thousands)
Loan payable to UPPC P=129,000 P=129,000 Less: unamortized discount 642 802 P=128,358 P=128,198
To secure the payment of the loan, PSHC constituted a mortgage over its land amounting to P=220.0 million in favor of certain creditors of UPPC (see Note 15).
The payable of PSHC to UPPC incurs an annual interest at a rate subject to mutual agreement by UPPC and PSHC on each anniversary date. Interest expense on the amount payable to UPPC amounted to P=10.8 million and P=13.4 million in 2015 and 2014, respectively (see Note 29).
22. Equity
a. Capital Stock
The composition of the Parent Company’s capital stock as at December 31, 2015 and 2014 is as follows:
Number of Shares 2015 2014 Preferred - cumulative, nonparticipating, P=10 par value Class AA Authorized 50,000,000 50,000,000
Class BB Authorized 50,000,000 50,000,000

2015 Annual Report 89
Number of Shares 2015 2014
Common - P=10 par value Authorized 420,000,000 420,000,000
Common shares: Issued 260,400,814 260,400,814 Subscribed 39,994 39,994 Issued and subscribed 260,440,808 260,440,808
Treasury shares 1,171,500 –
The issued and outstanding shares as at December 31, 2015 and 2014 are held by 1,241 and 1,250 equity holders, respectively.
Capital stock presented in the consolidated statements of financial position is net of subscription receivables amounting to P=124 thousand as at December 31, 2015 and 2014.
The following summarizes information on the Parent Company’s track record of registration of securities under the Securities Regulation Code:
Date of SEC Approval Authorized Shares No. of Shares Issued Issue/Offer Price March 12, 1957 1,200,000 172,298 P=10 June 30, 1959 – 47,868 10
b. Retained Earnings
Appropriated As approved by the BOD of PHN last March 4, 2015, the P=1.0 billion appropriation of retained earnings shall be allocated as follows:
i. P=700.0 million for investment in existing business of energy, education and property by 2016; and ii. Buyback of PHINMA Corporation shares in the amount of up to P=300.0 million from 2015 to 2017.
The above shall be subject to specific terms and conditions as the BOD shall fix.
Unappropriated On March 6, 2013, the BOD of Phinma Corporation declared a cash dividend of P=0.40 a share or an equivalent of P=104.2 million, to all common shareholders of record as at March 22, 2013. The cash dividends were paid on April 17, 2013.
On March 4, 2014, the BOD of Phinma Corporation declared a cash dividend of P=0.40 a share or an equivalent of P=103.9 million, to all common shareholders of record as at March 20, 2014. The cash dividends were paid on April 15, 2014.
On March 4, 2015, the BOD of Phinma Corporation declared a cash dividend of P=0.40 a share or an equivalent of P=103.5 million, to all common shareholders of record as at March 18, 2015. The cash dividends were paid on March 31, 2015.
The retained earnings is restricted for the payment of dividends to the extent of P=646.0 million and P=435.5 million as at December 31, 2015 and 2014, respectively, representing the accumulated equity in net earnings of the subsidiaries and associates and to the extent of treasury shares amouting to P=13.6 million and nil as at December 31, 2015 and 2014, respectively. The accumulated equity in net earnings of the subsidiaries and associates is not available for dividend distribution until such time that the Parent Company receives the dividends from the subsidiaries and associates.
c. Stock Purchase Plan
Following are the salient features of the Parent Company’s Stock Purchase Plan:
Purpose To motivate the Senior Officers to achieve the Parent Company’s goals, to help make the personal goals and corporate goals congruent and to reward the senior officers for the resulting increase in the value of PHN shares.

90 PHINMA CORPORATION
Prices of share The officers shall purchase shares of stock of PHN from those set aside under the Stock Purchase Plan at the average closing price of PHN shares in the stock market for 20 trading days, in no case shall the price be lower than par value.
Tranches 1/3 of the maximum shares can be purchased upon date of first notice and 1/3 each every year thereafter provided that work performance is deemed acceptable.
Holding period One-third of the shares shall not be sold or transferred to a 3rd party for at least one year from the date of each purchase or until retirement whichever comes first. Another one-third of the shares shall not be sold or transferred to a 3rd party for at least two years from the date of each purchase or until retirement whichever comes first.
The last one-third of the shares shall not be sold or transferred to a 3rd party for at least three years from the date of each purchase or until retirement whichever comes first.
Any such sale or transfer shall be considered null and void.
On April 2, 2009 and April 20, 2010, the BOD and shareholders of PHN, respectively, approved the setting aside of 8.4 million shares from the unsubscribed portion of the Parent Company’s 420 million authorized common shares for stock purchase by the Senior Officers of this Corporation. On January 26, 2012, the Philippine SEC approved the Parent Company’s Stock Purchase Plan while the PSE approved for listing the 8.4 million shares on May 23, 2012.
Under the Stock Purchase Plan, officers of the Parent Company can purchase P=30.5 million worth of shares over three years, subject to certain conditions. The shares can be purchased at the average closing price of PHN shares in the market 20 days prior to each notice, but in no case shall the price be less than par value.
As at December 31, 2015 and 2014, total shares issued under the stock purchase plan was 2,703,501.
Total cumulative expense recognized in relation to the stock purchase plan amounted to P=44.8 million charged to expense from January 1, 2011 to December 31, 2014. There are no outstanding vested options as at December 31, 2015.
d. Buyback of Shares
On March 4, 2015, the BOD approved the buyback of up to 10% of the issued shares of the Company from March 2015 to 2017 in the open market through the means of the trading facilities of the Philippine Stock Exchange (PSE).
23. Investment Income
This account consists of:
2015 2014 2013 (Amounts in Thousands) Interest income on: Cash and cash equivalents (see Note 9) P=5,269 P=3,297 P=4,886 Investments held for trading (see Note 10) 782 803 12,938 Due from related parties (see Note 30) 1,964 2,829 3,918 Others – 6,619 1,220 8,015 13,548 22,962 Net gains from investments held for trading (see
Note 10) 5,699 14,177 2,281 Dividend income 253 1,072 2,034 P=13,967 P=28,797 P=27,277

2015 Annual Report 91
24. Cost of Sales, Educational, Animation and Consultancy Services
This account consists of:
2015 2014 2013
(Amounts in Thousands)
Cost of sales P=2,856,728 P=2,916,789 P=2,572,299 Cost of hospital services 53,920 51,005 50,660 Cost of educational services 639,406 465,400 443,719 Cost of consultancy services 38,606 66,047 74,667 Cost of animation services – – 19,336 P=3,588,660 P=3,499,241 P=3,160,681
The details of cost of sales, educational, animation and consultancy services are as follows:
2015 2014 2013
(Amounts in Thousands)
Inventories used (see Note 12) P=2,565,844 P=2,555,618 P=2,290,953 Personnel costs (see Note 27) 504,127 410,726 402,763 Depreciation (see Note 28) 118,784 120,843 110,102 Laboratory and school supplies 96,281 114,975 102,137 Repairs and maintenance 53,255 50,918 40,367 Educational tour expenses 33,911 27,177 29,898 Provision for inventory obsolescence
(see Note 12) – 22,842 – Equipment running 23,426 21,418 19,042 Sports development and school activities 7,467 20,437 2,731 School affiliations and other expenses 7,442 5,007 35,985 Accreditation expenses 1,221 981 523 Others 176,902 148,299 126,180 P=3,588,660 P=3,499,241 P=3,160,681
25. General and Administrative Expenses
This account consists of:
2015 2014 2013
(Amounts in Thousands)
Personnel costs (see Notes 27, 30 and 32) P=489,573 P=525,007 P=487,698 Professional fees and outside services
(see Note 30) 179,509 109,306 143,044 Depreciation and amortization (see Note 28) 89,807 70,334 67,793 Taxes and licenses 60,767 25,803 18,961 Rent, light and water 71,244 55,117 55,805 Provision for doubtful accounts (see Note 11) 53,064 40,031 19,243 Advertising and promotions 25,434 21,170 23,548 Transportation and travel 17,657 15,156 19,843 Office supplies 15,380 8,736 10,381 Repairs and maintenance 12,656 3,547 1,937 Communications 12,386 9,734 10,925 Insurance 10,855 7,793 7,366 Direct costs and expenses of investment
properties (see Note 16) 6,147 6,147 6,147 Donations 3,999 10,841 9,863 Others 51,949 41,526 30,786 P=1,100,427 P=950,248 P=913,340

92 PHINMA CORPORATION
26. Selling Expenses
This account consists of:
2015 2014 2013
(Amounts in Thousands)
Personnel costs (see Note 27) P=254,606 P=270,002 P=232,475 Freight, handling and hauling 74,652 105,042 74,734 Commission 37,710 31,211 32,816 Installation cost 31,789 – – Transportation and travel 25,825 30,092 33,545 Outside services 19,953 1,427 1,294 Provision for doubtful accounts (see Note 11) 18,815 11,446 19,205 Taxes and licenses 13,992 11,992 11,989 Supplies 11,433 11,341 12,906 Repairs and maintenance 11,014 10,986 9,659 Postage, telephone and telegraph 9,652 8,936 7,905 Advertising 9,585 6,996 9,841 Depreciation (see Note 28) 555 6,773 6,831 Entertainment, amusement and recreation 4,313 4,005 2,871 Rental and utilities 3,704 1,958 2,215 Insurance 3,414 2,874 2,700 Others 11,640 19,733 15,579 P=542,652 P=534,814 P=476,565
27. Personnel Costs
This account consists of:
2015 2014 2013
(Amounts in Thousands)
Salaries, employee benefits and bonuses P=1,178,149 P=1,073,290 P=1,012,382 Pension and other post-employment benefits
(see Note 32) 54,985 36,856 38,630 Training 10,639 5,835 13,508 Others 4,533 89,754 58,416 P=1,248,306 P=1,205,735 P=1,122,936
28. Depreciation and Amortization
Depreciation and amortization relate to the following assets:
2015 2014 2013
(Amounts in Thousands)
Property, plant and equipment and investment properties:
Cost of sales, educational, hospital and animation services (see Note 24) P=118,784 P=120,843 P=110,102
General and administrative expenses (see Notes 14, 15 and 26) 77,718 70,334 67,793
Selling expenses (see Note 26) 555 6,773 6,831 Intangible assets - General and administrative expenses
(see Note 25) 12,089 4,418 – P=209,146 P=202,368 P=184,726
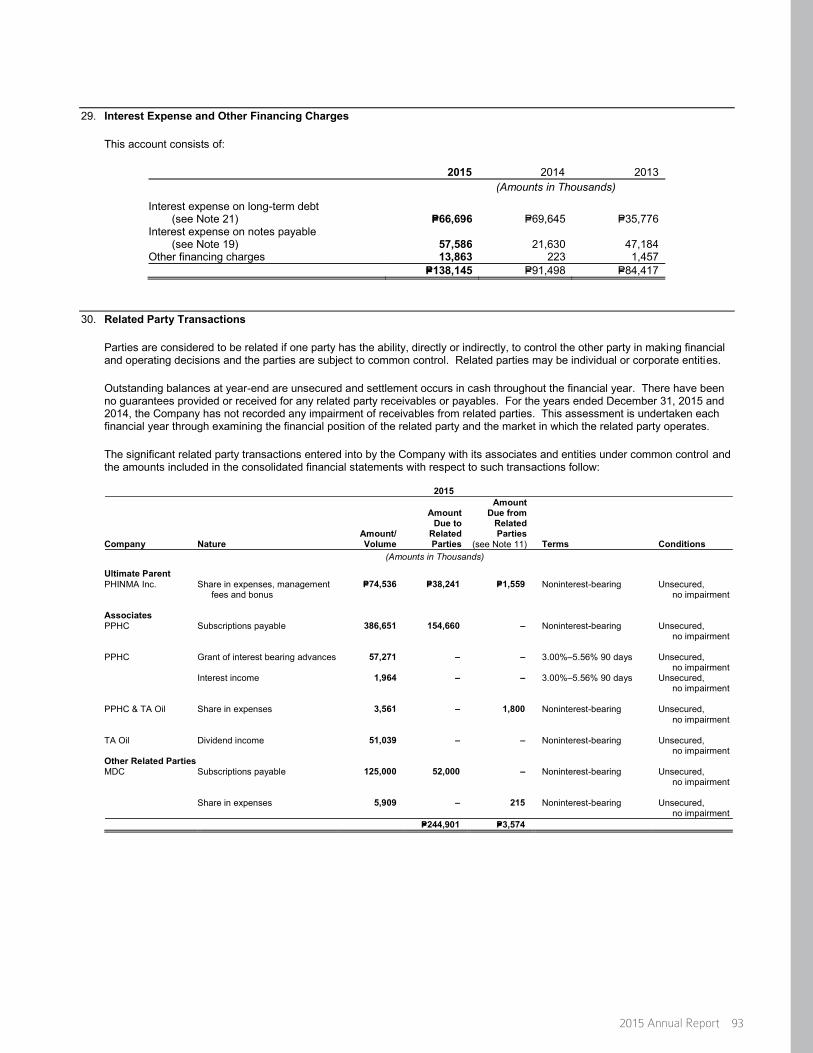
2015 Annual Report 93
29. Interest Expense and Other Financing Charges
This account consists of:
2015 2014 2013
(Amounts in Thousands)
Interest expense on long-term debt (see Note 21) P=66,696 P=69,645 P=35,776
Interest expense on notes payable (see Note 19) 57,586 21,630 47,184
Other financing charges 13,863 223 1,457 P=138,145 P=91,498 P=84,417
30. Related Party Transactions
Parties are considered to be related if one party has the ability, directly or indirectly, to control the other party in making financial and operating decisions and the parties are subject to common control. Related parties may be individual or corporate entities.
Outstanding balances at year-end are unsecured and settlement occurs in cash throughout the financial year. There have been no guarantees provided or received for any related party receivables or payables. For the years ended December 31, 2015 and 2014, the Company has not recorded any impairment of receivables from related parties. This assessment is undertaken each financial year through examining the financial position of the related party and the market in which the related party operates.
The significant related party transactions entered into by the Company with its associates and entities under common control and the amounts included in the consolidated financial statements with respect to such transactions follow:
2015
Company Nature Amount/ Volume
Amount Due to
Related Parties
Amount Due from
Related Parties
(see Note 11) Terms Conditions
(Amounts in Thousands)
Ultimate Parent PHINMA Inc. Share in expenses, management
fees and bonus P=74,536 P=38,241 P=1,559 Noninterest-bearing Unsecured,
no impairment Associates PPHC Subscriptions payable 386,651 154,660 – Noninterest-bearing Unsecured,
no impairment PPHC Grant of interest bearing advances 57,271 – – 3.00%–5.56% 90 days Unsecured,
no impairment Interest income 1,964 – – 3.00%–5.56% 90 days Unsecured,
no impairment PPHC & TA Oil Share in expenses 3,561 – 1,800 Noninterest-bearing Unsecured,
no impairment TA Oil Dividend income 51,039 – – Noninterest-bearing Unsecured,
no impairment Other Related Parties MDC Subscriptions payable 125,000 52,000 – Noninterest-bearing Unsecured,
no impairment Share in expenses 5,909 – 215 Noninterest-bearing Unsecured,
no impairment P=244,901 P=3,574

94 PHINMA CORPORATION
2014
Company Nature Amount/ Volume
Amount Due to
Related Parties
Amount Due from
Related Parties
(see Note 11) Terms Conditions
(Amounts in Thousands)
Ultimate Parent PHINMA Inc. Share in expenses, management
fees and bonus P=102,263 P=36,793 P=480 Noninterest-bearing Unsecured,
no impairment PHINMA Inc. Grant of interest bearing advances 206,591 – – 1.1% for 1 day Unsecured,
no impairment Associates PPHC Grant of interest bearing advances 209,538 – – 2.47%–3.125% for 1 day
to 75 days Unsecured,
no impairment PPHC Interest income 2,829 – – 2.47%–3.125% for 1 day
to 75 days Unsecured,
no impairment PPHC & TA Oil Share in expenses 2,783 – 608 Noninterest-bearing Unsecured,
no impairment TA Oil Dividend income 51,037 – – Noninterest-bearing Unsecured,
no impairment Other Related Parties Others Grant of non-interest bearing
advances 2,058 – – 1% for 1 day Unsecured,
no impairment Others Share in expenses 9,410 7,984 46,035 Noninterest-bearing Unsecured,
no impairment P=44,777 P=47,123
PHINMA, Inc. The Parent Company has a 5-year management contract with PHINMA, Inc. up to June 30, 2019, renewable thereafter mutual agreement. Under this contract, PHINMA, Inc. has a general management authority with corresponding responsibility over all operations and personnel of the Parent Company including planning, direction, and supervision of all the operations, sales, marketing, distribution, finance and other business activities of the Parent Company. Under the existing management agreement, the Parent Company pays PHINMA, Inc. a fixed monthly management fee plus an annual incentive based on a certain percentage of the Parent Company’s net income.
TA Oil and TA Power. TA Oil and TA Power are likewise controlled by PHINMA, Inc. through a management agreement. PHN bills TA Oil and TA Power for their share in expenses.
PPHC. The Parent Company grants interest-bearing advances to PPHC for a period of 30-60 days. The Parent Company also bills PPHC for their share in expenses.
Retirement Fund. The Parent Company has established a retirement fund that is managed by a trustee. The Parent Company has a receivable from PHN Retirement amounting to P=8.9 million as at December 31, 2015 and 2014.
Management and Directors’ Compensation PHN, UGC, COC, AU, UPANG and UI are under common management of PHINMA, Inc. and pay PHINMA, Inc. a fixed annual management fee plus an annual bonus based on a certain percentage of the respective companies’ adjusted net income, as defined in the management contract between PHINMA, Inc. and the respective companies, pursuant to the provisions of the same contract.
Management fees and bonuses, presented as “Professional fees and outside services” under “General and administrative expenses” account, amounted to P=93.0 million and P=85.2 million in 2015 and 2014, respectively (see Note 25). The related unpaid amount, presented as “Accruals for professional fees and others” under “Trade and other payables” account in the consolidated statements of financial position, amounted to P=47.8 million and P=53.6 million as of December 31, 2015 and 2014, respectively (see Note 20).
PHN, UGC, AHC, UI and AU recognized bonus to directors computed based on net income with pre-agreed adjustments. Directors’ bonus, presented in “Personnel costs” under “General and administrative expenses” account, amounted to P=43.4 million and P=37.9 million in 2015 and 2014, respectively (see Note 25). The related unpaid amount, presented in “Accruals for personnel costs” under “Trade and other payables” account in the consolidated statements of financial position, amounted to P=27.1 million and P=34.9 million as of December 31, 2015 and 2014, respectively (see Note 20).

2015 Annual Report 95
Compensation of key management personnel of the Company are as follows:
2015 2014 2013
(Amounts in Thousands)
Short-term employee benefits P=100,661 P=81,563 P=75,882 Post-employment benefits (see Note 32): Retirement benefits 7,920 9,175 3,684 Vacation and sick leave 468 1,621 2,265 P=109,049 P=92,359 P=81,831
31. Income Taxes
The components of the Company’s deferred tax assets and liabilities are as follows:
2015 2014
(Amounts in Thousands)
Deferred tax assets: NOLCO P=30,977 P=33,819 Allowance for doubtful accounts 47,267 32,502 Accrued expenses 44,115 26,690 Pension liability 40,015 24,526 Unrealized foreign exchange losses 3,654 3,173 Allowance for inventory write-down 3,328 7,261 Others 5,455 1,089 174,811 129,060 Deferred tax liabilities: Fair value adjustments on property and equipment of
subsidiaries (361,412) (224,479) Accelerated depreciation (21,637) (42,611) Trademark recognized from business combination (15,131) (14,617) Unrealized foreign exchange gain (3,208) – Unrealized gain on change in fair value (1,262) (3,206) Unamortized debt issuance costs (1,448) (1,376) Unamortized capitalized borrowing cost (210) (1,283) Others (13,412) (9,509) (417,720) (297,081) (P=242,909) (P=168,021)
The deferred tax assets and liabilities are presented in the consolidated statements of financial position as follows:
2015 2014
(Amounts in Thousands)
Deferred tax assets - net P=118,079 P=84,611 Deferred tax liabilities - net (360,988) (252,632) (P=242,909) (P=168,021)
The Company’s deductible temporary differences, unused NOLCO and MCIT for which no deferred tax assets are recognized in the consolidated statements of financial position, are as follows:
2015 2014
(Amounts in Thousands)
NOLCO P=372,825 P=405,410 Accrued personnel costs and employee benefits 92,908 101,549 Allowance for unrecoverable input VAT 86,442 89,611 Unrealized foreign exchange losses 22,587 19,047 Unamortized past service costs 10,210 16,707 Allowance for impairment loss – 10,725 MCIT 2,022 3,255 Unrealized change in fair value of investment 4,371 3,122 Accrued expenses – 434 P=591,365 P=649,860

96 PHINMA CORPORATION
Deferred tax assets were not recognized since management believes that it is not probable that sufficient future taxable profit will be available to allow said deferred tax assets to be utilized.
AU, UPANG, UI, COC and SWU, as private educational institutions, are taxed based on Republic Act (R.A.) No. 8424 which was effective January 1, 1998. Section 27(B) of R.A. No. 8424 defines and provides that: “A Proprietary Educational Institution is any private school maintained and administered by private individuals or groups with an issued permit to operate from the Department of Education, Culture and Sports, or Commission on Higher Education, or Technical Education and Skills Development Authority, as the case may be, in accordance with the existing laws and regulations - shall pay a tax of ten percent (10%) on their taxable income.”
MCIT totaling P=2.0 million can be deducted against RCIT due while NOLCO totaling P=454.1 million can be claimed as deduction against taxable income, as follows:
Amount NOLCO Date Paid/Incurred Expiry Date MCIT Fuld US* Others
(Amounts in Thousands)
December 31, 2011 December 31, 2031 P=– P=24,164 P=– December 31, 2012 December 31, 2032 – 44,611 – December 31, 2013 December 31, 2016/December 31, 2033 784 20,997 110,331 December 31, 2014 December 31, 2017/December 31, 2034 606 – 132,771 December 31, 2015 December 31, 2018/December 31, 2035 632 – 121,239 P=2,022 P=89,772 P=364,341 *Pertains to NOLCO of Fuld U.S. which has 20 carry forward period under U.S. Federal tax law.
MCIT amounting to P=1.9 million expired in 2015 and 2014. Expired NOLCO amounted P=171.2 million and P=253.5 million in 2015 and 2014. No MCIT and NOLCO were claimed as deduction against regular taxable income in 2015 and 2014.
Reconciliation between the statutory tax rates and the Company’s effective tax rates follows:
2015 2014 2013 Applicable statutory tax rate 30.0% 30.0% 30.0% Income tax effects of: Income of schools subject to lower
income tax rate of 10% (22.2) (11.1) (11.3) Change in unrecognized deferred tax
assets and others 24.3 9.9 15.0 Equity in net earnings of associates (13.8) (5.0) (15.2) Interest income subjected to lower
final tax rate (1.4) (0.7) (0.4) Dividend income exempt from tax .– (0.1) (0.1) Effective tax rates 16.9% 23.0% 18.0%
32. Pension and Other Post-employment Benefits
Pension and other post-employment benefits as at December 31 consist of:
2015 2014
(Amounts in Thousands)
Net pension liability P=275,774 P=181,723 Vacation and sick leave 40,172 36,134 P=315,946 P=217,857
Pension and other employee benefits expenses under “Cost of sales”, “General and administrative expenses” and “Selling expenses”, consist of:
2015 2014 2013
(Amounts in Thousands)
Net pension expense P=46,030 P=33,697 P=34,825 Vacation and sick leave 8,955 3,159 3,805 P=54,985 P=36,856 P=38,630

2015 Annual Report 97
A. Pension Benefit Obligation
The following tables summarize the components of net pension expense recognized in the consolidated statements of income and the funded status and amounts recognized in the consolidated statements of financial position for the respective plans.
Net pension expense consists of:
2015 2014 2013
(Amounts in Thousands) Current service cost P=41,442 P=28,832 P=27,969 Net interest cost 4,588 4,865 6,035 Past service cost – – 821 Net pension expense P=46,030 P=33,697 P=34,825
Details of net pension liability as at December 31 are as follows:
2015 2014
(Amounts in Thousands) Present value of defined benefit obligation P=463,784 P=371,046 Fair value of plan assets (188,010) (189,323) Pension liability P=275,774 P=181,723
Changes in the present value of the defined benefit obligation are as follows:
2015 2014
(Amounts in Thousands) Balance at beginning of year P=371,046 P=334,705 Current service cost 41,442 28,832 Interest cost on defined benefit obligation 13,859 13,888 Benefits paid from plan assets (12,041) (5,039) Benefits paid from operating funds (12,837) (3,531) Acquisition and disposal of subsidiaries 58,083 – Actuarial (gains)/losses: Changes in financial assumptions 14,450 7,426 Experience adjustments (1,760) (5,235) Changes in demographic assumptions (8,458) – Balance at end of year P=463,784 P=371,046
Change in the fair value of plan assets are as follows:
2015 2014
(Amounts in Thousands) Balance at beginning of year P=189,323 P=164,770 Actual return excluding amount included in net interest cost (11,876) (5,265) Actual contributions 13,333 25,834 Interest income included in net interest cost 9,271 9,023 Benefits paid (12,041) (5,039) Balance at end of year P=188,010 P=189,323
Actual return on plan assets P=2,606 P=3,758
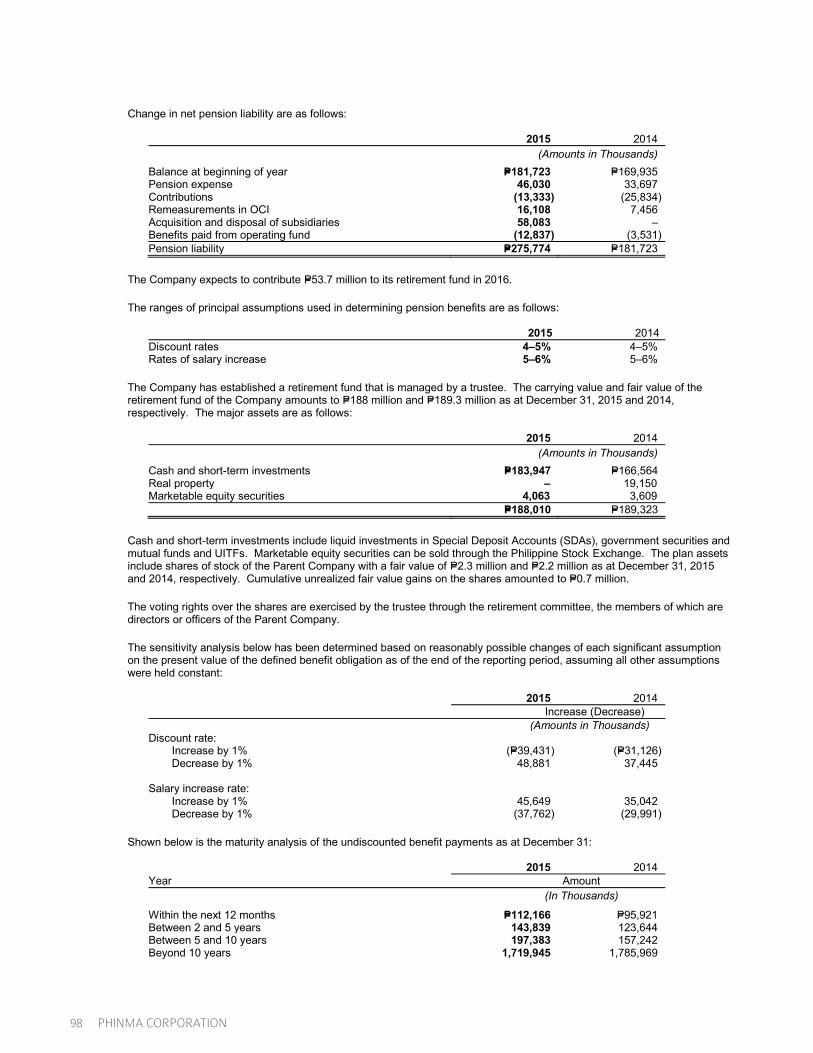
98 PHINMA CORPORATION
Change in net pension liability are as follows:
2015 2014
(Amounts in Thousands) Balance at beginning of year P=181,723 P=169,935 Pension expense 46,030 33,697 Contributions (13,333) (25,834) Remeasurements in OCI 16,108 7,456 Acquisition and disposal of subsidiaries 58,083 – Benefits paid from operating fund (12,837) (3,531) Pension liability P=275,774 P=181,723
The Company expects to contribute P=53.7 million to its retirement fund in 2016.
The ranges of principal assumptions used in determining pension benefits are as follows:
2015 2014 Discount rates 4–5% 4–5% Rates of salary increase 5–6% 5–6%
The Company has established a retirement fund that is managed by a trustee. The carrying value and fair value of the retirement fund of the Company amounts to P=188 million and P=189.3 million as at December 31, 2015 and 2014, respectively. The major assets are as follows:
2015 2014
(Amounts in Thousands) Cash and short-term investments P=183,947 P=166,564 Real property – 19,150 Marketable equity securities 4,063 3,609 P=188,010 P=189,323
Cash and short-term investments include liquid investments in Special Deposit Accounts (SDAs), government securities and mutual funds and UITFs. Marketable equity securities can be sold through the Philippine Stock Exchange. The plan assets include shares of stock of the Parent Company with a fair value of P=2.3 million and P=2.2 million as at December 31, 2015 and 2014, respectively. Cumulative unrealized fair value gains on the shares amounted to P=0.7 million.
The voting rights over the shares are exercised by the trustee through the retirement committee, the members of which are directors or officers of the Parent Company.
The sensitivity analysis below has been determined based on reasonably possible changes of each significant assumption on the present value of the defined benefit obligation as of the end of the reporting period, assuming all other assumptions were held constant:
2015 2014 Increase (Decrease) (Amounts in Thousands) Discount rate: Increase by 1% (P=39,431) (P=31,126) Decrease by 1% 48,881 37,445 Salary increase rate: Increase by 1% 45,649 35,042 Decrease by 1% (37,762) (29,991)
Shown below is the maturity analysis of the undiscounted benefit payments as at December 31:
2015 2014 Year Amount
(In Thousands)
Within the next 12 months P=112,166 P=95,921 Between 2 and 5 years 143,839 123,644 Between 5 and 10 years 197,383 157,242 Beyond 10 years 1,719,945 1,785,969

2015 Annual Report 99
The average duration of the defined benefit obligation at the end of the year is between 10 to 22 years.
B. Vacation and Sick Leave
The following tables summarize the components of vacation and sick leave expense recognized in the consolidated statements of income and the amounts recognized in the consolidated statements of financial position.
Vacation and sick leave expense consists of:
2015 2014 2013
(Amounts in Thousands) Current service cost P=7,549 P=2,598 P=3,453 Interest cost 1,406 561 352 Vacation and sick leave expense P=8,955 P=3,159 P=3,805
Changes in the present value of the vacation and sick leave obligation are as follows:
2015 2014
(Amounts in Thousands) Balance at beginning of year P=40,917 P=37,758 Current service cost 7,549 2,598 Interest cost 1,406 561 Benefits paid (9,700) – Balance at end of year P=40,172 P=40,917
33. Financial Risk Management Objectives and Policies
The Company’s principal financial instruments comprise of cash and cash equivalents, short-term investments, corporate promissory notes and bonds, government bonds, quoted and unquoted shares of stocks, investments in UITFs and loans and borrowings in Philippine Peso and U.S. dollar currencies. The main purpose of these financial instruments is to finance the Company’s investments. The Company also has financial assets and liabilities, such as trade and other receivables and trade and other payables that arise directly from operations.
The main risks arising from the Company’s treasury transactions are credit risk, liquidity risk, market risk, foreign currency risk, interest rate risk and equity price risk. Careful study, skill, prudence and due diligence are exercised at all times in the handling of the funds of the Company.
An Investment Committee reviews and approves policies and directions for investments and risks management.
The basic parameters approved by the Investment Committee are:
Investment Objective Safety of Principal
Tenor Three year maximum for any security, with average duration between one and two years
Exposure Limits a. For banks and fund managers: maximum of 20% of total funds of the Company per bank or fund
b. For peso investments: minimal corporate exposure except for registered bonds c. For foreign currencies: maximum 50% of total portfolio. Limits on third currencies outside
USD are set regularly and reviewed at least once a year by the Investment Committee d. For investments in equities whether directly managed or managed by professional managers:
limits are set as approved by the Investment Committee and based on current market outlook at the time of review
e. For derivative transactions - limits are set up to 100% of asset subject to derivative transaction with the objective of neutrality of gain/loss
Credit Risk Credit risk is the risk that the Company will incur a loss arising from customers, clients or counter-parties that dail to discharge their contractual obligations. Due to the Company’s investing and operating activities, the Company is exposed to the potential

100 PHINMA CORPORATION
credit-related losses that may occur as a result of an individual, counterparty or issuer being unable or unwilling to honor its contractual obligations.
In managing credit risk on these financial instruments, the Company transacts only with the Company’s duly accredited domestic and foreign banks. Investments per financial institution are subject to a maximum of 20% of the Company’s investible funds. It is the Company’s policy that investments cannot exceed 10% of the trust or mutual fund’s total assets.
A comprehensive credit and business review in coordination with dealers or underwriters is performed whenever the Company invests in non-rated securities. Furthermore, the Company monitors the credit quality of corporate and sovereign bonds with reference to credit rating studies and updates from the major rating agencies. The Company’s exposure to credit risk on its cash and cash equivalents and trade and other receivables arises from default of the counterparties with maximum exposures equal to the carrying amounts of the instruments.
2015 2014 (Amounts in Thousands) Loans and receivables: Cash and cash equivalents P=449,950 P=539,213 Trade and other receivables 1,411,003 1,010,277 P=1,860,953 P=1,549,490 *Excluding cash on hand amounting to P=17,932 in 2015 and P=20,398 in 2014.
There are no significant concentrations of credit risk.
Credit Quality of Financial Assets, Other than Trade and Other Receivables The Company uses the following criteria to rate credit quality of its financial assets, other than trade and other receivables:
Class Description
High Grade Investments in instruments that have a recognized foreign or local third party rating or instruments which carry guaranty/collateral.
Standard Grade Investments in instruments of companies that have the apparent ability to satisfy its obligations in full.
Substandard Grade Investments in instruments of companies that have an imminent possibility of foreclosure; those whose securities have declined materially in value, or those whose audited financial statements show impaired/negative net worth.
Cash and cash equivalents are classified as high grade since these are deposited in/or transacted with reputable financial institutions which have low probability of insolvency.
Credit Quality of Trade and Other Receivables Trade and other receivables are classified as (a) high grade when the receivables are secured or covered with collaterals; (b) standard grade when the receivables are unsecured but debtors have good paying habits; or (c) substandard grade when the receivables are unsecured and debtors have poor paying habits.
The credit quality of trade and other receivables as of December 31 are as follows:
2015 Neither Past Due nor Impaired Past Due
High Grade Standard
Grade Substandard
Grade or
Impaired Total
(Amounts in Thousands)
Trade P= P=1,012,652 P=– P=553,260 P=1,565,912 Due from related parties – 3,574 – – 3,574 Installment contract receivables – 600 – – 600 Advances to suppliers and contractors – 54,591 – – 54,591 Accrued interest 652 – – – 652 Receivable from PHN Retirement – 8,939 – – 8,939 Advances to officers and employees – 8,857 – – 8,857 Others 70,560 – 2,970 73,530 P=652 P=1,159,773 P=– P=556,230 P=1,716,655

2015 Annual Report 101
2014 Neither Past Due nor Impaired Past Due
High Grade Standard
Grade Substandard
Grade or
Impaired Total
(Amounts in Thousands)
Trade P=– P=644,127 P=– P=474,111 P=1,118,238 Due from related parties – 47,123 – – 47,123 Installment contract receivables – 1,192 – – 1,192 Advances to suppliers and contractors – 36,528 – – 36,528 Accrued interest 181 – – – 181 Receivable from PHN Retirement – 8,939 – – 8,939 Advances to officers and employees – 9,382 – – 9,382 Others 31,181 – 2,970 34,151
P=181 P=778,472 P=– P=477,081 P=1,255,734
As of December 31, 2015 and 2014, the aging analysis of trade and other receivables (including installment contract receivables) are as follows:
2015 Neither Past Due Past Due nor Past Due but not Impaired and Total Impaired <30 Days 30<60 Days 60<90 Days 90<120 Days >120 Days Impaired
(Amounts in Thousands)
Trade P=1,565,912 P=1,012,652 P=97,646 P=45,001 P=79,888 P=15,900 P=12,143 P=302,682 Due from related parties 3,574 3,574 – – – – – – Installment contract receivables 600 600 – – – – – – Advances to suppliers
and contractors 54,591 54,591 – – – – – – Accrued interest 652 652 – – – – – – Receivable from PHN Retirement 8,939 8,939 – – – – – – Advances to officers
and employees 8,857 8,857 – – – – – – Others 73,530 70,560 – – – – – 2,970 P=1,716,655 P=1,160,425 P=97,646 P=45,001 P=79,888 P=15,900 P=12,143 P=305,652 2014 Neither Past Due Past Due nor Past Due but not Impaired and Total Impaired <30 Days 30<60 Days 60<90 Days 90<120 Days >120 Days Impaired
(Amounts in Thousands)
Trade P=1,118,238 P=644,127 P=78,966 P=36,394 P=81,933 P=16,504 P=17,827 P=242,487 Due from related parties 47,123 47,123 – – – – – – Installment contract receivables 1,192 1,192 – – – – – – Advances to suppliers
and contractors 36,528 36,528 – – – – – – Accrued interest 181 181 – – – – – – Receivable from PHN Retirement 8,939 8,939 – – – – – – Advances to officers
and employees 9,382 9,382 – – – – – – Others 34,151 31,181 – – – – – 2,970 P=1,255,734 P=778,653 P=78,966 P=36,394 P=81,933 P=16,504 P=17,827 P=245,457
Impaired financial instruments comprise of trade receivables from customers, related parties and other receivables. The past due but not impaired trade and receivables are expected to be collected the following year.
Liquidity Risk Liquidity risk is the risk that the Company may not be able to settle or meet its obligations on time or at a reasonable price. The Company manages liquidity risks by restricting investments and continuously monitoring weekly and monthly cash flows as well as updates of annual plans.
The maturities of the financial liabilities are determined based on the Company’s projected payments and contractual maturities. The average duration adheres to guidelines provided by the Investment Committee. It is the Company’s policy to restrict investment principally to publicly traded securities with a history of marketability and by dealing with only large reputable domestic and international institutions.

102 PHINMA CORPORATION
The tables below show the maturity profile of the Company’s financial assets used for liquidity purposes based on contractual undiscounted cash flows as of December 31:
2015
Within 1 Year
1 to < 2 Years
2 to < 3 Years
3 to 5 Years
More than 5 Years Total
(Amounts in Thousands)
Financial Assets Loans and receivables - Cash and cash equivalents* P=449,950 P=– P=– P=– P=– P=449,950 Financial assets at FVPL - Investments in marketable equity
securities 7,566 – – – – 7,566 Investment in UITF 495,522 – – – – 495,522 P=953,038 P=– P=– P=– P=– P=953,038 *Excludes cash on hand amounting to P=17,932
2014
Within 1 Year
1 to < 2 Years
2 to < 3 Years
3 to 5 Years
More than 5 Years Total
(Amounts in Thousands)
Financial Assets Loans and receivables - Cash and cash equivalents* P=539,213 P=– P=– P=– P=– P=539,213 Financial assets at FVPL - Investments in marketable equity
securities 7,526 – – – – 7,526 Investment in UITF 772,769 – – – – 772,769 Investment in Bonds 13,910 – – – – 13,910 P=1,333,418 P=– P=– P=– P=– P=1,333,418 *Excludes cash on hand amounting to P=20,398
The table below summarizes the maturity profile of the Company’s financial liabilities based on contractual undiscounted payments as of December 31:
2015
Within 1 Year
1 to < 2 Years
2 to < 3 Years
3 to 5 Years
More than 5 Years Total
(Amounts in Thousands) Financial Liabilities Other financial liabilities: Notes payable P=265,724 P=– P=– P=– P=– P=265,724 Trade and other payables 897,554 – – – – 897,554 Long-term debt* 141,887 156,976 312,254 204,770 2,778,888 3,594,775 P=1,305,165 P=156,976 P=312,254 P=204,770 P=2,778,888 P=4,758,053 *Including current and noncurrent portion and interest.
2014
Within 1 Year
1 to < 2 Years
2 to < 3 Years
3 to 5 Years
More than 5 Years Total
(Amounts in Thousands) Financial Liabilities Other financial liabilities: Notes payable P=390,054 P=– P=– P=– P=– P=390,054 Trade and other payables 561,969 – – – – 561,969 Trust receipts payable 200,497 – – – – 200,497 Long-term debt* 237,590 164,327 424,909 161,328 82,917 1,071,071 P=1,390,110 P=164,327 P=424,909 P=161,328 P=82,917 P=2,223,591 *Including current and noncurrent portions and interest.
Market Risk Market risks are managed by constant review of global and domestic economic and financial environments as well as regular discussions with banks’ economists/strategy officers to get multiple perspectives on interest rate trends/forecasts. Regular comparison of the portfolio’s marked-to-market values and yields with defined benchmarks are also made.

2015 Annual Report 103
Foreign Currency Risk Foreign currency risk is the risk that the fair value or future cash flows of a financial instrument will fluctuate because of changes in foreign exchange rates. The Company’s financial assets that are exposed to foreign currency risk are foreign currency denominated cash and cash equivalents, investment in bonds and investments in UITFs.
Foreign exchange risks on the U.S. dollar and other foreign currencies are managed through constant monitoring of the political and economic environment. Returns are also calibrated on a per currency basis to account for the perceived risks with higher returns expected from weaker currencies.
The following table shows the U.S. foreign currency-denominated financial assets and financial liabilities and their peso equivalents as of December 31:
2015 2014
Foreign
Currency Peso
Equivalent Foreign
Currency Peso
Equivalent
(Amounts in Thousands)
Financial assets: Cash and cash equivalents US$443 P=20,825 US$1,047 P=46,822 Receivables – – 86 3,846 US$443 P=20,825 US$1,133 P=50,668
Financial liabilities: Trust receipts payable US$24 P=1,141 US$– P=– Long-term loan payable – – 576 25,759 US$24 P=1,141 US$576 P=25,759
In translating foreign currency-denominated financial assets into peso amounts, the exchange rates used were P=47.06 and P=44.72 to US$1.00 as at December 31, 2015 and 2014, respectively.
The following table demonstrates the sensitivity to a reasonably possible change in the exchange rate, with all other variables held constant, of the Company’s profit before tax (due to the changes in the fair value of monetary assets) as at December 31, 2015 and 2014. There is no impact on the Company's equity other than those already affecting the profit or loss. The effect on profit before tax already includes the impact of derivatives outstanding as at December 31, 2015 and 2014.
2015
Increase (Decrease)
in Peso-Dollar Exchange Rate Effect on
Profit Before Tax
(Amounts in Millions)
PHN P=1.00 P=0.4 (1.00) (0.4)
UGC 1.00 0.01 (1.00) (0.01)
Fuld Philippines 1.00 0.002 (1.00) (0.002) 2014
Increase (Decrease)
in Peso-Dollar Exchange Rate Effect on
Profit Before Tax
(Amounts in Millions)
PHN P=1.00 P=1.8 (1.00) (1.8)
UGC 1.00 0.01 (1.00) (0.01)
Fuld Philippines 1.00 0.09 (1.00) (0.09)

104 PHINMA CORPORATION
Interest Rate Risk Fair value interest rate risk is the risk that the fair value of a financial instrument will fluctuate due to changes in market interest rates.
The following tables set out the carrying amounts, by maturity, of the Company’s financial assets and liabilities that are exposed to interest rate risk as of December 31:
2015
Interest Rates Within 1
Year 1 to < 2
Years 2 to < 3
Years 3 to 5 Years More than
5 Years Total (Amounts in Thousands) Financial Assets Placements (PHP) 0.2%–1.0% P=179,963 – – – – P=179,963 Placements (USD) 0.69375%–0.925% 20,491 – – – – 20,491
Financial Liabilities UGC 3%–4% 265,724 – – – – 265,724 UGC 1.375%–4.5% 63,441 24,337 181,095 338,811 – 607,684 AU 5.75% subject to repricing
at the end of 7th year 12,279 12,304 12,328 62,079 22,500 121,490 COC from 5.81% DSTF + 2%
5.81% to PDST +2% 25,128 10,025 10,038 20,117 23,121 88,429 UPANG from 5.78% PDST + 1%
6.02% to PDST + 1% 35,667 100,000 115,984 – – 251,651 PEHI 5.3179%–6.1257% – – – 69,000 2,231,000 2,300,000 2014
Interest Rates Within 1
Year 1 to < 2
Years 2 to < 3
Years 3 to 5 Years More than
5 Years Total (Amounts in Thousands) Financial Assets Placements (PHP) 0.2%–1.4% P=333,324 P=– P=– P=– P=– P=333,324 Placements (USD) 1.04%–1.27% 45,896 – – – – 45,896
Financial Liabilities UGC 1.375%–4.5% 24,235 24,283 24,337 181,095 – 253,950 AU 5.75% subject to repricing
at end of 7th year 12,257 12,279 12,304 12,328 62,079 111,247 COC from 5.81% PDSTF + 2%
5.81% to PDSTF + 2% 10,014 10,025 10,038 20,117 32,820 83,014
Interest on financial instruments classified as fixed rate is fixed until the maturity of the instrument.
The table below set forth the estimated change in the Company’s income before tax due to a reasonably possible change in interest rates as at December 31, 2015 and 2014. There is no impact on the Company’s equity other than those already affecting the profit or loss.
2015
Increase/(Decrease)
in Basis Points Effect on
Profit Before Tax (Amounts in Thousands) Financial Assets PHN – peso placement 25 P=2 (25) (2) UGC, API, PSHC, PEN –
peso placement 50 895 (50) (895) Financial Liabilities UGC 25 2,183 (25) (2,183
AU 25 303 (25) (303)
COC 25 221 (25) (221) UPANG 25 629 (25) (629)
PEHI 25 P=5,750 (25) (5,750)

2015 Annual Report 105
2014
Increase/(Decrease)
in Basis Points Effect on
Profit Before Tax (Amounts in Thousands) Financial Assets PHN – peso placement 25 P=238 (25) (238) UGC, API, PSHC, PEN –
peso placement 50 595 (50) (595)
Financial Liabilities UGC (25) (635) 25 278
AU (25) (278) 25 208
COC (25) (208) 25 238
Peso placements are subject to cash flow interest rate risk while peso and dollar bonds are subject to fair value interest rate risk.
Equity Price Risk Equity price risk is the risk that the fair values of equities decrease as a result of changes in the levels of the equity indices and the values of individual stocks. The Company’s exposure to equity price risk relates primarily to its equity investments listed in the PSE classified under investments held for trading.
The Company’s policy is to maintain the risk to an acceptable level. Movement of share price is monitored regularly to determine impact on the Company’s financial position.
The following tables demonstrate the effect on the Company’s profit before income tax (as a result of a change in the fair va lue of equity instruments held as investment held for trading) due to a reasonably possible change in equity indices, based on the Company’s expectation, with all other variables held constant as at December 31, 2015 and 2014. There is no other significan t impact on the Company’s equity other than those already affecting the profit or loss.
2015
Increase/Decrease
in Stock Exchange Index Effect on
Profit Before Tax
(Amounts in Thousands)
PHN +10% P=223 -10% (223) API +10% 401 -10% (401) 2014
Increase/Decrease
in Stock Exchange Index Effect on
Profit Before Tax
(Amounts in Thousands)
PHN +10% P=244 -10% (244) API +10% 521 -10% (521)
Capital Management The primary objective of the Company’s capital management is to ensure that the Company maintains a healthy capital structure to maintain strong credit rating and maximize shareholder value.
The Company closely monitors and manages its debt-to-equity ratio, which it defines as total liabilities divided by total equity. Capital includes all the accounts appearing in the “Equity attributable to equity holders of the parent” and “Equity attributable to non-controlling interests” in the consolidated statements of financial position.

106 PHINMA CORPORATION
To ensure that there are sufficient funds to settle its liabilities, the Company’s policy is to keep debt-to-equity ratio below 1:1. The Company’s consolidated debt-to-equity ratio as at December 31, 2015 and 2014 are as follows:
2015 2014
(Amounts in Thousands)
Total liabilities P=6,167,429 P=3,120,631 Total equity 8,011,751 7,188,714 Debt-to-equity ratio 0.77:1 0.43:1
34. Financial Instruments
Fair Value Hierarchy The Company uses the following hierarchy for determining and disclosing the fair value of its assets and liabilities by valuation technique:
Level 1 - Quoted (unadjusted) market prices in active markets for identical assets or liabilities Level 2 - Valuation techniques for which the lowest level input that is significant to the fair
value measurement is directly or indirectly observable Level 3 - Valuation techniques for which the lowest level input is significant to their fair value
measurement is unobservable
Assets and liabilities measured or disclosed at fair value are as follows:
2015 Level 1 Level 2 Level 3
(Amounts in Thousands)
Assets Investments held for trading: Investments in UITFs P=446,124 P=446,124 P=– P=– Investments in trust accounts 49,398 49,398 – – Investments in marketable equity securities 7,566 7,566 – – Quoted AFS investments 13,160 13,160 – – Investment properties 1,455,372 – – 1,455,372 P=1,971,620 P=516,248 P=– P=1,455,372 Liabilities Long-term debt P=3,433,039 P=– P=– P=3,433,039 P=3,433,039 P=– P=– P=3,433,039 2014 Level 1 Level 2 Level 3
(Amounts in Thousands)
Assets Investments held for trading: Investments in UITFs P=772,769 P=772,769 P=– P=–
Investments in bonds 13,910 13,910 – – Investments in marketable equity securities 7,526 7,526 – – Investment properties 741,939 – – 741,939 1,536,144 P=794,205 P=– P=741,939 Liabilities Long-term debt P=1,077,356 P=– P=– P=1,077,356
During the years ended December 31, 2015 and 2014, there were no transfers between Level 1 and Level 2 fair value measurements and no transfers into and out of Level 3 fair value measurements.
The following methods and assumptions are used to estimate the fair value of the following financial instruments.
Investments Held for Trading and AFS Investments. Quoted market prices have been used to determine the fair value of financial assets at FVPL and listed AFS investments. Unquoted AFS investments are measured at cost less accumulated impairment loss since the fair value is not readily determinable due to the unpredictable nature of future cash flows and the lack of suitable methods of arriving at a reliable fair value. The Company does not intend to dispose the unquoted AFS in the near future.

2015 Annual Report 107
The carrying amounts of cash and cash equivalents, short-term investments, trade and other receivables, notes payable, trade and other payables, trust receipts payable and due to related parties approximate their fair values due to the relatively short-term maturities of these financial instruments.
Investment Properties. The fair value of investment properties were determined based on valuations made by accredited independent appraisers.
Long-term Debt. The fair value of interest-bearing fixed-rate loans is based on the discounted value of expected future cash flows using the applicable rates for similar types of loans. Discount rates used ranged from 3% to 5 % in 2015 and 2014.
Derivative Instruments
Freestanding Derivatives. The Company’s derivative financial instruments are accounted for as financial instruments at FVPL.
The Company enters into sell US$-buy PHP= non-deliverable foreign currency forward contracts to manage the foreign currency risk arising from its US$ denominated assets. These derivatives are transactions not accounted for as accounting hedges.
The Company has outstanding currency forward contracts with an aggregate notional amount of US$4.3 million as at December 31, 2012. The weighted average contracted forward rate is P=41.12 to US$1.00 as at December 31, 2012. The currency forward contracts outstanding as at December 31, 2012 will mature up to April 2013.
The net changes in fair value of these derivative assets (liabilities) are as follows:
2015 2014
(Amounts in Thousands)
Balance at beginning of year P=– P=– Net change in fair value during the year 345 24 Fair value of settled contracts (345) (24) Balance at end of year P=– P=–
35. Commitments and Contingencies
a. Unused Credit Lines
PHN has an unused credit line amounting to P=4.0 billion as at December 31, 2015.
UGC has the following unused approved credit lines with local banks and financial institutions as at December 31, 2015:
Nature Amount
(Amounts in Thousands)
Letters of credit/trust receipts P=758,121 Bills purchase line 171,435 Invoice financing 400,000 Settlement risk 350,000 Forward contract 65,000
b. Commitments Under Operating Lease Agreements
Lessee UGC entered into lease agreements covering its warehouse premises which have terms ranging from one to two years, renewable at the option of UGC under certain terms and conditions.
Future minimum rental payable as at December 31, 2015 are as follows:
Amount
(Amounts in Thousands)
2016 P=22,464 2017 19,380

108 PHINMA CORPORATION
c. Others
There are contingent liabilities arising from lawsuits primarily involving collection cases filed by third parties and for tax assessments occurring in the ordinary course of business. On the basis of information furnished by the Company’s legal counsel, management believes that none of these contingencies will materially affect the Company’s financial position and results of operations.
36. EPS Computation
Basic EPS is computed as follows:
2015 2014 2013
(Amounts in Thousands)
(a) Net income attributable to equity holders of the parent P=386,091 P=246,548 P=224,040
(b) Weighted average number of common shares outstanding 259,934 260,059 259,292
Basic EPS attributable to equity holders of the parent (a/b) P=1.49 P=0.95 P=0.86
The Company’s basic and diluted earnings per share are the same since the potential common shares arising from outstanding options from stock purchase plan are anti-dilutive.
2015 2014 2013
(Amounts in Thousands)
Weighted average number of common shares for basic earnings per share 259,934 260,059 259,292
Dilutive effect of outstanding options from Stock Purchase Plan (see Note 22) – – 387
Adjusted weighted average number of common shares outstanding 259,934 260,059 259,679
37. Segment Information
For management purposes, the Company’s operating businesses are organized and managed separately according to business activities and have five reportable operating segments as follows:
Investment holdings – The Parent Company and PSHC are engaged in investment holding activities of shares of stocks and other financial instruments.
Property development – API and MDC leases its real and personal properties. PPHC is engaged in real estate development. Energy – TA Oil is involved in power generation and trading, oil and mineral exploration, exploitation and production. Steel – UGC manufactures and trades iron and steel products. Educational services – PEHI holds interest in AU, COC, UPANG, UI and SWU which offer graduate, tertiary, secondary and
elementary education services. BPO – Fuld U.S. and Fuld Philippines are engaged in strategic consulting.
The Company has no geographical segment for segment reporting format as the Company’s risks and rates of return are substantially in the same economic and political environment, with the companies incorporated and operated in the Philippines.
The BOD (Chief Operating Decision Maker) monitors the operating results of its business units separately for the purpose of making decisions about resource allocation and performance assessment. Segment performance is evaluated based on operating profit or loss and is measured consistently with operating profit or loss in the consolidated financial statements. Segment result is defined as the segment’s income generated from its own operations, net of its share in the equity in net earnings of associates and investment income, before deducting interest and financing charges, provison for income tax and share of NCI.
Transfer prices between operating segments are on an arm’s length basis in a manner similar to transaction with third parties.

2015 Annual Report 109
Segm
ent I
nfor
mat
ion
Fina
ncia
l inf
orm
atio
n on
the
oper
atin
g se
gmen
ts a
re s
umm
ariz
ed a
s fo
llow
s:
In
vest
men
t H
oldi
ngs
Prop
erty
D
evel
opm
ent
Ener
gy
Stee
l Ed
ucat
iona
l Se
rvic
es
BPO
El
imin
atio
ns
Tota
l O
pera
tions
(A
mou
nts
in T
hous
ands
) Ye
ar E
nded
Dec
embe
r 31,
201
5
Rev
enue
P=3
83,9
48
P=4,4
37
P=–
P=3,6
54,1
40
P=1,6
11,9
23
P=402
,145
(3
58,1
03)
P=5,6
98,4
90
Segm
ent r
esul
ts
242,
264
(712
) –
274,
073
633,
710
(66,
901)
(6
42,1
14)
440,
320
Inve
stm
ent i
ncom
e 7,
990
3,10
1 –
563
1,83
0 48
3 –
13,9
67
Equi
ty in
net
ear
ning
s of
an
asso
ciat
es
– 22
,303
24
0,60
4 –
– 5,
218
1,49
2 26
9,61
7 In
tere
st e
xpen
se a
nd fi
nanc
ing
char
ges
(14,
240)
–
– (4
8,46
6)
(73,
009)
(2
,430
) –
(138
,145
) Be
nefit
from
(pro
visi
on fo
r) in
com
e ta
x (2
,602
) (2
0)
– (6
7,69
8)
(26,
143)
(7
,653
) 5,
077
(99,
039)
Sh
are
of n
on-c
ontro
lling
inte
rest
s –
– –
– (1
21,7
26)
– 21
,097
(1
00,6
29)
Net
inco
me
attri
buta
ble
to e
quity
hol
ders
of t
he p
aren
t P=2
33,4
12
P=24,
672
P=240
,604
P=1
58,4
72
P=414
,662
(P=
71,2
83)
(P=61
4,44
8)
P=386
,091
Year
End
ed D
ecem
ber 3
1, 2
014
Rev
enue
P=3
58,1
84
P=7,2
90
P=–
P=3,6
40,1
60
P=1,1
29,2
58
P=535
,415
(P=
303,
625)
P=5
,336
,682
Segm
ent r
esul
ts
(P=11
6,27
1)
(P=75
0)
– P=2
46,8
16
P=238
,533
(P=
4,20
4)
P=25,
101
P=389
,225
In
vest
men
t inc
ome
322,
566
6,12
9 –
663
1,98
2 1,
081
(303
,624
) 28
,797
Eq
uity
in n
et e
arni
ngs
of a
n as
soci
ate
– 12
,825
50
,354
–
– 3,
108
(430
) 65
,857
In
tere
st e
xpen
se a
nd fi
nanc
ing
char
ges
22,9
61
– –
(41,
963)
(2
2,95
8)
(7,8
82)
(41,
656)
(9
1,49
8)
Bene
fit fr
om (p
rovi
sion
for)
inco
me
tax
(1,4
83)
(10)
–
(60,
353)
(2
4,80
3)
(7,3
34)
3,60
9 (9
0,37
4)
Shar
e of
non
-con
trollin
g in
tere
sts
– –
– –
(870
) –
(54,
589)
(5
5,45
9)
Net
inco
me
attri
buta
ble
to e
quity
hol
ders
of t
he p
aren
t P=2
27,7
73
P=18,
194
P=50,
354
P=145
,163
P=1
91,8
84
(P=15
,231
) (P=
371,
589)
P=2
46,5
48
Year
End
ed D
ecem
ber 3
1, 2
013
Rev
enue
P=4
24,0
64
P=7,6
31
P=–
P=3,1
73,0
77
P=999
,946
P=5
47,5
81
(P=37
3,26
5)
P=4,7
79,0
34
Se
gmen
t res
ults
P=1
4,64
4 (P=
5,05
9)
– P=1
84,1
05
P=202
,861
(P=
40,3
73)
(P=12
8,42
5)
P=227
,753
In
vest
men
t inc
ome
272,
685
6,78
1 –
1,83
8 2,
755
20
(270
,112
) 13
,967
Eq
uity
in n
et e
arni
ngs
(loss
es) o
f ass
ocia
tes
– 5,
418
150,
886
– –
6,37
6 (9
89)
161,
691
Inte
rest
exp
ense
and
fina
ncin
g ch
arge
s (1
7,47
1)
– –
(38,
384)
(2
5,43
4)
(3,1
28)
– (8
4,41
7)
Bene
fit fr
om (p
rovi
sion
for)
inco
me
tax
(1,3
58)
(237
) –
(43,
730)
(1
8,13
7)
2,77
4 3,
383
(57,
305)
Sh
are
of n
on-c
ontro
lling
inte
rest
s –
– –
– (1
,215
) –
(36,
434)
(3
7,64
9)
Net
inco
me
attri
buta
ble
to e
quity
hol
ders
of t
he p
aren
t P=2
68,5
00
P=6,9
03
P=150
,886
P=1
03,8
29
P=160
,830
(P=
34,3
31)
(P=43
2,57
7)
P=224
,040

110 PHINMA CORPORATION
38. Events after the Reporting Period
On March 4, 2016, the Parent Company’s BOD declared a cash dividend amounting to P=103.7 million, or equivalent to P=0.40 a share, to all common shareholders of record as of March 18, 2016 and payable on March 31, 2016.
On March 4, 2016, the Parent Company’s BOD approved the increase of appropriated retained earnings from P=1.0 billion to P=1.5 billion, allocated as follows:
i. P=1.2 billion for investment in existing business of energy, education and property on or before December 31, 2017; and ii. Buyback of the Parent Company’s shares in the amount of up to P=300.0 million from 2015 to 2017.
39. Notes to Consolidated Statements of Cash Flows
The non-cash investing activities pertain to the following:
a. Acquisition of investment in TA Pet amounting P=146.0 million through receipt of property dividends from TA Oil in 2014.
b. Acquisition of investment in Coral Way amounting P=89.4 million though conversion of investment in preferred shares to common shares in 2014.

Contact Information
Energy TRANS-ASIA OIL AND ENERGY DEVT. CORPORATION11th Floor, PHINMA Plaza39 Plaza Drive, Rockwell Center, Makati CityTel.: (+632) 870-0100www.transasia-energy.com
Education PAMANTASAN NG ARAULLO (ARAULLO UNIVERSITY), INC. Barangay Bitas, Maharlika Highway Cabanatuan City, Nueva Ejica Tel.: (+6344) 464-3399www.au.phinma.edu.ph
CAGAYAN DE ORO COLLEGE, INC.Max Suniel St., CarmenCagayan de Oro City, Misamis OrientalTel.: (+6388) 858-5867 www.coc.phinma.edu.ph
UNIVERSITY OF PANGASINAN, INC. Avelino Street, Dagupan City Pangasinan Tel.: (+6375) 522-5635 www.up.phinma.edu.ph
UNIVERSITY OF ILOILO Rizal Street, Iloilo City Tel.: (+6333) 338-1071www.ui.phinma.edu.ph
SOUTHWESTERN UNIVERSITY, INC. Urgello Street, Cebu City Tel.: (+6332) 415-5555 www.swu.edu.ph
CAREER ACADEMY ASIA, INC. 5th Floor, PHINMA Plaza 39 Plaza Drive, Rockwell Center, Makati City Tel.: (+632) 896-9537 www.careeracademy.asia
Housing PHINMA PROPERTY HOLDINGS CORPORATION 29 Epifanio Delos Santos Avenue Mandaluyong City Tel.: (+632) 533-7777www.phinmaproperties.com
Steel Products UNION GALVASTEEL CORPORATION Chipeco Avenue Extension Barangay Real, Calamba City Tel.: (+6349) 545-0085www.uniongalvasteel.com.ph
Corporate Directory
PHINMA Corporation PRINCIPAL OFFICE 12th Floor, PHINMA Plaza 39 Plaza Drive, Rockwell Center, Makati City Tel.: (+632) 870-0100 Fax: (+632) 870-0456www.phinmacorp.com.ph INVESTOR RELATIONS OFFICERGiles R. Katigbak12th Floor, PHINMA Plaza 39 Plaza Drive, Rockwell Center, Makati City Tel.: (+632) 870-0130 Fax: (+632) 870-0456email: [email protected] INTEGRITY [email protected] Independent Public Accountants Sycip Gorres Velayo & Co. 6760 Ayala Avenue, Makati City Tel.: (+632) 891-0307 Transfer Agents Stock Transfer Services, Inc. 34th Floor, Unit D Rufino Pacific Tower 6784 Ayala Avenue, Makati City Tel.: (+632) 403-2410
Hotels MICROTEL MALL OF ASIA Coral Way Avenue cor. Seaside Boulevard SM Mall of Asia Complex, Pasay City Tel.: (+632) 403 -3333www.microtelbywyndham-manila.com
Strategic Consulting FULD + COMPANY3rd Floor, 131 Oliver StreetBoston, Massachusetts 02110 USATel.: (+1617) 492 - 5900www.fuld.com FULD + COMPANY (PHILIPPINES), INC.3402 One Corporate CentreJulia Vargas Avenue corner Meralco AvenueOrtigas Center, Pasig CityTel.: (+632) 706-3292www.fuld.com

12th Floor, PHINMA Plaza39 Plaza Drive
Rockwell Center, Makati City
www.phinmacorp.com.ph