to - apps.dtic.mil · 4t arinto 12vigii iro.cardo jl e ' weto se~a i trd qovx~z~r poc uni4nt...
TRANSCRIPT

UNCLASSIFIED
AD NUMBER
AD211874
NEW LIMITATION CHANGE
TOApproved for public release, distributionunlimited
FROMDistribution authorized to U.S. Gov't.agencies and their contractors; ForeignGov't. Info.; Mar 1958. Other requestsshall be referred to Central U.S.Registry, Rm. 1B889, The Pentagon,Washington, DC 20310-3072.
AUTHORITY
AGARD ltr, 24 Apr 1970
THIS PAGE IS UNCLASSIFIED

4t
ARINTO 12VIGII
IRO.CARDo jL E '
WETO SE~A I TRD
QOVX~z~r POC UNI4NT OVERMEN THREB
.ikNa I OS L7',UR MDTU ATTA H
NowENETMYHV UMLTD UNBEO NAYWYSPLE R
Ar e I SeDRW(A 8KCFicATOe ,ORONRAA1 TOcnia BE Pmaio A gency~
A1INTON MALL LICENINTHHORO NYTEii~t O APRL~CINGT ONY 12Y I RINTAUFCUE
FOR SL AETDDVNIKi~TMYI N A ERLTDTEEO
hWRO.CARD

____ ____ ____ ____ ____ __RRPORT 172
0
uj ADVISORY GROUP FOR AERONAUTICAL.,RESEARCH AND DEVELOPMENT
F C REPORT 172
TECNIQESOF PRESSURE-FLUCTUATIOK!4MEASUREMENTS EMPLOYED IN THE
RAE LOW-SPEED WIND-TUNNELS
FjIItF p
BYASTFA
iT. B. OWEN
if-I
Li-MARCH 195$
PALA D (,HilJ0TPARIS 1 P,
61 5~ p -4-

REPORfT I12
NORTI ATLANTIC TREATY ORGANIZATION
ADVISORY ORUffP IPOR AERONAtiriCAL. REHARCHI AND !IxVRLOPMRNT
TECHNIQUES OF~ PRNSSUREPLCTUAT1Ok MRASIREMENTSRMPLOYrND IN TilE RAE t.OW-SFI) WINnT0NNWLsi
T.8, Owen
Thin Presn u.a, 7.1 h.tijre;urr ; Lwutoigt, -~-n,,a~ltAqatrdWiwri Timnel lior VMfvic TI'9t in' Plnin,'' 1 frIr 2-111 f1 t 2
,1th uFirih. i1W311, 01, Linndtn

SUMMARY
A tehniuo a-mbe-devooppI fr ear~ninp atmodl salpand ina lo-pe idtnetearolnma xi-%infrPir-
important effect. The basic measurements P-re of the total intensityand spectrum function of the pressure fluctuations, and 'R descriptionis given of thf, capacity-type transducers and the akssociated electronic4 quipmenlt used. rolisof n~rr~ resentation and interpreta-tion of the data ara discussed; and, to illustrate the usefuln-ess arndlimitations of the technique, examples are given of its application tothe specific problems of aircraft vibration irducel by (lying withitMwr open bomb-doors or extended air-brakes, rr at an ino idenco where.appreciable flow separation occurs over the wings, Consieeration isgiven to the use of correlation measurements, and to the extension of
he teconique to testing at transonic spee'(s.
SOMMAIRE
Une te'ehnique a k6e mimse adi point rermettant d'examiner )'4chelle4maquette en soufflerie k faible vitesse 1ecxcittition ae'rodynsriique pou-
vant donner lieu des vibrations aux vitesses peu influenc~es par lenombre (IC Mach. Li's mesures foridamentales effectu~es ont ports surV intensit6 totale et la fonction spectrale des variations de pressions;on 1-erit ]es manomp'tres ai caps.Iit et 1' Iectronique associe utilise .Les questions int~res-ant la mesu-e, la pr~sentation Ct 1' interprh{aLi;A*-rdes r~sultats obtenus sont ensuite discut~es. Pour demontrer l'utiliteainsi que I~s limitations de cctte technique, des exemnles sont cit~sde V'application de ]a methode aux problemes particuliers des vibrationisinduites par le vol pendant lequel Les trappes-bombes sont restteesouvertes ou leg a~ro-freins ont h6 sortis, ou bien par le vol. 4 uneincidence caracte'rise'p par un de'collenment senqible? sur les miles. L'Pm~loIdo mesures corre'latives est consid-re ainsi que I' extension de la tech-nique des essais aux Vite3SeS transsoniques.
.533.6'. 071.3
3b8b2

CONTENTS
SIUKLMARY I
LIST OF FIGURES
NOTATION r.
1. INTRODUCTION 1
2. ME',;:OS OF MEASUREMENT AND PRESENTATION OF THE BASICPRE;SURF- FLUCTUATION DATA 32.1 3'sre-Trnsducers
2.2 Electronic Equipment 32.3 Calibrations 5
,2.3.1 Transducer sensitivity 6
2.3.2 Amplifier frequency response 62.3.3 Analyser calibration 7
2.3.4 Tape recorder2.4 Presentation of the Results 9
3. ACCURACY OF MEA URRMENT AND EXTENSIONS OF THE TECHNIQUE 93.1 Accuracyll 93.2 Effect of Wind-Tunnel Airflow Unsteadiness 113.3 Additional Meamurements 12
3.3.1 The use of pipes in pressu:e-fluctuationmeasurements 12
3.3.2 Correlation between pressure-fluctuations at two
pCints 13
3.3.3 Estimation of normal-force fluctuations trompressure- fluctuation measurements 15
3.4 Further Developments 163.4.1 Extension of the present testing techniques to
transonic and supersonic speeds 163.4.2 Automita tic analyser 17
4. SqME PARTICULAR APPLICATIONS OF PRESSURE-FLUCTUATIONMEASURPMENTS 17,1 1 fn i ghb-1Rayv luffetiniz 174.2 Air-Brake Buffeting 1813 Pr.i7-., Flui't~iitions of Thin Wings 18
4.3.1 Low.aspect-ratio unswept wing 19

4.3. 2 iUnswept wing pnell 214.3.3 Win pntnel with 3 ()n leading- -dge sweep 22
434 I. w-aip -rat hi khly swept wings 23
S, C(INCLlrINc, RFMARKS 24
RFVFI1,,NCFS 25
DI S BIrION
iv

TLTST OF FIGITRES
f 1.. 1 Exploded sections of capacity-type pressure transducers 26
1a) 0.7 in. jlrrsure transduce'r 26
of prssure, fluctuations 27
1.ig.3 Typical bandwidth responPe curves for the uirheai-Pametradawave analyser type D-489 28
iv .4 Typical ran-ducer calibration and sensitivity factor 29
0t) irvc-tt rans,,ucer caliorfation 29
h) Tranduc,' .. .,. lviLy factor 29
Fi, 5 .'requency response of wide frequency-range amplif.er 30
F I-4.F Wasured analysor charactristics 31
-( ) easured bandwidth ratio 31
(b) Overall analyser sensitivity factor (see Section 2.3.3) 31
Fig. 7 Frequency response using tape recorder 32
a) High frequency response of tape recorder and playback 32
ih) Analys.er sensitivity factor when used in conjunction with6 in.,s,-c recording and 60 in !sec playback 32
Fig.R Effect of record length on replay accuracy at low frequencies.
Recording ant replqy at 60 in.,'sec tape speed 33
(a) Analysis of two halves of a 75 fe recording 33
(b) Analysis of four quarters of a 4 It recording 33
r'. Fffect of wind-speed on a spectr=m of pressure fluctuations
on the rear wall of a rectangular cavity in a cylindrical{, , , 'i y It,nrgth 14
fi. 10 Effect of bandwidth :n a spectrum of pressure fluctuations
A on the upper surface of a highly swept wing 34
v
Best Available Copy

Fage
if.. 11 Measued spectrum showing separation of a peak, due to a
discrete frequency oscillation, from the continuous sp,ctrum 35
F i:. 12 Creparatlve masurements of a spectrum of pressure fluctuations
behind a spoiler obtaint:d by direct analysis, and by replay
of recoidings made at two tape speeds 36
(a) Dir'ct analysis. Analyses before and after recordings 36
(b) Recording at 6 in./sec. Replay at 60 in./sec.
Three '75 ft records 36
(c) Recording at 60 in./sec. Replay at 60 in./sec.
Three 75 ft, rcnrds 36
1]'.2 Mob.I for c(mparativw preiisure- fluctuation moasuremnts
in two wind-tunnels 3 -1
Fig. 14 Pressure fluctuations on a wing in two wind tunnels 38
FigA15 Attenuation due to use of a pipe between measuring point
and transducer. Transducer as shown in Figure Ia,
pipe 0.028 in. Internal diameter 39
Fig. 16 Circuit variations for correlation measurements 40
(a) Connections for measuring V' 40
(b) Connections for rmeasuring yB 40
(c) Connections for measuring v(A + B)2 40
FIg.17 'Explode,.' sections of a prototype transducer for the
measurement of high-frequency pressure fluctuations 41
Fig. 18 Effect of rounding the rear bulkhead on bomb-bay
pressure fluctuations 42
(a) Bulkhead transducer 42
(b) Body transducer
Fig.9 Effect , rear bulkhead fairing on bomb-bay pressure
f luc L ta t i,ozs 43
Fig. 20 Installation of trr.nsducer for pressure-fluctuation
measurements oan body with air-brake 44
vi
Best Available Copy
Page
Fig. 21 Fluctuating and statictpressure distributions on a bewlysurfacp due to an air-brake 45
(a) t- 70o 45
(b) w - 90 45
Pig. 2 2 Pressurf, fluctuatior spectra measured at pointsindicated in Figare 21 46
(a, I v 70 n 46
(b) 0 900 46
Fig.23 Effect of air-brake angle on the pressure excitation
on a boly 47
: ,."I". ,:, • ,? ,t ',,htl m~ L ,r .vith :.i r-hrako angle 47.
Pig,.25 King for correlation coefficient measurements 48
Fig.26 Chordwfse distribution of pressure fluctuations on wingshown in Figure 25, nacelle on 49
Fig.27 Chordwise variation of correlation coefficient on wingshown in Figure 25, nacelle on 50
Fig.28 Smoothed chordwise variation of correlation function
or wing ,z,,"fl in Figure 25. Nacelle on 51
Fig.29 Variation of sectior. normal-force fluctuation on wingshown in Figure ,,. Nacelle on 51
Fig.30 Chordwise variation of c3rrelatio , coefficient on wi:shown in Figure 25. Nacelle on. Wing incidence 40 52
Fig.31 Unswept wing with eharp ] $-ding edge 53
(a) Details of model 53
(b) Variation of bubble length with incidence 53
Fig.32 Unswept wing with sharp leading Ige. Fluctuations Inpressure differen-e bewtween upr- and lower surfaces 54
(a) r.m.s. pressure fluctuation 54
(b) Spectra of pressure fluctuations at 0.85c 54
.c) 'Low frequency componcnt' of pressure fluctuations 54
vB
" ~Best Available Cp

Page
Fig.33 Unswept wing with sharp leading edge. Comparison ofpressure fluctuations on upper and lower surfaces.Transducer at 0.85c 55
(it) r.m.s. pressure fluctuation 55
(b) Spectra of pressure fluctuations, a = 140 554
Fig. .4 Sharp-edged wing with 300 leadIng edge sweep 56
(a) Moel details 56
(b) Position of attachmen- point at spanwise positions ofpressure transducers 56
FIg.35 Pressure fluctuation measurements on a sharp-edged wing1Ith 300 leading edge sweep as shown in Figure 34 57
(a) r.m.s. pressure fluctuation at the three transducer positions 57
(b) Spectra of pressiure fluctuations at middle transducerposition 57
(c) ' ow-frequency component' of pressure fluctuations at thethree transducer positions 57
Fig. 3#r Upper-surface contours of v'nF(n) at n = 0.2 on a low-aspect-ratio sharp-edged wing at 80 incidence: n = fF!V 58
Fig.37 Variation of r.m.s. upper-surface value of vn-(n) at n 0.2with incidence for the sharp-edged wing shown in Figure 36,assuming a correlation coefficient of 1.0 throughout 58
Fig. 38 8 10 swept wing-RAE 101 section: fluctuations in pressure
difference between upper and lower surface 59
(a) Details of model 59
(b) r.m.s. pressure fluctuation 59
(c) Spectra of pressure flucttutions 59
(,{) L, frcqucncy ce'-.enent' of pressure fluctuations 59
Best Available CopY
viii

NOTAT ION
A. B instantaneous values of two fluctuating q' z.t1ties
A.B mean values of A and B
B mean value of product AB
VA5 2root-m.ean-square value of A
V B root-mean-square value of B
c local wing chord
cstandard mean chord
c aerodynamic mean chord
CL lift coefficient
CO) drag coefficient
CN instantaneous load
f input frequency; buffeting frequency
"- f acceptance frequency bandwidth
fw wing fundamental frequency
F(n) svectrun function
I a -. ,oP:sentative lpngth (Air brake chord in Figures 20-24)
L length of bomb bay
n a non-diensional frequency parameter ( fl/V)
p root-r-nn-s uare of pressure fluctuation
pxl Px, root-mean-square values of pressure fluctuations at x and x'
PxPx, instantaneous prensures at two points x and x' along wing cnord
q dynamr'4c hea r (= %oC1?)
r ix" -X1
Rab, R xxRxr correlation coefficients
t number of points on chord line at which pressure is measured
ix
Best Available Copy

V free-stream velocity
VA approach speed
x,x' distances measured along a chord line from the leading edge
wing incidence
bandwidth ratio (= Af/f)
Tj distance of pressure transducer from centre line (see Figure 22)
6 angular deflection of air brake
p air density
x

TECHN I QUES OF PRESSURE - FLUCYUAT ION MIASUREMENTSEMPLOYED IN THE RAE LOW-SPEED WIND-TUNNELS
T.B. Owen*
1. INTRODUCTION
There are many instances where aircraft vibration can be excited aerodynamically:for example, in flight with open bomb-doors, with extended airbrakes, or at speedsor attitudes at which extensive flow separations occur. The measurement, at modelscale, of the pressure fluctuations which excite the vibration, and the subsequontextrapolation to full-scale conditions are theretore of considerable Importance:and some of the techniques and methods of approach which may be used are considered
ir. detail in this paper. The problems discussed are all ones in which Mach numberdoes not have an appreciable effect, and the techniques described have been developedspecifically for use in low-speed wind-tunnels; some mention is made, however, ofthe further problems expected in extending the model techniques to transonic speeds,
The first application of the technique was to a problem of aircraft vibration whirhoccurred when the bomb-doors were open; a brief historical summary of this investi-gatisn, given below, brings out a number of points which have been found relevant toall subsequent investigations. A flight investigation had disclosed three character-istic' properties of the vibration: its ±n,*enslty was, at all points measured, approxi-mately proportional to the dynamic head ( pV 2 ) and independent of Mach number, with-in the speed range of the aircraft in question; the greater part of the vibrationcorresponded to excitation of the vertical and lateral flexural modes of the fuselage,within the frequency range 6 to 10 cycles/sec. and the vibration at points on the rearfuselage was very irregular, with no preferred frequency, suggesting its cause to bea randon aerodynamic disturbance. Since these characteristics were consistent with
- :,.s f he aircraft structure, it seemed worth'l!!- !-, t xPnine then;........ *.;-dyriamic fo 'n ftld in the absence of response effects and atmodel scale. we easurempnt and analysis of the fluctuating-pressure filo-d on aneffectively .igJ4 suodel of the aircraft in a low-speed wind-tunnel was therelorf, under-taken to throw light upon the basic causes of the aircraft vibration, and to indicatethe effectiveness of modifications designed to reduce them.
Preliminary tests were made in late 1952 using some existing transducers of the,,riable-capacitance type together with their associated pre-amplifier, and in con-junction with a wave-analyser which operated on the scanning principle. The resultsobt ilned show-d that significant pressure fluctuations were confined to the neighbour-hood of the rear bulkhead of the bomb-bay, but that they eere of too random a natur-for a spectrum analysis to be possible with the equipment used. The original analyserwas accordingly discarded and replaced by the final stage of an existing amplifier(originally designed for use with hot-wire anemometers) together with a tunable -.ave-analyser, and further experiments immediately esta-.lished the important result thatboth the -,oct- ,c.an-qqu,.re iten'i ty and the sectr,,m function of the pressure-fluctiv-tions were proportional to the dynamic head, and could consequently be usefully expr,,ssednon-dimensionally in the same way as steady pressures.
United Kingdom
Best Available Copy

2
Th se results agreed qualitatively with those obtained in flight in that theyindicated random aerodynamic excitation with no detectable scale effect. They there-fore. suggested that the nu-dimensional results were applicable to the full-scaleaircraft, and in particular it bccaine possible t.o define, and to concentrate attentionup,,n, a frequency range for the model scale which corresponded to the band cnnt ilningtht, dominant full-scale vibrations. In view of the narrowness of the frequency bandin question, the intensity 'r, this hand !"emed to offer a better indication of ther,,1-vant excitation than did the total intensity, especially when considering theprobable effectiveness of modificatlons, which are apt to change both total inten3ityand the spectrum shape.
These early wind-tunnel experiments established the usefulnss of the technique and,with imorovements in both the transducers and u.he associated electronic equipment,further applications followed, notabl, to the examination of the fluctuating-pressurefields:
(a) Associated with bomb-bay buffeting, using a generalised model consisting of acylindrical body in which the cavity shape could be systematically varied withvarious bomb-door configurations fitted
(b) On a body in the vicinity of an air-brake
(c) OT thin wings und er various mean-flow conditions.
All the experiments were confined to low speeds (below M = 0.3), and the absenceof scale effect, within ;the available' wind-tunnel speed range, was again confirmed inall cases. The further experience with the technique served also to emphasize theearlier conclusion that it was essential to determine spectra as well as the totalintensity of the pressure fluctuations, said these together were considered to provide theminimum amount of data from which useful inferencts could be drawn.
In addition to the application of the presiur-L-ra-ducer considered here. both thehot-wire and the strain-gauge are available for the ?masurement of velocity fluctua-tions and load or moment fluctuations respectively. Each of these techniques may beused in low-speed wind-tuennc! investigations into the causes of buffeting: but acomplete examination of their relative usefulness is beyond the scope of this paper,the purpose of which is to demonstrate the experimental nethods, and particularadvantages and limitations, associated with the use of the pressure-transducer. Theequipment required is considered in Section 2 of the paper, where the present designsof transducer and the associated electronic equipment are described in detail. Thissection also includes a discussion of the methods of reduction and presentation of thehasi. sorer--nts, the tot,! intensity, an, spectra of the pressure-fltctuations.This is followed, in Section 3, by a discussion of the accuracy of the basic measure-
f.:. ... .f th aia lable for widening the scope of the td:.iup, adit;ona1lmeasurenents which can be made are considered in the same section. The use and limita-tions of the data which can be obtained are indicated final!y, in S.et n 4, wherea numbe ot particular applications c.' the technique are discussed. nsideration isgiven in this section to the difficulties both o. measurements and ol 1--terpretation,and to situations where other techniques might be more appropriate.
Best Available Copy

2i
2. METHODS OF MEASUREMENT AND PRESENTATION OF THE BASICPRESSURIE- FLUCTUATION DAIA
2.1 Pressure-Transducers
The transducers are of the variable-capacitance type and the two designs most usedare those shown in Figures la and lb. The diaphragm~ are of beryllium copper and thetransducer bodi,:' of brass, which has a siiilar coefficient of expansion. The fixed
plate of the condenser is in.ulated from the body of the transducer by a Tufnol cup,t: e three parts being cemented together with Araldite. After cementing, the commonface is machined flat and a small step introduced at the rim, as shown in Figure 1.
This step, of 0.0030 in. for the larger transducer and 0.l00'. in. for the smaller.
in coniinction with a shim 0.0040 in. thick, gives a nominal gap between the diaphragmand fixed plate of 0.0010 in. for the larger transducer and 0.0005 in. for the
smaller one.
For investigations in separated air-flows at wind-tunnel speeds of 100 to 150 ft/sec
the two requpiromnts for the transducers are:
(a) A sensitivity of about 0.5 Pf/in. of water
(b) An ability to withstand a positive pressure difference of at least 4 in. ofwater without the diaphragm coming into contact with the fixed plate.
These two conditions are satisfied with a diaphragm thickness of 0.007 in. for the
larger transducer and 0.004 in. for the smaller. The inevitable slight lack of flatness
the dlaphragms makes it necessary to tune each individual transducer by trial assembly,using each of a number of diaphragms with various reduced shims, of from 0.0038 to0.0040 in. in thickness, to find a suitable coibination.
The sensitivity of about 0.5 Pf/in. of water appears to represent the highest value
conveniently attainablr with the smaller transducers as they are at present constructed.
The larger transducers, however, can easily be made more sensitive by reduction of the
diaphragm thickness and/or the gap between the diaphragm and the fixed plate, andsensitivities as high as 8 Pf.'in. of water have been used for special purpose-s, thoughwith a reduced maximum permissible pressure-difference.
2.2 Electronic Fquiprwnt
Figure 2 shows the general arrangement of the associated electronic equipment for
the measurement and analysis of the pressure fluctuations. The transducers are usedwith a Southern Instruments oscillator and pre-amplifier. This is a frequency-modu-lated system using a 2-megacycle/sec carrier with an 'N-shaped' respnzs'. curve,giving a nearly constant sensitivity e1 0.4 volts/Pf over a range of 50 Pf. Thie out-put of the pre-amplifier can be taken to a high-resistance voltmeter (: mgohm/volt)
4for direct calihration of the transducer from pressure to voltage, or alternatively
to an amplifier with a wide frequeicy-range for mea surement of pressure fluctuations.
This ampiif.e- is basically the final stages of one designed' at toe R.A.E. for use
with hot-wire anemometers; its output stage ha; been modified for the .resent purpose,and it has i nominal usable frequency range from 1.4 to 50.000 cycles/sec. A thermo-
junction is incorporated ii one of the final stages of the amplifier and is connected
Best Available Copy

to a suitable b.C. galvanometer. The reading of this galvanometer is then propor-tional to the mean-square amplitude of any alternating input voltage irrespective cffr,'que,,, within the frequency range of the amplifier. An uncalibrated inputLttenuator on the amplifier can be adjusted to give a standard reading on the thermo-
lu1lc.Lion-galv'rnometer irrespective of Input, in the range 3.5mV to 350OmV the inputto the ;inplifier can then be taken from the microvolter, the output of which can be
adiu.;t', L; give the same reading on the thermo-junction-galvanometer as that pro-dured by the signal from Lhe pre-amplifier: the reading of the microvolter, whichwhen ex,'it d from a suitable oscillator acts as a calibrated attenuator covering a
rooL-msfin-square range ef IjV to !V, is then equal to the root-mean-square output ofth, pr,,-amplif fIr. This value may finally be converted into the root-mean-square
tlal intnsity of the pressure fluctuation by neans of the, calibration between,0tady pressures and voltages previously obtained.
If it is requlrpn to measure the spectrum density of the pressure-fluctuations,the ar,,plifier output can be fed direct into the analyser section or zecorded onmagnetic tape for subsequent play-back into the analyser. The analyser used is theMuirhoad-Pametrada D-489 which covers the frequency range 20 cycles/sec to 20,000
cycles/sec and has four possible bandwidth ratios: 1.5%, 3.0%, 4.8% and 15.5% ofth, tuned trequency. The method of obtaining these four bandwidths is of interest.
Th, analY,,r consists of two tuned amplifiers in series; to obtain the 1.5% band-width ratio both amplifiers are in series giving a combined Q-factor of 80, and for!he 3.(Y', bandwidth ratio one amplifier is switche6 out giving a Q-factor of 50. For
the 4.8% bandwidth ratio the two amplfiers are again in series, but the tuned fre-quencies of the amplifiers are respectively +1.5% and -1.5% from the frequency seton the analyser: similarly the 15.5% bandwidth ratio is obtained with both amplifiersin series, with their frequencies +5% and -5% from the selected frequency. Typicalresponse curves are shown in Figure 3 and it can be seen that the 4.8%, and moreparticularly the 15.5%, bandwidth rn ",- fottned in this way is a better approximationto the ideal 'square' respof.e c:'-,ei r1, . tnnln r circuit curves of the 1.5%
3.. t " ,!!,,i. h ratios. Th O- 'ow-fr.-: iic:* r-. of the analyser is extended toinclude 2 to 20 cycles/sec by introducing a low-frequency modulator, which basicallyad(:- 50 cveles/s~c to the frequency of any incoming signal, so that this range becomes52 to 70 cycles/se c, which is then wit.nit, the raunge ,_ tho analyser. This method ofobtaining the low-frequency range leads to some complications with regard to bandwidthvariation which ill be discussed in Section 2.3.3.
Two modifications have been made to the analyser as supplied by the makers. Firstly
a thermo-junction feeding a suitable D.C. galvanometer has been introduced into theoutput t- rcuit. and the rectifier-type instrument on the analyser switched out, The
operator takes a mean of the ralvanometer reading by eye, and this modificationenables the requirea lean of a squared output to be taken rather than a simple mean,as would have been obtained from the instrument fed through a rectifier; also, somenecessary damping of the analysed signal, which may be varying rapidly by as much astw, - thi--- tr, one, is introdoiced. Secondly. the three-to-one steps of the analyserInput-attenuator were then too large for an output-instrument readinig proportional tothe square of the signal, and a logaritmic potcntioneter was const-ucted to repiacethe az.ayser attenuator, which was then locked on its 3mV setting. The logarithmicp,)tentiometer covers a 1000 to I rnnge in 100 steps (i e. with a gain of 1.072 per
pt-, and the ottput-galvanometer is scaled over the range 0.90 to 1.!).
Best Available Copy

5
In %.-, th-i amplifier, adjusted as described earlier, supplies the fluctuating
signal for analy.sis at :'. root-mean-square level of 3.5V o the analyser section.
"ihe fr#,quency range is covered using a standardised set of frequencies in which th,)ratio of Pach higher frequency to the preceding one is approximately in the ratio of2:1, the most usual range (3 to 2000 cycies/sec) requiring 22 measurements; measure-
ments at these frequencies alone are normally sufficient, but the steps are smallennugh for the readings to reveal any sharp peaks in the spectrum, the presence ofwaich *sjid require additional points to be interpolated. Calibrations are performedat intervals by taking the amplifier input from the icrov~lter, with zero settingon the logarithmic potentiometer and at a medium frequency of 280 cycles/sec, anddetermining the exact Input voltage required to produce a reading of unity on theanalyser output-galvanometer; allowance can then be made for any drift in the gain
of the amplifier or analyser.
The analysis )f one signal requires steady wind-tunnel conditions to he maintainedfor about 20 minutes. This is usually feasible for small low-speed rind-tunnels, butfor larg:-r or higher-speed wind-tunnels the cost in power and tunnel-running time,
together with difficulties in maintaining constant conditions in some cases, makes a
reduction in this time desirable. Provision has accordingly been made for recording
the amplifiar outptit onto magnetic-tape, for subsequent re-play into the analyser,so cutting the tunnel-running time to about 5 6dlnutes, though the time taken for the
analysis is hardly affeeted.
The tape recorder usi'd is a two-channel Ampex Type 306-2 with recording speeds of) 6, 12, 30 and 60 in./sec; ro-play is on an Ampex Type 3-3559 75 ft loop playbacksystem with a speed of 60 in./sec only. The only modification required for recording
is attenuation of the amplifier output from 3.5V r.m.s. to 0.5V r.m.s., the recommendedsignal voltage for the recorder; this is then compensated by the additon of a seven-to-one amplifier to the replay electronics, so that 3.5V r.m.s. is again supplied tothe analyser section. The Ampex equipment works on the frequency-moduiated principle
using a carrie" frequency of 54.000 cycles/sec at 60 in./sec, with proportionately
reduced carrier frequencies at lower tape speeds.
In use, channel I of the recorder is supplied continuously with 0.4V r.m.s.* at
280 cycles/sec. After ateasuring tne equivalent r.m.s. voltqge of the pre-arplifieroutput signal, as described earlier, the amplifier is left connected to the iicro-
volter and a short tape (about 8 ft) recorded; 75 ft is then recorded, taking theamplifier input from the pre-amplifier, and this is followed by another short tlpe
using the microvolter output. By reference to channel 1, and using the two shjittapes, any drift in channel 2 gain during recording or playback can be allowed for.
2.3 Calibrations
In order to obtain an acceptable accuracy it has been found necc-sary" to calibratethe whole system at intervals; this is required so that allowances can he rade forsmill steady ,hifts in gain of all the electronic iterms and in the sensitivity of the
transducer'-. 7:o various calibrations are considered separately below.
- O.4V r.u.,. rinier than O.V g supplied to c,Aannpl I so that incorrect loading nf calibrating
taie int th,- r-vlp y -qul| eni can te deterted.
--Best Available Copy

6
1... I Transducer sensitivity
The trarsduc,;.-, .1iiie navitv Lh mrn-t of being simple to construct, and adaptable
to a number of forms, suffer from two main drawbacks, non-linearity of calibration,
and variation with temperature both of zero and sensitivity. Considering first non-linearity, a typical transducer calibration is shown in Figure 4a, Where the D.C.voltag, output of the pre-amplifier is plotted aainst steady pressure differenceacr ss the transduuer diaphragm. The corresponding transducer -nensitivity in volts/in.ot water is shown in Figure 4b plotted against the output voltage. In a typical low-speed test on a wing the pressure difference across the transducer may vary from 0 to5 In. of water, causing a variation in sensitivity of 10%. Howpver, this can beallow i for by using thr relation shown in Figure 4b, provided that the mean pressuredifference, in terms of output-voltage from the pre-amplifier, is noted during the tests.The p)eak-t-ak amplitude of the pressure-fluctuation would not 7ormally 'xceed 3 in.of water, so that non-linearity does not distort the fluctuating signal appreciably.
1OC rise in temperature may raise the transducer sensitivity by as much as 10%,and cause a zero-shift equivalent to 5 in. of water. For :ow-speed wind-tunnel testsit Is normally sufficient to calibrate the transducers at the beginning, middle andend of the morning and either twice or three times again in the afternoon; the orderof drift between successive calibrations is shown in Figure 4. The zero-drift andsensitivity-drift can then be allowed for on a time basis if one tunnel-speed is beingused, or otherwise on a temperature basis. Appreciable zero-drift occurs in the pre-amplifier when it is first switched on, and it has been found necessary to use a time-switch,so that the pre-amplifier may have been switched on for two to three hours before it is (used. An accuracy of ±2% on the transducer sensitivity appears reasonable using thesemethods.
Preliminary tests on the possibility of using the present transducers in a model ina transonic wind-tunnel, with temperature rises of cp to 46:-C. suggested however that.cvcn with preliminary calibration of the temperature effects, an accuracy of ±5% ontransAducer sensitivity would be difficult to attain.
The author is not aware of an* satisfactory and simple method of measuring the fre-quency response of pressure transducers at frequencies above about 100 cycles/sec, andno attempt has been made to examine the frequency response of the transducers used. TheSouthern Instruments equipment, which uses a 2-megacycle/sec carrier frequency, wouldbe expected to have a flat response to considerably above the 20,000 cycles/sec limit ofthe rest of the equipment; the natural frequency of the transducer diaphragms is about6000 cycles/sec, and it is assumed that the transducers have a flat response to about athird of this, say 2000 cycles/sec. The transducer sensitivity to steady pressures istherefore used throughout and an upper limit of 2000 cycles/sec is applied to thespectrum analysis. For low-speed tests this upper limit exclude3 very little of thetotal energy in the spectrum.
2.3.2 4plifter frequency response *
Thr amplifier response curve is shown in Figure 5. The r.tn.s. amplitude of thesirnai passed by the amplifier is taken as representing the total intensity of theprevruro fluctcutlon. The upper frequency limit is well above any signal pass.ed bythe transducer. but the low frequency cut-off sometimes results in too low a valuefor the ta,,al internsity being obtained.
Best Available Copy
7
2.3.3 Analyser cal iaiion
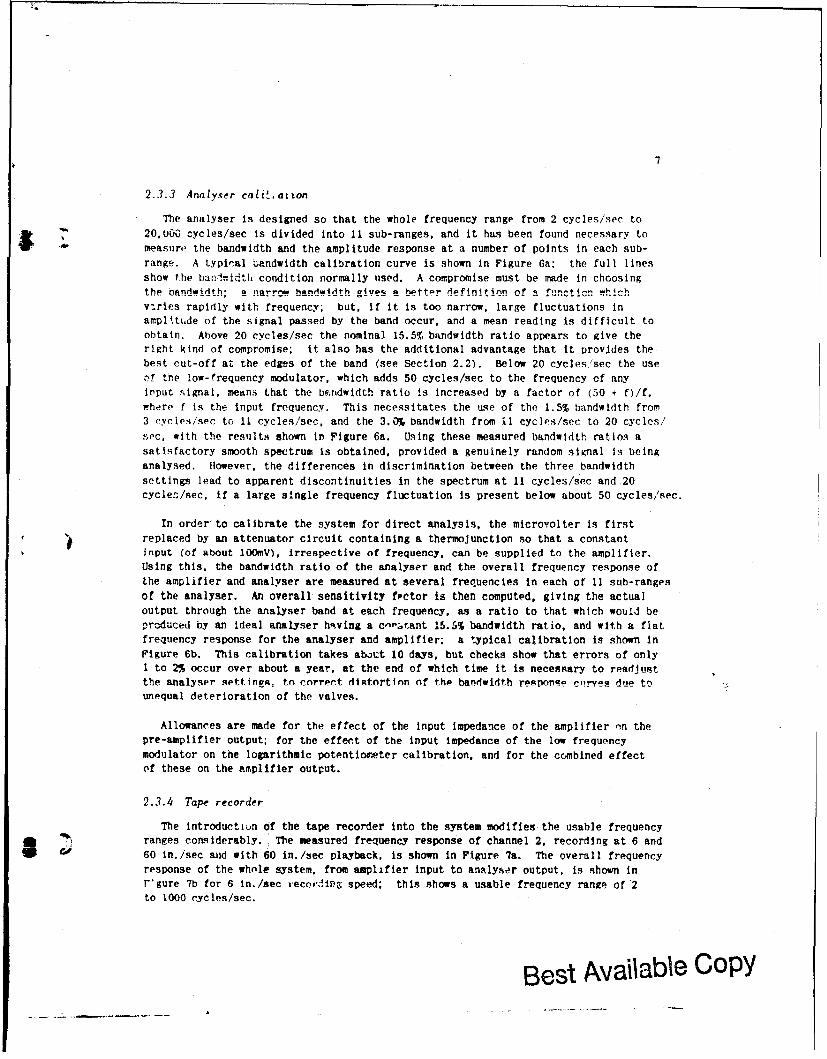
The analyser is designed so that the whole frequency range from 2 cycles/sec to20,U0O cycles/sec is divided into II sub-ranges, and it has been found necessary to
measure the bandwidth and the amplitude response at a number of points in each sub-range. A typial "andwidth calibration curve is shown in Figure 6a; the full lines
show the bariv.idt, condition normally used. A compromise must be made in choosing
the bandwidth; a narrow. band-idth gives a better eflintin of a functicn !hichvries rapidly with frequency; but, if it is too narrow, large fluctuations inampl.ttude of the signal passed by the band occur, and a mean reading is difficult toobtain. Above 20 cycles/sec the nominal 15.5% bandwidth ratio appears to give theright kind of compromise; it also has the additional advantage that it provides the
best cut-off at the edges of the band (see Section 2.2). Below 20 cycles,/see the usezf the low-frequency modulator, which adds 50 cycles/sec to the frequency of anyirput signal, means that the bandwidth ratio is increased by a factor of (50 + f)l/f,w-here f is the input frequency. This necessitates the use of the 1.5% bandwidth from3 cycles/sec to 11 cycles/sec, and the 3.0% bandwidth from 11 cycles/see to 20 cycles/sec, with the results shown in Figure 6a. Using these measured bandwidth ratios a
satisfactory smooth spectrum is obtained, provided a genuinely random signal is beinganalysed. However, the differences in discrimination between the three bandwidthsettings lead to apparent discontinuities in the spectrum at 11 cycles/sec and 20cyclen/sec, if a large single frequency fluctuation is present below about 50 cycles/sec.
In order'to calibrate the system for direct analysis, the microvolter is first
replaced by an attenuator circuit containing a thermojunction so that a constantinput (of about lOOmV), irrespective of frequency, can be supplied to the amplifier.
Using this, the bandwidth ratio of the analyser and the overall frequency response ofthe amplifier and analyser are measured at several frequencies in each of 11 sub-ranges
of the analyser. An overall sensitivity fpctor is then computed, giving the actual
output through the analyser band at each frequency, as a ratio to that which would beproduced by an ideal analyser hokving a c- ,rtant 15.5% bandwidth ratio, and with a flatfrequency response for the analyser and amplifier; a typical calibration is shown in
Figure 6b. This calibration takes abjt 10 days, but checks show that errors of only1 to 2% occur over about a year, at the end of which time it is necessary to readjust
the analyser settings, t.n enret. distortion of the bandwidth reep,.noge clrves due tounequal deterioration of the valves.
Allowances are made for the effect of the input impedance of the amplifier nn thepre-amplifier output; for the effect of the input impedance of the low frequency
modulator on the logarithmic potentiometer calibration, and for the combined effectof these on the amplifier output.
2.3.4- Tape recorder
The introductiun of the tape recorder into the system modifies the usable frequency* , ranges considerably. The measured frequency response of channel 2, recording at 6 and* J 60 In./sec and with 60 in./sec playback, is shown in Figure 7a. The overall frequency
response of the whole system, from amplifier input to analyser output, is shown inr'gure 7b for 6 in./sec recordMg speed; this shows a usable frequency range of 2to 1000 cycles/sec.
Best Available Copy

Us ing 60 In. ,se recording spted the upper irequency limit is raised to 10,000 cycles/MwC. while the lower limit might appear to be 3 cycles/sec. as for direct analysis. How-over. In this case, the, lower frequency limit is no longer simply defined, but has tobe experimentally determined as the lowest frequency which is sufficiently accurately .sampled in a 15-second recording (the maximum tape loop for playback is 75 ft). As acheck on this, the results of anialysing separately the two halves of a 75 ft recordingar, shown in Figure 8a, compared with a direct analysis, and the results for the fourquarters are similarly ,hown in Figure 8b. Possible limits, on the assumption thatthe additional scatter is Inversely proportional to the number of cycles recordei. areohown. Assuming a normal maximum scatter of ±10%, twice the normal scatter seemsreasonably acceptable at t;p limiting frrquency; this requires , minimmum of rO cyclesr 'orded. On this basis the usable frequency ranges of the equipment become
Recording speed Usable frequency ronge(in./¢ec ) (cyc esscc)
6 2" to 1,000
12 2 to 2,00030 5 to 5,000
60 10 to 10.000
F'rom this it would seem that the 12 in./sec recording speed matches the present
trarsducers satisfactorily. Where 1000 cycles/see is a sufficiently high upperlimit, the 6 in./sec recording speed has the advantage of less tape being wastedwhile the recorder accelprates to its operating speed, and also the low-trequency Amodulator is not required for the subsequent analysis.
Th,, overall frequency response of the system from amplifier Input to analyser outputis ag.tin determined at intervals usiig the calibrating circuit described in Section 2.3.3;short tapes, about 8 ft long, are recorded fru a namber of frcqucncifes at each of .heroc-r'1ing speeds. Measure-:,...s at about 12 frequencies at each tape-speed are ,cient to define a smooth curve of the ratio of th.io overall frequency response of thesyster using the tape recorder, to that measured with the amplifier connected directlyto the analyser section; values of this ratio can then be read off the curve atintermediate frequencies and applied as an additional factor to the overall sensitivityfactor for direct analysis determined as described in the previous section (2.3.3).
2.4 Presentation of the Result-t
Tho root-mean-square intensity. p, of the pressure fluctuations is iade ron-dimen-sional by dividing it by the dynamic head q(= 'oV2 ). A non-dimenslot.al frequencyparameter n : fl V (where f is the frequency, I a representative length and V the freestream velocity) is then introduced, and a spectrum function F(n) is defined, such thatF(n)bn is the contribution (piq) 2 in the frequency range n + 6n. Thus
F(n)6n = nF(n) 6(log n)
The re'sults of the spectrum analyses can therefore be plotted in the form F(n) agairrtn. or nP(n) against log n; end, in either caso, intr, ration over any iange of frequency
1Lmited by tht, amplifier response
13est Available Copy
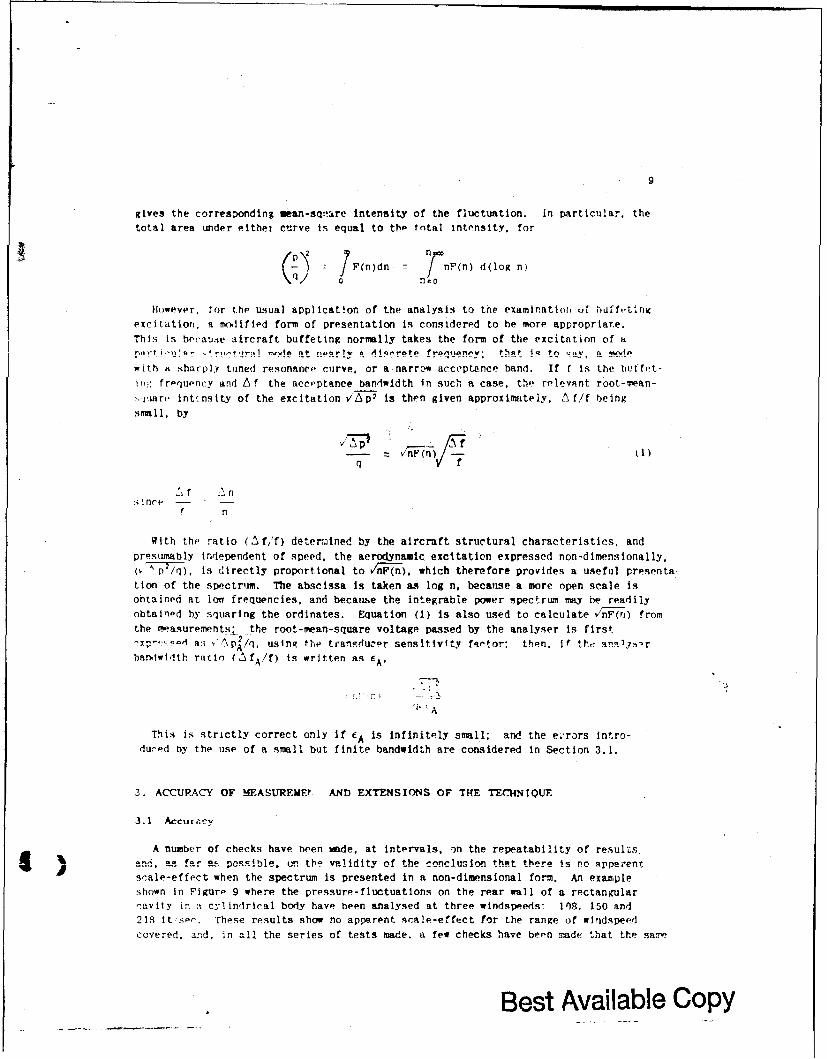
gives the corresponding mean-sqi'are intensity of the fluctuation, in particular, the
total area under elther curve is equal to the total intensity, for
(pi F(n)dn = n(n) d(log n)
However, for the usual application of the analysis to the examination of huff,-tlng
excitation, a moKdified form of presentation is considered to be more appropriar.e.This is becau.je aircraft buffeting normally takes the form of the excitation of ap,,rt -"u'! r -- ,,r . 1r.: 'e at no.arly t. 1!qcrete frequency; t .at !!- to a_ n ... i.
with at sharply tuned resonance curve, or a narrow acceptance band. If f Is the buffet-
iz ,- frpqtrwncy and Af the acce'ptance bandwidth in such a case, t0e relevant root-mean-
>iuare int.nslty of the excitation v/Ap2 is then given approximately, Af/f being
small, by
SV
sinre --n
With the ratio (Af'f) deterined by the aircraft structural characteristics, andpresumably independent of speed, the aerodynamic excitation expressed non-dimensionally,
(i 7/q). is directly proportional to nFiW), which therefore provides a useful presenta.
tion of the spectrum. The abscissa Is taken as log n, because a more open scale isobtained at iou frequencies, and because the integrabie power spectrum may be readilyobtained by squaring the ordinates. Equation (1) is also used to calculate nvi 1 ) from
the measure.mentsL the root-mean-square voltage passed by the analyser is first2'-p'/, using t.,e transduzer sensitivity faetor: then. if t.e a-1'-r
handwidth ratio (Af A/f) is written as CA-
A
This is strictly correct only if cA is infinitely small; and the ei'rors Intro-
duced by the use of a small but finite bandwidth are considered in Section 3.1.
3. ACCURACY OF MRASURE)4E! AND EXTENSIONS OF THE TECHNIQUE
3.1 Accur .cy
A number of checks have been made, at Intervals, ,)n the repeatability of results
s, -. as far 9.!tC"sible, on the v of the conclusion that there Is no Rpperentscale-effect when the spectrum is presented in a non-dimensional form. An example
shown in Figure 9 where the pressure-fluctuations on the rear wall of a rectangularcavity in : cy lindrical body have been analysed at three windspeeds: 11)8. 150 and213 it-sep. These results show no apparent scale-effect for the range of wlndspeedcovered, and, in ali the series of tests made. a few checks have been made that the sarTe
Best Available Copy
1 (;
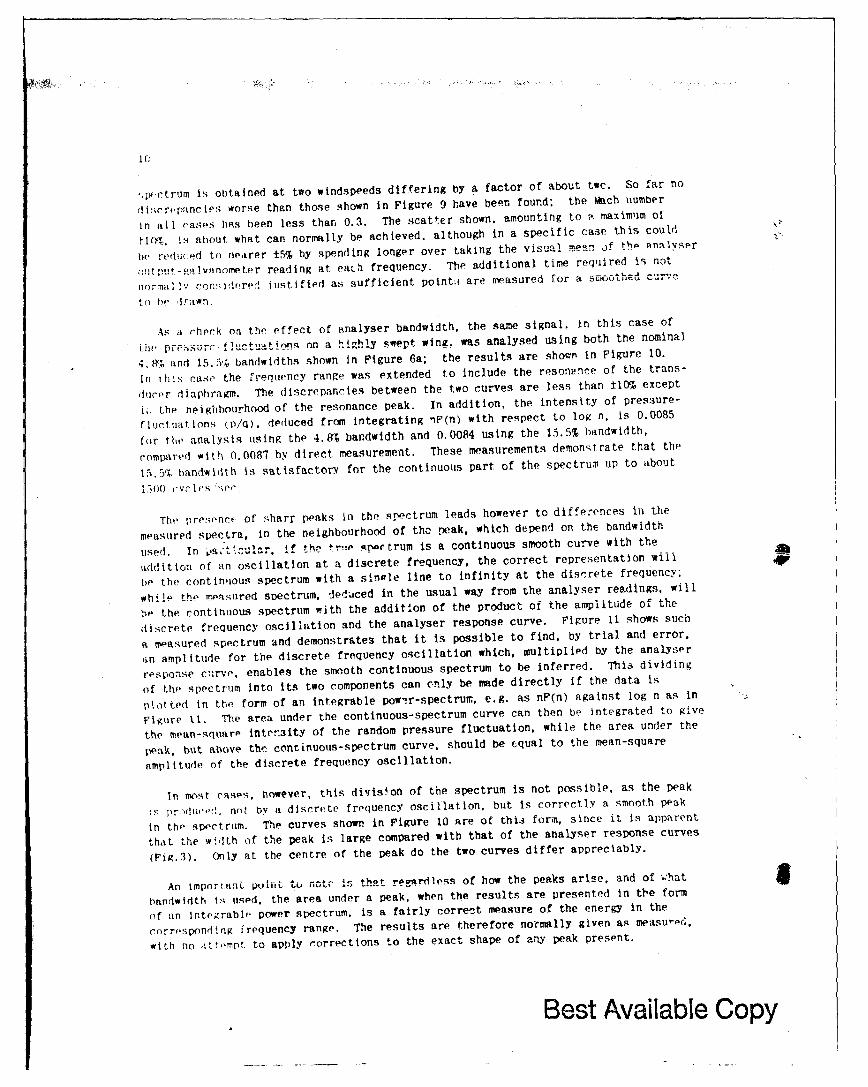
,,X.ctrum is obtained at too windspeeds differing by a factor of about twc. So far no
dtcrr pancies worse than those shown in Figure 9 have been fourd: the Mach number
in all rases has been less than 0.3. The scatter shown. amounting to ?. raximlm of
flr(,. is about what can normally be achieved, although in a specific case this could
he red(uced to neaLrer ±I% by spending longer over taking the visual mean _f tbp analyser
.:tl;..:;,, vrnomter reading at each frequency. The additional time required is not
normal 1y con,idFre justified as sufficient point.- are measured tor a suouthu dU...
to he ,rawLn.
As a rhpk on the effect of analyser bandwidth, the same signal, in this case of
Lhv pr,:' ~uctuatii_.n. nfl a highly sent wing, was analysed using both the nominal
4.1r,; and 15.5% bandwidths shown in Figure 6a; the results are shoVM in Figure 10.
In his case the frequency range was extended to include the resonance of the trans-
ducer diaphragm. The discrepancies between the two curves are less than ±10% except
ii. the neightbourhood of the resonance peak. In addition, the intensity of pressure-
fluctuations (p/q). deduced from integrating nF(n) with respect to log n. is 0.0085
for the analysis using the 4.8% bandwidth and 0.0084 using the 15.5% handwidth,
compared with 0.0087 by direct measurement. These measurements demonstrate that the
15.5% handwidth is satisfactory for the continuous part of the spectrum up to about
1500 cc 1 "os '
The presence of sharr peaks in the spectrum leads however to differences in the
measured spectra, in the neighbourhood of the peak, which depend on the bandwidth
used. in a..tiz-ar if the' tr.,p !.4rtrum is a continuous smooth curve with the
addition of an oscillation at a discrete frequency, the correct representation will 4P'
be the continuous spectrum with a single line to infinity at the discrete frequency:
while the rr .rsured spectrum, ded-ced in the usual way from the analyser readings, will
.e the continuous spectrum with the addition of the product of the amplitude of the
discrete frequency oscillation and the analyser response curve. Figure 11 shows such
R measured spectrum and demonstrates that it is possible to find, by trial and error.
an amplitude for the discrete frequency oscillation which, multiplied bY the analyser
response curve. enables the smooth continuous spectrum to be inferred. This dividing
of the spectrum into its two components can only be made directly if the data is
pl1otted in the form of an integrable powir-spectrum, e.g. as nF(n) against log n as in
Figure i1. The area under the continuous-spectrum curve can then be integrated to give
the mean-squarp inten3ity of the random pressure fluctuation, while the area under the
peak, hut above the continuous-spectrum curve, should be equal to the mean-square
amplitude of the discrete frequency oscillation.
In most cases, however, this divis.on of the spectrum is not possible, as the peak
ti prrou<, not by a discrete frequency oscillation, but is correctly a smooth peak
in the spectrum. The curves shown in Figure 10 are of this form, since it is apparent
that the width of the peak is large compared with that of the analyser response curves
(Fig.3). Only at the centre of the peak do the two curves differ appreciably.
An importanL puint t'u not i that reardless of how the peaks arise, and of .hat 5bandwidth is used, the area under a peak. when the results are presented
in the form
of an Integrable power spectrum, is a fairly correct measure of the energy in the
cnrrospondtng frequency range. The results are therefore normally given as measured,
with no , .ttmpt. to apply rorrections to the exact shape of any peak present.
Best Available Copy

11
To check the effect of the tape-recorder op the accuracy with which a spectrum isdetermined, a particulai signal produced by a transducer behind a spo iler was analyseddirectly. recorded at 6 in./sec on 225 ft of LLPe, recorded at 60 in./sec on another
225 ft of tape, and finally analysed directly again. Each of the 225-ft lengths of
tape was cut into three and the portions analysed separately; the resulttng spectraare compar-d in Figure 12 with the spectrum resulting from the direct analyses.
3.2 Effect of WinI-Ttunnel Airflow Unsteadiness
Early tests were made in the RAE 4 ft x 3 ft and No.2 li' ft wind-tunnels oncylindrical bodies having either a cavity to represent a bomnb-bay or an external air-
brake. Both tunnels have screens in the maximum sections and hot-wire nasurementshave shown low turbulence levels*. Datum checks of the pressure fluctuations on the
surfaces of the plain bodies gave values of p/q of about 0.005, which w-#re smallcompared with the maxima of about 0.15 measured in the cavity or behind the air-brake.The spectra for these datum tests were consistent with the pressure-fluctuations being
mainly dup to the turbulent boundary-layers on the bodies.
However, preliminary measurements of pressure-fluctuations on a thin wing in the
No.1 11V2 ft wind-tunnel, which is of earlier design, and has no screens, with a con-traction ratio of 4.75 to 1, showed spectra with a sharp rise in amplitide at lowfrequencies, even with the wing at zero incidence. This was attributed to "heunsteadinessof the airflow in the tunnel working-section and, in order to investigate
it, a special model was constructed (Fig.i3), enslsting nf m rectangular Wing of 1 ftspan and 6 in. chord, with a single transducer at its centre measuring the pressure
difference between the upper and lower surfaces at this point. The transducer wasbasically of the design shown in Figure la, but with a different front casing. andalso with a thinner diaphragm to increase the sensitivity: this enabled values '3
p/q as low as 0.0001 at 150 ft/sec to be measured and analysed.
Tne results of these tests are shown in Figure 14. The No.1 l1, tt wind-tunne', in it!-original form gave results with a very large increase of amplitude towards the low-frequency end of the spectrum. Fitting an available honeycomb at the beginning of theworking-section reduced the fluctuations considerably as shown; though, as -d
with the rest,,s,,. .ithe No.2 11% ft wind-tunnel, they were still large. WhI!_'
reducing the fluctuat nsto a, eve1iwi1ich ufghthwre~been acceptale for .;:-test, the honeycomb 4 not a satisfactory solution, as its positioning at the begin-
ning of the workig-section lead to a threefold increase in the power rcquired todrive the tunnel, with a consequent rapid rise in the temperature of the air at the
normal operating speed of the tunnel.
The low-frequency nature of the fluctuations suggested an intermittent breakawayin tb- tunnel return circuit, and one possible source was locatpd by inspection.Vortex-gene rators were installed ahead of this section, but, though this led to a
considerable reduction in the level of the fluctuations, as shown in Fi;,ure 14, the
At the usual test speed of 150 ft/sec the IGhgitudinal and lateral rcO*Donentn of the turbulenre
in the 4 ft x 3 ft wind-tunnel are about 0.01% and 0.02% respectlvely, while the lonaltudinal
('oWipontnt in tle No.2 llt ft wind-tunnel is about 0.04%.
Best Available Copy
lvl .f nFIn) at low fiequencies is still high. This indicates that the tunnel is
still unsuitable for pressure-fluctuation measurements on wngs, or for any other
tsts where, incidence fluctudtions can affect the results.
Provided that the pressure-fluctuations are large compared with those produce] bytho, boundary-layer alone, this _ype of test can be regarded as a method of obtainingincidvn( -flu-tuation values at low frequencies, where the equivalent wave-lcngth islarwe compared with the wing chord; 10 cycles/sec for instance corresnonds to 30 wingchords. Tho pressure-fluctuations can be converted to incidence-fluctuations bydividing by ds/di.* where ; ,s the difference between the static pressure coefficientsacross the transducer, and a is the wing incidence. As a check on the nature of thei: l-'w-tIt on the wing In the No.? llv ft wind-tunrel, a 26 s.w.g. transi-
tLion wire was added at 10% of the wing chord. This led to an approximate doubling ofnFtn) throughout the frequency range, suggesting that the measured pressure fluctua-
tions on the, plain wing were mainly due to the wing boundary-layer, and that onlynegligible flurtuations due to tunnel unsteadiness were present.
No tests were made in the 4 ft x 3 ft wind-tunnel, since measurements with hot-wireanemometers had shown an even smoother air flow there than in the No.2 11Y ft wind-
tunnel. All subsequent pressure-fluctuation tests have been confined to these two
tunne Is.
-.)A.@ Up ,, I sizremen t :
li previous sections the methods used to produce the total intensity and spectrumdensity of the fluctuating pressures have been described. Two further types ofmeasurement are now considered: (a) the use of pipes when only the amplitude of v'L(n
at low frequencies is required; and (b) the measurement cf the correlation between
pressure-fluctuatlons at two points.
3.3. !. The use of Pipe-s in presvure-flurtantion measurements
As will be dlscussei in Section 4.3. it has been found more appropriate, in sometests, t. use tho value of v'nrF(n) at a particular Low frequency as a parameter, rather
than p/q. Fur such tesLs the possibility arises ot using a lr,.l- ::,£h ofpip between the measuring point and the transducer, so enabling the measuring ointto he traversed over a large area of wing or bodv surface, without the necessity ofmoving and reinstalling the transducer. A suitable type of piping was found to be
cupro-nickel hypodermic tube of 0.140 in. (nominal 1 m) outside diameter and 0.028 in.inside diameter. This is sufficiently soft to be bent into various curves for tra-versing the measuring point a considerable number of times without fracture or
reduction of the bore.
A wide-range spectrum similar to that shown in Figure 12 was recorded with nonipe and with a series of pipe lengths between the measuring point and the transducer.The results are shown in Figure 15 as the variation with frequency of the attenuationin ampllt-I, produced by the introduction of the various lengths of pipe. These
" j;;I In ,'Iii t ile ,igri of transducer shown in [iguir is. sinc- hesize of th,' chamber in the front casing influences the response of the system. Theattenuation curve shown for the 60-In. pipe was obtained at both 80 and 140 ft/sec,
Ii m, % 1. 14(o delgree for tho wing used.
Best Available Copy

13
the total r.m.s. intensity of the pressure fluctuation being about 0.05q. This
independence of response with the amplitude of the pressure-fluctuaclon can. however,
only be expected to apply at low windspeeds, where the amplitude, of th" fluctuations
are sufficiently small for the Intermittent flow in the pipe not to be affected by
the compressibility of the air.
It is suggested that a reasonable upper-frequency limit for the longer pines isthat at which the attenuation Is 0.5, i.e. at 18, 50, 120 and 200 cycles/sec for the
60, 3C, 15 and 7.5 in. pipes respectively. For shorter lengths of pipe the more
rapid variation of attenuation with freiqutncy, above the resonant frequency, would
require very accurate frequency measurement and allo~rance for the variation of the
speed of sound with temperature. if accuracy was to be maintained. Ira particular.
for lengths of pipe shorter than about 2 in., a sharp resrnance peak with further
peaks at the higher harmonics would be expected, and the usual upper-frequency limit
of half the resonant frequency would apply. For the system tested therefore, it
would seem that about 8 in. is a reasonable minimum pipe-length, with no further useful
gain in the upper-frequency limit unless the pipe can be reduced to less than about
I in. in length.
3.3..2 forr-lation between pressure-fluctuations at two points
Some measurements, described later in Section 4.3.1, have been made to determine
the correlation coefficient Rab defined in the usual way as
AR
Rat) =-li
where A and B are the instantaneous values of two fluctuating quantities, measur(-d at
points a and b, AR is the mean of the instantaneous product AB, and vA2 and vB 2 are
the root-mean-square values of A and B. The usual method of obtaining A is to measurethe maan square values, (A + B)2 and (A - B) , nf the instantaneous quantities (A + B)and (A - B), obtained by electrically addli.x atnd buoLracting voltages prorortlonal to
A and B. whence A can be calculated from
(A + B) - (A- 31)2 - 4 AB
There are considerab>, difficulties in using this method with the existing equip-ment. While the pre-amplifier (Fig.2) has two channels, and two transducers may
readily be used to produce two fluctuating-voltage outputs, the circuits of both the
r,'e-amplifter and the following amplifier have one side earthed, in order to reduce
oick-up at the mains supply frequency and its higher harmonics. This earthing is
basic to the construction of the apparatus and there appeared to be no simple methods
of interconnection to obtain both (A + B) and (A - B). Eliminating the earthing froma second set of pre-amplifier equipment, while retaining rectified 50 cycles/secvnlt.ap sinlies led to very large voltage pick-up at 50 cycles/sec and higher
harmonics. Replacing this voltage supply by dry batteries reduced the pick-up to a
tolerable level, but the very short life of readily available batteries uLsed in thisway made the technique very cumbersome. In addition, some complication was introducedby the need for complete insulation of the transducer and its connecting leads f-om the
model, which in this case was of metal. The simpler method was therefore adopted ofmeasuring /A2, - and /- and obtaining ARB from the relation
Best Available Copy

(A + B)2 - A2 - B2 2 AB
It should be noted that in the complete formula for Rab,
(A + B) 2 - A2
B2
Rab (2)
2vA-2
the substitution of kA for A does not affect the result. It is not therefore
necessary for the two voltages, or other quantities summed, to be in the same ratio
to the original quantities A and B. In particular, if the two transducers are
ronnet-d in parallel so as to sum the capacity fluctuations, the r.m.s. value of
the resultinv voltage output from the pre-amplifier can be used in Equation (2),
ogether with th. corresponding values obtained from the transducers connecte. singly,
to give Rab, irrespective of the transducer sensitivities. It is necessary, however,
for the three measurements to be taken in sufficiently rapid succession for the
translucs'r sensitivities to remain substantially unchanged.
To provide the interconnections of the transducers, three muiti-w .y relays, con-
tained in a screening box, are used. The circuit includes fixed and adjustable
condensers, so that the total capacity of the system can be made the same, whether
readings from either transducer or the combination are being made. This constancy
of the total capacity is advisable as the pre-ampli1''er sensitivity (in volts/Pf)
varies to some extent with the total capacity, and it is essential, either that this
.ensitivity should be. the same for all Lhree aea.urrmcntz, cr that R 0 wance should
be made for the variation. The second alternative would require additional calibration,and introduce undesirable ccmplication into the computation.of the results. The
circuits made by the felays are shown in Figure 16; when makinK measurements from asingle transducer, the other is short-circulLed.
To maintain accuracy, the three measurements required to obtain Rab are always
made cons,- ... ve'y. keeping conditions constant me..-.7:i; this a lics to measure-
ments at each particular frequency in a spectrum analysis, as well as to total inten-
sity measurements. Since the estimation of Rab is unaffected by any sensitivity
tactors of the system, it is best calculated as directly as possible: from the threemi,-rovolfr ruadings for total intensity measurements, and from the logarithmic
pot "nt i uooter and output-galvanometer readings only in the case of spectrum measure-
monts. R ab is determined with acceptable accuracy by the above methods, provided thatr.'n.s. values of A and B do not differ appreciably in magnitude, but the accuracy fallsoff fairly rapidly as the ratio of v to vB increases. As an illustration, the error
in Rab due to a 1% high reading of V7-- 0 and a 1% low reading of vA- is given below
for a range of values of v-i"/v'2:
Error in Rab
1 ] 2 31
Rab 1 0.06 0.08 0.10 0. 12 0.14
Rab 0 0.03 0.05 0.07 0.09 0.11
Rab 1" 0.00 0.04 0.0610.08 0.10
CO~
15
An accuracy of ±1% in the r.m.s. alitude of the total sigrals seems possible,and also in spectrum measurements at frequencies above 50 cycles/sec; at lower fre-quencies, however, the scatter increases and errors of up to ±5% in amplitude mayoccur at 3 cycles/sec, with proportionately larger errors in Rab. Since the estimateof R is unaffected by any scaling ratios In the system, it is sometimes practicable
to reduce the ratio of vA to r iy using the combination of a transducer of low
sensitivity in a region of large pressure-fluctuations, with a transducer of high~'i ii V1 L.Y i 11 M regiuo Of sialI'L luctuito-"j--
3.3.3 Estimation of normal-force fluctuations from pressure-fluctuation
aeasureaents
If sufficient correlation measurements are made it is possible to calculate the
normal-force fluctuption on a section or over an area. Such a series of measurements,
discussed later in Section 4.3.1, has been made between a number of pairs of points
along a wing chord-line, and Zhe method of estimating the normal-force fluctuation
for this nase is discussed in this Section. Taking the origin at the wing leading-
edge, and letting c be the wing chord, consider two points x and x' at which the
ti. tan,. mv pressnres are P, and P,,,. The square of the instantaneous load i.i then
L~~C'' JJ -L dx dx'N c d'q
with a mean square
NC -
It is necessary, therefore, to know the covariance between. all. pair. of pvnLs Gn
the chord-line before A can be estimated; suppot;e the number of measuring points
to be t, tiien (t/2)(t - 1) sets of measurements wouid be required. However.c.-prcssing the data in terms of correlation coefficients can somctimes lead to a
reduction in the number of measurements required. The correlation coefficient.
defined as before, is
Tr x P X' P P1R xx, r
where px and pz , are defined in the usual way as the r.m.s. intensities of the pressure-
fluctuation- at x and x'. Equation (3) can then be rewritten as
f Lx4dx dx')o0 q q
0 0
If now the curves of Rzx,, with x constant, show sufficient similarity, it is
possible, in principle, to deduce the complete function uf Rxxr from measurements for
Best Available Copy

16
Only a few vslues of x. If for exanlle it could be shown. that Rxr (where r jx - xl)wis dependent only on r and independent of x, (t - 1) measurements at one value of x
would he sufficient, in principle, though in practice comparative measurements at two,
or preferably three. vilues of x would be required to establish the ,alidity or other-
wise of su'h i, ri.lationship. If Rr is the correlation coefficient, dependent only
on r. riuiation (4) can he written as
AC 2 I x P x + r(5)C . -x d x Rrd(5SN c7 ( Ic0q -x
It -hould he notpd that, even if the function Rxr does show some dependence upon x,
the use of in approximate mean variation Rr in Equation (5), rather than the full setof data in Equation (4), would not be expected to irtroduce large errors into the
estimate of , and this approach would seem to provide a useful method of reducingth nmhpr of mpiuripment. to be made.
3.4 Further Developments
3.4. I Fztenston of the pr-sent testtng techniques to transonic andsupersoniLc speeds
With the introduction of the tape-recorder into the system, the reduction of tunnel-
running tire at each test condition from 30 minutes for a direct spectrum analysis to
5 minutes using the recorder, makes testing in high-speed and high-power wind tunnels
practicable. It 4s proposed, in the first place, to examine the suitability of two
such wind tunnels, the 3 ft x 3 ft transonic and supersonic wind tunnel and the 8 ft x
6 ft transonic wind tunnel, for pressure-fluctuation tests tly making measurements on
a simplc model at zero incidence, as was done for the low-speed tunnels 'see Section 3.2).
The model in Ohis case is to he a dl ta-wing having a 700 leading-edge sweep, ) in. long.
with a single transducer of the type shown in Figure lb, installed on the centre-line
atI3 or thp root-chord from the nose. With such a wing there should be no shocks
a ro,s the model ahead of or near the transducer, within Lhe Mach number- range ot the
.ot 1.2 or the 8 ft x 6 ft t.nnel in,! 2.0 for the 3 ft x J fttunnel. The measurements should therefore give a good indication of the pressure-fluctuation datum in the two wind tunnels and its variation with Mac& number.
If the sind tunnels should be suitable, further research will be required into
tepeiature effects on transducer sensitivity, and into the constancy of the trans-ducer calibration with contin.ed use. For some tests also, the upper limit of
2000 cycles/sec imposed by the present transducers will be too low, and modifieddesigns will be required; one possible design, to replace the low-speed type shown
in Figure ia, is shown in Figure 17. The dlaphragm is tensioned and flattened byscrewing down the front casing over the outer casing, giving a 0.40 in. diameter
flush surfacc. ihe Inner casing can be screwed in ar.d out on a fine thread
(!00 threads per inch) to adjust the condenser pap and hence the transducer sensitivity.The ratural frequency of the diaphram, deduced1from measurme t6f its deflectionsde to steady pressures, is about 100,000 cycles/sec. Effects of temperature and
constancy of citibration have yet to be investigated.
Best Available Copy

17
3. -5. 2 Auto attc a(alySer
When analysing recordings at prmnent, the operator reacds a mean value off theanalyser output-galvanometer (Flg.2), as for direct analysis. To estimate a reason-ably accurate mean reading, it is found necessary to observe the galvanometer forabout 4 transits of the tape-loop at low frequeneien, and 2 at high frequencies,
. trun :1t t-king 15 seconds. The strain ,f the constant averaging 7 revents anyoxe onerutnr fmm norroyIng this job for long periods. An automatic analyser,as well as reducing the strain on the operator, offers the possibility of reducingthe analysis time to about a third, since only one transit of the tape-loop shouldbe required for each reading.
etailed plans for an hutomatic analyser have not yet bem worked out, but it isenvisaged ,o; cronMi;ting (f the following modifications to the existing system (Fig. 2).The output could consist of some lorm of integrator with automatic read-out, operatingoff a squaring and rectifying circuit, preferably not a thermo-junction, as thethermal lag would introduce difficulties in this application. The analyser could,for most test. be replaced by a set of 25 fixed filters, though some form of contin-uous tuning woul sometimes be required. with an output proportional to the squareof the signal, some form of calbrated gain control would still be required, thojgjwith less steps than the present logarithmic potentiometer; in principle this gain
control could be set by the operator. Switching from one filter to the noxt, andthe read-out, could be triggered hy a photo-cell working off the tape-splice. Thischange-over should not take more than about 1 sec out of the 15 sec of the tape-transittime, so that only about 5 ft of tape. which should include the splice, would be lost.
4. SOME PARTICULAR APPLICATIONS OF PRESSURE-FLUCTUATION MEASURFYFNTS
4.1 a1b-13ay Buffeting
An ir,gestigation was made into the airflow in bomb-bays of various shapes, thedrag to which they give rise, and the effectiveness of various flow-control devices;th? model used was, basically, a cylindrical body, with a systematic series ofcav±lies cut into it. Pressure fluctuations were measured, in some cases, using anearlier design of the transducer shown in Figure la, and it was found that thehighest intensities were mainly concentrated on the rear bulkhead of the bomb-bayand on the body immediately behind It, with a fairly rapid reduction forward alongthe bomb-bay roof and rearward along the body. Two transducers only therefore wereused, one in the rear bulkhead and one in the body just behind the bomb-bay, as shownin Figure 18. !n general the total intensity of the pressure fluctuations and theform of the spectra were different for the two transducer positions; rounding offthe lower edge of the rear bulkhead, in particular, reduced the intensity of thepressure fluctuations on the body very considerably, while baving little effect onthcse on the remaining bulkhead (see FIgure 18).
1hile there were minor differences in the total intensitles and spectra betweenbomb-bays of various height-to-length ratios, the only modification which appreciablyreduced the pressure fluctuations was the elimination of the vertical rear bulkhead,as shown in Figure 19; complete retraction of the bomb-doors still further inrcreasedthe effectivencr s of the sloping rear bulkhead.
Best Available Copy

18 I F8
4,2 Air-Brake j f fet t
A series of tests 2 was made to examine the static and fluctuating pressure distrlbutionson a cylindrical bidy with a square flat plate air-brake. A transducer of the type $shown in Figure la was used and the model and transducer installation are shown in
Figure 20. The portion of the body containing the transducer could be rotated, and
aio ;rh ,: th ther nrrtons of the body for longitudinal positioning; the
brake could also be moved longitudinally on the body. By this means it was possible toposition the transducer orifice anywhere on the body In the region from ?L ahead of
the brake hinge to 61 behind the brake hinge (I = brake-chord). The rear orifice ofthe transducer was connected, through a small-bore metal pipe, to a long length of
srall-bore tubing outside the wind-tunnel to provide a steady datum.
Both static pressure and the total intensity of the fluctuating pressure were
measured with the transducer, and contours of both were drawn, as shown in Figure 21.Spectra were measur,'d %t a few pcsitions only, as shown in Figure 22. To obtain some
impression of the variation of the aerodynamic excitation on the body with brake-angle,
the total Intensity of the pressare fluctuations was integrated over the area of the
body affected arld the result expressed non-dimensionally using the air-brake area;
the results are shown in Figure 23. This integral has no quantitative value as no
allowante has been made for the effects of correlation or of body curvature; but the
variation with brake-angle is considered significant, and it was deduced that res-triction of the brake-angle to 500 and mounting the brakes at the rear of the fuselage,
'to educe the area of fuselage affected, should be effective in reducing the aero-
dynimic excitation %ssociated with the brake.
This aerodynamic excitation appsared to be due to the unsteady nature of the flowbehind the hrike at high incidences. With the configuration tested (Fig.20), thene,sured shedding frequency wus nearly the same as for an isolatcd plate (Fig,24); itwas therefore considered that further attempts to reduce the unsteadiness of the w?.ke,
by means of modifications to tOe brake, could be compared more easily and quickly 1iththe aid of hot-wire measurements33 of velocity fluctuations in the wakes of isolatedplates. The conclusions reached have not yet bean confirmed by measurements ofpressure fluctuations.
4.3 Plrcssure Fluctuations of Thin Wings
The type of pressure transducer shown in Figure lb was specially designed for usein metal wings. It is fitted into the wing with its flange-face flush with the uppersurface, any excess of the body protruding through the lower surface being machinedoff; a minimum wing thickness of about 0.30 in. is required, A groove about 0.10 in.deep and 0.10 in. wide is uschined into the lower surface of the wing, from the holein the transducer body containing the rear plate connection to a suitable point onthe wing, usually in a body or nacelle, at which the normal 0.25 in. diameter coaxialable can be attac.ed; a si-.igie nAsulated wire is fixed into the groove with Araldite
cement and the surface smoothed off. There are three reasons for letting the trans- 4d'cer into the upper rather than the lower surface of the wing: firstly, the upper,turface suction, whose magnitude is difficult to predict, then tends to increase thecondenser gap, gr) that a short-circuit, which could otherwise only be avoided, withce7tainty. by uging a large pre-set gap with a correspondingly low sensitivity, can-nu,* occur; secondly, the variation with incidence of the differeotial static pressure
Best Availabke Copy

19
then leads to maximum sensitivity of the transducer at low incidence, where the pres-
sure fluctuations to be measured are least: and thirdly, since the pipe through the
N, transducer body is then connected to the lower surface of the wing. where the pressure
fluctuations are normrlly small, any resonance due to its length will also be small.
A number of tests have been made on wings with approximately two-dimensional leading-
edge flr Ieparation. This is the simplest case, and Investigationn are now in progress
to examine ways of measuring and presenting data for the more complicated types of flow
separation associated with low-aspect-ratio highly-swept wings.
It is found that wing buffeting caused 1y shock-induced separations in high-speed
flight consists almost entirely of the excitation of the fundamental flexural mode of
the wing, and it is expected that this will also apply to low-speed buffeting at high
incidences. Low-speed wind-tunnel tests are normally concerned with the possible
occurrence of wing buffet during an airfield approach, and with the relative effective-hess of acceptable modifications to the wing configuration. It seems reasonable, in
thiN case, to use as a criterion the aerodynamic excitation at a particular value of n,
say nA, defined by nA = fW(CAA), where fw is the wing fundamental flexural frequency,
c is the wing mean chord and VA is the approach speed. On projects so far examinedDA has been about 0.2; but with the relatively 'flat' spectra associated with flow
separation on wing., the value of n chosen is not critical, and the conclusions reached
would have been little affected if any other value of n between 0.1 and 0.4 had beenusel. A value of n of 0.2 corresponds to about 20 cycles/sec for a typical model wing
and wind-tunnel speed: and for measurements at such a frequency it is possible to useR considerable length of pipe between the measuring point and the transducer, as
described in Section 3.3.1, and to traverse the measuring point over the wing surface.
4.3.1 Low-aspect-ratio unswept wing
The mode' sfinwn in ,'igure 25 was constructed for measurements of the fluctuating-pressure fleld associated with flow separation from the leading edge of a low-aspect-
ratio uniswept wing; but since the addition of a nacelle, as shown In the figure,gave a region of approximately two-dimensional flow between the nacelle and the body,attention was confined, in the first instance, to this simpler flow regime. A pair of
transducers, of the type illustrated in Figure lb. can be set into any two of the
twenty-two positions indicated in Figure 25, and soldered connections can be made towires permanently installed in the lower surface of the wing; the remaining sockets
may then be plugged with dummy transducers. Measuring the correlation between thepressure fluctuations at different points on the wing was the main purpose of theexperimental programme.
The results discussed below all refer to the wing with the nacelle on, and withonly the thirteen transducer positions between the nacelle and body in us.. The totalintensities of the pressure fluctuations measured in the chordwise traverse are shownfor tho range of Incidence in Figure 26; ard the corresponding correlation coeffi-cdents Rxx7 (see Section 3.3.3), for x = 0.1c and x = 0.8c. are shown in Figure 27.The measured values of Rxxr show a fair amount of scatter, and a tendency to theconstant value of 0. 1. rather than zero, for large separations of the transducers.In order to rev-al the dominant effects of incidence upon the correlation function,th. measured c ffictents were cross-plotted in the form R against a (wherexrr 7 Ix' - x!); twc sets of measured values, corresponding to the two vialues of x,
Best Available Copy

20
w(,r h trr-fore plotted for each value of r and it was at once apparent t.hat both sets
could 1s reprfsented by a single smooth curve, with an error not exceeding the experi-
mental uncertainty; it follows that Rxr was effectively unaltered by changing x from
0.lc to 0.8c. The function of r, Rr say, obtained in this way is plotted in Figure 28.
In view of these results It in natural to assume that Rr closely iepresents thecorrelation function for all values of x; this implies that Pxr is not significantly
dependent on x. In this case a fairly accurate estimate of the magnitude of thefluctuating normal force, on the section in question, may be made according toEqiat~ton (5), S.ctlon 3.3.3. Results so obtained are plotted in Figure 29; the samefigure shows, for comparison, the total intensity of the normal-force fluctuationthat results if the correlation coefficient is assurwd to be unity everywhere, togetherwith th. total Intensity of the pressure fluctuation measured at O.8c. This assump-tion of unit correlation leads to the maximum force fluctuation compatible with themeasured intensities of the fluctuating pressures; the computed fluctuating normalforce on the section (expressed as a root-mean-square total Intensity) ranges from0.25 of the corresponding maximum at 00 incidence, to 0.50 at 80, and 0.77 at 160,
thus. lndloating a marked effect of the increasing correlation with incidence. It isa so Int,,resting to notice that the total intensity of the pressure fluctuations at0.8c shows some resemblence, in the forn of its variation with incidence, to thenormal-force fluctuations.
The spanwise correlations, with respect to the middle station of the five shownin Figure 25 at 0.8c, were also veaqured. In this case, however, iisufficient datawero obtained to justify a similar analysis to that applied to the chordwise traverse,but it is interesting to note that the results are adequately represented by thefunction Rr, determined from the chordwise traverse, at both high and low incidence;in the range 40 to 80 of incidence the spanwise correlations somewhat exceeded thecorresponding chordwise values.
It is also possible, in principle, to derive the spectrum of the fluctuating normalforce on a wing frc n the measured spectra of the two-pNint products of the pressurefluctuations at a sufficient number of points; the spectrum funtion for the forcefluctuation is then obtained by successive application of either the complete formof computation described in Section 3.3.3, or, if the data are suitable, the for zuingshorter form. to a number of narrow bands of frequency. Some measurements have benmade at one incidence (40) of the variation with frequency of the chordwise c.irrelation,and these results are shown in Figure 30 in the form of correlation coefficients;they exhibit a noticeable wave-form, and further measurements with respect to other
reference points would be required to determine whether the correlatio coefficientdepends primarily on the separation of the two points in question at all frequencies.as is apparently true for the total intensity mee.surements.
: "v if this wave-form, a single spectrum of the correlation between two points'.. ; 1', valii: it in:; clarly necessary to determini the n-nne:- in w ich, the
spectrum varies with the distance between the two points. The corplote df'inition ofthe correlation function would also appear to require a closer spacing betweensuccessive stations than would be necessary if there were no wave-form. The resultsgiven i , Figure 30. obtained in about 3 days of tunnel-running time, are not suffi-'int .o give even an indication of the spectral density of the fluctuating normalforce( on the section. toe definition of which must therefore be regarded as a lengthyprocs-:;. As an illustration of the rlifficulties involved in deducing the spectra of
Best Available Copy

21
normal-force fluctuations from pressure-fluctuation measurements, consider, forexample, the more general case of the wing shown in Figure 25, with th? nacelle
removed and with a 'ull set of fourteen chordwise rows of nine transducer stations- 126 transducer positions in all. If no simplifying assumptions were permissible,the spectra of the correlations would be required between all pairs of these positions;using the present technique, the time taken, merely for the measurements - at therate of three sets of spectra a day for fifty five-day weeks a year - would amountto about 10 years for each wing-incidence. Though there is little doubt that thisfigure would be considerably reduced In practice - permissible simplifications wouldbe likely to become apparent as the results were collected, there is also littleloubt that the total intensity and spectrum of a fluctuating load would be much bettermeasured directly. On the other hand. a limited application of the procedure outlinedhere might help to throw light upon the causes of the load fluctuation; it is hoped,thorefore, that the data already collected will be supplemented sufficiently to allowthe computation of the spectrum of the fluctuation of the normal force on the wingsection, for one or two angles of incidence, in order to investigate the significanceof the period i nature of the correlation function measured at dlfftrent frequencies.
4.3.2 Vtswept wLng p,,el
The effects of various leading-edge Oevices, and of plain and split flaps at thetrailing-edge, have been examined, using the wing shown in Figure 31. Only twotransdurers were fitter', at 0.50c and 0.85c as shr-n, and the results for the plainwing are shown in Figure 32; these measurements are fairly similar for the twochordwise positions. The frequency at which buffeting might be expected to occur,at the approach speed of the full-scale aircraft, corresponds to a value of thefrequency parameter, n, of about 0.2. At such a low value of n the corr'.lation mightbe expected to be fairly high; this is supported by the solitary series of measure-
ments plotted in Figure 30.
When the Intensity of the pressure fluctuations shows a sharp rise with increaningincidence, a.s it does in this case (Fig.32), it is natural to suppose that the onsetof buffeting - if it occurs - is likely to be associated in some way with this sharprise. It Is therefore suggested that the incidence, or more correctly the corres-ponding aircraft CL, at which the value of Y~ff-n), for n 0.2, and x as large aspracticable (in thi! case 0.85c), has risen appreciably - to 0.01 say - is likely tobe a suitable criterinn with which to establish the relative merits of the variotLsleading-edge de"Kce,3 according to this standard, a plain nose-flap of 10% chord wasfound to be ' he most effective of the devices tested.
Wherever possible, an attempt has been made to relate the fluctuating pressures tothe mean flow field, which, for this particular wing panel, Is dominated by a leadlng-
- ,, wich y:;, r: to yive risf, to kn aS proximato]lI two-ciilSionstion:,1 I l ov
tl:' h ' .fIe, with r ,ttachm t onto tVl ,oprr surrftre of the win! , to jithr~lt
SIf" : niW, c( ;ei Figure 31). It is intert t ing t, note that while tlhe low-frequency fluctuations reach their maximum intensity when the reattachrent line lies
,,l: ,.2l : i ed,,,- (,f the sing_ the sharp rise begins much sooner - rt theincidence corresponding to about 0.3c. for the forward transducer, and 0.5c for therearward one. Divergence of the trailing-edge static pressure, which is often usedas a criterion for the onset of the type of wing-buffet associated with shock-induced separation of the flow over the rearward part of a wing, occurs when reattach-ment reaches 0.8c, so corresponding to nearly maximum intensity of the low-frquency
Best Available Copy
21
normal-force fluctuations from pressure-fluctuation measurements, consider, forexample, the more general case of rhe wing shown in Figure 25, with the nacell-removed and with a tull set of fourteen chordwise rows of nine transducer stations
, .. -126 transducer positions In all. If no simplifying assumptions were permissible,the speetza of the correlations would-be req~ifre b~twen al '4o these 'PoitIonmYusing the present technique, the time taken, merely for the measurements - at therate of three -sets of spectra a day for fifty five-day weeks a year - would amountto about 10 years for each wing-incidence. Though there is little doubt that thisfigure would be considerably reduced in practice - permissible simplifications wouldbe likely to become apparent as the results were collected, there is also littleloubt that the total intensity and spectrum of a fluctuating load would be much bettermeasured directly. On the other hand, a limited application of the procedure outlinedher, might help to throw light upon the causes of the load fluctuation: it is hoped.therefore, that the data already collected will be supplemented sufficiently to allowthe computation of the spectrum of the fluctuation of the normal force on the wingsection, for one or two angles of incidence, in order to investigate the significanceof the perit ic nature of the correlation function measured at dlffrrent frequencies.
4. 3.2 lIstospt Wtng panel
The effecLs of various leading-edge devices, and of plain and split flaps at thetrailing-edge, have been examined, using the wing shown in Figure 31. Only twotransducers were fitte l. at 0.50c and 0.85c as shr.n, and the results for the plainwing are shown in Figure 32; these measurements are fairly similar for the twochor(lwi!se positions. The frequency at which buffeting might be expected to occur,at the approach speed of the full-scale aircraft, corresponds to a value ,f thefrequency parameter, n, of about 0.2. At such a low value of n the corri.lation mightbe expected to be fairly high; this is supported by the solitary series of measure-ments plotted in Figure 30.
When the intensity of the pressure fluctuations shows a sharp rise with increasingincidence, as it does in this case (Fig. 32), it is natural to suppose that the onsetof buffeting - if it occurs - is likely to be associated in some way with this sharprise. It is therefore suggested that the incidence, or more correctly the corres-ponding aircraft CL, at which the value of Vrf(n), for n 7 0.2, and x as large aspracticable (in th1t rase 0.85c), has risen upprPciahly - to 0.01 say - is likely tobe a suitable critec-on with which to establish the relative merits of the variouslealing-edge d, .ce:3; according to this standard, a plain nose-flap of 10% chord wasfound to be the most effective of the devices tested.
Wherever possible, an attempt has been made to relate the fluctuating pressures tothe mean flow field, which, for this particular wing panel, is dominated by a leading-edge separation which appears to give rise to Rn approximately two-dimensional flowof the 'bubble' type, with reattachment onto the upper surface of the wing up to about110 of incidence (see Figure 31). It is interesting tG note that while the low-
J frequency fluctuations reach their maximum intensity when the reattachmient line liesalong the trailing-edge of the wing, the sharp rise begins much sooner - at theincidence corresponding to about 0.3c, for the forward transducer, and 0.5c for there..rward one. fivergence of the trailing-Pdge static pressure, which is often usedAS at cIt-irl for the onset of the typo4 of wing-buffet associated with ;hock-
,, u,,,,., t he. flow over thei rearwari part of a wing, o'rur!; whenre atteh-ment reaches 0. 8c, so corresponding to nearly maximum intensity of the low-frequency
Best-Available Copy

22
fluctuations, rather than their initial ritse; it would seem, therefore, that this
criterion is not directly applicable to buffeting associated with leading-cdge flow
separation at low speeds.
It seewq likely that the m rked increase in intensity of the low-frequency pres-
sure fluctuations as the incidence increases from 80 to 100, (see Figure 32b) is a
result of the appearance of significant fluctuations in circulation, associated with
intermittent chunges in tne flow structure; although the near nosition of reattach-
ment. line Is still well forward of the trailing-edge of the wing at. these incidences,
its instantaneous position may apnroch, and perhaps reach, the trailing edge
intermittently. Since tapped holes are provided in both sides of the type of the
transducer shown in Figure lb. either surface can be connected to a steady datum
prpssure by means of a metal pipe leading to a reservoir outside the wind-tunnel;
the total Intensities of the prssure fluctuations on the unper and lower surface,measured in this way at 0.85c. are compared in Figure 33a with t1.o fluctuating
diffPrentia) pressures; it imy be noticed that the rise in total intensity on the
lower surface with increasing incidence is similar in form to that shown by the low-
tr-quency tluct.uations of the differential pressure in Figure 32c. The spectra of the
lower-surface and the differential pressure fluctuations at 0.85c and 140 incui,nce
are compared in Figure 33b; they show a marked similarity up to n = 0.5, the lowersurface intensity being about one fifth of the corresponding differential values in
this range. Above n z 0.5 the lower surface intensity falls off rapidly until,above n - 2. it corresponds to a normal turbulent boundary-layer level.
These results all sapport the view that the large low-frequency content of the (fluctuating pressure field, at incidences above about 80. is associated with fluctua-tions in circulation, and that the chordwise correlatinn in this low-frequency range
is likely to be high. It seems reasonable therofore to use, as a criterion for com-
paring the effectiveness of modifications, the first rise with incidence of the
value of VnF(n) at a particular low frequency, and at a point sufficiently far backalong the wing chord for most of the wing surface to be affected (see chordwise
distribution of total intensity on a similar wing - Figure 26).
4.3.3 Wing panel xU:," 30 leading-edge sweep
Pressure fluctuation measurements have been made on the wing panel shown in Figure 34.
Surface flow patterns indicated leading-edge flow separation, with reattachment on to the
upper surface of the wing, very similar to that observed on the unswept panel just des-cribed. Three transducers were installed as far back as possible (at 80% of the wingchord), as shown. The variation with incidence of the position of the reattachment line,
at the three chordwise sections containing the transducers, is shown in Figure 34, and
results of the pressure fluctuation measurements in Figure 35. It was expected that the
critical full scale frequency range would again correspond to a value of n of about 0.2.,
and it is suggested that the incidence at which the value of Vn-Fv), at n = 0.2, has
risen avpreciably for any of the three transducers is a reasonable criterion for com.-
paring the effectivene ss of modifications, as for the unswept wing panel. Ho-ever,
becaus" of the more shallow initial rise in the low-frequencpy intensity. compered with,hat ,, th,. insw,.pt win. parnel, the incidence at which vnF(n), at n = 0.2, first
reaches 0.02 rather than 0.01 would probably yield a more reliable comparison inthis ease.
Best Available Copy

23
4.3.4 Lo,-aspo'ct-ratto highly 'vpt rings
On wings of this class, surface flow patterns suggest that leading-edge flowseparation gives rise to the vortex, rather than the bubble type of flow; themarkedly three-dimensional nature of the mean flow then makes the choice of suitabletransducer positions, and the interpretation of the results from them, much moredifficult. However, sowe measurements have been made on the w-ng shown in Figure 36ising, in the first instance, four transducers at the positions indicated, but sincethe re ,,u!tg obtained showed little relation to each other at any one Incidence. atraverse of the upper surface of the wing was then made, using a single transducerfixed in the body together with a 16 in. length of pipe. The pipe ended in a pieceof metal plate, 0.040 in. thick and 0.25 in. square, which was faired into the wingsurface with plasticene, the pipe inlet being through a flush hole drilled in thecentre of the plate; tests showed that variation3 in fairing shape were unimpcrtant.The traver3e results, for n = 0.2, showed excellent agreement with the corresriondingresiults obtained with the four transducers let into the wing, although the formerrelate, strictly, only to the pressure fluctuations on the upper surface of the wing,while the latter relate to the fluctuations in differential pressure.
From tho dat. presented in Figure 36, and corresponding data at other incidences,it appears that the dominant pressure fluctuations are confined to the part of thewing directly below the vortex. Very much more data would be required before anestimate of the fluctuating normal force could be made; though it is possible, ofcourse, to estimate the maximum intensity of the normal force fluctuation, atn = 0.2, consistent with the local pressure fluctuation intensities, by assumingfull correlation throughout. The ea.a.-square intensity of the low-frequency pressurefluctuation, that is nP(n) at n = 0.2, has been integrated over the wing surface forthe data shown in Figure 36. assuming unit correlation, and the result expressed as amean over the whole wing area. The r.m.s. intensity of this quRntity Is n.013 fr _hccase illstrated, and its variation with incidence is shown in Figure 37, but unlessit can be shown that the correlation is approximately constant, and independent ofboth incidence and any modifications which might be made, it is difficult to see howthis, or any other, simple function of the data can be regarded as a reliabl.e criterionfnr purposes of comparison. The possibility of direct measurements of the normal-force
fluctuation is therefore under consideration, as an alternative approach.
Another interesting result was obtained on a wing of this class: this was a delta-wing with 81o leading-edge sweep, in which a single transducer was installed, forpreliminary measurements, at 75% of the centre-line chord behind the nose and at 70%of the local semi-span. The results obtained are shown in Figure 38; it will be seenthat the iaximum intensity recorded is low, and even this is apparently confined to anarrow strip directly below each vortex, the peak value of vn(r) for n 0.2 occurring
when the vortex passes over the transducer position.
Further experiments have begun, with the object of determining contours of the low-frequency pressure fluctuations on a wing with 600 leading-edge sweep; these measure-ments are of particular Interest, as there is a possibility of comparative full-scalpdata being obtained in flight. Preliminary results show levels of intensity under thevortices of the same order as those measured on unswept wings. This is not necessarily,urprising since mean-flow measurements in wakes have suggested that thc vortex strur-Lure cau;3e'- uY leadilg-edKe I'low separation may change fairly ahruptly with Increau -Ing angle of sAeep; at moderate angles of sweep the vortex cores appear to be diffuse
Best Avmailable Copy
and to f.xhibit either an instability or a large scale turbulent structuro: at hightingles of sweep - above 700. it is thought - the vortex cores contract markedly,exhibiting high velocity components and no noticeable instability. Experiments arecor'tlnting for the purpose of examining the pressure fluctuations associated with (thoso different types of vortex structure.
S. CONCLUDING REMARKS
The technique described in this paper has been proved, by use, to be satisfactoryfor the measurement and analysis of pressure fluctuations on wind-tunnel models atlo, speeds and, as indicated in Section 3.4.1, there is no reason to suppose that theadditional difficulties arising from its use at transonic speeds - in so far as theyaffect the design and operat.on of the transducers and their associated electronicequipment - cannot be overcome. It remains to be proved, however, that the air flowIr a transonirc wind tunnel can be sufficiently steady for useful results to beob tai ned.
The applications of the technique to the low-speed investigations, described in-;ome detail in Section 4. suggest certain broad conclusions in respect of Its suita-hility for particular classes of problem and its general limitations. These mayu:,,fully be summarised here:
(a) The technique is especially useful in fundamental research, since it provideslocal data in flow fields where other techniques (e.g. the hot-wire anemometer) (cannot be used at all; some progress has already been made in relating therature of the fluctuating pressure field on thin wings to the mean-flowstructure, and further experiments (particularLy if th-v includAe rorre-Lionmeasurernts) may be expected to lead to a much greater understanding of theorigins of the aerodynamic excitation which causes the full-scale vibration;
(b) When applied to specific cases of aircraft-buffet, tie techniques described canoften be used, with fair certainty, to predict the effectiveness of modifica-tions designed to reduce the buffeting:
(c) The approach is not, in general, suitable for determining the resultant loadfluctuation on a large area.
Jt should, perhaps, be emphasized that buffeting is regarded as the forced vibra-tion of an aircraft structure, and that the present technique is intended solely forexamination of the aerodynamic forcing excitation. However, the level of vibrationto-which the structure will be subjected depends also ipon the aerodynamic and struc-tural damping, so that knowledge only of the excitation cannot be expected, ingeneral, to provide a sufficient indication of the onset of buffeting. This limita-tion must also be shared, to some extent, by all other techniques which aim at7weasuring aerodynamic excitation on rigid models, such as load or moment measure- (
Iments. and it would appear that it is not completely overcome by techniques nvolving
'tthe measurement of vibration levels on dynamic models. These involve all the problemsu ( o,,ntered in wind-tunnel flutter experiments, with the additional difficulties thatthere would be no precisely defined critical vibration, comparable to the self-excitedflutter oscillation, and that, even if an accurate allowance could be made for differences
Best Available Copy
between the model and full-scale aerodynamic and structural damping, the tolerablo
level of vibration. full-scale, is not likely to be known.
SOn the other hand. it may often be assumed that the onset of buffet, should it
occur, is likely to be sharply defined. A sharply defined change in the irtensityand scale of the aerodynamic excitation might then be taken to indicate that thelikelihood of buffeting exists and, to this extent, to provide a comparative criterion- that is to say, a criterion which may be used in cumpailiIg dIfferent cdr"_c:; of th'same type. It is in this sense that the present technique has been used for the
prediction of the effectiveness of modificationsdesigned to reduce buffeting.
REFERENCES
1. Sc',uh, i. Wide range amplifier for turbulence measurements with
Walker, D. ndustable upper frequency limit. (Unpublished M.O.S.
report).
2. Owen, T.B. Low speed static and fluctuating pressure distributions
on a cylindrical body with a square flat plate airbrake.
C.P. No.288.
3. Fail, R. Preliminary low-speed wind-tunne! tests on flat plates
and air brakes: Flow, vibration and balance measure-
meats. C.P. No.251.
4. Fail. R. Low speed experiments on the woake characteristics of
et alii flat plates normal to an airstream. (Unpublished
M.o.S. report).
de Bray, B.G. Low-speed wind-tunnel tests on perforated square flat
plates normal to the airstream: Drag and velocityfluctuation measure~rtis. C.P. No.323.
3ctAva1rbla Copy

CC-~AiA CAB~LE -
CrENTRE CONDIJCTOPQEAP PRE55URE WNOLE SOLDERED TO REAR
PLATE CONNECTION.
:ASINA, E CLIP CONNECTINCT OUTEl8'R55 CONDUcTOR TO CELL-. CASIN(q.
1w IN&%uATION .- ~M(BERYLLIUM COPPR)
-FRONT CONDENSER PL-ATE
y n ER C~lNE (BERYLLIUM COPPER DIAPHCA(CM)
oe P-AT (BRSS)FIRONT CASINQ
1 (BRASS)
FRONT PRES"UE H~OLE-
(dl .- in. press'ure~ transducer
~5U~ -O~.EINSULATE3 CONDIJCTORSOLDERE L M REAR
PLATE CONNECTION
(BRAS)
LIXA' N~ir tlN
v INNER CASI~
'AA
.- )INSULATIONTUFNL 8.- ,5HIMr (BERYLLIUM COPPER)
Qtxg(BRA FS E RON 7 CN DNSER PLATE
TT (E '-LUM COF'ER DIAP-HPAGri)
FCONT CASING
(BRASS)
IC, 0. S 10
5CAtE iN
S0.3"7 in. pr,'ssurre trans~ducer
pFsz. 1 Exploded'I ;e(t ions of capacity-tYPe' pressure' transduicers,

-APAC rr'q TYPE
SPRESSURE TRANSCUCER
2-CO-AXIAL CABLE (UP To 2oFT LONG)
~J SOUTHER4N INSTRUMENTS
5CoRF. SCREENED CABLE (LIPTO 1-30PT. LON 44) Amp.x M1ODEL 306-0
TWO CW44NL
0 OUT4Ek.N ImS-,RUMENTS AEPC5E
PRE-A MPLIFIER TP CR
0 ~ ~ 2 NSTRUEf
0 0C VOLTmETER 0 0 OStILLATOR
__I
AMPEX MODEL
ATIENUATOR REORDt~
Wic ADDITIOwALL - A04PLIiE.R .MPLIFIER
b.C GILVIN*VIR N AMPEX MOD
THE.RIMO-JUNCTION OUTPUTPLYRC
___________________ LECTRON'
1F51 Loqk"nTHMIC
I I Po~aNT s 0ETER0
I 000000000
0 OW FREOUENCY"i ODEL
12 CHANNEL~
OE~ MUI~AO..PAMPTRADA PLO0PCSWAVE ANALYSE~ PLYBC
0o 0 TYPE D4900 0
0
1111 0 ~ f0000
D.C CIALVANOMETER ONT64ERMO -JUNCTION OUTPUT
Fi~ 2 G.rwral arrangement of appatrativs for mpastrmmint and analysik of' prps-ure'
fluctutiofls

In
I- -
on or)
oo0
C
too
0 0
&:)Nanbai QdNfl.i Ly -30fl-ldWO)'
acn.L*IdW

PREAWMEtR,OLJT"U
(VrJT
* -2
AFTER
(a) Dlirect transducer calibration
TRANSDUJCERSENSITIV[TY FALCOR(VOUTm/IS WATER)
04
AFTER1TESTL1I~ RUNT ~ocs
(h)Trns'iEr FORiitE aco
~ *~ Typica) translucer calitioaneitvity fa ctor
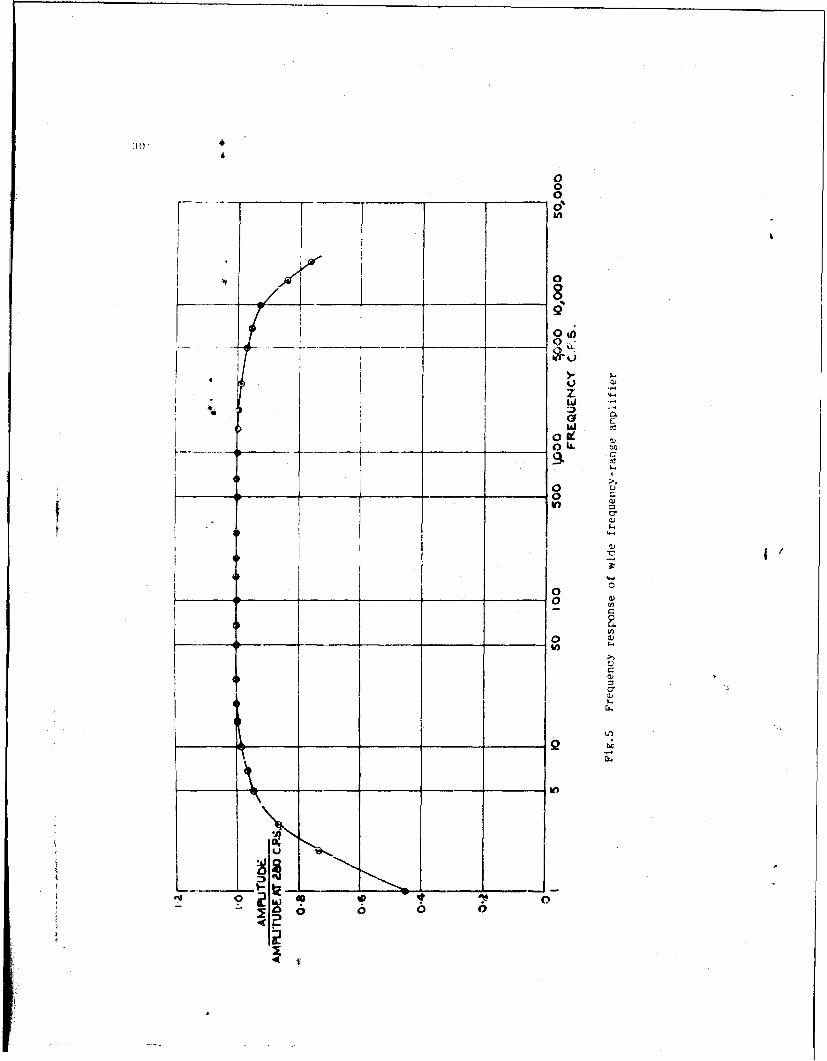
4
0
0
-~1.1 A] 1.8
9%
0.0
4 ,- ~-
4~) a)
2:w*
EI~1 ~*d
___ a)
*~~-~~1~~~~~ - CI I-
o0 C
I II - a)
I a)-C
*1 ___ ___ ___ ___ 0 0__ __ __ __ __ C.){ 0 1f~
I -
I tj~
____ ____ I ____ 0 a)
-- -- ~, 1 40
Ca)
a)S..
Q b
U,
-I-2

31
1 - r r -
iy ~o4
3 s 1 o 10 o .0 100<oo2,0
00
'II
30 50 00 s00 t o .000 50 6 000 l,000 w
ANALYSR REQUENCY C.PS
(h)Orv ral aal (a)e sstiredy fadcth raoe 4r n233
(Thefi~nre~a. th g.mna bandidh anatyn;Pr caadthr' uNcuverfes h
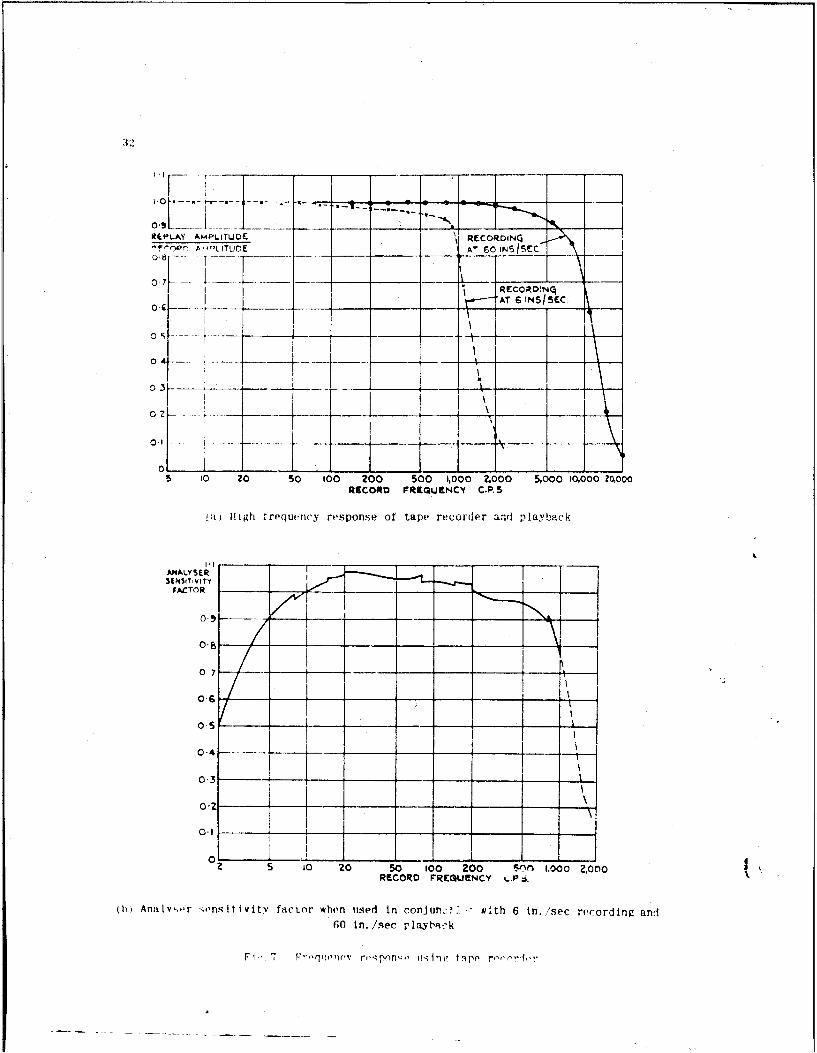
REPLA kMPLIrLJOCCRDNC
0Ir AT Is.INS/SEC.
0 1 AV-A-___ --
5 10 20 s0 t00 200 5009.1000 2.000 5,000 10,000 M000RIECONO FREQUZNCY C.P.5.
SHigh Irequency response ot tape recordjer and plaYback
5(?45jTiVI1Y
o4 - -- _ _
03 4 ----- -- L- I__ I_ _
0-3 - _ _ _
5 10 20 50 10 00 Vs~ 1000 2,000RECORD rREGUENCY -.P zi.
(h) Analvsor -;#,nsitivity factor when uised in !onJun,2; .- l'th 6 in. /sec re'cording and60 in. /see r'1ayvck
F i 7 Troqijoycv r(,";pnn,; w~im talp' rr-rnrdor
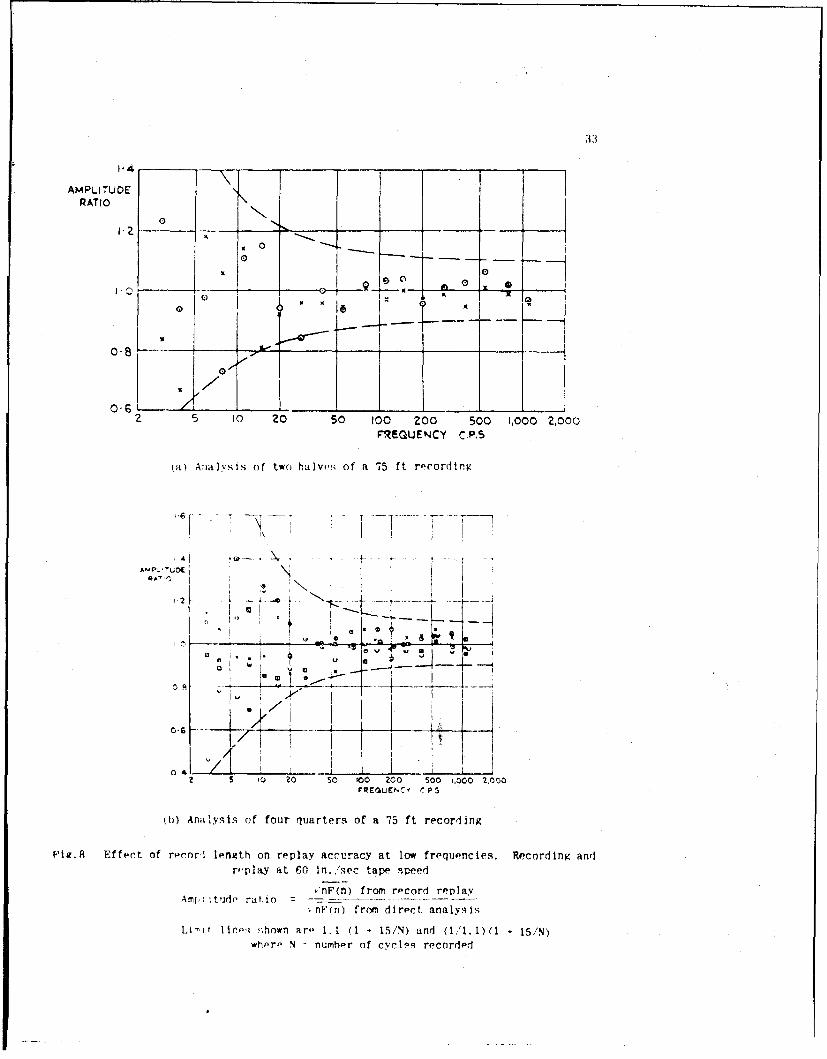
3:'
AMPLITUE"RATIO
0\
K
K
0.81- x 0
00r I Zz 5 10 20 50 100 200 500 1,000 2,000
FREQUENCY C.P.S
(a) Analysis of two halv,; of a 75 ft roeording
-,f. ..T - ( " -T T . . .. . . .. .
6 I I
IIL
2 0 2 s 6 0 50 e4A .00 ,0
I I
EQUENC .
(b) Analysis of four quarters of a 75 ft recording
F'i.8 Effect of recorI length on replay accuracy at low frequencies. Recording and
rplay at 60 in.,.sec tape ,peed
,nF(n) from record replayAm;IH tudo ratin -
SnF(n) from dirpet analysis
Limit lin,,; s;hown are 1.1 (1 - 15/N) and (1,11.1)(1 + 15/N)whorp N - number of cycles recorded
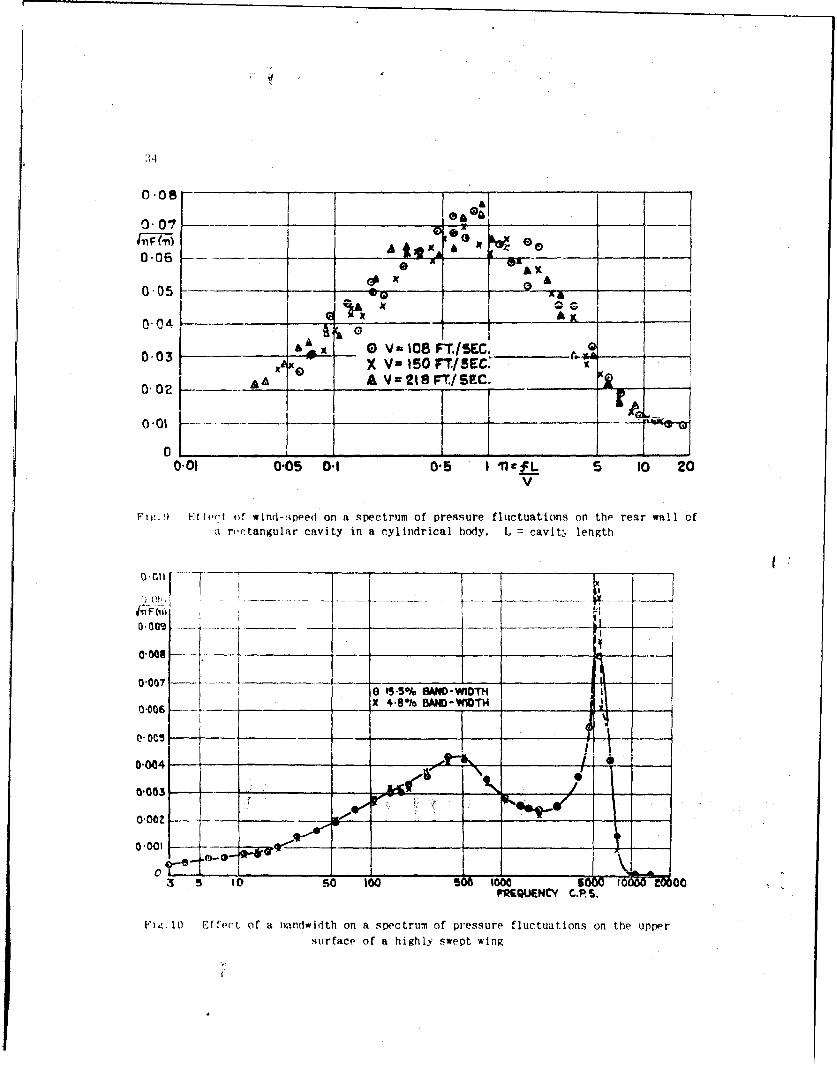
34
.07 __
4,n F (-ni) Ajg3A0.06
0 .0 5 [ -X
A
&
0 . 0
() A xI x'A
0.03_-___ __ o V-I18 FT.ISEC.__ __ _
X, xe X V- ISO FT(SEC:A A v =.2 /FTC. SEC
...... L1..~ ..._ _ __ _ _ __ _ _ _ _
0-01 0'05 0.1 0"5 I 'rlfL 5 10 20V
Hg. F:ftc,,t of win(l-:ped on a spectrum of pressure fluctuations on the rear wall of
a r,,ctangular cavity in a cylindrical body. L cavit:,. length
__ ! i I ___-_
0"Q -- lX48/ -OD- T rL- I_ ___ _ __
o m I
___ j~x 4B8% BANDWICT14____ __
0.004 -_ ___ -t ~ I
0.0019
1 0 o so 10 . 1000 so'"-FKQMNCY C.P. S.
Fig.10 Effect of a bandwidth on a spectrum of pressure fluctuations on the upper
surface of a highly swept wing
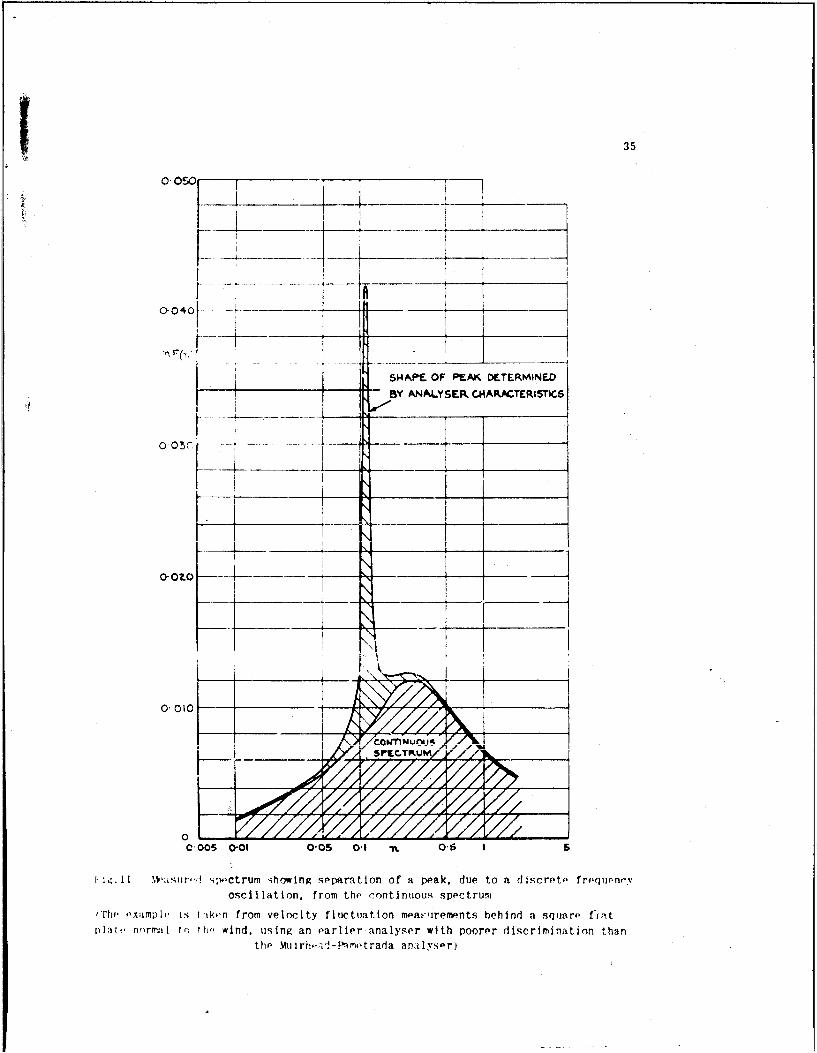
O35
......----
roo -- ,
SHAPE OF PEAK DETERMINED
BY ANALYSER C.HARACTERIST"C6
0 10--~_ rk\ ///A____
C,,TINUCAJ19 I
0005 001 005 01 0. 1 S
I. 1!. 11 Wsur-! spoctrum showing separation of a pak, due to a discrete frequ-nr.
oscillation, from the contintious spectrum
(The oximple is t 4ksen from velocity fluctuation mea.,:'jrempnts behind a square fitplai' normal to, iho wind, using an earlier analyser with poorer discrimination than
the M rh~~v!-FPmtrada analysarj

36
l;F( ) I
oca --4 - -
I __ _ __ __ _
,03,
S O s 00 500 1,000 ZOOFREQUENCY C P S
,a) Direct analysis. Analyses before and after recordings
- -
0
' 10 s0 Soo 500 C t,000FREQUENCY C.5.S,
(I) Recording at 6 in./sec. Replay at 60 in./sec. Three 75 ft records
0
FTI .... L! o o ,, .,
5 10 so 100 500 1,000 Z,030FREQ.,.UENCY C.P. S.
(c) ,.ording at 60 in. isec. Replay at 60 in. 'sec. Three 75 ecordis
Fiv.12 Comrnralve measurements of a spectrum of pressure fluctuations behind aspoilr obtained by direct analysis, and by replay of recordings M.de at two tape
speeds
The full curve of Fig.12(a) is repeated In Fig. 12(h) & 12(c)

37
/N Cw, A-
Fig' 1 &3r. for comparative pressUre.fluctuto MOW rmpn., two' willdtunn,,.

38
____ VOR____
W~N-T~~4CL~WIN-T ND-uNE
Wirh HOMM1OMB
IN- TP4NEA.
.3 10 so 100 50 10FREOLIENCY AT IOOFT/SEC.
Fig. 14 Pressure fluctuations on a wing in two wind tunnels (see Section 3.2)

39
se
aa
90 -
CC
______t

40
TO .TO
TRANSDvCERI TkCAN3DUCEYA~
I i_ _ _ _ _ _ _ _ _ _._.
TO OSCILLATOR
(a) Connections-. for measuring vA
r-o -£7; - ':[[2
TRA5DUCER TKANSDUCER
A J ] -IC "5 Z CA -
I I
TO OSC ILLAT"OR
(b) Connections for measuring VB2
TO " TO*° 5:--•---------
!C ; A
I -I II I I
I I
TO OSIL.LATOR.
(c) Connections for measuring V B
FIR.(16 Circoit variations for correlation measurementsC ad ils! Fd to he qI to C (the capacity of trasducer A an d its connecting cable)
C adjusted to be equal to CA (the capacity of transducer A and its connecting cable)

41
~- LOCKING RING(BRASS)
REAR PRESS3URE HOLE
INNER CASING
-INSULATION STUCK TOGIETHER(rlUFWOL) WATR ARALDrTE
CEMENT
REAR CONDENSERFINE THREAD0 (100 o, .) PLAT (BRASS)
FOR 5ENSITIVITYADJUSTMENT
(BRASS5)
RETAINING RING
rZ/ 'RONT CASI NG(5RASS)
DIAPHRAGM PRSSED INTO FRONT CONDENSECR PLATE
CA5ING WITH RETAINING (5ERYLUUtA COPPCR DIAPHRAGM)RING AND TE.NSIONED BY
5CREWINC DOWN OUTER CASIN(G00. .
SCALE IN4S.
Fig. 17 'Expioderl sections of a prototy- ransducer for the measuremient of high-frequency pressure fMuctuations

42
WIND BD
R-Oi*JDED REAR BULKHEAD
008 -
0 04
- -ROUWrf D REAR-- BUL KEAD
005 01 05 1 0Is t
(a) Bulkhead transducer
0 04
0.02
BULKHEAD
0.05 0.1 0- 11t--1
(b) Body transducer
Fig. 18 Effect of rounding~ the rear bulkhead on bomb-bay pressure fluctuations
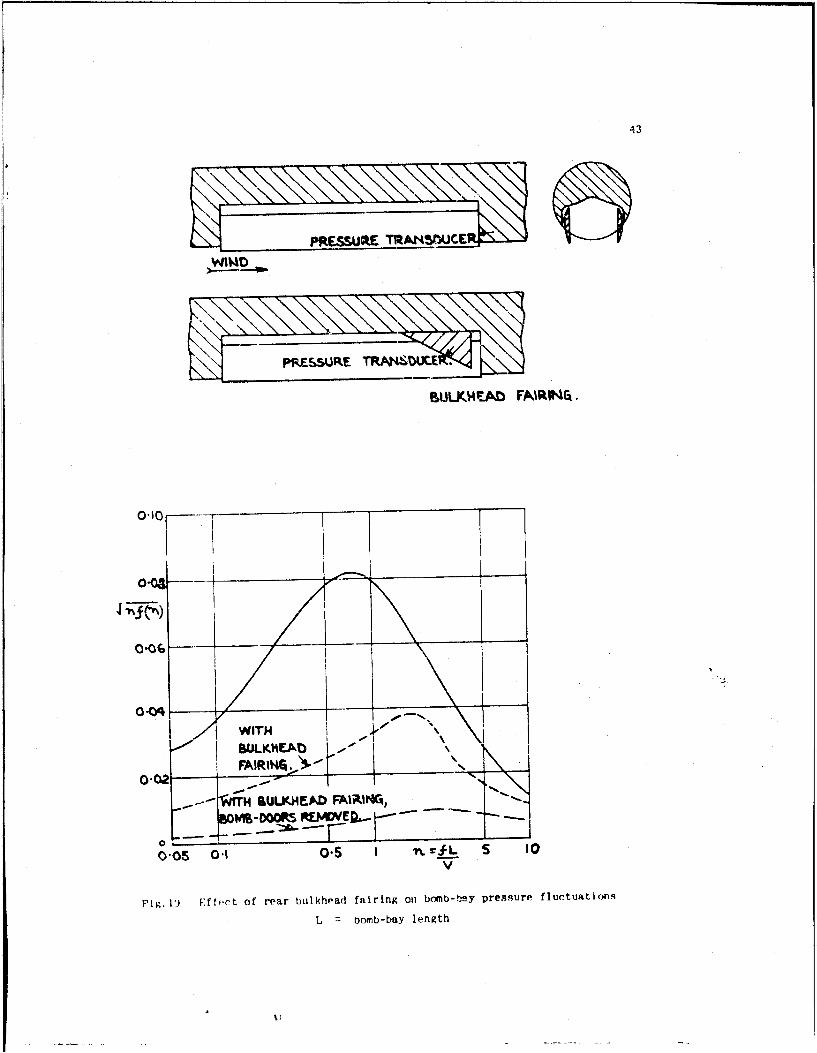
BULKHE-AD FAIRIN~k.
_ K4I A WITH
WLKHCA~bj AIRIN15.r~ _I___
,- IrATH SULKJ4EA. FARNWA,14DOMPPMEMM - -
0.05 0-1 0-5 1 n zfL s 10V
Fig 19 Fff,.ct of rear bulkhe'ad fairing on bomb-tay pre.,sure fluctuations
L m bomb-bay length
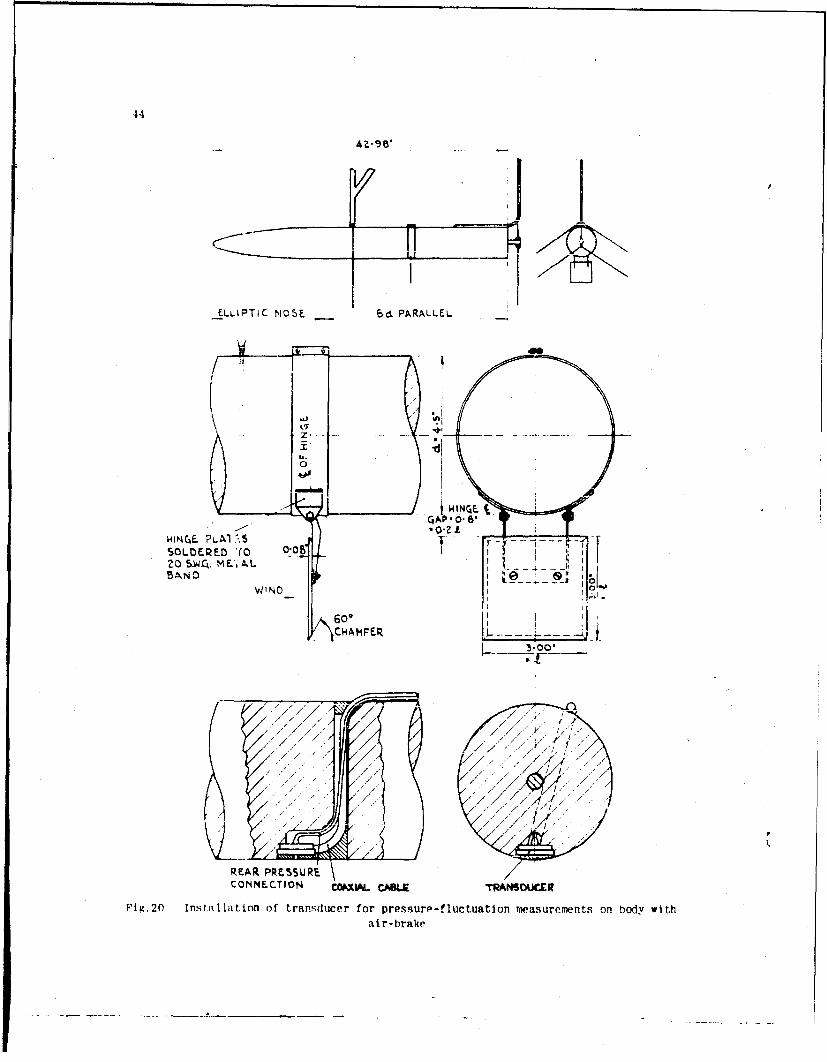
44
ELLIPTiC moSE __ 6d PARALLEL
0
wi4ICE. PL.A1 tSSOLDERED .(0 00B20 S.WrC4. MEL ALBAND EN A, L
so*0
CHAFE
RE / PRESU 7CONCTO 'OXI /AUTASUE
Fig20 Intalaio oftrnsucr orprssm flctatonimsurmetsonboy itair-brak
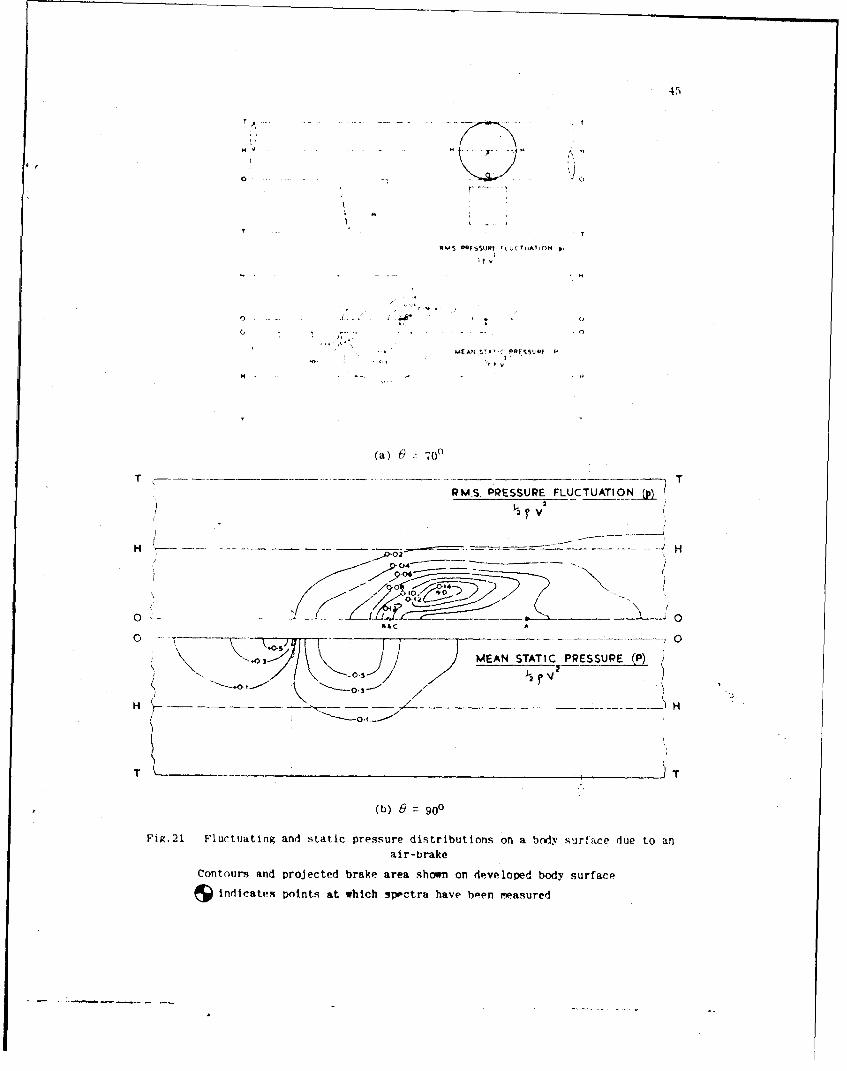
Rt$ POFI SUP FtU(ITuATIOM (
... .. .--
(a) t)- 70 °
SRM.S. PRESSURE FLUCTUATION_(pi
H- H
-..... 7
o0 0i ".o / / MEAN STATI C PRESSURE _P.
H H-" /
(b) e 900
FIg.21 Fluctuating and static pressure distributions on a body surface due to an
air-brake
Contours and projected brake area shown on developed body surface
i indicates points at which spectra have been measured

4(;
A ON S , I E41,. IO BRAKE klINGE01 oN 1-61t BEHIND BRAKE. H-I/00'9 ON r AT MAIMUM P"/q1 .
0?? CUSTR?. LINE AT MAKI MUM O-13 L
0-07[ -
O'* 1- .. .. . . . . ' \ _ _ ,-. .
o .I . . ....... _ _ _ -_ _ _-_ _...._ --_ ----0-00 06100 -1 5 -
BV
-' ~.< . - ,_ , !--...
o '4 -
0.0 - 2
o o r~ ~ -
" - .... .... - . ..." " - - . ..
0.005 0 0 005 0-10 Y. . 0 "5 I.0
V
(a) 09 700
0"0
. ..._____... . .... - -- - -
00
0 04
0"0€ , 0'0. 0-0OS 0-10 .f., ., 0" '
v
(b) L9 = 900l
Fig. 22 Pressulre fluctutiton ., ctrtt meas~red at points indicated in Figure 21
x -distance of pressure transducer behind braike hinge-lineT) distance of pressure t.7ansducer from t measured round body surface
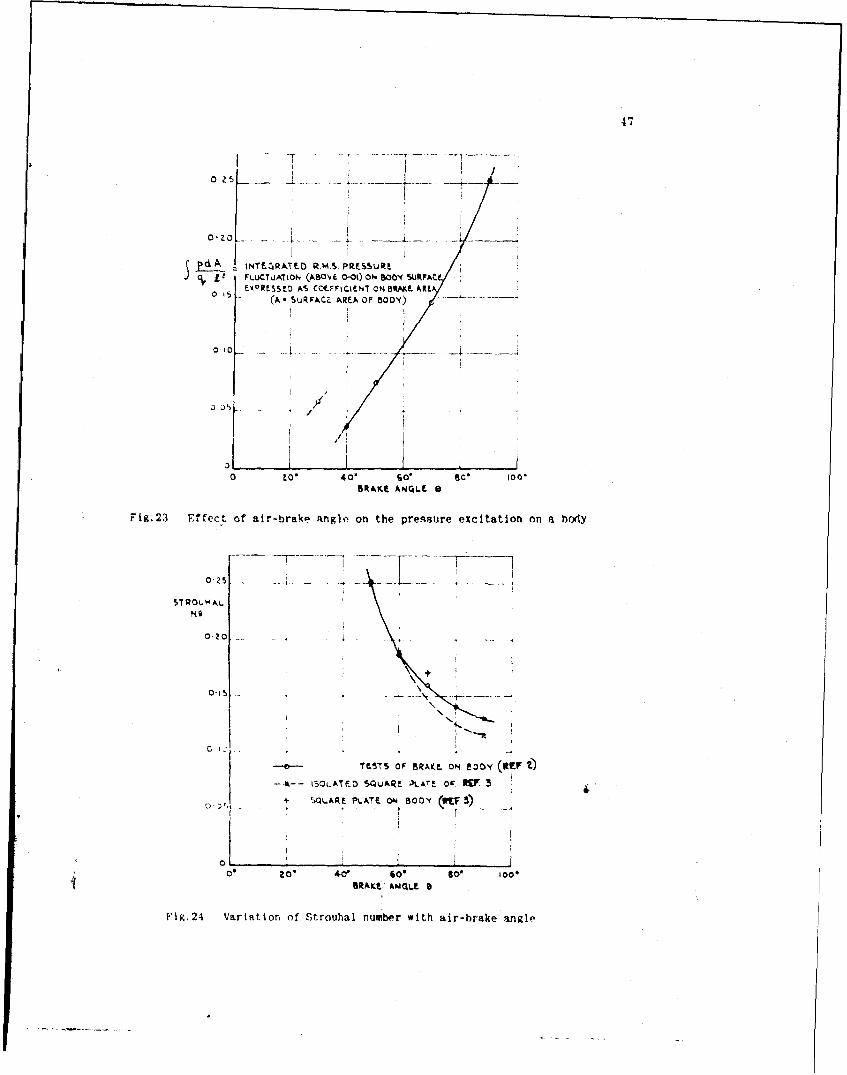
47
pdA IMTE. RATED .M.S PRESURES FLUCTUJATION (ABOVE 0-01) ON 80Of SUFAt
_ARES3AS COEFFICIENT ON BRAKE AkRO5 (A- SR~kCL AREA OF BODY)
o~ ~~5 UO- R---
0 10
0-? ~ z- 0 o, 5. 1
0 .
0.0406' 0
T LIT S O A KE N0 0 IfFZ
F'ig,24 Variation of Strouhal number with air-brake angle

00
0-
bL
0)fc-
zq c
0 NA
41&
J-

49
00
0.10K
Oldo
04
0i6
0
00
914
0,
Pig.26 Chorc1lt;p distribution of pressure~ fluttuations on wing shown in Figure 25.nacelle on
2distance from wing leading edge. c z wing chord

-- EFCRC PONT AT % I Oc---- RPRENCE POINT AT x OSc
R WINC4R~} IN C OENCE
0K.
I. u
RX C
00
Rxx
-0
10
1 0 O O *.. ... ...
27x 14rdis vauto fcreaincefcin nwn hw nFgr
nacll on
0 'maue rmwn ecigeg.czwn hr

&6WING,
NC
0 0.a 0-4 06 r/C. 081.
Fig. 28 Smooithed chordwise variation of correlation function on wing shown inFigure 25. Nacelle on
r di::tance apart of measuring points, c wing chord
OIII
0-- x -----
Oz ~/AT8
I' J
F'ig.29 Va-tation of seetlon normal-force fluctuation on wing shown in Figure 25.Narelle on

I L~o
0* Z
0 IL
5
0 4 ~ '/ 8.
Ri.3 Chrws 10tolo ore~incefceto w hw nFgr 5
Nael n0igicdne4
x O.8c c wiTOchor~ ft~d ' masurd fom he wng ead nTE NSIT

53
O'85c
BUMLE cBGUNDAR,'
'0~& i D 00
SECTION A A P0 ITIONS OF
PRES5URE TRkNSDUiCER5
A -A
5oDYPLAN VIEW.
(a) Details of model
x
0 8 r2 IG
(b) Vrariat ion of bubble~ length with incidence
Fig.31 TU1nswept wing with sharp leading edge

0.12,
0.10.
0.0, LK
04
0a 2IC 8 t 12 14 16
()r. m.s. pressure flUCtuatn
0050[
0-03
002
0.02 0.05 0.1 0.5 I 5 10 20
(b) Spectra of pressure fluctuations at 0.85C
0-06 - 7JLV0051 T
0-02- 1
0 2 4- 6 8 10 12 14
(c) 'Low fro,(IMICny COMponent' of pre.;sur-P fluctuations
Hg.3 'nswept sling with sharp leading edge. Fluctuations in pressure differencehetwoefl upp~r and lower surfaces

010-
UPPER TO LOnWER SURFACE__A A___K "T- 1, i 1
LUPPER SURFAr-E ONLY0-o_ - _ -4--
SLOWE. S)RFNCE ONLY
o- 2 -
(a) r.m.s. pressure fluctuation
1 IPPER TO LOWER SURFP.,-E0.05"
Cr00a
LOWER~ SrwFAj.F nui V
0-i1
oC. 0-05 01 c& I 5 10 50
.h,,-ltra of prfessure fluctuatinns, Y 140
FK. ' 3 Ur-nwp wing with sharp leadirg edge. Comparison of oressure fluctu i w,:on upper and lower surfaces. Transducer at 0.85c

Tv*r!PL SE:& 5VCTION .
90DY
INNER.
* MICOLE.
* OUTER.
(a) Model details
The three transducer positions shown thus are st 0.80c
0-4-
u-2 L/
I ICEE
04 .. . - . .. . . ...,A .
0.,4 .... /e n ieep/
t 2/ -
M ,L /j
W4NI ' I0 I ,,
WIH It~ac.Ib NcC..
) oi'ti on of attachment point at spanwtse postb'ns of rressure transttcer,
FiK.34 Sharp-edged wing with :00 le+ading dle swep

57
o... . .. . . / S:t\,', ..
Z, LA A%3C / ,".. S .
'
//,
0 0,,1//,/
r
T-
.. /
* 03
* /0' --4
(a) r.m.a,, pressure fluctuat.ion at the three transducer positions
o-t - r- * ... ./ -Y .- t, 1-,..
0' . i * - I *.' ,i
006 - '
003 .
002- -I-NE
00 005 L5 5 0
(( i'r SpeCtra of pressure fluctutations at t hlddl t ransdcor position
MIDL
swee as shw iFiure34
003-ng mLLn c
~ 00 " -
00 -INCIEN¢ISI CE
t0
(c) %Low-trrQuency component' of pressure fluctue~tlons at the three transducer position.s
Pig.3" Pr, 'ire fluctuation maurements on a .sharp-edged wing with 300 leading e~dgrI sweep as sho~n in Figure 34
= wing mean chord

58
~OW ATTACHMEN7 I 001Z.'DUCED OM -o&sP iCEOIL7 LOW
L )(ED~ TloSDCE r1Q'&Ti0N45 1*40N -NU 0
FI tt i>ppr- s'irtfirf' (ontlr of nF(1 :-.0-it n -- 0.2 on it lov-as -r-t-ra~ir) h~irp-erlgpelwing at 80 incidence; n f-c,7V
C),aio 0 - . 4o S 80 100 4
Fig.37 Vrainof r.m.q. upper-surface value of VinF7n) at n =0.2 with incidencefor thie shnrp-edgo'd wing shown In Figure 36. assuming a correlation coefficient of
1.0 throughout
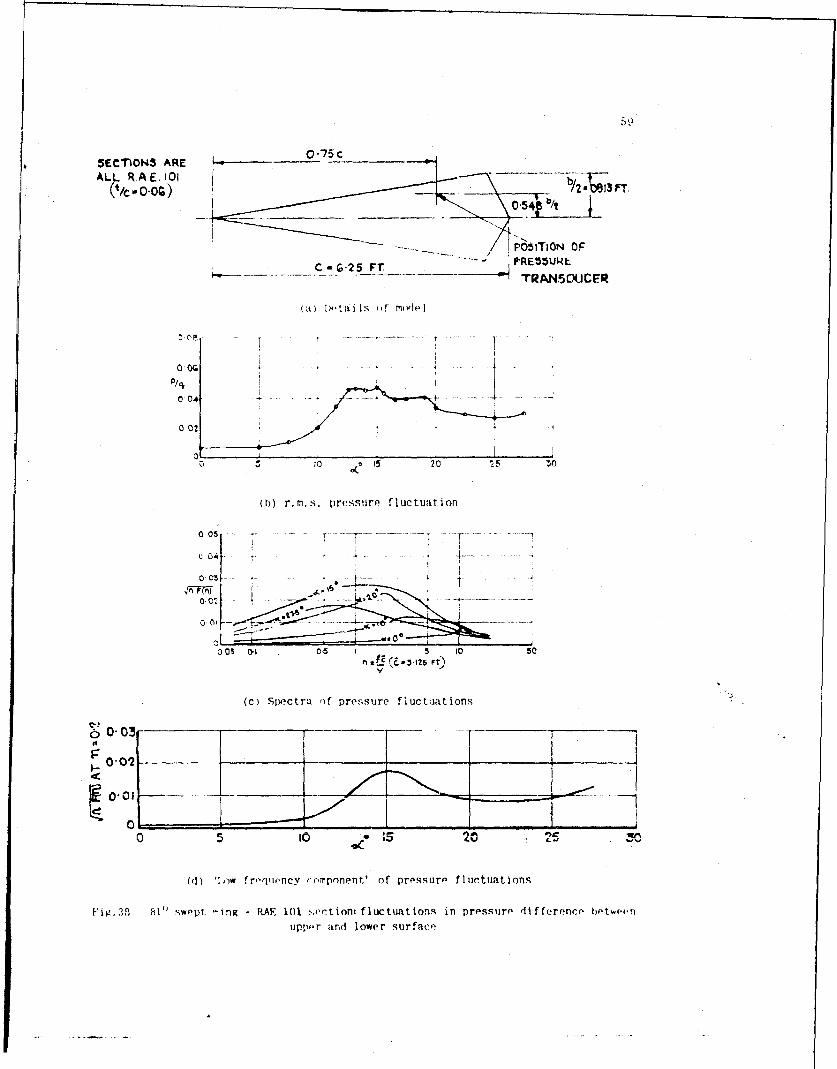
SECIONS ARE 0--75
AL ,RE.1I W/,7F
I/ P65TION OF____ CdG.5FT -- jjj~PRE55UREC - o -2 -FrTRANSOUCER
(a )O1.tail (a uf myiel
0 02
(b) r.rn. . pressure flIuc tuat.i on
04 - 4--
00S 011 05 1 5 - J 50
(c) Spectra ;)f Pres~sure fluctuations
0
(d) '1,,w fr.,qipncy 'riiponeft' of pre~ssure fluictuations
F i V. 38 fil(1 swept -ing - RAE 101 sertton: fluctuations in pressure diffe-rence, botwe'nuppor and lower surfacse
DISTRIBUTION
Cope: of AGARD publications may be obtained in thevarious countries at the addresses given below.
on peutse procurer des exemplaires des publications
de 1' AGARD aux adresses suivantes.
BELGIUM Centre National d'Etudes et de
IIPLGIQUE Recherches Ae ronautiques
ii. rue d'Egmont
Bruxelles.
CANADA Director of Scientific Information
Services, Defence Research Board
Department of National Defence
'A' Building
Ottawa, Ontario.
DFNMARK" Military Research Board
DANEMARK Defence Staff
Kastel2et
Copenhagen 0.
PRAPC' O.N.E.R.A. (Lirection)
25, avenue de la Division-Leclerc
Cb~tillon-sous-agneux (Seine)
GPRMANY Wissenschaftliche Gesellschaft fir
AIJ,)AAGNE Luftfahrt
Zentralstelle der LuftfahrtdokumentationMunchen 64. Flughafen
Attn: Dr. H.3. j. uter.
GREECE Greek Nat. Def. Gen. Staff
GRECE B. MEO
Athens.
it,:AND) Director of Aviation
ILDE C/o FlugradReykJavik
Ice Iand
ITALY Centro Consultivo Studi e Ricerche
ITAIIE Ministero Difesa - Aeronautica
Roae.

LUXEMBURG Luxemburg De1egation to NATO
LUXFMBORG Palais de Chaillot
Paris 16.
NETHERXLANDS Nethrlands Delegation to AGARD
PAYS RAS 10 KanaalstraP.tDelft. Holland.
NORWAY Chief Engineering Division
NORVEGE Royal Norwegian Air Force
Deputy Chief of Staff/Material
Myntgaten 2
Oslo, Norway
Attn: Lt. Col. S. Heglund
PORTUGAL Subsecretariado da Estado da
Aeronautica
Av. da Liberdade 252
Lisbon.
Attn: Lt. Col. Jose Fereira do
Nascimento
TURJKEY M. M. Vekaleti
TURUIEE Erkanliharbiyei Umumiye Riyaseti
ilm Istisare Kurulu Mudurlugu
Ankara, Turkey
Attn: Briga& ;,r General foat Ulur
UNITED KINGDOM Ministry of Supply
ROYAUME UNT TIL, Room 009A
First Avenue House
High Holborn
London, h.C.l.
UNITED STATE1S National Advisory Committee for
ETATS ,NS Aeronautics
1512 H Street, N.W.
Washington 25. D.C.
Pr nted by lechnicaL 9dtinfg and Revrod rtiCon Ltd
95 G- at Portland St. Lotvio, W.L.