tm9sf4: role in cancer and development · gene induce le la7 cscs a trans-differenziare a cellule...
TRANSCRIPT
UNIVERSITÀ DEGLI STUDI DI MILANO
SCUOLA DI DOTTORATO IN MEDICINA MOLECOLARE
CICLO XXVIII
Anno Accademico 2014/2015
TESI DI DOTTORATO DI RICERCA
BIO10
TM9SF4: ROLE IN CANCER AND DEVELOPMENT
Dottorando: Marianna GRECO
Matricola N° R10175
Tutore: Prof.ssa Cristina BATTAGLIA
Co-tutore: Dott.ssa Ileana ZUCCHI
Direttore del dottorato: Ch.mo Prof. Mario CLERICI

I
SOMMARIO
Il gene tm9sf4 codifica per una proteina appartenente alla famiglia Transmembrane 9 Protein Superfamily, caratterizzata dalla presenza di nove domini trans-membrana e da un grado elevato di conservazione a livello evolutivo. In origine, essa è stata identificata in Dictyostelium e Drosophila come una proteina coinvolta nell’adesione cellulare e nella fagocitosi. Studi più recenti hanno dimostrato che la proteina Tm9sf4 è espressa nelle cellule di melanoma derivate da metastasi ed è coinvolta in un processo chiamato “tumor cell cannibalism”, che sembrerebbe essere una proprietà esclusiva delle cellule metastatiche. Le cellule tumorali sono in grado di fagocitare oltre a materiale amorfo, sia cellule tumorali sorelle, sia linfociti T diretti contro le cellule tumorali stesse. Pertanto, il cannibalismo consente alle cellule tumorali di rifuggire dal sistema immunitario dell’ospite, ne promuove la sopravvivenza in un ambiente ostile, caratterizzato da scarsità di nutrienti e ipossia, e consente loro di rimodellare la matrice extracellulare e di invaderla. Nel nostro laboratorio, questo gene è stato messo in evidenza grazie alla linea cellulare LA7, che costituisce un modello di cellula staminale cancerosa (CSC, cancer stem cell) della ghiandola mammaria. I nostri dati preliminari dimostrano che il livello di espressione di tm9sf4 è maggiore nelle LA7 CSCs rispetto alla loro controparte differenziata. Inoltre, abbiamo osservato che la sotto-regolazione del gene induce le LA7 CSCs a trans-differenziare a cellule mesenchimali e provoca un aumento del livello di espressione di specifici marcatori di “epithelial to mesenchymal transition” (EMT), suggerendo che il gene potrebbe essere coinvolto in questa transizione.
Lo scopo di questo lavoro è l’identificazione della funzione di tm9sf4 nelle cellule normali e tumorali. Basandoci sulla considerazione che tutti i vertebrati mostrano conservazione nelle vie di trasduzione del segnale coinvolte in processi come la diramazione di tessuti che si differenziano in strutture tubulari, la migrazione cellulare e lo sprouting, abbiamo studiato il ruolo della proteina nello sviluppo embrionale di zebrafish (Danio rerio), che è stato recentemente indicato come un modello adatto allo studio delle malattie umane e dei processi associati all’oncogenesi. Inoltre, il processo di EMT è stato proposto come il principale elemento guida sia per la morfogenesi durante lo sviluppo embrionale sia per la progressione dei tumori, coinvolgendo processi cellulari e cascate di segnale molto conservati.
L’espressione di tm9sf4 è stata analizzata mediante RT-PCR su RNA provenienti da embrioni a diversi stadi di sviluppo e tramite WISH (Whole Mount In Situ Hybridization), realizzando in seguito sezioni istologiche degli embrioni ibridati. Sono stati eseguiti esperimenti di genetica inversa (loss-of-function), iniettando embrioni allo stadio di 1-4 cellule con oligonucleotidi antisenso (morfolino), allo scopo di reprimere l’espressione di tm9sf4, utilizzando sia linee wild type sia la linea transgenica tg(gata1:dsRed)
sd2/tg(flk1:EGFP)
S843. Successivamente, è stata
analizzata l’espressione di specifici marcatori del sistema nervoso centrale (CNS) e di EMT da parte degli embrioni precedentemente iniettati con i morfolino (morfanti), mediante ibridazione in situ e Real Time PCR.
II
Abbiamo dimostrato che durante lo sviluppo embrionale di zebrafish il gene è espresso in tutti gli stadi analizzati, da oocita a cinque giorni dopo la fecondazione (dpf, days post fertilization), indicando che l’espressione è sia materna sia zigotica. Inoltre, il gene è espresso principalmente nel CNS e, in seguito a sotto-regolazione della proteina, gli embrioni riportano necrosi a livello della testa e una ridotta definizione delle strutture cerebrali. L’analisi di espressione di marcatori di specifiche regioni del CNS ha evidenziato che tutte queste strutture sono formate nei morfanti, ma sono meno organizzate rispetto a quelle osservate negli embrioni di controllo. Inoltre, la sotto-regolazione della proteina induce un aumento del livello di espressione di fgf8, shha, wnt1 e una diminuzione dl livello di otx2. Questi risultati suggeriscono una funzione della proteina nello sviluppo del CNS. D’altra parte, i morfanti a 24 ore dopo la fecondazione (hpf, hours post fertilization) riportano difetti nella regione denominata ICM (Intermediate Cell Mass), dove avvengono l’ematopoiesi primitiva e lo sviluppo dei vasi. A 48 hpf la circolazione è compromessa e si osservano edema cardiaco e stasi a livello della coda, dove si riscontrano difetti nei vasi intersomitici, che si formano per angiogenesi. E’ importante evidenziare che l’angiogenesi rappresenta un modello per diversi processi biologici, tra cui la migrazione cellulare. In seguito, abbiamo dimostrato che la sotto-regolazione di Tm9sf4 induce un aumento dei livelli di zeb2 e twist2 da parte dei morfanti a 24 hpf, suggerendo che la proteina potrebbe essere coinvolta nella soppressione di questi fattori, inibendo la repressione trascrizionale di E-caderina e promuovendo di conseguenza l’adesione cellulare. Questa ipotesi confermerebbe i precedenti studi, che attribuiscono a Tm9sf4 un ruolo nell’adesione cellulare. Inoltre, abbiamo osservato che il gene è maggiormente espresso nelle regioni periventricolari di diencefalo e mesencefalo, dove si trovano cellule in proliferazione, che sono in procinto di migrare e che vanno probabilmente incontro a EMT. Pertanto, abbiamo ipotizzato che la proteina potrebbe avere un ruolo nel reprimere il processo di EMT durante la neurulazione. Coerentemente con le nostre ipotesi, abbiamo dimostrato che la sotto-regolazione della proteina induce una diminuzione del livello di E-caderina in gastrulazione, promuovendo probabilmente la perdita dell’adesione cellulare.
In futuro, saranno condotti ulteriori studi, determinando in quali cellule del CNS il gene tm9sf4 è espresso e valutando l’effetto della sotto-regolazione della proteina sull’espressione di altri componenti della cascata che regola il processo di EMT, sia durante la gastrulazione, sia durante la neurulazione. Inoltre, sarà analizzata l’espressione di altri marcatori del CNS mediante ibridazione in situ, per stabilire nello specifico quali regioni sono compromesse in seguito a sotto-regolazione della proteina e, possibilmente, quali sono le vie di trasduzione del segnale coinvolte. Infine, saranno studiati più approfonditamente i problemi circolatori osservati nei nostri morfanti, sia mediante un approccio di genetica inversa con specifiche linee transgeniche, sia tramite l’analisi dell’espressione di marcatori cardiaci, allo scopo di stabilire se i problemi alla circolazione siano causati da difetti nello sviluppo del cuore, o se, al contrario, l’edema cardiaco sia provocato dai difetti morfologici osservati nei vasi intersomitici.

III
ABSTRACT
The tm9sf4 gene encodes a member of Transmembrane 9 Protein Superfamily, characterized by the presence of nine transmembrane domains and a high degree of evolutionary conservation.
It was originally identified in Dictyostelium and
Drosophila as a protein involved in cell adhesion and phagocytosis. More recent studies reported that tm9sf4 is expressed in metastatic melanoma cells and it is involved in the process of tumor cell cannibalism, which might be unique to metastatic cells. Tumor cells indiscriminately phagocytize both sibling tumor cells and lymphocytes, in addition to amorphous material, thereby allowing tumor cells to escape from the immune response, promoting cell survival in a hostile microenvironment with low nutrient supplies and hypoxia conditions and allowing them to remodel and migrate through the extracellular matrix.
Tm9sf4 gene was brought to our attention by LA7 cells, which represent a cancer stem cell (CSC) model system. Our preliminary data showed that the expression level of tm9sf4 gene was higher in LA7 CSCs if compared to the differentiated counterpart. Tm9sf4 downregulation by RNA interference induced LA7 CSCs to trans-differentiate to mesenchymal-like cells and caused an increase of the expression level of EMT-associated markers, suggesting that the gene is involved in epithelial to mesenchymal transition (EMT).
The aim of my PhD project is to identify the function of tm9sf4 in normal and cancer cells. Based on the assumption that all vertebrates share common pathways involved in biological processes including morphogenesis-associated development of branched structures, cell migration and sprouting, we investigated Tm9sf4 protein function in zebrafish (Danio rerio), to further investigate its role in normal development. Zebrafish was recently proven to be a powerful model, to study not only human diseases, but also processes associated with oncogenesis. Additionally, EMT was suggested to be the major driver of both embryonic morphogenesis and tumor progression, involving highly conserved cellular processes and signaling pathways.
Tm9sf4 expression analyses were performed by both RT-PCR on RNA from embryos at different developmental stages and whole mount in situ hybridization (WISH). Histological sections of the stained embryos were performed. In addition, loss-of-function analyses were carried out by the injection of 1-4 cell stage embryos with antisense oligonucleotide morpholinos, using the zebrafish AB line (wild type) and the double transgenic line tg(gata1:dsRed)
sd2/tg(flk1:EGFP)
S843. The
expression of specific brain markers and EMT-associated markers was assessed by WISH and Real Time PCR on embryos previously injected with morpholino oligos (morphants).
We demonstrated that during zebrafish embryogenesis the gene was expressed from oocytes to 5 days post fertilization (dpf), suggesting that the expression is both maternal and zygotic. Moreover, it was found to be mainly expressed in the central nervous system (CNS). Following tm9sf4 downregulation, the embryos displayed head necrosis and an impaired brain compartmentation. Expression analysis of specific brain markers suggested that all of the targeted sub-structures were present in morphants, while
IV
they were less well organized than in control embryos. Additionally, tm9sf4 downregulation induced an increase of the expression levels of fgf8, shha, wnt1 and a reduction of otx2 level. These findings suggested that the gene has a role in CNS development. At 24 hours post fertilization (hpf) the morphants displayed tail bending and defects in the intermediate cell mass (ICM) region, where primitive hematopoiesis and vessel development occur. At 48 hpf the circulation was significantly impaired by protein downregulation, which caused cardiac edema and blood stasis in the tail, where morphological defects were detected in intersomitic vessels, which are formed by angiogenesis. It was suggested that angiogenesis represents a model for many core biological processes, including morphogenesis-related development of branched structures and cell migration, all of which are involved in the morphogenesis of many other organ systems. We demonstrated that tm9sf4 downregulation induced an increase of zeb2 and twist2 expression levels by 24 hpf embryos, suggesting that tm9sf4 induces negative regulation of these factors, inhibiting E-cadherin transcriptional repression, resulting in its upregulation, which promotes cell-cell adhesion. This hypothesis is consistent with previous studies, which suggested a protein role in cell adhesion. Interestingly, we found the tm9sf4 gene to be most strongly expressed in the periventricular regions of the diencephalon and mesencephalon, where there are proliferating cells that are going to migrate and could undergo epithelial to mesenchymal transition. Hence, tm9sf4 could have a role in repressing EMT during zebrafish neurulation. We also demonstrated that during gastrulation Tm9sf4 protein downregulation induced a decrease of E-cadherin expression level, which could promote the loss of cell-cell adhesion.
In the near future we are going to further investigate the role of tm9sf4 in EMT, by determining in which specific CNS cells the tm9sf4 gene is expressed and by studying its effect on the expression of other components of the EMT signaling pathways, both in zebrafish gastrulation and neurulation. WISH analysis of other brain markers is now in progress, to individuate the specific regions and, possibly, the pathways affected by Tm9sf4 protein downregulation. Additionally, further investigations on circulation defects will be carried out, by both loss-of-function analyses on specific transgenic lines and cardiac markers expression studies, in order to establish whether the circulation problems are caused by defects in the heart development or rather the cardiac edema is due to the defective intersomitic vessels development.
V
INDEX
1. INTRODUCTION .................................................................................... 1
1.1 From eating to feed to eating to defend ...................................... 1
1.2 Tumor cell cannibalism ................................................................. 3
1.3 LA7: a cancer stem cell model system ....................................... 6
1.4 Danio rerioas a model system.................................................... 11
1.5 Transmembrane 9 protein superfamily in zebrafish ............... 15
1.6 Epithelial to mesenchymal transition ........................................ 18
2. AIMS ..................................................................................................... 24
3. MATHERIALS AND METHODS .......................................................... 25
3.1 Zebrafish maintenance................................................................ 25
3.2 RT-PCR analysis .......................................................................... 26
3.3 Cloning and sequencing ............................................................. 27
3.4 Probes preparation ...................................................................... 28
3.5 Whole-mount in situ hybridization (WISH) ............................... 29
3.6 Histological sections ................................................................... 31
3.7 Loss-of-function analysis ........................................................... 32
3.8 Real time PCR analysis: .............................................................. 35
4. RESULTS ............................................................................................. 38
4.1 Tm9sf4 expression analysis ....................................................... 38
4.1.1 Tm9sf4 expression during embryonic development ....... 38
4.1.2 Tm9sf4 expression in embryonic tissues ......................... 38
4.2 Loss-of-function analysis ........................................................... 42
4.2.1 Injection of translation blocking morpholinooligos in
ABline ................................................................................................ 42
4.2.2 Injection of splicing morpholino in AB line ...................... 47

VI
4.3 The role of Tm9sf4 protein role in the central nervous system .
....................................................................................................... 51
4.4 Investigation of the role oftm9sf4 in zebrafish blood system 55
4.5 Expression analysis of EMT markers ........................................ 57
5. DISCUSSION........................................................................................ 60
6. CONCLUSIONS ................................................................................... 70
7. REFERENCES ..................................................................................... 73

Introduction
1
1. INTRODUCTION
1.1 From eating to feed to eating to defend
TM9SF4 was originally identified in Dictyostelium discoideum as a protein
involved in cell adhesion and phagocytosis [1], [2]. The gene was named
phg1 and it encoded a member of Transmembrane 9 Protein Superfamily,
or nonaspanins, characterized by a potential N-terminal signal sequence,
followed by a large non-cytoplasmic domain and nine putative membrane-
spanning segments. This family displays a high degree of evolutionary
conservation.
In higher eukaryotes, phagocytic cells are essential players of the host
defense against invading pathogens. The mechanisms involved in
phagocytosis by Dictyostelium cells are very similar to those used by
mammalian phagocytes. Phagocytosis involves adhesion of the phagocytic
cell to the pathogen surface, and reorganization of the actin cytoskeleton to
allow pathogen engulfment.
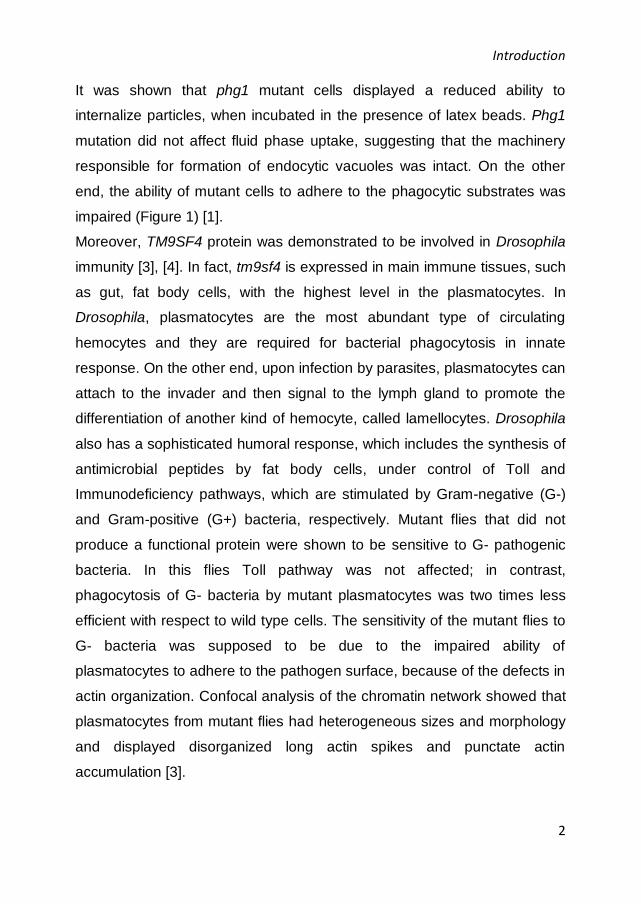
Figure 1 Scanning electron microscopy showing adhesion of wild-type (WT) and
phg1 mutant Dictyostelium cells to their substrate. Scale bar 1 m. Distinct
mutations in phg1 gene (right) cause a reduced ability to adhere to phagocytic
substrates by Dictyostelium cells, with respect to wild type cells (left) [1].
Introduction
2
It was shown that phg1 mutant cells displayed a reduced ability to
internalize particles, when incubated in the presence of latex beads. Phg1
mutation did not affect fluid phase uptake, suggesting that the machinery
responsible for formation of endocytic vacuoles was intact. On the other
end, the ability of mutant cells to adhere to the phagocytic substrates was
impaired (Figure 1) [1].
Moreover, TM9SF4 protein was demonstrated to be involved in Drosophila
immunity [3], [4]. In fact, tm9sf4 is expressed in main immune tissues, such
as gut, fat body cells, with the highest level in the plasmatocytes. In
Drosophila, plasmatocytes are the most abundant type of circulating
hemocytes and they are required for bacterial phagocytosis in innate
response. On the other end, upon infection by parasites, plasmatocytes can
attach to the invader and then signal to the lymph gland to promote the
differentiation of another kind of hemocyte, called lamellocytes. Drosophila
also has a sophisticated humoral response, which includes the synthesis of
antimicrobial peptides by fat body cells, under control of Toll and
Immunodeficiency pathways, which are stimulated by Gram-negative (G-)
and Gram-positive (G+) bacteria, respectively. Mutant flies that did not
produce a functional protein were shown to be sensitive to G- pathogenic
bacteria. In this flies Toll pathway was not affected; in contrast,
phagocytosis of G- bacteria by mutant plasmatocytes was two times less
efficient with respect to wild type cells. The sensitivity of the mutant flies to
G- bacteria was supposed to be due to the impaired ability of
plasmatocytes to adhere to the pathogen surface, because of the defects in
actin organization. Confocal analysis of the chromatin network showed that
plasmatocytes from mutant flies had heterogeneous sizes and morphology
and displayed disorganized long actin spikes and punctate actin
accumulation [3].
Introduction
3
1.2 Tumor cell cannibalism
In humans, four tm9sf genes have been identified. Tm9sf4 is characterized
by a high degree of evolutionary conservation, suggesting that
Dictyostelium, Drosophila and human proteins may have similar functions.
More recent studies suggested that human TM9SF4 protein is involved in
the process of tumor cell cannibalism [2], [5], [6].
Cannibal behaving tumor cells were identified more than a century ago
(Steinhaus, 1891; Stroebe, 1982) in malignant tumors with different
histology, including breast carcinoma, hematological malignancies, bladder
cancer, medulloblastoma, gastric adenocarcinoma, melanoma and skin
carcinomas. They were described as tumor cells containing engulfed
material of different origin in large vacuoles that push the nucleus to the cell
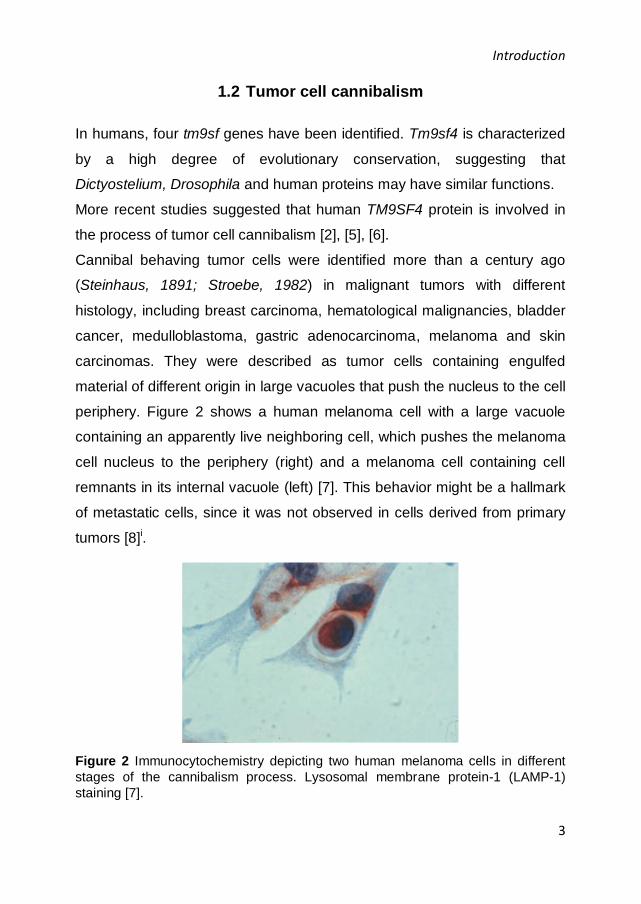
periphery. Figure 2 shows a human melanoma cell with a large vacuole
containing an apparently live neighboring cell, which pushes the melanoma
cell nucleus to the periphery (right) and a melanoma cell containing cell
remnants in its internal vacuole (left) [7]. This behavior might be a hallmark
of metastatic cells, since it was not observed in cells derived from primary
tumors [8]i.
Figure 2 Immunocytochemistry depicting two human melanoma cells in different
stages of the cannibalism process. Lysosomal membrane protein-1 (LAMP-1)
staining [7].

Introduction
4
Tumor cells indiscriminately internalize amorphous material as well as
apoptotic and healthy cells; in particular, they phagocytose both sibling
tumor cells and lymphocytes that should kill them. In addition, it has been
demonstrated that the percentage of surviving tumor cells increases, in the
absence of serum or amino acids, when the melanoma cells are co-
cultured in the presence of T-cells [5]. Hence, the main functions of this
behavior are to feed upon other cells, to nibble the extracellular matrix and
to escape from the specific immune response. These characteristics are
peculiar of highly invasive and metastatic tumor cells, because they
promote cell survival in a hostile microenvironment, with low nutrient
supplies and hypoxia conditions, and allow them to remodel and migrate
through the extracellular matrix.
This process is different from the typical phagocytosis, where the
engulfment is preceded by the formation of ruffles and pseudopods,
embracing the external body. In this case, the internalization occurs
through a sequence of events, including early interaction between the two
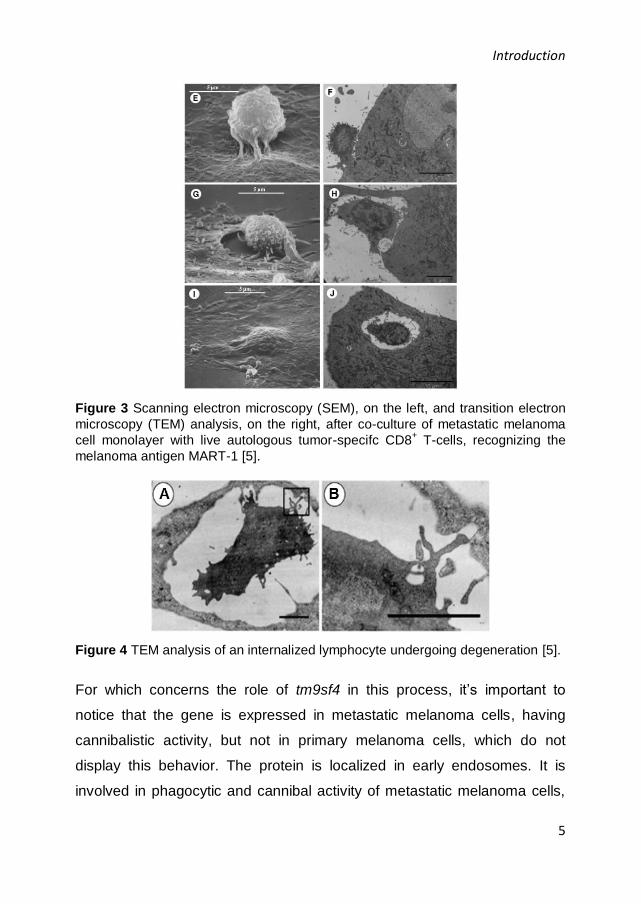
cells (Figure 3, E-F), tumor cell invagination (Figure 3, G-H) and
entrapment of lymphocyte within the melanoma cell (Figure 3, I-J) [5]. In
particular, this process requires big caveolar-like vacuoles (Figure 4) in the
site of the interaction between the tumor cell and the lymphocyte and a link
between caveolin 1 expressing vacuoles and the actin cytoskeleton. The
connection may be provided by the actin-linker molecule ezrin, which
belongs to the ERM actin binding protein family (ERM, Ezrin, Radixin,
Moesin) [5]. Furthermore, the pH of vesicles is lower in metastatic
melanoma cells respect to primary melanoma cells. The acidic environment
activates proteolytic enzymes, like cathepsin B, which is required for
cannibalistic activity [2], [5].
Each of the components of the cannibal framework may represent specific
tumor targets for future new strategies against cancer.
Introduction
5
Figure 3 Scanning electron microscopy (SEM), on the left, and transition electron
microscopy (TEM) analysis, on the right, after co-culture of metastatic melanoma
cell monolayer with live autologous tumor-specifc CD8+ T-cells, recognizing the
melanoma antigen MART-1 [5].
Figure 4 TEM analysis of an internalized lymphocyte undergoing degeneration [5].
For which concerns the role of tm9sf4 in this process, it’s important to
notice that the gene is expressed in metastatic melanoma cells, having
cannibalistic activity, but not in primary melanoma cells, which do not
display this behavior. The protein is localized in early endosomes. It is
involved in phagocytic and cannibal activity of metastatic melanoma cells,

Introduction
6
since tm9sf4 knock-down by RNA interference significantly impairs the
phagocytic activity of these cells against yeast and the cannibal activity
against autologous lymphocytes. Furthermore, tm9sf4 silencing induces an
increase of intravesicular pH of melanoma cells and a decrease of cytosolic
pH, suggesting a protein role as an ion channel component or an ion
channel regulating element, involved in the control of intracellular vesicle
pH [2].
1.3 LA7: a cancer stem cell model system
Tm9sf4 gene was brought to our attention by LA7 cell line, which
represents a model of mammary gland cancer stem cell (CSC), which
allows us to study the dynamics of tumor formation at the single cell level
and to investigate certain aspects of normal mammary gland development.
LA7 cells, characterized by a polygonal epithelial morphology, were
isolated by Renato Dulbecco from a chemically induced rat
adenocarcinoma [9].
According to cancer stem cell hypothesis, tumors are derived from mutated
stem cells that have retained the properties of self-renewal and
differentiation potential or from progenitors that have regained these
characteristics. These kinds of tumor contain a hierarchical population of
cells, composed by a majority of differentiated cells and a small number of
tumor initiating cells. Since mammary tumors have been demonstrated to
be often clonal in origin, they are supposed to be generated from a single
mutated stem cell [10].
In our laboratory, it has been shown that LA7 cells can be propagated
indefinitely both in monolayer and in suspension culture. In non-adherent
conditions LA7 mammospheres could be regenerated indefinitely from cells
derived from previously dissociated mammospheres. In these conditions
Introduction
7
LA7 cells maintain their undifferentiated status, since they do not express
mammary gland lineage specific cell markers.
The mammary gland is composed of stem cells, which possess the
capacity of indefinite self-renewing, lineage-committed progenitor cells, that
have lost this capacity, but still possess proliferation and differentiation
potential, and terminally differentiated cells, belonging to three cell
lineages: luminal, alveolar and myoepithelial cells. LA7 stem cells confluent
monolayer cultures, treated with differentiation inducers, are able to form
domes, which are structures reminding mammary gland alveoli. A single
mammosphere seeded onto collagen-coated dishes can give origin to
branched-like structures, reminiscent of tubules, that are composed of myo-
epithelial and luminal cells, expressing cytokeratin 14 (K14) and cytokeratin
18 (K18) respectively. When treated with lactogenic hormones, LA7
mammosphere-derived outgrowths produce milk proteins such as -casein,
which is a marker specific for functional terminally differentiated alveolar
cells [11].
Hence, in vitro, LA7 cells have the ability to serially regenerate
mammospheres in long-term non adherent cultures, the differentiation
potential to generate all the cell lineages of the mammary gland and to
develop tubular structures that recapitulate, morphologically and
functionally, the ductal-alveolar-like architecture of the mammary tree
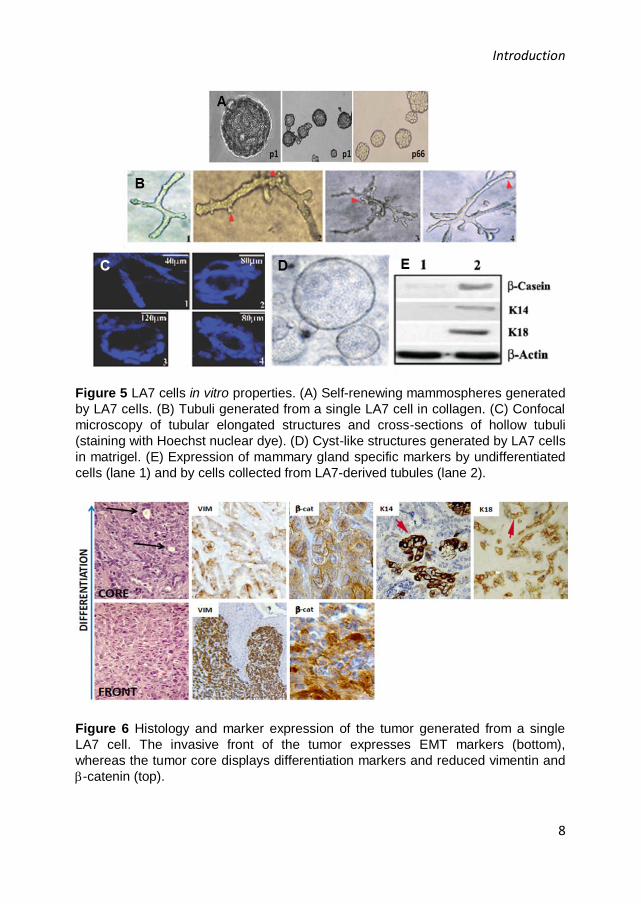
(Figure 5) [11], [12].
In vivo, when injected at the single cell level in nonobese diabetic severe
combined immunodeficient (NOD-SCID) immunocompromised mice, they
are able to generate tumors with a heterogeneous morphology and
containing cells with different ability to self-renewing and three dimensional
organotypic growths. The tumor heterogeneity is the result of the clonal
expansion of a single LA7 cell in all the cell lineages of the tissue of origin.
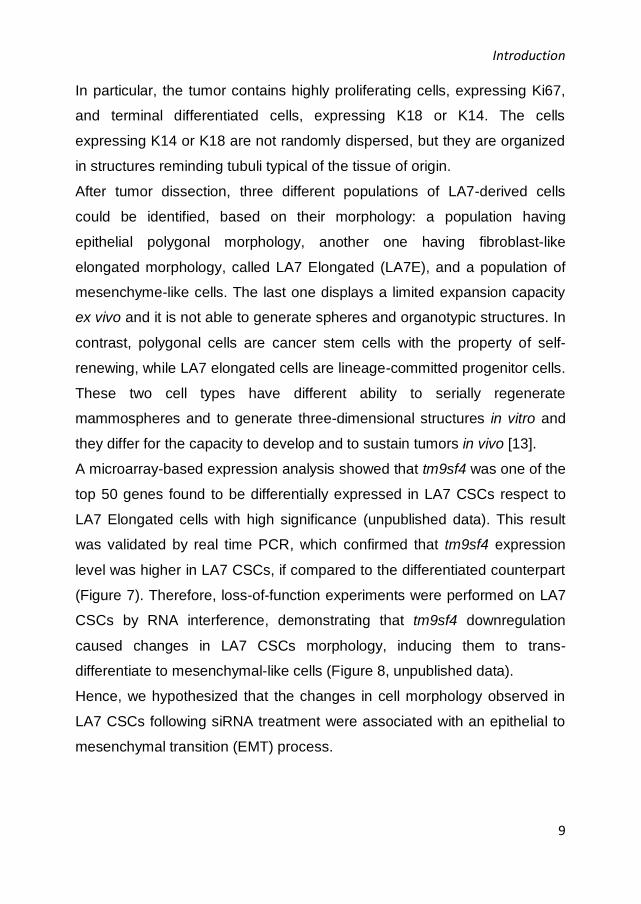
[11] (Figure 6).
Introduction
8
Figure 5 LA7 cells in vitro properties. (A) Self-renewing mammospheres generated
by LA7 cells. (B) Tubuli generated from a single LA7 cell in collagen. (C) Confocal
microscopy of tubular elongated structures and cross-sections of hollow tubuli
(staining with Hoechst nuclear dye). (D) Cyst-like structures generated by LA7 cells
in matrigel. (E) Expression of mammary gland specific markers by undifferentiated
cells (lane 1) and by cells collected from LA7-derived tubules (lane 2).
Figure 6 Histology and marker expression of the tumor generated from a single
LA7 cell. The invasive front of the tumor expresses EMT markers (bottom),
whereas the tumor core displays differentiation markers and reduced vimentin and
-catenin (top).
Introduction
9
In particular, the tumor contains highly proliferating cells, expressing Ki67,
and terminal differentiated cells, expressing K18 or K14. The cells
expressing K14 or K18 are not randomly dispersed, but they are organized
in structures reminding tubuli typical of the tissue of origin.
After tumor dissection, three different populations of LA7-derived cells
could be identified, based on their morphology: a population having
epithelial polygonal morphology, another one having fibroblast-like
elongated morphology, called LA7 Elongated (LA7E), and a population of
mesenchyme-like cells. The last one displays a limited expansion capacity
ex vivo and it is not able to generate spheres and organotypic structures. In
contrast, polygonal cells are cancer stem cells with the property of self-
renewing, while LA7 elongated cells are lineage-committed progenitor cells.
These two cell types have different ability to serially regenerate
mammospheres and to generate three-dimensional structures in vitro and
they differ for the capacity to develop and to sustain tumors in vivo [13].
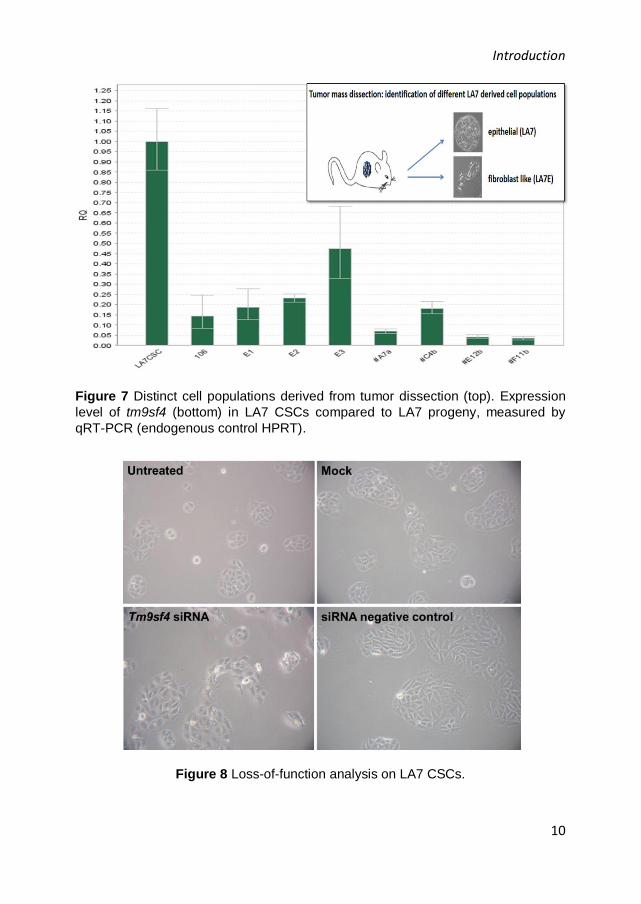
A microarray-based expression analysis showed that tm9sf4 was one of the
top 50 genes found to be differentially expressed in LA7 CSCs respect to
LA7 Elongated cells with high significance (unpublished data). This result
was validated by real time PCR, which confirmed that tm9sf4 expression
level was higher in LA7 CSCs, if compared to the differentiated counterpart
(Figure 7). Therefore, loss-of-function experiments were performed on LA7
CSCs by RNA interference, demonstrating that tm9sf4 downregulation
caused changes in LA7 CSCs morphology, inducing them to trans-
differentiate to mesenchymal-like cells (Figure 8, unpublished data).
Hence, we hypothesized that the changes in cell morphology observed in
LA7 CSCs following siRNA treatment were associated with an epithelial to
mesenchymal transition (EMT) process.
Introduction
10
Figure 7 Distinct cell populations derived from tumor dissection (top). Expression
level of tm9sf4 (bottom) in LA7 CSCs compared to LA7 progeny, measured by
qRT-PCR (endogenous control HPRT).
Figure 8 Loss-of-function analysis on LA7 CSCs.
Introduction
11
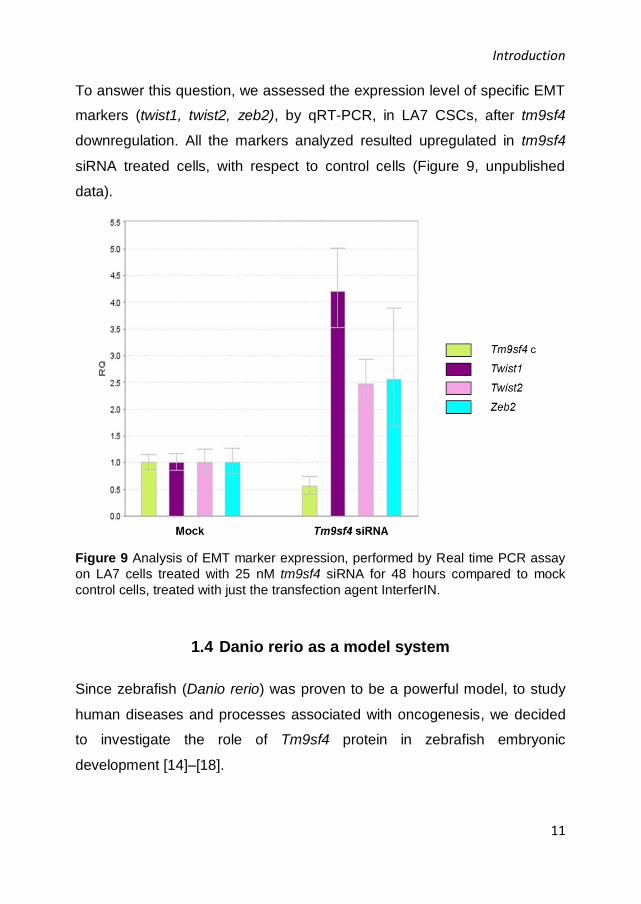
To answer this question, we assessed the expression level of specific EMT
markers (twist1, twist2, zeb2), by qRT-PCR, in LA7 CSCs, after tm9sf4
downregulation. All the markers analyzed resulted upregulated in tm9sf4
siRNA treated cells, with respect to control cells (Figure 9, unpublished
data).
Figure 9 Analysis of EMT marker expression, performed by Real time PCR assay
on LA7 cells treated with 25 nM tm9sf4 siRNA for 48 hours compared to mock
control cells, treated with just the transfection agent InterferIN.
1.4 Danio rerio as a model system
Since zebrafish (Danio rerio) was proven to be a powerful model, to study
human diseases and processes associated with oncogenesis, we decided
to investigate the role of Tm9sf4 protein in zebrafish embryonic
development [14]–[18].
Introduction
12
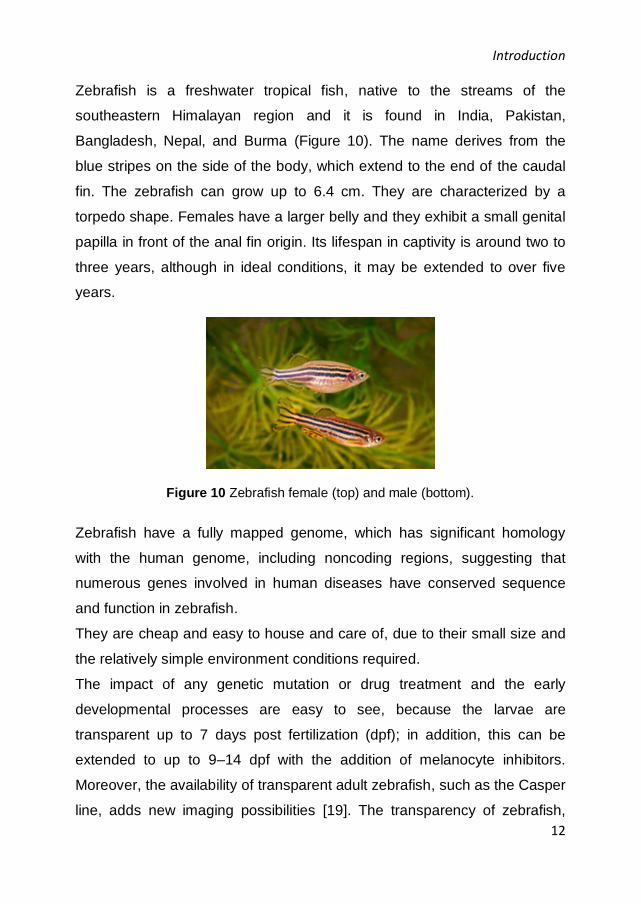
Zebrafish is a freshwater tropical fish, native to the streams of the
southeastern Himalayan region and it is found in India, Pakistan,
Bangladesh, Nepal, and Burma (Figure 10). The name derives from the
blue stripes on the side of the body, which extend to the end of the caudal
fin. The zebrafish can grow up to 6.4 cm. They are characterized by a
torpedo shape. Females have a larger belly and they exhibit a small genital
papilla in front of the anal fin origin. Its lifespan in captivity is around two to
three years, although in ideal conditions, it may be extended to over five
years.
Figure 10 Zebrafish female (top) and male (bottom).
Zebrafish have a fully mapped genome, which has significant homology
with the human genome, including noncoding regions, suggesting that
numerous genes involved in human diseases have conserved sequence
and function in zebrafish.
They are cheap and easy to house and care of, due to their small size and
the relatively simple environment conditions required.
The impact of any genetic mutation or drug treatment and the early
developmental processes are easy to see, because the larvae are
transparent up to 7 days post fertilization (dpf); in addition, this can be
extended to up to 9–14 dpf with the addition of melanocyte inhibitors.
Moreover, the availability of transparent adult zebrafish, such as the Casper
line, adds new imaging possibilities [19]. The transparency of zebrafish,

Introduction
13
associated to sophisticated fluorescent technologies, permits to mark
signaling proteins or cellular entities, allowing for the imaging of biological
and disease processes. Zebrafish are highly fecund: a pair of zebrafish
produces over 100 embryos per clutch, which are usable for larval
experiments. The embryos breed and develop very quickly: in fact, an adult
zebrafish develops in 3 months. The first cellular division occurs after
approximately 45 minutes. During the first 8 hours of development, it is
possible to observe the embryonic cells to cleave on the top of the yolk,
followed by epiboly, in which cells move down and establish the anterior-
posterior axis. The formation of different organ systems can be followed
under the microscope. At 24 hours post fertilization (hpf), the embryo
displays well defined morphological characteristics: for example, it shares a
vascular system and a well-organized nervous system; moreover, eyes,
otolites, somites, pronephric ducts and blood cells precursors can be
observed. At 48 hpf, also a cardiac pump and blood circulation can be
visualized. The developing gastrointestinal system can be detected using
specific molecular markers, whereas it will be possible to analyze its
morphology at 5 dpf. Furthermore, a liver with histology similar to mammals
is detectable.
In addition, knock-down (morpholino injection) and forward genetic
(mutagenesis, transgenic lines) techniques are well established and
commonly used to manipulate and characterize zebrafish gene function.
The embryos can be easily injected at the 1-4 cell stage with antisense
morpholino oligonucleotides, targeting specific gene transcripts, to perform
loss-of-function studies.
Additionally, since zebrafish is a vertebrate, it has many features commonly
found in mammals, including an innate immune system, composed of
neutrophils, NK cells, and monocytes/macrophages, that become functional
by 48 hpf [20] and an adaptive immune system that is fully functional at 4–6

Introduction
14
weeks post fertilization [15]. The adaptive immune system, as in mammals,
includes T-cells and B-cells that undergo Rag-dependent V(D)J-
recombination.
A wide range of larval and adult zebrafish models that recapitulate human
diseases is available, including different branches of pathology, such as
wound healing, gastrointestinal disease, microbe-host interactions, genetic
diseases and drug screens [21].
Zebrafish is particularly useful for the study of hematopoiesis [22]. Blood
circulation begins approximately at 24 hpf and the number and morphology
of circulating cells are visible under a microscope. The hematopoietic
process is conserved throughout vertebrate evolution: in fact, many mouse
and human homologues of blood specific genes have been cloned in
zebrafish (scl, lmo-2, gata-1, and c-myb). More than 50 mutants with
hematopoietic defects have been identified [16].
Furthermore, zebrafish can be used to study cardiovascular disorders. The
zebrafish embryonic heart resembles the heart of a human embryo at three
weeks of gestation. It is divided into atrial and ventricular chambers and it is
lined by endocardium, with cardiac valves forming at the chambers
boundaries. The heart starts to beat at approximately at 22 hpf with a
peristaltic wave and, by 36 hpf, the beating is generated by coordinate
contractions of atrium and ventricle. Studying the heart in zebrafish is
particularly convenient, because the heart function can be assessed
visually; moreover, the fish, unlike mouse, is not dependent from blood
circulation for survival in early development [16].
Zebrafish represent a useful model system for kidney disorders. The
pronephric kidney is composed by two nephrons with fused glomeruli and
bilateral pronephric ducts. Zebrafish kidney development and function
resemble for many aspects higher vertebrates kidney [23].
Introduction
15
Finally, D. rerio has been proposed to be an ideal vertebrate system in
which to model cancer [14]. Teleosts develop a wide variety of benign and
malignant tumors in virtually all organs, with a histology resembling that of
human tumors. Cell-cycle genes, tumor suppressors and oncogenes are
conserved between human and zebrafish genome sequence. Hence,
mutagenesis screens targeted to these pathways could be designed, to
analyze the resulting phenotypes in the developing embryos. This system
also provides a way to check if a mutation causing an embryonic phenotype
is related to a cancer predisposition in adults. Zebrafish system can be
used for chemical genetic screens, to identify drugs active in multicellular
organisms [24]. In fact, embryos exhibit many features of cancer, like
rapidly dividing cells, extensive apoptosis and angiogenesis. Screens for
compounds that affect these properties could identify drugs potentially
useful for cancer treatment. Transgenic lines could be used to express
oncogenes or to follow gene expression through the use of GFP and rapid
short-term analysis of gene function could be carried out using morpholinos
that are often successfully used to phenocopy mutants.
Interestingly, it has been suggested that all vertebrates share common
pathways involved in processes like development of branched structures,
cell migration and neurogenesis [25]. Our hypothesis is that tm9sf4 could
be involved in one of these pathways. Hence, studying the protein function
in this model may help us to understand its role in normal embryonic
development and in tumorigenesis.
1.5 Transmembrane 9 protein superfamily in zebrafish
In zebrafish five genes belonging to transmembrane 9 protein superfamily
have been identified: tm9sf1 (NM_001003550), tm9sf2 (NM_212728),
tm9sf3 (BC046021), tm9sf4 (NM_200510) and tm9sf5 (XP_686483) [26].

Introduction
16
Splice variants could be found in databanks for all the human genes, in
most cases in the N-terminal variable part. In particular, four variants were
reported for human tm9sf4, while in zebrafish no splice variants were
identified.
Zebrafish tm9sf4 gene is located on chromosome 23 and it is composed by
16 exons, while the human gene resides on chromosome 20 and it includes
18 exons. Tm9sf genes were found to be ubiquitously expressed in tissues
of adult zebrafish. During embryonic development, the expression of all
tm9sf genes was detected from fertilization up to 4 dpf [26].
Bioinformatics analysis of 80 Tm9sf protein sequences from yeast, plants
and animals showed that the protein have a conserved structure. Based on
preliminary bioinformatics analyses, zebrafish Tm9sf4 protein was
predicted to be composed by 9 transmembrane regions, a large variable
region facing the non-cytoplasmic side, a C-terminal end orientated to the
cytoplasmic side. At the N-terminus, a small cytoplasmic N-terminal part or
another transmembrane region could be present [26] (Figure 11).
Figure 11 Prediction of the Tm9sf4 protein membrane topology
Two ITIM-like (Immunoreceptor Tyrosine-based Inhibition Motif) sequences
could be present at the C-terminal end, close to transmembrane regions 7
and 9, respectively. A putative TRAF-2 (Tumor Necrosis Factor Receptor-
Associated Factor 2) binding site is present between transmembrane
regions 1 and 2. These domains are conserved in all Tm9sf proteins [26].
ITIMs have been found in a large number of immune receptors that were
Introduction
17
shown to negatively regulate cellular processes including endocytosis,
phagocytosis and cell adhesion. When ITIM-containing receptors are
engaged, they become tyrosine phosphorylated and then they transmit
inhibitory signals by binding and activating SH2 (Src homology domain)
containing phosphatases. In many cases the target is Vav1, a guanine
nucleotide exchange factor, which participates in several processes
requiring cytoskeletal reorganization. Hence, the presence of ITIM motifs
could place Tm9sf proteins in signal transduction pathways that may
regulate processes such as adhesion and phagocytosis. On the other end,
recently, ITIM and ITIM-like motifs have also been detected in proteins that
are not directly involved in immunity, such as G-proteins in which it
mediates apoptosis.
TRAF proteins are signal transducers for members of the TNF receptor
family, even if TRAF signaling is not restricted to these receptors. TNF
receptor-mediated TRAF2 signaling may lead to cell proliferation, cell
activation and cytokine secretion. TRAF2 has also a role in cell
differentiation or maturation in B cells, osteoclasts and macrophages. As
TRAF2 protein is ubiquitous, a role of this protein in not direct immune
functions may also be expected. TRAF2 could be involved in the induction
of autophagy in the unfolded protein response (UPR), where TRAF2 is
recruited by the endoplasmic reticulum serine/threonine kinase IRE1.
However, this prediction suggests that Tm9sf proteins could be involved in
zebrafish immunity and it is consistent with the previous works, which
shown protein involvement in the innate immunity of Drosophila and
Dictyostelium [1], [3], [4].
Despite of this, the expression of tm9sf genes was not affected by
incubation of the embryos with PAMPs (Pathogen Associated Molecular
Patterns), such as LPS, CpG, poly I:C, at any concentration or length of
exposure [26]. Therefore, the role of Tm9sf4 protein in zebrafish immune
Introduction
18
system could be related to signaling. According to this hypothesis, it was
suggested that Tm9sf proteins may transduce signals from PAMPs [26].
1.6 Epithelial to mesenchymal transition
Most adult tissues develop from a series of conversions of epithelial cells to
mesenchymal cells, through the epithelial to mesenchymal transition (EMT)
and the reverse process, mesenchymal to epithelial transition (MET).
Several rounds of EMT and MET are required for final cell differentiation
and the development of the complex structure of organs (primary,
secondary, tertiary EMT). Primary EMT includes the formation of
mesoderm from the primitive ectoderm and the repositioning of the three
primary germ layers, as well as the definition of the anteroposterior and
dorsoventral axes in the developing embryo, by mesendodermal
progenitors undergoing EMT during gastrulation, and, successively, the
formation of dorsal neural tube by neural crest delamination. Secondary
EMT involves early mesodermal cells (axial, paraxial, intermediate, lateral
plate cells), which condense into transient secondary epithelial structures
(notochord, somites, somatopleure and splanchnopleure respectively), that
will undergo EMT, leading to the generation of mesenchymal cells, that
differentiate into specific cell types: for instance, endodermal tissues,
including pancreas bud and liver diverticulum, undergo the dissociation of
endocrine cells and hepatoblasts from their epithelial primordia. An
example of tertiary EMT occurs in the heart during the formation of cushion
mesenchyme, which is the precursor of cardiac valves, from the
atrioventricular canal or the outflow tract.
Epithelial cells establish close contact with their neighbors and an
apicobasal axis of polarity. They maintain global communication through
specialized junction structures and they remain separated from adjacent

Introduction
19
tissues by the basal lamina. In contrast, mesenchymal cells are dispersed
in a three-dimensional extracellular matrix and comprise connective tissues
adjacent to epithelia. In general, the EMT process involves morphological
changes of epithelial cells, the loss of cell-cell adhesion and cell polarity, in
addition to the acquisition of migratory and invasive properties.
Furthermore, the expression of specific proteins occurs: cell-cell junction
proteins and cytokeratin intermediate filaments are replaced by vimentin
filaments and fibronectin.
Mesoderm formation and neural crest delamination represent the key
embryonic EMT programs. Some of the most important elements involved
in this process are conserved through evolution [27]. The genetic pathways
governing gastrulation in amniotes, which are substantially maintained in
zebrafish, are shown in figure 12 [27].
Figure 12 Genetic pathways controlling gastrulation in amniotes [27].
Introduction
20
In early development, at the onset of gastrulation, activation of canonical
Wnt (Wingless-type MMTV integration site family) signaling leads to the
formation of the primitive streak or blastopore in the posterior part of the
embryo, which is the region where cells involute or ingress and that
establish a bilateral symmetry in most vertebrates. In zebrafish, the
blastopore is not present and the cells involute at the blastoderm margin. In
this region, convergence movements produce a local accumulation of cells,
known as the embryonic shield in zebrafish (node in mammals), which is an
organizing center, regulating cell movements and specification [28]. The
formation of this structure is promoted by -catenin, which, in turn, is
regulated by Wnt and is transported in the dorsal part of the embryo by a
maternal program of microtubule dependent transport, activating
transcription factors and secreted signals in dorsal blastomers. Later,
members of TGF- superfamily (i.e. Nodal) mark the beginning of
gastrulation, in both zebrafish and Xenopus. Nodal signaling and FGF
(Fibroblast Growth Factor) family control the specification of mesoderm in
all vertebrates. Members of TGF- superfamily induce Snail1 and Snail2
(SNAI1 and SNAI2 in humans), which are E-cadherin repressors and
control cell-cell adhesion, cell shape and motility. In addition, they are
essential for EMT and mesodermal cells migration. FGF signaling is
required to maintain their expression and for gastrulation to proceed [29].
The cell delamination is allowed by microtubule disruption and basal
membrane breakdown, induced by Net1 (RhoGEF protein), which inhibits
RhoA in the blastopore [30]. On the other end, FLRT3 maintains the basal
membrane integrity in other areas [31].
In particular, zebrafish gastrulation involves a set of movements:
blastoderm expansion around the syncytial yolk cell, which is associated
with its thinning (epiboly), the migration of mesodermal and endodermal
precursors from the blastula surface beneath the ectodermal layer, forming

Introduction
21
an internal layer, the so called hypoblast (ingression), the conversion
movements narrowing embryonic tissues mediolaterally and extension
movements elongating tissues along the anteroposterior axis (Figure 13)
[28]. Finally, deep cell layer (DEL) cells, adjacent to the blastoderm margin,
become lineage restricted.
Figure 13 Gastrulation movements in zebrafish. (a) Midblastula stage. (b, c)
Gastrulation. (d) 16 hpf embryo. Abbreviations: AP, animal pole; D, dorsal; E-YSL,
external yolk syncytial layer; I-YSL, internal YSL; SMO, Spemann-Mangold
organizer; V, ventral; VP, vegetal pole; YSN, yolk syncytial nuclei. Color code: red,
mesoderm; dark red, prechordal mesoderm; yellow, endoderm; light blue, non-
neural ectoderm; dark blue, neural ectoderm. The black arrow indicates the
proximodistal blastopore axis [28].
Interestingly, many genes controlling these cell movements are involved in
cell adhesion [28]. Moreover, it has been recently demonstrated that E-
cadherin (cdh1) is involved in epiboly, convergence and extension
Introduction
22
movements in zebrafish [32], [33]. In particular, E-cadherin-mediated
adhesion between enveloping layer (EVL) and DEL cells could play a role
in epiboly.
Furthermore, in the embryonic shield, prechordal mesendodermal cells
internalize by synchronized ingression and successively they migrate
towards the animal pole [32]. Activation of stat3 downstream to catenin is
essential for convergence and extension movements in the axial tissues
[33]. The main effector of stat3 is liv1, a zebrafish homolog of a breast
cancer-associated zinc transporter, which promotes the nuclear localization
of snail, a transcription factor that negatively regulates E-cadherin
expression. It has been proposed that liv1 promotes EMT in prechordal
mesendodermal cells [34].
Wnt non-canonical signaling, mediated by wnt11, is also required for this
process and it has been proposed to modulate cell adhesion by regulating
E-cadherin activity [35]. Moreover, the T-box gene notail, the zebrafish
homolog of Brachyury, and wnt11 are required for the migration of the
notochord precursors [36], [37].
Despite the heterogeneity of the mechanisms involved in gastrulation
movements, E-cadherin has been shown to be essential for different cell
behaviors underlying these processes [28]. The role of E-cadherin is
conserved through evolution. It is unclear how E-cadherin function is
regulated in terms of transcription, translation and protein activity. Since the
gastrulation events occur very rapidly, many pathways should cooperate to
ensure a dynamic and rapid regulation of E-cadherin.
After gastrulation the epidermal and neural (neuroectoderm) territories are
progressively defined and the neural crest forms from ectoderm at the
boundary between these two territories, characterized by an intermediate
BMP (Bone Morphogenic Protein) signaling. BMP proteins belong to TGF-
superfamily. Neural crest is a transient population of embryonic progenitors,

Introduction
23
which constitute the dorsal midline of the early neural tube and have the
ability to undergo EMT and migrate as single cells over extraordinarily long
distances. After migration they generate a wide variety of derivatives,
including, among others, craniofacial structures, most of the peripheral
nervous system, some endocrine cells and melanocytes. Canonical Wnt
signaling is important for neural crest precursors induction and stabilization,
whereas non-canonical Wnt signaling is required for neural crest migration
[38]. One critical component of neural crest migration is the extracellular
matrix: high levels of fibronectin and hyaluronan appear in the neural crest
area just before migration.
In both developmental processes and carcinoma progression and
metastasis, functional loss of E-cadherin in epithelial cells is considered a
hallmark of EMT. Therefore, a pivotal importance represents the
understanding of pathways through which E-cadherin is regulated. A wide
range of transcription factors, including Snail and ZEB, are able to repress
E-cadherin transcription by directly binding E-box elements present on its
promoter [39]–[41]. Other factors, including the bHLH factor Twist, regulate
E-cadherin indirectly [42], [43]. Interestingly, most of these factors are
involved in various EMT processes, occurring both during embryogenesis
and in tumor malignancy and metastatization.
Aims
24
2. AIMS
The aim of my PhD project is the identification of Tm9sf4 protein function in
normal and cancer cells, in particular in mammary gland stem cell
maintenance and in tumor initiation and progression.
Based on the assumption that all vertebrates share common pathways
involved in many important biological processes, including tissue
branching, cell migration, sprouting and neurogenesis [25], Zebrafish
(Danio rerio) was used as an in vivo model system, to investigate Tm9sf4
protein function in embryonic development.
D. rerio was recently proven to be a powerful model to study not only
human diseases, but also processes associated with oncogenesis. Since
zebrafish is a vertebrate organism, it shares genetic similarity to humans
and, to date, all proteins studied for their involvement in many human
diseases have conserved sequences and functions in fish and mammals.
Moreover, the zebrafish are easy to house and care for. The impact of any
genetic mutation or drug treatment is easy to visualize under microscope,
because the embryos are completely transparent. They produce a large
number of eggs per mating and the embryos breed and develop very
quickly.
Interestingly, most of the processes associated with EMT are conserved for
many aspects in zebrafish embryonic development and human tumor
progression [27], [44]. Our hypothesis is that tm9sf4 is involved in one of
these pathways. In particular, it could have a role in the regulation of EMT
in various embryonic tissues and in tumor progression. Therefore, studying
Tm9sf4 protein function in zebrafish may help us to understand its role in
normal embryonic development and in tumorigenesis.
Materials and Methods
25
3. MATHERIALS AND METHODS
3.1 Zebrafish maintenance
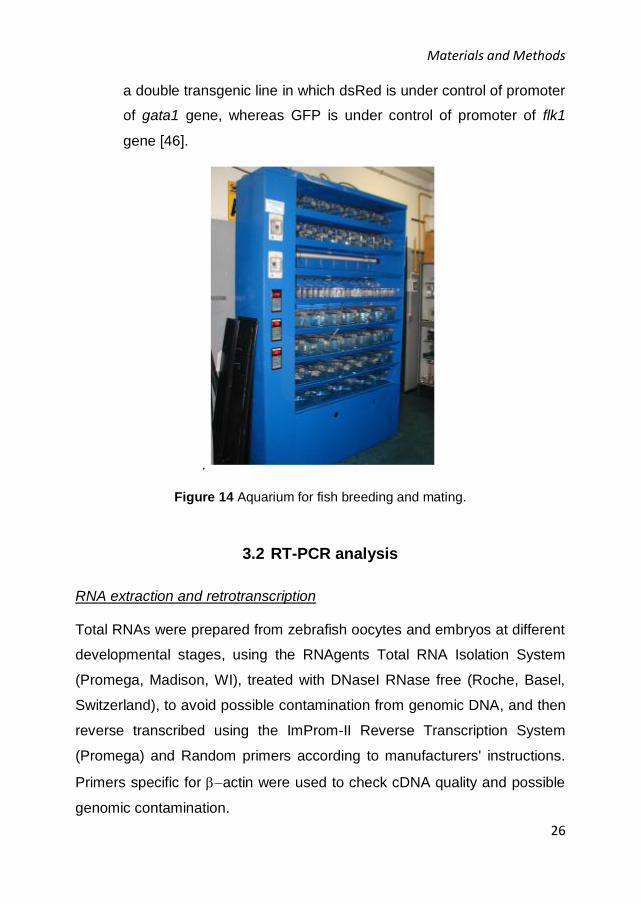
Adult zebrafish were kept at 28 °C in a cabinet equipped with fish tanks
(Figure 14), each one containing 3-5 liters of fish water, composed by a
solution of 34 g of Instant Ocean Sea Salt per liter of dH2O, further diluted
1:200 in dH2O. They were fed three times per day with Artemia Salina and
dried flake food. The light/dark cycle was 14/10 hours. Males and females
were kept in separate tanks until mating.
In order to permit reproduction, a male and a female were combined, after
the dark period, in 1 liter tanks, equipped with a mesh, to prevent adults
from cannibalism and allow fertilized eggs to settle to the bottom. Zebrafish
embryos obtained from natural spawning were collected in Petri dishes
containing fish water, added with 0.01% methylene blue, to prevent fungal
growth, and maintained at 28 °C until they reached the desired
developmental stage, according to established techniques [Westerfield, M.
1995, The Zebrafish Book. A Guide for the Laboratory Use of Zebrafish
(Danio rerio), 3rd Edition. Eugene, OR, University of Oregon Press, 385].
The embryos were staged according to morphological criteria [45].
Beginning from 24 hpf they were cultured in fish water containing 0.003%
PTU (1-phenyl-2-thiourea; SIGMA) to prevent pigmentation and 0.01%
methylene blue.
For this study the following animal lines were used:
AB: wild type line, obtained from the Wilson lab, University College
London, London, United Kingdom.
tg(gata1:dsRed)sd2/tg(flk1:EGFP)S843 (from the Santoro lab,
Molecular Biotechnology Center, Università di Torino, Torino, Italy),
Materials and Methods
26
a double transgenic line in which dsRed is under control of promoter
of gata1 gene, whereas GFP is under control of promoter of flk1
gene [46].
.
Figure 14 Aquarium for fish breeding and mating.
3.2 RT-PCR analysis
RNA extraction and retrotranscription
Total RNAs were prepared from zebrafish oocytes and embryos at different
developmental stages, using the RNAgents Total RNA Isolation System
(Promega, Madison, WI), treated with DNaseI RNase free (Roche, Basel,
Switzerland), to avoid possible contamination from genomic DNA, and then
reverse transcribed using the ImProm-II Reverse Transcription System
(Promega) and Random primers according to manufacturers' instructions.
Primers specific for actin were used to check cDNA quality and possible
genomic contamination.
Materials and Methods
27
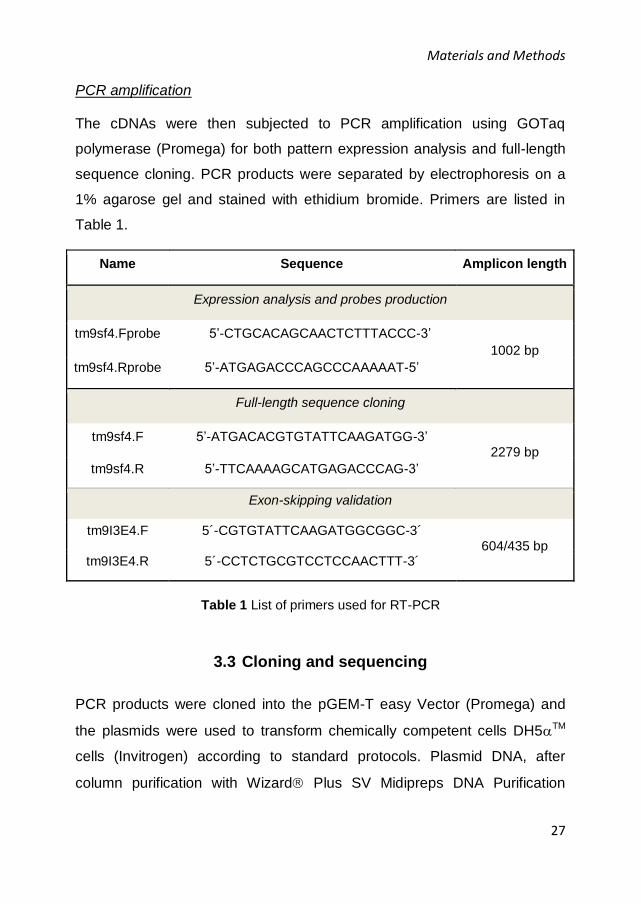
PCR amplification
The cDNAs were then subjected to PCR amplification using GOTaq
polymerase (Promega) for both pattern expression analysis and full-length
sequence cloning. PCR products were separated by electrophoresis on a
1% agarose gel and stained with ethidium bromide. Primers are listed in
Table 1.
Name Sequence Amplicon length
Expression analysis and probes production
tm9sf4.Fprobe 5’-CTGCACAGCAACTCTTTACCC-3’
1002 bp
tm9sf4.Rprobe 5’-ATGAGACCCAGCCCAAAAAT-5’
Full-length sequence cloning
tm9sf4.F 5’-ATGACACGTGTATTCAAGATGG-3’ 2279 bp
tm9sf4.R 5’-TTCAAAAGCATGAGACCCAG-3’
Exon-skipping validation
tm9I3E4.F 5´-CGTGTATTCAAGATGGCGGC-3´ 604/435 bp
tm9I3E4.R 5´-CCTCTGCGTCCTCCAACTTT-3´
Table 1 List of primers used for RT-PCR
3.3 Cloning and sequencing
PCR products were cloned into the pGEM-T easy Vector (Promega) and
the plasmids were used to transform chemically competent cells DH5TM
cells (Invitrogen) according to standard protocols. Plasmid DNA, after
column purification with Wizard Plus SV Midipreps DNA Purification
Materials and Methods
28
System (PROMEGA), was analyzed by electrophoresis on a 1% agarose
gel and then the insert was controlled by Sanger sequencing.
3.4 Probes preparation
Template cloning
A 1002 bp cDNA template was generated by RT-PCR on total RNA
extracted from 5 dpf (days post fertilization) embryos and primers listed in
Table 1, as described before (Paragraph 3.3).
Plasmid digestion
The cDNA-containing plasmid was linearized with PstI restriction
endonuclease and transcribed with T7 RNA polymerase (Roche) for the
sense riboprobe synthesis or linearized with ApaI and transcribed with SP6
RNA polymerase (Roche) to synthesize the antisense probe.
The enzymatic digestions were performed using the following mix (100 l):
- 10 g plasmidic DNA in water solution
- Restriction endonuclease (3 U enzyme/g DNA)
- Buffer 10X
- BSA 10X
- Nuclease-free H2O
The reaction mix were incubated for at least 2 hours at 37 °C and the
digestion were assessed by electrophoresis on 1% agarose gel. The DNA
was extracted with 1 volume of phenol and following centrifugation the
aqueous phase was collected and added with 10-1 volumes of sodium
acetate and 2.5 volumes of ethanol. The mixture was incubated overnight
at -20 °C, to precipitate DNA. After centrifugation, the pellet was washed
with 70% ethanol and resuspended in nuclease-free H2O.

Materials and Methods
29
Probe transcription
Probes were synthetized using MAXIscriptTM kit (Life Technologies) and
dygoxigenin-UTP, according to manufacturers’ instructions. The reaction
mix was then treated with DNase at 37 °C for 15 minutes. The probes were
purified using Sigma SpinTM sequencing Reaction Clean-Up columns
(Sigma) and analyzed by electrophoresis on 1% agarose gel, to determine
the concentration.
3.5 Whole-mount in situ hybridization (WISH)
Embryos fixing
Embryos at the desired stage, after mechanical removal of chorion, were
fixed with a solution of 4% PFA in PBS for 1 hour at room temperature,
dehydrated with a graded methanol series in PBS and stored in 100%
methanol at -20 °C.
Hybridization procedure
Whole-mount in situ hybridization (WISH) was performed as described by
Thisse C. and colleagues [47] using 60% formamide, a hybridization
temperature of 65 °C and 300 ng of probe per sample.
First day:
Embryos were rehydrated with a decreasing methanol series in PBS and
they were washed four times in PBT (PBS 1X/1% Tween 20).
Successively, they were treated with a solution of 10 g/ml proteinase K in
PBT for different times, depending on the developmental stage.
The solution was removed and the reaction was blocked by incubation in
PFA for 20 minutes at room temperature.
Materials and Methods
30
The embryos were washed 5 times with PBT and incubated in hybridization
mix (HM) for 2-5 hours at 65 °C.
Successively, they were incubated overnight at 65 °C in HM, previously
added with the probe.
Second day:
The following washes were performed:
HM wash, 65 °C
75% HM wash/25% SSC 2X (15 minutes, 65 °C)
50% HM wash/50% SSC 2X (15 minutes, 65 °C)
25% HM wash/75% SSC 2X (15 minutes, 65 °C)
SSC 2X (15 minutes, 65 °C)
SSC 0.1X (30 minutes, 65 °C, X2)
75% SSC 0.1X/25% PBT (10 minutes, RT)
50% SSC 0.1X/50% PBT (10 minutes, RT)
25% SSC 0.1X/75% PBT (10 minutes, RT)
PBT (10 minutes, RT)
The embryos were incubated in a PBT solution containing 2% sheep serum
and 2 mg/ml BSA, for at least 2 hours at room temperature. Then, they
were incubated in the same solution, previously added with anti-DIG
antibody (1:5000), overnight at 4 °C.
Third day:
After antibody removal, embryos were washed 6 times with PBT at room
temperature for 15 minutes and, then, 3 times with staining buffer for 5
minutes at room temperature.
The embryos were incubated in staining buffer added with 2.3 l/ml NBT
and 3.5 l/ml BCIP.
To stop the staining, the buffer was removed and the embryos were
washed in PBT.

Materials and Methods
31
Finally, a post-fixing was carried out by incubation in 1% PFA at room
temperature for 30 minutes.
The embryos were washed with PBS and stored at 4 °C in PBS.
Solutions
10X PBS buffer: 180 g NaCl; 2 g KCl; 14.4 g Na2HPO4; 2.4 g KH2PO4, in
milliQ H2O (1 l final volume).
PBT buffer: 1% Tween 20 in 1X PBS
20X SSC pH 7 (Saline Sodium Citrate Buffer): 300 mM trisodium citrate;
3 M sodium citrate pH 7.0.
HM wash: 60% formamide; 5X SSC; 1M citric acid pH 6; 0.1% Tween 20;
milliQ H2O.
Hybridation mix (HM): HM wash; 500 g/ml Yeast RNA; 50 g/ml eparin.
Staining buffer: 100 mM NaCl; 100 mM Tris HCl pH 9.5; 50 mM MgCl2;
0.1% Tween 20, milliQ H2O.
Imaging
The embryos were transitioned to 87% glycerol/13% PBS 1X, by
performing washes with a graded series of glycerol (30%, 50%, 75%).
Images of stained embryos were taken with a Leica MZFLIII
epifluorescence stereomicroscope equipped with a DFC 480 digital camera
and IM50 Leica imaging software (Leica, Germany).
3.6 Histological sections
After hybridization the embryos were transitioned to PBS and dehydrated in
a graded ethanol series (35%, 50%, 70%, 90%, 95%, and 100%),
Materials and Methods
32
transitioned to xylene and then embedded in paraffin wax (paraplast plus,
Bio Optica).
Wax embedding and sectioning
After 2 washes with xylene (1 hour, RT), the embryos were incubated in
50% xylene/50% paraffin overnight at room temperature.
Three washes with liquid paraffin were performed (1 hour, 61 °C).
The embryos were positioned and properly oriented in inclusion molders
that were filled with liquid paraffin. The blocks were allowed to cool at room
temperature overnight.
Samples were then serially sectioned at 8 µm on a microtome (Leitz 1516).
The sections were putted on slides (superfrost, Bio Optica) and dried at 37
°C.
Eosin staining and imaging
The wax was removed by consecutive washes in xylene.
The sections were rehydrated in a decreasing ethanol series (100%, 95%,
90%, 70%, and 50%), washed with dH2O and stained with a water solution
of eosin for 50 seconds.
After washing with dH2O, the sections were dehydrated in a graded ethanol
series and transitioned to xylene.
The slides were mounted with Eukitt (Bio Optica). All sections were
observed at microscope Olympus BH-2 equipped with a Leica DCF480
digital camera and the software IM50.
3.7 Loss-of-function analysis
Wild type embryos, belonging to line AB, and double transgenic embryos,
belonging to line tg(gata1:dsRed)sd2/tg(flk1:EGFP)S843, were injected with
Materials and Methods
33
antisense morpholino oligonucleotides. We designed an antisense
translation blocking morpholino oligonucleotide (tm9sf4-MO), targeted to
the start codon AUG, and a splicing morpholino oligonucleotide (tm9I3E4-
MO), targeted to the junction between intron 3 and exon 4. Tm9sf4-MO was
co-injected with an oligonucleotide targeted to p53 (p53-MO), to suppress
eventual off-target effects [48]. As a negative control, we injected a
standard control morfolino (std-MO), targeted to human -globin gene and
having no targets in zebrafish. Morpholino oligonucleotides were
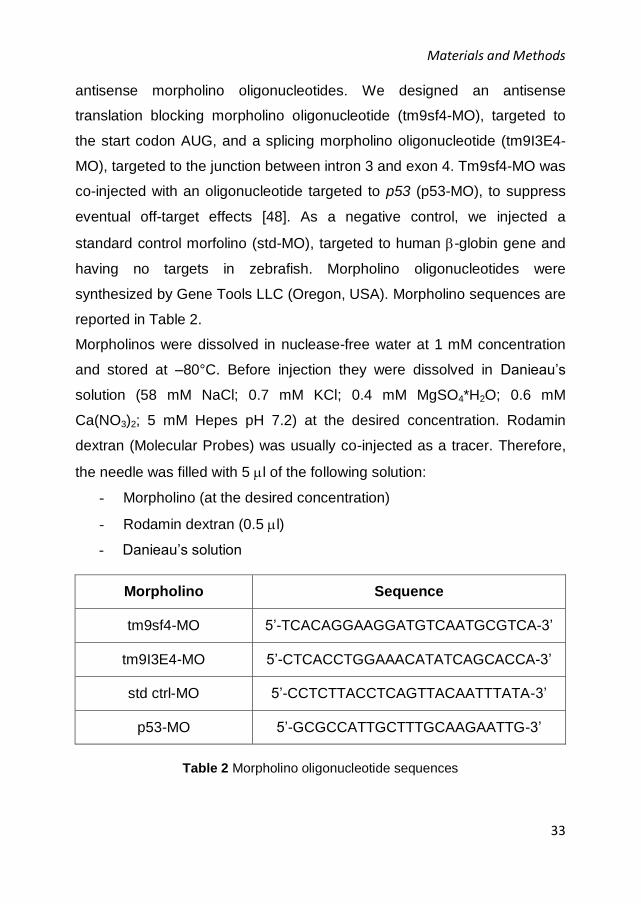
synthesized by Gene Tools LLC (Oregon, USA). Morpholino sequences are
reported in Table 2.
Morpholinos were dissolved in nuclease-free water at 1 mM concentration
and stored at –80°C. Before injection they were dissolved in Danieau’s
solution (58 mM NaCl; 0.7 mM KCl; 0.4 mM MgSO4*H2O; 0.6 mM
Ca(NO3)2; 5 mM Hepes pH 7.2) at the desired concentration. Rodamin
dextran (Molecular Probes) was usually co-injected as a tracer. Therefore,
the needle was filled with 5 l of the following solution:
- Morpholino (at the desired concentration)
- Rodamin dextran (0.5 l)
- Danieau’s solution
Morpholino Sequence
tm9sf4-MO 5’-TCACAGGAAGGATGTCAATGCGTCA-3’
tm9I3E4-MO 5’-CTCACCTGGAAACATATCAGCACCA-3’
std ctrl-MO 5’-CCTCTTACCTCAGTTACAATTTATA-3’
p53-MO 5’-GCGCCATTGCTTTGCAAGAATTG-3’
Table 2 Morpholino oligonucleotide sequences

Materials and Methods
34
Successively, 5 nl per embryo of this solution were microinjected at the 1–4
cells stage.
Fertilized eggs were collected in Petri dishes containing fish water and
aligned on the edge of a slide placed in a dish (about 50 embryos/slide).
The microinjections were performed using the “Micromanipulator 5171”
(Eppendorf) and the microinjector “Cell Tram Oil” (Eppendorf) (Figure 15).
Figure 15 Microinjection system
After injection, embryos were raised in fish water at 28 ºC and observed up
to the stage of interest. Before the phenotypic analysis, rodamin dextran
positive embryos were selected and the chorion was mechanically
removed. Injected embryos after 24 hpf were treated with PTU 1X (1-
Phenil-2-thiourea, SIGMA; stock PTU 10X: 0.015 g of PTU powder in 50 ml
of fish water) to inhibit pigment formation. The injected embryos were
anaesthetized using tricaine 1X (Ethyl 3-aminobenzoate methanesulfonate
salt, SIGMA; stock tricaine 25X: 0.08 g in 20 ml of distilled H2O) in fish
water and PTU 1X, to allow a better visualization and imaging. Images
Materials and Methods
35
were acquired by using a Leica MZ FLIII equipped with a Leica DCF480
digital camera and the software IM50.
3.8 Real time PCR analysis
RNA extraction and DNase treatment
Total RNAs were prepared from morphants at the desired developmental
stage, using the RNAgents Total RNA Isolation System (Promega,
Madison, WI). RNA was analyzed with Nanodrop, to measure the
concentration.
1g of total RNA for each sample was treated with 1 Unit of DNaseI
enzyme (cat. 18068-015, Invitrogen) at 25 °C for 15 minutes in a total
volume of 10l. The enzyme was then inactivated adding 1 l of ETDA (25
M) and heating the reaction at 65 °C for 10 minutes.
Retrotranscription
cDNA was produced using 9l of the DNase with High-Capacity cDNA
Reverse Transcription Kit (cat.4368814, Life Technologies) in a total
volume of 20 l, following manufacturers’ instruction. The samples were
incubated at 25 °C for 10 minutes (annealing), 37 °C for 120 minutes
(reverse transcription) and, finally, at 85 °C for 5 minutes (inactivation).
Real Time PCR
qRT-PCR was performed with 7500 Real-Time PCR System (Life
Technologies) using primers listed in Table 3 at the final concentration of
300 nM each, with SYBR Select Master Mix (cat. 4472920, Life
Technologies), following manufacturers’ instructions. Each single reaction
was performed with a cDNA amount corresponding to 5 ng of original total
RNA. All the analysis were performed by calculating relative quantification

Materials and Methods
36
with the ∆∆Ct approach, using Rpl8 as endogenous control and calculating
the standard error among triplicate reactions.
Primer Type Sequence
ZF_Fgf8_F Forward 5’-GAGTTATCTATTCCTTCACCTCTTTGC-3’
ZF_Fgf8_R Reverse 5’-TCACTCACATGCTGTGTAAAATTAGG-3’
ZF_SHHa_F Forward 5’-CCAAAGCCCACATTCATTGC-3’
ZF_SHHa_R Reverse 5’-AAACAGCCCCCAGATTTCG-3’
ZF_Rpl8_F Forward 5’-CCGTTGTTGGTGTTGTTGCT-3’
ZF_Rpl8_R Reverse 5’-TTGGCCTTGTATTTGTGGTAAGC-3’
ZF_Wnt1_F Forward 5’-CCCACAGCCCCAATGTCTT-3’
ZF_Wnt1_R Reverse 5’-CACCAGCACTTGTAATGGCAAA-3’
ZF_Egr2a_F Forward 5’-AAGGAGGCACACAAAAATCCA-3’
ZF_Egr2a_R Reverse 5’-TGTGAGGGCCCACAGAAAG-3’
ZF_OTX2_F Forward 5’-ACCCAGCGACTCCTCGAAA-3’
ZF_OTX2_R Reverse 5’-GCACATCTAGTTGCGCTCTAGTAAA-3’
ZF_OTX1a_F Forward 5’-TATCCCACGAATCCTCGTAAACA-3’
ZF_OTX1a_R Reverse 5’-CTCTCCAAGATGTCCAGCTGAGT-3’
ZF_CDH1_F Forward 5´-TGTAGCGAGTCAAATGGCTTGT-3´
ZF_CDH1_R Reverse 5´-CCACTCGAAAAGACCTGAAAAAGA-3´
TWIST2_F Forward 5’-AGGGCGCGTGGTCGAT-3’
TWIST2_R Reverse 5’- AGTAAACAGTCCGTTCGGCATT-3’

Materials and Methods
37
Primer Type Sequence
TWIST1a_F Forward 5’-CCATGTCAACATCCCACTAACG-3’
TWIST1a_R reverse 5’-CCATGTCAACATCCCACTAACG-3’
TWIST1b_F Forward 5’-GGGCGCTTGGTCCATGT-3’
TWIST1b_R Reverse 5’-GCTCACGGTTTGACCATTTAAAA-3’
ZEB2a_F Forward 5’-CAGCCACCTTTGCTGAGAT-3’
ZEB2a_R Reverse 5’-ATCCCCCTGGAAGCCTTGT-3’
ZEB2b_F Forward 5’-GGTACAGATGAACTGAAGGCTGATT-3’
ZEB2b_R Reverse 5’-ACTTTCAGTGTCCACCAGTTTACG-3’
Table 3 List of primers used for qRT-PCR
Results
38
4. RESULTS
4.1 Tm9sf4 expression analysis
4.1.1 Tm9sf4 expression during embryonic development
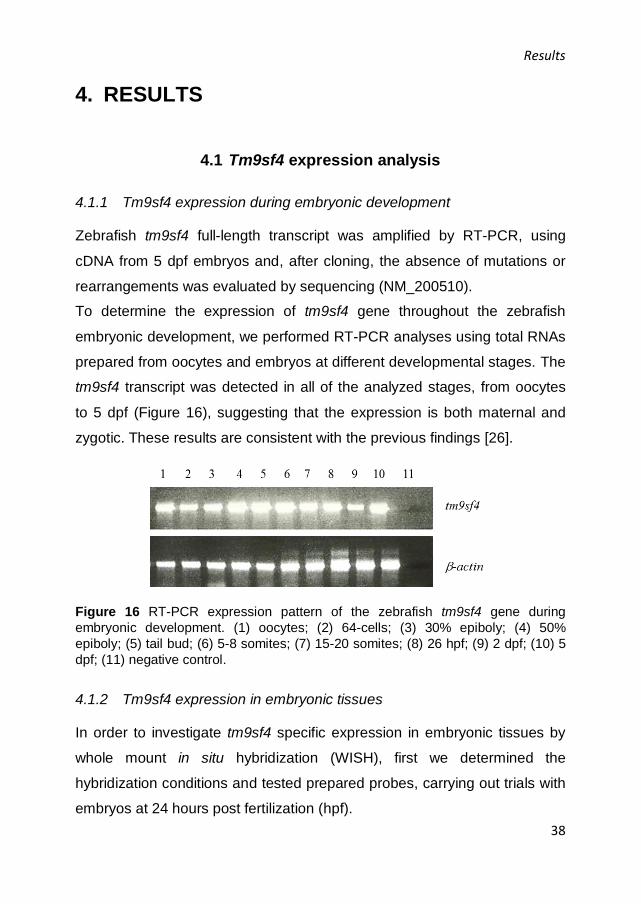
Zebrafish tm9sf4 full-length transcript was amplified by RT-PCR, using
cDNA from 5 dpf embryos and, after cloning, the absence of mutations or
rearrangements was evaluated by sequencing (NM_200510).
To determine the expression of tm9sf4 gene throughout the zebrafish
embryonic development, we performed RT-PCR analyses using total RNAs
prepared from oocytes and embryos at different developmental stages. The
tm9sf4 transcript was detected in all of the analyzed stages, from oocytes
to 5 dpf (Figure 16), suggesting that the expression is both maternal and
zygotic. These results are consistent with the previous findings [26].
Figure 16 RT-PCR expression pattern of the zebrafish tm9sf4 gene during
embryonic development. (1) oocytes; (2) 64-cells; (3) 30% epiboly; (4) 50%
epiboly; (5) tail bud; (6) 5-8 somites; (7) 15-20 somites; (8) 26 hpf; (9) 2 dpf; (10) 5
dpf; (11) negative control.
4.1.2 Tm9sf4 expression in embryonic tissues
In order to investigate tm9sf4 specific expression in embryonic tissues by
whole mount in situ hybridization (WISH), first we determined the
hybridization conditions and tested prepared probes, carrying out trials with
embryos at 24 hours post fertilization (hpf).
Results
39
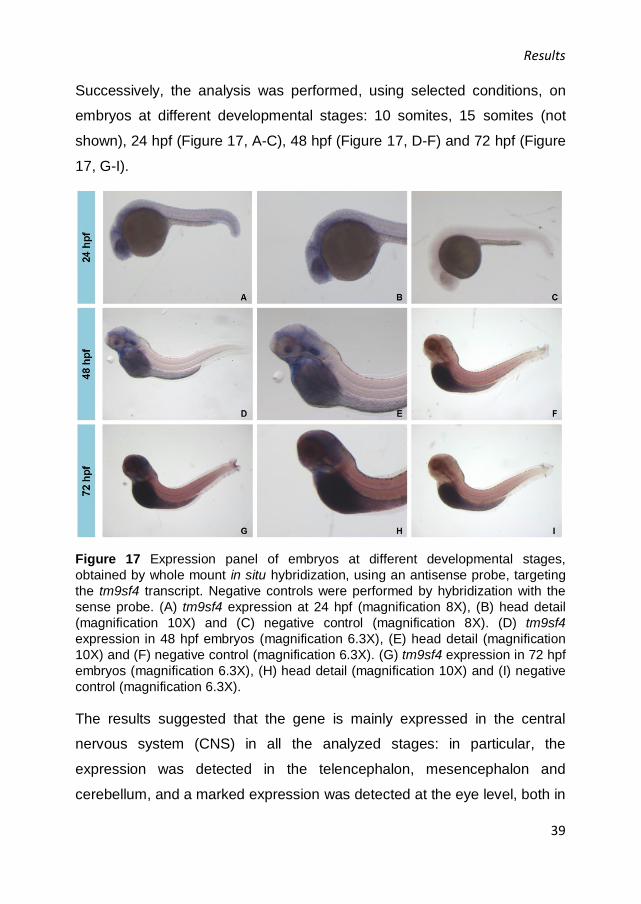
Successively, the analysis was performed, using selected conditions, on
embryos at different developmental stages: 10 somites, 15 somites (not
shown), 24 hpf (Figure 17, A-C), 48 hpf (Figure 17, D-F) and 72 hpf (Figure
17, G-I).
Figure 17 Expression panel of embryos at different developmental stages,
obtained by whole mount in situ hybridization, using an antisense probe, targeting
the tm9sf4 transcript. Negative controls were performed by hybridization with the
sense probe. (A) tm9sf4 expression at 24 hpf (magnification 8X), (B) head detail
(magnification 10X) and (C) negative control (magnification 8X). (D) tm9sf4
expression in 48 hpf embryos (magnification 6.3X), (E) head detail (magnification
10X) and (F) negative control (magnification 6.3X). (G) tm9sf4 expression in 72 hpf
embryos (magnification 6.3X), (H) head detail (magnification 10X) and (I) negative
control (magnification 6.3X).
The results suggested that the gene is mainly expressed in the central
nervous system (CNS) in all the analyzed stages: in particular, the
expression was detected in the telencephalon, mesencephalon and
cerebellum, and a marked expression was detected at the eye level, both in

Results
40
the retina and crystalline lens. Moreover, in 24 hpf embryos a superficial
signal in the tail was present (Figure 17, A), while 72 hpf embryos showed
a signal in notochord (Figure 17, G).
To better understand the specific localization of the embryonic signals, the
stained embryos were wax embedded and histological sections were
obtained as described in materials and methods.
At 24 hpf the sections of the head showed a scattered signal in the brain
and eye and a stronger signal in the crystalline lens and in the
periventricular wall of the diencephalon and mesencephalon, both at the
tegmentum and tectum level (Figure 18, B). Moreover, tm9sf4 gene
expression was detected in the periventricular wall of the hindbrain and in
the otic vesicles (Figure 18, C). At the tail level, we detected a punctuated
superficial signal in somites that may be either muscular or epithelial
(Figure 18, D).
Figure 18 (A) tm9sf4 expression in 24 hpf embryos, obtained by whole mount in
situ hybridization (magnification 8X). (B-D) Histological sections (8 m) of the
Results
41
stained embryo in the regions indicated in A by the lines 1, 2 and 3 respectively (B-
C, magnification 40X and D, magnification 20X).
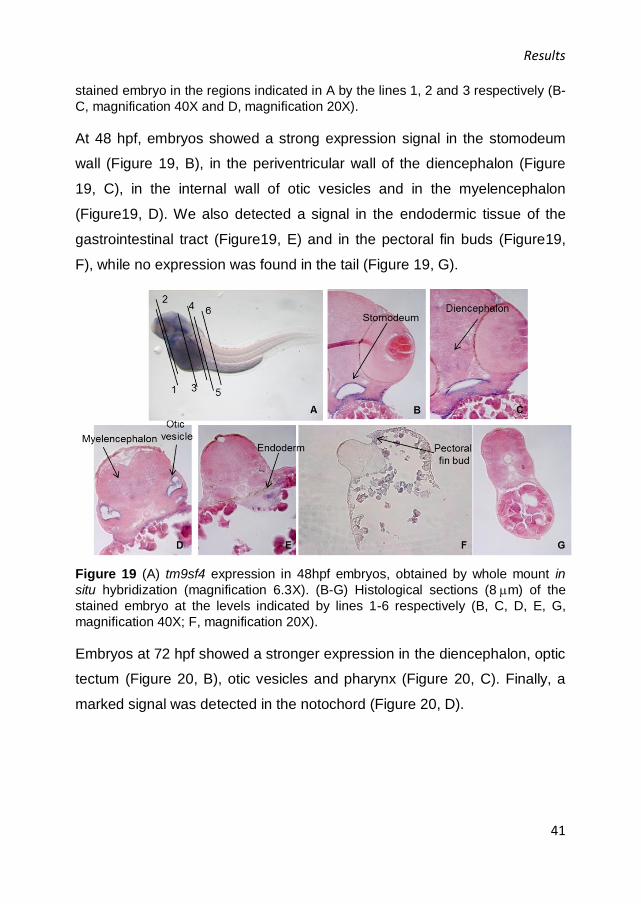
At 48 hpf, embryos showed a strong expression signal in the stomodeum
wall (Figure 19, B), in the periventricular wall of the diencephalon (Figure
19, C), in the internal wall of otic vesicles and in the myelencephalon
(Figure19, D). We also detected a signal in the endodermic tissue of the
gastrointestinal tract (Figure19, E) and in the pectoral fin buds (Figure19,
F), while no expression was found in the tail (Figure 19, G).
Figure 19 (A) tm9sf4 expression in 48hpf embryos, obtained by whole mount in
situ hybridization (magnification 6.3X). (B-G) Histological sections (8m) of the
stained embryo at the levels indicated by lines 1-6 respectively (B, C, D, E, G,
magnification 40X; F, magnification 20X).
Embryos at 72 hpf showed a stronger expression in the diencephalon, optic
tectum (Figure 20, B), otic vesicles and pharynx (Figure 20, C). Finally, a
marked signal was detected in the notochord (Figure 20, D).

Results
42
Figure 20 (A) tm9sf4 expression in 72 hpf embryos, obtained by whole mount in
situ hybridization (magnification 6.3X). (B-D) histological sections (8m) of the
stained embryo at the levels indicated by lines 1, 2, 3 (magnification 20X).
4.2 Loss-of-function analysis
4.2.1 Injection of translation blocking morpholino oligos in AB line
In order to investigate the function of Tm9sf4 protein in vivo during
embryonic development, we performed loss of function experiments by
injection of antisense morpholino oligonucleotides (MOs) in 1-4 cell stage
embryos. We started this study using an AUG-targeted oligonucleotide
(tm9sf4-MO), which acts as a translation-blocking morpholino. As a
negative control we injected a standard control morpholino (std-MO), which
targets the human -globin gene and has no targets in zebrafish.
At first, we tested two different doses of tm9sf4-MO: 0.5 and 1
pmol/embryo. At 48 hpf the morphants showed a low survival rate (39%
Results
43
and 22% of the total number of tm9sf4 morphants, respectively). The
surviving embryos displayed a marked necrosis in the central nervous
system and severe morphological defects. Therefore, we decided to co-
inject the tm9sf4-MO with an oligo targeting p53 (p53-MO), in order to
suppress possible off-target effects [48].
Then we performed the dose/survival curve by co-injecting different doses
of the tm9sf4-MO and p53-MO at the molar ratio of 1:1.5. The embryos
were visually followed for at least three days after injection. We took into
account the survival rate at 48 hpf, because within this period the majority
of the morphants died.
In concordance with the study of Nasevicius and Ekker [49], we obtained a
highly specific series of phenotypes dependent on dose. The results are
summarized in table 4 and the plots reported in figure 21; the
corresponding phenotypes are shown in figure 22.
As expected, the higher the dose of injection, the lower was the survival
rate. Moreover, for all the doses tested, the survival rate was higher in
tm9sf4/p53 morphants than in tm9sf4 morphants and lower in morphants
than in control embryos. These results suggest that the severe phenotypes,
observed following the injection with the tm9sf4 morpholino alone, were
partially due to off-target effects mediated by p53 activation. This effect
leads to the activation of the p53-dependent cell death pathway, in which a
N-terminal truncated p53 isoform is transcribed from a recently recognized
internal promoter [48].
Additionally, based on these data, we established that the optimal dose of
the tm9sf4-MO was 0.6 pmol/embryo, which allowed a survival rate of 79%
in double morphants and induced detectable defects in surviving embryos.
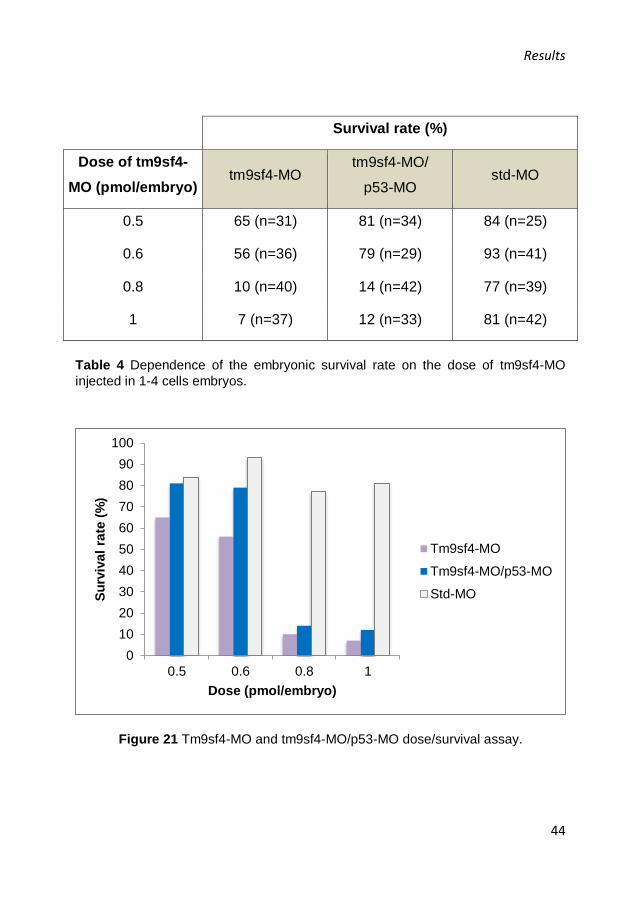
Results
44
Survival rate (%)
Dose of tm9sf4-
MO (pmol/embryo) tm9sf4-MO
tm9sf4-MO/
p53-MO std-MO
0.5 65 (n=31) 81 (n=34) 84 (n=25)
0.6 56 (n=36) 79 (n=29) 93 (n=41)
0.8 10 (n=40) 14 (n=42) 77 (n=39)
1 7 (n=37) 12 (n=33) 81 (n=42)
Table 4 Dependence of the embryonic survival rate on the dose of tm9sf4-MO
injected in 1-4 cells embryos.
Figure 21 Tm9sf4-MO and tm9sf4-MO/p53-MO dose/survival assay.
0
10
20
30
40
50
60
70
80
90
100
0.5 0.6 0.8 1
Su
rviv
al
rate
(%
)
Dose (pmol/embryo)
Tm9sf4-MO
Tm9sf4-MO/p53-MO
Std-MO

Results
45
Figure 22 Effects of Tm9sf4 protein loss-of-function on embryos at 48 hpf,
following injection with different doses of the tm9sf4-MO (C, F and I), Tm9sf4/p53-
MO at the ratio 1:1.5 (B, E and H) and std-MO (A, D, G). Panels in lines 1, 2 and 3
correspond to 0.5 pmol, 0.6 pmol and 0.8 pmol of morpholino, respectively (C:
magnification 1.25X; B and F: magnification 1.6X; A, G, E and D: magnification 1X;
I: magnification 2.5X; H: magnification 2X).
At the selected dose we obtained three phenotypic classes, one having a
phenotype similar to wild type embryos (43% of total number of morphants;
Figure 23, A), one having mild phenotype (35%; Figure 23, B) and one
having severe phenotype (22%; Figure 23, C).
At 24 hpf, tm9sf4/p53 morphants displayed necrosis in the head, even if it
was markedly reduced with respect to tm9sf4 morphants, and they showed
a consistent tail bending. Furthermore, like in tm9sf4 morphants, the brain
compartmentation was not as well defined as in control embryos (Figure
24, A-C).
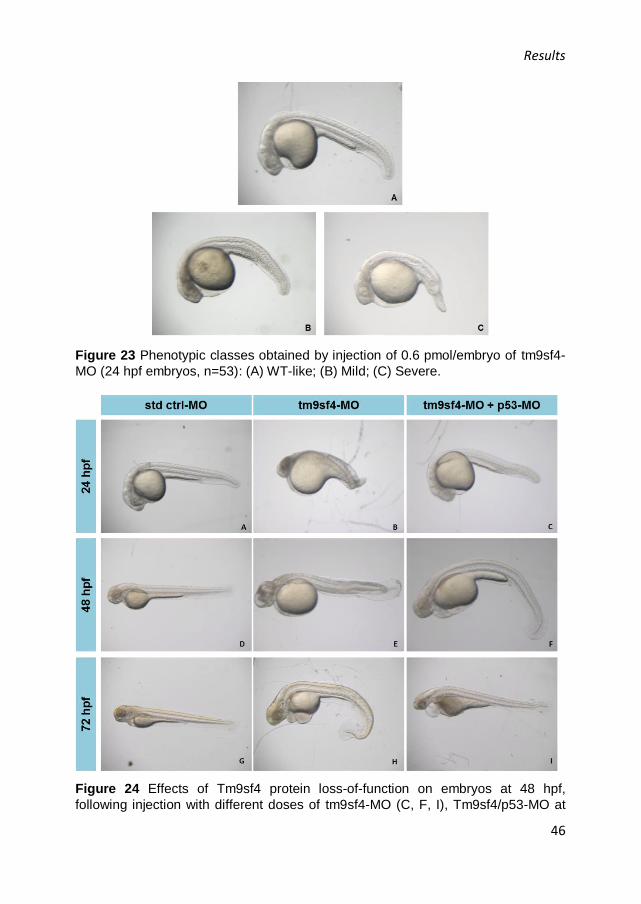
Results
46
Figure 23 Phenotypic classes obtained by injection of 0.6 pmol/embryo of tm9sf4-
MO (24 hpf embryos, n=53): (A) WT-like; (B) Mild; (C) Severe.
Figure 24 Effects of Tm9sf4 protein loss-of-function on embryos at 48 hpf,
following injection with different doses of tm9sf4-MO (C, F, I), Tm9sf4/p53-MO at

Results
47
the ratio 1:1.5 (B, E, H) and std-MO (A, D, G). The first line corresponds to 0.5
pmol, the second to 0.6 pmol and the third to 0.8 pmol of morpholino (C:
magnification 1.25X; B and F: magnification 1.6X; A, G, E, D: magnification 1X; I:
magnification 2.5X; H: magnification 2X).
At 48 hpf (Figure 24, D-F) this defect was partially restored and the
necrosis was reduced. The embryos displayed also cardiac edema and
some problems in blood flow; the circulation was either not complete or
totally absent in the tail. The same defects persisted at 72 hpf (Figure 24,
G-I).
4.2.2 Injection of splicing morpholino in AB line
We designed a splicing morpholino (Tm9i3e4-MO) targeting the junction
between intron 3 and exon 4, which was expected to induce the skipping of
exon 4 (164 bp), during mRNA splicing.
Morpholino activity was validated by RT-PCR on cDNA prepared from 24
hpf embryos, following injection with tm9I3E4-MO, using specific primers,
listed in materials and methods (Table 1). The results confirmed that
tm9I3E4-MO was able to induce exon skipping (Figure. 25).
Figure 25 Splicing morfolino validation, carried out by RT-PCR on 24 hpf embryos
injected with tm9I3E4-MO (1) and std-MO (2); -actin PCR on 24 hpf embryos
injected with tm9I3E4-MO (3) and std-MO (4); negative control (5).
A dose/survival curve was performed, by injecting different doses of
tm9I3E4-MO. Also in this case the survival rate was inversely proportional
to the morpholino dose (Table 5, Figure 26) and dose-dependent
phenotypes were observed (Figure 27).

Results
48
Survival rate (%)
Dose
(pmol/embryo) tm9I3E4-MO std-MO
0.5 92 (n=52) 95 (n=41)
0.7 81 (n=36) 96 (n=25)
0.8 79 (n=29) 84 (n=25)
1 50 (n=58) 91 (n=45)
Table 5 Dependence of the embryonic survival rate on the dose of Tm9I3E4-MO
injected.
Figure 26 Tm9I3E4-MO dose/survival assay.
0
10
20
30
40
50
60
70
80
90
100
0.5 0.7 0.8 1
Su
rviv
al
rate
(%
)
Dose (pmol/embryo)
Tm9I3E4-MO
Std-MO

Results
49
Figure 27 Effects of Tm9sf4 protein loss-of-function on embryos at 48 hpf,
following injection with different doses of std-MO (A, C, E, G, magnification 0.8X)
and Tm9I3E4-MO (B, D, H, magnification 1X;F, magnification 1.25X).
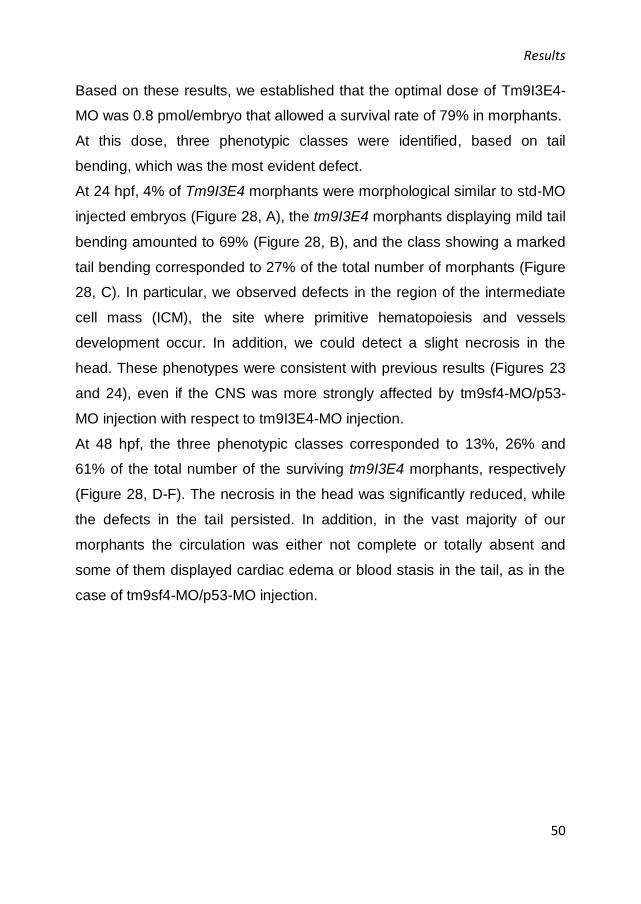
Results
50
Based on these results, we established that the optimal dose of Tm9I3E4-
MO was 0.8 pmol/embryo that allowed a survival rate of 79% in morphants.
At this dose, three phenotypic classes were identified, based on tail
bending, which was the most evident defect.
At 24 hpf, 4% of Tm9I3E4 morphants were morphological similar to std-MO
injected embryos (Figure 28, A), the tm9I3E4 morphants displaying mild tail
bending amounted to 69% (Figure 28, B), and the class showing a marked
tail bending corresponded to 27% of the total number of morphants (Figure
28, C). In particular, we observed defects in the region of the intermediate
cell mass (ICM), the site where primitive hematopoiesis and vessels
development occur. In addition, we could detect a slight necrosis in the
head. These phenotypes were consistent with previous results (Figures 23
and 24), even if the CNS was more strongly affected by tm9sf4-MO/p53-
MO injection with respect to tm9I3E4-MO injection.
At 48 hpf, the three phenotypic classes corresponded to 13%, 26% and
61% of the total number of the surviving tm9I3E4 morphants, respectively
(Figure 28, D-F). The necrosis in the head was significantly reduced, while
the defects in the tail persisted. In addition, in the vast majority of our
morphants the circulation was either not complete or totally absent and
some of them displayed cardiac edema or blood stasis in the tail, as in the
case of tm9sf4-MO/p53-MO injection.

Results
51
Figure 28 Phenotypic classes obtained by injection of 0.8 pmol/embryo of
tm9I3E4-MO. (A-C) 24 hpf embryos (n=26); (D-F) 48 hpf embryos (n=23). A, B, C
and F, magnification 6.3X; D and E, magnification 4 X.
4.3 The role of Tm9sf4 protein in the central nervous system
Since both the tm9sf4/p53 and tm9I3E4 morphants displayed defects in the
central nervous system, we planned to study the expression of specific
markers in the tm9sf4 morphants compared to controls, to individuate the
brain sub-structures that are affected by Tm9sf4 protein downregulation.
We selected a set of genes that are representative markers of specific
structures in the central nervous system (fgf8, shha, wnt1, otx2, otx3 -
otx1a-, krox20 -egr2a-). The expression of fgf8 (fibroblast growth factor 8),
shha (sonic hadgehog a), otx2 (orthodenticlehomeobox 2) and wnt1
(Wingless-type MMTV integration site family member 1) was assayed by
WISH on 24 hpf embryos (AB line), previously injected with tm9sf4-
MO/p53-MO.
In situ hybridization for fgf8 showed that in the tm9sf4 morphants the
signals were diffused and that the brain regions seemed to be less
organized with respect to control embryos. The midbrain-hindbrain
Results
52
boundary (MHB) appeared thicker than in controls and in general the
marker was at least apparently upregulated in tm9sf4 morphants (Figure
29, A-D).
Then we analyzed the expression of shha that marks the floor plate and
notochord. In tm9sf4 morphants the expression in the floor plate was
similar to controls, whereas the notochord had an altered morphology
respect to std-MO injected embryos (Figure 29, E-H).
Also otx2 signal was more diffused in tm9sf4/p53 morphants if compared to
control embryos and the brain regions were not well defined (Figure 29, I-
L).
Wnt1 expression confirmed that the MHB was thicker in tm9sf4 morphants
than in controls and also in this case the marker appeared upregulated in
our morphants (Figure 29, M-P).
Furthermore, the expression level of all these markers was assessed by
qRT-PCR on RNAs extracted from 24 hpf tm9sf4/p53 morphants and
compared to control embryos (Figure 30). According to WISH analyses, the
results showed that fgf8, shha, wnt1 and otx3 (otx1a) were upregulated in
morphants, following tm9sf4 downregulation. In particular, fgf8 was the
most differentially expressed; according to in situ hybridization results. In
contrast, the expression level of otx2 and krox20 (egr2a) was lower in
tm9sf4/p53-MO injected embryos than in controls.
These results are consistent with the literature about the pathways involved
in zebrafish brain development [50], [51], [52].
They were also confirmed by qRT-PCR on RNAs from 24 hpf tm9I3E4
morphants, with the exception of krox20, which was significantly up-
regulated in tm9I3E4 morphants, while it was downregulated in tm9sf4/p53
morphants, and otx3, which underwent a stronger upregulation in
tm9sf4/p53 morphants with respect to tm9I3E4 morphants (Figure 31).
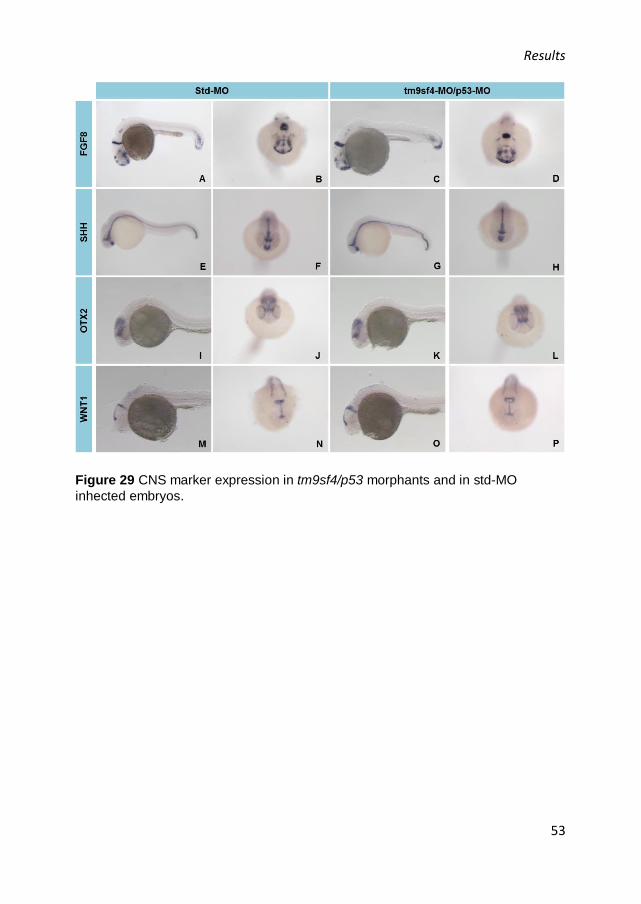
Results
53
Figure 29 CNS marker expression in tm9sf4/p53 morphants and in std-MO
inhected embryos.
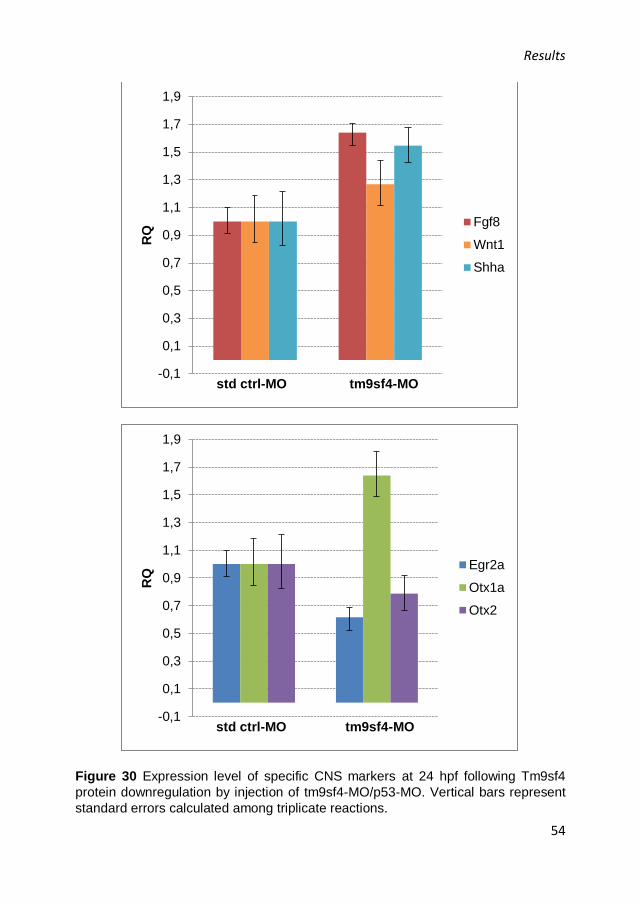
Results
54
Figure 30 Expression level of specific CNS markers at 24 hpf following Tm9sf4
protein downregulation by injection of tm9sf4-MO/p53-MO. Vertical bars represent
standard errors calculated among triplicate reactions.
-0,1
0,1
0,3
0,5
0,7
0,9
1,1
1,3
1,5
1,7
1,9
RQ
std ctrl-MO tm9sf4-MO
Fgf8
Wnt1
Shha
-0,1
0,1
0,3
0,5
0,7
0,9
1,1
1,3
1,5
1,7
1,9
RQ
std ctrl-MO tm9sf4-MO
Egr2a
Otx1a
Otx2

Results
55
Figure 31 Expression level of specific CNS markers at 24 hpf following tm9sf4
downregulation by injection of tm9I3E4-MO. Vertical bars represent standard errors
calculated among triplicate reactions.
4.4 The role of Tm9sf4 protein in zebrafish blood system
Since Tm9sf4 protein downregulation caused circulation defects in the
majority of embryos and, in some cases, cardiac edema and blood stasis in
the tail, we wanted to further investigate this issue by performing loss-of-
function studies, using a double transgenic line
tg(gata1:dsRed)sd2/tg(flk1:EGFP)S843, in which blood vessel endothelium is
labelled in green and circulating elements are labelled in red.
0
0,5
1
1,5
2
2,5
3
3,5
4
4,5R
Q
std-MO tm9I3E4-MO
Egr2a
Fgf8
Otx1a
Otx2
Shha
Wnt1
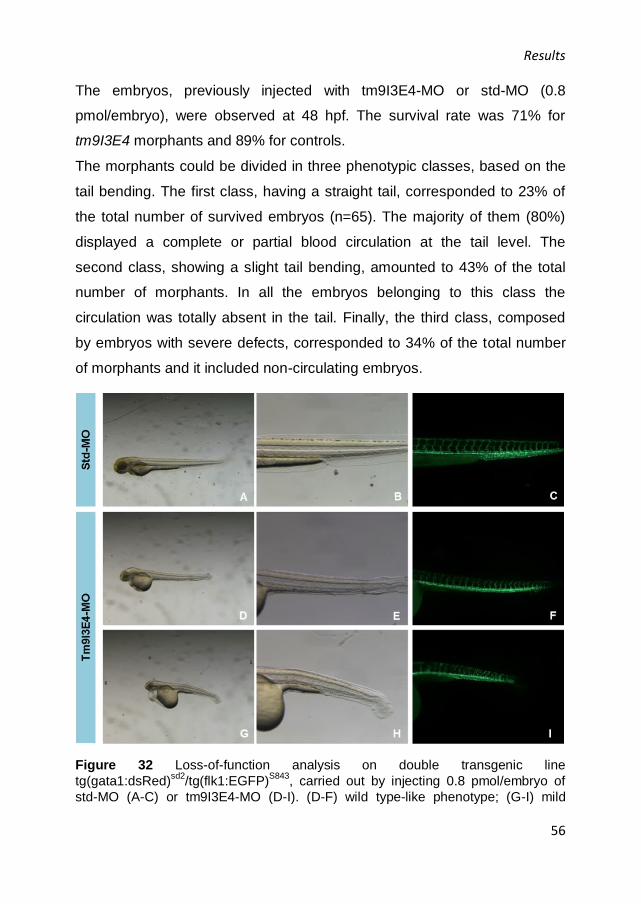
Results
56
The embryos, previously injected with tm9I3E4-MO or std-MO (0.8
pmol/embryo), were observed at 48 hpf. The survival rate was 71% for
tm9I3E4 morphants and 89% for controls.
The morphants could be divided in three phenotypic classes, based on the
tail bending. The first class, having a straight tail, corresponded to 23% of
the total number of survived embryos (n=65). The majority of them (80%)
displayed a complete or partial blood circulation at the tail level. The
second class, showing a slight tail bending, amounted to 43% of the total
number of morphants. In all the embryos belonging to this class the
circulation was totally absent in the tail. Finally, the third class, composed
by embryos with severe defects, corresponded to 34% of the total number
of morphants and it included non-circulating embryos.
Figure 32 Loss-of-function analysis on double transgenic line
tg(gata1:dsRed)sd2
/tg(flk1:EGFP)S843
, carried out by injecting 0.8 pmol/embryo of
std-MO (A-C) or tm9I3E4-MO (D-I). (D-F) wild type-like phenotype; (G-I) mild
Results
57
phenotype. The magnification is 32X for the whole embryos and 80X for the tail
details.
For which concerns the first class of morphants, the main axial vessels
(Dorsal Aorta and Posterior Cardinal Vein) and intersomitic vessels did not
display detectable defects (Figure 32, D-F). Taking into account the second
class, in which the circulation was absent, despite the tail did not have
significant morphological defects, we observed that the embryos reported
defects at the intersomitic vessels, which are formed by angiogenesis
(Figure 32, G-I).
4.5 Expression analysis of EMT-associated markers
Our preliminary results suggested that tm9sf4 is involved in the process of
epithelial to mesenchymal transition (EMT) in LA7 cells, used as a model of
mammary gland cancer stem cell (CSC). In fact, we demonstrated that the
expression level of tm9sf4 was higher in LA7 CSCs if compared to LA7
progeny (Figure 7). Moreover, tm9sf4 downregulation induced changes in
LA7 CSCs morphology, leading them to trans-differentiate to
mesenchymal-like cells (Figure 8). In support of this, the expression level of
EMT-associated markers (twist1, zeb1, zeb2) increased following tm9sf4
downregulation (Figure 9). Since mechanisms and pathways involved in
EMT are conserved in all vertebrates, we wanted to investigate tm9sf4 role
in this process, using zebrafish as a model system. First, we verified that
these genes are conserved in D. rerio and that they have functions similar
to mammals. In particular, in zebrafish we found two orthologues for
mammals twist1 (twist1a and twist1b), two for zeb2 (zeb2a and zeb2b) and
one for twist2. Then, we evaluated their expression level by qRT-PCR,
performed on RNAs from embryos previously injected with tm9sf4-MO/p53-
MO. In agreement with our previous results obtained with LA7 cells, twist2
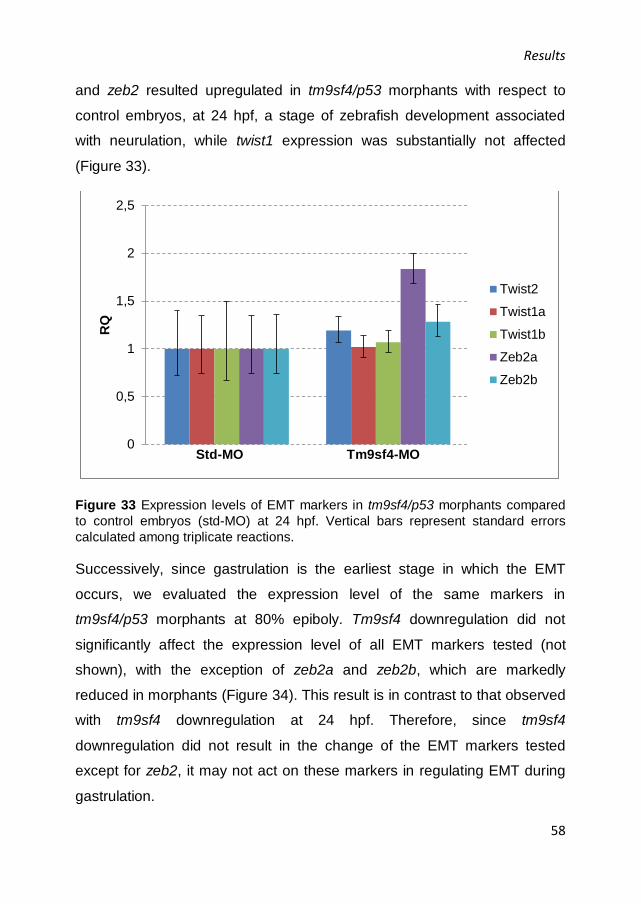
Results
58
and zeb2 resulted upregulated in tm9sf4/p53 morphants with respect to
control embryos, at 24 hpf, a stage of zebrafish development associated
with neurulation, while twist1 expression was substantially not affected
(Figure 33).
Figure 33 Expression levels of EMT markers in tm9sf4/p53 morphants compared
to control embryos (std-MO) at 24 hpf. Vertical bars represent standard errors
calculated among triplicate reactions.
Successively, since gastrulation is the earliest stage in which the EMT
occurs, we evaluated the expression level of the same markers in
tm9sf4/p53 morphants at 80% epiboly. Tm9sf4 downregulation did not
significantly affect the expression level of all EMT markers tested (not
shown), with the exception of zeb2a and zeb2b, which are markedly
reduced in morphants (Figure 34). This result is in contrast to that observed
with tm9sf4 downregulation at 24 hpf. Therefore, since tm9sf4
downregulation did not result in the change of the EMT markers tested
except for zeb2, it may not act on these markers in regulating EMT during
gastrulation.
0
0,5
1
1,5
2
2,5
RQ
Std-MO Tm9sf4-MO
Twist2
Twist1a
Twist1b
Zeb2a
Zeb2b
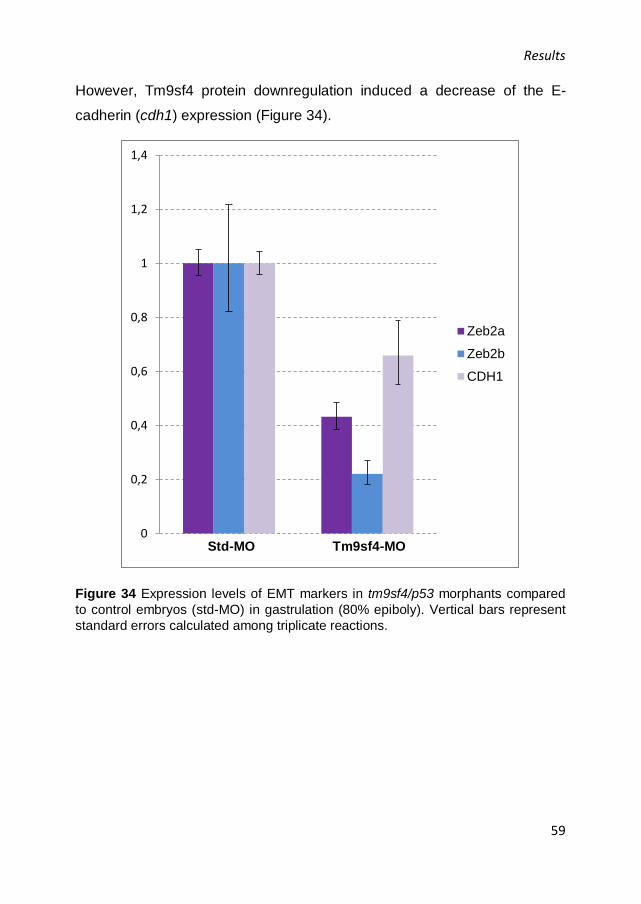
Results
59
However, Tm9sf4 protein downregulation induced a decrease of the E-
cadherin (cdh1) expression (Figure 34).
Figure 34 Expression levels of EMT markers in tm9sf4/p53 morphants compared
to control embryos (std-MO) in gastrulation (80% epiboly). Vertical bars represent
standard errors calculated among triplicate reactions.
0
0,2
0,4
0,6
0,8
1
1,2
1,4
Std-MO Tm9sf4-MO
Zeb2a
Zeb2b
CDH1

Discussion
60
5. DISCUSSION
In agreement with the previous studies [26], we observed that during
zebrafish development tm9sf4 was expressed starting from fertilization to 5
dpf, suggesting that the expression is both maternal and zygotic (Figure
16). Furthermore, these studies suggested that the gene is ubiquitously
expressed in zebrafish adult tissues and has a role in innate immunity
signaling [26]. We demonstrated by WISH that tm9sf4 was mainly
expressed in the central nervous system (CNS) during all the analyzed
stages (24 hpf, 48 hpf, 72 hpf) and, in particular, in the telencephalon,
mesencephalon and cerebellum. Additionally, a marked expression of
tm9sf4 was detected at the eye level, both in retina and crystalline lens
(Figure 17). Interestingly, histological sections of the stained embryos
showed that the gene was mostly expressed in the periventricular regions
of the diencephalon and mesencephalon (Figures 18-20).
To investigate Tm9sf4 protein function during embryonic development,
loss-of-function experiments were performed by the injection of two
different antisense morpholino oligonucleotides (MOs): a translation-
blocking and a splicing morpholino. The translation blocking oligonucleotide
(tm9sf4-MO) was designed to target the transcript in the region of the
starting codon AUG. Injection of tm9sf4-MO caused severe defects in the
central nervous system and a very low survival of the morphants. Co-
injecting tm9sf4-MO and an oligo targeting p53 (p53-MO), the CNS defects
were reduced and the survival increased, suggesting that the defects
produced by the injection of tm9sf4-MO alone were due to off-target effects.
In fact, some morpholinos showed activation of a p53-dependent cell death
pathway in a sequence-dependent manner, inducing the transcription of a
N-terminal truncated p53 isoform, that uses a recently recognized internal
Discussion
61
promoter [48]. Hence, in all the successive experiments we co-injected
tm9sf4-MO with p53-MO.
The splicing morpholino (tm9I3E4-MO) was targeted to the junction
between intron 3 and exon 4, in order to produce an alternative splicing,
resulting in the skipping of exon 4 and in the deletion of a transmembrane
domain with consequent overturning of the protein membrane topology. In
these conditions, the resulting protein is expected to have an altered
functionality.
Following tm9sf4-MO/p53-MO injection, 24 hpf embryos displayed necrosis
in the head and a consistent tail bending (Figure 24). Additionally, the brain
compartmentalization was not as well defined as in control embryos. At 48
hpf the morphants displayed also cardiac edema and some problems in
blood flow; defects persisting up to 72 hpf.
These results were substantially confirmed by tm9I3E4-MO injection
(Figure 28). At 24 hpf, the most evident defect of the tm9I3E4-MO injected
embryos was a marked tail bending. In particular, we observed defects in
the region of the intermediate cell mass (ICM), the site where primitive
hematopoiesis and vessels development occur. We could detect a slight
necrosis in the head, although the CNS was most strongly affected by
tm9sf4-MO/p53-MO injection. At 48 hpf, the necrosis in the head was
significantly reduced, while the defects in the tail persisted. Furthermore, in
the majority of the morphants the circulation was either not complete or
totally absent and some of them displayed cardiac edema or blood stasis in
the tail, as in the case of tm9sf4-MO/p53-MO injection.
Since the tm9sf4 gene was expressed in the central nervous system and
protein downregulation caused both necrosis in the head and a reduced
brain structure definition, we hypothesized that Tm9sf4 protein has a role in
CNS development. Therefore, we analyzed the expression of specific brain

Discussion
62
markers in the morphants, to individuate the brain sub-structures that are
affected by Tm9sf4 protein downregulation. We selected a set of genes that
are representative markers of specific structures of the central nervous
system (fgf8, shha, wnt1, otx2, otx3, and krox20). All the analyzed markers
were detected in tm9sf4 morphants, but had diffuse signals and the brain
regions were less defined in our morphants compared to control embryos.
Moreover, the midbrain-hindbrain boundary (MHB) was thicker and both
fgf8 and wnt1 appeared upregulated in tm9sf4 morphants than in control
embryos (Figure 29). This result was confirmed by qRT-PCR on mRNA
from 24 hpf morphants, which showed that fgf8, shha, wnt1 and otx3
(otx1a) were upregulated in tm9sf4 morphants compared to control
embryos, whereas the expression levels of otx2 and krox20 (egr1a) were
lower in tm9sf4-MO than in std-MO injected embryos (Figure 30).
This result is consistent with the literature about the pathways involved in
zebrafish brain development [50], [51], [52]. For example, fgf8 expression is
closely associated with tissues expressing shh and bmp4 and they function
together in the patterning of regions of the embryonic head. In particular,
fgf8 regulates regionalization of the prosencephalon through inhibition of
otx2 and emx2 [53]. Furthermore, the genetic hierarchy of gene expression
at the MHB involves multiple positive and negative regulatory loops that
result in the establishment of non-overlapping domains of wnt1 and fgf8 on
either side of the boundary and the consequent specification of the
cerebellum. Both wnt1 and fgf8 are necessary for the development of the
posterior midbrain and cerebellum [54], [55]. Wnt1 regulates the genetic
network, including otx2, required for the control of the identity and fate of
midbrain dopaminergic progenitors [50]. Moreover, wnt1 is expressed in a
distinct population of boundary cells that forms at the interface of the
segments in the zebrafish hindbrain. Wnt1 knockdown leads to ectopic
Discussion
63
expression of boundary cell markers in non-boundary regions of the
hindbrain [56].
These results were confirmed by injection of tm9I3E4-MO (Figure 31), with
the exception of krox20, which was significantly up-regulated in tm9I3E4
morphants, while it was downregulated in tm9sf4 morphants, and otx3,
which underwent a stronger upregulation in tm9sf4/p53 morphants with
respect to tm9I3E4 morphants (Figures 30 and 31).
In addition to the defects observed in the CNS, loss-of-function experiments
showed that protein downregulation caused defects in the ICM region and,
at 48 hpf, in the majority of the morphants the circulation was significantly
impaired, with some of them displaying cardiac edema or blood stasis in
the tail.
This finding was confirmed by loss-of-function experiments on the double
transgenic line tg(gata1:dsRed)sd2/tg(flk1:EGFP)S843, which allows the
visualization through fluorescence microscopy of both vessel endothelium
and circulating erythrocytes. In the majority of the morphants the tail was
bent and the circulation was absent, although the tail did not have
significant morphological defects. This class of morphants reported defects
at the intersomitic vessels (Figure 34), which are formed by angiogenesis.
Interestingly, it was suggested that angiogenesis is a paradigm for many
processes including tissue branching, sprouting and cell migration [25].
Thereby, investigating a possible role of tm9sf4 in angiogenesis may allow
us to clarify the protein function in cell migration and branching. It will be
necessary to establish whether the circulation problems are caused by
defects in the heart development or rather the cardiac edema is due to the
defective intersomitic vessels.
Additionally, we found that tm9sf4 gene was differentially expressed in LA7
cancer stem cells (CSC) with respect to LA7 elongated cells. We
Discussion
64
demonstrated that tm9sf4 downregulation by RNA interference resulted in
important changes in LA7 CSC morphology, inducing a trans-differentiation
of the CSCs themselves or descendent lineage cells into mesenchymal-like
cells, as suggested by the up-regulation of EMT-associated markers by
siRNA treatment. Therefore, we hypothesized that the gene is involved in
EMT process.
Since it has been shown that many signaling pathways induce EMT in both
embryonic development and in normal and transformed cells [27], [44], we
wanted to investigate the involvement of tm9sf4 gene in EMT during
zebrafish embryonic development.
Interestingly, according to our previous hypothesis, in zebrafish embryos,
the gene was found to be most strongly expressed in periventricular
regions of the diencephalon and mesencephalon, where there are
proliferating cells that are going to migrate and could undergo epithelial to
mesenchymal transition.
Moreover, we observed that the EMT markers found to be upregulated in
LA7 cells had conserved sequences and functions in zebrafish. We
identified two orthologues for mammal twist1 (twist1a and twist1b), two for
zeb2 (zeb2a and zeb2b) and one for twist2.
At 24 hpf, tm9sf4 downregulation by morpholino injection leaded to an
increase of the expression level of twist2 and zeb2, whereas twist1
expression was not sensibly affected (Figure 32), similarly as observed in
LA7 cells, supporting that the gene could have a role in inhibiting EMT
processes occurring during embryonic development. This is in contrast with
that observed after tm9sf4 downregulation during zebrafish gastrulation
(80% epiboly), in which all EMT markers, except for zeb2, did not show a
change in expression (Figure 33). However, previous studies suggested
that twist is not crucial for EMT events associated to gastrulation and that
snail may be the principal effector [27].

Discussion
65
Therefore, since tm9sf4 downregulation did not result in the change of the
EMT markers tested except for zeb2, it may not act on these markers to
regulate EMT during gastrulation.
Studying the pathways involved in development is difficult due to the
complex hierarchy of the components involved in these systems; in
particular, many feedback and feedforward loops are involved in embryonic
EMT-associated processes. Analysis is also complicated by the fact that
the gene expression studies are mostly carried out by in situ hybridization,
which does not reveal the onset of gene expression, since it requires a
sufficient amount of RNA for detection, and when the gene product reaches
a concentration sufficient to produce physiological effects. Moreover,
generally the expression levels of hundreds of genes change in response to
experimental and genetic perturbations [57]. Hence, determining in which
order the genes are expressed or repressed becomes a very challenging
issue.
Notably, at cellular level, pathological EMTs are very similar to
physiological EMTs: they are regulated by the same signaling pathways,
regulators and effector molecules [27]. Some of the most known
components of signaling pathways involved in embryogenesis are reported
in table 6.
All the pathways, regarding both development and tumor progression,
converge on E-cadherin regulation. Functional loss of E-cadherin in an
epithelial cell has been considered a hallmark of EMT. Some zinc-finger
transcription factors were found to directly bind the E-box elements of the
E-cadherin promoter and repress its transcription, thereby causing the loss
of cell-cell adhesion. These factors include, among others, Snail [39] and
ZEB family transcription factors ZEB1 (EF1) [40], [58] and ZEB2 (SIP1)
[41]. These factors are capable of suppressing critical components that
contribute to set up of the epithelial phenotype. For instance, recently,

Discussion
66
ZEB1, Snail and Slug were reported to repress the transcription of polarity
factors, including Crumbs3 and Lgl2 [58]. These transcription factors are
involved in various EMT processes during embryogenesis (Table 6).
Table 6 EMT-associated signaling pathways components involved in embryonic
development.
We found zeb2 to be upregulated following tm9sf4 knock down both in LA7
cell line, used as a model of mammary gland cancer stem cells, and during
zebrafish embryonic development, suggesting that tm9sf4 downregulation
cause an increase of zeb2 expression level and consequent E-cadherin
transcription repression mediated by zeb2, leading to the loss of cell-cell
adhesion and promoting EMT. Therefore, tm9sf4 could negatively regulate
EMT during zebrafish neurulation, by promoting cell-cell adhesion.
In zebrafish, the anterior neurocranium is derived from the anterior cranial
neural crest cells, which migrate from the dorsal neural tube and reach the
head, following a path along the optic stalks, medial to the eyes. Migration
begins at 12 hpf and by 15 hpf the cells moves into pharyngeal arches.
Successively, neural crest cells migrate around the eye, where they cannot
be detected until 24 hpf.
Therefore, the changes in expression of EMT markers suggest that tm9sf4
expression inhibits EMT during neurulation.
Developmental
process
TGF-
pathway
Wnt
pathway
Notch
pathway
TK
receptors
Transcription
factors
Mesoderm
formation Nodal Canonical Wnt
Not
determined FGFR Snail
Neural crest
migration
TGF-1,2,3
BMP
Canonical Wnt
Non canonical
Regulate BMP
signaling
FGFR
PDGFR
Snail, Slug,
Twist1, ZEB2
Cardiac valve
formation TGF-3
Not
determined
Jagged 1
Notch 1 ErbB3
Not
determined
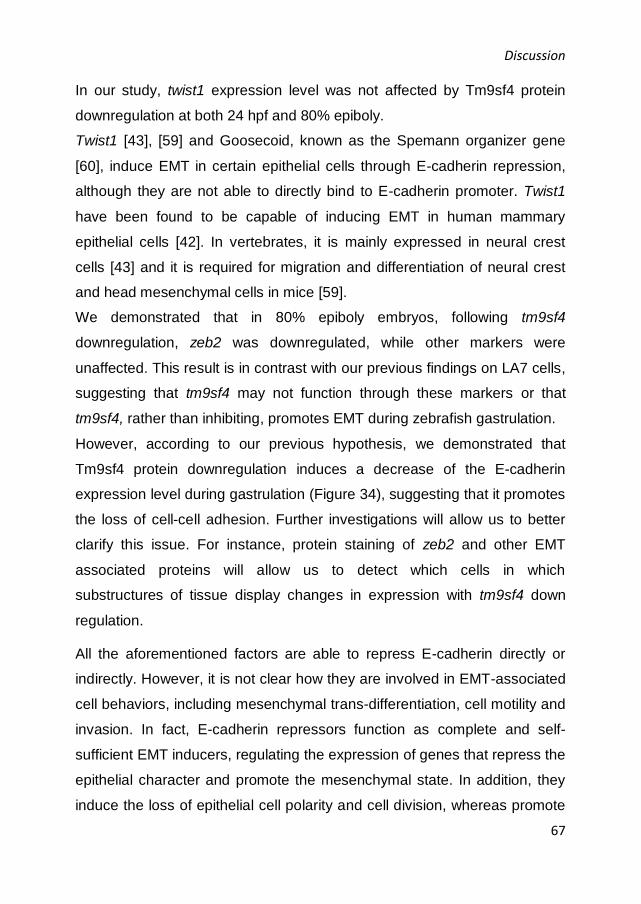
Discussion
67
In our study, twist1 expression level was not affected by Tm9sf4 protein
downregulation at both 24 hpf and 80% epiboly.
Twist1 [43], [59] and Goosecoid, known as the Spemann organizer gene
[60], induce EMT in certain epithelial cells through E-cadherin repression,
although they are not able to directly bind to E-cadherin promoter. Twist1
have been found to be capable of inducing EMT in human mammary
epithelial cells [42]. In vertebrates, it is mainly expressed in neural crest
cells [43] and it is required for migration and differentiation of neural crest
and head mesenchymal cells in mice [59].
We demonstrated that in 80% epiboly embryos, following tm9sf4
downregulation, zeb2 was downregulated, while other markers were
unaffected. This result is in contrast with our previous findings on LA7 cells,
suggesting that tm9sf4 may not function through these markers or that
tm9sf4, rather than inhibiting, promotes EMT during zebrafish gastrulation.
However, according to our previous hypothesis, we demonstrated that
Tm9sf4 protein downregulation induces a decrease of the E-cadherin
expression level during gastrulation (Figure 34), suggesting that it promotes
the loss of cell-cell adhesion. Further investigations will allow us to better
clarify this issue. For instance, protein staining of zeb2 and other EMT
associated proteins will allow us to detect which cells in which
substructures of tissue display changes in expression with tm9sf4 down
regulation.
All the aforementioned factors are able to repress E-cadherin directly or
indirectly. However, it is not clear how they are involved in EMT-associated
cell behaviors, including mesenchymal trans-differentiation, cell motility and
invasion. In fact, E-cadherin repressors function as complete and self-
sufficient EMT inducers, regulating the expression of genes that repress the
epithelial character and promote the mesenchymal state. In addition, they
induce the loss of epithelial cell polarity and cell division, whereas promote

Discussion
68
cell survival. The EMT inducers that indirectly repress E-cadherin
transcription frequently activate some of the direct repressors and they also
act on multiple targets.
For example, it has been demonstrated that snail1 [61], zeb1 [58] and TGF-
alter epithelial cell polarity by repressing the transcription of components
belonging to the complexes involved in the maintaining of apicobasal
polarity (Par, Crumbs, Scribble). Moreover, Snail and ZEB factors induce
the expression of metalloproteases that degrade the basement membrane,
some of which are sufficient to induce EMT, by triggering a positive
regulatory feedback loop [62]. However, both in development and in
carcinoma progression, snail1 is expressed at the onset of the transition,
whereas snail2, ZEB genes and twist are successively induced to maintain
the migratory mesenchymal state [63].
An additional attractive pathway is the -catenin-mediated transcription
program. The loss of E-cadherin from adherent junctions causes the
release into the cytoplasm of catenin, which enters the nucleus and
activate transcription of factors including slug [64] and twist1 [65], thereby
contributing to the EMT program.
In addition to E-cadherin, N-cadherin-mediated adhesion plays an
important role in neural crest associated EMT, where N-cadherin and
cadherin 6 downregulation occurs as well as expression of the less
adhesive type II cadherins, including cadherin 7 and 11 [66].
The role of tm9sf4 has not been explored in this context. Investigating
whether tm9sf4 influences other components of the EMT signaling
pathways acting during zebrafish development will allow us in the future to
clarify its role in this process.
It is interesting to consider that several studies reported that tm9sf4 could
be involved in cell adhesion both in Dictyostelium [1] and Drosophila
plasmatocytes [3], [4]. In addition, it has been recently proposed that

Discussion
69
tm9sf4 hypoxia-mediated downregulation induces a decrease of cell
adhesion in leukemic cells to fibronectin [67]. All of these studies support
our hypothesis that tm9sf4 has a role in cell-cell contact.

Conclusions
70
6. CONCLUSIONS
According to previous findings [26], we found that during zebrafish
embryonic development tm9sf4 was expressed in all of the stages from
oocytes to 5 dpf, suggesting that the expression is both maternal and
zygotic.
Furthermore, the gene was found to be mainly expressed in the brain and
loss-of-function analyses by antisense morpholino oligonucleotide injection
showed that tm9sf4 downregulation induced defects in the CNS, which
displayed an impaired regionalization.
WISH analysis of specific brain markers (fgf8, otx2, shha, wnt1) confirmed
that the brain regions targeted by these probes were all formed in tm9sf4
morphants, but they were less defined with respect to those observed in
control embryos; additionally, the midbrain-hindbrain boundary (MHB)
appeared thicker in our morphants than in control embryos.
Real Time PCR showed that, as expected, tm9sf4 downregulation induced
an increase of the expression level of fgf8, shha, wnt1 and a reduction of
otx2 level. The results regarding the effect of tm9sf4 downregulation on
krox20 (egr1a) and otx3 (otx1a) were controversial.
In situ hybridization for krox20 and otx3 will be performed to further
investigate this issue. Expression analysis of other markers is now in
progress, to better understand the specific regions affected by protein
downregulation and, possibly, the pathways in which they are involved.
However, these findings suggest a role for tm9sf4 in zebrafish brain
development.
Additionally, tm9sf4 downregulation caused 24 hpf embryos to have a bent
tail, with defects in the ICM region, the site where the primitive
hematopoiesis and blood vessels development occur. At 48 hpf the blood

Conclusions
71
circulation was significantly affected by protein downregulation and
embryos reported cardiac edema and blood stasis in the tail, in addition to
morphological defects in the intersomitic vessels, which are formed by
angiogenesis. Interestingly, it was suggested that angiogenesis represents
a paradigm for many core biological processes such as tissue
morphogenesis through branching, cell migration and lumen formation, all
of which are involved in the morphogenesis of many other organs [25].
It will be necessary to establish whether the circulation problems are
caused by defects in the heart development or rather the cardiac edema is
due to the defective intersomitic vessels. At this purpose, both expression
analysis of cardiac markers, following protein downregulation, and loss-of-
function experiments, using specific transgenic lines, will be carried out.
Our previous studies showed that tm9sf4 gene was more strongly
expressed in LA7 cancer stem cells with respect to LA7 elongated cells.
Tm9sf4 downregulation by RNA interference resulted in important changes
in LA7 CSC morphology, inducing them to trans-differentiate to
mesenchymal-like cells. According to these results, we demonstrated that
the expression of EMT-associated markers by LA7 cells increased following
tm9sf4 downregulation.
Based on the foundation that cellular processes and signaling pathways
governing EMT are conserved in embryogenesis and tumor progression,
we proposed that tm9sf4 is involved in EMT processes occurring during
zebrafish embryonic development.
We demonstrated that tm9sf4 downregulation induced an increase of zeb2
and twist2 expression level by 24 hpf embryos, suggesting that tm9sf4
induces negative regulation of these factors, inhibiting E-cadherin
transcriptional repression and thereby promoting cell-cell adhesion. This
hypothesis is consistent with previous studies, which proposed a role of
Conclusions
72
tm9sf4 in cell adhesion [1], [3], [4], [67]. Therefore, tm9sf4 could be
involved in repressing EMT during zebrafish neurulation.
In accordance to this hypothesis, we demonstrated that Tm9sf4 protein
downregulation induced a decrease of E-cadherin expression level during
gastrulation, which could promote the loss of cell-cell adhesion.
Interestingly, the gene was found to be mainly expressed in periventricular
regions of the diencephalon and mesencephalon, where there are
proliferating cells that are going to migrate and could undergo epithelial to
mesenchymal transition.
In the near future we are going to further investigate this issue by
determining in which specific CNS cells the gene is expressed and by
studying tm9sf4 effect on the expression of other components of the EMT
signaling pathways, including Wnt signaling, TGF- (BMP, Nodal), Snail
and E-cadherin, both in zebrafish gastrulation and neurulation.

References
73
7. REFERENCES
[1] S. Cornillon, E. Pech, M. Benghezal, K. Ravanel, E. Gaynor, F. Letourneur, F. Brückert, and P. Cosson, “Phg1p is a nine-transmembrane protein superfamily member involved in dictyostelium adhesion and phagocytosis.,” J. Biol. Chem., vol. 275, no. 44, pp. 34287–92, Nov. 2000.
[2] F. Lozupone, M. Perdicchio, D. Brambilla, M. Borghi, S. Meschini, S. Barca, M. L. Marino, M. Logozzi, C. Federici, E. Iessi, A. de Milito, and S. Fais, “The human homologue of Dictyostelium discoideum phg1A is expressed by human metastatic melanoma cells.,” EMBO Rep., vol. 10, no. 12, pp. 1348–54, Dec. 2009.
[3] E. Bergeret, J. Perrin, M. Williams, D. Grunwald, E. Engel, D. Thevenon, E. Taillebourg, F. Bruckert, P. Cosson, and M.-O. Fauvarque, “TM9SF4 is required for Drosophila cellular immunity via cell adhesion and phagocytosis.,” J. Cell Sci., vol. 121, no. Pt 20, pp. 3325–34, Oct. 2008.
[4] M.-O. Fauvarque and M. J. Williams, “Drosophila cellular immunity: a story of migration and adhesion,” J. Cell Sci., vol. 124, no. 9, pp. 1373–1382, 2011.
[5] L. Lugini, P. Matarrese, A. Tinari, F. Lozupone, C. Federici, E. Iessi, M. Gentile, F. Luciani, G. Parmiani, L. Rivoltini, W. Malorni, and S. Fais, “Cannibalism of live lymphocytes by human metastatic but not primary melanoma cells.,” Cancer Res., vol. 66, no. 7, pp. 3629–38, Apr. 2006.
[6] S. Fais and M.-O. Fauvarque, “TM9 and cannibalism: how to learn more about cancer by studying amoebae and invertebrates.,” Trends Mol. Med., vol. 18, no. 1, pp. 4–5, Jan. 2012.
[7] S. Fais, “Cannibalism: a way to feed on metastatic tumors.,” Cancer Lett., vol. 258, no. 2, pp. 155–64, Dec. 2007.

References
74
[8] L. Lugini, F. Lozupone, P. Matarrese, C. Funaro, F. Luciani, W. Malorni, L. Rivoltini, C. Castelli, A. Tinari, A. Piris, G. Parmiani, and S. Fais, “Potent Phagocytic Activity Discriminates Metastatic and Primary Human Malignant Melanomas: A Key Role of Ezrin,” Lab. Investig., vol. 83, no. 11, pp. 1555–1567, 2003.
[9] R. Dulbecco, M. Bologna, and M. Unger, “Role of Thy-1 antigen in the in vitro differentiation of a rat mammary cell line.,” Proc. Natl. Acad. Sci. U. S. A., vol. 76, no. 4, pp. 1848–1852, 1979.
[10] J. J. Going, H. M. Abd El-Monem, and J. a Craft, “Clonal origins of human breast cancer,” J Pathol, vol. 194, no. 4, pp. 406–412, 2001.
[11] I. Zucchi, S. Sanzone, S. Astigiano, P. Pelucchi, M. Scotti, V. Valsecchi, O. Barbieri, G. Bertoli, a Albertini, R. a Reinbold, and R. Dulbecco, “The properties of a mammary gland cancer stem cell.,” Proc. Natl. Acad. Sci. U. S. A., vol. 104, no. 25, pp. 10476–81, Jun.
2007.
[12] C. Cocola, S. Sanzone, S. Astigiano, P. Pelucchi, E. Piscitelli, L. Vilardo, O. Barbieri, G. Bertoli, R. a Reinbold, and I. Zucchi, “A rat mammary gland cancer cell with stem cell properties of self-renewal and multi-lineage differentiation.,” Cytotechnology, vol. 58, no. 1, pp. 25–32, Sep. 2008.
[13] I. Zucchi, S. Astigiano, G. Bertalot, S. Sanzone, C. Cocola, P. Pelucchi, G. Bertoli, M. Stehling, O. Barbieri, a Albertini, H. R. Schöler, B. G. Neel, R. a Reinbold, and R. Dulbecco, “Distinct populations of tumor-initiating cells derived from a tumor generated by rat mammary cancer stem cells.,” Proc. Natl. Acad. Sci. U. S. A., vol. 105, no. 44, pp. 16940–5, Nov. 2008.
[14] J. F. Amatruda, J. L. Shepard, H. M. Stern, and L. I. Zon, “Zebrafish as a cancer model system.,” Cancer Cell, vol. 1, no. 3, pp. 229–31,
Apr. 2002.
[15] N. D. Meeker and N. S. Trede, “Immunology and zebrafish: spawning new models of human disease.,” Dev. Comp. Immunol.,
References
75
vol. 32, no. 7, pp. 745–57, Jan. 2008.
[16] K. Dooley and L. I. Zon, “Zebrafish: a model system for the study of human disease.,” Curr. Opin. Genet. Dev., vol. 10, no. 3, pp. 252–6, Jun. 2000.
[17] C. Sullivan and C. H. Kim, “Zebrafish as a model for infectious disease and immune function.,” Fish Shellfish Immunol., vol. 25, no. 4, pp. 341–50, Oct. 2008.
[18] Z. Lele and P. H. Krone, “The zebrafish as a model system in developmental, toxicological and transgenic research,” Biotechnol. Adv., vol. 14, no. 1, pp. 57–72, Jan. 1996.
[19] R. M. White, A. Sessa, C. Burke, T. Bowman, J. LeBlanc, C. Ceol, C. Bourque, M. Dovey, W. Goessling, C. E. Burns, and L. I. Zon, “Transparent Adult Zebrafish as a Tool for In Vivo Transplantation Analysis,” Cell Stem Cell, vol. 2, no. 2, pp. 183–189, 2008.
[20] G. J. Lieschke, a C. Oates, M. O. Crowhurst, a C. Ward, and J. E. Layton, “Morphologic and functional characterization of granulocytes and macrophages in embryonic and adult zebrafish.,” Blood, vol. 98, no. 10, pp. 3087–3096, 2001.
[21] J. R. Goldsmith and C. Jobin, “Think Small: Zebrafish as a Model System of Human Pathology,” J. Biomed. Biotechnol., vol. 2012, pp. 1–12, 2012.
[22] H. W. Detrich, M. W. Kieran, F. Y. Chan, L. M. Barone, K. Yee, J. a Rundstadler, S. Pratt, D. Ransom, and L. I. Zon, “Intraembryonic hematopoietic cell migration during vertebrate development.,” Proc. Natl. Acad. Sci. U. S. A., vol. 92, no. 23, pp. 10713–7, 1995.
[23] G. R. Dressler, “Kidney development branches out.,” Dev. Genet., vol. 24, no. 3–4, pp. 189–93, 1999.
[24] R. T. Peterson, B. a Link, J. E. Dowling, and S. L. Schreiber, “Small
References
76
molecule developmental screens reveal the logic and timing of vertebrate development.,” Proc. Natl. Acad. Sci. U. S. A., vol. 97, no. 24, pp. 12965–9, 2000.
[25] S. P. Herbert and D. Y. R. Stainier, “Molecular control of endothelial cell behaviour during blood vessel morphogenesis,” Nat. Rev. Mol. Cell Biol., vol. 12, no. 9, pp. 551–564, 2011.
[26] B. Pruvot, V. Laurens, F. Salvadori, E. Solary, L. Pichon, and J. Chluba, “Comparative analysis of nonaspanin protein sequences and expression studies in zebrafish.,” Immunogenetics, vol. 62, no. 10,
pp. 681–99, Oct. 2010.
[27] J. P. Thiery, H. Acloque, R. Y. J. Huang, and M. A. Nieto, “Epithelial-Mesenchymal Transitions in Development and Disease,” Cell, vol. 139, no. 5, pp. 871–890, 2009.
[28] L. Solnica-Krezel, “Gastrulation in zebrafish — all just about adhesion?,” Curr. Opin. Genet. Dev., vol. 16, no. 4, pp. 433–441, 2006.
[29] a. Barrallo-Gimeno, “The Snail genes as inducers of cell movement and survival: implications in development and cancer,” Development, vol. 132, no. 14, pp. 3151–3161, 2005.
[30] Y. Nakaya, E. W. Sukowati, Y. Wu, and G. Sheng, “RhoA and microtubule dynamics control cell–basement membrane interaction in EMT during gastrulation,” Nat. Cell Biol., vol. 10, no. 7, pp. 765–775, 2008.
[31] J. Egea, C. Erlacher, E. Montanez, I. Burtscher, S. Yamagishi, M. Heß, F. Hampel, R. Sanchez, M. T. Rodriguez-manzaneque, M. R. Bösl, R. Fässler, H. Lickert, and R. Klein, “Genetic ablation of FLRT3 reveals a novel morphogenetic function for the anterior visceral endoderm in suppressing mesoderm differentiation,” pp. 3349–3362, 2008.

References
77
[32] T. Shimizu, T. Yabe, O. Muraoka, S. Yonemura, S. Aramaki, K. Hatta, Y. K. Bae, H. Nojima, and M. Hibi, “E-cadherin is required for gastrulation cell movements in zebrafish,” Mech. Dev., vol. 122, no. 6, pp. 747–763, 2005.
[33] D. a. Kane, “Mutations in half baked/E-cadherin block cell behaviors that are necessary for teleost epiboly,” Development, vol. 132, no. 5, pp. 1105–1116, 2005.
[34] S. Yamashita, C. Miyagi, T. Fukada, N. Kagara, Y.-S. Che, and T. Hirano, “Zinc transporter LIVI controls epithelial-mesenchymal transition in zebrafish gastrula organizer.,” Nature, vol. 429, no. 6989, pp. 298–302, 2004.
[35] F. Ulrich, M. Krieg, E.-M. Schötz, V. Link, I. Castanon, V. Schnabel, A. Taubenberger, D. Mueller, P.-H. Puech, and C.-P. Heisenberg, “Wnt11 Functions in Gastrulation by Controlling Cell Cohesion through Rab5c and E-Cadherin,” Dev. Cell, vol. 9, no. 4, pp. 555–564, 2005.
[36] F. Lin, “Essential roles of G 12/13 signaling in distinct cell behaviors driving zebrafish convergence and extension gastrulation movements,” J. Cell Biol., vol. 169, no. 5, pp. 777–787, 2005.
[37] N. S. Glickman, C. B. Kimmel, M. a Jones, and R. J. Adams, “Shaping the zebrafish notochord.,” Development, vol. 130, no. 5, pp. 873–887, 2003.
[38] C. Carmona-Fontaine, H. K. Matthews, S. Kuriyama, M. Moreno, G. a Dunn, M. Parsons, C. D. Stern, and R. Mayor, “Contact inhibition of locomotion in vivo controls neural crest directional migration.,” Nature, vol. 456, no. 7224, pp. 957–61, 2008.
[39] E. Batlle, E. Sancho, C. Francí, D. Domínguez, M. Monfar, J. Baulida, and a García De Herreros, “The transcription factor snail is a repressor of E-cadherin gene expression in epithelial tumour cells.,” Nat. Cell Biol., vol. 2, no. 2, pp. 84–89, 2000.

References
78
[40] A. Eger, K. Aigner, S. Sonderegger, B. Dampier, S. Oehler, M. Schreiber, G. Berx, A. Cano, H. Beug, and R. Foisner, “DeltaEF1 is a transcriptional repressor of E-cadherin and regulates epithelial plasticity in breast cancer cells,” Oncogene, vol. 24, no. 14, pp.
2375–2385, 2005.
[41] J. Comijn, G. Berx, P. Vermassen, K. Verschueren, L. Van Grunsven, E. Bruyneel, M. Mareel, D. Huylebroeck, and F. Van Roy, “The two-handed E box binding zinc finger protein SIP1 downregulates E-cadherin and induces invasion,” Mol. Cell, vol. 7,
no. 6, pp. 1267–1278, 2001.
[42] J. Yang, S. A. Mani, J. L. Donaher, S. Ramaswamy, R. A. Itzykson, C. Come, P. Savagner, I. Gitelman, A. Richardson, R. A. Weinberg, C. Val, and A. Lamarque, “Twist , a Master Regulator of Morphogenesis , Plays an Essential Role in Tumor Metastasis Ben Gurion University of the Negev,” vol. 117, pp. 927–939, 2004.
[43] I. Gitelman, “Twist protein in mouse embryogenesis.,” Dev. Biol., vol. 189, no. 2, pp. 205–214, 1997.
[44] J. Yang and R. a. Weinberg, “Epithelial-Mesenchymal Transition: At the Crossroads of Development and Tumor Metastasis,” Dev. Cell, vol. 14, no. 6, pp. 818–829, 2008.
[45] C. B. Kimmel, W. W. Ballard, S. R. Kimmel, B. Ullmann, and T. F. Schilling, “Stages of embryonic development of the zebrafish.,” Dev. Dyn., vol. 203, no. 3, pp. 253–310, Jul. 1995.
[46] M. M. Santoro, T. Samuel, T. Mitchell, J. C. Reed, and D. Y. R. Stainier, “Birc2 (cIap1) regulates endothelial cell integrity and blood vessel homeostasis.,” Nat. Genet., vol. 39, no. 11, pp. 1397–402, Nov. 2007.
[47] C. Thisse, B. Thisse, T. F. Schilling, and J. H. Postlethwait, “Structure of the zebrafish snail1 gene and its expression in wild-type, spadetail and no tail mutant embryos.,” Development, vol. 119, no. 4, pp. 1203–1215, 1993.
References
79
[48] M. E. Robu, J. D. Larson, A. Nasevicius, S. Beiraghi, C. Brenner, S. a Farber, and S. C. Ekker, “P53 Activation By Knockdown Technologies.,” PLoS Genet., vol. 3, no. 5, p. e78, May 2007.
[49] a Nasevicius and S. C. Ekker, “Effective targeted gene ‘knockdown’ in zebrafish.,” Nat. Genet., vol. 26, no. 2, pp. 216–220, 2000.
[50] N. Prakash, C. Brodski, T. Naserke, E. Puelles, R. Gogoi, A. Hall, M. Panhuysen, D. Echevarria, L. Sussel, D. M. V. Weisenhorn, S. Martinez, E. Arenas, A. Simeone, and W. Wurst, “A Wnt1-regulated genetic network controls the identity and fate of midbrain-dopaminergic progenitors in vivo.,” Development, vol. 133, no. 1, pp.
89–98, 2006.
[51] B. T. Phillips, K. Bolding, and B. B. Riley, “Zebrafish fgf3 and fgf8 encode redundant functions required for otic placode induction.,” Dev. Biol., vol. 235, no. 2, pp. 351–365, 2001.
[52] C. Y. Su, H. a. Kemp, and C. B. Moens, “Cerebellar development in the absence of Gbx function in zebrafish,” Dev. Biol., vol. 386, no. 1, pp. 181–190, 2014.
[53] P. H. Crossley, S. Martinez, Y. Ohkubo, and J. L. R. Rubenstein, “Coordinate expression of Fgf8, Otx2, Bmp4, and Shh in the rostral prosencephalon during development of the telencephalic and optic vesicles,” Neuroscience, vol. 108, no. 2, pp. 183–206, 2001.
[54] S. K. Sgaier, S. Millet, M. P. Villanueva, F. Berenshteyn, C. Song, and A. L. Joyner, “Morphogenetic and cellular movements that shape the mouse cerebellum: Insights from genetic fate mapping,” Neuron,
vol. 45, no. 1, pp. 27–40, 2005.
[55] C. L. Chi, S. Martinez, W. Wurst, and G. R. Martin, “The isthmic organizer signal FGF8 is required for cell survival in the prospective midbrain and cerebellum.,” Development, vol. 130, no. 12, pp. 2633–
2644, 2003.
References
80
[56] M. Amoyel, Y.-C. Cheng, Y.-J. Jiang, and D. G. Wilkinson, “Wnt1 regulates neurogenesis and mediates lateral inhibition of boundary cell specification in the zebrafish hindbrain.,” Development, vol. 132, no. 4, pp. 775–785, 2005.
[57] M. Klymkowsky, C. Cortez Rossi, and K. B. Artinger, “Mechanisms driving neural crest induction and migration in the zebrafish and Xenopus laevis,” Cell Adh. Migr., vol. 4, no. 4, pp. 595–608, Oct. 2010.
[58] S. Spaderna, O. Schmalhofer, M. Wahlbuhl, a. Dimmler, K. Bauer, a. Sultan, F. Hlubek, a. Jung, D. Strand, a. Eger, T. Kirchner, J. Behrens, and T. Brabletz, “The Transcriptional Repressor ZEB1 Promotes Metastasis and Loss of Cell Polarity in Cancer,” Cancer Res., vol. 68, no. 2, pp. 537–544, 2008.
[59] K. Soo, M. P. O’Rourke, P.-L. Khoo, K. a Steiner, N. Wong, R. R. Behringer, and P. P. L. Tam, “Twist function is required for the morphogenesis of the cephalic neural tube and the differentiation of the cranial neural crest cells in the mouse embryo.,” Dev. Biol., vol. 247, no. 2, pp. 251–270, 2002.
[60] K. A. Hartwell, B. Muir, F. Reinhardt, A. E. Carpenter, D. C. Sgroi, and R. A. Weinberg, “The Spemann organizer gene, Goosecoid, promotes tumor metastasis.,” Proc. Natl. Acad. Sci. U. S. A., vol. 103, no. 50, pp. 18969–74, 2006.
[61] E. L. Whiteman, C.-J. Liu, E. R. Fearon, and B. Margolis, “The transcription factor snail represses Crumbs3 expression and disrupts apico-basal polarity complexes,” Oncogene, vol. 27, no. 27, pp. 3875–3879, 2008.
[62] D. C. Radisky, D. D. Levy, L. E. Littlepage, H. Liu, C. M. Nelson, J. E. Fata, D. Leake, E. L. Godden, D. G. Albertson, M. Angela Nieto, Z. Werb, and M. J. Bissell, “Rac1b and reactive oxygen species mediate MMP-3-induced EMT and genomic instability,” Nature, vol. 436, no. 7047, pp. 123–127, 2005.
References
81
[63] H. Peinado, D. Olmeda, and A. Cano, “Snail, Zeb and bHLH factors in tumour progression: an alliance against the epithelial phenotype?,” Nat. Rev. Cancer, vol. 7, no. 6, pp. 415–428, 2007.
[64] M. Conacci-Sorrell, I. Simcha, T. Ben-Yedidia, J. Blechman, P. Savagner, and A. Ben-Ze’Ev, “Autoregulation of E-cadherin expression by cadherin-cadherin interactions: The roles of β-catenin signaling, Slug, and MAPK,” J. Cell Biol., vol. 163, no. 4, pp. 847–857, 2003.
[65] T. T. Onder, P. B. Gupta, S. A. Mani, J. Yang, E. S. Lander, and R. A. Weinberg, “Loss of E-Cadherin Promotes Metastasis via Multiple Downstream Transcriptional Pathways,” Cancer Res., vol. 68, no. 10, pp. 3645–3654, 2008.
[66] J. Vallin, J. M. Girault, J. P. Thiery, and F. Broders, “Xenopus cadherin-11 is expressed in different populations of migrating neural crest cells,” Mech. Dev., vol. 75, pp. 171–174, 1998.
[67] R. Paolillo, I. Spinello, M. T. Quaranta, L. Pasquini, E. Pelosi, F. Lo Coco, U. Testa, and C. Labbaye, “Human TM9SF4 Is a New Gene Down-Regulated by Hypoxia and Involved in Cell Adhesion of Leukemic Cells,” PLoS One, vol. 10, no. 5, p. e0126968, 2015.

82
ACKNOWLEDGEMENTS
First of all, I wish to express my deepest gratitude to my supervisor, Dr.
Ileana Zucchi (CNR-ITB, Segrate), for her expert guidance and aid
throughout my study.
A very special thank you to Dr. Paride Pelucchi for helping me with my
research and being a constant source of motivation. Thanks a lot for
everything.
I am extremely grateful to my friend, Dr. Stefano Molgora, for the support
he has lent me over all these years.
I also thank Dr. Rolland Reinbold for his time and effort in checking this
manuscript, Laura Vilardo for the preliminary data and the other members
of my group.
In addition, I would like to express my sincere gratitude to Professor
Franco Cotelli (Department of Bioscience, University of Milan) for
providing me with all the necessary facilities, Dr. Silvia Carra, whose
technical expertise, knowledge and time were generously shared, and all
the members of the lab.
I also thank my tutor Cristina Battaglia for her helpfulness.
Finally, a thank you to my family and friends for their unconditional love.
They have always been there for me and I am thankful for everything they
have helped me achieve.
This work was supported by FIRB RBAP11BYNP “Nanosistemi avanzati
per una nuova oncologia molecolare” NEWTON.