titration error in polyprotic acid-base titrations ... · to titration of vinegar, cola drinks and...
TRANSCRIPT

International Journal of Advanced Research in Chemical Science (IJARCS)
Volume 4, Issue 9, 2017, PP 7-20
ISSN No. (Online) 2349-0403
DOI: http://dx.doi.org/10.20431/2349-0403.0409002
www.arcjournals.org
International Journal of Advanced Research in Chemical Science (IJARCS) Page | 7
Titration Error in Polyprotic Acid-Base Titrations: Applications
to Titration of Vinegar, Cola Drinks and Antibiotic Batches
Julia Martín, Gloria Cañamares Marin, Agustin G. Asuero*
Department of Analytical Chemistry, The University of Seville, Spain
1. INTRODUCTION
The speciation of polyprotic acids [1-3] is a common problem in analytical, pharmaceutical and food
chemistry, covering applications from pH control in simple and complex experiments [4], to the evaluation of acidity constants [5] of polyprotic systems (polyprotic acids, polyacid bases, or
ampholytes). Titration curves and titration error of such complex systems are readily derived by the
incorporation of the molar fractions of the dissociated species and the formation function, ñ (Bjerrum index or average number of bound protons) into the equations defining the mass and charge balances.
Working in a medium of ionic strength fixed considerably reduces the mathematical complexity.
Although a number of excellent studies corresponding to the titration error of single equilibria have been published [6], the estimation of the polyprotic acid titration error has received scarce attention.
Various systems of analytical interest, including monoprotic and diprotic acids and bases, triprotic and
tetraprotic acids, and ampholytes; i.e. acetic acid (vinegar), phosphoric acid (Coca Cola), and
vancomycin (antibiotic, antibacterial), are subject of consideration in this paper.
2. EVALUATION CURVE OF A POLYPROTIC ACID
The calculation of pH as a function of the volume V of titrant generally requires the solution of a high
degree equation [7-8]. The usual approach is to write a polynomial equation in terms of hydrogen ion concentration and then find a positive root, which is a complex task (unless approximations are
introduced), requiring the use of a computer. The inverse approach [10-11] for the derivation of the
titration curves involves calculating the volume of titrant V (dependent variable, extensive), added to
a given volume of acid (or acids) as a function of pH (independent variable, intensive). It is very easy to obtain and it does not require any of the simplifications generally performed in textbooks.
In the potentiometric titration of a neutral polyprotic acid HNA [10], to a volume V0 of initial acid
(which may contain the background electrolyte) at an initial concentration CA, is added a volume V of
strong titrant base (which may contain the background electrolyte at the same concentration as the
acid solution), BOH, at a concentration CB. Electroneutrality rule is satisfied at any moment in the course of the titration (charges are omitted in the following for simplicity).
1 22 ... 1N NH B OH H A H A N HA N A (1)
Abstract: Though a number of excellent papers have been published dealing with titration error in acid-base
chemical systems of the monoprotolytic kind, the estimation of titration error of polyprotic acid (or polyacid
bases and ampholytes) have received a scarce attention. Nevertheless, using the dissociation and formation
(ñ) functions the chemical complexity involved in such kind of calculations is reduced considerably. Simple
general expressions, based on the inverse approach for titration curves, i.e., V=f(pH), are derived for
titration error of polyprotic acid (HNA), polyprotic bases (B or NaNT) or ampholytes (NaN-xHxT), in the nth-equivalence point (1 to N for polyprotic acid or base, and 1 to x (or N-x) for ampholyte titrated with strong
base (strong acid)). Among possible analytical applications the determination of acetic acid in vinegar,
phosphoric acid in Coca-Cola, and vancomycin purity in batches of raw material were selected for study.
Keywords: Titration error; Polyprotic acids and bases;Potentiometric titration; Vinegar; Coca-Cola;
Vancomycin
*Corresponding Author: Agustin G. Asuero, Department of Analytical Chemistry, The University of Seville, Spain

Titration Error in Polyprotic Acid-Base Titrations: Applications to Titration of Vinegar, Cola Drinks and
Antibiotic Batches
International Journal of Advanced Research in Chemical Science (IJARCS) Page | 8
Given the increase in volume of the solution in the course of titration we get the mass balances
01 2
00
...N
A N N N j
VC H A H A H A HA A H A
V V
(2)
0
B
VC B
V V
(3)
Taking into account that fjis the fraction molar of the species HjA(N-j)
j
j
j
H Af
H A
(4)
we have
0
0
j j j j A
VH A f H A f C
V V
(5)
0 0
0 0
j A j A
V Vj H A C j f C ñ
V V V V
(6)
Where ñ is the formation function [11] or Bjerrum index
2
0 2
0
01 2
0
0 0
2 ...
...
2 ...
NH
NA
N
jj N
j
N jN Nj
j j
HA H A N H AC Hñ
V A HA H A H AC
V V
j H Aj H
f f Nf j f
H H A
(7)
Being j the global stability constant related with the formation constants Kj’ s and the acidity constants Ka’s by means of
1 2
, 1 , 1
1 1 1... ...
j
j jj
aN a N a N j
H AK K K
K K KH A
(8)
corresponding to the formation global equilibrium A + jH = HjA, Kj is the formation constant
corresponding to the equilibrium Aj-1H + H = AjH, y Kaj the acidity constant corresponding to the equilibrium HN+1-jA = HN-j A + H
1
1N j
aj
N j j
KK
(9)
0
j
j
j Nj
j
Hf
H
(10)
By combining Eqns. (2)-(6) we get
01 2 1 0
0 0
2 ... 1N N A B
H OH
V Vf f N f Nf C C
V V V V
(11)
0
0
A BN ñ C V C V
V V
(12)
and on rearrangement

Titration Error in Polyprotic Acid-Base Titrations: Applications to Titration of Vinegar, Cola Drinks and
Antibiotic Batches
International Journal of Advanced Research in Chemical Science (IJARCS) Page | 9
0
A
B
N ñ CV V
C
which allow to evaluate the secondary variable ñ as a function of titration parameters
0 00
0 0
B
AA A
C Vñ N N T
V VC VC C
V V V V
(13)
where T is the titrated fraction.
3. TITRATION ERROR IN POLYPROTIC ACID-BASE TITRATIONS: THEORY
From the mass and charge balances, it may easily be shown [7-8] that the fraction of acid titrated in
the titration of a volume V0 of a neutral polyprotic acid, HNA, of concentration CA with a volume V of
strong base e.g. BOH, of concentration CB is related to the formation function ñ by means of (ionic strength is assumed to be constant)
00
0
B
AA
OH HC VT N ñ
VC VC
V V
(14)
Then the (fractional) titration error at then-th end point will be given by
1
end A end
OH HT nT N ñ n
n n C
(15)
The volume (dilution) factor near the n-th equivalence point, can be approximated by using T=n to be
0,
0 1 1
A AA end A
end end
V C CC C
V V rT rn
(16)
where dilution coefficient r is given by
A
B
Cr
C (17)
It is to be noted that it is not necessary to know the values of pH at equivalence points in order to
calculate the error.
Note in Eqn. (15) the sum of two terms; one that manifests itself at low or high pH values, which is
dependent on the concentration CA, and another, N-ñ-n, which is independent of the concentration (N-
ñ is the degree of deprotonation of the acid).
3.1. Application to Diprotic Acid
In the case of a diprotic acid, N=2, ñ=f1+2f2 and when n=1 the Eqn. (15) becomes
1 2 1 2
, ,
0 1 2 1 2 0 2
, ,
2 2 1 1 2
2
A end A end
A end A end
OH H OH HT f f f f
C C
OH H OH Hf f f f f f f
C C
(18)
since the sum of the molar fractions of the different species of diprotic acid is equal to unity,
f0+f1+f2=1. The Eqn. (18) corresponds to Eqn. (16) of the paper of Butcher and Fernando [12], since for the diprotic acid
1 2
0 2 2 2
1 2 1 1 2
2 2 1
1 1
11
a a
a a a
a a a
K Kf
H H H H H K H K K
K K K
(19)

Titration Error in Polyprotic Acid-Base Titrations: Applications to Titration of Vinegar, Cola Drinks and
Antibiotic Batches
International Journal of Advanced Research in Chemical Science (IJARCS) Page | 10
2
2 2
2 1 22 2 2 2
1 2 1 1 2
2 2 1
11
a a
a a a
a a a
H
H HK Kf
H H H H H K H K K
K K K
(20)
where the global stability constants, successive formation constants and acid dissociation constants of
the diprotic acid are related through the expressions
1 1
2
1
a
KK
(21)
2 1 2
2 1
1 1
a a
K KK K
(22)
When we titrate to the second equivalence point, n=2, the Eqn. (15) leads to
1 2 1 2
, ,
12
,
1 12 2 2 2
2 2
2 2
A end A end
A end
OH H OH HT f f f f
C C
OH H ff
C
(23)
with
1 12
1 2 2 2
1 2 1 1 2
2 2 1
11
aa
a a a
a a a
H
H K HKf
H H H H H K H K K
K K K
(24)
The Eqn. (23) corresponds to Eqn. (18) of the paper of Butcher and Fernando [12].
3.2. Application to Monoprotic Acid
For a weak monoprotic acid, N=1, ñ=f1, and Eqn. (15) becomes
1 1
, ,
1 1A end A end
OH H OH HT f f
C C
(25)
being f1 in this case equal to
1
1
1
1
111
a
aa
a
H
H HKf
KHH H KHK
(26)
The Eqn. (25) corresponds to Eqn. (7) of the paper of Butcher y Fernando [12] already quoted. For a
strong acid, f1=0, and the titration error is given by the first part of the second member of Eqn. (25):
T=([OH-]-[H
+])/CA,end.
3.3. Hyperbolic Sine Expression for Titration Error: Polyprotic Acid
The Eqn. (15) can be transformed into a hyperbolic sine relationship, as we will see in the following.
The difference [OH]-[H] can be expressed as
ccc www c
w
K HKOH H H K
H H K
(27)
and taking into account the definition of hyperbolic sine

Titration Error in Polyprotic Acid-Base Titrations: Applications to Titration of Vinegar, Cola Drinks and
Antibiotic Batches
International Journal of Advanced Research in Chemical Science (IJARCS) Page | 11
sinh2
x xe ex
(28)
we get
21
sinh 1 102
c cw w
A
K pKT n p H N ñ n
n C
(29)
4. TITRATION CURVE OF POLYACID BASES AND AMPHOLYTES
A volume V0 mL of a polyacid base NaNA of concentration CB, may be titrated with a volume V of strong
monobasic acid HX of concentration CA, to give HA, H2A…HNA. We also may titrate a neutral polyacid
base B which undergoes, when titrated with the strong acid, N successive protonations to give BH+,
BH22+
,...BHNN+
.
An ampholyteNaN-xHxT may be titrated either with a monoprotic strong base or a strong acid,
respectively. Note that the charge which supports T is - N, and that for x = N coincides with the neutral
polyprotic acid HNT, and for x = 0 we get the N-charged polyacid base situation, NaNT. A volume V0 mL
of the NaN-xHxTampholyte of concentration CA, may be titrated by adding V mL of a strong base, i.e.
KOH, of concentration CB. For the reverse titration, V0 mL of NaN-xHxTampholyte of concentration CB, is
titrated with a volume V of strong monoprotic acid, i.e., hydrochloric acid. From the mass and charge
balances (as for the case of polyprotic acid) we get the results compiled in Table 1, where the expression
for the titration curve, the titration error formula as well as an alternative titrated fraction expression are
shown. Expressions of the titration errors for particular cases are easily deduced from the general
expression contained in Table 1, as we have previously seen for the polyprotic acid case.
Table 1. Titration curve, titration error and titration fraction expressions.
Titration of Titration curve Titration error formula Titrated fraction
(alternative)
Neutral polyprotic
acid
titrated with a
strong base
(HNA type acid)
0
A
B
N ñ CV V
C
0
0
1
A
OH HT N ñ n
VnC
V V
1
A
B
N ñC
T
C
Neutral polyacid
base B titrated
with a strong
acid
(N-charged base of
the type AN-
)
0B
A
ñCV V
C
0
0
1
B
H OHT ñ n
VnC
V V
1
B
A
ñC
T
C
NaN-xHxT
ampholite titrated
with a
strong base
0
A
B
x ñ CV V
C
0
0
1
A
OH HT x ñ n
VnC
V V
1
A
B
x ñC
T
C
NaN-xHxT
ampholite titrated
with a
strong acid
0
B
A
ñ x CV V
C
0
0
1
B
H OHT ñ x n
VnC
V V
1
B
A
ñ xC
T
C
5. TITRATION ERROR OF ACETIC ACID AND IST DETERMINATION IN VINEGAR
The data corresponding to a titration of HCH3COO (plus HCl) using a Metrohm 702 Titrino automatic
titrator [13] coupled with a combined pH electrode with NaOH are shown in Table 2, and Figure 1
with the derivative curve obtained incrementally.

Titration Error in Polyprotic Acid-Base Titrations: Applications to Titration of Vinegar, Cola Drinks and
Antibiotic Batches
International Journal of Advanced Research in Chemical Science (IJARCS) Page | 12
Table 2. Titration with NaOH 0.4905 M, of 3.96 mmol of acetic acid plus 0.484 mmol de HCl dissolved in 200 mL of KCl 0.10 M.
V(mL) pH V(mL) pH V(mL) pH V(mL) pH V(mL) pH V(mL) pH
0.00 2.79 1.80 3.87 3.60 4.50 5.40 4.92 7.20 5.38 9.00 7.23
0.30 2.89 2.10 4.01 3.90 4.58 5.70 4.98 7.50 5.49 9.30 10.14
0.60 3.06 2.40 4.15 4.20 4.67 6.00 5.05 7.80 5.61 9.60 10.85
0.90 3.26 2.70 4.25 4.50 4.72 6.30 5.12 8.10 5.76 9.90 11.20
1.20 3.48 3.00 4.35 4.80 4.78 6.60 5.21 8.40 5.97 10.20 11.39
1.50 3.72 3.30 4.42 5.10 4.85 6.90 5.29 8.70 6.28 10.50 11.54
Figure 1. Left: Titration of NaOH 0.4905 M of 200 mL de HCH3COO 0.0198 M +HCl 0.00242 M and
derivative curve. Right: Schwartz’ method. pH-meter calibrated with buffers of pH 4.00, 7.00 and 9.00.
The theoretical volume required reaching the 2nd
equivalence point is 0.987 + 8.073 = 9.060 mL. The
derivative curve shows a maximum at 8.85 mL (minimum at 9.15 on the dV/dpH curve versus V), so
the valuation error will be
2 20
0 2 2
8.85 0.9871 1 1 1 1 0.026
8.073
B pf pfB H
A B pe pe
C V VC V C VE T
C V C V V
(30)
Taking 9.15 mL the error is 0.011. On the other hand, from Eqn. (12) taking into account the two
acids, removing denominators and regrouping terms is reached to the expression
0
1 2 0.2 2´ aeq eq eq
B a
V V KV V V V f V
C K H
(31)
which is of the form (Schwartz, 1987)
2´ ´a eq aV H K V K V (32)
from which the values of 7.952, 4.82 (I = 0.1) and 0.0195 for Veq2, pKa and CA, respectively, are
obtained. Assuming the values of the starting parameters as absolute, the error is given by: E = (7.952
/ 8.073) -1 = -0.015 or -1.5%. Kraft [13] obtains a pKa of 4.83 for that data series, using a different
method.
The calculation of the titration error is a common analytical problem. Given the acidity constants, the
error associated with the pH range of colour change is estimated. The pH limits of these ranges are
tabulated [14-15] and only need to calculate the corresponding titration volumes. The calculation is
therefore simple: the extreme pH’s of the indicator range are selected and T (= V/Veq) is calculated for
these limits (Table 3), determining the resulting error ΔT (= (V/Veq) -1). Likewise, the titration error
resulting from a preset value or from a pH reading can be obtained immediately.

Titration Error in Polyprotic Acid-Base Titrations: Applications to Titration of Vinegar, Cola Drinks and
Antibiotic Batches
International Journal of Advanced Research in Chemical Science (IJARCS) Page | 13
Table 3. Estimation of the titration error corresponding to the transition pH ranges of the indicator used in the titration of 50 mL of acetic acid (pKa = 4.76) with sodium hydroxide at the indicated concentrations (pKw =
14.00).
HCH3COO CA(M) 0.0833 0.00833 0.000833 0.000833 0.000833
NaOH CB(M) 0.0833 0.00833 0.000833 0.001666 0.004165
Indicator pH Range Error percentage of titration corresponding to the extreme values of the pH range of the
tabulated indicators (% ΔT)
Phenol Red 6.4–8.0 -2.24 –-0.06 -2.25 – -0.03 -2.33 – 0.18 -2.31 – 0.12 -2.29 – 0.09
Neutral Red 6.8– 8.0 -0.90 – -0.06 -0.91 – -0.03 -0.93 – 0.18 -0.92 – 0.12 -0.92 – 0.09
Cresol Red 7.2– 8.8 - 0.36 – 0.01 -0.36 – 0.14 -0.34 – 1.52 -0.34 – 1.13 -0.35 – 0.90
-Naphtholphthalein 7.3 – 8.7 -0.29 – 0.00 -0.28 – 0.11 -0.25 – 1.20 -0.26 – 0.89 -0.27 – 0.71
Cresol Purple 7.4 – 9.0 -0.23 – 0.02 -0.22 – 0.23 -0.18 – 2.42 -0.19 – 1.81 -0.20 – 1.44
Thymol Blue 8.0 – 9.6 -0.06 – 0.09 -0.03 – 0.96 0.18 – 10.04 0.12 – 7.34 0.09 – 5.79
Phenolphthalein 8.2 – 10.0 -0.03 – 0.24 0.00– 2.43 0.34 – 27.28 0.25 – 19.16 0.19 – 14.76
Acetic acid is a component of vinegar, a water-miscible sour-tasting liquid, derived from the acetic fermentation of alcohol assisted by bacteria Mycodermaaceti. The concentration of vinegar in acetic
acid is about 5%; ie, 0.833 M. Titration curves corresponding to 1:10, 1:100 and 1:1000 dilutions are
shown in the top left-hand side of Fig. 2. Titration error (in the interval of -1% to 1%) for the different
molar concentrations of acid is drawn in Fig. 2 middle. The pH at the equivalence point (Fig. 2 bottom) fluctuates between 7.699 and 7.806 when a 0.000833 M acid is titrated with a strong base
solution 1, 2, 3, 4 and 5 times more concentrated. The calculations made allow us to verify (Table 3)
that neutral red, cresol red and α-naphtholphthalein are satisfactory indicators for the titration of acetic acid in all cases. Thymol blue and phenolphthalein are not recommended except at high
concentrations of acid. Natural vinegars also contain small amounts of tartaric acid and citric acid.
Among the varieties of vinegar are wine, aceto-balsamic, Sherry, cider or apple, and Porto. The concentration of acetic acid in vinegar ranges from 3% to 5%.
It is also possible to titrate vinegar solution up to a fixed endpoint, in order to avoid the plotting of the entire potentiometric titration curve. This makes it necessary to know how the titration error varies
with the acid concentration at given pH values (Fig. 3). For example, for a 1:250 dilution of vinegar,
its pCA will be of the order of 2.50, with titration errors lower than 1% if the titration is carried out to a pH of 7.2 to 9.2. If higher accuracy is desired, the above pH range should be limited, using the same
diagram. Bottles of vinegar of different format are shown in Fig. 4. The experimental titration curve
of a dark mahogany coloured Sherry vinegar (Fig. 5), shows that at pH 7.4–9.1 the error is minimal,
according to the developed theory. The degree of acidity of the Sherry vinegar tested is 7.51%, higher than that of conventional vinegar, whose acidity degree was equal to 6.98%. In both cases we get
higher values than those declared in label values (7 and 6%, respectively). The pH value at T=0.5 is
4.53.

Titration Error in Polyprotic Acid-Base Titrations: Applications to Titration of Vinegar, Cola Drinks and
Antibiotic Batches
International Journal of Advanced Research in Chemical Science (IJARCS) Page | 14
Figure 2. Top left: titration curves of acetic acid with sodium hydroxide at the same concentration; Top right: titrated fraction and Bjerrum index as a function of pH. Middle: fractional titration error. Bottom: enhanced
error scale allowing to get the end point pH value in the titration of 0.000833 M acetic acid with sodium
hydroxide n more concentrated times (n = 1, 2, 3, 4 and 5).
Figure 3. Titration error for acetic acid as a function of CA and pH of the end point.
Figure 4. Bottles of vinegar of different formats (wikipedia, n.d.).
Figure 5. Titration curve of diluted Sherry vinegar 1:100 (V0=25 mL; end point = 15.65 mL).

Titration Error in Polyprotic Acid-Base Titrations: Applications to Titration of Vinegar, Cola Drinks and
Antibiotic Batches
International Journal of Advanced Research in Chemical Science (IJARCS) Page | 15
6. PHOSPHORIC ACID SYSTEM AND ITS DETERMINATION IN COLA DRINKS
Phosphoric acid is a triprotic acid with pKa1 = 2.15, pKa2 = 7.20 and pKa3 = 12.15, whose titration curve shows (Fig. 6, top) two jumps. The fraction titrated together with the degree of deprotonation
are shown in Fig. 6 middle, whereas the curves corresponding to the fractional error for the
equivalence points corresponding to both jumps (end point (e.p.) 1º and e.p. 2º) are depicted in Fig. 6
bottom.
The experimental data obtained in the titration of 25 mL of a 0.04389 M phosphoric acid solution with 0.09948 M NaOH [16], using a Orion Model 420 A pH meter(equipped with an Orion electrode
Model 91-57 "Triode" immersed in 4 MKCl saturated with AgCl prior to use), are shown in Table
4together with the incremental curve (pH -meter is calibrated with pH 4.00, 7.00 and 9.00 buffers).
The theoretical volume required to reach the first and second equivalence points is equal to 11.03 and
22.06 mL, respectively. Since the derivative curve (Fig. 7) shows maximums at 10.90 and 22.15 mL, the titration error will be given by
Figure 6. Top: Titration curve of phosphoric acid with sodium hydroxide. Middle: Titrated fraction (T) and
degree of deprotonation (n-ñ) as a function of pH. Bottom: Titration error at the different end points (e.p.) (1º y
2º; and 3º no detectable).

Titration Error in Polyprotic Acid-Base Titrations: Applications to Titration of Vinegar, Cola Drinks and
Antibiotic Batches
International Journal of Advanced Research in Chemical Science (IJARCS) Page | 16
1
1
1
10.91 1 0.0118 1.2%
11.3
pf
pf
eq
VT
V
(33)
. .1
. .2
1
22.151 1 0.004 0.4%
2 2 11.03
e p
e p
eq
VT
V
(34)
The titration curves in the concentration range of 1.2 10-1
to 6 10-4
M are shown in Fig. 8 (top). In the
intermediate range (H2PO4- / HPO4
2-), the pH is independent of the concentration. The titration error,
T, at pH values close to the end points is also shown in Fig. 8 (middle and bottom). For the
determination of H3PO4 in decarbonated (degassed) cola drinks [17, 18] potentiometric titration has to
be applied, given its intense colour. The undiluted drink pH is 2.5 with
22 2
2.48
2.48 3
1 2.15
1
1010 4.8 10
10a A
aA
H HK C H M
KC H
(35)
Figure 7. Titration curve and derivative curve corresponding to the titration of 25 mL of 0.04389 M of
phosphoric acid with NaOH 0.09948 M (without ionic strength adjustment).
Table 4. Titration of 25 mLof H3PO4 0.04389 M with NaOH 0.09948 M (Veq1=11.03 mL; Veq2=22.06 mL).
V (mL) pH V (mL) pH V (mL) pH V (mL) pH V (mL) pH V (mL) pH
0.0 1.44 6.9 2.29 11.0 4.70 14.9 6.36 20.9 7.63 23.5 10.63
0.5 1.52 7.2 2.33 11.1 4.91 15.4 6.44 21.2 7.78 24.0 10.80
1.0 1.57 7.5 2.38 11.2 5.12 15.9 6.52 21.4 7.93 24.2 10.86
1.5 1.63 7.8 2.42 11.3 5.18 16.5 6.61 21.6 8.10 24.4 10.91
2.0 1.69 8.1 2.47 11.5 5.35 16.8 6.68 21.8 8.33 24.6 10.97
2.5 1.75 8.5 2.56 11.7 5.42 17.4 6.78 22.0 8.87 24.8 11.01
3.0 1.80 9.0 2.68 11.9 5.55 17.6 6.82 22.1 9.06 25.0 11.05
3.5 1.85 9.3 2.78 12.1 5.64 18.0 6.88 22.2 9.41 25.5 11.15
4.0 1.90 9.5 2.84 12.3 5.73 18.5 6.96 22.3 9.75 26.0 11.24
4.5 2.00 9.9 2.98 12.5 5.79 18.9 7.07 22.4 9.83 26.5 11.32
5.0 2.05 10.2 3.14 12.8 5.90 19.4 7.17 22.6 10.03 27.0 11.38
5.5 2.10 10.4 3.35 13.1 5.98 19.9 7.30 22.7 10.19
6.0 2.15 10.6 3.68 13.5 6.07 20.3 7.39 22.9 10.32
6.5 2.22 10.7 3.93 13.9 6.16 20.5 7.46 23.1 10.47
6.7 2.25 10.8 4.10 14.4 6.27 20.7 7.54 23.2 10.50

Titration Error in Polyprotic Acid-Base Titrations: Applications to Titration of Vinegar, Cola Drinks and
Antibiotic Batches
International Journal of Advanced Research in Chemical Science (IJARCS) Page | 17
Figure 8. Top: Titration curves of phosphoric acid with sodium hydroxide concentrations 2.5 times more concentrated. Middle: Titration error at varying concentrations of acid for the 1º end point. Bottom: Titration
error at varying concentrations of acid for the 2º end point.
Figure 9. Titration error as a function of concentration of H3PO4 and pH of the end point

Titration Error in Polyprotic Acid-Base Titrations: Applications to Titration of Vinegar, Cola Drinks and
Antibiotic Batches
International Journal of Advanced Research in Chemical Science (IJARCS) Page | 18
Figure 10. Titration curve of 25 mL of degassed Coca Cola (1º end point at 6.65 mL)
Other acids present (citric acid) exert a negligible influence [17], if titration is carried out to the first
end point, since Veq2> 2 Veq1. In order to evaluate for routine purposes up to a fixed pH range, we
study how the titration error varies as a function of the concentration at given values of pH (Fig. 9). It
is noted that a pH value of 5.2 covers the range of pCA values from 2.0 to 3.3 with an error lower than 1%. Likewise, a pH value of 8.8– 9.0 (2
nd end point) also covers that same range of pCA.
The degassed (using an ultrasound bath) Coca Cola titration curve(Figure 10) shows that the error is
minimal at the 1º end point when the pH is between 4.5 and 5.0, values some lower than expected, being logical the difference taking into account the complexity of the medium. The phosphoric acid
concentration is ≈ 5.32 10-3
M.
7. TITRATION CURVES OF CIPROFLOXACIN AND VANCOMYCIN
Antibiotics are important antimicrobial agents whose behaviour in vivo is significantly influenced by
their physicochemical properties, such as degree the of ionization and the ability to chelate metal ions.
The transport of the active principle through the cells and the biological membranes is a function of
their physical and chemical properties and pKa values, which play a vital role in the development of new drugs. The acid-base character [19] is a key factor in the behaviour at the molecular level, since it
governs solubility, absorption, distribution, metabolism and elimination. Antibiotics, belonging to
various therapeutic families, i.e., macrolides, penicillins, sulphonamides, tetracyclines, cephalos- porins, glycopeptides, carbapenem, are polyprotic acids or bases. The ciprofloxacin hydrochloride
(pKa1=3.01; pKa2=6.14; pKa3=8.70; pKa4=10.58) and the vancomycinglycopeptide (pKa1=2.18;
pKa2=7.75; pKa3=8.89; pKa4=9.59; pKa5=10.40; pKa6=12) titration curves are shown in Fig. 11 left and
right, respectively.
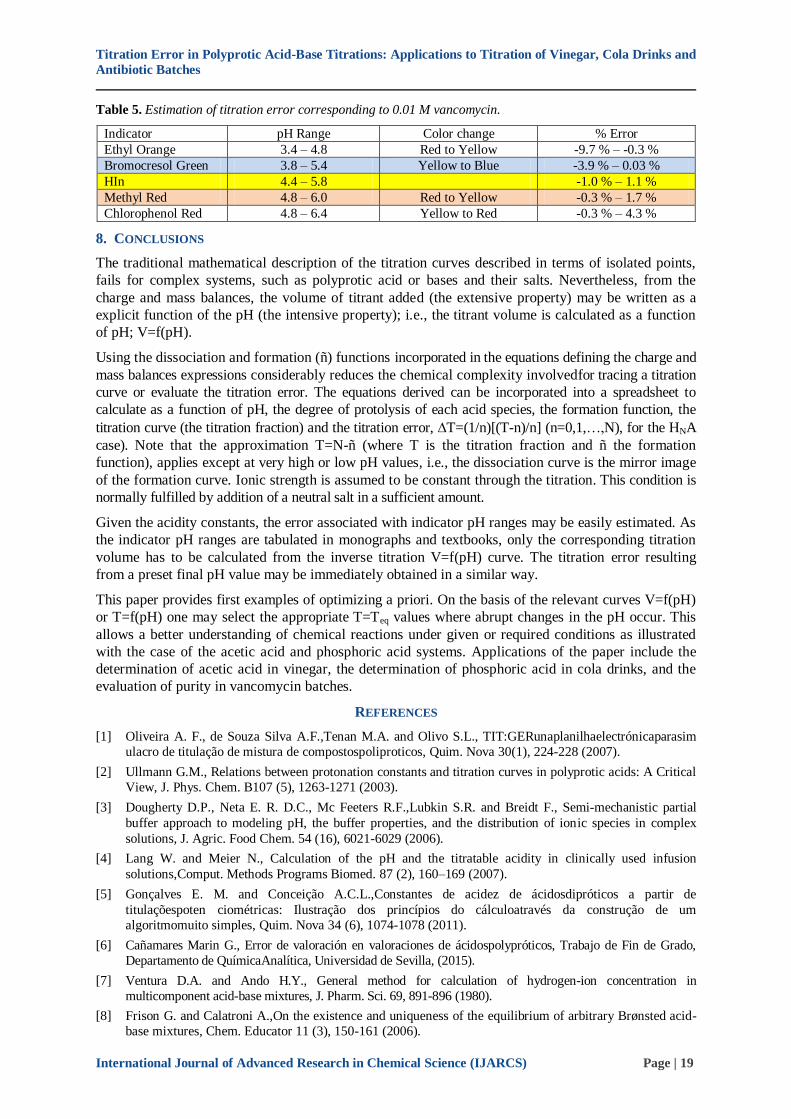
It is possible to use visual indicators in the case of vancomycinglycopeptide, as shown in Table 5, after applying the formalism described in the first application. Of the indicators tabulated the one that
is better is the red of methyl, although the ideal would be to have one that turns between pH 4.4 and
5.8. The case of ciprofloxacin requires further study in the direction applied to the case of phosphoric
acid, since in practice the derived titration curves obtained from the experimental data are far from the ideal behaviour shown in Fig. 11 left.
Figure 11. Titration curves of ciprofloxacin (left) and vancomycin (right).
Titration Error in Polyprotic Acid-Base Titrations: Applications to Titration of Vinegar, Cola Drinks and
Antibiotic Batches
International Journal of Advanced Research in Chemical Science (IJARCS) Page | 19
Table 5. Estimation of titration error corresponding to 0.01 M vancomycin.
Indicator pH Range Color change % Error
Ethyl Orange 3.4 – 4.8 Red to Yellow -9.7 % – -0.3 %
Bromocresol Green 3.8 – 5.4 Yellow to Blue -3.9 % – 0.03 %
HIn 4.4 – 5.8 -1.0 % – 1.1 %
Methyl Red 4.8 – 6.0 Red to Yellow -0.3 % – 1.7 %
Chlorophenol Red 4.8 – 6.4 Yellow to Red -0.3 % – 4.3 %
8. CONCLUSIONS
The traditional mathematical description of the titration curves described in terms of isolated points,
fails for complex systems, such as polyprotic acid or bases and their salts. Nevertheless, from the
charge and mass balances, the volume of titrant added (the extensive property) may be written as a
explicit function of the pH (the intensive property); i.e., the titrant volume is calculated as a function
of pH; V=f(pH).
Using the dissociation and formation (ñ) functions incorporated in the equations defining the charge and
mass balances expressions considerably reduces the chemical complexity involvedfor tracing a titration
curve or evaluate the titration error. The equations derived can be incorporated into a spreadsheet to
calculate as a function of pH, the degree of protolysis of each acid species, the formation function, the
titration curve (the titration fraction) and the titration error, T=(1/n)[(T-n)/n] (n=0,1,…,N), for the HNA
case). Note that the approximation T=N-ñ (where T is the titration fraction and ñ the formation
function), applies except at very high or low pH values, i.e., the dissociation curve is the mirror image
of the formation curve. Ionic strength is assumed to be constant through the titration. This condition is
normally fulfilled by addition of a neutral salt in a sufficient amount.
Given the acidity constants, the error associated with indicator pH ranges may be easily estimated. As
the indicator pH ranges are tabulated in monographs and textbooks, only the corresponding titration
volume has to be calculated from the inverse titration V=f(pH) curve. The titration error resulting
from a preset final pH value may be immediately obtained in a similar way.
This paper provides first examples of optimizing a priori. On the basis of the relevant curves V=f(pH)
or T=f(pH) one may select the appropriate T=Teq values where abrupt changes in the pH occur. This
allows a better understanding of chemical reactions under given or required conditions as illustrated
with the case of the acetic acid and phosphoric acid systems. Applications of the paper include the
determination of acetic acid in vinegar, the determination of phosphoric acid in cola drinks, and the
evaluation of purity in vancomycin batches.
REFERENCES
[1] Oliveira A. F., de Souza Silva A.F.,Tenan M.A. and Olivo S.L., TIT:GERunaplanilhaelectrónicaparasim
ulacro de titulação de mistura de compostospoliproticos, Quim. Nova 30(1), 224-228 (2007).
[2] Ullmann G.M., Relations between protonation constants and titration curves in polyprotic acids: A Critical
View, J. Phys. Chem. B107 (5), 1263-1271 (2003).
[3] Dougherty D.P., Neta E. R. D.C., Mc Feeters R.F.,Lubkin S.R. and Breidt F., Semi-mechanistic partial
buffer approach to modeling pH, the buffer properties, and the distribution of ionic species in complex
solutions, J. Agric. Food Chem. 54 (16), 6021-6029 (2006).
[4] Lang W. and Meier N., Calculation of the pH and the titratable acidity in clinically used infusion
solutions,Comput. Methods Programs Biomed. 87 (2), 160–169 (2007).
[5] Gonçalves E. M. and Conceição A.C.L.,Constantes de acidez de ácidosdipróticos a partir de
titulaçõespoten ciométricas: Ilustração dos princípios do cálculoatravés da construção de um
algoritmomuito simples, Quim. Nova 34 (6), 1074-1078 (2011).
[6] Cañamares Marin G., Error de valoración en valoraciones de ácidospolypróticos, Trabajo de Fin de Grado,
Departamento de QuímicaAnalítica, Universidad de Sevilla, (2015).
[7] Ventura D.A. and Ando H.Y., General method for calculation of hydrogen-ion concentration in
multicomponent acid-base mixtures, J. Pharm. Sci. 69, 891-896 (1980).
[8] Frison G. and Calatroni A.,On the existence and uniqueness of the equilibrium of arbitrary Brønsted acid-
base mixtures, Chem. Educator 11 (3), 150-161 (2006).

Titration Error in Polyprotic Acid-Base Titrations: Applications to Titration of Vinegar, Cola Drinks and
Antibiotic Batches
International Journal of Advanced Research in Chemical Science (IJARCS) Page | 20
[9] Asuero A.G. and Michalowski T., Comprehensive formulation of titration curves for complex acid-base systems and its analytical Implications, Crit. Rev. Anal. Chem. 41 (2), 151-187 (2011).
[10] De Levie R., Advanced Excel for Scientific Data Analysis, 3th. Ed., Atlantic Academic: New York (2012).
[11] Asuero A. G., Jiménez-Trillo J.L. and Navas M.J., Mathematical treatment of absorbance versus pH graphs of
polybasic acids,Talanta 33, 929-934 (1986).
[12] Butcher J. and Fernando Q., Theoretical error in acid-base titrations, J. Chem. Educ. 43 (10), 546-550
(1966).
[13] Kraft A., The determination of the pKa of multiprotic, weak acids by analyzing potentiometric acid-base
titration data with difference plots, J. Chem. Educ. 80 (5), 554-559 (2003).
[14] Harris D.C., Quantitative Chemical Analysis, 8th ed., W.H. Freeman and Company: New York (2010).
[15] Bishop E., Indicators, Pergamon Press, Oxford (1972).
[16] Burnett J. and Burns W.A., Using a spreadsheet to fit experimental pH titration data to a theoretical
expression: estimation of analytite concentration and Ka, J. Chem. Educ. 83 (8), 1190-1193 (2006).
[17] Murphy J., Determination of phosphoric acid in cola beverages. A colorimetric and pH titration
experiment for general chemistry, J. Chem. Educ. 60 (5), 420-421 (1983).
[18] Bello M.A. and González A.G., Determination of phosphate in cola beverages using nonsupressed ion
chromatography. An experiment introducing ion chromatography for quantitative analysis, J. Chem. Educ.
73 (12), 1174-1175 (1996).
[19] Avdeef A., Absorption and Drug Development: Solubility, Permeability, and Charge State, Wiley: New
York (2012).
Citation: A. Asuero, "Titration Error in Polyprotic Acid-Base Titrations: Applications to Titration of Vinegar,
Cola Drinks and Antibiotic Batches", International Journal of Advanced Research in Chemical Science
(IJARCS), vol. 4, no. 9, pp. 7-20, 2017. http://dx.doi.org/10.20431/2349-0403.0409002
Copyright: © 2017 Authors. This is an open-access article distributed under the terms of the Creative
Commons Attribution License, which permits unrestricted use, distribution, and reproduction in any medium,
provided the original author and source are credited.