basic acid/base titrations. types of acid base titration there are four different types of acid/base...
TRANSCRIPT
Basic acid/base titrations
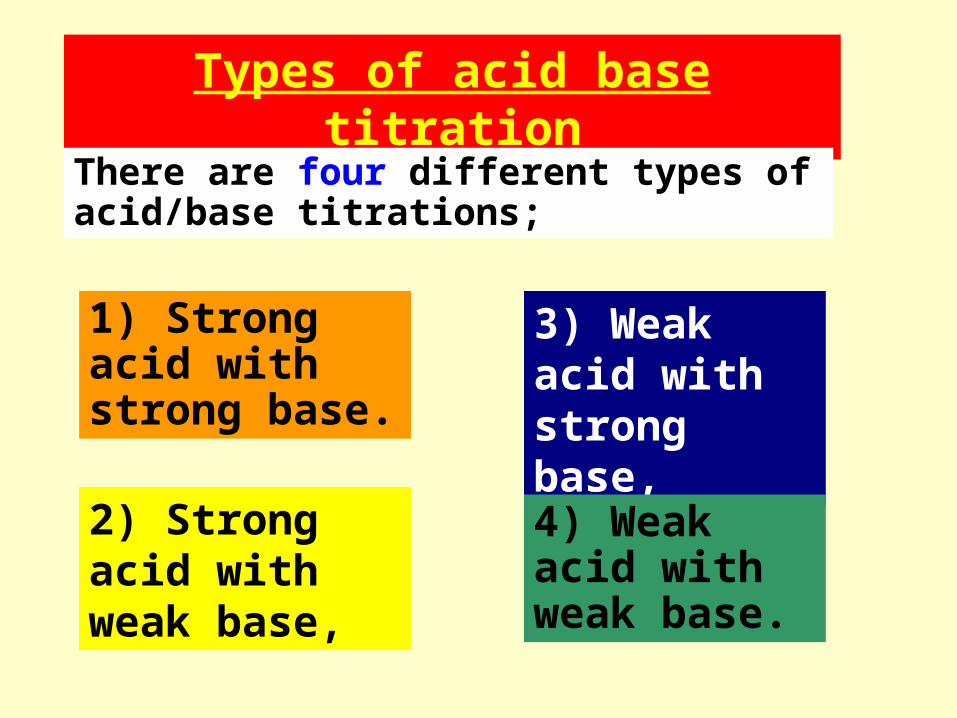
Types of acid base titration
There are four different types of acid/base titrations;
1) Strong acid with strong base.
2) Strong acid with weak base,
3) Weak acid with strong base,
4) Weak acid with weak base.
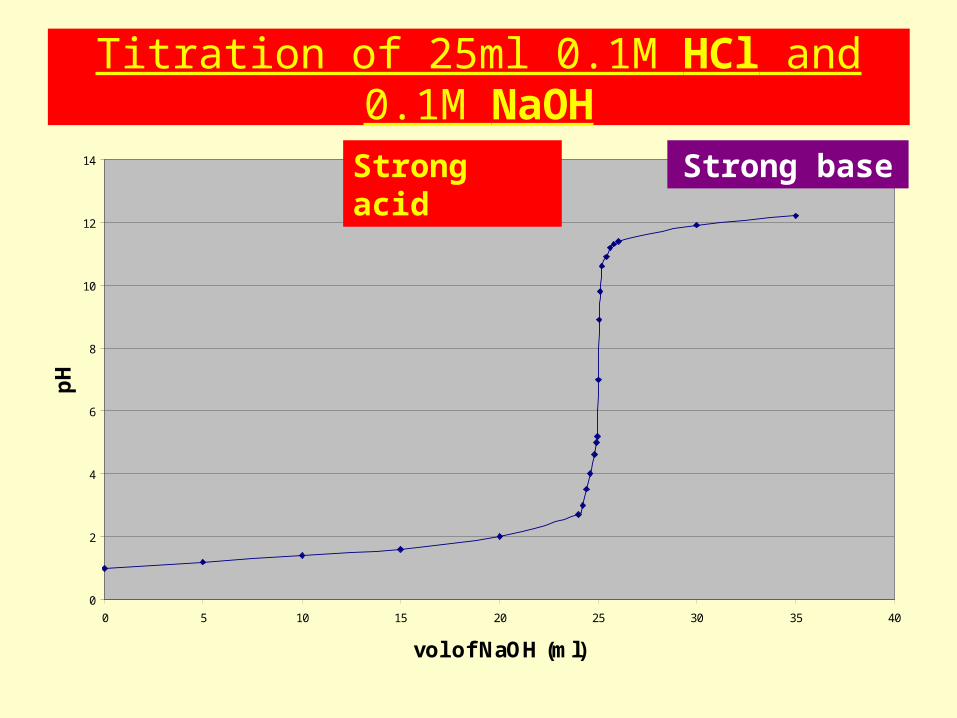
Titration of 25ml 0.1M HCl and 0.1M NaOH
0
2
4
6
8
10
12
14
0 5 10 15 20 25 30 35 40
vol of NaOH (ml)
pH
Strong acid Strong base
Choosing an indicator pH
7
1
13
25
cm3 of base
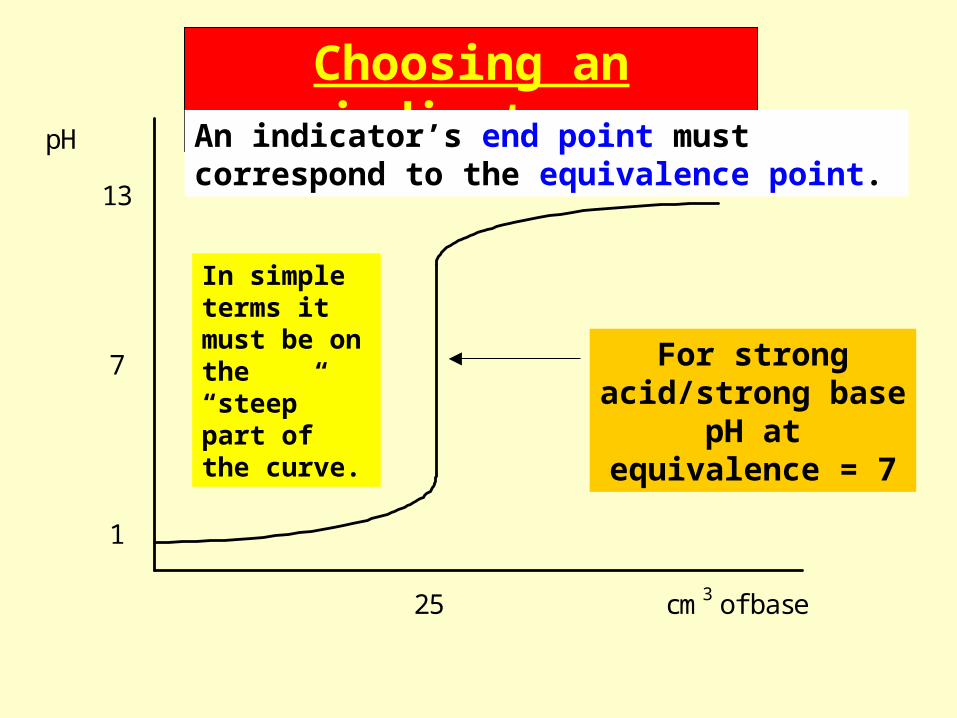
For strong acid/strong base pH at equivalence = 7
An indicator’s end point must correspond to the equivalence point.
In simple terms it must be on the “steep” part of the curve.
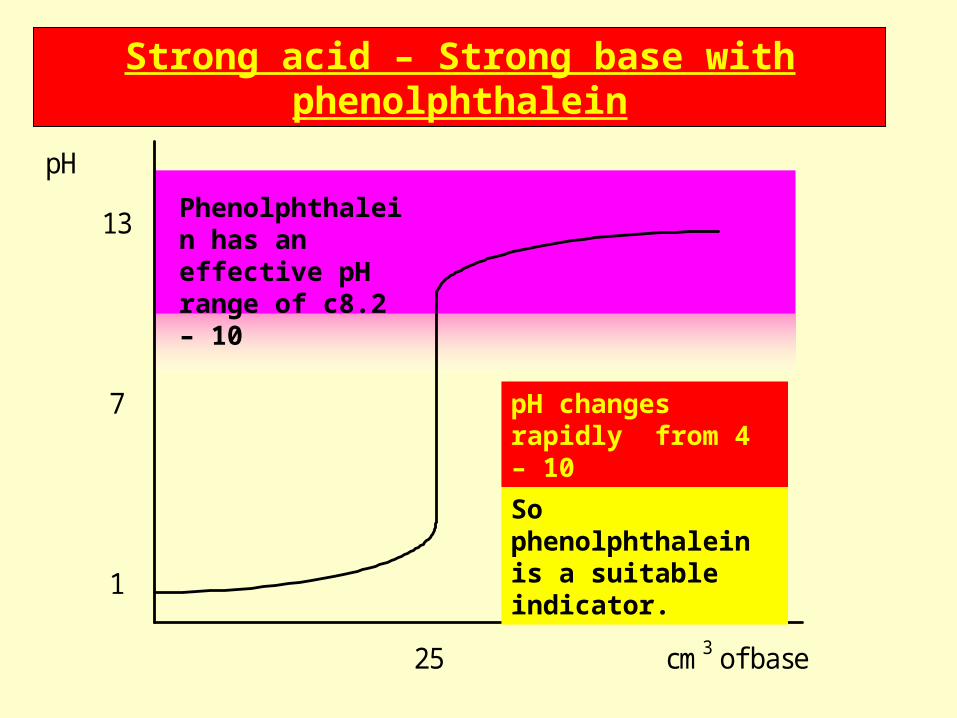
Strong acid – Strong base with phenolphthalein
pH
7
1
13
25
cm3 of base
pH changes rapidly from 4 – 10
Phenolphthalein has an effective pH range of c8.2 – 10
So phenolphthalein is a suitable indicator.
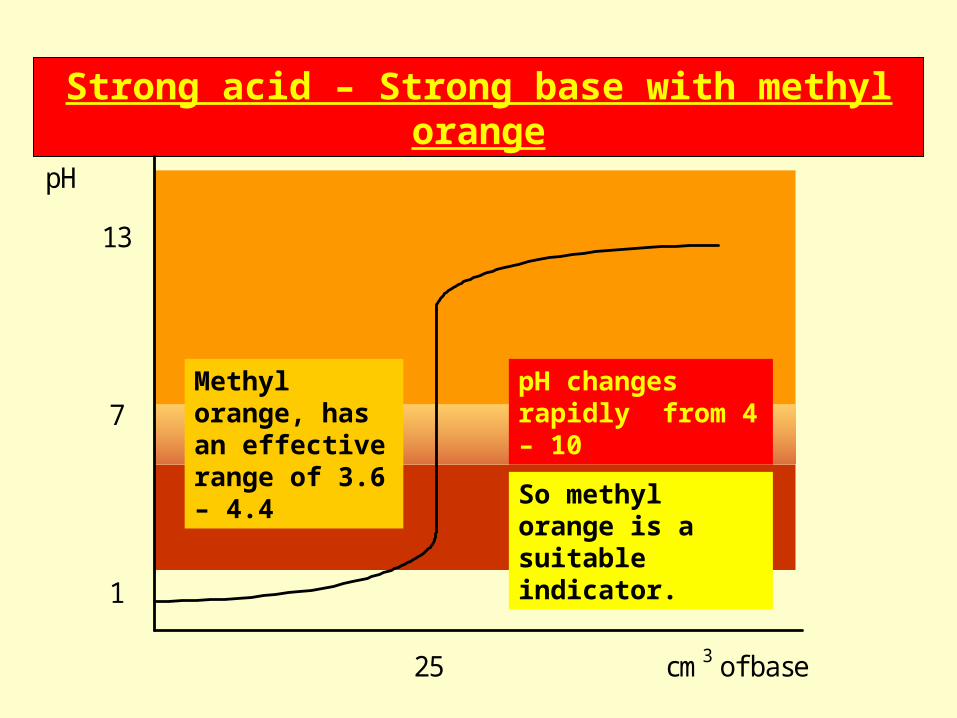
Strong acid – Strong base with methyl orange
pH
7
1
13
25
cm3 of base
Methyl orange, has an effective range of 3.6 – 4.4
pH changes rapidly from 4 – 10
So methyl orange is a suitable indicator.
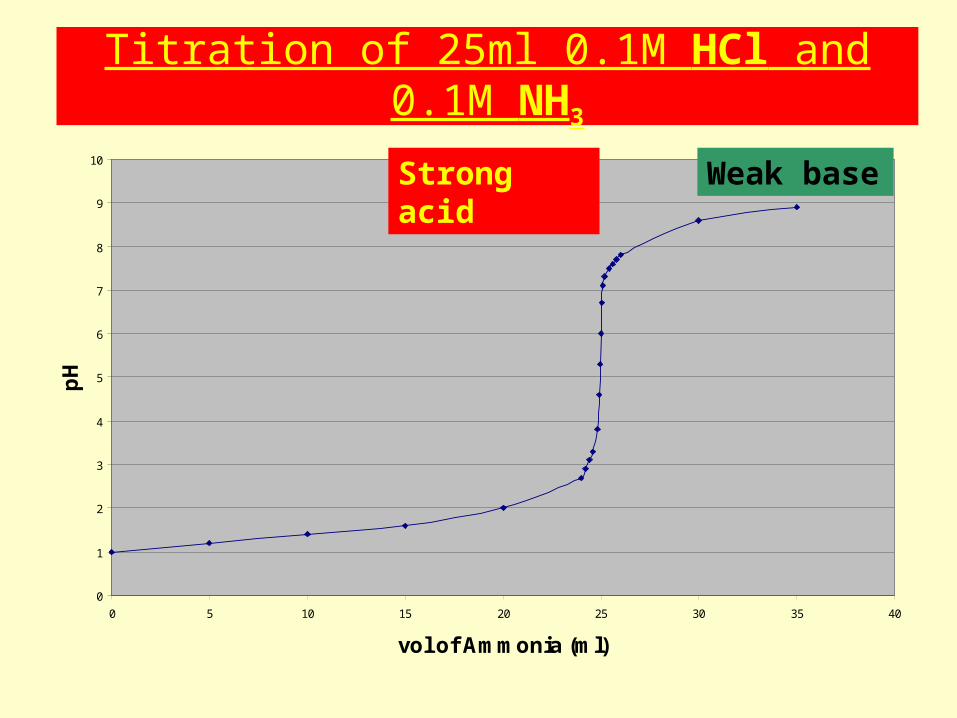
Titration of 25ml 0.1M HCl and 0.1M NH3
0
1
2
3
4
5
6
7
8
9
10
0 5 10 15 20 25 30 35 40
vol of Ammonia (ml)
pH
Strong acid Weak base
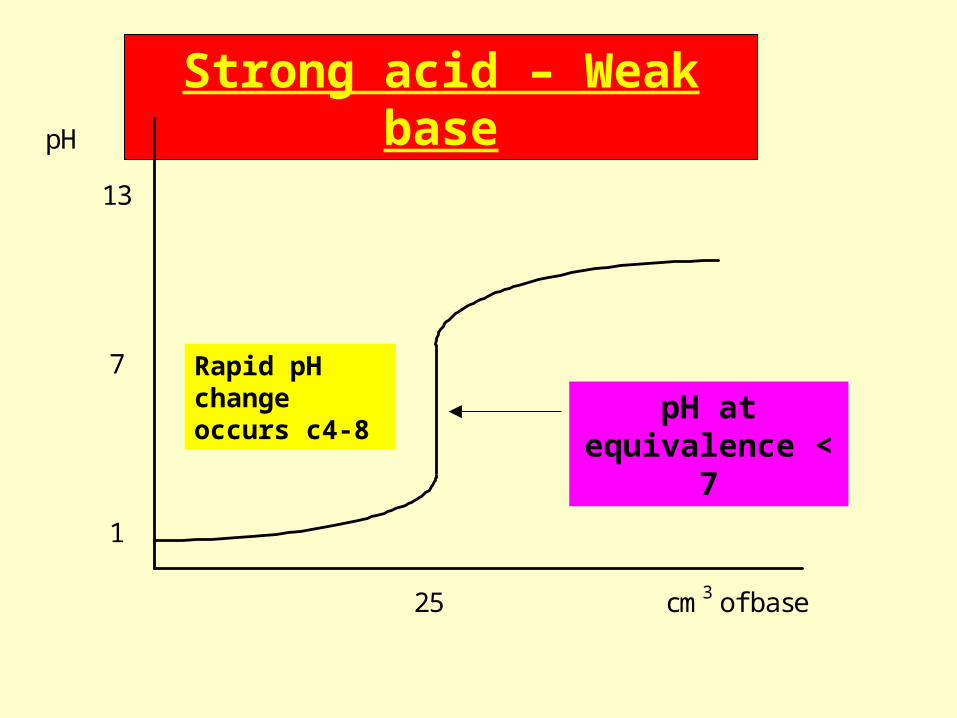
Strong acid – Weak base pH
7
1
13
25
cm3 of base
pH at equivalence < 7
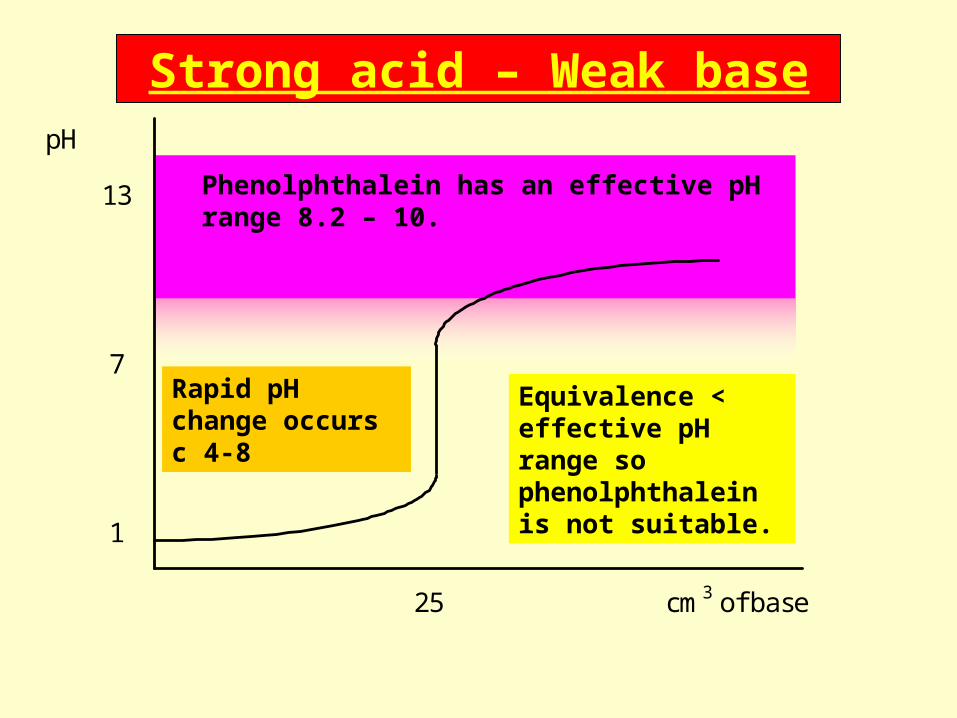
Rapid pH change occurs c4-8
Strong acid – Weak base pH
7
1
13
25
cm3 of base
Rapid pH change occurs c 4-8
Phenolphthalein has an effective pH range 8.2 – 10.
Equivalence < effective pH range so phenolphthalein is not suitable.
Strong acid – Weak base pH
7
1
13
25
cm3 of base
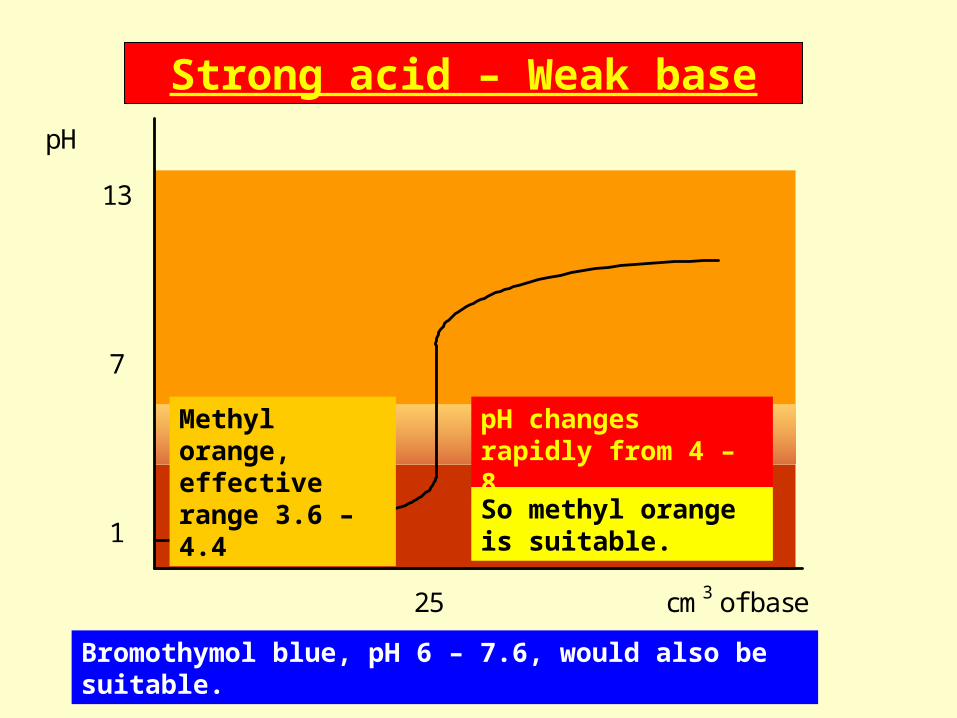
Methyl orange, effective range 3.6 – 4.4
pH changes rapidly from 4 – 8.
So methyl orange is suitable.
Bromothymol blue, pH 6 – 7.6, would also be suitable.
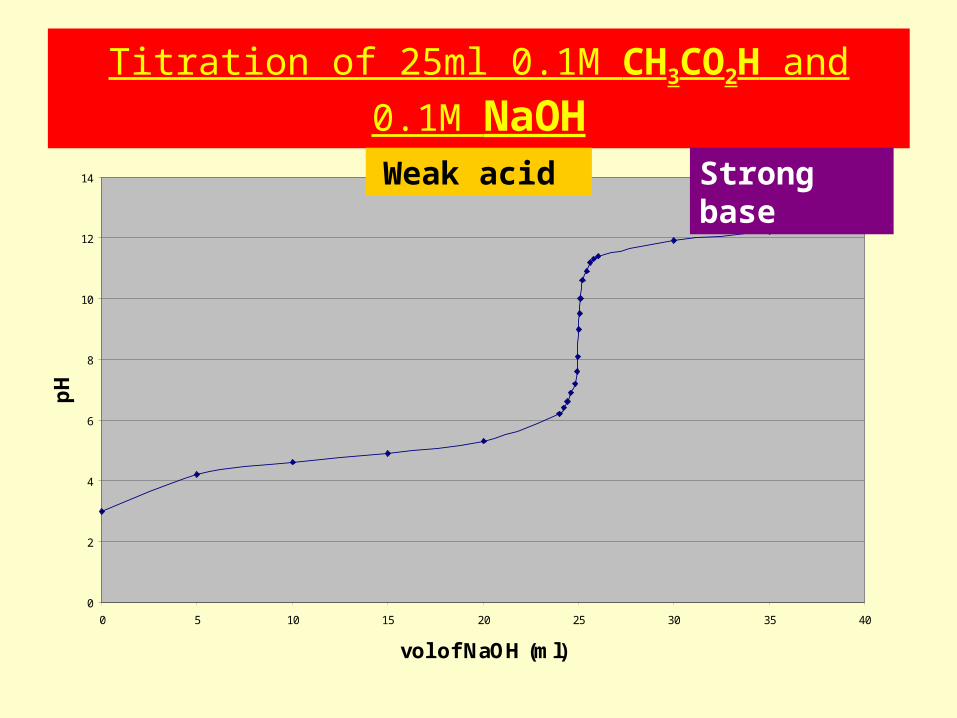
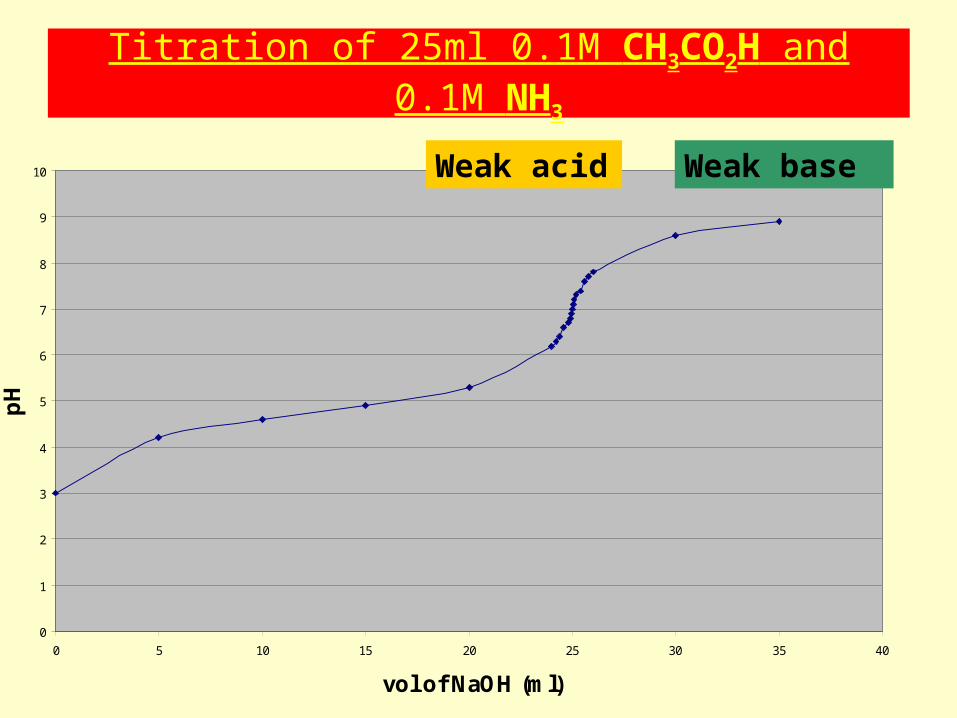
Titration of 25ml 0.1M CH3CO2H and 0.1M NaOH
0
2
4
6
8
10
12
14
0 5 10 15 20 25 30 35 40
vol of NaOH (ml)
pH
Weak acid Strong base
Weak acid – Strong base pH
7
1
13
25
cm3 of base
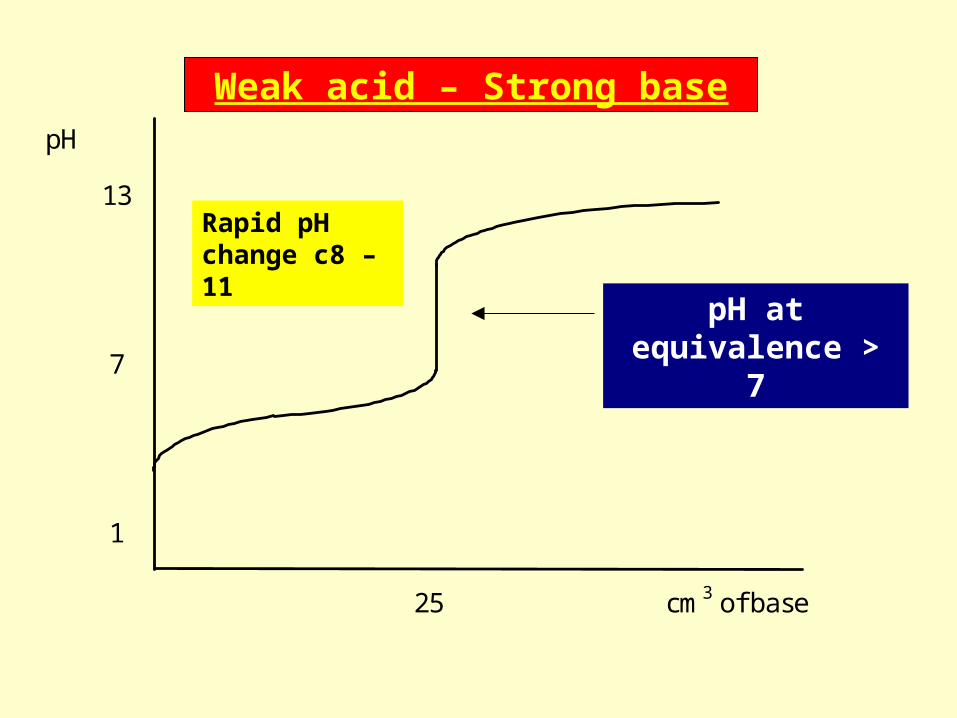
pH at equivalence > 7
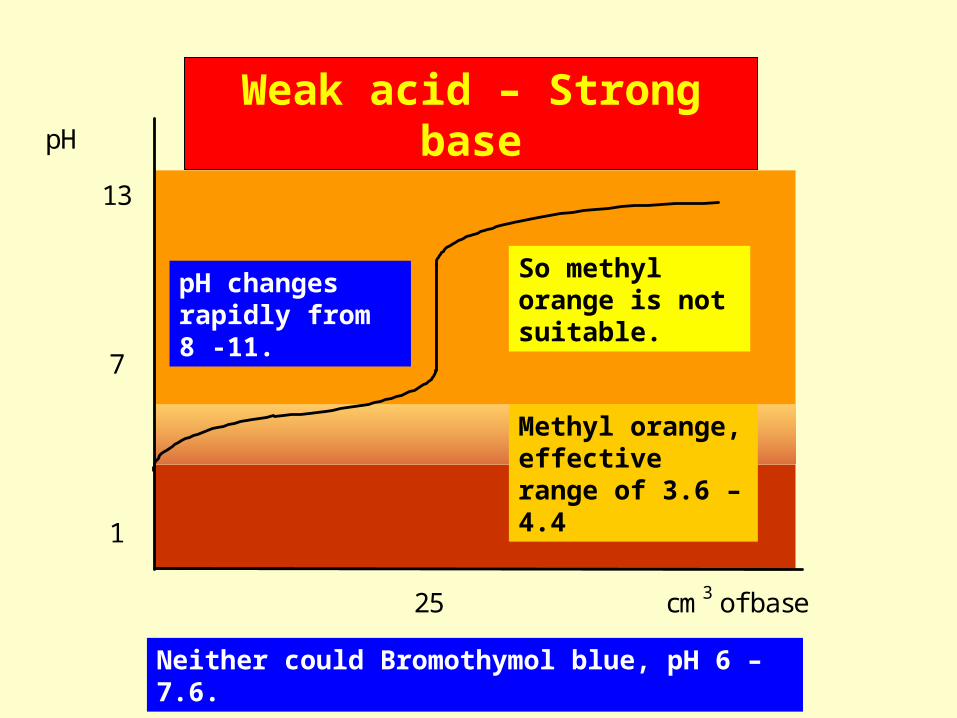
Rapid pH change c8 – 11

Weak acid – Strong base pH
7
1
13
25
cm3 of base
Rapid pH change occurs c 8 – 11
Phenolphthalein, pH range of 8.2 – 10
So phenolphthalein is suitable.
Weak acid – Strong base pH
7
1
13
25
cm3 of base
Methyl orange, effective range of 3.6 – 4.4
pH changes rapidly from 8 -11.
So methyl orange is not suitable.
Neither could Bromothymol blue, pH 6 – 7.6.
Titration of 25ml 0.1M CH3CO2H and 0.1M NH3
0
1
2
3
4
5
6
7
8
9
10
0 5 10 15 20 25 30 35 40
vol of NaOH (ml)
pH
Weak acid Weak base
Weak acid – Weak base pH
7
1
13
25
cm3 of base
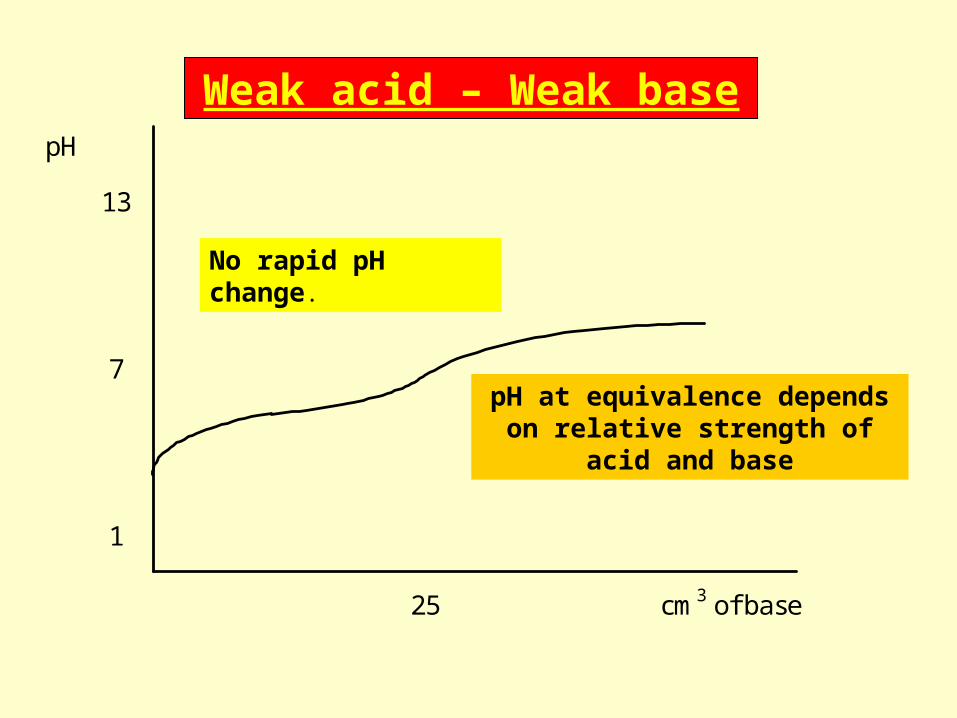
pH at equivalence depends on relative strength of acid and
base
No rapid pH change.
Weak acid – Weak base pH
7
1
13
25
cm3 of base
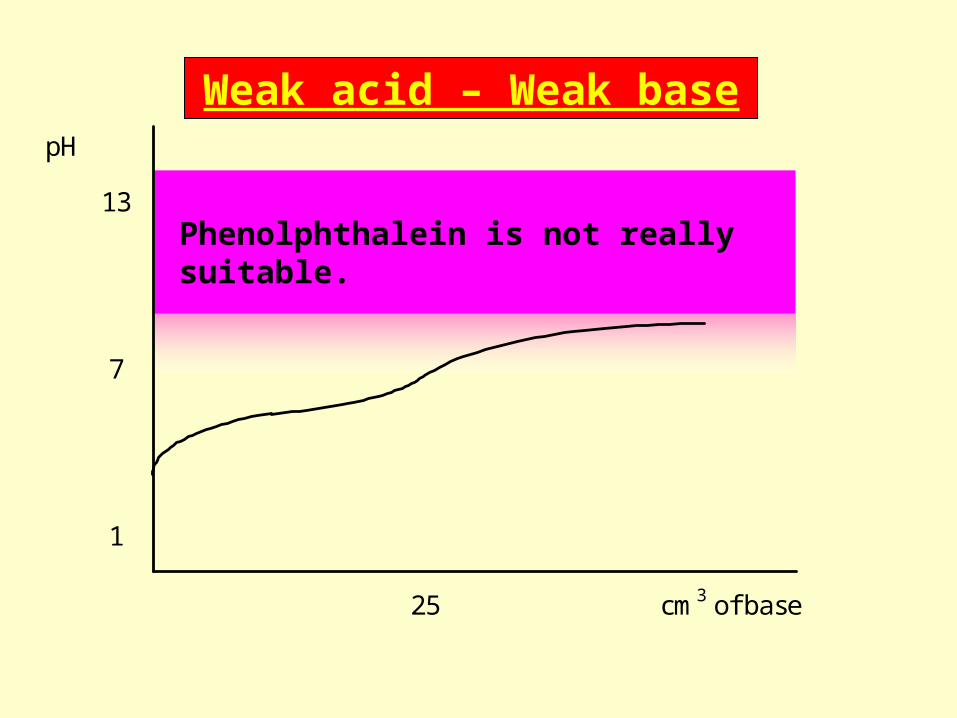
Phenolphthalein is not really suitable.
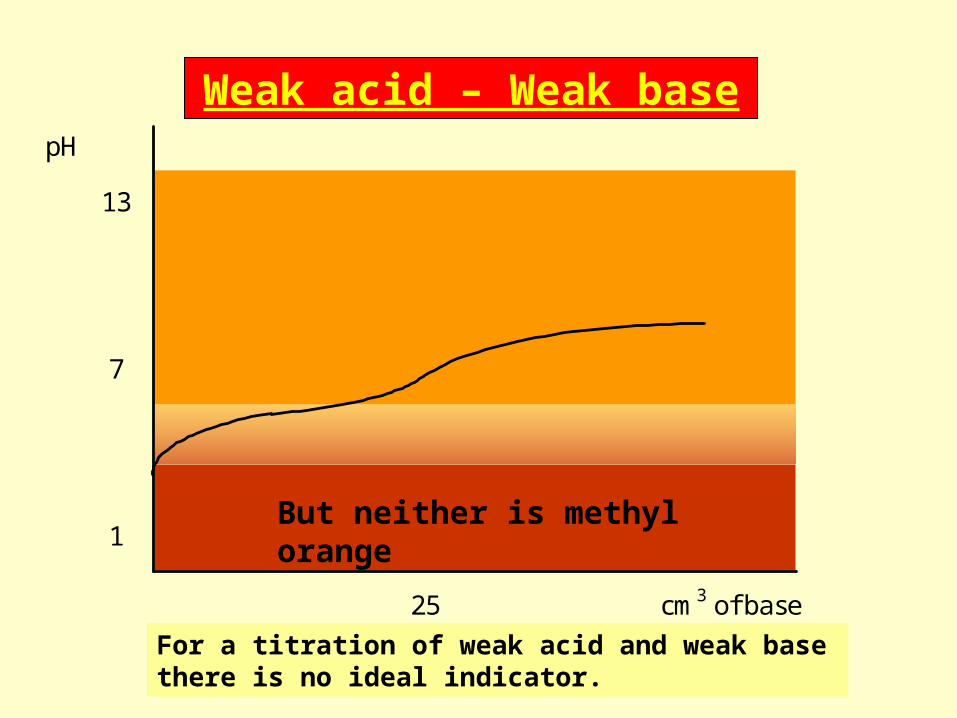
Weak acid – Weak base pH
7
1
13
25
cm3 of base
But neither is methyl orange
For a titration of weak acid and weak base there is no ideal indicator.
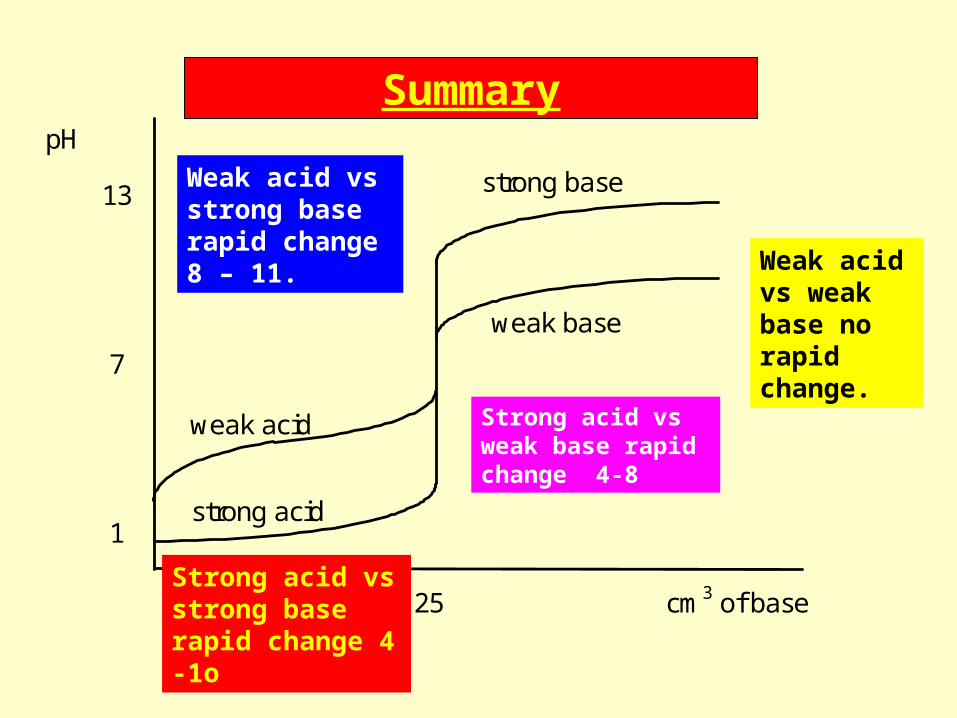
Summary pH
7
1
13
25
cm3 of base
strong base
weak base
strong acid
weak acid
Strong acid vs strong base rapid change 4 -1o
Strong acid vs weak base rapid change 4-8
Weak acid vs strong base rapid change 8 – 11. Weak acid
vs weak base no rapid change.
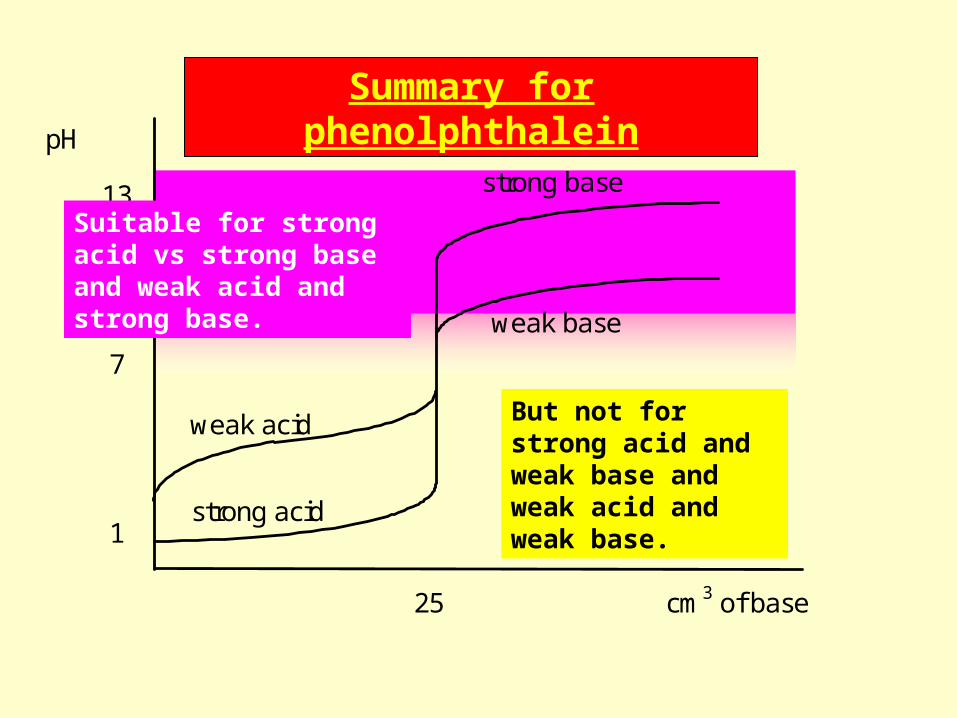
Summary for phenolphthalein pH
7
1
13
25
cm3 of base
strong base
weak base
strong acid
weak acid
Suitable for strong acid vs strong base and weak acid and strong base.
But not for strong acid and weak base and weak acid and weak base.
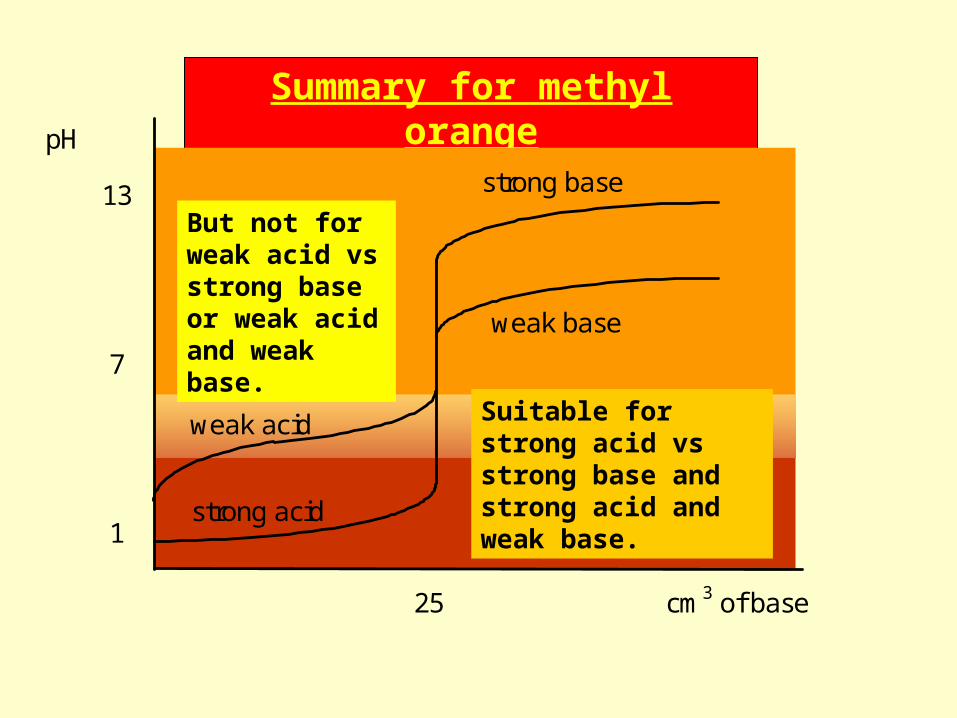
Summary for methyl orange pH
7
1
13
25
cm3 of base
strong base
weak base
strong acid
weak acid Suitable for strong acid vs strong base and strong acid and weak base.
But not for weak acid vs strong base or weak acid and weak base.
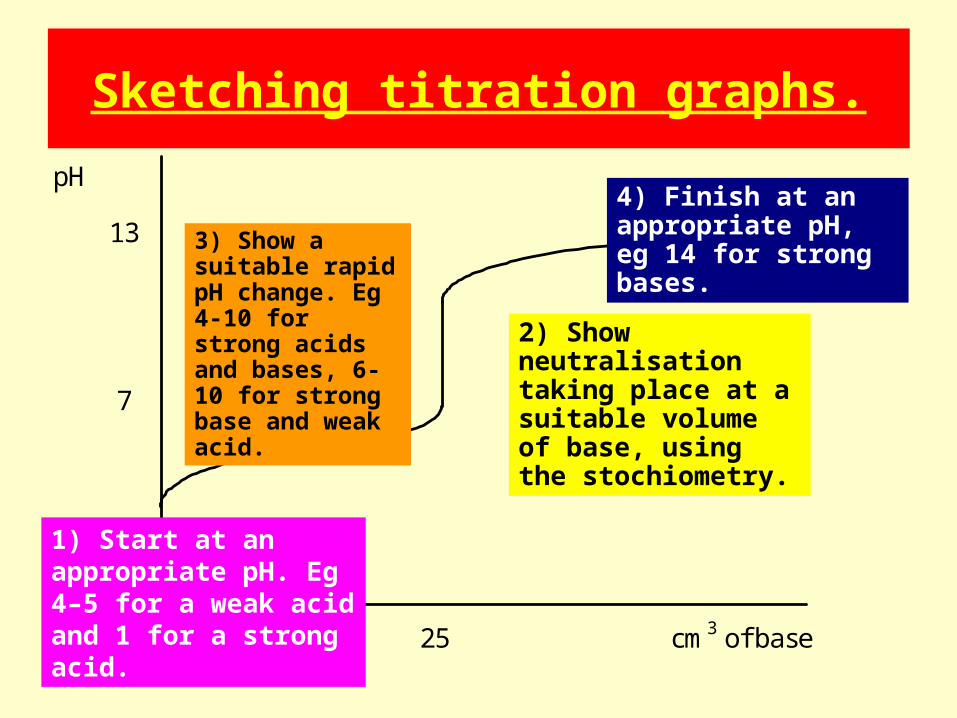
Sketching titration graphs.
pH
7
1
13
25
cm3 of base
1) Start at an appropriate pH. Eg 4–5 for a weak acid and 1 for a strong acid.
2) Show neutralisation taking place at a suitable volume of base, using the stochiometry.
3) Show a suitable rapid pH change. Eg 4-10 for strong acids and bases, 6-10 for strong base and weak acid.
4) Finish at an appropriate pH, eg 14 for strong bases.
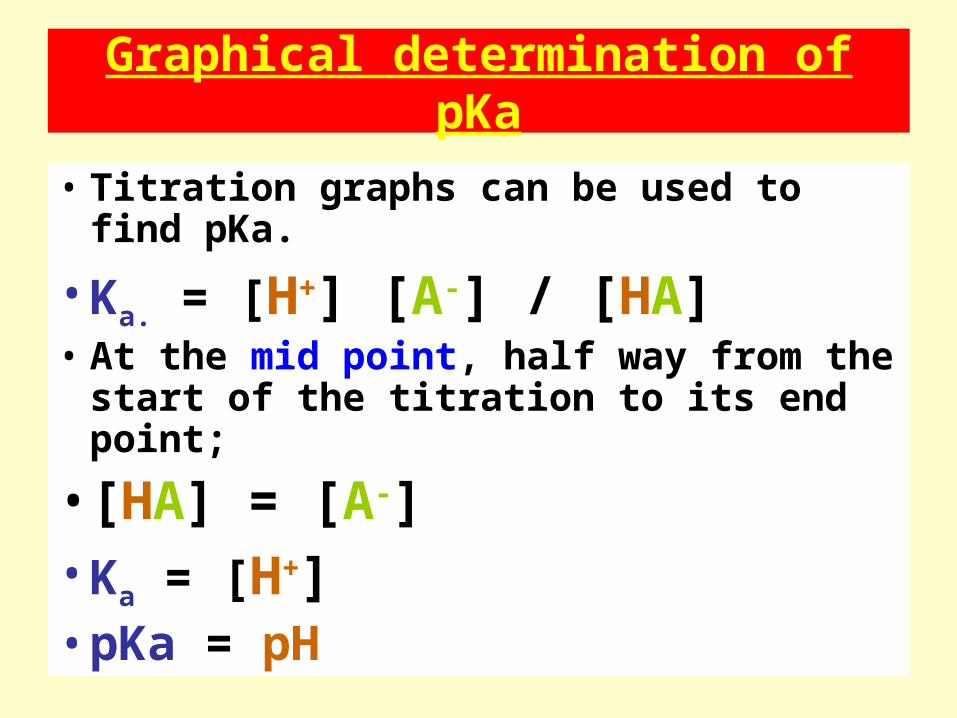
Graphical determination of pKa
• Titration graphs can be used to find pKa.
• Ka. = [H+] [A-] / [HA]• At the mid point, half way from the start
of the titration to its end point;
• [HA] = [A-]• Ka = [H+]• pKa = pH
0
2
4
6
8
10
12
14
0 5 10 15 20 25 30 35 40
vol of NaOH (ml)
pH
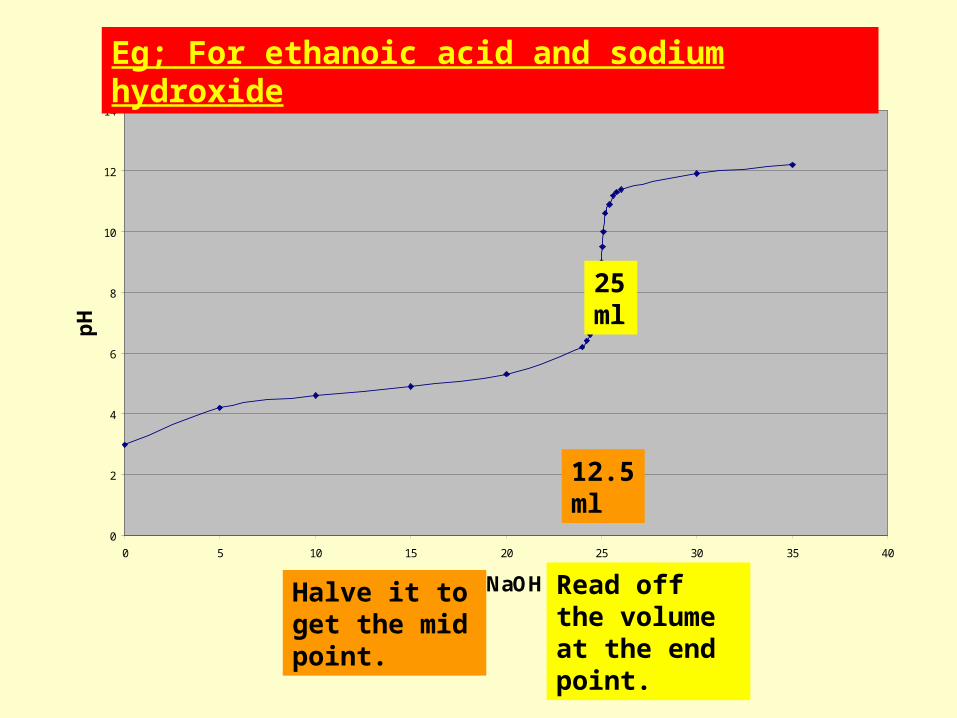
Read off the volume at the end point.
Halve it to get the mid point.
25 ml
12.5 ml
Eg; For ethanoic acid and sodium hydroxide

0
2
4
6
8
10
12
14
0 5 10 15 20 25 30 35 40
vol of NaOH (ml)
pH
Draw a line up to the graph at 12.5ml.
Then draw a line to the y axis.
Read off the pH, which = pKa