title technology-based tools for english literacy
TRANSCRIPT

Title Technology-based tools for English literacy intervention: Examining
intervention grain size and individual differences Author(s) Beth A. O’Brien, Malikka Habib and Luca Onnis Source Frontiers in Psychology, 10, Article 2625 Published by Frontiers Media Copyright © 2019 The Authors This is an Open Access article licensed under a Creative Commons Attribution License (http://creativecommons.org/licenses/by/4.0/). This document is protected by copyright and was first published by Frontiers. All rights reserved. It is reproduced with permission. Citation: O'Brien, B. A., Habib, M., & Onnis, L. (2019). Technology-based tools for English literacy intervention: Examining intervention grain size and individual differences. Frontiers in Psychology, 10, Article 2625. https://doi.org/10.3389/fpsyg.2019.02625

fpsyg-10-02625 November 26, 2019 Time: 12:10 # 1
ORIGINAL RESEARCHpublished: 26 November 2019
doi: 10.3389/fpsyg.2019.02625
Edited by:Wai Ting Siok,
The University of Hong Kong,Hong Kong
Reviewed by:Heikki Juhani Lyytinen,
University of Jyväskylä, FinlandJackie Masterson,
UCL Institute of Education,United Kingdom
*Correspondence:Beth A. O’Brien
[email protected] Onnis
Specialty section:This article was submitted to
Language Sciences,a section of the journalFrontiers in Psychology
Received: 02 August 2019Accepted: 07 November 2019Published: 26 November 2019
Citation:O’Brien BA, Habib M and Onnis L
(2019) Technology-Based Toolsfor English Literacy Intervention:
Examining Intervention Grain Sizeand Individual Differences.
Front. Psychol. 10:2625.doi: 10.3389/fpsyg.2019.02625
Technology-Based Tools for EnglishLiteracy Intervention: ExaminingIntervention Grain Size and IndividualDifferencesBeth A. O’Brien1* , Malikka Habib1 and Luca Onnis2*
1 National Institute of Education, Nanyang Technological University, Singapore, Singapore, 2 Department of EducationSciences, University of Genoa, Genoa, Italy
Technology plays an increasingly important role in educational practice, includinginterventions for struggling learners (Torgesen et al., 2010; de Souza et al., 2018).This study focuses on the efficacy of tablet-based applications (see WordReading, Grapholearn, and an experimental word-level program) for the purpose ofsupplementing early English literacy intervention with primary grades 1 and 2 children.The children were identified for learning support programs within Singaporean schools,which follow a bilingual policy, meaning children were learning reading in Englishplus an additional language. One hundred forty-seven children across seven schoolsparticipated (Mean age = 6.66). Within learning support classrooms, triplets of studentsmatched on basic reading skills were randomly assigned to one of three groups:(1) phoneme-level, (2) rime-level, or (3) word-level focused interventions. All groupsperformed reading skills activities on iPads, across two phases over a 14-weekperiod. Assessments for word reading accuracy and fluency, pseudoword decodingaccuracy and fluency, and spelling were administered at four time points, pre- and post-intervention. Additional baseline measures were taken to assess individual differencesin phonological awareness, orthographic awareness, general cognitive ability, statisticallearning, and bilingual vocabulary knowledge. Mixed model analysis was conductedon the pre- to post-test measures across the two phases of the intervention(focused on accuracy then fluency). All groups made gains across the different literacymeasures, while the phoneme-level intervention showed an advantage over the rime-level intervention, but not the word-level intervention, for decoding. There were alsomoderating effects of individual differences on outcomes. The general pattern of resultsshowed an advantage of the word-level intervention for those with poorer phonologicalawareness for reading fluency; and a phoneme-level intervention advantage for thosewith poorer statistical learning ability. Children’s bilingual group (English plus Mandarin,English plus Malay, or English plus Tamil) also showed differential effects of the typeof intervention (e.g., phoneme- or word-level) on different outcome measures. Theseresults, along with data collected from the tablets during the intervention, suggest theneed to examine the interplay between different types of technology-based interventionsand individual differences in learning profiles.
Keywords: struggling readers, technology, intervention, statistical learning, phonological awareness
Frontiers in Psychology | www.frontiersin.org 1 November 2019 | Volume 10 | Article 2625

fpsyg-10-02625 November 26, 2019 Time: 12:10 # 2
O’Brien et al. Literacy Intervention and Grain Size
INTRODUCTION
Since the first evident writing system in 1800 BCE (Wolfand O’Brien, 2006), several iterations of invented symbolicrepresentations of language emerged and have persisted tothe present day – the prolific alphabetic systems, alongwith alphasyllabaries and morphosyllabaries. The glacial-speedchanges to these invented writing systems seem to have metwith an evolutionary leap currently upon us – the technology-supported renditions of script. New possibilities of interactingwith script that is responsive and dynamic creates differentenvironments for processing text as a reader. At the same time,new environments are made possible for learning to read. Itis important to consider how reading occurs on a cognitivelevel, and by extension how reading is learned, as half of theequation in the human–machine interface of reading on modernelectronic digital devices. The focus of the current study is onteaching children to read in English with the use of technology-mediated applications. In particular, we center on childrenwho are struggling learners, and in this case also bilinguallearners who are learning to read in an additional languagealong with English.
Technology-based environments for instruction andintervention have some advantages over traditional methods,in that they are engaging, reduce social pressure to perform,are adaptable to individual performance with features likeembedded scaffolding and feedback, as well as the crucialingredient for struggling learners – extensive practice (Clarket al., 2016; Laurillard, 2016; de Souza et al., 2018). Nevertheless,meta-analytic findings report better student progress withteacher-based versus computer-based interventions (Dowker,2005; Slavin et al., 2011), but these findings do not accountfor differences across computer-based programs, where someapproaches may be more beneficial than others. Rather thanbeing considered as a replacement for human-led instruction, itis suggested that technology-based approaches serve primarilyas tools that can be used to remediate or optimize learningexperiences for all individuals (Dowker, 2005; Rose andStrangman, 2007). Accordingly, it is recommended thattechnology-based instruction conforms to known learningand pedagogical principles (e.g., Butterworth and Yeo, 2004;Hirsh-Pasek et al., 2015); that is by “using the combinationof images and sounds and through a paradigm that triesto understand human behavior and, as well, employ anapproach that matches how effective teaching actually occurs”(de Souza et al., 2018, p. 7).
An unresolved debate concerns what is the most effectiveteaching approach for English literacy acquisition. This includesquestions about the optimal input for learning to read in theEnglish language (National Reading Panel (US) et al., 2000;Walton et al., 2001; Hatcher et al., 2006), especially for strugglinglearners and children learning to read in multiple languages,as in the present study (Rickard Liow and Lau, 2006). Shouldinstruction be aimed at coding of the individual phoneme, orsublexical rime patterns, or even whole words? This question isespecially relevant to reading in English, because English is notconsidered as an ‘ideal’ alphabetic system with clear mappings
of letters to speech sounds (Caravolas, 2004). English has a deeporthography, beyond simple 1:1 mappings to the phonology, andit is even described as more of a morphophonemic system than astrictly alphabetic one (Nagy et al., 2006). The deep orthographymeans that sometimes letters are pronounced different ways,or sounds are spelled differently; yet there is solace in largercontextual units in terms of spelling-sound consistency. Rimepatterns are more consistent than individual vowels, and thepreceding consonant can provide information about how avowel should be pronounced (Treiman et al., 2002, 2006). Asa ‘non-ideal’ alphabetic system, English presents a challenge tobeginning readers (Seymour et al., 2003).
Beginning readers have to learn the mapping system betweenphonology and orthography (Perfetti and Veroeven, 2017). Tounderstand this mapping system, they need to be able to identifyphonological units within words in order to map them tocorresponding orthographic symbols (e.g., letters). Knowledgeabout the language’s orthography as well as an awareness of thephonology are thus two requisites for learning this mappingsystem. Orthographic awareness involves knowledge about thestructure of written language, in terms of where letters tendto appear within words and permissible letter sequences, whilephonological awareness involves the ability to identify, segment,and manipulate speech sounds within words. Ample evidencesupports the close and predictive role of phonological awarenessto reading ability across alphabetic writing systems (Loniganet al., 2000; Melby-Lervåg and Lervåg, 2011; Branum-Martinet al., 2012). Thus, phonological awareness is held as a centralmechanism for learning to read alphabetic languages.
Additionally, or alternatively, it is suggested that reading maybe mediated by statistical learning mechanisms (Seidenberg andMcClelland, 1989). Statistical learning involves the ability to pickup probabilistic properties of information, usually implicitly. Itis argued that the process of learning to read involves implicitlypicking up the mapping system of speech and print (phonology –orthography) as a set of statistical regularities (Steacy et al.,2017; Sawi and Rueckl, 2018). Steacy et al. (2017) propose anindividual differences model in which statistical learning is akey mechanism that impacts how children are able to avail oflearning opportunities in their environment – or not, in thecase of struggling learners. In support of this, performance onstatistical learning tasks correlates with reading ability across arange of ages (Arciuli and Simpson, 2011).
Struggling readers, or children with developmental dyslexia,show an array of anomalies in terms of performance onmeasures of phonological awareness, rapid symbol naming,orthographic awareness (Norton and Wolf, 2012; Peterson andPennington, 2012; Wandell et al., 2012), and, according to morerecent findings, statistical learning (Aravena et al., 2013; Gabayet al., 2015; Sawi and Rueckl, 2018). Measures of phonologicalawareness robustly discriminate typical from atypical readers,including findings across adults, children and at-risk pre-readers(Pugh et al., 2000; Hampson et al., 2004; Hoeft et al., 2006; Sayginet al., 2013). Moreover, reduced performance on phonologicalawareness tasks correlates with neurophysiological anomaliesin regions of the reading circuit of the brain (Saygin et al.,2013), and reported deficits in phonological awareness persist
Frontiers in Psychology | www.frontiersin.org 2 November 2019 | Volume 10 | Article 2625

fpsyg-10-02625 November 26, 2019 Time: 12:10 # 3
O’Brien et al. Literacy Intervention and Grain Size
across development for individuals with dyslexia (Goldstein andKennemer, 2005). Statistical learning ability predicts readingability within groups with dyslexia (Gabay et al., 2015), anddyslexic individuals show poorer performance on implicitlearning tasks related to sounds and letter-to-sound matching(Aravena et al., 2013; Gabay et al., 2015). Findings support therole of statistical learning in dyslexia, although this may not beas consistent as those with phonological awareness (Sawi andRueckl, 2018). Thus, these possible mechanisms for learning toread, phonological awareness and statistical learning, may affectstudent learning, and so we focus on these as possible moderatorsof intervention effects for struggling learners.
Furthermore, biliterate bilinguals demonstrate cross-linguistic and cross-orthographic influence (Koda, 2005; Geva,2014; Lallier and Carreiras, 2018), raising questions aboutapproaches to training. Different writing systems vary in theircognitive demands, including levels of metalinguistic awareness.Knowledge about phonology is evidently important for learningto read English and other alphabetic languages, but somelanguages are more easily decodable at the phoneme level (e.g.,Italian, Tamil), versus the syllable level (e.g., English, Malay),while others are morphemically more transparent (e.g., Chinese)(Bassetti, 2013). The unit level or grain size of reading forbilingual readers is hypothesized as a hybrid of the optimalgrain-sizes per their known languages (Lallier and Carreiras,2018). Thus, of concern is whether promoting awareness at thephoneme level has positive effects across languages, or may besimply confusing for some bilingual children who learn to spellin one language at the syllable or morpheme level (e.g., RickardLiow and Lau, 2006, p. 876). Therefore, we also considered inour analysis the other language that the children were learning inschool, simultaneous with English, and how this played out withintervention effects.
Thus, in the current study on technology-mediated readingintervention, we consider the debated optimal input for learningto read English – at the level of either the phoneme, rime orwhole word unit. Previous studies found that computer assistedreading training with speech-feedback was most beneficial whenfeedback was directed at either syllable or onset-rime units ascompared with whole words (Olson and Wise, 1992; Ecalle et al.,2009), while a study with graphics-based feedback showed atrend for better benefits with a focus at the rime-level versus thephoneme level (Kyle et al., 2013). However, given the range andheterogeneity of difficulties that individual struggling learnersshow, it is also quite possible that certain types of intervention aremore beneficial for different types of learners than others (e.g., seeCheung and Slavin, 2013). Therefore, we consider the question ofthe optimal input unit-size along with individual differences thatmay moderate such effects.
In the current study with early primary school (grades 1–2)children learning to read in English within Singapore, we addressthe following research questions:
(1) What is the optimal grain size for teaching strugglinglearners the phoneme–grapheme correspondences ofEnglish? We investigate this question using a randomizedcontrolled design with three intervention groups, focusing
technology-mediated intervention at (a) the phoneme-level, (b) rime-level, or (c) the word-level. Two phases ofinstruction focus on, first, explicit teaching and learningof GPC through iPad-based activities for developingaccuracy for phoneme–grapheme correspondence (GPC).The second phase extends the learning of GPC accuracyto fluency through iPad-based activities that requirerapid matching of orthographic patterns to an auditorystimulus. We hypothesize that the word level group wouldshow least progress, as lexical processing would be lessefficient than to learn sublexical GPC patterns.
(2) Do individual characteristics of struggling learnersmoderate the effect of intervention? We includebaseline measures of individual performance onphonological awareness and statistical learning, alongwith orthographic awareness and rapid naming measuresto examine possible interactions with learning outcomes.Also, while English is the language of instruction inSingapore, children are exposed to and are taught earlyliteracy skills in their additional language (Mandarin orMalay or Tamil). Therefore, we also consider individualdifferences in line with the sets of scripts that each childis learning in school. We hypothesize that phonologicalawareness may be more relevant for the phoneme levelintervention, since lexical strategies could be used for theword level intervention activities, such that phonologicalawareness would positively moderate outcomes for thephoneme-level group. Also, we hypothesize that statisticallearning may be most beneficial with the rime levelintervention, because picking up orthographic patternswould be easier for those with greater statistical learningability. Therefore, we would predict that phonologicalawareness moderates outcomes for intervention focusedat the phoneme level, and statistical learning moderatesoutcomes for intervention focused at the rime level.
MATERIALS AND METHODS
ParticipantsOne hundred forty-eight children from seven primary schools ingeographically dispersed locations across Singapore participated(Mean age = 79.91 months, SD = 4.82, at the beginningof the study). One hundred and thirty-six were enteringprimary grade 1, and 12 primary grade 2. The children wereidentified as at risk for reading difficulties, and were enrolledinto learning support programs (LSPs) within Singaporeanschools. Informed consent was obtained for all participantsfrom a parent, along with child assent, in accordance withthe Declaration of Helsinki. Procedures were approved by andfollowed ethical standards of the research team’s universityinstitutional review board. Within learning support classrooms,triplets of students matched on basic reading skills (BritishAbility Scales-III) were randomly assigned to one of threeintervention groups: (a) phoneme-level, (b) rime-level, or (c)word-level focused interventions. Within each interventiongroup, there were 58 English–Chinese, 73 English–Malay,
Frontiers in Psychology | www.frontiersin.org 3 November 2019 | Volume 10 | Article 2625

fpsyg-10-02625 November 26, 2019 Time: 12:10 # 4
O’Brien et al. Literacy Intervention and Grain Size
and 17 English–Tamil speakers, where the composition ofbilingual groups did not differ across intervention conditions[X2(4) = 2.57, p > 0.05]. Further, the intervention groupsdid not differ in age [F(2,145) = 0.078, p > 0.05], nor onbaseline measures of cognitive ability and vocabulary (referto Table 1).
MeasuresBaseline measures were taken prior to pretest. Outcome measuresof reading and decoding accuracy and fluency, plus spelling weretaken at four time points: pre-test prior to intervention, mid-testat the end of intervention phase one, post-test at the end of phasetwo of the intervention, and follow-up 3 months after post-test.
Baseline MeasuresGeneral Cognitive Ability was assessed with the British AbilityScales III Quantitative Reasoning (SET B; Rasch split-halfreliability = 0.87–0.90) and Matrices (reliability = 0.83–0.87)subtests (Elliott and Smith, 2011). Children view sets of numberpairs and are asked to find the relationship between the pairs inorder to complete additional number sets (by filing in blanks withthe corresponding number). Administration was discontinuedafter three consecutive errors. In the Matrices subtest, childrenview a matrix of 9 figures including one blank, and they haveto choose a figure, from 4 to 6 options, to complete the matrixpattern. Administration was discontinued after three consecutiveerrors. An overall summed score from both tests was used asan indicator of cognitive ability and was entered as a covariate.Raw scores were used because local norms are not currentlyavailable for this test.
Verbal memory was assessed using the Memory for Digitssubtest of the Comprehensive Test of Phonological Processing(CTOPP-2; Wagner et al., 2013). Children were given a series ofdigits and asked to repeat them backward. This subtest is madeup of 21 items. A score of 1 was given for correct response. Thetask was discontinued when the child made three consecutiveincorrect responses.
Receptive Vocabulary was assessed using theBilingual Language Assessment Battery (BLAB;
Rickard Liow and Sze, 2008; split-half reliability for English =0.85 and for Mother Tongue = 0.80, from a local sample).The BLAB is a locally developed measure that has been usedin multiple published studies in Singapore. Both vocabularytests follow the same format, where, on each trial, childrenlistened to an audio-recorded word and selected one of fourpictures on the iPad screen that matched the word. Childrencompleted this task in both the English language and thechild’s Mother Tongue or heritage language (Mandarin,Malay, or Tamil) that they were also learning in school. Inboth English and Mother Tongue versions of the BLAB,children first completed three practice trials with correctivefeedback, followed by 80 experimental trials. The final scorefor each child was the total number of correct responses on theexperimental trials.
Basic reading skill was assessed at baseline with the BritishAchievement Scale III Reading subtest (Elliott and Smith,2011), using form Word Reading form A (Rasch split-halfreliability = 0.99). The task was administered according to theguidelines, whereby all children started with item 1 and wereasked to read aloud a series of words presented on a stimuluscard. Testing was discontinued when the child made 8 errorsin a block of 10 words. Items were scored according to locallyaccepted standards of pronunciation, with 1 point awarded percorrect response. Total number of correct words was summed forthe final score.
Phonological awareness was assessed in English using theComprehensive Test of Phonological Processing Elision subtest(CTOPP-2; Wagner et al., 2013, split-half reliability = 0.95 froma local sample). Children were required to listen to a word (e.g.,toothbrush), repeat it, and then say what is left of that word afterdropping designated word (e.g., brush) or sound segments (e.g.,cup without the sound/k/). Corrective feedback was given on thefirst 10 items. Test administration was discontinued after threeconsecutive errors. An overall total correct score was used as anindicator of phonological awareness.
Rapid symbol naming was assessed in English with theCTOPP-2 RAN letters subtest (Wagner et al., 2013) (test–retestreliability = 0.90). In this test, the children named sets of letters
TABLE 1 | Baseline measures across intervention groups.
Phoneme Rime Word
Baseline measure M SD M SD M SD F, p
Reading achievement 7.64 10.08 6.09 6.51 6.93 8.49 0.169, 0.85
Non-verbal ability 86.62 8.00 87.58 7.83 86.12 7.46 0.373, 0.69
Memory for digits 6.56 5.68 7.31 5.73 7.23 4.95 0.354, 0.70
Vocabulary English 26.85 11.98 22.76 12.92 22.92 12.59 1.416, 0.25
Vocabulary other 35.86 12.45 31.93 12.15 32.54 11.49 0.798, 0.45
Phonological awareness 7.17 5.35 6.92 4.55 7.75 5.96 0.369, 0.69
Rapid symbol naming 40.13 22.28 40.53 17.47 42.06 48.07 0.037, 0.96
Orthographic awareness 22.69 4.05 21.40 4.57 21.30 5.05 0.301, 0.74
Reading achievement and non-verbal ability was assessed with BAS-3 (Elliott and Smith, 2011) and are reported as total correct raw scores; Vocabulary for English andthe child’s other language (Mandarin, Malay, or Tamil) was assessed with the BLAB (Rickard Liow and Sze, 2008); Memory for digits, phonological awareness, and rapidsymbol naming were assessed with the CTOPP-2 (Wagner et al., 2013); Orthographic awareness measure was adapted (Cunningham et al., 2001; O’Brien, 2014). Foreach measure, total correct raw scores are reported, except for rapid symbol naming which is reported in total seconds taken to complete all items.
Frontiers in Psychology | www.frontiersin.org 4 November 2019 | Volume 10 | Article 2625

fpsyg-10-02625 November 26, 2019 Time: 12:10 # 5
O’Brien et al. Literacy Intervention and Grain Size
that were presented in 4 rows by 8 columns. Time to completenaming all items was scored in seconds.
Orthographic awareness was measured using an orthographicchoice task (Cunningham et al., 2001), and a wordlikenessjudgment task (Cunningham et al., 2001; O’Brien, 2014).For the orthographic choice task, children had to distinguishwords from non-word letter strings that could be pronouncedidentically (e.g., rain–rane). The task included 23 trials. For thewordlikeness task, children decided which of two letter-stringslooked more like a real word (e.g., beff-ffeb). This task included19 trials. Stimuli for each task were presented on an iPad, andchildren completed all items (split-half reliabilities = 0.51–0.84,Cunningham et al., 2001). The total correct score was summedfor the two tasks.
Statistical Learning (SL) was assessed using a visual SL testsimilar to Arciuli and Simpson (2011) and Raviv and Arnon(2018). The SL test comprised two phases: (1) a training phase,followed by (2) a surprise forced-choice test phase (refer toAppendix). Four base triplets of 12 cartoon figures describedas “aliens” were chosen as stimuli for the task. Training Phase1. The triplets were presented as a continuous stream of aliensqueuing up to board a space-ship. Aliens were shown one at atime, in the center of the iPad display against a black background(each visible for 500 ms with an interstimulus interval of 100 ms).Each triplet appeared 24 times. There were also 24 occasionswhere a repeated presentation of one alien was given, and thechild’s task was to detect these instances and press a button. TestPhase 2. After completing phase 1, children were given a ‘test’task, for which they were asked to identify alien triplets that hadappeared together previously. In a 2-AFC they chose whether thetriplet on the left or right of the screen had appeared togetherbefore. Overall, the average response rate was 50% correct (witha SD = 10.2%). This mean is low compared with similar agedtypically developing children in Raviv and Arnon (2018), whoreported a 52% response rate by 5 to 6 year olds, and 57% by 6to 7 year olds on a similar task. The poorer performance may notbe unexpected given that the current sample includes strugglingreaders, who have been shown to have poorer statistical learningin some studies (Aravena et al., 2013; Gabay et al., 2015). Scoreswere calculated as the difference between the raw score andchance level (16), with raw scores below 16 recast as 0’s.
Outcome MeasuresReading and decoding accuracy was assessed four times withthe letter-word identification and word attack subtests of theWoodcock-Johnson III Tests of Achievement (WJIII; Woodcocket al., 2007; test–retest reliability = 0.87 and 0.91). Childrenhad to identify letters first and then pronounce words ordecode pronounceable non-words, or pseudowords. The testwas discontinued when the child had six incorrect responses.The total number of correctly read words or pseudowords wastaken as the final score. Accuracy scores for word reading anddecoding were converted to grade equivalent scores based on thepublished norms of the WJIII (Woodcock et al., 2007), given thatthere may be age differences between the US-based normativesample and the current Singaporean sample for children inprimary grades 1 and 2.
Reading and decoding fluency was assessed four times with thesight word efficiency and phonemic decoding efficiency subtestsof the Test of Word Reading Efficiency (TOWRE-2; Torgesenet al., 2012; test–retest reliability = 0.97, 0.96, respectively,according to a local normative sample). A practice test wasfirst given to obtain confirmation that the child understood thedirections. The task was to read aloud as many words, thenpseudowords from separate lists as quickly as possible within45 s for each list. The total number of correctly read wordsor pseudowords was taken as the final score. Normative datafrom a local sample of Singaporean primary school children wereused to calculate z-scores for these reading and decoding tasks(Chen et al., 2016).
Spelling was assessed four times with the British AchievementScale III Spelling subtest (Elliott and Smith, 2011; Rasch split-halfreliability = 0.96–0.97). The spelling subtest was administeredfollowing the guideline whereby all children started with thefirst item, and they completed all items (10) in the first block.Thereafter, administration was conducted item-by-item untilthey committed 8 or more errors starting from the second block.Research assistants introduced the spelling task by pointingto the spelling worksheet corresponding to the child’s startingitem. Then the research assistant read the target word, read thesentence with the target word, and then repeated the target word(e.g., on. I lie on the grass. on). The total number of correctlyspelled words was taken as the final score.
ProceduresAssessmentsChild-based assessments were administered at four time points:at the beginning of the academic year, prior to intervention(baseline and pre-test in February) before the mid-year schoolbreak, between phases 1 and 2 of intervention (mid-test inMay); at the end of the academic year, after both phases ofthe intervention (post-test in October); and at the start of thefollowing academic year, 3 months after the intervention (follow-up in February the following year). The battery of tasks was givenin two to three sessions for each time-point, with each set taking30 to 60 min to complete. Tests were given in the same order, andeach task was administered individually to the child.
Experimental ConditionsThere were 46 students per intervention group across schools.Within each classroom, the randomly-assigned matched sets ofparticipants took part in one of three interventions: phoneme-,rime-, and word-level intervention, across two 7-week phasesof intervention. The first intervention phase was focused ontraining accuracy of GPCs (with the SeeWord Reading app) forthe phoneme and rime groups, and a word-level reading appfor the word group. The second intervention phase was focusedon training fluency of GPCs (with the Grapholearn app) for thephoneme and rime groups, while the word-level group continuedwith a word- and sentence-level app designed for this study.The phoneme group received the Grapholearn-Phoneme (GLP)app, and the rime group the Grapholearn-Rime app (GLR) tocontrast conditions based on two opposing theoretical viewsof how phonics should be taught: either at the small unit size
Frontiers in Psychology | www.frontiersin.org 5 November 2019 | Volume 10 | Article 2625

fpsyg-10-02625 November 26, 2019 Time: 12:10 # 6
O’Brien et al. Literacy Intervention and Grain Size
(e.g., following synthetic phonics, Hulme et al., 2002), or atthe rime level (e.g., following learning with analogies, Goswamiand Bryant, 1990). The word group served as a comparisonbetween lexical level compared with the sublexical level focus ofintervention (see Table 2).
InstructionEach school’s LSP coordinators or teachers were trained toadminister the intervention to small groups. Each child withinthe group worked independently on their own iPad. LSP staffprovided instruction on how to use the apps by demonstratingthe procedures of the app, and they explained the purpose sothat the child understood the point of the lesson. If a child hadany difficulty interacting with the content presented in the app,the staff helped the child by explaining the content using simplerlanguage. Instructions at each level were also given through theapp and children used headphones to listen. The staff checkedthat the children understood how to use the app effectivelybefore he or she worked on it independently. The trained LSPstaff supervised children in all groups working individually withthe iPad app for 10 min each day, 5 days per week duringtwo 7-week phases of instruction (for a total of 28 lessons).The level of treatment intensity was in line with other similarintervention studies (e.g., Leafstedt et al., 2004; de Graaff et al.,2009; Yeung et al., 2012).
InterventionPhase 1 – Training Grapheme–Phoneme AccuracyBoth the phoneme- and rime-level groups were first trained withthe SeeWord Reading app in a series of lessons that progressivelyteach students grapheme–phoneme correspondences for up to44 speech sounds (or phonemes) in English. The SeewordReading app is a digital, interactive tool that uses visualcommunication principles with picture-embedded fonts toprovide graphic cues so students may concretely visualizethe relationship of phonemic sounds to alphabetic letterforms(Seward et al., 2014). This intervention has been used successfullywith small groups of kindergarteners in the US and Singapore(O’Brien and Chern, 2015).
In the app, letterforms are presented with pictures of objectsthat begin with the sound represented by the letter (e.g., apeapod embedded within the letter ‘p’). There are three levelsin SeeWord Reading and each level records children’s audio andkinesthetic interactions: Letter-Sound Correspondence wherethree letters/sounds were taught each lesson in isolation (level 1),within words at the Word Building level (level 2) and within aconnected story at the Story level (level 3). Three to four letters
are presented in each lesson, and the order of presentation wasbased on the frequency of letters in English language (CommonCore State Standards for English Language Arts and Literacy),wherein the most common consonant and vowel sounds weretaught first in the program.
At the Letter-Sound Correspondence level, children werepresented with one letter at a time and matching visualcues to help them to remember the phoneme–graphemecorrespondences. For example, children were introduced to theletter ‘a’ and had to trace the letterform with their finger inthe same way they had been taught to write the letter inclass. Multiple attempts are allowed until the child draws inthe most accurate direction possible. Thereafter, a sequence ofimages embedded in the letterform appears (e.g., alligator, appleetc.) as a visual cue for the child. Finally, the child had toname the letter, find the corresponding sound and a word thatbegan with the sound.
At the next level, Word Building, children had to makewords using the sounds they had learned in the previous Letter-Sound Correspondence level. For instance, after naming the letter‘p’ and learning the corresponding sound/p/, a word rhymepattern/an/may be presented with a blank at the beginning.Children were instructed to find the missing letter by choosingand pulling the letter tiles from the bottom of the screen to theword. Visual cues of the embedded pictures were presented in theletters when the child tapped on the letter, if they were unsure ofits sound. Upon building a new word, children were instructed toread the word aloud and their voices were recorded for them toplay back and listen to or re-record.
Within the final Story level, children listened to a story fromthe app and while the text was highlighted as the words were read.Subsequently, they were asked to locate and touch each letter inthe story text that matched a given speech sound (phoneme).Positive reinforcement was provided in the form of stars whenthe correct letter was touched.
Training Word Identification and ReadingThe word-level group worked on developing their reading skillswith a series of iPad-based activities focused at the word level.The children worked with an in-house developed app, whichwas used to reinforce learning through vocabulary building andword reading games. The activities were aligned with the typeof review activities that were typically conducted at the end ofLSP lessons. There are five levels to the word reading game:(1) Picture Match, (2) Word Match, (3) Multiple Match, (4)Spelling Match, and (5) Flashcards. Each day of the week theypracticed a different level, and each activity included feedback,
TABLE 2 | Intervention activities per group.
Experimental group Intervention phase 1 (7 weeks) Intervention phase 2 (7 weeks)
Phoneme level SeeWord Reading (to learn GPC accuracy) Grapholearn – Phoneme (to develop GPC fluency)
Rime level SeeWord Reading (to learn GPC accuracy) Grapholearn – Rime (to develop GPC fluency)
Word level Activities to match words with pictures (for meaning), toselect their correct spelling, and to read words aloud.
Activities to match sentences with pictures (for correctmeaning), and to read sentences aloud
GPC = grapheme-to-phoneme correspondence; App = iPad tablet-based applications.
Frontiers in Psychology | www.frontiersin.org 6 November 2019 | Volume 10 | Article 2625

fpsyg-10-02625 November 26, 2019 Time: 12:10 # 7
O’Brien et al. Literacy Intervention and Grain Size
while the child could only move on to the next trial after selectingthe correct option.
Within the first level, Picture Match, children had to select thepicture that corresponded to the word presented on the iPad. Forinstance, when presented with the word “sat,” the child selectedthe image that matched the word. If a wrong image was selected,for example a picture representing “tip” instead of “sat,” thepicture would be highlighted in red and the word for that imagewas given as feedback. If the correct image for the word “sat” wasselected, it was highlighted in green and the correct word was readout to the child. The child could also click on the sound icon onthe screen to hear the word as many times as needed.
The next level, Word Match, included matching picture tothe printed word shown on the iPad. For example, the word“tap” would appear on the screen and the child had to selectone out of the three pictures corresponding to the meaning of“tap.” Similar feedback was given for an incorrect response (redhighlighing with corrective feedback) and a correct response(green highlighting and the word being read) as in the previouslevel. Moving onto the Multiple Match level, three images andthree words were shown on the screen and the children couldclick on the image to hear the corresponding word for each image.The child then had to drag each word under the correct image. Ifany of the words were matched to the wrong image, a buzzer rangand the word was dropped back down, for the child to retry.
In the fourth level, Spelling Match, one image was shownwith three words (e.g., tan, tap, tin). The children dragged thecorrectly-spelled word to match the image. They could also clickon the image to hear the word. Similar to the previous level, ifan incorrect word was matched to the image, a buzzer sounded,and the word was dropped back to the original position. If thecorrect word was matched to the image, the child could proceedto the next question. In the last level, Flashcards, children readwords presented on the iPad in a card deck with feedback. Theirvoice was recorded, then they could play their recording back andthen listen to the correct recording of the word to check if theywere accurate.
The research team worked closely with the LSP coordinatorsto develop the app to support the curriculum content, while atthe same time ensuring that the activities were focused on lexicalprocessing and were dissimilar from the sub-lexical focus of theother groups’ content. The children worked with the app on iPadsindividually for 10 min per day 5 days per week over the same7 week period as the other groups.
Phase 2 – Training Grapheme–Phoneme FluencyFor the phoneme and rime groups, the second phase of thestudy involved playing Grapholearn, a computerized learningenvironment for learning to pair audio segments (phonemes,syllables, and words) with visual symbols (graphemes, words,etc.) in a timed format to encourage automatization (Richardsonand Lyytinen, 2014). Feedback, positive and corrective, wasprovided and the game was adaptive to the player’s performance.The intervention has been widely used across multiple countries(e.g., Saine et al., 2011; Kyle et al., 2013).
The phoneme-level group played the Grapholearn-Phonemeversion, where letter-sound correspondences were learned
starting with the most frequent, most consistent, and mostprototypical first and these were also reinforced first during latergame streams. In streams 1 and 2, children were introduced toall the single letter-sound correspondences in English (e.g., ‘I,’‘a,’ ‘ee,’ ‘oa’). Following, in Stream 3, children were presentedwith phonemes that were blended into consonant-vowel (CV)units (e.g., /ti/, /loa/). Phonemes were combined into vowel-consonant (VC) units in Stream 4 and children had to combinethe letter-sounds into larger units and finally create real words.Starting from Stream 5, children were presented with wholewords and had to select letter-sound correspondences withinthe whole words or combine letter-sounds correspondences intowhole words (Kyle et al., 2013).
The rime-level group played the Grapholearn-Rime versionfocusing on orthographic rime units. In each stream, childrenfamiliarize themselves with a single letter-sound correspondence,learned to combine the letter-sound into an orthographic rimeunit with an onset and a rime pattern and finally into consonant-vowel-consonant (CVC) words. They then played games withmatching rhyming words (Kyle et al., 2013). Children were alsoshown how the same letter-sounds may be broken down interms of how the letters represent the constituent phonemes (e.g.,“p + ad = pad,” then “pad = p-a-d”). The first stream included asmall set of letter-sound correspondences (e.g., C, S, A, T, P, I, N).Rime units that were also real words were presented first (e.g., ‘at’and ‘in’) and reinforced. For example, children had to blend theorthographic rime units (e.g., A, T, I, and N) together into units(’at’ and ’in’), then with an added onset sound to build words (like‘cat’ and ‘tin’). Thereafter, rime units that were not real wordswere also introduced (e.g., ‘og’ and ‘ag’), allowing the creationof real words, such as dog and bag (Kyle et al., 2013). For bothGraphoLearn apps, there were periodic mini assessments, whereknowledge of symbol (grapheme) to sound matching was testedwithout feedback.
Training Word Identification and ReadingThe word-level group completed iPad-based activities on the in-house developed app, to continue reinforcing word vocabulary,spelling, as well as sentence comprehension. The activities forthe second phase of intervention included (1) Word Match, (2)Multiple Match, (3) Spelling Match and (4) Flashcards, and,by the end of phase, sentence-based activities for (5) SentencePicture Match and (6) Sentence Build. The first four activitieswere similar to phase 1, but with different words. In the SentencePicture Match, children see a picture and three short sentences(e.g., ‘They walk to the park’), then they picked which sentencematched the meaning of the picture. For Sentence Build, studentshad to listen to a sentence that was read out on the iPad.Thereafter, they selected words from a word bank at the bottomof the screen and dragged them into the appropriate place in thesentence. The children worked with the app on iPads individuallyfor 10 min five times per day over the same 7 week period asthe other groups. Children also read sentences for the Flashcardsactivity. For this, the child clicked on “rec” button to read thesentence into the microphone and clicked on the “play” button tolisten to their own recordings, then they could check the correctpronunciation of the word using a “check” button.
Frontiers in Psychology | www.frontiersin.org 7 November 2019 | Volume 10 | Article 2625

fpsyg-10-02625 November 26, 2019 Time: 12:10 # 8
O’Brien et al. Literacy Intervention and Grain Size
RESULTS
For the reading outcome measures, raw scores for accuracy onword reading and decoding were converted to grade equivalentscores based on the published norms of the WJIII (Woodcocket al., 2007). Raw scores for fluency on word reading anddecoding were converted to z-scores using a local normativesample of TOWRE scores (Chen et al., 2016). Spelling raw scoreswere scaled and centered within the current sample. Descriptivestatistics for these measures at pretest are presented in Table 3.
Zero-order correlations were first run with all of the outcomemeasures at each time point and with the baseline measures ofnon-verbal cognitive ability, phonological awareness, statisticallearning, rapid naming, and orthographic awareness, along withage. Table 4 shows the Pearson correlation coefficients forthis full set of measures, between the dependent variables forreading and spelling at each time point and the other baselinemeasures. As shown, there are high correlations between theoutcome measures of reading and spelling over time, and baselinemeasures also showed low to moderate correlations with outcomemeasures at most time points.
Research Question 1To address the first research question regarding the optimalgrain size for teaching struggling readers, mixed effects linearregression models were run separately for each outcome variableusing the lmer package in R (R Studio Version 1.1.442).Participants were entered as a random variable, and theinteraction of intervention group and time were entered asfixed variables. Age and non-verbal cognitive ability scores atbaseline were entered as covariates in all of the models. Theanalysis was first conducted with data from Phase 1 (for traininggrapheme–phoneme accuracy), including the pre-test and mid-test scores. This analysis compares the outcomes for a lexicalfocus, in the word group, versus a sublexical focus, in the othertwo groups. Then, the data across Phase 2 (for training spelling-sound fluency) were analyzed, including pre-test, mid-test, andpost-test scores. These analyses contrast the different phoneme-,rime- and word-unit level foci of the respective interventions.Finally, to examine the duration of effects, an analysis of post-testto follow-up data was undertaken.
TABLE 3 | Reading and spelling pretest scores across intervention groups.
Phoneme Rime Word
Measure M SD M SD M SD
Word reading accuracy 2.05 (1.05) 1.90 (0.08) 2.05 (0.82)
Non-word reading accuracy 3.78 (3.82) 2.75 (0.19) 3.33 (2.06)
Word reading fluency −1.11 (1.08) −1.41 (0.12) −1.01 (1.09)
Non-word reading fluency −0.39 (0.90) −0.64 (0.08) −0.34 (0.82)
Spelling 14.61 (1.47) 13.29 (1.18) 15.31 (8.59)
Word and Non-word Reading Accuracy = grade equivalent scores from the WJIIIword identification and word attack subtests (Woodcock et al., 2007). Word andNon-word Reading Fluency = z-scores based on local sample from the TOWRE-2sight word and phonemic decoding subtests (Torgesen et al., 2012; Chen et al.,2016). Spelling = raw scores from the BAS-3 (Elliott and Smith, 2011).
Phase 1Comparing performance of the intervention groups overtime, from pre-test to mid-test, showed main effects whereperformance improved over time in each dependent variable[word reading accuracy, t(138.44) = 11.76, p < 0.001; decodingaccuracy, t(143.17) = 6.81, p < 0.001; word reading fluency,t(137.68) = 7.98, p < 0.001; decoding fluency t(137.76) = 8.54,p < 0.001; spelling, t(131.91) = 10.67, p < 0.001]. None of thetime by intervention group interactions were significant for thistreatment phase (refer to Table 5).
Phase 2Models with three time points, pre-test, mid-test and post-test, again showed significant main effects of time foreach of the dependent variables [word reading accuracy,t(272.22) = 14.39, p < 0.001; decoding accuracy, t(279.53) = 7.88,p < 0.001; word reading fluency, t(268.55) = 9.70 p < 0.001;decoding fluency t(268.86) = 10.04, p < 0.001; spelling,t(256.46) = 13.62, p < 0.001]. In addition, the time byintervention group interaction was significant for decodingaccuracy, t(278.43) = −2.37, p = 0.018 (see Figure 1). Post hocpairwise comparisons showed that the phoneme-level and rime-level intervention groups differed in their slopes for performanceover time, t(281) = 2.37, p = 0.048 (with Tukey adjustment).There was also a trend for the interaction of intervention groupby time for word reading accuracy, t(271.62) = −1.94, p = 0.053.However, post hoc contrasts showed no differences between theintervention groups in terms of word reading performance overtime (p’s > 0.05). The time by intervention group effects werenot significant for the other measures (see Table 5).
Follow-UpFinally, after the intervention at post-test, all students continuedto show growth in word reading accuracy, which showed maineffects of time from post-test to follow-up, t(126.9) = 3.161,p < 0.001. Word reading fluency and decoding fluency decreasedover this time period, however, t(126.38) = −6.808, p < 0.001;t(126.42) = −6.618, p < 0.001, meaning these children were notkeeping up with the progress of their peers when they had enteredthe next grade in school. There was no difference over this timeperiod in decoding accuracy scores, or spelling scores, althoughspelling did reveal a trend for intervention group (the rime-level compared with the phoneme-level group) over time effects,t(125.25) = 1.73, p = 0.085 (Table 5).
SummaryAfter the first 7 weeks of the interventions (phase 1), eachintervention group showed improved scores on each ofthe five outcome measures (word reading and decoding,fluency for word reading and decoding, and spelling),with no evident advantage for either a word-level orsubword-level focused approach. After the second 7 weeksof intervention (phase 2), all groups again showed similarlevels of improvement on outcomes, except that decodingaccuracy showed greater improvement for the phoneme-level intervention group compared to the rime-level group.Finally, 3 months after the intervention, for all groups word
Frontiers in Psychology | www.frontiersin.org 8 November 2019 | Volume 10 | Article 2625

fpsyg-10-02625N
ovember26,2019
Time:12:10
#9
O’B
rienetal.
LiteracyIntervention
andG
rainS
ize
TABLE 4 | Pearson correlations for reading and spelling outcome measures over time and baseline measures of individual differences.
1 2 3 4 5 6 7 8 9 10 11 12 13 14 15 16 17 18 19 20 21 22 23 24 25 26
(1) Age 1
(2) SL 0.06 1
(3) PA 0.12 −0.04 1
(4) RAN (time) 0.01 −0.02 −0.25∗∗ 1
(5) OA 0.20∗−0.07 0.20∗−0.06 1
(6) NVCog 0.17∗ 0.04 0.49∗∗−0.33∗∗ 0.16 1
(7) Wacc1 0.24∗ 0.01 0.59∗∗−0.44∗∗ 0.26∗∗ 0.53∗∗ 1
(8) NWacc1 0.14 −0.01 0.52∗∗−0.26∗∗ 0.20∗ 0.32∗∗ 0.75∗∗ 1
(9) Wflu1 0.28∗−0.05 0.50∗∗−0.28∗∗ 0.36∗∗ 0.40∗∗ 0.80∗∗ 0.62∗∗ 1
(10) NWflu1 0.22∗−0.11 0.54∗∗−0.19∗∗ 0.30∗∗ 0.26∗∗ 0.74∗∗ 0.75∗∗ 0.76∗∗ 1
(11) Sp1 0.15 0.05 0.54∗∗−0.23∗∗ 0.17 0.41∗∗ 0.78∗∗ 0.67∗∗ 0.73∗∗ 0.61∗∗ 1
(12) Wacc2 0.18∗ 0.02 0.60∗∗−0.42∗∗ 0.22∗ 0.47∗∗ 0.86∗∗ 0.74∗∗ 0.80∗∗ 0.71∗∗ 0.68∗∗ 1
(13) NWacc2 0.09 −0.11 0.48∗∗−0.30∗∗ 0.18∗ 0.27∗∗ 0.64∗∗ 0.62∗∗ 0.60∗∗ 0.67∗∗ 0.49∗∗ 0.77∗∗ 1
(14) Wflu2 0.18∗ 0.01 0.61∗∗−0.36∗∗ 0.30∗∗ 0.45∗∗ 0.84∗∗ 0.71∗∗ 0.84∗∗ 0.73∗∗ 0.70∗∗ 0.89∗∗ 0.66∗∗ 1
(15) NWflu2 0.07 −0.06 0.50∗∗−0.27∗∗ 0.22∗ 0.30∗∗ 0.68∗∗ 0.74∗∗ 0.67∗∗ 0.76∗∗ 0.53∗∗ 0.77∗∗ 0.79∗∗ 0.76∗∗ 1
(16) Sp2 0.20∗ 0.01 0.66∗∗−0.32∗∗ 0.32∗∗ 0.45∗∗ 0.83∗∗ 0.74∗∗ 0.80∗∗ 0.73∗∗ 0.78∗∗ 0.89∗∗ 0.74∗∗ 0.88∗∗ 0.76∗∗ 1
(17) Wacc3 0.12 −0.01 0.59∗∗−0.41∗∗ 0.15 0.45∗∗ 0.76∗∗ 0.67∗∗ 0.69∗∗ 0.62∗∗ 0.57∗∗ 0.86∗∗ 0.75∗∗ 0.84∗∗ 0.77∗∗ 0.81∗∗ 1
(18) NWacc3 0.1 −0.09 0.47∗∗−0.33∗∗ 0.09 0.37∗∗ 0.68∗∗ 0.58∗∗ 0.47∗∗ 0.53∗∗ 0.41∗∗ 0.69∗∗ 0.74∗∗ 0.64∗∗ 0.68∗∗ 0.70∗∗ 0.83∗∗ 1
(19) Wflu3 0.02 −0.03 0.52∗∗−0.39∗∗ 0.21∗ 0.42∗∗ 0.72∗∗ 0.61∗∗ 0.67∗∗ 0.55∗∗ 0.56∗∗ 0.81∗∗ 0.66∗∗ 0.82∗∗ 0.73∗∗ 0.80∗∗ 0.90∗∗ 0.74∗∗ 1
(20) NWflu3 0.05 −0.14 0.42∗∗−0.39∗∗ 0.18∗ 0.26∗∗ 0.61∗∗ 0.61∗∗ 0.58∗∗ 0.63∗∗ 0.42∗∗ 0.71∗∗ 0.70∗∗ 0.72∗∗ 0.77∗∗ 0.70∗∗ 0.84∗∗ 0.82∗∗ 0.84∗∗ 1
(21) Sp3 0.13 0.02 0.57∗∗−0.37∗∗ 0.19∗ 0.47∗∗ 0.75∗∗ 0.63∗∗ 0.67∗∗ 0.58∗∗ 0.62∗∗ 0.85∗∗ 0.71∗∗ 0.81∗∗ 0.72∗∗ 0.85∗∗ 0.89∗∗ 0.81∗∗ 0.84∗∗ 0.75∗∗ 1
(22) Wacc4 −0.1 −0.01 0.47∗∗−0.29∗∗ 0.05 0.38∗∗ 0.54∗∗ 0.52∗∗ 0.47∗∗ 0.41∗∗ 0.42∗∗ 0.64∗∗ 0.55∗∗ 0.61∗∗ 0.54∗∗ 0.63∗∗ 0.78∗∗ 0.71∗∗ 0.81∗∗ 0.72∗∗ 0.72∗∗ 1
(23) NWacc4 −0.06 −0.02 0.42∗∗−0.27∗∗ 0.08 0.37∗∗ 0.48∗∗ 0.53∗∗ 0.40∗∗ 0.44∗∗ 0.33∗ 0.59∗∗ 0.62∗∗ 0.53∗∗ 0.56∗∗ 0.57∗∗ 0.76∗∗ 0.82∗∗ 0.73∗∗ 0.73∗∗ 0.70∗∗ 0.86∗∗ 1
(24) Wflu4 −0.08 0.02 0.47∗∗−0.37∗∗ 0.08 0.44∗∗ 0.58∗∗ 0.49∗∗ 0.50∗∗ 0.39∗∗ 0.41∗∗ 0.65∗∗ 0.52∗∗ 0.67∗∗ 0.53∗∗ 0.64∗∗ 0.80∗∗ 0.74∗∗ 0.86∗∗ 0.72∗∗ 0.76∗∗ 0.91∗∗ 0.84∗∗ 1 1
(25) NWflu4 −0.08 −0.07 0.43∗∗−0.32∗∗ 0.16 0.32∗∗ 0.56∗∗ 0.57∗∗ 0.53∗∗ 0.52∗∗ 0.36∗∗ 0.63∗∗ 0.66∗∗ 0.62∗∗ 0.63∗∗ 0.62∗∗ 0.79∗∗ 0.79∗∗ 0.80∗∗ 0.82∗∗ 0.70∗∗ 0.83∗∗ 0.86∗∗ 0.86∗∗ 1
(26) Sp4 0.04 −0.02 0.54∗∗−0.36∗∗ 0.16 0.47∗∗ 0.69∗∗ 0.62∗∗ 0.60∗∗ 0.52∗∗ 0.57∗∗ 0.79∗∗ 0.67∗∗ 0.77∗∗ 0.65∗∗ 0.80∗∗ 0.86∗∗ 0.80∗∗ 0.87∗∗ 0.76∗∗ 0.90∗∗ 0.84∗∗ 0.80∗∗ 0.86∗∗ 0.79∗∗ 1
SL = Statistical Learning; PA = Phonological Awareness (CTOPP-2 Elision); RAN (time) = Rapid Symbol Naming (CTOPP-2 RAN letters) response time; OA = Orthographic Awareness; NVCog = BAS-3 Non-verbalCognition; Wacc1, Wacc2, Wacc3, Wacc4 = Word Accuracy (WJIII Word Identification) at Time 1, 2, 3, and 4, respectively; NWacc1, NWacc2, NWacc3, NWacc4 = Non-word Accuracy (WJIII Word Attack) at Time 1,2, 3, and 4, respectively; Wflu1, Wflu2, Wflu3, Wflu4 = Word Fluency (TOWRE-2 sight word reading) at Time 1, 2, 3, and 4, respectively; NWflu1, NWflu2, NWflu3, NWflu4 = Non-word Fluency (TOWRE-2 phonemicdecoding) at Time 1, 2, 3, and 4, respectively; Sp1, Sp2, Sp3, Sp4 = Spelling (BAS-3) at Time 1, 2, 3, and 4, respectively. ∗p < 0.05, ∗∗p < 0.01.
Frontiersin
Psychology
|ww
w.frontiersin.org
9N
ovember
2019|Volum
e10
|Article
2625

fpsyg-10-02625 November 26, 2019 Time: 12:10 # 10
O’Brien et al. Literacy Intervention and Grain Size
TABLE 5 | Coefficients (standard errors) for mixed effects models of word reading and decoding accuracy, fluency, and spelling from phases 1 and 2 and follow-up ofthe intervention.
Fixed effects Word reading accuracyestimate (SE)
Decoding accuracyestimate (SE)
Word reading fluencyestimate (SE)
Decoding fluencyestimate (SE)
Spellingestimate (SE)
Phase 1 (pre-mid test)
Intercept −1.194 (1.469) −1.282 (1.504) −0.467 (0.834) −0.499 (0.674) −3.731 (1.268)∗∗
Tx2 −0.121 (0.215) −0.121 (0.220) −0.098 (0.122) −0.189 (0.099) −0.188 (0.180)
Tx3 0.159 (0.215) 0.207 (0.221) 0.021 (0.123) 0.017 (0.099) 0.174 (0.0181)
Time 0.577 (0.135)∗∗∗ 0.575 (0.126)∗∗∗ 0.325 (0.048)∗∗∗ 0.233 (0.042)∗∗∗ 0.551 (0.067)∗∗∗
Age 0.042 (0.018)∗ 0.043 (0.019)∗ −0.015 (0.010) −0.005 (0.008) 0.050 (0.016)∗∗
NV Ability −0.007 (0.003)∗ −0.007 (0.003)∗ −0.004 (0.002)∗∗ −0.003 (0.001) −0.004 (0.002)
Tx2: Time −0.105 (0.191) −0.105 (0.177) 0.019 (0.067) 0.032 (0.059) −0.115 (0.094)
Tx3: Time −0.211 (0.190) −0.144 (0.177) 0.075 (0.068) 0.081 (0.059) −0.080 (0.094)
Phase 2 (pre-mid-post test)
Intercept −0.195 (0.795) −0.412 (1.899) 0.180 (0.952) −0.130 (0.747) −2.58 (1.054)∗
Tx2 −0.040 (0.116) −0.427 (0.276) −0.135 (0.139) −0.190 (0.110) −0.151 (0.150)
Tx3 0.095 (0.117) −0.030 (0.277) 0.077 (0.140) 0.035 (0.110) 0.127 (0.150)
Time 0.688 (0.048)∗∗∗ 1.664 (0.211)∗∗∗ 0.634 (0.065)∗∗∗ 0.549 (0.055)∗∗∗ 0.953 (0.700)∗∗∗
Age 0.025 (0.010)∗ 0.042 (0.024) −0.019 (0.012) −0.007 (0.009) 0.036 (0.013)∗∗
NV Ability −0.006 (0.002)∗∗∗ −0.009 (0.004)∗ −0.006 (0.002)∗∗ −0.003 (0.001)∗ −0.005 (0.002)∗
Tx2: Time −0.130 (0.067) −0.702 (0.296)∗ −0.065 (0.090) 0.005 (0.076) −0.080 (0.098)
Tx3: Time −0.039 (0.067) −0.514 (0.296) 0.145 (0.092) 0.073 (0.077) −0.033 (0.098)
Post-followup test
Intercept 0.163 (1.272) 0.637 (3.477) −0.226 (1.673) 0.089 (1.171) −2.098 (1.409)
Tx2 −0.187 (0.180) −0.838 (0.491) −0.163 (0.237) −0.183 (0.166) −0.118 (0.199)
Tx3 0.086 (0.180) −0.114 (0.491) 0.220 (0.237) 0.105 (0.166) 0.151 (0.199)
Time 0.193 (0.005)∗∗∗ −0.067 (0.209) −0.574 (0.084)∗∗∗ −0.367 (0.056)∗∗∗ 0.048 (0.043)
Age 0.031 (0.016) 0.048 (0.044) −0.009 (0.021) −0.005 (0.015) 0.032 (0.018)
NV Ability −0.008 (0.002)∗∗ −0.013 (0.006)∗ −0.012 (0.003)∗∗∗ −0.007 (0.002)∗∗ −0.008 (0.003)∗∗
Tx2: Time 0.001 (0.076) 0.327 (0.296) 0.087 (0.120) 0.042 (0.078) 0.104 (0.060)
Tx3: Time 0.094 (0.076) 0.464 (0.296) 0.129 (0.119) 0.071 (0.078) 0.099 (0.060)
Word reading accuracy and decoding accuracy are grade equivalent scores from the WJIII, word reading fluency and decoding fluency are norm-referenced z-scores,and BAS Spelling are scaled scores. NV Ability = non-verbal ability. Tx2 = rime-level compared to phoneme-level intervention effects; Tx3 = word-level compared withphoneme-level intervention effects. ∗∗∗p < 0.001; ∗∗p < 0.01; ∗p < 0.05.
FIGURE 1 | Effects of intervention groups (Tx), on decoding accuracy acrosstwo phases of intervention. Phon = phoneme-level, Rime = rime-level,Word = word-level intervention conditions. Group differences are shownacross pre-test (left), mid-test (middle), and post-test (right).
reading continued to improve, while performance on fluencymeasures lagged behind typical peers. Similar to previousresearch, fluency skills are the most difficult to remediate(Metsala and David, 2017).
Research Question 2To address the second research question regarding effects ofindividual characteristics of struggling readers, and whether thesemoderate the effect of intervention, we added to the models thebaseline measures of individual performance to examine possibleeffects and interactions with learning outcomes. Orthographicawareness and rapid symbol naming were included as covariates,along with age and non-verbal ability. Additionally, phonologicalawareness, statistical learning, and the child’s mother tonguelanguage group were included in models, each as interactionterms with intervention group by time. Just as in the analysisfor research question 1, we first ran mixed models with datafrom Phase 1 of the intervention, including the pre-test and mid-test scores. Then, the data across Phase 2 of the interventionwere analyzed, including pre-test, mid-test, and post-test scores.Finally, to examine the duration of effects, an analysis of post-testto follow-up data was undertaken.
Phase 1The mixed regression models on pre-test to mid-test data foreach of the outcomes are reported in Table 6A. We focus
Frontiers in Psychology | www.frontiersin.org 10 November 2019 | Volume 10 | Article 2625

fpsyg-10-02625 November 26, 2019 Time: 12:10 # 11
O’Brien et al. Literacy Intervention and Grain Size
TABLE 6A | Coefficients (standard errors) for mixed effects models including baseline measure moderators of word reading and decoding accuracy, fluency, and spellingfrom Phase 1 of the intervention.
Fixed effects Word reading accuracyestimate (SE)
Decoding accuracyestimate (SE)
Word reading fluencyestimate (SE)
Decoding fluencyestimate (SE)
Spellingestimate (SE)
Phase 1 (pre-mid test)
Intercept −0.154 (0.606) −0.584 (1.46) −0.661 (0.833) −0.529 (0.700) −2.942 (1.005)∗∗
Tx2 0.275 (0.208) 0.197 (0.500) 0.244 (0.286) −0.035 (0.24) 0.124 (0.339)
Tx3 0.109 (0.188) 0.609 (0.451) 0.222 (0.258) 0.032 (0.217) 0.043 (0.308)
Time.L 0.168 (0.074)∗ 0.721 (0.280)∗ 0.185 (0.094). 0.101 (0.097). 0.254 (0.134).
PA 0.050 (0.014)∗∗∗ 0.119 (0.035)∗∗∗ 0.080 (0.02)∗∗∗ 0.056 (0.017)∗∗∗ 0.101 (0.024)∗∗∗
SL −0.034 (0.038) −0.195 (0.093)∗ −0.038 (0.052) −0.048 (0.044) −0.046 (0.062)
Lang_M −0.123 (0.118) −0.438 (0.284) −0.284 (0.161). −0.059 (0.136). −0.271 (0.192)
Lang_T −0.28 (0.24) −0.741 (0.576) −0.328 (0.33) −0.107 (0.277) −0.582 (0.387)
Age 0.012 (0.007) 0.013 (0.018) −0.023 (0.01)∗ −0.012 (0.009)∗ 0.022 (0.013).
NV Ability 0.008 (0.007) 0.021 (0.016) −0.009 (0.009) −0.003 (0.008) 0.007 (0.011)
OA 0.014 (0.008). 0.040 (0.019)∗ 0.024 (0.011)∗ 0.011 (0.009)∗ 0.035 (0.013)∗∗
RAN −0.014 (0.007)∗ −0.028 (0.017). 0.005 (0.009) 0.001 (0.008) −0.011 (0.011)
Tx2: Time 0.102 (0.118) −0.400 (0.447) 0.026 (0.149) 0.181 (0.154) 0.208 (0.221)
Tx3: Time 0.01 (0.106) −0.275 (0.402) −0.181 (0.134) 0.25 (0.139) 0.127 (0.206)
Tx2: PA −0.04 (0.018)∗ −0.093 (0.042)∗ −0.056 (0.024)∗ −0.026 (0.02)∗ −0.062 (0.029)∗
Tx3: PA −0.007 (0.015) −0.110 (0.035)∗∗ −0.035 (0.020). −0.015 (0.017). 0.001 (0.025)
Time: PA 0.01 (0.006) 0.062 (0.024)∗ 0.017 (0.008)∗ 0.014 (0.008)∗ 0.054 (0.012)∗∗∗
Tx2: SL 0.050 (0.052) 0.220 (0.126). 0.074 (0.072) 0.052 (0.06) 0.050 (0.084)
Tx3: SL 0.076 (0.062) 0.301 (0.15)∗ 0.002 (0.086) 0.015 (0.072) 0.141 (0.101)
Time: SL −0.020 (0.023) −0.214 (0.087)∗ −0.043 (0.030) 0.019 (0.03) −0.062 (0.042)
Tx2: EM −0.113 (0.178) 0.318 (0.428) −0.06 (0.244) −0.007 (0.206) 0.153 (0.289)
Tx3: EM −0.107 (0.173) 0.203 (0.418) 0.041 (0.238) 0.068 (0.2) −0.089 (0.282)
Tx2: ET 0.444 (0.295) 1.074 (0.709) 0.456 (0.405) 0.207 (0.34) 0.909 (0.475).
Tx3: ET 0.153 (0.301) 0.645 (0.722) 0.456 (0.414) 0.276 (0.347) 0.546 (0.485)
Time: EM 0.061 (0.069) −0.805 (0.261)∗∗ 0.098 (0.088) 0.026 (0.09) −0.115 (0.127)
Time: ET −0.003 (0.136) −0.616 (0.518) −0.028 (0.172) −0.149 (0.178) 0.032 (0.247)
Tx2: Time: PA −0.007 (0.01) −0.044 (0.038) 0.003 (0.013) −0.008 (0.013) −0.043 (0.02)∗
Tx3: Time: PA −0.003 (0.008) −0.058 (0.032). 0.027 (0.011)∗ −0.015 (0.011)∗ −0.026 (0.018)
Tx2: Time: SL 0.027 (0.031) 0.189 (0.117) 0.084 (0.039)∗ 0.015 (0.041)∗ 0.131 (0.056)∗
Tx3: Time: SL 0.048 (0.035) 0.137 (0.132) 0.075 (0.044). −0.049 (0.046). −0.008 (0.064)
Tx2: Time: EM −0.171 (0.102). 0.929 (0.389)∗ −0.133 (0.13) −0.159 (0.134) −0.237 (0.191)
Tx3: Time: EM −0.198 (0.099)∗ 0.890 (0.376)∗ −0.065 (0.126) −0.044 (0.13) −0.045 (0.185)
Tx2: Time: ET −0.074 (0.169) 0.76 (0.641) −0.047 (0.214) 0.056 (0.221) 0.018 (0.306)
Tx3: Time: ET 0.077 (0.172) 0.493 (0.654) −0.025 (0.218) 0.213 (0.225) 0.095 (0.312)
Word reading accuracy and decoding accuracy are grade equivalent scores from the WJIII, word reading fluency and decoding fluency are norm-referencedz-scores, and BAS Spelling are scaled scores. NV Ability = non-verbal ability, OA = orthographic awareness, PA = phonological awareness, SL = statistical learning,Lang_M = English/Malay group, Lang_T = Egnlish/Tamil group. EM = English/Malay group vs. English/Chinese group, ET = English/Tamil group vs. English/Chinese group.Tx2 = rime-level compared to phoneme-level intervention effects; Tx3 = word-level compared with phoneme-level intervention effects. ∗∗∗p < 0.001; ∗∗p < 0.01; ∗p < 0.05.
on the interaction effects of intervention group over time by(1) phonological awareness, (2) statistical learning, and (3)bilingual language group. At Phase 1, the word-level interventiongroup, which involves lexical level processing, is compared to asublexical focus in the other interventions.
First, for the interaction of phonological awareness byintervention group by time effects, the three-way interactionwas significant for word reading fluency outcomes after the firstphase of intervention, t(119.50) = 2.54, p = 0.012 (Figure 2).Generally, the relation of phonological awareness to outcomesbecame stronger over time for the word-level intervention groupcompared with the phoneme-level intervention group. Second,
there were no interaction effects for statistical learning with timeby intervention groups with a lexical versus sublexical unit focus.
Third, for the interaction of bilingual language group byintervention group by time effects, word reading accuracyoutcomes after phase 1 of the intervention showed a significantthree-way interaction effect, t(121.32) = −1.67, p = 0.049(Figure 3, left panel). The English–Malay and English–Chinese bilingual individuals differed in their response tointervention at the word-level, where the former did notimprove over time in the word-level group (p > 0.05), butthe latter group did (p < 0.001). Also, decoding accuracyoutcomes revealed a significant three-way interaction across the
Frontiers in Psychology | www.frontiersin.org 11 November 2019 | Volume 10 | Article 2625

fpsyg-10-02625 November 26, 2019 Time: 12:10 # 12
O’Brien et al. Literacy Intervention and Grain Size
FIGURE 2 | Effects of phonological awareness on word reading fluency(z-scores) for each intervention group over two time points (pre-test andmid-test). PA = phonological awareness score, Tx_Phon = phoneme-levelgroup, Tx_Rime = rime-level group, Tx_Word = word-level intervention group.
phoneme-level intervention versus word-level, t(118.84) = 2.36,p = 0.020, and rime-level conditions, t(118.71) = 2.39,p = 0.018 (Figure 3, right panel). In this case, the English–Chinese bilinguals benefited more from the phoneme-levelintervention, while the English–Malay bilinguals benefited morefrom the rime-level intervention (p’s < 0.05). No otherthree-way interaction effects with bilingual language groupwere significant.
Phase 2For the second phase of the intervention, the mixed regressionmodels on pre-test, mid-test and post-test data for each of theoutcomes are reported in Table 6B. The interaction effects ofinterest are reported in each section below for intervention groupby time with (1) phonological awareness, (2) statistical learning,and (3) bilingual language group.
First, for the phonological awareness by group by time effects,the three-way interaction was significant for word reading fluencyoutcomes after the two phases of intervention, for both the rime-level vs. phoneme-level intervention groups, t(250.8) = −2.32,p = 0.021, and for the word-level vs. phoneme-level interventiongroups, t(246.2) = 2.77, p = 0.006 (see Figure 4). Phonologicalawareness had less of an effect on outcomes for the rime-level intervention group. On the other hand, phonologicalawareness showed stronger effects on outcomes for the word-level intervention group.
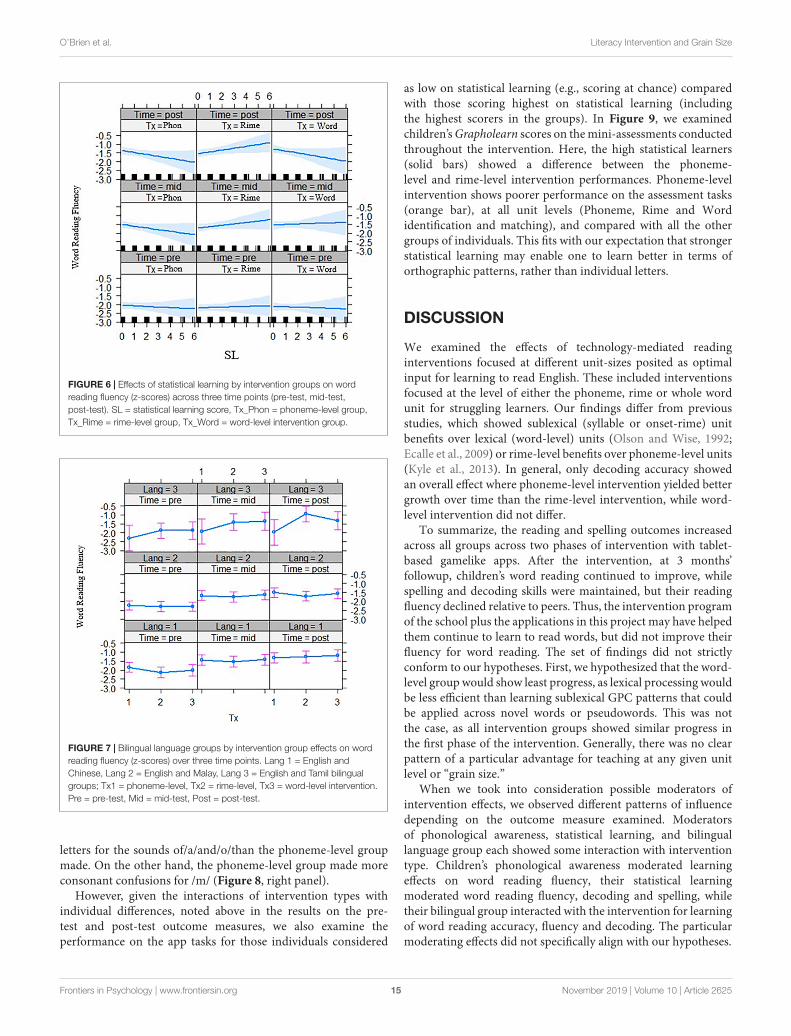
Second for the interaction of statistical learning byintervention group by time, there was a significant three-way interaction effect for decoding accuracy, t(261.02) = 2.05,p = 0.041 (Figure 5, left panel) across phase 2 of the intervention,and for spelling outcomes t(237.85) = 2.08, p = 0.039 (Figure 5,right panel). In both cases, it appears that with lower statisticallearning there were better outcomes for those in the phoneme-level intervention group over time. In addition, the three-wayinteraction of statistical learning by intervention group by timewas significant for word reading fluency, t(235.0) = 2.24,p = 0.027, where there were significant interactions onperformance for the rime-level compared with phoneme-level intervention groups (Figure 6). Third, for differencesacross the bilingual language groups there was only a marginalthree-way interaction on word reading fluency, t(232.0) = −1.92p = 0.056 (Figure 7), indicating that the English–Malay bilingual
FIGURE 3 | Bilingual language groups by intervention group effects over two time points for word reading accuracy (top) and decoding accuracy (bottom) (gradeequivalent scores). Tx1 = phoneme-level, Tx2 = rime-level, Tx3 = word-level intervention. Pre = pre-test, Mid = mid-test; Lang 1 = English and Chinese, Lang 2 =English and Malay, Lang 3 = English and Tamil bilingual groups.
Frontiers in Psychology | www.frontiersin.org 12 November 2019 | Volume 10 | Article 2625

fpsyg-10-02625 November 26, 2019 Time: 12:10 # 13
O’Brien et al. Literacy Intervention and Grain Size
TABLE 6B | Coefficients (standard error) for mixed effects models including baseline measure moderators of word reading and decoding accuracy, fluency, and spellingfrom Phase 2 of the intervention.
Fixed effects Word reading accuracyestimate (SE)
Decoding accuracyestimate (SE)
Word reading fluencyestimate (SE)
Decoding fluencyestimate (SE)
Spellingestimate (SE)
Phase 2 (pre-mid-post test)
Intercept 0.245 (0.634) −0.699 (1.681) 0.376 (0.847) −0.123 (0.705) −1.977 (0.775)
Tx2 −0.012 (0.200) 0.141 (0.584) −0.138 (0.263) −0.29 (0.226) −0.24 (0.244)
Tx3 −0.008 (0.19) 0.270 (0.525) −0.073 (0.252) −0.096 (0.213) −0.127 (0.232)
Time 0.255 (0.11)∗ 0.387 (0.484) 0.101 (0.138) 0.237 (0.133). 0.45 (0.146)
PA 0.021 (0.01)∗ 0.169 (0.031)∗∗∗ 0.030 (0.012)∗ 0.036 (0.011)∗∗ 0.04 (0.012)∗∗∗
SL −0.061 (0.041) −0.268 (0.109)∗ −0.08 (0.055) −0.071 (0.046) −0.064 (0.049)∗
Lang_M −0.061 (0.125) −0.368 (0.327) −0.267 (0.167) −0.115 (0.139) −0.229 (0.15)
Lang_T −0.477 (0.252). −1.334 (0.649)∗ −0.53 (0.337) −0.281 (0.279) −0.604 (0.297)∗
Age 0.007 (0.008) 0.006 (0.02) −0.033 (0.01)∗∗ −0.017 (0.009)∗ 0.012 (0.009)
NV Ability 0.022 (0.005)∗∗∗ 0.01 (0.015) 0.013 (0.007). 0.007 (0.006) 0.023 (0.006)
OA 0.024 (0.004)∗∗∗ 0.072 (0.017)∗∗∗ 0.025 (0.006)∗∗∗ 0.02 (0.005)∗∗∗ 0.031 (0.006)∗∗∗
RAN −0.028 (0.005)∗∗∗ −0.017 (0.015) −0.018 (0.007)∗∗ −0.009 (0.006) −0.028 (0.006)
Tx2: Time 0.133 (0.188) −0.11 (0.814) 0.472 (0.235)∗ 0.192 (0.226) 0.005 (0.254)
Tx3: Time −0.06 (0.157) −1.07 (0.69) −0.139 (0.196) 0.009 (0.189) −0.016 (0.214)
Tx2: PA −0.013 (0.013) −0.105 (0.043)∗ −0.015 (0.017) −0.007 (0.015) −0.008 (0.017)∗
Tx3: PA −0.003 (0.012) −0.116 (0.036)∗∗ 0.002 (0.015) −0.004 (0.013) 0.013 (0.015)∗∗
Time: PA 0.028 (0.008)∗∗∗ 0.11 (0.035)∗∗ 0.039 (0.01)∗∗∗ 0.022 (0.01)∗ 0.049 (0.011)∗∗
Tx2: SL 0.085 (0.055) 0.253 (0.146). 0.15 (0.074)∗ 0.07 (0.061) 0.085 (0.066).
Tx3: SL 0.147 (0.065)∗ 0.521 (0.172)∗∗ 0.042 (0.087) 0.035 (0.072) 0.157 (0.077)∗∗
Time: SL −0.039 (0.031) −0.26 (0.137). −0.056 (0.039) −0.014 (0.038) −0.051 (0.042).
Tx2: EM −0.063 (0.185) 0.333 (0.489) 0 (0.247) 0.181 (0.206) 0.086 (0.221)
Tx3: EM −0.158 (0.184) 0.286 (0.48) −0.022 (0.246) 0.123 (0.204) −0.138 (0.219)
Tx2: ET 0.689 (0.307)∗ 1.644 (0.795)∗ 0.767 (0.41). 0.546 (0.34) 0.805 (0.363)∗
Tx3: ET 0.387 (0.318) 1.189 (0.821) 0.556 (0.426) 0.419 (0.352) 0.56 (0.376)
Time: EM 0.187 (0.093)∗ −0.209 (0.41) 0.132 (0.116) −0.08 (0.112) −0.131 (0.125)
Time: ET −0.203 (0.181) −1.383 (0.807). −0.153 (0.226) −0.265 (0.218) −0.169 (0.24).
Tx2: Time: PA −0.017 (0.014) −0.07 (0.059) −0.04 (0.017)∗ −0.022 (0.017) −0.012 (0.019)
Tx3: Time: PA −0.005 (0.011) −0.018 (0.049) 0.04 (0.014)∗∗ 0.003 (0.014) −0.01 (0.017)
Tx2: Time: SL 0.049 (0.042) 0.161 (0.183) 0.116 (0.052)∗ 0.01 (0.05) 0.115 (0.055)
Tx3: Time: SL 0.073 (0.049) 0.443 (0.216)∗ −0.008 (0.062) −0.068 (0.059) 0.011 (0.067)∗
Tx2: Time: EM −0.251 (0.141). 0.286 (0.621) −0.339 (0.177). 0.034 (0.17) −0.29 (0.192)
Tx3: Time: EM −0.226 (0.133). 0.63 (0.59) −0.208 (0.166) 0.105 (0.16) −0.143 (0.18)
Tx2: Time: ET 0.138 (0.224) 1.254 (0.995) 0.184 (0.28) 0.382 (0.27) 0.137 (0.297)
Tx3: Time: ET 0.431 (0.228). 1.546 (1.019) −0.045 (0.285) 0.341 (0.275) 0.269 (0.303)
Word reading accuracy and decoding accuracy are grade equivalent scores from the WJIII, word reading fluency and decoding fluency are norm-referencedz-scores, and BAS Spelling are scaled scores. NV Ability = non-verbal ability, OA = orthographic awareness, PA = phonological awareness, SL = statistical learning,Lang_M = English/Malay group, Lang_T = Egnlish/Tamil group. EM = English/Malay group vs. English/Chinese group, ET = English/Tamil group vs. English/Chinesegroup. Tx2 = rime-level compared to phoneme-level intervention effects; Tx3 = word-level compared with phoneme-level intervention effects. ∗∗∗p < 0.001; ∗∗p < 0.01;∗p < 0.05.
individuals did not benefit as much from the rime-levelintervention as did the English–Chinese bilinguals.
Follow-UpThe data from post-test to follow-up test revealed that a three-way interaction of time by intervention group by statisticallearning was significant for spelling scores, t(112.8) = 2.27,p = 0.025, such that the rime-level intervention yielded betteroutcomes over time for those with higher statistical learning.Also, word reading fluency showed a significant effect of time byintervention group by bilingual language group, t(114.5) = 2.174,p = 0.032, with the word-level intervention yielding improved
outcomes over time for the English–Malay bilingual individualscompared with the English–Chinese bilinguals (Table 6C).
SummaryIndividual differences in phonological awareness, statisticallearning, and bilingual groups moderated outcomes in a waythat interacted with the intervention approach. After phase 1,in the word-level intervention, those with better phonologicalawareness benefited more than those with poorer phonologicalawareness when it comes to word reading fluency. Word-levelintervention affected word reading accuracy for English–Chinesebilinguals but not for English–Malay bilinguals, whereas for
Frontiers in Psychology | www.frontiersin.org 13 November 2019 | Volume 10 | Article 2625
fpsyg-10-02625 November 26, 2019 Time: 12:10 # 14
O’Brien et al. Literacy Intervention and Grain Size
FIGURE 4 | Effects of phonological awareness on word reading fluency(z-scores) for each intervention group over three time points (pre-test,mid-test, and post-test). PA = phonological awareness score, Tx_Phon =phoneme-level group, Tx_Rime = rime-level group, Tx_Word = word-levelintervention group.
decoding accuracy these bilingual groups benefited only in thephoneme-level intervention for the former, and the rime-levelintervention for the latter group.
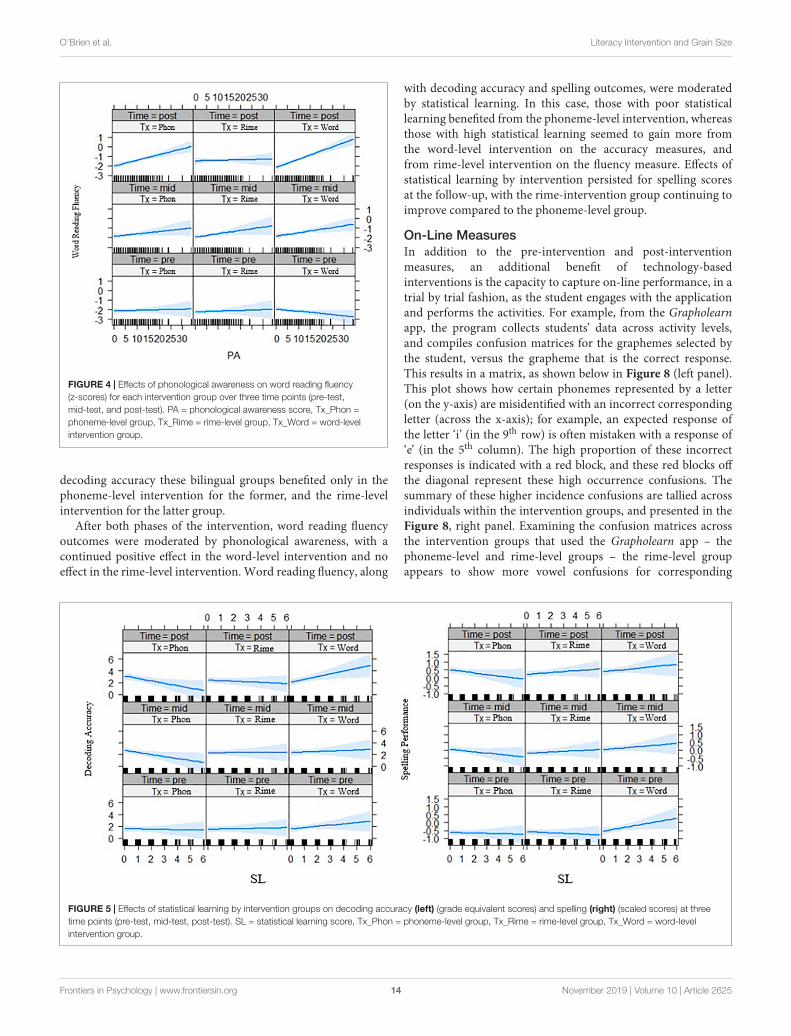
After both phases of the intervention, word reading fluencyoutcomes were moderated by phonological awareness, with acontinued positive effect in the word-level intervention and noeffect in the rime-level intervention. Word reading fluency, along
with decoding accuracy and spelling outcomes, were moderatedby statistical learning. In this case, those with poor statisticallearning benefited from the phoneme-level intervention, whereasthose with high statistical learning seemed to gain more fromthe word-level intervention on the accuracy measures, andfrom rime-level intervention on the fluency measure. Effects ofstatistical learning by intervention persisted for spelling scoresat the follow-up, with the rime-intervention group continuing toimprove compared to the phoneme-level group.
On-Line MeasuresIn addition to the pre-intervention and post-interventionmeasures, an additional benefit of technology-basedinterventions is the capacity to capture on-line performance, in atrial by trial fashion, as the student engages with the applicationand performs the activities. For example, from the Grapholearnapp, the program collects students’ data across activity levels,and compiles confusion matrices for the graphemes selected bythe student, versus the grapheme that is the correct response.This results in a matrix, as shown below in Figure 8 (left panel).This plot shows how certain phonemes represented by a letter(on the y-axis) are misidentified with an incorrect correspondingletter (across the x-axis); for example, an expected response ofthe letter ‘i’ (in the 9th row) is often mistaken with a response of‘e’ (in the 5th column). The high proportion of these incorrectresponses is indicated with a red block, and these red blocks offthe diagonal represent these high occurrence confusions. Thesummary of these higher incidence confusions are tallied acrossindividuals within the intervention groups, and presented in theFigure 8, right panel. Examining the confusion matrices acrossthe intervention groups that used the Grapholearn app – thephoneme-level and rime-level groups – the rime-level groupappears to show more vowel confusions for corresponding
FIGURE 5 | Effects of statistical learning by intervention groups on decoding accuracy (left) (grade equivalent scores) and spelling (right) (scaled scores) at threetime points (pre-test, mid-test, post-test). SL = statistical learning score, Tx_Phon = phoneme-level group, Tx_Rime = rime-level group, Tx_Word = word-levelintervention group.
Frontiers in Psychology | www.frontiersin.org 14 November 2019 | Volume 10 | Article 2625
fpsyg-10-02625 November 26, 2019 Time: 12:10 # 15
O’Brien et al. Literacy Intervention and Grain Size
FIGURE 6 | Effects of statistical learning by intervention groups on wordreading fluency (z-scores) across three time points (pre-test, mid-test,post-test). SL = statistical learning score, Tx_Phon = phoneme-level group,Tx_Rime = rime-level group, Tx_Word = word-level intervention group.
FIGURE 7 | Bilingual language groups by intervention group effects on wordreading fluency (z-scores) over three time points. Lang 1 = English andChinese, Lang 2 = English and Malay, Lang 3 = English and Tamil bilingualgroups; Tx1 = phoneme-level, Tx2 = rime-level, Tx3 = word-level intervention.Pre = pre-test, Mid = mid-test, Post = post-test.
letters for the sounds of/a/and/o/than the phoneme-level groupmade. On the other hand, the phoneme-level group made moreconsonant confusions for /m/ (Figure 8, right panel).
However, given the interactions of intervention types withindividual differences, noted above in the results on the pre-test and post-test outcome measures, we also examine theperformance on the app tasks for those individuals considered
as low on statistical learning (e.g., scoring at chance) comparedwith those scoring highest on statistical learning (includingthe highest scorers in the groups). In Figure 9, we examinedchildren’s Grapholearn scores on the mini-assessments conductedthroughout the intervention. Here, the high statistical learners(solid bars) showed a difference between the phoneme-level and rime-level intervention performances. Phoneme-levelintervention shows poorer performance on the assessment tasks(orange bar), at all unit levels (Phoneme, Rime and Wordidentification and matching), and compared with all the othergroups of individuals. This fits with our expectation that strongerstatistical learning may enable one to learn better in terms oforthographic patterns, rather than individual letters.
DISCUSSION
We examined the effects of technology-mediated readinginterventions focused at different unit-sizes posited as optimalinput for learning to read English. These included interventionsfocused at the level of either the phoneme, rime or whole wordunit for struggling learners. Our findings differ from previousstudies, which showed sublexical (syllable or onset-rime) unitbenefits over lexical (word-level) units (Olson and Wise, 1992;Ecalle et al., 2009) or rime-level benefits over phoneme-level units(Kyle et al., 2013). In general, only decoding accuracy showedan overall effect where phoneme-level intervention yielded bettergrowth over time than the rime-level intervention, while word-level intervention did not differ.
To summarize, the reading and spelling outcomes increasedacross all groups across two phases of intervention with tablet-based gamelike apps. After the intervention, at 3 months’followup, children’s word reading continued to improve, whilespelling and decoding skills were maintained, but their readingfluency declined relative to peers. Thus, the intervention programof the school plus the applications in this project may have helpedthem continue to learn to read words, but did not improve theirfluency for word reading. The set of findings did not strictlyconform to our hypotheses. First, we hypothesized that the word-level group would show least progress, as lexical processing wouldbe less efficient than learning sublexical GPC patterns that couldbe applied across novel words or pseudowords. This was notthe case, as all intervention groups showed similar progress inthe first phase of the intervention. Generally, there was no clearpattern of a particular advantage for teaching at any given unitlevel or “grain size.”
When we took into consideration possible moderators ofintervention effects, we observed different patterns of influencedepending on the outcome measure examined. Moderatorsof phonological awareness, statistical learning, and bilinguallanguage group each showed some interaction with interventiontype. Children’s phonological awareness moderated learningeffects on word reading fluency, their statistical learningmoderated word reading fluency, decoding and spelling, whiletheir bilingual group interacted with the intervention for learningof word reading accuracy, fluency and decoding. The particularmoderating effects did not specifically align with our hypotheses.
Frontiers in Psychology | www.frontiersin.org 15 November 2019 | Volume 10 | Article 2625

fpsyg-10-02625 November 26, 2019 Time: 12:10 # 16
O’Brien et al. Literacy Intervention and Grain Size
FIGURE 8 | Letter confusions collected on-line, while students played Grapholearn app (Phase 2), across intervention groups. (Left) Shows example of a letterconfusion matrix, where red shading indictates the proportion of times a letter (x-axis) was confused for a target letter (y-axis). (Right) Shows summary acrosschildren in the rime-level intervention group (blue bars) and the phoneme-level intervention group (orange bars). Bars indicate the proportion of confusion errorsacross different letters, with an incorrect response (‘e’) to a given sound (/a/).
Phonological AwarenessWhen children’s phonological awareness level was taken intoaccount, word reading fluency outcomes were moderated by thisskill, which has been reported to be foundational to learning toread in alphabetic languages. We hypothesized that phonologicalawareness may be more relevant for learning with the phoneme-level intervention, since lexical strategies could be used forthe word-level intervention activities. As such, phonologicalawareness was expected to positively moderate outcomes forthe phoneme-level group. However, for word reading fluency,children with higher phonological awareness scores appearedto benefit more from a word-level focused intervention thanone focused at the phoneme-level, whereas those with highphonological awareness benefited less from a rime-level focusedintervention. Two possibilities may explain the difference in ourresults versus previous findings (Olson and Wise, 1992; Kyleet al., 2013). Since the children in this study were simultaneousbilinguals, learning to read in two languages at the onset,the relation between phonological awareness and developingreading skills may be more complex. For example, the reading-phonological awareness relation was found to differ for childrenlearning different sets of languages and scripts (O’Brien et al.,2019). Second, the children in this study may have inherentdifficulties accessing the phoneme level of analysis, as do otherswith reading disorders.
Bilingual Sets of LanguageThe other languages that these bilingual, simultaneously biliteratechildren were learning in school were also expected to exertsome influence on how children approach the task of learningto read in English. In this case, we examined the bilingualsets of children, English and Chinese, English and Malay, and
English and Tamil learners, in terms of possible moderatingeffects of these other languages on intervention effects. English–Chinese learners appeared to benefit more from word- versusphoneme-level intervention for word reading, but more fromphoneme-level versus word-level intervention for decoding,when compared with English–Malay learners. Word readingfluency also showed longer term positive outcomes from word-level intervention for the English–Malay learners compared tothe English–Chinese learners. In the study noted above, O’Brienet al. (2019) found that early reading skills were predicted bysyllable-level phonological awareness for Chinese/English andMalay/English bilingual typically-developing children, whereasphoneme-level awareness was more predictive for Tamil/Englishbilingual children. The sets of languages that biliterates cometo learn have different forms of influence, depending on thelinguistic and typological distance and phonological transparencyof the scripts (e.g., Yelland et al., 1993; Bialystok et al.,2005). It is important to tease apart the cross-linguistic andcross-orthographic transfer of skills when considering readinginterventions (Bassetti, 2013). Rickard Liow and Lau (2006) notethat conventions for teaching reading, based on monolingualresearch on alphabetic systems, may not be as useful for bilingualchildren, and that other forms of metalinguistic awareness, suchas morphological awareness, may be more important in somecases. Research in this area is only beginning, but will informmore viable interventions for a variety of learners.
Statistical LearningThe other main learner characteristic that we considered wasstatistical learning. We hypothesized that statistical learningmay be most beneficial when learning with the rime-levelintervention, because picking up orthographic patterns should
Frontiers in Psychology | www.frontiersin.org 16 November 2019 | Volume 10 | Article 2625

fpsyg-10-02625 November 26, 2019 Time: 12:10 # 17
O’Brien et al. Literacy Intervention and Grain Size
TABLE 6C | Coefficients for mixed effects models of Word reading, Decoding and Spelling from Post-Followup of the intervention including baseline measuremoderators.
Fixed effects Word reading accuracyestimate (SE)
Decoding accuracyestimate (SE)
Word reading fluencyestimate (SE)
Decoding fluencyestimate (SE)
Spellingestimate (SE)
Post-followup test
Intercept −0.991 (0.954) −2.614 (3.144) −1.73 (1.307) −1.289 (1.009) −2.948 (0.97)∗∗
Tx2 0.02 (0.374) 0.134 (1.231) 0.36 (0.511) −0.162 (0.395) −0.165 (0.379)
Tx3 −0.125 (0.314) −0.974 (1.035) −0.225 (0.43) −0.341 (0.332) −0.138 (0.319)
Time.L 0.027 (0.138) −0.127 (0.549) −1.052 (0.193)∗∗∗ −0.55 (0.14)∗∗∗ 0.04 (0.111)
PA 0.057 (0.015)∗∗∗ 0.205 (0.049)∗∗∗ 0.08 (0.021)∗∗∗ 0.06 (0.016)∗∗∗ 0.062 (0.015)∗∗
SL −0.06 (0.062) −0.269 (0.204) −0.113 (0.085) −0.08 (0.066) −0.109 (0.063).
Lang_M 0.141 (0.181) 0.606 (0.594) −0.101 (0.248) 0.003 (0.191) −0.201 (0.184)
Lang_T −0.702 (0.342)∗ −1.432 (1.123) −0.868 (0.467). −0.528 (0.361) −0.694 (0.347)∗
Age 0.014 (0.011) 0.017 (0.037) −0.027 (0.015). −0.012 (0.012) 0.012 (0.011)
NV Ability 0.02 (0.007)∗∗ 0.002 (0.023) 0.013 (0.009) 0.002 (0.007) 0.016 (0.007)∗
OA 0.054 (0.009)∗∗∗ 0.11 (0.029)∗∗∗ 0.069 (0.012)∗∗∗ 0.041 (0.009)∗∗∗ 0.058 (0.009)∗∗
RAN −0.025 (0.007)∗∗∗ −0.007 (0.023) −0.02 (0.009)∗ −0.005 (0.007) −0.022 (0.007)∗∗
Tx2: Time −0.049 (0.238) −0.055 (0.946) 0.196 (0.332) 0.052 (0.242) 0.232 (0.191)
Tx3: Time 0.01 (0.198) −0.265 (0.787) −0.092 (0.277) −0.142 (0.201) −0.009 (0.159)
Tx2: PA −0.028 (0.023) −0.089 (0.076) −0.058 (0.032). −0.022 (0.024) −0.01 (0.023)
Tx3: PA 0.012 (0.02) −0.017 (0.065) 0.029 (0.027) 0.025 (0.021) 0.018 (0.02)
Time: PA 0.019 (0.008)∗ −0.05 (0.033) 0.05 (0.012)∗∗∗ 0.011 (0.008) 0.008 (0.007)
Tx2: SL 0.138 (0.08). 0.33 (0.264) 0.303 (0.11)∗∗ 0.112 (0.085) 0.186 (0.082)∗
Tx3: SL 0.118 (0.099) 0.727 (0.327)∗ 0.092 (0.136) −0.015 (0.105) 0.187 (0.101).
Time: SL 0.006 (0.038) 0.157 (0.152) 0 (0.053) −0.006 (0.039) −0.06 (0.031).
Tx2: EM −0.114 (0.271) −0.536 (0.893) −0.332 (0.372) 0.082 (0.287) −0.089 (0.276)
Tx3: EM −0.318 (0.264) −0.015 (0.868) −0.173 (0.361) 0.131 (0.279) −0.371 (0.269)
Tx2: ET 0.931 (0.422)∗ 1.575 (1.388) 0.948 (0.577) 1.061 (0.445)∗ 0.837 (0.428).
Tx3: ET 0.606 (0.437) 1.422 (1.438) 0.592 (0.597) 0.638 (0.461) 0.65 (0.443)
Time: EM −0.09 (0.11) 0.911 (0.439)∗ −0.161 (0.155) 0.152 (0.113) −0.041 (0.089)
Time: ET −0.238 (0.213) 1.031 (0.848) −0.501 (0.297). −0.218 (0.216) −0.131 (0.171)
Tx2: Time: PA −0.01 (0.015) 0.069 (0.059) −0.018 (0.021) −0.002 (0.015) −0.022 (0.012).
Tx3: Time: PA 0.003 (0.013) 0.084 (0.05). −0.019 (0.018) 0.009 (0.013) 0.002 (0.01)
Tx2: Time: SL 0.05 (0.049) 0.059 (0.196) 0.099 (0.069) 0.077 (0.05) 0.09 (0.04)∗
Tx3: Time: SL −0.018 (0.059) −0.095 (0.237) 0.138 (0.083) 0.017 (0.06) 0.054 (0.049)
Tx2: Time: EM 0.206 (0.171) −0.886 (0.682) 0.039 (0.24) −0.223 (0.175) 0.037 (0.138)
Tx3: Time: EM 0.123 (0.159) −0.443 (0.635) 0.487 (0.224)∗ 0.096 (0.163) 0.063 (0.129)
Tx2: Time: ET 0.346 (0.266) −0.925 (1.06) 0.296 (0.372) 0.427 (0.271) 0.187 (0.214)
Tx3: Time: ET −0.003 (0.279) −1.091 (1.108) 0.427 (0.389) 0.235 (0.283) 0.148 (0.224)
Word reading accuracy and decoding accuracy are grade equivalent scores from the WJIII, word reading fluency and decoding fluency are norm-referencedz-scores, and BAS Spelling are scaled scores. NV Ability = non-verbal ability, OA = orthographic awareness, PA = phonological awareness, SL = statistical learning,Lang_M = English/Malay group, Lang_T = Egnlish/Tamil group. EM = English/Malay group vs. English/Chinese group, ET = English/Tamil group vs. English/Chinesegroup. Tx2 = rime-level compared to phoneme-level intervention effects; Tx3 = word-level compared with phoneme-level intervention effects. ∗∗∗p < 0.001; ∗∗p < 0.01;∗p < 0.05.
be easier for those with greater statistical learning ability.When children’s level of statistical learning was taken intoconsideration, three outcome measures showed differentialtreatment effects over time. These included decoding, spellingand word reading fluency. Those with lower statistical learningskill benefited more from the phoneme-level intervention ineach case. On the other hand, those with higher statisticallearning showed better longer term outcomes from a rime-levelintervention at follow-up. The effects that statistical learninghad across several outcome measures suggest that this is animportant skill which may moderate learning and intervention.However, the construct of statistical learning is still unclear
from the literature, and an understanding of its contribution toreading acquisition is still developing (see Siegelman et al., 2017).Nonetheless, further study is warranted.
Technology Derived DataWhat is unique about the process of using technology-basedmethods for instruction of reading is that it offers flexible waysto present text, outside of the stationary blots of ink on paperwith traditional methods. Fonts with increased interletter spacinghave been promoted to ease eligibility for dyslexic readers (Zorziet al., 2012); reverse contrast enables faster reading for low visionreaders (Legge, 2007); synthesized speech helps multiple groups
Frontiers in Psychology | www.frontiersin.org 17 November 2019 | Volume 10 | Article 2625

fpsyg-10-02625 November 26, 2019 Time: 12:10 # 18
O’Brien et al. Literacy Intervention and Grain Size
FIGURE 9 | On-line data from Grapholearn mini-assessments for groups of students in the phoneme-level intervention group (orange bars) and the rime-levelintervention group (blue bars). HSL = High statistical learners (solid bars), LSL = Low statistical learners (striped bars). Performance (proportion correct) onletter-sound items (left), rime items (middle), and word items (right).
to go beyond what is undecodable text (Meyer and Bouck, 2014)thus allowing customization of the presentation of print.
In addition, technology-based intervention allows educatorsto see how individual children are performing longitudinally ona trial-by-trial, and session-by-session level while completing thelearning activities. This gives a finer-grained assessment of whatchildren can do or continue to struggle with. For example, weobserved the types of letter confusions children tended to makewhen performing the phoneme- and rime-level activities, andhow these intervention groups compared on mini-assessments atmultiple grain sizes. These types of measures could offer a clearermicrogenetic analysis of learning throughout the intervention, asopposed to aggregated two-point pre-test and post-test measures,which may be less sensitive.
Overall, technology-based approaches can be instrumental asa bridge between the laboratory and the classroom. The way weuse technology applications can help us to test the hypothesesthat we would normally run in the lab, but now have the capacityto do in the classroom with better experimental controls. With atechnology approach, using tablets as a medium and gamificationas a method, we can bring our research questions to the classroomand actually run real experiments that are ecologically more valid.These experiments can be embedded in an educational settingwithout disrupting the educational programs of the school. Thesetools of access, then, allow cognitive scientists to test learninghypotheses in the classroom, with gains for the field and littledisruption to the students. These methods may be more easily“scalable” to larger samples as well. Should one approach work,it could be adapted to real classrooms with direct benefits foreducation, and not only to basic science.
LimitationsThe conclusions we draw from this study need to be consideredin light of some limitations. First, our bilingual group ofEnglish and Tamil learners was small, so that our comparisonsacross the language groups was limited to comparing biscriptal
bilinguals learning different types of orthographies (Chinese andEnglish) with monoscriptal bilinguals learning two alphabeticorthographies and one script (Malay and English). Research onliteracy development for Akshara scripts is limited, so futurestudies including biliterates acquiring this type of script areneeded. Also, the measure we used for statistical learningdifferences was based on the standard task used in previousliterature (Arciuli and Simpson, 2011), but this measure hasrecently come under more scrutiny (Siegelman et al., 2017). Wescored the task in a manner that we expect would highlightindividual differences, but future studies should consideralternate ways of measuring such individual differences andperhaps with multiple tasks, if statistical learning is indeed amulti-faceted construct. Finally, the use of technology-basedprograms has the distinct benefit of individualizing interventionto students’ needs, but comparison of outcomes across childrenmay be affected by differential exposure to different levelsof the games. That is, the games were adapted to individualperformance, and children could only move on to the next levelwhen they achieved mastery (80% accuracy).
CONCLUSION
There are concerns with the advent of widespread use oftechnology for reading. Just as Socrates was concerned thatliteracy would lead to the demise of memory skills, currentconcerns are expressed for how the nature of reading willchange with digital text (e.g., Wolf, 2018). Deep reading, thatis the feeling of being immersed in a novel or reading fordeep understanding of a topic, is at stake. Because readingyields many benefits for the mind, from vocabulary to verbalskills to declarative knowledge (Cunningham and Stanovich,2001), the concern is warranted. Therefore, understanding howto encourage lifelong reading habits is a worthwhile pursuit inthis digital age.
Frontiers in Psychology | www.frontiersin.org 18 November 2019 | Volume 10 | Article 2625
fpsyg-10-02625 November 26, 2019 Time: 12:10 # 19
O’Brien et al. Literacy Intervention and Grain Size
DATA AVAILABILITY STATEMENT
The datasets generated for this study are available on request tothe corresponding author.
ETHICS STATEMENT
The studies involving human participants were reviewed andapproved by NTU-Institutional Review Board at [email protected] informed consent to participate in this study wasprovided by the participants’ legal guardian/next of kin.
AUTHOR CONTRIBUTIONS
BO’B conceived the original idea, designed the study andanalytical approach, performed the analytical calculations, andtook the lead in writing the manuscript. MH contributed to
the implementation of the experiment, data collection andprocessing, and wrote the methods and co-designed the figureswith BO’B. LO verified the analytical methods and contributedto the interpretation of the results. All authors discussed theresults, provided critical feedback, analysis, and contributed tothe final manuscript.
FUNDING
This research was supported by the NIE Office of EducationResearch grant # OER0417OBA.
SUPPLEMENTARY MATERIAL
The Supplementary Material for this article can be foundonline at: https://www.frontiersin.org/articles/10.3389/fpsyg.2019.02625/full#supplementary-material
REFERENCESAravena, S., Snellings, P., Tijms, J., and van der Molen, M. W. (2013). A lab-
controlled simulation of a letter–speech sound binding deficit in dyslexia. J. Exp.Child Psychol. 115, 691–707. doi: 10.1016/j.jecp.2013.03.009
Arciuli, J., and Simpson, I. C. (2011). Statistical learning in typically developingchildren: the role of age and speed of stimulus presentation. Dev. Sci. 14,464–473. doi: 10.1111/j.1467-7687.2009.00937.x
Bassetti, B. (2013). “Bilingualism and writing systems,” in The Handbook ofBilingualism and Multilingualism - Second Edition, eds T. K. Bhatia, andW. C. Ritchie, (Hoboken, NJ: Blackwell Publishing Ltd), 649–670. doi: 10.1002/9781118332382.ch26
Bialystok, E., Luk, G., and Kwan, E. (2005). Bilingualism, biliteracy, and learningto read: interactions among languages and writing systems. Sci. Stud. Read. 9,43–61. doi: 10.1207/s1532799xssr0901_4
Branum-Martin, L., Tao, S., Garnaat, S., Bunta, F., and Francis, D. J.(2012). Meta-analysis of bilingual phonological awareness: language, age, andpsycholinguistic grain size. J. f Educ. Psychol. 104, 932–944. doi: 10.1037/a0027755
Butterworth, B., and Yeo, D. (2004). Dyscalculia Guidance: Helping Pupils WithSpecific Learning Difficulties in Maths. London: Nelson Publishing CompanyLtd.
Caravolas, M. (2004). Spelling development in alphabetic writing systems: a cross-linguistics perspective. Eur. Psychol. 9, 3–14. doi: 10.1027/1016-9040.9.1.3
Chen, S. H. A., Ng, B., Tan, S. C., Poon, K. K., Yeo, L. S., Aljunied, S. M., et al.(2016). Findings and Data From Grant Supported by the Singapore NationalResearch Foundation, Science of Learning Planning Grant (NRF2015-SOL001-011). Singapore: National Research Foundation.
Cheung, A. C., and Slavin, R. E. (2013). Effects of educational technologyapplications on reading outcomes for struggling readers: a best-evidencesynthesis. Read. Res. Q. 48, 277–299. doi: 10.1002/rrq.50
Clark, D. B., Tanner-Smith, E. E., and Killingsworth, S. S. (2016). Digital games,design, and learning: a systematic review and meta-analysis. Rev. Educ. Res. 86,79–122. doi: 10.3102/0034654315582065
Cunningham, A. E., Perry, K. E., and Stanovich, K. E. (2001). Converging evidencefor the concept of orthographic processing. Read. Writ. 14, 549–568.
Cunningham, A. E., and Stanovich, K. E. (2001). What reading does for the mind.Journal of Direct Instruction 1, 137–149.
de Graaff, S., Bosman, A. M. T. T., Hasselman, F., and Verhoeven, L. (2009).Benefits of systematic phonics instruction. Sci. Stud. Read. 13, 318–333. doi:10.1111/j.2044-8279.2010.02015.x
de Souza, G. N., Brito, Y. P. S., Tsutsumi, M. M. A., Marques, L. B., Goulart, P. R. K.,Monteiro, D. C., et al. (2018). The adventures of Amaru: integrating learning
tasks into a digital game for teaching children in early phases of literacy. Front.Psychol. 9:2531. doi: 10.3389/fpsyg.2018.02531
Dowker, A. (2005). Early identification and intervention for students withmathematics difficulties. J. Learn. Disabil. 38, 324–332. doi: 10.1177/00222194050380040801
Ecalle, J., Magnan, A., and Calmus, C. (2009). Lasting effects on literacy skillswith a computer-assisted learning using syllabic units in low-progress readers.Comput. Educ. 52, 554–561. doi: 10.1016/j.compedu.2008.10.010
Elliott, C. D., and Smith, P. (2011). The British Ability Scales- Third Edition (BAS-3).London: GL Assessment.
Gabay, Y., Thiessen, E. D., and Holt, L. L. (2015). Impaired statistical learning indevelopmental dyslexia. J. Speech Lang. Hear Res. 58, 934–945. doi: 10.1044/2015_jslhr-l-14-0324
Geva, E. (2014). The cross-language transfer journey - a guide to the perplexed.Writ. Lang. Lit. 17:1. doi: 10.1075/wll.17.1.01gev
Goldstein, S., and Kennemer, K. (2005). “Learning disabilities,” in Handbook ofNeurodevelopmental and Genetic Disorders in Adults, eds S. Goldstein, and C. R.Reynolds, (New York, NY: Guilford Press), 91–114.
Goswami, U., and Bryant, P. (1990). Phonological Skills and Learning to Read.Hillsdale, NJ: Lawrence Erlbaum.
Hampson, M., Olson, I. R., Leung, H. C., Skudlarski, P., and Gore, J. C. (2004).Changes in functional connectivity of human MT/V5 with visual motioninput. Neuroreport 15, 1315–1319. doi: 10.1097/01.wnr.0000129997.95055.15
Hatcher, P. J., Hulme, C., Miles, J. N., Carroll, J. M., Hatcher, J., Gibbs, S., et al.(2006). Efficacy of small group reading intervention for beginning readers withreading-delay: a randomised controlled trial. J. Child Psychol. Psychiatr. 47,820–827. doi: 10.1111/j.1469-7610.2005.01559.x
Hirsh-Pasek, K., Zosh, J. M., Golinkoff, R. M., Gray, J. H., Robb, M. B., andKaufman, J. (2015). Putting education in “educational” apps: lessons fromthe science of learning. Psychol. Sci. Public Interest 16, 3–34. doi: 10.1177/1529100615569721
Hoeft, F., Hernandez, A., McMillon, G., Taylor-Hill, H., Martindale, J. L., Meyler,A., et al. (2006). Neural basis of dyslexia: a comparison between dyslexic andnondyslexic children equated for reading ability. J. Neurosci. 26, 10700–10708.doi: 10.1523/jneurosci.4931-05.2006
Hulme, C., Hatcher, P. J., Nation, K., Brown, A., Adams, J., and Stuart, G. (2002).Phoneme awareness is a better predictor of early reading skill than onset-rimeawareness. J. Exp. Child Psychol. 82, 2–28. doi: 10.1006/jecp.2002.2670
Koda, K. (2005). Insights Into Second Language Reading. New York, NY: CambridgeUniversity Press.
Kyle, F., Kujala, J. V., Richardson, U., Lyytinen, H., and Goswami, U. (2013).Assessing the effectiveness of two theoretically motivated computer-assisted
Frontiers in Psychology | www.frontiersin.org 19 November 2019 | Volume 10 | Article 2625

fpsyg-10-02625 November 26, 2019 Time: 12:10 # 20
O’Brien et al. Literacy Intervention and Grain Size
reading interventions in the United Kingdom: GG Rime and GG Phoneme.Read. Res. Q. 48, 61–76. doi: 10.1002/rrq.038
Lallier, M., and Carreiras, M. (2018). Cross-linguistic transfer in bilinguals readingin two alphabetic orthographies: the grain size accommodation hypothesis.Psychon. Bull. Rev. 25, 386–401. doi: 10.3758/s13423-017-1273-0
Laurillard, D. (2016). Learning ‘number sense’ through digital games with intrinsicfeedback. Australas. J. Educ. Technol. 32, 32–44.
Leafstedt, J. M., Richards, C. R., and Gerber, M. M. (2004). Effectiveness of explicitphonological-awareness instruction for at-risk English learners. Learn. Disabil.19, 252–261. doi: 10.1111/j.1540-5826.2004.00110.x
Legge, G. E. (2007). Psychophysics of Reading in Normal and Low Vision. New York,NY: Taylor & Francis.
Lonigan, C. J., Burgess, S. R., and Anthony, J. L. (2000). Development of emergentliteracy and early reading skills in preschool children: evidence from a latent-variable longitudinal study. Dev. Psychol. 36, 596–613. doi: 10.1037/0012-1649.36.5.596
Melby-Lervåg, M., and Lervåg, A. (2011). Cross-linguistic transfer of oral language,decoding, phonological awareness and reading comprehension: a meta-analysisof the correlational evidence. J. Res. Read. 34, 114–135. doi: 10.1111/j.1467-9817.2010.01477.x
Metsala, J. L., and David, M. D. (2017). The effects of age and sublexicalautomaticity on reading outcomes for students with reading disabilities. J. Res.Read. 40, S209–S227.
Meyer, N. K., and Bouck, E. C. (2014). The impact of text-to-speech on expositoryreading for adolescents with LD. J. Spec. Educ. Technol. 29, 21–33. doi: 10.1177/016264341402900102
Nagy, W., Berninger, V. W., and Abbott, R. D. (2006). Contributions ofmorphology beyond phonology to literacy outcomes of upper elementary andmiddle-school students. J. Educ. Psychol. 98, 134–147. doi: 10.1037/0022-0663.98.1.134
National Reading Panel (US), National Institute of Child Health, and HumanDevelopment (US), (2000). Report of the National Reading Panel: Teachingchildren to Read: An Evidence-Based Assessment of the Scientific ResearchLiterature on Reading and its Implications for Reading Instruction: Reports ofthe Subgroups. Washington, DC: National Institute of Child Health and HumanDevelopment.
Norton, E. S., and Wolf, M. (2012). Rapid automatized naming (RAN) and readingfluency: implications for understanding and treatment of reading disabilities.Annu. Rev. Psychol. 63, 427–452. doi: 10.1146/annurev-psych-120710-100431
O’Brien, B. A. (2014). The development of sensitivity to sublexical orthographicconstraints: an investigation of positional frequency and consistency using awordlikeness choice task. Read. Psychol. 35, 285–311. doi: 10.1080/02702711.2012.724042
O’Brien, B. A., and Chern, F. C. (2015). “Effective approaches to early phonicsinstruction using technology-based digital text,” in Proceedings of the Presentedat the Biennial Meeting of SRCD, (Philadelphia, PA).
O’Brien, B. A., Mohamed, H. M., Yussof, N. T., and Ng, S. C. (2019). Thephonolgoical awareness relation to early reading in English for three groupsof simultaneous bilingual children. Read. Writ. 32, 909–937.
Olson, R. K., and Wise, B. W. (1992). Reading on the computer with orthographicand speech feedback. Read. Writ. 4, 107–144. doi: 10.1007/bf01027488
Perfetti, C., and Veroeven, L. (2017). “Epilogue: universals and particulars inlearning to read across seventeen orthographies,” in Learning Across Languagesand Writing Systems, eds L. Veroeven, and C. Perfetti, (Cambridge: CambridgeUniversity Press), 455–466. doi: 10.1017/9781316155752.019
Peterson, R. L., and Pennington, B. F. (2012). Developmental dyslexia. Lancet 379,1997–2007. doi: 10.1016/S0140-6736(12)60198-6
Pugh, K. R., Mencl, W. E., Jenner, A. R., Katz, L., Frost, S. J., Lee, J. R., et al.(2000). Functional neuroimaging studies of reading and reading disabilitydevelopmental dyslexia. Ment. Retard. Dev. Disabil. Res. Rev. 6, 207–213. doi:10.1002/1098-2779(2000)6:3<207::aid-mrdd8>3.3.co;2-g
Raviv, L., and Arnon, I. (2018). The developmental trajectory of children’s auditoryand visual statistical learning abilities: modality-based differences in the effectof age. Dev. Sci. 21:e12593. doi: 10.1111/desc.12593
Richardson, U., and Lyytinen, H. (2014). The GraphoGame method: thetheoretical and methodological background of the technology-enhancedlearning environment for learning to read. Hum. Technol. 10, 39–60. doi:10.17011/ht/urn.201405281859
Rickard Liow, S. J., and Lau, L. H.-S. (2006). The development of bilingualchildren’s early spelling in English. J. Educ. Psychol. 98, 868–878. doi: 10.1037/0022-0663.98.4.868
Rickard Liow, S. J., and Sze, W. P. (2008). Bilingual Language Assessment Battery(BLAB). Singapore: National University of Singapore.
Rose, D. H., and Strangman, N. (2007). Universal design for learning: meetingthe challenge of individual learning differences through a neurocognitiveperspective. Univers. Access Inf. Soc. 5, 381–391. doi: 10.1007/s10209-006-0062-8
Saine, N., Lerkkanen, M.-K., Ahonen, T., Tolvanen, A., and Lyytinen, H. (2011).Computer-assisted remedial reading intervention for school beginners at riskfor reading disability. Child Dev. 82, 1013–1028. doi: 10.1111/j.1467-8624.2011.01580.x
Sawi, O. M., and Rueckl, J. (2018). Reading and the neurocognitive bases ofstatistical learning. Sci. Stud. Read. 23, 8–23. doi: 10.1080/10888438.2018.1457681
Saygin, Z. M., Norton, E. S., Osher, D. E., Beach, S. D., Cyr, A. B., Ozernov-Palchik,O., et al. (2013). Tracking the roots of reading ability: white matter volume andintegrity correlate with phonological awareness in prereading and early-readingkindergarten children. J. Neurosci. 3, 13251–13258. doi: 10.1523/JNEUROSCI.4383-12.2013
Seidenberg, M. S., and McClelland, J. L. (1989). A distributed, developmentalmodel of word recognition and naming. Psychol. Rev. 96, 523–568. doi: 10.1037//0033-295x.96.4.523
Seward, R., O’Brien, B., Breit-smith, A. D., and Meyer, B. (2014). Linking designprinciples with educational research theories to teach sound to symbol readingcorrespondence with multisensory type. Visible Lang. 48, 86–108.
Seymour, P. H. K., Aro, M., and Erskine, J. M. (2003). Foundation literacyacquisition in European orthographies. Br. J. Psychol. 94, 143–174. doi: 10.1348/000712603321661859
Siegelman, N., Bogaerts, L., and Frost, R. (2017). Measuring individual differencesin statistical learning: current pitfalls and possible solutions. Behav. Res. 49,418–432. doi: 10.3758/s13428-016-0719-z
Slavin, R. E., Lake, C., Davis, S., and Madden, N. A. (2011). Effective programsfor struggling readers: a best-evidence synthesis. Educ. Res. Rev. 6, 1–26. doi:10.1016/j.edurev.2010.07.002
Steacy, L. M., Elleman, A. M., and Compton, D. L. (2017). “Opening the ‘blackbox’ of learning to read,” in Theories of Reading Development, eds K. Cain,D. L. Compton, and R. K. Parrila, (Amsterdam: John Benjamins PublishingCompany), 99–117.
Torgesen, J. K., Wagner, R., and Rashotte, C. (2012). Test of Word ReadingEfficiency: (TOWRE-2). London: Pearson Clinical Assessment.
Torgesen, J. K., Wagner, R. K., Raschotte, C. A., Herron, J., and Lindamood, P.(2010). Computer assisted instruction to prevent early reading difficulties instudents at risk for dyslexia: outcomes from two instructional approaches. Ann.Dyslexia 60, 40–56. doi: 10.1007/s11881-009-0032-y
Treiman, R., Kessler, B., and Bick, S. (2002). Context sensitivity in the spellingof English vowels. J. Mem. Lang. 47, 448–468. doi: 10.1016/s0749-596x(02)00010-4
Treiman, R., Kessler, B., Zevin, J. D., Bick, S., and Davis, M. (2006). Influence ofconsonantal context on the reading of vowels: evidence from children. J. Exp.Child Psychol. 93, 1–24. doi: 10.1016/j.jecp.2005.06.008
Wagner, R. K., Torgesen, J. K., Rashotte, C. A., and Pearson, N. A. (2013).Comprehensive Test of Phonological Processing-2. Austin: Pro-Ed.
Walton, P. D., Walton, L. M., and Felton, K. (2001). Teaching rime analogy orletter recoding reading strategies to prereaders: effects on prereading skillsand word reading. J. Educ. Psychol. 93, 160–180. doi: 10.1037//0022-0663.93.1.160
Wandell, B. A., Rauschecker, A. M., and Yeatman, J. D. (2012). Learning to seewords. Annu. Rev. Psychol. 63, 31–53. doi: 10.1146/annurev-psych-120710-100434
Wolf, M. (2018). Reader, Come Home: The Reading Brain in a Digital World.New York, NY: HarperCollins.
Wolf, M., and O’Brien, B. (2006). “From the sumerians to images of the readingbrain: insights for reading theory and intervention,” in The Dyslexic Brain: NewPathways in Neuroscience Discovery, ed. G. D. Rosen, (Mahwah, NJ: LawrenceErlbaum Associates), 5–20.
Woodcock, R. W., McGrew, K. S., and Mather, N. (2007). Woodcock Johnson IIITests of Achievement. Rolling Meadows, IL: Riverside Publishing.
Frontiers in Psychology | www.frontiersin.org 20 November 2019 | Volume 10 | Article 2625

fpsyg-10-02625 November 26, 2019 Time: 12:10 # 21
O’Brien et al. Literacy Intervention and Grain Size
Yelland, G. W., Pollard, J., and Mercuri, A. (1993). The metalinguistic benefitsof limited contact with a second language. Appl. Psycholinguist. 14, 423–444.doi: 10.1017/s0142716400010687
Yeung, S. S., Siegel, L. S., and Chan, C. K. K. (2012). Effects of a phonologicalawareness program on English reading and spelling among Hong KongChinese ESL children. Read. Writ. 26, 681–704. doi: 10.1007/s11145-012-9383-6
Zorzi, M., Barbiero, C., Facoetti, A., Lonciari, I., Carrozzi, M., Montico, M., et al.(2012). Extra-large letter spacing improves reading in dyslexia. Proc. Natl. Acad.Sci. U.S.A. 109, 11455–11459. doi: 10.1073/pnas.1205566109
Conflict of Interest: The authors declare that the research was conducted in theabsence of any commercial or financial relationships that could be construed as apotential conflict of interest.
Copyright © 2019 O’Brien, Habib and Onnis. This is an open-access articledistributed under the terms of the Creative Commons Attribution License (CC BY).The use, distribution or reproduction in other forums is permitted, provided theoriginal author(s) and the copyright owner(s) are credited and that the originalpublication in this journal is cited, in accordance with accepted academic practice. Nouse, distribution or reproduction is permitted which does not comply with these terms.
Frontiers in Psychology | www.frontiersin.org 21 November 2019 | Volume 10 | Article 2625