title page improving septic tank … thesis latest... · ascertaining people‟s perception with...
TRANSCRIPT

i
TITLE PAGE
IMPROVING SEPTIC TANK PERFORMANCE BY A NEW
RATIONAL DESIGN APPROACH
Ph.D THESIS
BY
NNAJI, CHIDOZIE CHARLES
(Reg. No.: PG/Ph.D/08/49126)
SUPERVISOR:
ENGR. PROF. J. C. AGUNWAMBA
MARCH, 2011
ii
CERTIFICATION
This is to certify that Nnaji, Chidozie Charles, a postgraduate student in the
Department of Civil Engineering with registration number PG/Ph.D/08/49126
has successfully fulfilled the requirements for the award of Doctor of
Philosophy (Ph.D) in Civil Engineering (Water Resources and Environmental
Engineering option). This work is original and has not been submitted in part or
full for the award of certificate in any other institution, University, referred
journals, book or any publication.
…………………………………………………….
Engr. Prof. J. C. Agunwamba
(Supervisor)
………………………………………….................
Engr. J. C. Ezeokonkwo
(Head of Department)
………………………………………………………..
Engr. Prof. Ify L. Nwaogazie
(External Examiner)
March, 2011

iii
DEDICATION
To my lovely wife, Favour Nnenna, Nnaji; my precious little daughter,
Chigozirim Hephzibah Nnaji and my parents Pastor and Mrs. Nathaniel Nnaji
for believing in me.

iv
ACKNOWLEDGMENT
First and foremost, I am grateful to the Almighty God for His Eternal Mercies.
I am mostly indebted to my indefatigable supervisor, Engr. Prof. Jonah
Chukwuemeka Agunwamba, the Dean of Faculty of Engineering, UNN. His
blazing trail of intellectual and scholarly versatility has provided for me a sure
take-off base.
I wish to Acknowledge Mr. Ted Kulongosky of Orenco Systems Incorporated,
USA for providing me with some materials on sludge accumulation audit. I
express my gratitude to all the staff of Civil Engineering, University of Nigeria
Nsukka. I remain grateful to the following: Engr. Prof. N. N. Osadebe, former
Dean of Engineering, Prof. J. O. Ademiluyi, Engr. Dr. C. U. Nwoji, Dr. F. O.
Okafor, Engr. J. C. Ezeokonkwo, Dr. B. O. Mama, Dr. H. N. Onah, Engr. A. J.
Anyaegbunam, Arch A. Adamou, and Engr. Mrs. C. N. Mama for their positive
impacts on me. I thank Dr. O. O. Ugwu for the useful tips he provided. I
appreciate Engr. Ifeanyi Obeta for being a good friend and colleague who is
always willing to help.
I am grateful to the staff of the Public Health Laboratory of Civil Engineering
Department, especially Engr. Chinedu Anyanwu and Mrs. Eze, for their
assistance in laboratory analysis. I wish to thank the Head of Agric and
Bioresources Engineering Department, Dr. B. O. Ugwuishiwu for technical
support. I also thank my students: Ikenna Ezeugwu and Friday Oligie for taking
the time to do dirty job of sewage sample collection with me at the sewage
treatment plant. I thank Mr. Barnabas Eze for helping me out with pumping
sewage into the reservoir and maintaining the pilot scale tanks. Not forgotten
are all the staff of the sewage treatment plant for their friendliness.
I will not forget my lovely wife, Favour Nnenna Nnaji who was very empathic
with me and supportive throughout the period that this research lasted. My
infant daughter, Chigozirim Hephzibah Nnaji was also supportive in her own

v
little way – struggling with my fingers or pen or even the laptop while I worked
made the whole effort worthwhile. I remain eternally indebted to my parents
for being such wonderful parents; and my siblings (Ndidiamaka, Chinedu,
Uzochukwu, Miracle, Grateful and Grace) for their loving support. My sincere
gratitude also goes to my parents In-law, Mr. and Mrs. David Ogbonna for their
prayers and moral support.
Finally, I would like to mention my friends who, by virtue of being my friends,
have touched my life in one way or the other. They are Mr. Peter Nick
Chineke, Obinna Ezeja, Damian Itumo, Pastor Samuel Ezeh, Engr. Dr.
Matthew Aho, Engr. Joseph Utsev, Engr. Ifeanyi Nweke, Igwebuike Udeh, Dr.
Charles Dike, Dr. Chris Afangideh, Dr. Timothy Adibe and others.
May God bless you all.

vi
ABSTRACT
This study was aimed at developing a rational approach to septic tank design in
order to reduce health risks associated with improperly treated effluent
especially in developing countries. To this end, several research tools including
questionnaires, pilot scale study and model formulation were employed.
Questionnaires were used to conduct a preliminary study with a view to
ascertaining people‟s perception with regard to septic tank design, use and
maintenance. This preliminary study revealed that the septic tank is a poorly
designed and grossly overlooked but indispensable waste management facility.
Pilot scale studies were conducted to monitor physicochemical and microbial
parameters. A sludge accumulation model was formulated from first principles
by applying material balance to a model septic tank. The model was calibrated
using data from three different septic tank audits spanning 3 years, 5 years and
8 years respectively and involving over 1000 septic tanks. A correlation
coefficient of R = 0.98 was obtained between measured and calculated sludge
accumulation data. The sludge accumulation model showed that sludge does
not accumulate at a constant rate as is usually assumed but rather at a reduced
rate over time. The sludge accumulation model was compared with two
existing but purely empirical models namely: Weibel‟s model derived in 1955
for the US Public Health Service and Bound‟s (1995) model. Finally a rational
approach to septic tank design was developed. Design charts and a Microsoft
Excel based design programme were produced to aid the unlearned designer
and the computer literate designer respectively.

vii
LIST OF FIGURES
Figure 2.1 Relationship between Air Space and Sludge Accumulation
Figure 2.2 Efficiency of Suspended Solids Removal between Compartments
(Kamel and Hgazy, 2006)
Figure 2.3 Efficiency of BOD Removal between Compartments (Kamel and
Hgazy, 2006)
Figure 2.4 Efficiency of Treatment for Different Modifications of the Septic
Tank (Nguyen et al., 2007)
Figure 2.5 Efficiency of Treatment versus Number of Baffled Reactors
(Koottatep et al., 2004)
Figure 2.6 Efficiency of COD Removal for Different Modifications of the
Septic Tank at Various Detention Times (Koottatep et al., 2004)
Figure 2.7 Efficiency of Treatment versus Wastewater Composition
(Washington et al., 1998)
Figure 3.1 Generalized Sketch of Experimental Set up
Figure 3.2 Picture of Experimental Set up
Figure 3.3 Mass Balance of Solids in the Septic Tank
Figure 3.5 Generalized Relationship for Accumulated Sludge versus Solids
Removal Efficiency
Figure 3.4 Accumulation of Sludge versus Efficiency of SS Removal Plotted
from Data Obtained by Heinss et al. (1999)
Figure 4.1 Compliance to Basic Septic Tank Tests (Questionnaire result)
Figure 4.2 Kinds of Construction Problems Encountered
(Questionnaire result)
Figure 4.3 Design Issues (Questionnaire result)
Figure 4.4 Flushing of Non-biodegradable Materials into the Septic Tanks
(Questionnaire result)
Figure 4.5 Is Your Septic Tank Malfunctioning? (Questionnaire result)
Figure 4.6 Temperature Variation Tanks
Figure 4.7 Temperature Variation Tanks (Different Inlet Types)
Figure 4.8 Change in pH between Inlet and Outlet
viii
Figure 4.9 Change in pH between Inlet and Tank Midpoint
Figure 4.10 Change in pH between Inlet and Outlet for Different Types of
Baffles
Figure 4.11 Change in pH between Inlet and Tank Midpoint for Different
Types of Baffles
Figure4.12 Outlet BOD Removal Efficiency for Different Baffle Types
Figure 4.13 Tank Midpoint BOD Removal Efficiency for Different Baffle
Types
Figure 4.14 Outlet COD Removal Efficiency for Different Baffle Types
Figure 4.15 Tank Midpoint COD Removal Efficiency for Different Baffle
Types
Figure 4.16 Tank Midpoint E-coli Removal Efficiency for Different Baffle
Types
Figure 4.17 Tank Midpoint Suspended Solids Removal Efficiency for
Different Baffle Types
Figure 4.18 Outlet Suspended Solids Removal Efficiency for Different Baffle
Types
Figure 4.19 Effluent E-coli Removal Efficiency
Figure 4.20 Outlet BOD Removal Efficiency
Figure 4.21 Tank Midpoint BOD Removal Efficiency
Figure 4.22 Effluent Suspended Solids Removal Efficiency
Figure 4.23 Tank Midpoint Suspended Solids Removal Efficiency
Figure 4.24 Plots of Model and Measured Sludge Accumulation versus Time
Figure 4.25 Comparison of Model with Bounds‟ and Weibel‟s Models
Figure 4.26 Decline of detention time with sludge accumulation
Figure 4.27 Decline of Detention Time for House Connection, Simple
Plumbing (Typical wastewater flow = 0.064m3/day)
Figure 4.28 Decline of Detention Time for Urban House with Full Water
Connection and Garden (Typical wastewater flow =
0.275m3/day)

ix
Figure 4.29 Decline of Detention Time for Basic Water Requirement
(Typical wastewater flow = 0.04m3/day)
Figure 4.30 Decline of Detention time for Average Nigerian House
(Typical wastewater flow = 0.03m3/day)
Figure 4.31 Chart for Determining Volume of Sludge for a Chosen
Desludging Interval
Figure 4.32 Residual Depth per Occupant (hre) versus Number of Occupants
Figure 4.33 Tank Dimensions and Residual Depth for Simple House
Connection, pour flush (Q=0.064m3/capita/day) and L = 2W
Figure 4.34 Tank Dimensions and Residual Depth for Full Simple House
Connection, Pour Flush (Q=0.064m3/capita/day) and L = 3W
Figure 1.35 Tank Dimensions and Residual Depth for Simple House
Connection, Pour Flush (Q=0.064m3/capita/day) and L = W
Figure 4.36 Tank Dimensions and Residual Depth for Full house connection,
urban with garden (Q= 0.22) and L = 2W
Figure 4.37 Tank Dimensions and Residual Depth for Full house connection,
urban with garden (Q= 0.22) and L = 3W
Figure 4.38 Tank Dimensions and Residual Depth for Full house connection,
urban with garden (Q= 0.22) and L = W
Figure 4.39 Tank Dimensions and Residual Depth for Nigerian Average,
Urban Areas without Pipe Borne Water (Q=0.03) and L = 2W
Figure 4.40 Tank Dimensions and Residual Depth for Nigerian Average,
Urban Areas without Pipe Borne Water (Q=0.03) and L = 3W
Figure 4.41 Tank Dimensions and Residual Depth for Nigerian Average,
Urban Areas without Pipe Borne Water (Q=0.03) and L = W
Figure 4.42 Tank Dimensions and Residual Depth for Basic Water
Requirement (Q=0.04) and L = 2W
Figure 4.43 Tank Dimensions and Residual Depth for Basic Water
Requirement (Q=0.04) and L = 3W
Figure 4.44 Tank Dimensions and Residual Depth for Basic Water
Requirement (Q=0.04) and L = W

x
Figure 4.45 Sample Design using Excel Codes
Figure 4.46 Determination of Residual Depth per Occupant Using Charts
Figure 4.47 Determination of Tank Dimensions Using Charts
Figure 4.48 Tank Design Using Excel Codes

xi
LIST OF TABLES
Table 2.1 Soil Limitation Ratings Used by NRCS for Wastewater
Absorption Fields
Table 2.2 Desludging Intervals as Recommended by Bounds (1995)
Table 3.1 Description of Pilot Scale Units
Table 3.2 Hydraulic Characteristics of Tanks
Table 3.3 Hydraulic Characteristics of Inlet Pipes
Table 4.1 Dissolved Oxygen Values (mg/l)
Table 4.2 Sludge Accumulation Data
Table 4.3 Water consumption under different supply conditions
Table 4.4 Schedule of Septic Tank Sizing and Dimensions (PWD, 1943)
Table 4.5 Septic Tank Volumes (Crites and Tchobanoglous, 1997)
xii
TABLE OF CONTENT
Title page………………………………………………………………….i
Certification……………………………………………………………….ii
Dedication…………………………………………………………………iii
Acknowledgment………………………………………………………….iv
Abstract……………………………………………………………………vi
List of figures……………………………………………………………...vii
List of tables……………………………………………………………….xi
Table of Content.………………………………………………………….xii
CHAPTER ONE: INTRODUCTION
1.1 Background………………………………………………………...1
1.2 Statement of problem……………………………………………...2
1.3 Objectives of the study…………………………………………….3
1.4 Scope of work……………………………………………………...4
1.5 Justification of the study…………………………………………...4
1.6 Limitations of the study……………………………………………4
CHAPTER TWO: LITERATURE REVIEW
2.1 Origin of the septic tank…………………………………………..5
2.2 Septic tank construction and material…………………………….5
2.2.1 Septic tank construction…………………………………...5
2.2.2 Septic tank material………………………………………..7
2.3 Domestic wastewater……………………………………………..9
2.4 Operation and performance of the septic tank system………….10
2.5 The drain field……………………………………………………13
2.6 Septic tank failure………………………………………………..17
2.7 Sludge accumulation……………………………………………..19
2.8 Contributions of previous researchers………………………….....21

xiii
CHAPTER THREE: METHODOLOGY
3.1 Data collection…………………………………………………...42
3.1.1 Preliminary study (questionnaires)…………………….....42
3.1.2 Pilot scale septic tanks……………………………………42
3.1.3 Laboratory analysis……………………………………….46
3.1.4 Sludge accumulation data acquisition…………………….47
3.2 Model formulation…………………………………………….....47
3.2.1 Sludge accumulation model……………………………...47
3.2.2 Initial conditions……………….………………………….52
3.2.3 Assumptions………………………………………………53
3.2.4 Solution of model…………………………………………54
3.2.5 Depreciation of detention time and rate of settling………56
3.2.6 Residual depth…………………………………………....59
3.2.7 Reserve space…………………………………………….60
CHAPTER FOUR: RESULTS AND DISCUSSION
4.1 Preliminary observations…………………………………………62
4.2 Result of pilot scale study………………………………………...66
4.2.1 Dissolved oxygen and temperature………………………..66
4.2.2 pH variation……………………………………………......68
4.2.3 Effect of baffle on treatment efficiency...........................70
4.2.4 Effect of detention time on treatment efficiency..............75
4.3 Model calibration………………………………………………...78
4.3.1 Comparison of model with existing sludge accumulation
models…………………………………………………….81
4.4 Basis for the new design approach………………………………82
4.5 The new design approach……………………………………......90
4.6 Design example…………………………………………………...109
4.7 Caution For Users…………………………………………………115

xiv
CHAPTER FIVE: CONCLUSION AND RECOMMENDATIONS
5.1 Conclusion……………………………………………………….115
5.2 Recommendations………………………………………………116
REFERENCES…………………………………………………………...118
APPENDIX I……………………………………………………………..125
APPENDIX II……………………………………………………………..133

1
CHAPTER ONE
INTRODUCTION
1.1 BACKGROUND
The septic tank system is the most widely used onsite treatment system for
domestic wastewater. In fact, most developing countries (Nigeria inclusive)
lack the technology and economic power to construct and operate sewerage
systems for conveyance of domestic wastewater to central sewage treatment
facilities, so a greater population rely on the septic tank system for sewage
treatment. It is an enclosed receptacle designed to collect wastewater, segregate
settleable and floatable solids (sludge and scum), accumulate, consolidate and
store solids, digest organic matter and discharge treated effluent (Bounds,
1997). In the United States only, over 50 million people use the septic system
(Collick et al., 2006). According to Fidelia (2004, in Burubai et al., 2007),
over 46% of the Nigerian population use the septic tank system. The septic
tank system was once thought to be a temporary solution to domestic
wastewater treatment and disposal. This was true until 1997 when the United
States Environmental Protection Agency and Congress officially recognized
the system as a sustainable, long-term solution for treating wastewater.
The septic tank is an anaerobic reactor due to the insufficiency of oxygen
concentration to act as electron acceptor. The wastewater is degraded by
micro-organisms aerobically while the C, CO2 SO4 act as electron acceptors to
form CO2, H2, CH4 and S2-
(sulphides). At the same time, most of the organic
N is converted to NH+
4 (inorganic). The effluent flows into the drain field
where aerobic degradation occurs due to abundance of oxygen in the
unsaturated soil layer. The C in the wastewater is now oxidized to CO2 while
NH4+ is oxidized to NO2
- thus raising the nitrate level of the sewage to about
seven times the limit acceptable for dumping water (10mg/l). The H+ released
from the oxidation of NH4+ now reduces the pH of the effluent.

2
A properly functioning septic tank system should be able to reduce the
pollutional level of wastewater to such a level as is within local and
international standards for wastewater disposal. The septic tank system
consists of a water tight tank for removal of solids and partial digestion of
organic matter, and a drain field which is a secondary treatment system. The
tank is an anaerobic system while the drain field is mostly aerobic which
further treats the effluent before channeling it to the groundwater. In some
cases, the drain field could be a gravity type or a dosing type.
All things being equal, the septic tank system does not pose much problem and
requires little maintenance. However when the system is not working properly,
it merely serves as a route for recycling pathogens and deadly chemicals
through the ecosystem. According to Cogger (1988), nearly 40% of
groundwater attributed disease outbreaks can be traced to the failure of onsite
disposal systems. Weissman et al. (1976), Bidgman et al. (1995) and Taylor et
al. (1981) among others, reported cases of disease outbreak resulting from
groundwater contamination due to septic tank failure. In Africa where most
people depend on streams, shallow wells and boreholes, the case is even more
severe.
1.2 STATEMENT OF PROBLEM
If wastewater flowing into the septic tank does not receive adequate treatment,
it is simply passed on to the groundwater unnoticed thus wreaking havoc on
public health. Researchers have shown that most septic tanks especially in
developing countries do not even attain an average performance throughout
their lifetime. The result is that most septic tanks only act as a conduit for
conveying raw / under treated sewage into the soil leading to massive fouling
of our groundwater. And because the groundwater is the main source of potable
water in most communities, man constantly stands the risk of water borne and
water related diseases. Most times, the groundwater is used without treatment
on the common assumption that it is “always clean”. The menace of such

3
diseases as typhoid fever, diarrhea, giardiasis, gastroenteritis, hepatitis,
methemoglobinamia, samonellosis, dysentery, etc will continue to plague
humanity until a systematic approach to the design, construction and
maintenance of the septic tank system is adopted.
The foregoing indicates that the septic tank system requires proper design,
construction, use and maintenance. The cardinal aspect of septic tank
maintenance which is of interest in this research is desludging. The absence of
a deterministic equation for the prediction of desludging interval has usually
led to too frequent desludging or excessive accumulation of sludge in the septic
tank. Too frequent desludging increases cost of operation while excessive
accumulation of sludge drastically reduces the efficiency of the septic tanks.
The problem at the heart of this research is to develop a systematic and rational
approach to the design of septic tanks and also to provide suitable guidelines
for the maintenance of the septic tank system in order to ensure the protection
of public and environmental health.
1.3 OBJECTIVES OF THE STUDY
Most of the existing methods of septic tank design are not based on extensive
scientific research and have so far proved inadequate. Most times what is
referred to as design is mere lumped sizing instead of systematic and rational
design. Therefore, the main objective of this research is to develop a systematic
approach to the design and maintenance of septic tanks.
Hence, the specific objectives of this research are:
(i) To derive a model to predict the rate of sludge accumulation in
septic tanks;
(ii) To calibrate the model using field data;
(iii) To predict the desludging interval of septic tanks by relating sludge
accumulation to reduction in detention time;
(iv) To compare the sludge accumulation model to existing models

4
(v) To expose the unreliability of prevailing design methods and
maintenance; and
(vi) To present a step by step procedure of how to design a functional
septic tank using facts from the research.
1.4 SCOPE OF WORK
The core of this research shall concentrate on only the septic tank and not any
of its secondary complements such as the soil absorption field, mound system,
wetland, waste stabilization pond, etc. The reason is that, under normal
circumstances, the tank itself is the limiting factor of performance in the septic
tank system. Because most homes in developing and even developed countries
still use the conventional septic tanks, this study will not extend to modified
septic tanks. However, some of these systems will be highlighted during
literature review for the sake of completeness.
1.5 JUSTIFICATION OF THE STUDY
The septic tank is pivotal to public health and yet one of the most overlooked
and least maintained waste treatment facilities. Research has shown that most
outbreaks of water borne epidemics result from fecal contamination. In most
developing countries, people are not aware of the crucial role of the septic tank
as they merely view it as a sewage pit that needs no special design, construction
and maintenance considerations. The result is the ubiquity of malfunctioning
septic tanks. This is why this subject deserves a serious intellectual attention.
1.6 LIMITATIONS OF THE STUDY
Several researches conducted on the septic tank system have shown that
sewage is very difficult to work with. Characteristics of sewage vary from
place to place and from septic tank to septic tank depending on the activities of
users. Sewage is very inhomogeneous, consisting of a liquid phase, settled and
partly settled solids, scum, dissolved solids such that it is difficult to obtain a
representative sample (Heinss et al., 1999)

5
CHAPTER TWO
LITERATURE REVIEW
2.1 ORIGIN OF THE SEPTIC TANK
Louis M. Mouras was acclaimed to be the inventor of the septic tank in 1860.
He called it the Mouras pit or automatic scavenger; however, it was not
patented until 1881. Around the same period that Mouras invented his septic
tank, Dr. Tracey and Dr. Featherton of the Lying – In Hospital, Carlton,
Melbourne had been operating what they described as an inoffensive system for
disposal of sewage. This was in 1861. In 1871, a Brisbane architect, Andrea
Stombuco invented a new kind of closet which he tested in his Royal Oak
Hotel for two years. Though Stombuco was fined by the Board of Health for
keeping an unauthorized system, the same board later considered the invention
in 1883. However, the term septic tank was not used until 1885 when Donald
Cameron patented his version.
In some places, it was thought that the septic tank did not need to be covered
because the scum layer provided the necessary cover. It was also common
belief that dung worms could be used to reduce the scum layer and that a piece
of meat should be used to kick start a new septic tank.
2.2 SEPTIC TANK CONSTRUCTION AND MATERIAL
2.2.1 Septic Tank Construction
Early septic tanks were cast in situ while there are now available precast septic
tanks which can be made of materials ranging from concrete to fibre glass. The
usual configuration is the rectangular type. All the wastewater from the home
is routed to the septic tank through pipes that merge into one that conveys
wastewater to the tank. Originally, a concrete splash baffle was used to slow
down the influent wastewater to avoid disturbance of the settled solids. The
concrete splash baffles are fast disappearing in favour of tee pipes that serve as
both inlet and baffle. Tee pipes are more efficient in reducing the kinetic and

6
potential energy of the flow thus providing quiescent conditions for effective
settling (Burubai et al., 2007). According to Bounds (1997), the change in
direction of flow dissipates its incoming velocity reducing mixing action as the
influent rushes into tank. The settleable solids retention is improved by starting
the settling at the clear zone level, near the bottom and sludge larger rather than
at the surface. It has also been found that the aggressive wastewater attacks
concrete baffles so that they deteriorate over time. This causes the effluent
quality to reduce drastically.
The tank is usually provided with a concrete cover with air vents to allow the
escape of gaseous products of anaerobic digestion. There are also manholes on
the cover, near the inlet and outlet for inspection and desludging of the tank. In
some case, the tank could have two or more compartments to enhance the
treatment efficiency of the tank. The bottom of the tank may be flat, or it may
slope towards inlet to enhance pumping of sludge. The tank is usually designed
based on the daily wastewater follow with a detention time of between 24 hours
and 72 hours. The length of the tank is usually more than the width or the
depth in order to increase the travel path of particles to enhance solids removal
and biodegradation. The conventional septic tank is constructed in such a way
as to leave some air space above the scum layer.
Septic tank effluent is usually discharged by gravity or with the aid of pumps.
Experience has shown that most outlet baffles vanish with time thus allowing
the scum layer to pass on to the drain field and clog it. The use of siphon or
pump for effluent discharge helps to reduce this problem. It is worthy of note
that most septic tanks constructed in Nigeria and other developing countries
still make use of concrete baffles. Moreover, only very few individual can
afford the dosing septic tank because of cost.
The structural requirement of the septic tank is that the septic including all
extensions to the surface shall be watertight to prevent leakage into or out of

7
the tank (Bounds, 1997). It shall be structurally sound and made of materials
resistant to corrosion from soil and acids produced from septic tank gasses
(Kansas State Department of Health and Environment, 1997). Leaking tanks
are unacceptable and watertightness is a requirement that should be mandatory
for all onsite application. Even in the United States, leaking and structurally
unsound septic tanks abound, and regulatory bodies do not make any effort to
enforce those requirements (Bounds, 1997). It therefore calls for strict quality
control during the construction of septic tanks to ensure that they attain a
desirable level of structural integrity. The American Society for Testing of
Materials recommends a hydrostatic test which involves filling the newly
constructed tank with water and allowing it to stand for hours to allow the
concrete to absorb water. Then the tank is topped off and an initial
measurement made with a hook and gauge with veneer scale. Any loss of
water after an hour renders the tank unacceptable. Observation of the outside
of the tank can also give clues of leakage. Any trickle, ooze, or exterior wet
spot is a sign of leakage (KSDHE, 1997).
2.2.2 Septic Tank Material
Concrete
The most commonly used material for the construction of the septic tank is
reinforced concrete because of its relatively lower cost. Concrete septic tanks
can either be cast in situ or precast. In most developed countries, precast
concrete septic tanks are now favoured more than the in suit type because the
precast type is made in a more controlled environment whereas cast in situ
tanks are subject to the different skills of different workers. Because it is
impossible to cast a tank in a single pour, the risk of cold joints subject to
leaking are introduced. On-site casting of septic tanks introduces job delays
and environmental hazards with the excavation being open overnight waiting
for concrete to cure. On the other hand, a precast concrete tank can be
completely installed in a single day. In most developed countries, there are

8
now many companies that specialize in manufacturing and installing precast
septic tanks of different sizes and modifications to meet growing needs.
Polyethylene
Polyethylene tanks offer the cheapest solution for onsite water treatment and
disposal. They are easy to transport and install and no cranes are needed. One
big disadvantage of polyethylene tanks is that under saturated soil conditions,
they normally tend to float out of the ground. This problem can be eliminated
by the combination of high density polyethylene (HDPE) and a ribbed design.
Fiberglass Tanks
Fiberglass can be a good substitute for concrete in the construction of septic
tanks as it has been found reliable in underground gasoline storage. Even
though fiberglass tank is lighter than a concrete tank, it is costlier than an
equivalent concrete tank. However fiberglass tanks are easier to install and
require no cranes. One brand of fiberglass septic tank is made of fiberglass
reinforced polymer (FRP). The FRP is made from a liquid resin that hardens
when a catalyst is added. The fiberglass acts as the reinforcing agents. Ribs
are also provided to improve the structural integrity of the tank.
Copolymer Polypropylene Tanks
These are made of copolymer thermoplastic sheets. The synthesis of
copolymers consists of additional copolymerization of propylene and ethylene
in a secondary reactor. By varying the quantities of co-monomer used and the
conditions of the reactor, the copolymer properties can be tailored to meet
specific use and application as in the septic tank. Copolymers have good
impact resistance and excellent corrosion resistance over a wide range of
temperatures. They are very light in weight and have exceptionally high
strength-to-weight ratio. Though a copolymer septic tank weighs only one
tenth of the weight of an equivalent precast concrete tank, it is much stronger

9
than concrete. It easily recovers after being stressed and is environmentally
safe.
2.3 DOMESTIC WASTEWATER
Domestic wastewater is the wastewater resulting from domestic activities in the
home. It contains a relatively high concentration of organic compounds
containing reduced carbon (C) and nitrogen (N) (Wilhelm et al., 1994). It also
contains a large number of potentially harmful micro-organisms and chemical
compounds. Specifically, household wastewater contains bacteria, viruses,
household chemicals and excess nutrients such as nitrates and phosphates
(Rose and Gerba, 1991; Pang et al., 2003). Raw domestic wastewater poses a
potential health risk for transmission of a large number disease causing
organisms (Nirel and Revadier, 1999). Four types of pathogens potentially
present in domestic wastewater are viruses, bacteria, protozoa and helminthes
eggs. Some of the pathogens in domestic wastewater are not “frank” pathogens
but normal flora which reside in the human gut. Enteric bacterial pathogens
can cause a wide variety of diseases ranging from gastroenteritis to ulcer and
typhoid fever.
According to Tchobanoglous et al. (1991), wastewater contains between 0.2 g/l
to 0.6 g/l of organic matter mostly composed of protein, carbohydrates and
smaller amounts of lipids. Wastewater contains two classes of contaminants:
anthropogenic organic chemicals and microbial pathogens. Proteins and urea
contribute over 97% of the 20 to 70mg/l of nitrogen typically found in
wastewater (Lake 1974; Tchobanoglous et al., 1991). Organic nitrogen
contributes 90 to 320mg/l of domestic wastewater; organic sulphur contributes
5 to 10mg/l (Hypes, 1974) of the oxygen demand while organic carbon
contributes 200 to 1000 mg/l (Tchobanoglous et al., 1991). The pH of domestic
wastewater typically ranges between 6.5 and 8.0 (Canter and Knox, 1985;
Huder and Hcukelekian, 1965).

10
The strength of domestic wastewater can be measured by its biochemical
oxygen demand (BOD), suspended solids (SS), chemical oxygen demand
(COD) or microbial content (E.coli, fecal coliform, etc). The standard BOD test
measures only the oxygen demand for organic carbon. The characteristics of
domestic wastewater flowing into the septic tank depend on whether it is only
toilet wastewater (sewage) or a combination of sewage and grey water
(bathroom and kitchen waste water). Whereas toilet wastewater is composed
mainly of organic compounds, bathroom and kitchen wastewater can contain a
relatively high quantity of inorganic compounds which may not be amenable to
biodegradation. Surface runoff from roofs and paved areas, subsurface
drainage from drains and sewers pumps and cooling water are not domestic
wastewater and therefore should not be channeled into the septic tanks as they
will lead to overloading and subsequently reduce the efficiency of the tank.
The wastewater flow is usually taken as 80% of the water consumption of a
home. However, water consumption varies from place to place depending
mainly on the availability of water. The average wastewater flow reported by
various researchers are 160 lpcd, 24 lpcd, 71 lpcd, 51 lpcd, 29 lpcd (Watson et
al., 1967); 64 lpcd (Kriesel, 1971); 100 lpcd and 120 lpcd (Rahman et al.,
1999). The standard wastewater flow used for septic tank design in the United
States is 75 gallons/capital/day (283.9 lpcd); in Egypt it is 100 lpcd for a
population less than 5000 (Kamel and Hgazy, 2006); while in Nigeria, it is 114
lpcd (Aluko, 1978). The use of water softener in areas with hard water can
raise the wastewater flow by about 40 lpcd.
2.4 OPERATION AND PERFORMANCE OF THE SEPTIC TANK
SYSTEM
The septic tank is a primary settling tank as well as an anaerobic reactor. The
influent wastewater is interrupted by the concrete splash baffle and is scattered

11
on the surface of the tank‟s content disturbing the scum layer and settled
sludge. But in tanks using tee pipes as inlet, the part of the pipe pointing
downward is made to dip into the liquid at mid depth to provide minimal
disturbance of the content. Settling starts at the inlet of the tank. Given enough
detention time, the septic tank can achieve as much as 81% total suspended
solids removal, 68% BOD removal, 65% phosphate removal and 66% fecal
coliform removal (Seabloom et al., 1982; Rahman et al., 1999). These values
are not fixed; they could be more or less depending on design, construction,
maintenance and modification. A malfunctioning septic tank will cause
damage to the drain field if the issue is not addressed.
Ideally, the septic tank operates as a plug flow reactor (fluid and particles enter
and exit the tank is progressive sequence), so there is usually no mixing or
heating, particles ascend or descend and stratification develops (Bounds, 1997).
The septic tank is primarily a sedimentation tank. The low rate of
biodegradation in the septic tank is as a result of insufficient oxygen in the
tank. The tank consists of four zones viz:
1. The sludge zone – this is the lowest portion of the tank where particles
denser than water settle given a sufficient detention time.
2. The clear zone – this is just above the sludge zone where clarified
wastewater is retained for a while before discharge into the drain field.
Detention of waste tends to homogenize the flow of waste water to the
drain field (Baumann et al., 1978). Detention also provides some time
for biodegradation by anaerobic micro-organisms.
3. The scum layer - this is the top layer just above the clear wastewater
where materials lighter than water rise to form a thick layer of about
3cm. Trojan et al. (1985) and Winneberger (1984) estimated the rate of
sludge and scum accumulation at 40 l/c/yr. The scum layer has the
undesirable effect of hindering the diffusion of air into the septic tank
content. The dissolved oxygen concentrations in septic tanks have been
found to average 0.3mg/l (Winneberger, 1984).

12
4. Air / Reserve Space – this is an empty space above the sum layer. This
provides a factor of safety against clogging of septic tank pipes. It is
recommended that the air space be equivalent to one day detention time
to provide enough time for repairs before the tank fills up completely.
However if the septic tank is not functioning properly, there will be short
circuiting causing some particles to leave the tank in a period less than the
design detention time. There will also be dead zones where some particles
seem to lodge permanently thus reducing the effective volume of the tank and
hence reducing the detention time.
The particles that settle at the bottom of the tank form the sludge layer.
Anaerobic decomposition will normally reduce the volume of the accumulated
sludge by 40 to 50% producing methane (CH4), carbon IV oxide (CO2), water
(H2O) and hydrogen sulphide (H2S) gases (Seabloom et al., 1982; USEPA,
2000). Usually there are more microbial activities at the outlet than at the inlet
resulting in less sludge accumulation at the inlet. Hydrolysis and fermentation
are typically fully functional within 48 hours of operating a new septic tank.
(Jowett, 2007). That is why septic tanks are usually sized based on twice the
daily design flow. Sludge keeps on accumulating in the tank until the effluent
quality falls below certain limits and the tank is desludged. Some septic tanks
are emptied after a specified period of time while others emptied when they are
one third full or even completely full. The level of sludge and scum in the tank
can be measured using a sludge judge which typically consists of rod with pH
or light sensitive tips. The effluent from the septic tank is sent to a drain field,
waste stabilization pond, wet land, peat or sand filter, mound, upflow and
synthetic filters, pressure distribution system or nitrogen reduction system for
further polishing before discharge or reuse. A baffle is usually placed near the
outlet to prevent the exit of scum.

13
In order to prolong the life span of the septic tank, there should be strict control
over what is sent into it. Non-biodegradable materials will cause the tank to fill
up quickly thereby causing the tank to require more frequent desludging and
consequently raising the cost of operation. Non-degradable items such as rags,
wool, hair, plastics and polythene bags can also clog the plumbing system
leading to the back flow of sewage into the house
2.5 THE DRAIN FIELD
The drain field or soil absorption system is the most commonly used facility for
final treatment of septic tank effluent before discharge into the soil. The two
most common types are the trench type and the bed type. The effluent from the
septic tank flows to a distribution box from which the effluent is distributed to
a network of perforated pipes which then gradually release the effluent to the
soil. The soil just below the perforated pipes is a graded soil of porous
material. It is usually required that there be at least 4 feet (1.22m) of
unsaturated soil below the distribution pipes, in order to ensure that wastewater
undergoes a reasonable level of treatment by the soil before it joins the ground
water. While the septic tank removes most of the solid organics, the soil
absorption system is concerned with the removal of nitrates and pathogens.
Accumulation of organic matter and micro organisms just below the perforated
pipes results in the formation of a biological layer commonly called biomat.
The micro organisms act on the accumulated solids to degrade them. The
hydraulic and purification processes that occur when effluent passes through
the biomat and underlying unsaturated zone are closely linked. The relatively
long detention time in the unsaturated soil provides opportunity for treatment
processes such as oxidation, adsorption, pathogen die-off and ion exchange.
The drain field is an aerobic treatment system provided there is an adequate
depth of unsaturated soil below the field. The domestic wastewater undergoes
its most significant geochemical changes in the drain field, where it flows from

14
the biological mat to the water table (Wilhelm et al., 1994). When there is
adequate oxygen, the micro organisms can completely oxidize the reduced
wastewater components in the unsaturated zone. Anaerobic bacteria in the
septic tank transform the organic nitrogen in the wastewater to NH+
4- N
(ammonium nitrogen) while the aerobic bacteria in the drain field subsequently
oxidize the NH+
4-N to N0-3-N (nitrate nitrogen). Organic carbon is also
oxidized to CO2 and a certain fraction is removed by retention by sediments.
The most persistent contaminant in wastewater is the nitrate which is a
potential health hazard and can cause eutrophication in coastal, marine and
surface wasters. However, nitrates can be removed from wastewater by
denitrifying bacteria which are located deep down in the soil. These bacteria
require anoxic conditions as well as equal amounts of carbon and NO-3-N to
accomplish denitrification. In ground water settings, a lack of labile organic
carbon is the most common limitation to denitrification (Keeney, 1986).
Bouma et al. (1972) stated that not all soils are suitable for waste disposal.
Suitable soil should be reasonably permeable and well aerated (drained) so that
oxidation of the organic waste can take place (Canter and Knox, 1985).
Karathansis et al. (2006) noted that extremely fine soils and extremely coarse
textured soils are not ideal for the soil absorption system. This is because in
fine textured soil, solid particles may clog the soil pores making it difficult to
maintain adequate long term drainage, thus leading to system failure.
The soil absorption system can be limited in efficiency by number of factors.
i) Percolation Rate
Soils with percolation rates less than 5 minutes/inch or greater than 60
minutes/inch are not recommended for soils absorption system. Very high
percolation rates permit septic tank effluents to pass through the soil without
proper treatment. On the other hand, very low percolation rates can drastically
reduce the rate of wastewater movement which in turn can result in ponding of
septic tank effluent. This will create anaerobic conditions and a complete

15
failure of the entire system. The size of the drain field is usually dependent on
the percolation rate. The percolation rate is usually measured by digging about
six holes on the site where the drain field is to be located. The depth of the
holes should be the same as the depth of the distribution pipes (roughly 2 feet).
The holes are first filled with water and left for 24 hours to ensure that the soil
is saturated. Afterwards the hole is topped with water and the depth of water in
each hole is measured at a regular interval, usually thirty minutes. The
percolation rate is determined by dividing the time interval by the drop in water
level. Measurement is continued until each of any three consecutive calculated
rates varies by no more than 10 percent from the average of the three values
(Kansas State Department for Health and Environment, 1997)
ii) Depth to Bedrock or Water Table
High water table or shallow soil over rock is restrictive to the use of drain field.
A high water table will give rise to anaerobic conditions in the drain field and
allow pathogens to escape to ground water. Shallow soil over rock will not
provide sufficient soil for wastewater treatment. In addition, it will lead to
ponding which will give rise to anaerobic conditions. It is usually required that
the soil for drain field have at least four feet (1.22m) of suitable soil below the
distribution pipes. High water table and shallow soil over rock can lead to
hydraulic failure and treatment failure respectively. Treatment failure occurs
when contaminants are not fully removed from water because of an insufficient
depth of the aerated zone while hydraulic failure occurs when the water table
inundates the disposal pipes or reaches the ground surface, where overland
flow can transport the pollutants directly to the stream without adequate
treatment (Collick et al., 2006). Such soils can only be suitable for the mound
system of effluent treatment rather than the conventional drain field.
iii) Soil Surface Slope
Areas with slopes steeper than 20% will cause considerable difficulty during
construction and are not recommended for lateral field installation (KSDHE,

16
1997). Steep slopes can cause hydraulic failure when the septic effluent flows
laterally and surfaces downslope of the field (Collick et al., 2006). Drain fields
on very steep slopes can also be subject to erosion by high velocity runoff
which can lead to total destructions of the drain field.
Table 2.1: Soil Limitation Ratings Used by NRCS for Wastewater Absorption
Fields
PROPERTY
LIMITS
Slight Moderate Severe Restrictive feature
USDA Texture - - Ice Permafrost
Flooding None,
protected
Rare Severe Flood water inundates site
Depth to bedrock
(m)
> 72 in 40-72 in <40 in Bedrock or weathered
bedrock restricts water
movement or reduces
treatment capacity
Depth to
cemented pan (in)
> 72 in 40-72 in < 40 in Reduces water & air
movement
Permeability
(in/hr) 24-60 in
layer
less than 24 in
layer
2.0 – 6.0
-
0.6 – 2.0
-
< 0.6
> 0.6
Slow percolation rate, poor
drainage poor filter
Slope (%) 0-8 8-15 > 15 Difficult to construct and
hold in place
Layer stones
greater than 3 in
(% by wt)
< 25 25 – 50 > 50 Restricted water and air
movement results in
reduced treatment capacity

17
2.6 SEPTIC TANK FAILURE
Septic tank failure constitutes any situation that detracts from optimal
performance of the system. Septic tank failure is very common though
overlooked in many cases because the septic tank system is usually hidden
from sight. When septic tanks fail, they release nutrients and pathogens into
the environment (Geary and Gardner, 1998; Yates, 1985; Scalf et al., 1997)
such as groundwater, surface waters, swimming pools, farmlands etc. Jelliffe
(1995) reported septic tank failure rate as being higher than 40% in Australia.
Of the 48 septic tanks studied by Ahmed et al. (2005), 32(67%) needed
cleaning out, 23(48%) had soggy absorption fields, 4(8%) had structural
defects such as broken baffles or lids, 2(4%) had technical faults such as high
water table or the absorption system being too close to a water well, 3(6%) had
insufficient capacity, and only 7(15%) were well maintained.
Gordon (1989) identified causes of septic tank failure as: too small absorption
field, unsuitable depth or soil type, under sizing and improper design, high
water table, physical damage to plumbing works and lack of maintenance.
Another inevitable cause of septic tank failure with respect to effluent quality is
high density of septic tank systems in an area (Jelliffe, 1995).
With minimal maintenance and good practices, the septic tank can last very
long. Septic tank failure can be caused by the following:
i. Excessive accumulation of sludge and scum
Good practice requires that the septic tank should be desludged at intervals.
Failure to desludge the tank can cause excessive solids to be carried over to
the drain field and thus clogging it. When this happens, the drain field
becomes inundated with septic effluent leading to anaerobic conditions.
This usually gives rise to pungent smells indicating gaseous product of
anaerobic decomposition. Excessive sludge accumulation in the tank can
also cause back up of sewage into the house when the inlet pipes are
clogged.
18
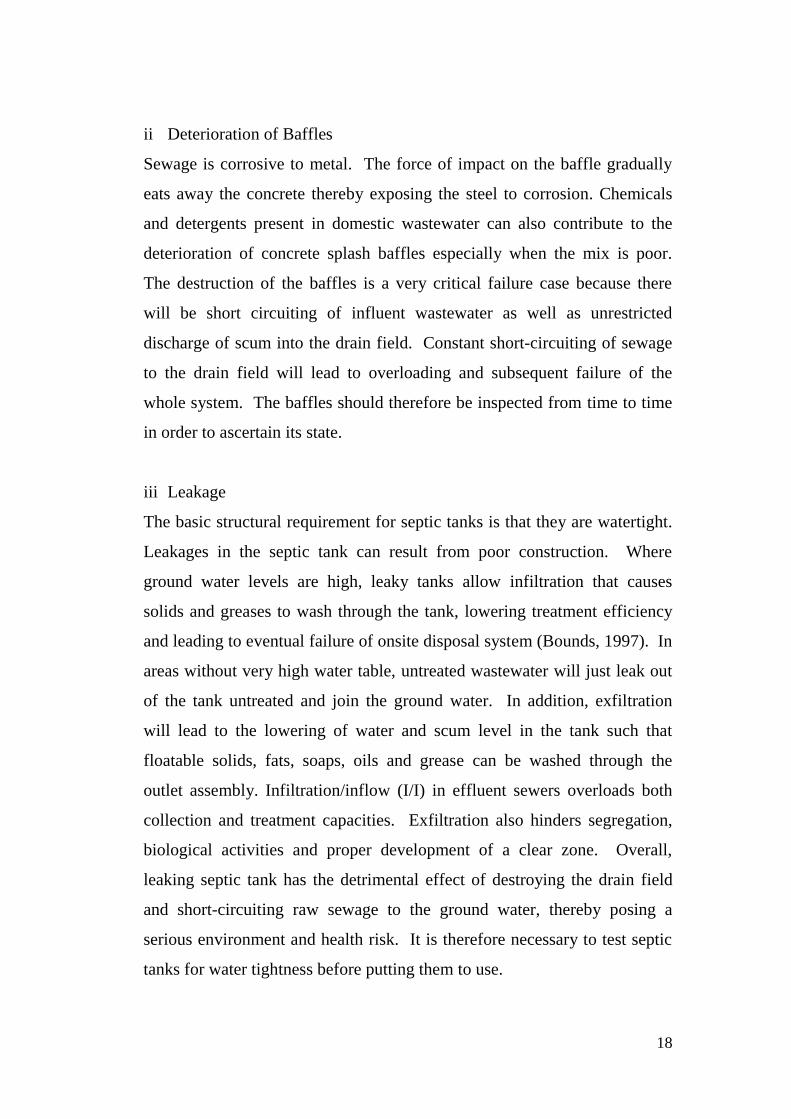
ii Deterioration of Baffles
Sewage is corrosive to metal. The force of impact on the baffle gradually
eats away the concrete thereby exposing the steel to corrosion. Chemicals
and detergents present in domestic wastewater can also contribute to the
deterioration of concrete splash baffles especially when the mix is poor.
The destruction of the baffles is a very critical failure case because there
will be short circuiting of influent wastewater as well as unrestricted
discharge of scum into the drain field. Constant short-circuiting of sewage
to the drain field will lead to overloading and subsequent failure of the
whole system. The baffles should therefore be inspected from time to time
in order to ascertain its state.
iii Leakage
The basic structural requirement for septic tanks is that they are watertight.
Leakages in the septic tank can result from poor construction. Where
ground water levels are high, leaky tanks allow infiltration that causes
solids and greases to wash through the tank, lowering treatment efficiency
and leading to eventual failure of onsite disposal system (Bounds, 1997). In
areas without very high water table, untreated wastewater will just leak out
of the tank untreated and join the ground water. In addition, exfiltration
will lead to the lowering of water and scum level in the tank such that
floatable solids, fats, soaps, oils and grease can be washed through the
outlet assembly. Infiltration/inflow (I/I) in effluent sewers overloads both
collection and treatment capacities. Exfiltration also hinders segregation,
biological activities and proper development of a clear zone. Overall,
leaking septic tank has the detrimental effect of destroying the drain field
and short-circuiting raw sewage to the ground water, thereby posing a
serious environment and health risk. It is therefore necessary to test septic
tanks for water tightness before putting them to use.

19
iv Clogging and Plugging of Drains
Plugging of drains can result from excessive accumulation of solids in the
tank or flushing of non biodegradable materials such as sanitary towels,
rags, cotton buds and plastic materials into the tank. These materials can
clog the septic tank inlet or any other part of the sewer. Plugged pipes will
cause sewage to back up into the house and cause wastewater to drain
slowly. Sometimes plugging can occur if the plumbing pipes used are of
too small diameters.
v Overloading
Diversion of surface and roof runoff to the septic tank can cause occasional
hydraulic overloading which will cause wastewater to leave the tank before
the design detention time. The use of macerators and garbage grinders for
disposal of waste food can cause rapid overloading of the septic tank.
Discharge of pesticides, herbicides and materials with high concentration of
bleach or caustic soda can also hamper the functioning of the septic tank.
For properly functioning septic tanks, occasional overloading can occur at
weekends or during holidays or festivals. In addition, if there are leakages
in the plumbing or tank, runoff can find its way into the tank thus giving
rise to overloading. Hydraulic overloading can be avoided by ensuring that
only wastewater from the home enters the tanks. Laundry activities can
also be spread out over the days than doing them in one day.
2.7 SLUDGE ACCUMULATION
Sludge accumulation is an intrinsic aspect of septic tank operation. Sludge
accumulation results from the settling of solids on the bottom of the tank. The
treatment quality of the tank is greatly diminished when excess sludge and
scum accumulate in the tank so that they start to be carried over into the
absorption field. Excess solid particles leaving the septic tank plug up the
leaching pipes and then there is no adequate distribution of the effluent and no

20
proper treatment of the waste in the drain field. It is important to estimate the
scum and solids accumulation rates in the septic tank in order to predict the
septage removal intervals. The most popular equations (Equations 2.1 and 2.2)
for estimating sludge and scum accumulation in the septic tank were obtained
by Bounds (1988) and Weibel et al., (1955) respectively.
675.047tN (2.1)
86.5039.13 tN (2.2)
Where
N = volume of septage accumulated in tank in US gallons per capita.
t = number of years of operation.
These equations are purely empirical in nature and have a statistical confidence
level of 95%, and predict the gallons per capita accumulated after any time
given in years. However, Bounds‟ equation (Equation 2.1) gives slightly higher
values of septage accumulation.
Seabloom et al. (2004) recalled that in 1980 and 2002, the USEPA
recommended that if the systems are not regularly inspected, the septic tank
should be pumped out every 3 to 5 years, depending on the size of the tank, the
number of building occupants, and household appliances. Bounds (1995)
opposed this stand, stating that such pump-out intervals were not supported by
scientific evidence, and suggested much longer intervals (Table 2.2).
21
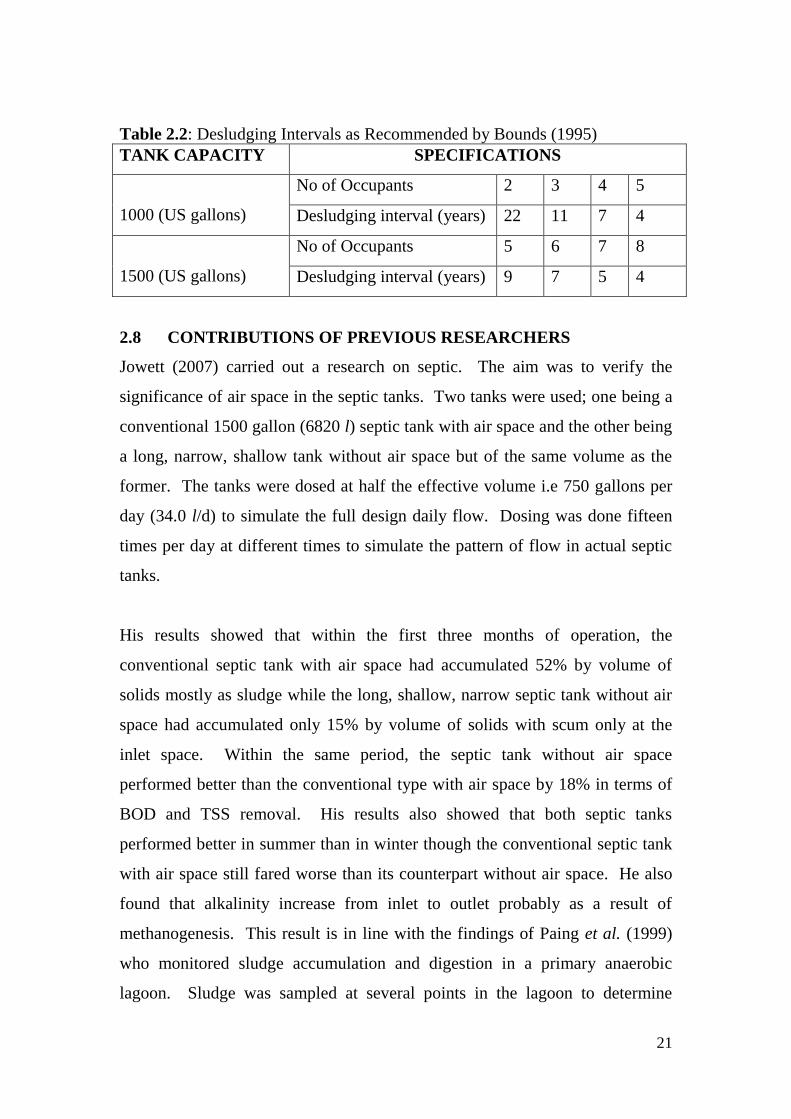
Table 2.2: Desludging Intervals as Recommended by Bounds (1995)
TANK CAPACITY SPECIFICATIONS
1000 (US gallons)
No of Occupants 2 3 4 5
Desludging interval (years) 22 11 7 4
1500 (US gallons)
No of Occupants 5 6 7 8
Desludging interval (years) 9 7 5 4
2.8 CONTRIBUTIONS OF PREVIOUS RESEARCHERS
Jowett (2007) carried out a research on septic. The aim was to verify the
significance of air space in the septic tanks. Two tanks were used; one being a
conventional 1500 gallon (6820 l) septic tank with air space and the other being
a long, narrow, shallow tank without air space but of the same volume as the
former. The tanks were dosed at half the effective volume i.e 750 gallons per
day (34.0 l/d) to simulate the full design daily flow. Dosing was done fifteen
times per day at different times to simulate the pattern of flow in actual septic
tanks.
His results showed that within the first three months of operation, the
conventional septic tank with air space had accumulated 52% by volume of
solids mostly as sludge while the long, shallow, narrow septic tank without air
space had accumulated only 15% by volume of solids with scum only at the
inlet space. Within the same period, the septic tank without air space
performed better than the conventional type with air space by 18% in terms of
BOD and TSS removal. His results also showed that both septic tanks
performed better in summer than in winter though the conventional septic tank
with air space still fared worse than its counterpart without air space. He also
found that alkalinity increase from inlet to outlet probably as a result of
methanogenesis. This result is in line with the findings of Paing et al. (1999)
who monitored sludge accumulation and digestion in a primary anaerobic
lagoon. Sludge was sampled at several points in the lagoon to determine

22
spatial variations. Their results show that more sludge accumulated at the inlet
than at the outlet due to higher methanogenic activities towards the outlet.
Wilhelm et al. (1994) reasoned that metanogenesis raises the alkalinity of
septic tank effluent. However Paing et al. (1999) and Jowett (2007) do not
agree on the spatial variation of volatile fatty acid in the tanks. While Jowett
(2007) reported that volatile fatty acids generally increase from inlet to outlet,
Paing et al. (1999) reported a decrease in volatile fatty acid from inlet to outlet.
Figure 2.1: Relationship between Air Space and Sludge Accumulation
(Source: Jowett, 2007)
Furthermore, Jowett (2007) concluded that the presence of air space is
disadvantageous to the general welfare of septic tanks (Figure 2.1). This
rubbishes the view of Baumann (1978) who was of the opinion that the air
space is a reservoir with two main functions: permanent storage of floating
scum and temporary storage of influent surges to decrease velocities through
the outlet pipe. Jowett (2007) & Dunbar (1907) countered by saying that the
air - water interface actually encourages vegetative moulds that trap sludge
particles rising on fermentation bubbles, creating a hard leathery scum layer
0%
10%
20%
30%
40%
50%
60%
Tank Air Space Tank Without Air Space
Slu
dge
Acc
um
ula
tio
n
Tank Modification

23
which could overturn and sink, causing resuspension and outflow of sludge.
They also stated that the scum can cause more nuisance by presenting
difficulties during pumping. However, it is counterproductive to recommend
that septic tanks be constructed without air space because the reserve space will
always be a functional component of the septic tank. Without the reserve space,
any blockage will result in the backup of sewage into the building. While
Jowett (2007) might have made an interesting discovery regarding air space,
the practicability of their findings remains elusive.
Rock and Boyer (1995) carried out a research on the effect of
compartmentalization and baffle type on the efficiency of septic tanks at the
University of Maine for a period of two years starting from 1992. First they
compared a single compartment tank with tee pipes acting as both inlet and
baffle, and another single compartment tank with a concrete splash baffle. The
tank with inlet-outlet baffle produced 20% better BOD removal than the tank
with concrete splash baffle while the tank with splash concrete baffle had a
better SS removal by 1% margin. The single compartment tank with inlet-
outlet baffle was next compared with a 2:1 double compartment tank with a
100mm elbow opening in the partition opening to serve as outlet for the first
compartment. The double compartment septic tank had the same inlet-outlet
baffles just like the single compartment tank. The single compartment tank
was found to produce effluent 23% better in BOD removal and 14% better in
TSS removal than the double compartment tank. Seabloom (1982, reported in
Seabloom et al., 2007) who also worked on compartmentalization obtained
similar result although of a bit different pattern. His own results showed that
the single compartment tank gave 17% better BOD and 69% better TSS
removal than the double compartment tank.
However, the double compartment tank improved when a larger opening was
provided in the partition wall. The slot was horizontal and covered 75% of the
width of the partition wall. The result was amazing: 11% better BOD removal

24
and 7% better TSS removal than the single compartment tank. If these results
are anything to go by, they should lay to rest the age-long controversy on
whether compartmentalization really does improve the quality of septic tank
effluent. Winneberger (1984) explains this phenomenon by saying that
velocities and turbulence affects the migration path of particles traveling
through the septic tank such that slow velocities yield the highest effluent
quality. He went on to say that the critical factor is the management of flow
through the septic tank not the geometric shape of the tank nor the size of the
second compartment. Bounds (1997) does not seem to be concerned about
compartmentalization hence he wrote: “regardless of number, size or shape of
supplemental compartments, the primary or first compartment‟s capacity
should be defined based on hydraulic loading, velocity through the tank,
reserve capacity, solids storage capacity and hydraulic retention time”. This
statement, sound as it may seem, is not in complete consonance with the more
recent research works of Jowett (2007) whose results suggest the elimination of
the reserve space being advocated by Bounds (1997).
Lay et al. (2005) in an attempt to contribute their own quota to the issue of air
space (reserve space) and compartmentalization, compared the performance of
four different septic tanks. The first was the conventional septic tank, (single
compartment with air space), the second was a 2:1 double compartment tank
with air space, the third was 2:1 double compartment tank without air space
while the fourth was 1:1 double compartment tank without air space. All the
tanks were of 4500l. Light expanded clay was used as surrogates for sludge
particles and dosing was done at the rate of 3.75 l/s. The result obtained show
that the conventional septic tank has the worst performance followed by the 2:1
double compartment tank with air space. The last two tanks without air space
did not allow short circuiting of solids even when the doing rate was increased.
According to Jowett and Lay (2005), the septic tank without air space provides
a „closed-conduit‟ flow similar to that in a flooded pipe or flooded cave, with
equal frictional drag on all sides of the tank: walls, ceiling and floor. This equal

25
frictional drag minimizes the velocity differentials between the center of the
tank and the sides thus prohibiting short circuiting. On the contrary, a tank
with air space is similar to an open channel which experiences unequal
frictional drag between the walls and floor, and the air space. This allows
greater velocity differential thus encouraging short circuiting.
Jowett and Lay (2005) used two interconnected narrow long and shallow tanks
to show that long and shallow configurations favour sludge particle capture and
thorough fermentation. Like Winneberger (1984), they concluded that flow
characteristics are more important than size alone. They reasoned that
differential flow velocities, causing unwanted higher velocity plume, increase
in tanks with shorter, wider and deeper aspects especially in those with point
source inlets and outlets like a septic tank. Higher velocity plumes produce
turbulent flow with eddies that resuspend solids and allow untreated sewage to
short-circuit to the outlet. This was also corroborated by Winneberger (1984)
using dye as a tracer in a short, partitioned model tank. Short circuiting was
witnessed in the short tank while no short circuiting was observed in a long,
meander model tank. Jowett and Lay were of the opinion that in order to
optimize separation of solids and to maximize retention time without short-
circuiting, the tank should encourage a well developed laminar flow regime.
In Egypt, Kamel and Hgazy (2006) worked with forty (40) modified septic
tanks in an attempt to improve the quality of septic tank effluents. The
modified septic tanks consisted of four sealed chambers arranged serially,
discharging into a fifth chamber filled with gravel. The first Chamber was 1m
long x 1m wide x 1.5m deep, the second chamber was 1m x 0.5m x 1.2m, the
third and fourth compartments were 1m x 0.75m x 1.2m each. Forty percent
(40%) of each of the third and fourth compartments was covered with gravel to
serve as filter beds. The compartment openings were such as to allow
alternating up flow and down flow discharge from compartment to
compartment. The fifth compartment was totally filled with gravel and acts as a

26
drain field from which effluent flows into the surrounding soil. Though the
inlet into the first compartment and outlet from the fourth compartment were
made of 3 inches tee pipes, the compartment openings were similar to that used
by Rock and Boyer (1995) in their compartmentalization studies.
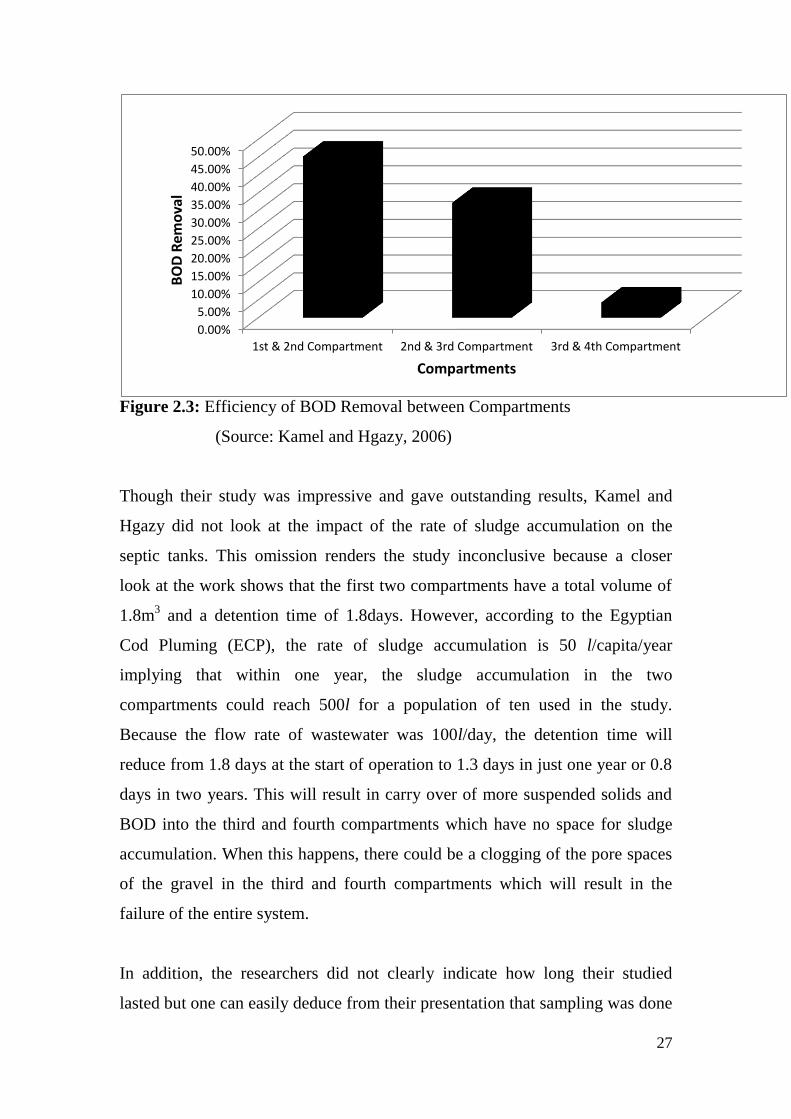
The results obtained show that the best performing tank gave a total of 83.7%
SS removal in this order: 43.3% between the first and second compartment;
33.7% between the second and third compartments; and 6.77% between the
third and fourth compartments (Figure 2.2). The overall best BOD5 removal
was 81.7% in this order: 45.2% between the first and second compartments,
32.22% between the second and the third compartments and 4.29% between the
third and the fourth compartments (Figure 2.3). They also recorded very high
pathogen removal with an almost complete elimination of salmonellae.
Figure 2.2: Efficiency of Suspended Solids Removal between Compartments
(Source: Kamel and Hgazy, 2006)
0.00%
5.00%
10.00%
15.00%
20.00%
25.00%
30.00%
35.00%
40.00%
45.00%
1st & 2nd Compartment
2nd & 3rd Compartment
3rd & 4th Compartment
Susp
end
ed S
olid
s R
emo
val
Compartment
27
Figure 2.3: Efficiency of BOD Removal between Compartments
(Source: Kamel and Hgazy, 2006)
Though their study was impressive and gave outstanding results, Kamel and
Hgazy did not look at the impact of the rate of sludge accumulation on the
septic tanks. This omission renders the study inconclusive because a closer
look at the work shows that the first two compartments have a total volume of
1.8m3 and a detention time of 1.8days. However, according to the Egyptian
Cod Pluming (ECP), the rate of sludge accumulation is 50 l/capita/year
implying that within one year, the sludge accumulation in the two
compartments could reach 500l for a population of ten used in the study.
Because the flow rate of wastewater was 100l/day, the detention time will
reduce from 1.8 days at the start of operation to 1.3 days in just one year or 0.8
days in two years. This will result in carry over of more suspended solids and
BOD into the third and fourth compartments which have no space for sludge
accumulation. When this happens, there could be a clogging of the pore spaces
of the gravel in the third and fourth compartments which will result in the
failure of the entire system.
In addition, the researchers did not clearly indicate how long their studied
lasted but one can easily deduce from their presentation that sampling was done
0.00%
5.00%
10.00%
15.00%
20.00%
25.00%
30.00%
35.00%
40.00%
45.00%
50.00%
1st & 2nd Compartment 2nd & 3rd Compartment 3rd & 4th Compartment
BO
D R
emo
val
Compartments

28
only once. If this was the case, then no valid conclusion can be drawn from
their results though they look good. This is because the septic tank is a
continuously operated system whose performance could be drastically affected
with the passage of time.
Rahman et al. (1999) investigated the influence of wastewater characteristics
on the performance of septic tanks. They used three different arrangements viz:
(i) Septic tank receiving only toilet wastewater,
(ii) Septic tank receiving toilet wastewater and kitchen waste
wastewater, and
(iii) Septic tank receiving toilet wastewater, kitchen wastewater and
bathroom wastewater (all purpose).
Their results show that the septic tank receiving the three kinds of wastewater
performed better than the other two, followed by the tank receiving toilet
wastewater and kitchen wastewater despite that the three arrangements have the
same volume. The reason is that discharging kitchen wastewater and bath water
into the septic tank dilutes its content. However, this will increase flow rate and
reduce the efficiency of fecal coliform, NO3- and PO4
- removal. Again, the
study period was too short and therefore insufficient to conclusively establish
any pattern. The researchers recommended a five day retention time for septic
tanks receiving only toilet wastewater, a three day retention time for septic
tanks receiving toilet wastewater and kitchen wastewater, and one day
detention time for an all purpose septic tank.
Büsser et al. (2006) reported in Nguyen et al. (2007) have a somewhat different
opinion about discharging grey water into septic tanks. They noted that grey
water can contain up to 50% of the COD of domestic wastewater. Nguyen et
al.(2007), based on their Vietnamese experience reported that discharging only
toilet waste (black water) into the septic tank can reduce the pollution load of a
household.

29
Nguyen et al. (2007) did a comparative study of the conventional septic tank
and its modified version in Vietnam between July 2004 and November 2005.
The modified septic tanks are baffled septic tank (BAST), baffled septic tank
with anaerobic filter (BASTAF) and septic tank with anaerobic filter (STAF).
The baffled septic tank is a type of compartmentalized septic tank with
partition openings located near the bottom of the tanks so that wastewater flows
into the second compartment in an up flow direction. This is to force more
contact between the wastewater and the sludge (biomass) in the tank to increase
the rate of biodegradation.
In their experiment, they used six plastic upright cylinders arranged serially so
that wastewater enters each one from the bottom and leaves through a tubing
connected near the top from which it then flows to the next cylinder. The up
flow velocity was so controlled as to avoid the wash out of sludge which can
cause the failure of the whole system. The baffled septic tank with anaerobic
filter is a further improvement on the septic tank by adding an anaerobic filter
chamber to the BAST. The filter materials were 60mm diameter plastic balls.
The study was aimed at determining the extent of improvement in effluent
quality provided by the modified septic tanks over the conventional type. For
the BAST, they found that the optimum number of up flow chambers is four
and that the optimum hydraulic retention time is 48 hours as increasing the
retention time beyond this will require more cost in terms of tank volume while
at the same time not producing any significant result above that observed for 48
hours hydraulic retention time. Typical results obtained are as follows: 55.7%
COD removal and 47.4 TSS removal for the conventional septic tank; 72%
COD removal and 70.4% TSS removal for the BAST system; 86.3% COD
removal and 90.8 TSS removal for the BASTAF system and 84.1% COD
removal and 84.7 TSS removal for the STAF system (Figure 2.4).

30
Figure 2.4: Efficiency of Treatment for Different Modifications of the Septic
Tank (Nguyen et al., 2007)
Nguyen et al.(2007) observed that adding an anaerobic filter chamber to either
the BAST or the conventional septic tank system gives an effluent quality
better than that of both the BAST and the conventional type. However, their
results indicate that the BASTAF system, though more complex, is not as cost
effective as the STAF system. For all its cost and complexity, the BASTAF
could only afford approximately 2% better COD removal, 5% better BOD
removal and 6% better TSS removal. In addition it was observed that effluent
quality started declining after two years. This prompted the researchers to
recommend a two-year desludging interval for the BASTAF.
It should be noted that Nguyen et al.(2007) carried out their research using both
laboratory scale models and full scales. However, they used black water (toilet
water) as influent into the laboratory scale models, while some of the full scales
received a combination of black water and grey water. In addition, they failed
to point out that the BAST and the BASTAF system could be subject to
resuspension of settled sludge if wastewater flow is not properly managed.
0%
10%
20%
30%
40%
50%
60%
70%
80%
90%
100%
COD TSS
BA
ST, 7
2%
BA
ST, 7
0.4
0%
BA
STA
F, 8
6.3
0%
BA
STA
F, 9
0.8
0%
STA
F, 8
4.1
0%
STA
F, 8
4.7
0%
Co
nve
nti
on
al T
ank,
55
.70
%
Co
nve
nti
on
al T
ank,
47
.40
%
Per
cen
tage
Rem
ova
l

31
Wilhelm et al. (1994) presented a conceptual model which borders on the
geochemical evolution of wastewater right from inflow into the septic tank to
the final stage when it joins the groundwater. They noted that the septic tank
itself is a zone of redox reactions catalyzed by micro-organisms. Because
domestic wastewater is composed mostly of organic matter, the micro-
organisms first hydrolyze the large organic compounds to simpler ones.
Carbohydrate is hydrolyzed to sinple sugar; protein is hydrolyzed to amino acid
while fat is hydrolyzed to fatty acid and glycerol.
The second stage is the conversion of simple sugar and amino acids into
organic acid acetate and H2. The fatty acids earlier produced by the hydrolysis
of fat and the intermediate organic acid produced from simple sugar and amino
acid undergo anaerobic oxidation in which protons accept electrons to form H2
in the presence of SO2-
4. The micro-organisms will use the So2-
4 to oxidize
organic carbon to produce CO2 and S2-
. Finally methanogenic bacteria then use
acetate or CO2 and H2 to produce CH4. It was also observed that most of the
nitrate-nitrogen (No-3 -N) in the influent are usually converted to ammonium-
nitrogen (NH+
4 –N) which is usually denitrified in the absorption field while
10% to 30% of the total organic nitrogen is removed by sludge storage (Laak
and Crates, 1978). They further noted that the production of organic acid by
fermentation and the formation of H2 by oxidation usually reduce the alkalinity
of the septic tank effluent while the reduction of SO2-
4 and the consumption of
acetate by methanogenesis usually raise alkalinity thus maintaining a balance.
If however, methanogenesis is inhibited by low pH, then the pH of the effluent
will drop precipitously (Grady and Lim, 1980).
Burubai et al. (2007) used modified septic tanks, similar to those used by
Kamel and Hgazy (2006), to improve septic tank effluent in Rivers State of
Nigeria which is a high water table area. The Kansas State Department of
Health and Environment (1997) recommends at least four (4) feet of
unsaturated aerated) soil below the bottom of the soil absorption field to ensure

32
adequate treatment. The set up consist of a three compartment septic tank: two
are for sedimentation while the third acts as a sand filter from which partially
treated wastewater flows into the drain field. The aim was to achieve a high
level of treatment in the septic tank by augmenting with the sand filter so that
the more or less inefficient soil absorption field will have less work to do. This
is similar to those of Kamel and Hgazy (2006) in that, their own set up
consisted of two sedimentation chambers leading to two gravel filtration
chambers whose final effluent flowed into the drain field.
Burubai et al.(2007) monitored three of the full scale set up sited in an area
where the water table was less then 100mm (4 in) below the surface. The drain
field consisted of perforated pipes covered with graded sand and gravel under
gravity flow. The effluent from the soil absorption field was collected by
means of a horizontal screened outlet below the field.
The initial results obtained show that the effluent quality for BOD, COD, TSS
and fecal coliform fell within both local and international standards within the
first one year. Effluent quality started declining from around the 15th
month and
this was attributed to filter clogging. The result is interesting but the researchers
did not indicate whether they also collected samples from the septic tank
effluent. This would have enabled them estimate what percentage of the
treatment was contributed by the drain field. In fact taking effluent from each
unit would have helped them know which unit was the most efficient and
which one was the least viz-a-viz cost. However, intuitively, one can easily
come to the conclusion that the drain field was inefficient as 4 inches of soil
will easily be overwhelmed by the effluent. Moreover, Burubai et al.(2007) did
not say how to maintain or revive the failed filter after fifteen months. Their
cost estimate also shows that the cost of the modified septic tank was 57%
higher than that of the conventional septic tank and yet it failed in fifteen
months. If satisfactory answers can be given to the issues raised so far, then this
modified septic tank can be extended to cover other areas where such

33
restrictive soil factors as high percolation rate, very low percolation rate and
very steep slopes render the septic tank system inefficient.
Koottatep et al. (2004) conducted a research similar to that of Nguyen et al.
(2007) using a slightly different experimental set up. While Nguyen et
al.(2007) used a number of standing cylindrical units to emulate baffled septic
tanks with anaerobic reactors, Koottatep et al.(2004) used a set up which better
approximates an actual septic tank. The set up of Nguyen et al. seem over
idealized as it is not yet clear how their set up can be executed on site.
Koottatep et al.(2004) used four laboratory scale models of dimensions (64 cm
long x 25cm wide x 40 cm high) with vertical standing and hanging baffles to
imitate an anaerobic baffled reactor (ABR). Just like Nguyen et al.(2007), their
reason for this was to ensure more contact between wastewater and biomass in
the sludge zone. The description of the four experimental set up are as follows:
reactor A - two baffles; reactor B - three baffles; reactor C – two baffles with
anaerobic filter and reactor D – conventional septic tank with two
compartments serving as a control unit. The reactors were subjected to strong
wastewater being a combination of septage from Bangkok and wastewater from
the Asian Institute of Technology (AIT). The flow rate of wastewater was such
as to give 24 hours and 48 hours detention times, respectively.
Their results show that at 24 hours detention time, there was no significant
difference between three baffled reactor the two baffled reactor in BOD, COD
and TS removal (Figures 2.5 & 2.6). But as the detention time was increased to
48hours, the performance of the two baffle reactor with anaerobic filter
improved over the three baffled reactor, while the performance of the three
baffled reactor remained fairly constant. In fact, a closer look at their results
revealed that the improved septic tanks performed much better than the
conventional septic tanks at low detention times such as 24hrs. However, as the
detention time increased the performance of the conventional septic tanks
improved and even recorded a better performance in SS removal than the three

34
baffled reactor. They however, noted that the three-baffled reactor is more
robust than all the others. When subjected to both shock loading and fluctuating
loading, the other reactors responded by a fluttering performance while the
three baffled rectors maintained a fairly constant performance irrespective of
loading.
Their results also showed that the two-baffled reactor performed better than the
two-baffled reactor with anaerobic filter. This is not in order because the
anaerobic filter is meant to effect more treatment in addition to the work done
by the baffles. The researchers did not point out this anomaly in their result but
one can deduce that this incongruence is due to experimental error.
Figure 2.5: Efficiency of Treatment Versus Number of Baffled Reactors
(Source: Koottatep et al., 2004)
The researches however, jumped to a hasty conclusion about the three-baffled
reactor by stating that “the shorter the hydraulic retention time (HRT), the
0%
10%
20%
30%
40%
50%
60%
70%
80%
90%
COD BOD TS SS TKN TP
2-B
affl
e
2-B
affl
e
2-B
affl
e
2-B
affl
e
2-B
affl
e
2-B
affl
e
3-B
affl
e
3-B
affl
e
3-B
affl
e
3-B
affl
e
3-B
affl
e
3-B
affl
e
2-B
affl
e +
Filt
er
2-B
affl
e +
Filt
er
2-B
affl
e +
Filt
er
2-B
affl
e +
Filt
er
2-B
affl
e +
Filt
er
2-B
affl
e +
Filt
er
Co
ntr
ol
Co
ntr
ol
Co
ntr
ol
Co
ntr
ol
Co
ntr
ol
Co
ntr
ol
Rem
ova
l Eff
icie
ncy

35
smaller the size of the reactor required”. This cannot be correct. There is
certainly an optimum detention time below which the reactor cannot attain the
desired performance and above which, efficiency may not increase
considerably. In fact Nguyen (2007) reported an optimum detention time of 48
hours.
Figure 2.6: Efficiency of COD Removal for Different Modifications of the
Septic Tank at Various Detention Times (Source: Koottatep et al., 2004)
The discharge of chemical such as water softener and disinfectants into the
septic tanks has been a source of worry to septic tank experts. It has been
reported that water softeners resuspend solids and cause them to be washed out
of the tank with effluents while disinfectants adversely affect the microbiology
of the tank resulting in reduced treatment efficiency or total failure.
Washington et al. (1998) performed an experiment with a view to determining
the fate of absorbable organic halide from household bleach in a septic tank and
assessing the effect of bleached laundering on septic tanks. They noted that the
COD removal fell from 40-50% for a septic tank receiving toilet wastewater to
25-35% when laundry water was added (Figure 2.7). Gross (1987) determined
0%
10%
20%
30%
40%
50%
60%
70%
80%
90%
24hr Retention Time 48hr Retention Time
3 B
affl
es A
BR
3 B
affl
es A
BR
2 B
affl
es A
BR
wit
h A
F
2 B
affl
es A
BR
wit
h A
F
\Tw
o C
om
par
tmen
t Se
pti
c Ta
nk
Two
Co
mp
artm
ent
Sep
tic
Tan
k
Per
cen
tage
CO
D R
emo
val
36
the effects of liquid chlorine bleach, high test hypochlorite (HTH), Lysol and
Drano crystal on the performance of the septic tanks. All four chemicals used
are common household disinfectants. He found that the discharge of these
chemicals into the septic tanks led to a drastic reduction in the microbial
population in one septic tank. Slug concentrations of these disinfectants were
found to be more detrimental to the septic tank than a gradual dosage.
However, the septic tank recovered quickly after the use of the disinfectants
was discontinued. This is similar to the observation of Novac et al. (1990) who
is however of the opinion that the septic tank will not recover completely if the
household disinfectants are dosed beyond a certain critical concentration.
Below this dosage the septic tank would recover as the chemical will be flushed
out by new wastewater without chemical.
Vaishar and McCabe (1996) investigated the effects of household chemical on
three parametric indicators of the efficiency of the septic tank namely:
microbial activities, settling of solids and the adsorption of these chemicals to
the septic tank sludge. Using an anaerobic sludge respiration test as measure of
the level of microbial activities taking place in the tank, they found that the 96-
hour no - effect concentration (NOEC) is 625ml. They concluded that dry
bleach in septic system is acceptable so long as solid settling is not adversely
affected.

37
Figure 2.7: Efficiency of Treatment versus Wastewater Composition
(Source: Washington et al., 1998)
Ignatius and Jowett (2004) investigated the effect of two household
disinfectants on the performance of the septic tank. One is a two-tablet sanitary
bleach puck system which is a chlorine based disinfectant while the other is
granular laundry detergent, an oxygen based bleach. Four laboratory scale
septic tanks were used in this research. The first was control receiving only
wastewater, the second received wastewater and the two-tablet sanitary bleach
puck, the third received wastewater and the granular laundry detergent while
the fourth received wastewater and both chemicals. Results show that a
combination of both chemicals has more effect on the performance of the septic
tank followed by the granular laundry detergent. Surprisingly, it was found that
the septic tank receiving wastewater and the chlorine based bleach performed
better than the other system. This better performance was however not
significant when compared with the control. The reason the chlorine based
bleach did not have any noticeable effect on the performance of the septic tank
was explained by the researchers. Raw sewage contains a high concentration of
ammonia which will normally react with the chlorine in the bleach. The
oxidizing power of free chlorine is inactivated by reaction with ammonia
(Washington et al., 1997).
0%
5%
10%
15%
20%
25%
30%
35%
40%
45%
Sewage Only Sewage & Laundry Water
Ave
rage
CO
D R
emo
val

38
The researchers used only two parameters in their research viz: biochemical
oxygen demand (BOD) and fecal coliform. This is not commendable as the
primary function of the septic tank is suspended solids removal. The work
would have been more realistic if suspended solids had been included in the
parameters of interest. Moreover, the wastewater used was not strictly raw
wastewater. They diverted effluent from a biofilter which has already reduced
the characteristics of the wastewater. For instance, the wastewater used has a
BOD ranging from 13-79mg/l which in some cases is even lower than that from
properly functioning septic tanks.
The most critical effect of failure of the septic tank to effectively treat
wastewater can be witnessed in its impact on ground water quality. A failed
septic tank is most likely to result in failure in the drain field which will then
respond by transmitting improperly treated wastewater to the groundwater. As
mentioned earlier, nitrate (NO3-) is the most persistent pollutant in wastewater
because of its conservative nature. Sinton (1982) and Close et al. (1989) found
elevated NO3- levels and locally high level of fecal coliform in groundwater as
a result of carryover of pollutants from the drain field. Wilhelm et al. (1994)
observed that denitrifying bacteria need labile carbon in order to effectively
reduce NO3- to nitrogen. They however, noted that by the time the wastewater
gets to the denitrifying zone, there will be little or no carbon left to act as
electron acceptor. The result of this is that dentrification will be grossly
hampered resulting in the discharge of elevated levels of NO3- into
groundwater.
Still on the impact of improperly treated wastewater on groundwater, Pang et
al. (2006) developed a ground water transport model using HYDRUS 2D
which is a Microsoft Window based finite element model. The model was used
to evaluate the effect of clustered septic tanks on the quality of ground water in
Yaldhurst area of Christ Church, New Zealand. Their results show that

39
clustered septic tanks resulted in an increase in the NO3- levels of groundwater
in the area under investigation. The model showed that a distance of 2.9km is
needed between septic tanks in order to affectively attenuate the NO3- level in
ground water. This distance was found sufficient to bring nitrate concentrations
to background levels. They were quick, however to observe that this separation
distance is impracticable and recommended more efficient treatment in the
septic tank system. They also found that depth of 10m below the ground water
level was needed for effective dilution of the nitrate level. Hence they
recommended that water wells should penetrate 10m below the ground water
level.
The same model was applied to fecal coliform transport in ground water.
Results obtained show that fecal coliform had only a localized impact. No
cumulative effect as a result of clustering was observed. They stated that there
is no correlation between microbial contamination and distance in the direction
of ground water flow. The reason for this is that unlike nitrates, fecal coliform
was easily removed by straining, attachment and die-off in the unsaturated
zone. Moreover, the hydraulic conductivity, initial concentration of NO3- and
discharge rate were found to have the much more significant influence on NO3-
transport than nitrification rate coefficient, longitudinal dispersivity and
absorption coefficient of NH4+. Nitrate concentration is directly proportional to
flow rate and initial nitrate concentration but inversely proportional to
hydraulic conductivity.
Ahmed et al., (2005) used a biochemical fingerprinting method to assess septic
tank failures with specific emphasis on surface water contamination in
Australia. They collected effluents from 39 septic tanks as well as water
samples from creeks upstream and downstream of the septic tanks. The
samples were tested for E.coli and m-enterococcus and the fecal indicators
were typed using PhPlate; PhPlate AB fingerprinting method. For
enterococcus, they found a total of 100 biochemical phenotypes with 31 being

40
common to some of the septic tanks and 79 being unique to individual septic
tanks. For E.coli, they found a total of 114 biochemical phenotypes with 27
being common to some of the septic tanks and 87 being unique to individual
septic tanks. When the number of fecal indicators in the septic tank effluents
was compared with that of the creek waters in the septic tank environment, it
was found that the creek water samples had higher numbers of fecal indicators
as well as more biochemical phenotypes. This was attributed to the fact that the
creek waters received bacteria from diffuse sources such as animal farms or
industrial processes via runoff, in addition to septic tank effluent. They also
suggested that not all fecal indicators that entered the septic tanks survived the
septic tank activity, implying that certain species of fecal indicators are more
resistant to the septic tank processes. They also discovered that in cases where
identical biochemical phenotypes were found in water samples and septic tank
effluents, the number of enterococcus was more than that of E.coli indicating
that enterococcus is more resistant than E.coli. This position was also shared by
Baudisöva (1997). Furthermore, they found that the strains of fecal indicators
present in the properly maintained septic tanks were absent from the creek
water samples while this was not the case for the failing septic tanks. Hence,
they concluded that well maintained septic tanks do not contribute fecal
bacteria to surface waters.
Nicosia et al. (2001) studied the removal of bromide and bacteriophage in
septic tank drain field. They found that rainfall and the presence of organic
matter reduce the rate of virus removal from septic tank effluent in the drain
field. Inactivation was found to be the major mechanism of virus removal.
Removal by absorption was not so significant as rainfall results in the
desorption of adsorbed bacteriophage. Moreover organic matters compete with
virus for adsorption sites thus resulting in the decrease in virus removal
efficiency with time.
41
Collick et al. (2006) developed a model for predicting the failure of septic tank
drain field in sloping terrains. The model revealed that failure may not occur in
the drain field itself but the flux of septic effluent to a portion down slope can
lead to failure of that portion which may not be a part of the drain field. When
the soil depth and conductivity of a soil portion up slope of the drain field are
both low, the failure rate in the drain field itself will reduce. This is because
this decrease in soil depth and hydraulic conductivity will result in increased
runoff being generated from the field upslope. This runoff will infiltrate in the
septic effluent disposal field (without causing the water table to rise above the
perforated pipe), and the overall system drains faster due to high saturated
conductivity of the septic field resulting in a generally lower water table. In
addition, a conductivity of less than 1m/day and a slope greater than 4% gave
rise to a 100% failure rate in the drain field. The reason is that these conditions
encourage plugging which will prevent fast drainage of water and a subsequent
rise in water table.
Al-Layla and Al-Rawi (1989) studied the performance of several septic tanks in
the Mosul City of Iraq. They found that a number of the septic tanks were
performing poorly as a result of high water table, absence of inlet tees or
elbows and poor soil types. They also observed that some of these tanks
experienced rapid filling with sludge, thus necessitating desludging within
short intervals ranging from two weeks to six months. They suggested that the
poor performance of the septic tank system was due to poor design especially
with respect to inlet and outlet structures. It was, however, noted that some of
the tanks achieved high levels of pollutant removal due to their long detention
times (approximately 10 days).

42
CHAPTER THREE
METHODOLOGY
3.1 DATA COLLECTION
Data for this research was collected from questionnaires, pilot scale septic
tanks and other sources.
3.1.1 Preliminary Study (Questionnaires)
In order to have an overview of the condition of septic tanks as well as
practices common among septic tank users in Nigeria precisely, using Nsukka
as a case study, two hundred questionnaires were distributed in the following
proportions:
Contractors – 50
Landlords – 50
Tenants – 100
Respondents were randomly selected and questionnaires administered to them.
Out of the 200 questionnaires distributed to contractors, landlords and the
tenants, 144 were completed and returned, while a total of 56 questionnaires
were not retrieved.
3.1.2 Pilot Scale Septic Tanks
Five rectangular pilot scale septic tanks were constructed with metal sheets and
painted on the inside to check the rate of corrosion given that raw sewage is
known to be corrosive. All the tanks had the same dimensions (78cm long,
50cm wide and 50cm deep) but different dosing rates. Table 3.1 is a summary
of the description of the pilot scale tanks. Four of the tanks were dosed with
sewage at different rates to simulate one, two, three and four days detention
times. The fifth one was dosed to simulate one day detention time but its inlet
pipe was positioned at the edge instead of centrally like the other four. All the
inlets consisted of one inch PVC pipe entering the tanks at 0.4m above the

43
bottom and bent downwards to serve as a baffle hence directing the influent
downwards. The effluent pipes also were 25.4mm (one inch) in diameter. Each
of the tanks was perforated midway on the top so that samples could also be
collected from the middle of the tanks in order to monitor treatment progress
along the tank. The perforations were fitted with a one inch PVC cork to keep
away oxygen. The inlet of each tank was fitted with a stop cork and connected
to a concrete reservoir through a central one inch pipe. Raw sewage was then
pumped from the inlet of the Imhoff tank of the University of Nigeria, Nsukka
central waste treatment plant to the reservoir using a model 30WPX Techno
water pump fitted with a three inch hose. Samples were scheduled to be
collected twice a week from August to December 2010, however, this schedule
could not be followed religiously because of inadequate personnel at the
laboratory. While this part of the research was in progress, final year
undergraduate students commenced their projects which caused facilities at the
laboratory to be overstretched.
Samples were collected from the outlets and the midpoints of these tanks and
immediately sent to the Civil Engineering Laboratory, University of Nigeria,
Nsukka for physicochemical and microbial analyses. Sample were collected
from the midpoint of the tanks using a 10ml pipette fitted with a rubber pipette
filler and subsequently transferred to a 1 litre plastic can. This was repeated
severally until the can was filled up. Samples collected were analyzed for
biochemical oxygen demand (BOD), suspended solids (SS), chemical oxygen
demand (COD) pH, dissolved oxygen (DO) and E.coli according to the
Standard Methods (1992). Dissolved oxygen was measured in situ using a
dissolved oxygen meter by inserting the electrode in the tank through the
midpoint perforations. Temperature measurements were also made in situ
during sampling.

44
Table 3.1: Description of Pilot Scale Units
Tank Detention
Time(days)
Volume(m3) Inlet Position Baffle
A 2 0.156
Skewed to edge Metal splash baffle
B 2 0.156 Centred PVC tee
C 1 0.156 Centred PVC tee
D 3 0.156 Centred PVC tee
E 4 0.156 Centred PVC tee
Fig 3.1: Generalized Sketch of Experimental Set up

45
Fig 3.2: Picture of Experimental Set up
Flow Characteristics
The septic tank operates optimally under quiescent conditions. The presence of
turbulence or hydraulic jumps will result in the resuspension of settled solids.
Hence, it was ensured that the pilot scale tanks conformed to the same
operational conditions as the full scale tank. The hydraulic characteristics of the
pilot scale septic tanks have been tabulated in Table 3.2. The flow
characteristics of concern are the Froude number (Fr) and the Reynolds number
(Re). In actual practice, the septic tank system is not a continuous flow system
but rather an intermittent flow system. Hence, two kinds of hydraulic
characteristics were considered. The Reynolds number and Froude number for
intermittent flow are designated as Re(int) and Fr(int) respectively while those
for continuous flow are designated as Re(con) and Fr(con) respectively. For the
continuous flow, the velocity is obtained by spreading out the flow throughout

46
the day while, for the intermittent flow, the discharge is obtained by dividing
the total volume of flow by the actual time of flow, hence ignoring idle times.
The hydraulic characteristics of the inlets have been tabulated in Table 3.3.
Table 3.2: Hydraulic Characteristics of Tanks
Tank Fr(con) Fr(int) Re(con) Re(int) Condition
A 0.000002 0.000110 0.000731 0.035073 Subcritical Laminar
B 0.000002 0.000110 0.000731 0.035073 Subcritical Laminar
C 0.000005 0.000220 0.001462 0.070164 Subcritical Laminar
D 0.000002 0.000073 0.000487 0.023352 Subcritical Laminar
E 0.000001 0.000055 0.000363 0.017447 Subcritical Laminar
Table 3.3: Hydraulic Characteristics of Inlet Pipes
Tank Fr(con) Fr(int) Re(con) Re(int) Condition
A 0.000009 0.000440 0.000046 0.002192 Subcritical Laminar
B 0.000009 0.000440 0.000046 0.002192 Subcritical Laminar
C 0.000018 0.000880 0.000091 0.004385 Subcritical Laminar
D 0.000006 0.000293 0.000030 0.001460 Subcritical Laminar
E 0.000005 0.000219 0.000023 0.001090 Subcritical Laminar
3.1.3 Laboratory Analysis
All samples collected for laboratory analysis were analysed immediately they
were brought into the sanitary laboratory. Sample which could not be analysed
on the collection day were preserved in the refrigerator and analysed the
following day. The laboratory analyses of samples were done in accordance
with the Standard methods (1992). Owing to the sensitivity of the dissolved
oxygen level, it was determined in-situ. The test was done using dissolved
oxygen (DO) meter. The DO meter was switched on and left to acclimatize.
After which the electrode of the DO meter was dipped inside the tank until a
steady value was obtained from the meter. The steady value which is given in
mg/l was recorded as the dissolved oxygen level of the pilot scale tank. The
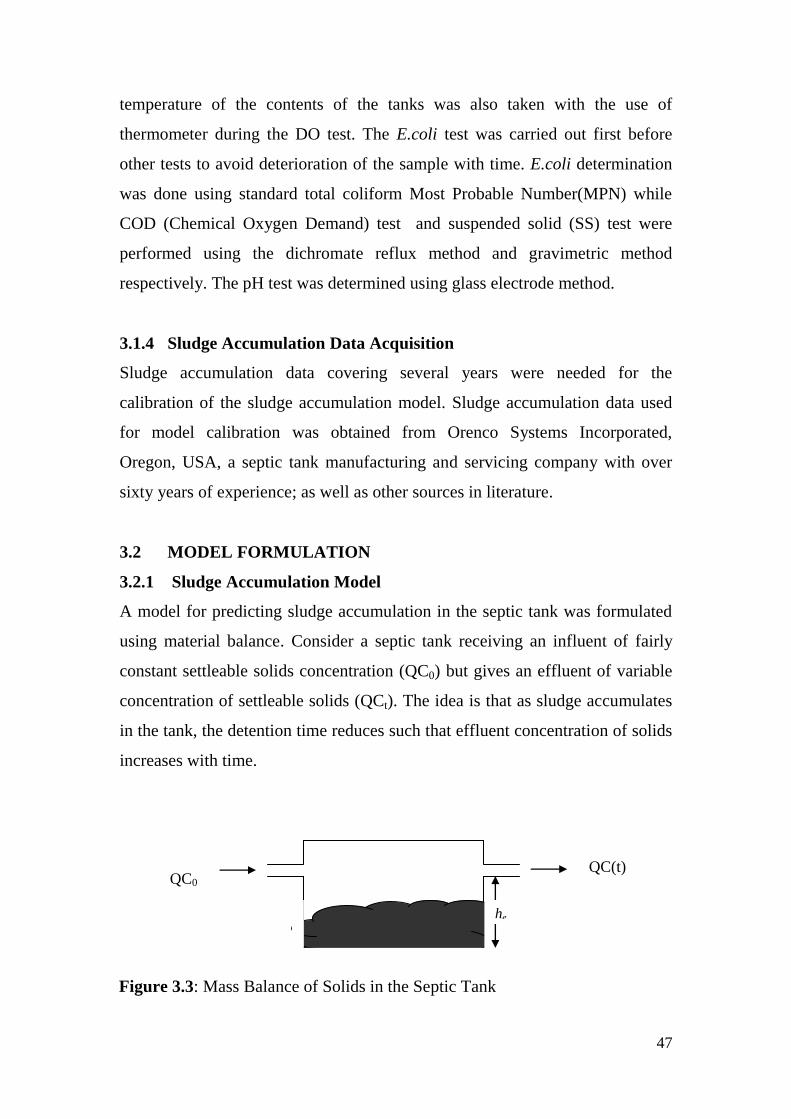
47
temperature of the contents of the tanks was also taken with the use of
thermometer during the DO test. The E.coli test was carried out first before
other tests to avoid deterioration of the sample with time. E.coli determination
was done using standard total coliform Most Probable Number(MPN) while
COD (Chemical Oxygen Demand) test and suspended solid (SS) test were
performed using the dichromate reflux method and gravimetric method
respectively. The pH test was determined using glass electrode method.
3.1.4 Sludge Accumulation Data Acquisition
Sludge accumulation data covering several years were needed for the
calibration of the sludge accumulation model. Sludge accumulation data used
for model calibration was obtained from Orenco Systems Incorporated,
Oregon, USA, a septic tank manufacturing and servicing company with over
sixty years of experience; as well as other sources in literature.
3.2 MODEL FORMULATION
3.2.1 Sludge Accumulation Model
A model for predicting sludge accumulation in the septic tank was formulated
using material balance. Consider a septic tank receiving an influent of fairly
constant settleable solids concentration (QC0) but gives an effluent of variable
concentration of settleable solids (QCt). The idea is that as sludge accumulates
in the tank, the detention time reduces such that effluent concentration of solids
increases with time.
QC0
QC(t)
he
Figure 3.3: Mass Balance of Solids in the Septic Tank

48
The mass of sludge dM accumulated in the tank in time dt can be expressed as
follows.
tQCQCdt
dM 0 (3.1)
If we consider the fact anaerobic decomposition will normally reduce the
volume of the accumulated sludge by 40 to 50% producing methane (CH4),
carbon IV oxide (CO2), water(H2O) and hydrogen sulphide (H2S) gases
(Seabloom et al., 1982; USEPA, 2000), then Equation (3.1) translates to
)( 00 tQCQCktQCQCdt
dM (3.2)
M = mass of sludge accumulated at time t
Q = Flow rate (m3/s)
C0 = Influent concentration of settleable solids (mg/l)
C = Effluent concentration of settleable solids (mg/l)
k = rate constant of degradation by bacteria(day-1
)
However, though the bacteria converts some sludge to gas thus reducing the
quantity of sludge in the tank, the bacteria will multiply as they consume the
sludge so that the net quantity of sludge actually converted to sludge is given
by
Net decrease in sludge mass = Mass of sludge consumed by bacteria -
Increase in bacteria mass.
But increase in bacteria mass is proportional to mass of sludge consumed that
is:

49
tQCQCkdt
dX 0 (3.3)
Where = Yield coefficient (no unit)
Therefore
kktQCQCmasssludgeindecreaseNet (0 (3.4)
Rewriting Equation (3.2) to incorporate bacteria mass contributing to sludge
mass, Equation (3.2) becomes:
tQCQCktQCQCktQCQCdt
dM 000 (3.5)
Because the concentration of effluent solids increases as sludge accumulates in
the tank ie increase in effluent concentration of solids is proportional to sludge
accumulation. This can be expressed mathematically as
dt
dM
dt
dC (3.6)
Where is a proportionality coefficient.
Equation (3.6) follows from the result obtained by Heins et al. (1999) as shown
in Figure 3.4.
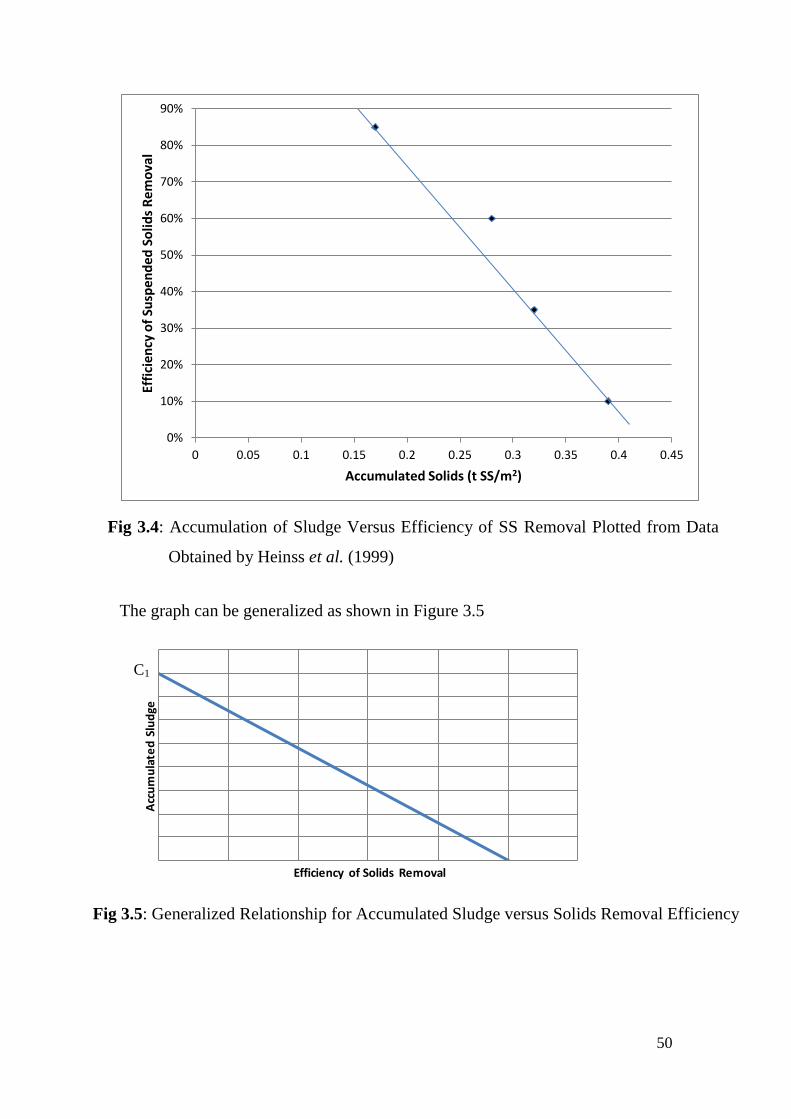
50
The graph can be generalized as shown in Figure 3.5
Acc
um
ula
ted
Slu
dge
Efficiency of Solids Removal
0%
10%
20%
30%
40%
50%
60%
70%
80%
90%
0 0.05 0.1 0.15 0.2 0.25 0.3 0.35 0.4 0.45
Effi
cien
cy o
f Su
spen
ded
So
lids
Re
mo
val
Accumulated Solids (t SS/m2)
C1
Fig 3.4: Accumulation of Sludge Versus Efficiency of SS Removal Plotted from Data
Obtained by Heinss et al. (1999)
Fig 3.5: Generalized Relationship for Accumulated Sludge versus Solids Removal Efficiency

51
From the graph, it follows that
(3.6b)
M = mass of sludge
= intercept (having a dimension of mass)
n = efficiency of solids removal (no unit)
= slope (having a unit of mass)
0
0
C
CCM (3.6c)
C0 = Influent concentration of settleable solids (mg/l)
C = Effluent concentration of settleable solids (mg/l)
CC
M0
(3.6d)
Recalling that dt
dM
dt
dC then
0
1
CdC
dM
This implies
0C (3.6e)
Knowing C0, can be determined from the graph M versus C and hence can
also be determined. The unit of is m-3
Hence dt
dMC
dt
dC
0 (3.7)
Differentiating Equation (3.5) yields Equation (3.8):
dt
dCkkQ
dt
Md1
2
2
(3.8)
Substituting Equation (3.7) in Equation (3.8) gives Equation (3.9) as follows:
nM
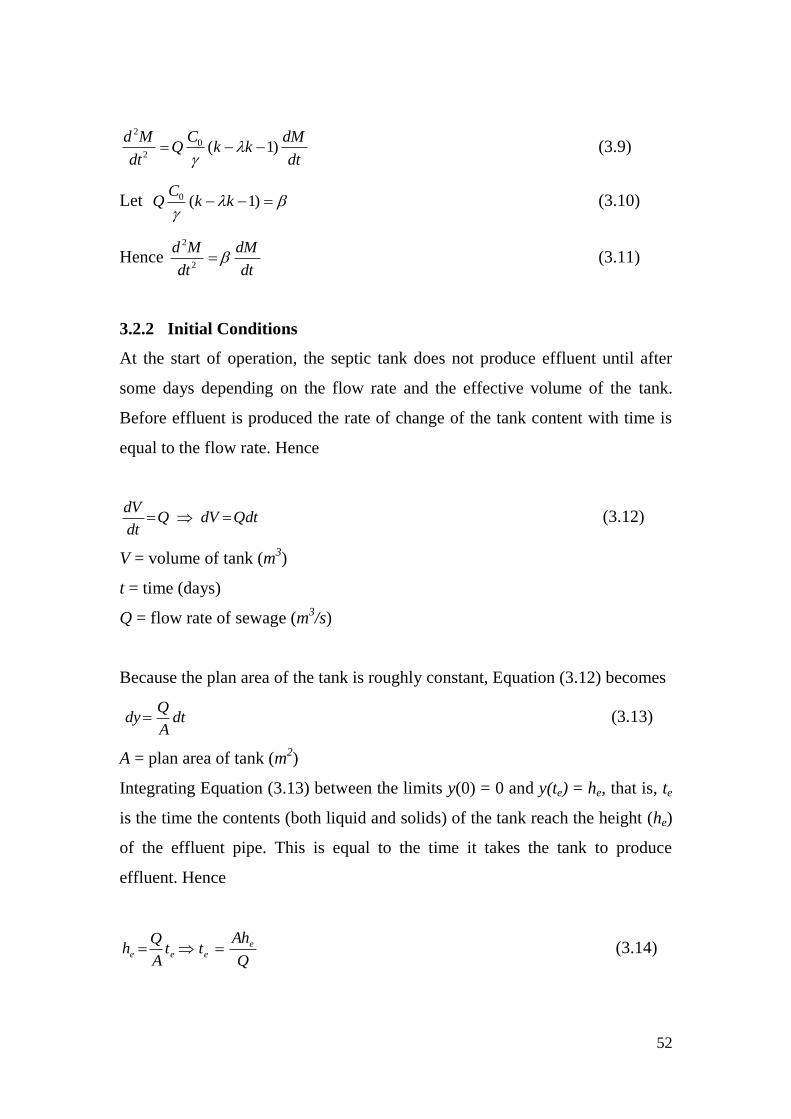
52
dt
dMkk
CQ
dt
Md)1(0
2
2
(3.9)
Let
)1(0 kkC
Q (3.10)
Hence dt
dM
dt
Md
2
2
(3.11)
3.2.2 Initial Conditions
At the start of operation, the septic tank does not produce effluent until after
some days depending on the flow rate and the effective volume of the tank.
Before effluent is produced the rate of change of the tank content with time is
equal to the flow rate. Hence
QdtdVQdt
dV (3.12)
V = volume of tank (m3)
t = time (days)
Q = flow rate of sewage (m3/s)
Because the plan area of the tank is roughly constant, Equation (3.12) becomes
dtA
Qdy (3.13)
A = plan area of tank (m2)
Integrating Equation (3.13) between the limits y(0) = 0 and y(te) = he, that is, te
is the time the contents (both liquid and solids) of the tank reach the height (he)
of the effluent pipe. This is equal to the time it takes the tank to produce
effluent. Hence
Q
Ahtt
A
Qh e
eee (3.14)

53
At time te, the amount of sludge in the tank (assuming that before effluent is
produced, all the solids in the tank would have settled) is given by
eee AhCtQCtM 00)( .
This is the first initial condition, that is, when t = te, M =C0Ahe
For the second initial condition, we refer to Equation (3.5).
Neglecting the action of bacteria at the time the tank is just about to start
producing effluent; Equation (3.5) reduces to
tQCQCdt
dM 0 (3.15)
At time te QC(t) is equal to zero, therefore
)( 0 e
t
CCQdt
dM
e
This is the second initial condition, that is, when t = te,
dt
dM = QC0 - Ce where Ce is the initial concentration of suspended solids in the
effluent just as it starts producing effluent. At this stage, the tank should be
performing at its optimum.
Summary of initial conditions
(1) M(te) = C0Ahe
(2) M’(te)= Q(C0 - Ce)
3.2.3 Assumptions
1. Redissolution and resuspension are negligible;
2. Uniform bacteria activity is assumed throughout the body of
accumulated sludge;

54
3. The possible variation in the concentration of settleable solids in the
septic tank influent is negligible;
4. Since the septic tank is usually sealed and water tight evaporation
and seepage losses are negligible;
5. The construction material does not absorb water;
6. The rates of bacteria growth and sludge decomposition are governed
by first order kinetics;
7. The tank is in continuous use;
8. Only biodegradable solids are flushed into the tank; and
9. The plan area of the tank remains constant.
3.2.4 Solution of Model
dt
dM
dt
Md
2
2
is a second order ordinary differential equation with a
straightforward solution.
"" MM (3.16)
Hence 02 DD (3.17)
tDtDBeAeM 21 (3.18)
But D1 = 0 and D2 = β
Thus tBeAM (3.19)
Differentiating, we obtain
tBeM ' (3.20)
Applying the initial conditions
(1) ee AhCtM 0
Substituting initial condition (1) in Equation (3.18), we have
et
e BeAAhC
0 (3.21)
(2) )()(' 0 ee CCQtM
Substituting initial condition (2) in Equation (3.20), we have
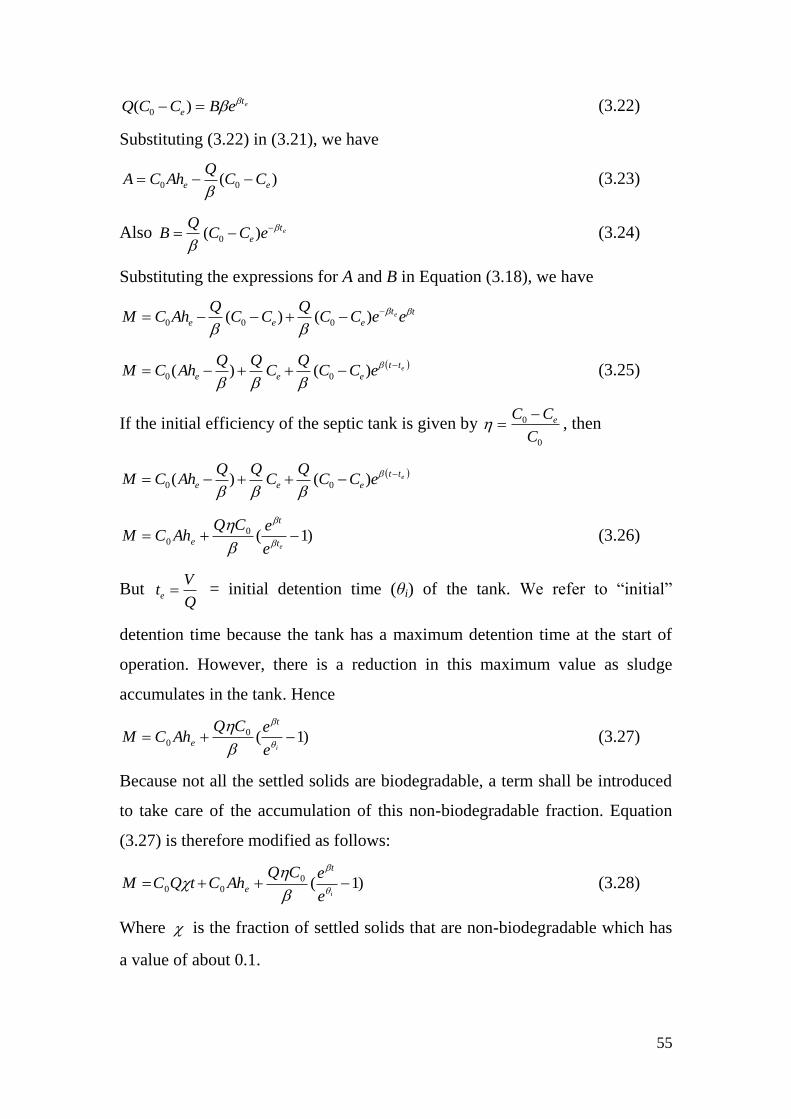
55
et
e eBCCQ )( 0 (3.22)
Substituting (3.22) in (3.21), we have
)( 00 ee CCQ
AhCA
(3.23)
Also et
e eCCQ
B
)( 0 (3.24)
Substituting the expressions for A and B in Equation (3.18), we have
tt
eee eeCCQ
CCQ
AhCM e
)()( 000
ett
eee eCCQ
CQQ
AhCM
)()( 00 (3.25)
If the initial efficiency of the septic tank is given by 0
0
C
CC e , then
ett
eee eCCQ
CQQ
AhCM
)()( 00
)1(0
0 et
t
ee
eCQAhCM
(3.26)
But Q
Vte = initial detention time (θi) of the tank. We refer to “initial”
detention time because the tank has a maximum detention time at the start of
operation. However, there is a reduction in this maximum value as sludge
accumulates in the tank. Hence
)1(0
0 ie
eCQAhCM
t
e
(3.27)
Because not all the settled solids are biodegradable, a term shall be introduced
to take care of the accumulation of this non-biodegradable fraction. Equation
(3.27) is therefore modified as follows:
)1(0
00 ie
eCQAhCtQCM
t
e
(3.28)
Where is the fraction of settled solids that are non-biodegradable which has
a value of about 0.1.

56
Equation (3.28) above shows the rate of sludge accumulation with time in the
septic tank. But our interest lies in knowing the sludge level or volume of
sludge at any future time from the start of operation. Hence, the equation shall
be rewritten in terms of y. Because the sludge is oversaturated with water, the
density of the mixed liquor is given as follows:
)1( wSG wml (3.29)
Where
ml = density of mixed liquor (Kg/m3)
w = density of water = 1000Kg/m3
SG = specific gravity of sludge (no unit)
w = water content of mixed liquor (no unit)
Hence )1(1000
)1()(0
00
wSG
eCQ
AhCtQC
V
it
e
(3.30)
Or in terms of sludge depth AwSG
eCQ
AhCtQC
y
it
e
)1(1000
)1()(0
00
(3.31)
Where all parameters remain as previously defined.
3.2.5 Depreciation of Detention Time and Rate of Settling
As the mass of sludge in the tank increases, the detention time decreases. Thus
dt
d
dt
dM (3.32)
dt
dK
dt
dMs
(3.33)
Ks = proportionality coefficient (having the dimension of mass)

57
= detention time of tank at any time t
Recall that VwSGM )1(1000 where V is the total volume occupied by the
mixed liquor of sludge and water. The above equation can be rewritten as
follows:
))(1(1000 lt VVwSGM (3.34)
Vt = design volume of tank and Vl (residual volume) = volume of tank above
sludge layer.
But QVl , hence
))(1(1000 QblhwSGM (3.35)
Differentiating Equation (3.35) yields
dwSGQdM )1(1000 (3.36)
Comparing Equation (3.32) and Equation (3.36) shows that
)1(1000 wSGQK s where Ks represents a form of settling rate having a
dimension of MT-1
.
Integrating Equation (3.36) under the boundary condition M(0) = 0 and (0) =
i , where i is the initial (design) detention time of the tank.
)())(1(1000 isi KwSGQM (3.37)
Recall that )1(1000 wSGVM ml and note that )( iQyblV
V = volume occupied by sludge (m3)
y = depth of sludge (m)
b = width of tank (m)
l = length of tank (m)
All other parameters have previously been defined.
Hence:

58
)( ioSy (3.38)
y = depth of sludge and So = Q/bl which is the overflow rate
Equation (3.38) relates loss of effective detention time to sludge accumulation.
Equation (3.38) can be rewritten as follows:
)(
i
re
bl
blHy (3.39)
Hre = residual depth above sludge layer (m)
irere HHy
y + Hre = total effective height of tank (he) which is the same as the height to
the effluent pipe, hence,
i
eh
y
1 (3.40)
By substituting Equation (3.31) in Equation (3.40), we obtain a relationship
between sludge depth and residual detention time.
i
e
t
e
AhwSG
eCQ
AhCtQC i
)1(1000
)1(
1
)(0
00
(3.41)
Equation (3.41) represents decay of detention time and will enable anyone to
assess the decline of detention time as sludge accumulates in the tank. Sludge
accumulation reduces the effective volume of the tank so that the detention
time available for solids separation is reduced in turn. Equation 3.41 can be re-
written as follows:
i
i
t
e
QwSG
eCQ
AhCtQC i
)1(1000
)1(
1
)(0
00
(3.42)

59
This is because Ahe is the initial effective volume of the tank which is equal to
the product of wastewater flow and initial detention time. Hence:
QwSG
eCQ
AhCtQC it
e
i)1(1000
)1()(0
00
(3.43)
Equation 3.43 relates residual detention time to time of tank operation
3.2.6 Residual Depth
As sludge accumulates in the septic tank, the depth of the tank decreases. In the
design of septic tank, it is necessary to specify a minimum residual depth and a
minimum residual detention time in order to maintain the efficiency of the tank
above a threshold limit. These conditions should be the prevailing conditions at
desludging. Considering a septic tank of plan area A, receiving wastewater at
the rate of Q m3/s per capita which is required to maintain a minimum residual
detention time, ϴre days and a minimum residual depth per capita hre (m), the
following relationship holds.
A
Qh re
re
(3.44)
For the sake of economy, it is necessary to choose plan dimensions that will
yield the minimum plan perimeter for a given plan area. This will ensure that
the minimum amount of materials is used for construction. Tank perimeter, P is
given as:
lwP 22 (3.45)
ll
AP 2
2 (3.46)
For minimum perimeter, we differentiate with respect to l and equate to zero.
02
22
l
A
dl
dP (3.47)
Hence l = w for the most economic plan area. This implies that the most
economic plan should be a square. However, researchers have been advocating
for tanks with narrow plan for higher efficiency, hence three classes of plan

60
specifications will be included in the evolving design approach. The cases are: l
=w for economy; and l = 2w and l = 3w for laminar conditions (Jowett and
Lay, 2005).
Case 1: l = w
Substituting for A = l2 in Equation (3.44), we obtain,
2l
Qh re
re
(3.48)
Most standards recommend that a tank must maintain a minimum detention
time of 24 hours (1 day) at desludging. Hence,
2l
Qhre (3.49)
Case 2: l = 2w
For this case, we obtain an expression for minimum residual depth per capita
observing a minimum residual detention time of 24hrs. Hence,
2
2
l
Qhre (3.50)
Case 3: l = 3w
For this case, we obtain an expression for minimum residual depth per capita
observing a minimum residual detention time of 24hrs. Hence,
2
3
l
Qhre (3.51)
3.2.7 Reserve Space
The reserve space refers to the empty space above the liquid level of the septic
tank or above the effluent pipe. The reserve space is an additional space that
takes care of such malfunctions as blockage of the effluent pipe or clogging of
the drain field. When blockage of effluent pipe or clogging of drain field
occurs, the additional space in the tank accommodates influent until the defect
is corrected. If the defect is not corrected then sewage will back up into the

61
house. The reserve space should be such that it will take the tank about one full
day to fill up the extra space so that there will be adequate time to effect
repairs. Considering that, one day detention time is also allowed for the
residual depth, hence, volume of the reserve space is equal to the residual
volume.
hre = hrev (3.52)
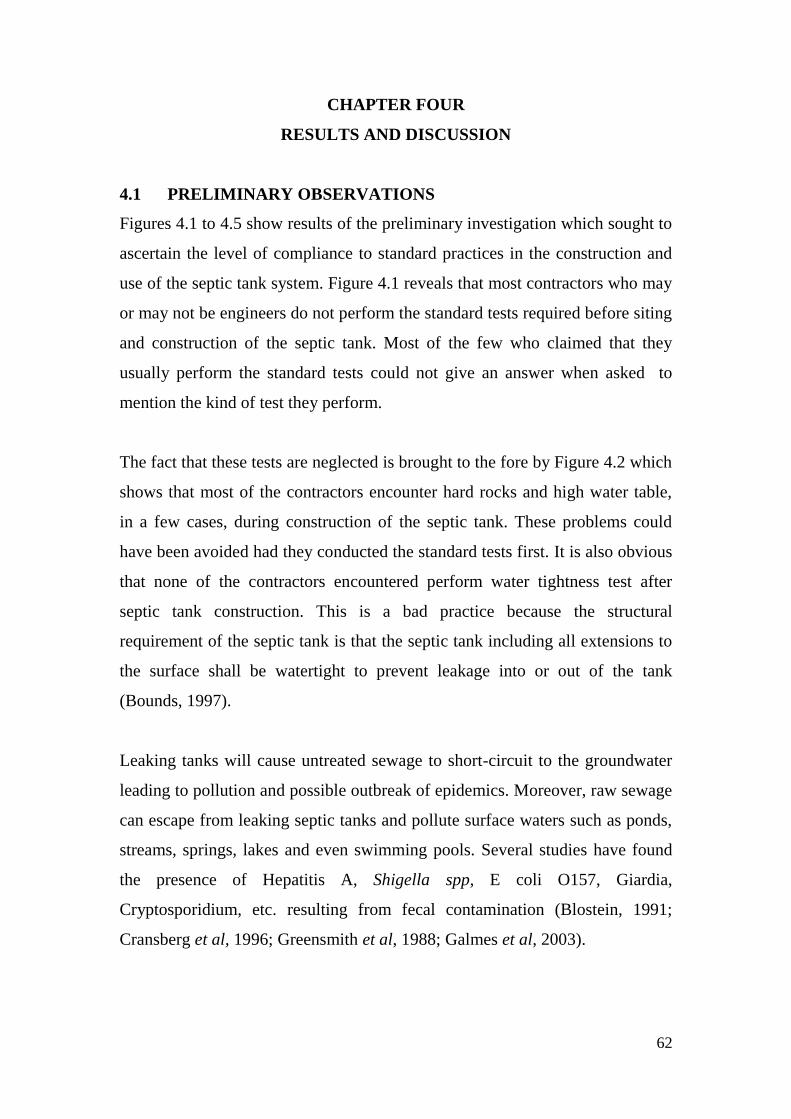
62
CHAPTER FOUR
RESULTS AND DISCUSSION
4.1 PRELIMINARY OBSERVATIONS
Figures 4.1 to 4.5 show results of the preliminary investigation which sought to
ascertain the level of compliance to standard practices in the construction and
use of the septic tank system. Figure 4.1 reveals that most contractors who may
or may not be engineers do not perform the standard tests required before siting
and construction of the septic tank. Most of the few who claimed that they
usually perform the standard tests could not give an answer when asked to
mention the kind of test they perform.
The fact that these tests are neglected is brought to the fore by Figure 4.2 which
shows that most of the contractors encounter hard rocks and high water table,
in a few cases, during construction of the septic tank. These problems could
have been avoided had they conducted the standard tests first. It is also obvious
that none of the contractors encountered perform water tightness test after
septic tank construction. This is a bad practice because the structural
requirement of the septic tank is that the septic tank including all extensions to
the surface shall be watertight to prevent leakage into or out of the tank
(Bounds, 1997).
Leaking tanks will cause untreated sewage to short-circuit to the groundwater
leading to pollution and possible outbreak of epidemics. Moreover, raw sewage
can escape from leaking septic tanks and pollute surface waters such as ponds,
streams, springs, lakes and even swimming pools. Several studies have found
the presence of Hepatitis A, Shigella spp, E coli O157, Giardia,
Cryptosporidium, etc. resulting from fecal contamination (Blostein, 1991;
Cransberg et al, 1996; Greensmith et al, 1988; Galmes et al, 2003).

63
Most of the contractors claimed that they design each septic tank before
construction, but some others were honest enough to admit that they use the
same specification for all the tanks they construct (Figure 4.3). However,
almost all of them admitted that they do not recommend desludging intervals to
owners after construction. This implies that occupants do not even know when
to expect their septic tank to be desludged. This usually makes occupants to
wait until the tank malfunctions or fills up completely before thinking about
desludging. Figure 4.4 shows that some septic tank users flush non-
biodegradable materials such as sanitary pad, condom, hair, wool and
polythene into the septic tank. These materials have the potential to clog
plumbing connections and cause back flow of sewage into the house. They also
cause the tank to be filled up too soon due to the accumulation of inorganic
matter.
The result of practices with regard to the design and construction as well as
maintenance/use of septic tanks is poor performance of the septic tank and even
total failure in some cases. This fact is highlighted in Figure 4.5 which shows
that about 60% of the tenants believe that their septic tanks are having one kind
of problem or the other. However, only about 24% of the land lords think that
their septic tanks are malfunctioning. This discrepancy in response could have
stemmed from the fact that most landlords live in other people‟s houses; and in
addition they would like to protect their image by claiming that their septic
tanks do not have any problems. The discrepancies notwithstanding, both
tenants and landlords agree that septic tanks disorder is a common occurrence
which needs to be addressed.

64
Figure 4.1: Compliance to Basic Septic Tank Tests
Figure 4.2: Kinds of Construction Problems Encountered
0%
10%
20%
30%
40%
50%
60%
70%
80%
90%
100%
Do you check depth of
ground water or bed rock?
Do you perform water
tightness test?
Do you consider
location/distance of water wells, or boreholes?
Per
cen
tage
com
plia
nce
Yes
No
0.00%
5.00%
10.00%
15.00%
20.00%
25.00%
30.00%
35.00%
40.00%
45.00%
High water table Hard rock Too loose soil Sloppy soil None
Perc
enta
ge

65
Figure 4.3: Design Issues
Figure 4.4: Flushing of Non-biodegradable Materials into the Septic Tanks
0.00%
10.00%
20.00%
30.00%
40.00%
50.00%
60.00%
70.00%
80.00%
90.00%
100.00%
Do you carry out septic tank design
before construction?
Do you recommend desludging intervals?
Perc
enta
ge co
mpl
ianc
e
Yes
No
0.00%
10.00%
20.00%
30.00%
40.00%
50.00%
60.00%
70.00%
80.00%
Sanitary pad Condoms Polythene Wool/hair Clothes None
Perc
enta
ge R
espo
nse
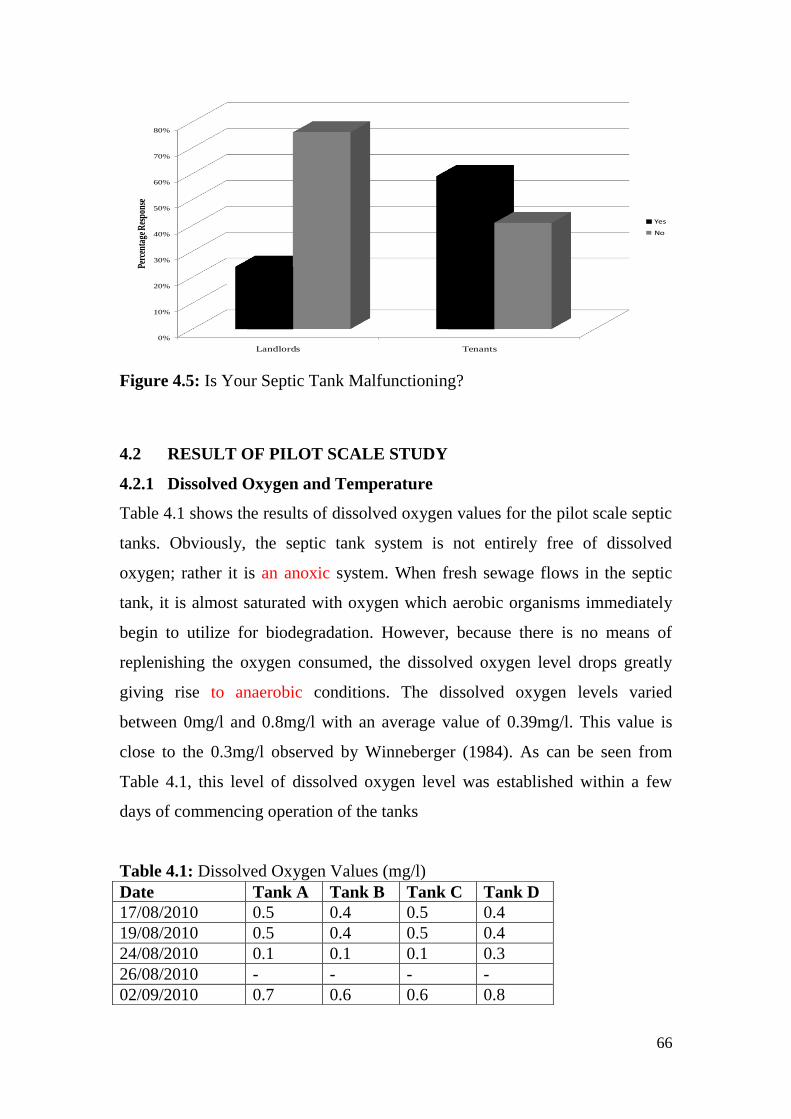
66
Figure 4.5: Is Your Septic Tank Malfunctioning?
4.2 RESULT OF PILOT SCALE STUDY
4.2.1 Dissolved Oxygen and Temperature
Table 4.1 shows the results of dissolved oxygen values for the pilot scale septic
tanks. Obviously, the septic tank system is not entirely free of dissolved
oxygen; rather it is an anoxic system. When fresh sewage flows in the septic
tank, it is almost saturated with oxygen which aerobic organisms immediately
begin to utilize for biodegradation. However, because there is no means of
replenishing the oxygen consumed, the dissolved oxygen level drops greatly
giving rise to anaerobic conditions. The dissolved oxygen levels varied
between 0mg/l and 0.8mg/l with an average value of 0.39mg/l. This value is
close to the 0.3mg/l observed by Winneberger (1984). As can be seen from
Table 4.1, this level of dissolved oxygen level was established within a few
days of commencing operation of the tanks
Table 4.1: Dissolved Oxygen Values (mg/l)
0%
10%
20%
30%
40%
50%
60%
70%
80%
Landlords Tenants
Perc
enta
ge R
espo
nse
Yes
No
Date Tank A Tank B Tank C Tank D
17/08/2010 0.5 0.4 0.5 0.4
19/08/2010 0.5 0.4 0.5 0.4
24/08/2010 0.1 0.1 0.1 0.3
26/08/2010 - - - -
02/09/2010 0.7 0.6 0.6 0.8

67
The temperature levels inside the tanks are shown in Figures 4.6 and 4.7. The
lowest temperature recorded was 240C while the highest was 33
0C. The
temperature levels had an average value of 260C within the first two months of
operation but increased to an average value of 300C in the third month
(November). This can be attributed to the microbial activities in the tanks as
well as increased ambient temperature at the end of the rainy season.
Generally, there was a gradual upward trend in temperature in all the tanks.
However, there were no marked differences in the temperature levels of
different pilot scale tanks. Though temperature levels indicate the level of
microbial activities in a treatment plant and consequently the efficiency, this is
not entirely the case for the septic tank which is first and foremost a settling
system accompanied by some levels of microbial degradation. The highest
level of activity in the septic tank occurs in the sludge layer where anaerobic
bacteria consume settled sludge.
14/09/2010 0.3 0.2 0.5 0.3
28/09/2010 0.7 1.2 0 0
12/10/2010 0 0.1 0.6 0.7
19/10/2010 0 0 0 0
28/10/2010 0 0 0.6 0.7
11/11/2010 0.8 0.7 0.6 0.5
18/11/2010 0.5 0.6 0.4 0.4
25/11/2010 0 0.5 0.5 0.8
Average 0.31 0.33 0.45 0.48
Overall
Average 0.39

68
Figure 4.6: Temperature Variation in Tanks
Figure 4.7: Temperature Variation in Tanks (Different Inlet Types)
4.2.2 pH Variation
One of the most active groups of micro-organisms in the septic tank are the
methanogens (methane formers) which convert acetic acid to methane
(Wilhelm et al., 1994). This conversion usually leads to an increase in the
20
22
24
26
28
30
32
34
0 20 40 60 80 100 120
Tem
per
atu
re (
0C
)
Time (Days)
2 Days 1 Day 3 Days
23
25
27
29
31
33
35
Tem
p (0
C)
Time (Days)
Splash Baffle Inlet Tee

69
alkalinity of the septic tank content and hence increased pH. This is
corroborated by Figures 4.8 to 4.10. An increase in pH between inlet and outlet
is a sign that the septic tank is performing well. The effect of detention on pH is
not very clear as results obtained show that 2 days detention time achieved a
higher pH removal than both 1 day and 3 days detention time. This is not
reasonable because it is expected that the longer the sewage stays in the septic
tank the more time methanogens will have to act on it and hence the more the
increase in pH levels.
Figure 4.8: Change in pH between Inlet and Outlet
6.6
6.8
7
7.2
7.4
7.6
7.8
8
0 20 40 60 80 100 120
pH
Time (Days)
Influent 2 Days 1 Day 3 Days

70
Figure 4.9: Change in pH between Inlet and Tank Midpoint
4.2.3 Effect of Baffle on Treatment Efficiency
Tanks A and B were used to monitor the effects of baffle types on the
efficiency of the septic tank system. Figures 4.10 and 4.15 show that the use of
inlet tees in the place of the commonly used splash baffles could lead to higher
efficiency. This is indicated by higher pH values both in samples taken from
the midpoint of the tanks and those taken from tank outlets. The same trend
was observed for BOD removal, COD removal and E-coli removal both at the
outlets and midpoints. The only exception was suspended solids removal where
there was no marked difference between splash baffle and inlet tee removal
efficiencies. The essence of baffles in septic tanks is to retard the flow rate as
sewage enters into the tank. The slowing down ensures that settled sewage is
not resuspended by turbulence from fast flowing influent. Baffles also prevent
short circuiting. In Nigeria and most developing countries, the most commonly
used baffle type is the concrete splash baffle which consists of a concrete beam
placed directly in front of the inlet pipe to intercept incoming sewage. This
baffle type has the disadvantage of being attacked by sewage so that it is eaten
away over time. The results of this research have revealed another disadvantage
6
6.2
6.4
6.6
6.8
7
7.2
7.4
7.6
7.8
8
0 20 40 60 80 100 120
pH
Time (Days)
Influent 2 Days 1 Day 3 Days

71
which is reduced efficiency. One of the reasons for this reduction in efficiency
could be because the impact between the incoming sewage and the splash
baffle caused sewage particles to be broken into smaller particles some of
which may not settle easily. Secondly, while inlet tees direct incoming sewage
into the sludge layer, the splash baffled septic tank experiences disturbance of
the scum layer causing particles trapped in the scum layer to be resuspended. A
third possible reason could be that the inlet tee directs incoming wastewater
down to the sludge layer so that there are more chances of decomposition by
micro-organisms in the sludge layer. In the case of the inlet tee, there is a
higher possibility of stratification so that inflow and outflow of sewage occurs
only in the upper layers of the tank. This will not allow the wastewater to have
adequate contact with the sludge layer.
Figure 4.10: Change in pH between Inlet and Outlet for Different Types of
Baffles
6
6.2
6.4
6.6
6.8
7
7.2
7.4
7.6
7.8
8
pH
Time (Days)
Influent Splash Baffle Inlet tee

72
Figure 4.11: Change in pH between Inlet and Tank Midpoint for Different
Types of Baffles
Figure4.12: Outlet BOD Removal Efficiency for Different Baffle Types
6
6.2
6.4
6.6
6.8
7
7.2
7.4
7.6
7.8
8p
H
Time (Days)
Influent Splash Baffle Inlet Tee
82
84
86
88
90
92
94
96
98
100
0 10 20 30 40 50 60 70 80 90 100
Eff
icie
ncy
(%
)
Time (Days)
Splash baffle Inlet tee
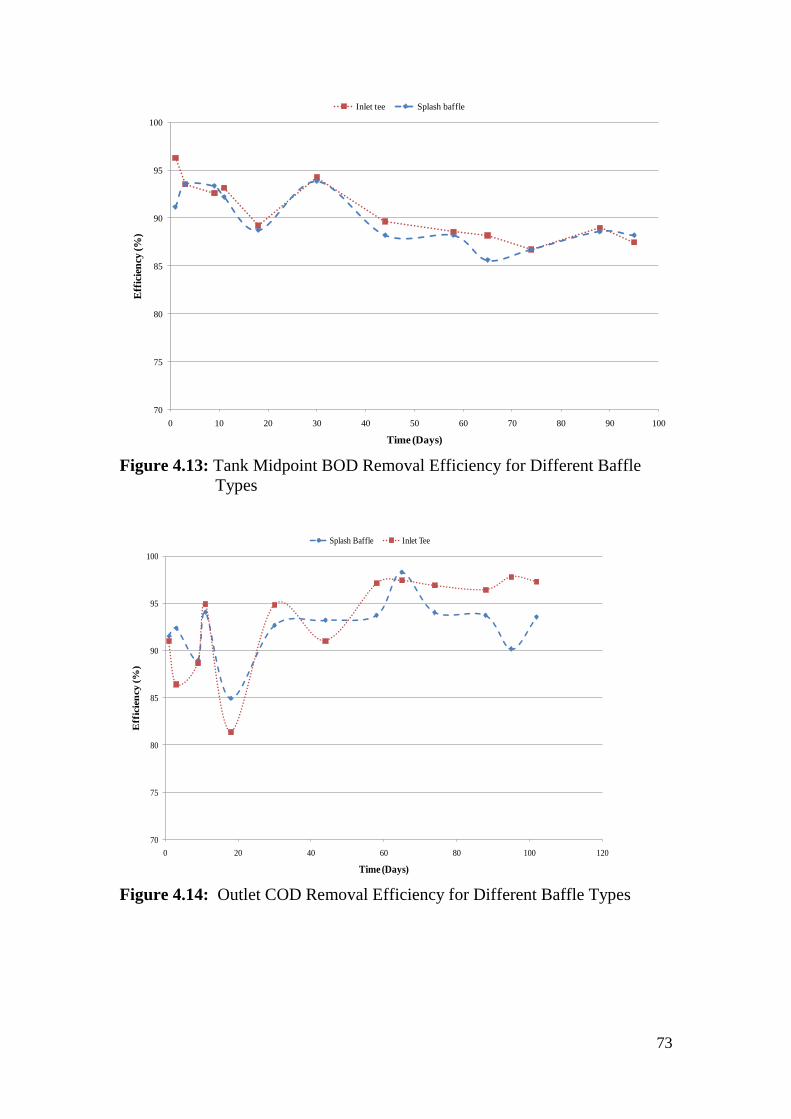
73
Figure 4.13: Tank Midpoint BOD Removal Efficiency for Different Baffle
Types
Figure 4.14: Outlet COD Removal Efficiency for Different Baffle Types
70
75
80
85
90
95
100
0 10 20 30 40 50 60 70 80 90 100
Eff
icie
ncy
(%
)
Time (Days)
Inlet tee Splash baffle
70
75
80
85
90
95
100
0 20 40 60 80 100 120
Eff
icie
ncy
(%
)
Time (Days)
Splash Baffle Inlet Tee

74
Figure 4.15: Tank Midpoint COD Removal Efficiency for Different Baffle
Types
Figure 4.16: Tank Midpoint E-coli Removal Efficiency for Different Baffle
Types
0
20
40
60
80
100
120
0 20 40 60 80 100 120
Eff
icie
ncy
(%
)
Time (Days)
Splash Baffle Inlet Tee
0
20
40
60
80
100
120
0 10 20 30 40 50 60 70 80
Eff
icie
ncy
(%
)
Time (Days)
Splash Baffle Inlet Tee

75
Figure 4.17: Tank Midpoint Suspended Solids Removal Efficiency for
Different Baffle Types
Figure 4.18: Outlet Suspended Solids Removal Efficiency for Different Baffle
Types
4.2.4 Effect of Detention Time on Treatment Efficiency
Tanks B, C, D and E were used to monitor the effects of detention time on the
efficiency of the septic tank system. Tank E started leaking profusely soon after
the commencement of operation and could not be repaired immediately.
40
50
60
70
80
90
100
0 10 20 30 40 50 60 70 80 90 100
Eff
icie
ncy
(%
)
Time (Days)
Splash Baffle Inlet Tee
60
65
70
75
80
85
90
95
100
105
0 10 20 30 40 50 60 70 80 90 100
Eff
icie
ncy
(%
)
Time (Days)
Splash Baffle Inlet Tee
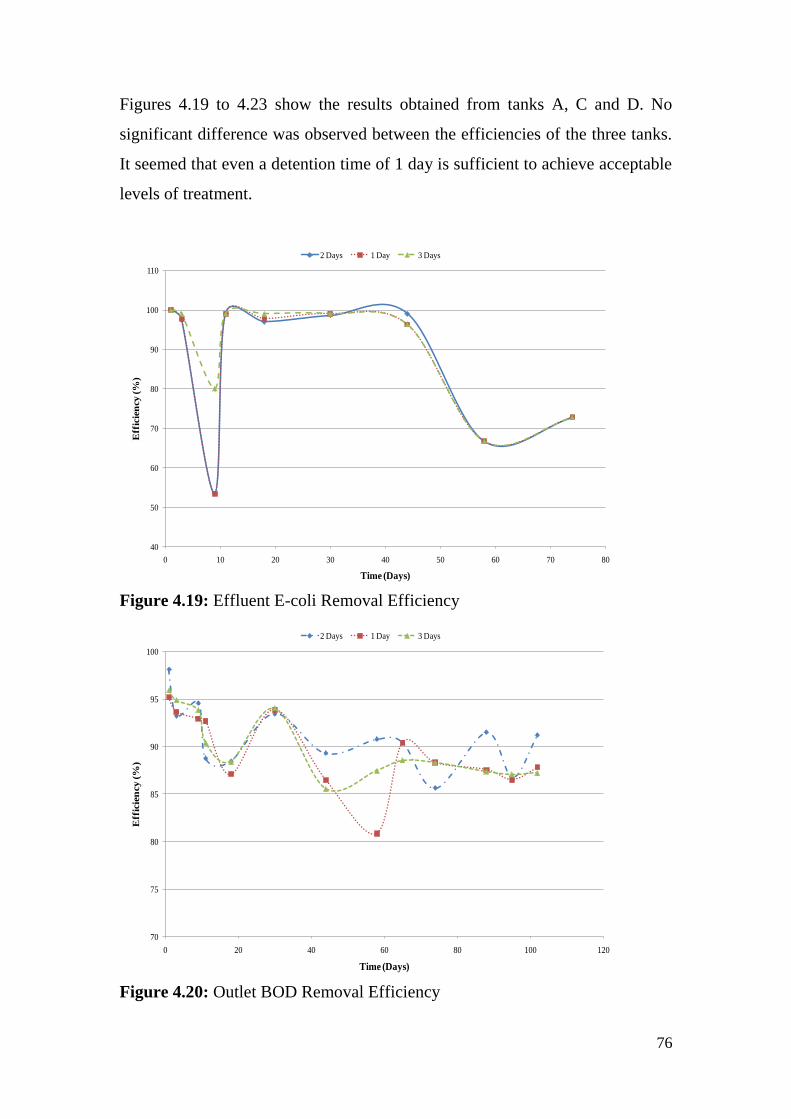
76
Figures 4.19 to 4.23 show the results obtained from tanks A, C and D. No
significant difference was observed between the efficiencies of the three tanks.
It seemed that even a detention time of 1 day is sufficient to achieve acceptable
levels of treatment.
Figure 4.19: Effluent E-coli Removal Efficiency
Figure 4.20: Outlet BOD Removal Efficiency
40
50
60
70
80
90
100
110
0 10 20 30 40 50 60 70 80
Eff
icie
ncy
(%
)
Time (Days)
2 Days 1 Day 3 Days
70
75
80
85
90
95
100
0 20 40 60 80 100 120
Eff
icie
ncy
(%
)
Time (Days)
2 Days 1 Day 3 Days

77
Figure 4.21: Tank Midpoint BOD Removal Efficiency
Figure 4.22: Effluent Suspended Solids Removal Efficiency
84
86
88
90
92
94
96
98
0 20 40 60 80 100 120
Eff
icie
ncy
(%
)
Time (Days)
2 Days 1 Day 3 Days
40
50
60
70
80
90
100
110
0 10 20 30 40 50 60 70 80 90 100
Eff
icie
ncy
(%
)
Time (Days)
2 Days 1 Day 3 Days

78
Figure 4.23: Tank Midpoint Suspended Solids Removal Efficiency
4.3 MODEL CALIBRATION
The sludge accumulation model (Equation 3.30) was calibrated using the
sludge accumulation data obtained from Ted Kulongosky of Orenco Systems
Inc. Oregon, USA as well as other sources in literature. Table 4.2 is a summary
of data sources used and the time length of septic tank sludge accumulation
monitoring. The water content w and specific gravity SG of sewage sludge is
0.88 and 1.03, respectively (Saqqar and Pescod, 1995). The calibration was
done by filling a column in Microsoft Excel with time values ranging from half
a year to 9 years which roughly covers the duration of the sludge accumulation
study. The next column was filled with an arbitrary constant value for β. The
third column was programmed to use the corresponding time value of the first
column and the arbitrary value of β to evaluate the generalized sludge
accumulation model of Equation 3.30. The fourth column was filled with the
sludge accumulated per capita corresponding to the time of measurement in the
30
40
50
60
70
80
90
100
110
0 10 20 30 40 50 60 70 80 90 100
Eff
icie
ncy
(%
)
Time (Days)
2 Days 1 Day 3 Days

79
first column. Scatter plots of the measured sludge accumulation versus time
and that of the calculated sludge accumulation versus time were made. The
value of β was manipulated until the two curves came the closest. The final
curve is shown in Figure 4.24. Hence Equation (4.1) was obtained with a
correlation coefficient of 0.985.
)1(56.0011.000832.0 11.0 t
sludge etV (4.1)
Where Vsludge is the volume of sludge in m3/capita accumulated in time, t years.
Table 4.2: Sludge Accumulation Data
Time
(Years)
Volume of Sludge
Accumulated (m3/capita)
Period of
Monitoring
No of
Septic
Tanks
Source
0.5 0.046 5 years 28 Gary (1995)
1 0.047 3 years 727 Bounds (1994)
2.8 0.174 8 years 486 Bound (1990)
4.8 0.29 8 years 486 Bound (1990)
5 0.325 5 years 28 Gary (1995)
8 0.378 8 years 486 Bound (1990)

80
Figure 4.24: Plots of Model and Measured Sludge Accumulation versus Time
In order to obtain the total volume of septage (sludge and scum) in the tank at
any time, Equation (4.1) was modified to include a scum accumulation term.
The Douglas County Audit found that, the scum accumulation was 12 US
gallons/capita/year (0.0454m3/capita/year) in the first year and a constant rate
of 2.6 US gallons/capita/year (0.0098m3/capita/year) in subsequent years. This
rate of scum accumulation was corroborated by a 3-year audit of 727 septic
tanks by the Montesano Community, Washington at 95% confidence level
(Bounds, 1994). Hence, the rate of scum accumulation can be given as:
tVscum 01.0035.0 (4.2)
Where Vscum is the volume of scum in m3 per capita and t is time in years.
Equation (4.1) is then merged with Equation (4.2) to yield Equation (4.3) for
the total volume of solids (septage) accumulated in the tank in time, t (years).
)1(56.0021.0043.0 11.0 t
septage etV (4.3)
0
0.1
0.2
0.3
0.4
0.5
0.6
0 2 4 6 8 10 12
Vo
lum
e o
f S
lud
ge
per
Ca
pit
a(m
3/c
ap
ita
)
Time (years)
Model Measured
R = 0.985

81
The total depth occupied by solids is given by Equation 4.4.
A
ety
t
septage
)1(56.0021.0043.0 11.0
(4.4)
Hence, Equation (3.40) which relates detention time to time after
commencement of operation becomes:
Q
et t
i
)1(56.0021.0043.0 11.0
(4.5)
4.3.1 Comparison of Model with Existing Sludge Accumulation Models
It is necessary to compare the model (Equation 4.3) for solids accumulation
derived in this study with the existing models. The most popular models for
solids accumulation are those of Bounds (1995) and Weibel et al. (1955)
derived for the US Public Health Service.
Figure 4.25: Comparison of Model with Bounds‟ and Weibel‟s Models
0
0.2
0.4
0.6
0.8
1
1.2
1.4
0 2 4 6 8 10 12 14 16 18 20
Vo
lum
e o
f S
epta
ge
(m3/c
ap
ita
)
Time (Years)
Bounds Weibel Model

82
Figure 4.25 shows that the new model gives lower estimates than the models of
Bounds and Weibel et al. But Seablom et al. (2004) noted that Bound‟s
equation gives high estimates of septage accumulation. Weibel‟s equation has
the disadvantage of assuming that sludge accumulation is a linear function.
Sludge accumulation studies have shown that this is not the case as a result of
consolidation and decomposition of accumulated sludge by micro-organisms.
The aspect of solids accumulation that can be reasonably assumed to have a
constant rate is scum accumulation and the accumulation of non-biodegradable
fractions of sewage.
4.4 BASIS FOR THE NEW DESIGN APPROACH
Many codes and designers recommend that the septic tank should be desludged
when sludge has reached one third of the tank height. But this has no rational
basis. The most critical parameter in septic tank design and operation is the
detention time. At any point in time, the detention time must be sufficient to
allow solid particles to settle, otherwise, its performance will be impaired.
Desludging interval of the septic tank should rather be based on the parameter
introduced earlier in this research which was referred to as the minimum
residual detention time. This was defined as the minimum allowable detention
time in the septic tank. It is the detention time which should be specified by the
designer such that once it is attained, the tank must be desludged. Research has
shown that detention time between 12 hours and 24 hours are close to the
threshold of acceptable solids removal in the septic tank. Equation 3.40 relates
residual detention time to the ratio of sludge depth to tank effective height. In
order to expose the arbitrariness in the recommendation that septic tanks be
desludged when sludge depth reaches one third of the effective height, a plot of
residual detention time and the ratio of sludge depth to tank height is presented
in Figure 4.26 (based on Equation 3.40).
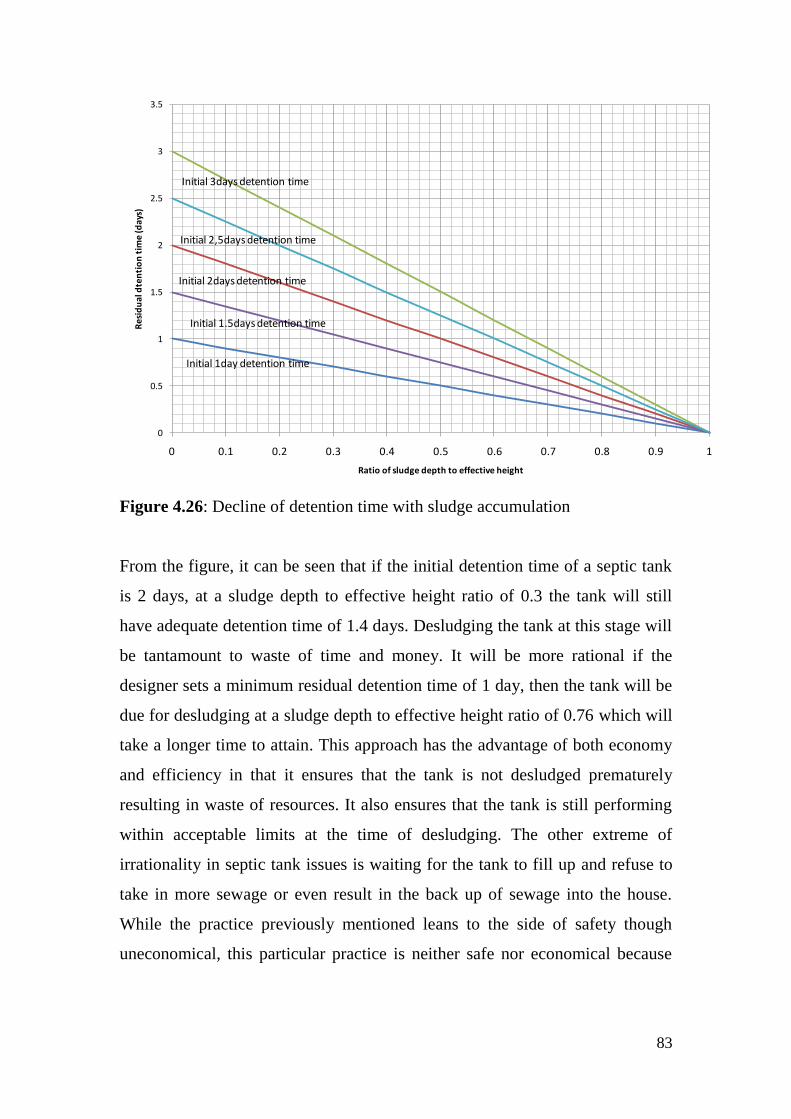
83
Figure 4.26: Decline of detention time with sludge accumulation
From the figure, it can be seen that if the initial detention time of a septic tank
is 2 days, at a sludge depth to effective height ratio of 0.3 the tank will still
have adequate detention time of 1.4 days. Desludging the tank at this stage will
be tantamount to waste of time and money. It will be more rational if the
designer sets a minimum residual detention time of 1 day, then the tank will be
due for desludging at a sludge depth to effective height ratio of 0.76 which will
take a longer time to attain. This approach has the advantage of both economy
and efficiency in that it ensures that the tank is not desludged prematurely
resulting in waste of resources. It also ensures that the tank is still performing
within acceptable limits at the time of desludging. The other extreme of
irrationality in septic tank issues is waiting for the tank to fill up and refuse to
take in more sewage or even result in the back up of sewage into the house.
While the practice previously mentioned leans to the side of safety though
uneconomical, this particular practice is neither safe nor economical because
0
0.5
1
1.5
2
2.5
3
3.5
0 0.1 0.2 0.3 0.4 0.5 0.6 0.7 0.8 0.9 1
Res
idu
al d
ten
tio
n t
ime
(day
s)
Ratio of sludge depth to effective height
Initial 3days detention time
Initial 2,5days detention time
Initial 2days detention time
Initial 1.5days detention time
Initial 1day detention time

84
this can shorten the life span of the septic tank as well as result in the clogging
of the drainfield or soak pit.
Another anomaly in the prevailing design approach of septic tanks is that most
times, consideration is not given to water use and availability in the house. It‟s
not just enough to know the number of people that are likely to live in the
house, it is important to know the rate of water consumption. Table 4.3 shows
the variation in water consumption per capita for different water supply
conditions.
Table 4.3: Water consumption under different supply conditions
Water Supply Condition Water Use (lpcd) Source
Public standpipe farther than 1 Km ≤ 10 Gleick (1996)
Public standpipe closer than 1 Km 20 Gleick (1996)
House connection, simple plumbing,
pour, flush toilet
80*
Gleick (1996)
Urban house connection with garden 275*
Gleick (1996)
Nigerian Average water use 36 UNDP (2006)
Basic water requirement 50 Gleick (1996)
* represents average value.
Water consumption will determine the capacity of septic tank to use. Though
water consumption varies from house to house, the raw sewage flow per person
into the tank will not vary much. A superficial reasoning will lead to the
conclusion that a house with low water consumption will require a septic tank
with low detention time. But this is not the case because a low detention time
coupled with very low wastewater flow rate will yield an insignificant design
volume that will be soon be filled up with solids. This is because, though water
use may vary widely from place to place, the average feaces input per person
into the tank does not vary significantly. Very small septic tank volumes lead to
frequent need for desludging and hence high cost of maintenance. Figures 4.27

85
to 4.30 produced from Equation (3.43) show how wastewater flow affects
residual detention time. It should be noted that the wastewater flow is taken as
80% of the total water consumption per person per day.
Figure 4.27: Decline of Detention Time for House Connection, Simple
Plumbing (Typical wastewater flow = 0.064m3/day)
0
1
2
3
4
5
6
7
0 1 2 3 4 5 6 7 8 9 10
Det
enti
on
Tim
e (d
ay
s)
Time after commencement of operation (years)
ϴi =2days ϴi =3days ϴi =4days ϴi =5days ϴi =6days ϴi =7days
ϴi = 7days
ϴi = 6days
ϴi = 5days
ϴi = 4days
ϴi = 3days
ϴi = 2days

86
Figure 4.28: Decline of Detention Time for Urban House with Full Water
Connection and Garden (Typical wastewater flow = 0.275m3/day)
Figure 4.29: Decline of Detention Time for Basic Water Requirement
(Typical wastewater flow = 0.04m3/day)
0
1
2
3
4
5
6
7
8
0 2 4 6 8 10 12 14 16 18 20 22 24
Det
enti
on
Tim
e (d
ay
s)
Time after commencement of operation (years)
ϴi =2days ϴi =3days ϴi =4days ϴi =5days ϴi =6days ϴi =7days
ϴi = 6days
ϴi = 7days
ϴi = 6days
ϴi = 5days
ϴi = 4days
ϴi = 3days
ϴi = 2days
0
1
2
3
4
5
6
7
8
9
10
0 1 2 3 4 5 6 7
Det
enti
on
Tim
e (d
ay
s)
Time after commencement of operation (years)
ϴi =2days ϴi =3days ϴi =4days ϴi =5days ϴi =6days ϴi =7days ϴi =8days ϴi =9days
ϴi = 7days
ϴi = 6days
ϴi = 5days
ϴi = 4days
ϴi = 3days
ϴi = 2days
ϴi = 8days
ϴi = 9days

87
Figure 4.30: Decline of Detention time for Average Nigerian House
(Typical wastewater flow = 0.03m3/day)
These figures demonstrate vividly that houses with high water consumption or
wastewater flow can have tanks with moderate to low detention times and still
operate for about twenty years without requiring desludging. Figure 4.28 shows
that a septic tank designed for a house with full water connections and having
an initial detention time of three days can operate for nine years and still
maintain the minimum 24 hours residual detention time introduced earlier on.
On the other hand, Figure 4.30 shows that for the average Nigerian water
consumption, a septic tank sized for an initial detention time of three days for
the same number of occupants will attain the minimum 24 hours residual
retention time in only nine months and will, in fact, get filled up in less than
one and half years. This explains why some people have frequent need to
desludge their septic tanks while others have not had the need to desludge
theirs for about a decade or more. This justifies the approach developed in this
research which starts design by fixing a desired desludging interval and a
minimum residual detention time of 24 hours.
0
1
2
3
4
5
6
7
8
9
0 0.5 1 1.5 2 2.5 3 3.5 4 4.5 5
Det
enti
on
Tim
e (d
ay
s)
Time after commencement of operation (years)
ϴi =2days ϴi =3days ϴi =4days ϴi =5days ϴi =6days ϴi =7days ϴi =8days ϴi =9days
ϴi = 7days
ϴi = 6days
ϴi = 5days
ϴi = 4days
ϴi = 3days
ϴi = 2days
ϴi = 8days
ϴi = 9days

88
In Nigeria, septic tanks are rarely designed, rather, most contractors resort to
arbitrary sizing or adopt the specifications of the Public Works Department
(PWD, 1943) shown in Table 4.4 or other Local Government specifications.
The specifications on this table are based on 1 day detention time and a
wastewater flow of 0.114m3/capita/day. This specification is not realistic as a
septic tank sized for 1 day detention time will need desludging frequently.
Furthermore, the wastewater flow of 0.114m3/capita/day is unrealistic (see
Table 4.3).
Table 4.4: Schedule of Septic Tank Sizing and Dimensions (PWD, 1943)
Tank Size Dimensions No. of
Users
Length(m) Width(m) Depth(m) Capacity(m3)
I 2.032 0.457 1.220 1.134 10
II 2.286 0.534 1.220 1.448 13
III 2.286 0.610 1.220 1.700 15
IV 2.540 0.686 1.220 2.125 18
V 3.048 0.762 1.220 2.832 25
The code recommended that a septic tank serving 10 people should have a
dimension of 2.032m (length), 0.457m (width) and 1.22m (depth) giving a total
volume of 1.13m3. Even if the usual constant sludge accumulation rate of
0.04m3/capita/year (Agunwamba, 2001; Winneberger, 1984) is assumed, in
three years the tank will be overflowing with sludge (1.2m3). This implies that
the tank will need desludging about every two years. Compare this with the
recommendations of Crites and Tchobanoglous (1997). For instance, they
recommended a tank of 2000 US gallons (7.57m3) for a four bedroom house
(see Table 4.5). Obviously this is a very long shot from the meager 1.13m3
recommended by PWD for a septic tank serving 10 people.
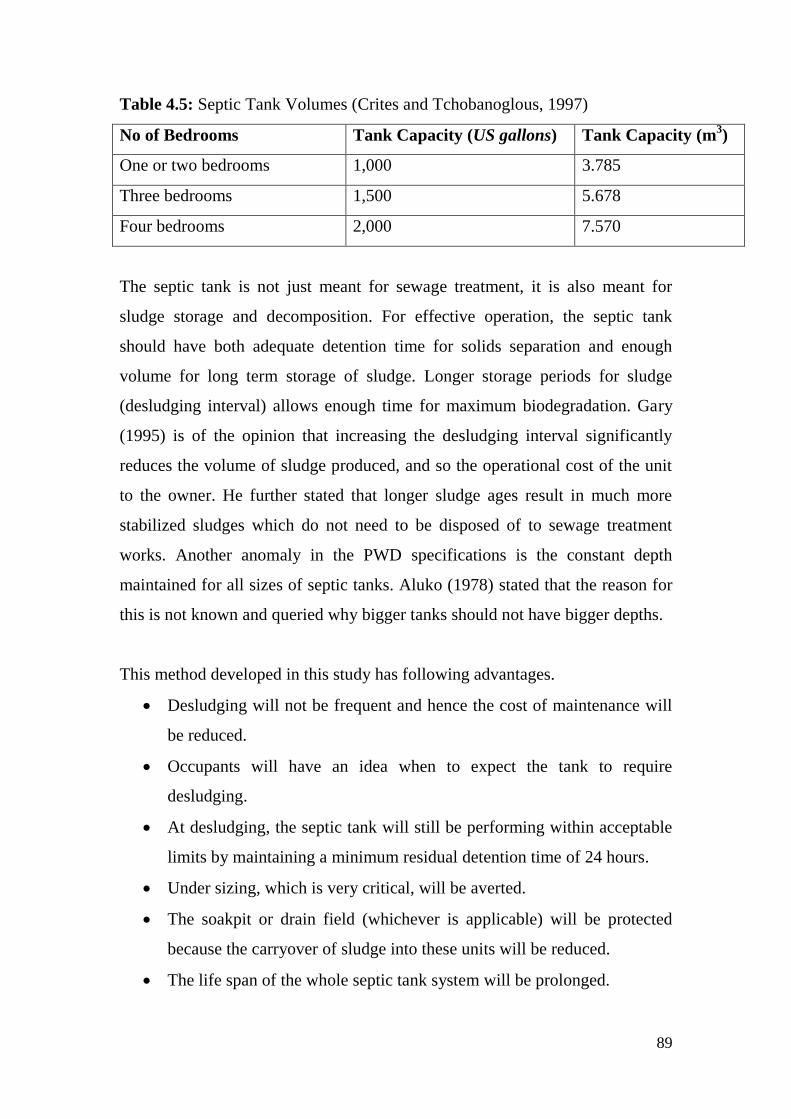
89
Table 4.5: Septic Tank Volumes (Crites and Tchobanoglous, 1997)
No of Bedrooms Tank Capacity (US gallons) Tank Capacity (m3)
One or two bedrooms 1,000 3.785
Three bedrooms 1,500 5.678
Four bedrooms 2,000 7.570
The septic tank is not just meant for sewage treatment, it is also meant for
sludge storage and decomposition. For effective operation, the septic tank
should have both adequate detention time for solids separation and enough
volume for long term storage of sludge. Longer storage periods for sludge
(desludging interval) allows enough time for maximum biodegradation. Gary
(1995) is of the opinion that increasing the desludging interval significantly
reduces the volume of sludge produced, and so the operational cost of the unit
to the owner. He further stated that longer sludge ages result in much more
stabilized sludges which do not need to be disposed of to sewage treatment
works. Another anomaly in the PWD specifications is the constant depth
maintained for all sizes of septic tanks. Aluko (1978) stated that the reason for
this is not known and queried why bigger tanks should not have bigger depths.
This method developed in this study has following advantages.
Desludging will not be frequent and hence the cost of maintenance will
be reduced.
Occupants will have an idea when to expect the tank to require
desludging.
At desludging, the septic tank will still be performing within acceptable
limits by maintaining a minimum residual detention time of 24 hours.
Under sizing, which is very critical, will be averted.
The soakpit or drain field (whichever is applicable) will be protected
because the carryover of sludge into these units will be reduced.
The life span of the whole septic tank system will be prolonged.

90
It is our opinion that the septic tank is a very vital aspect of waste management
and public health that merits more than casual sizing. Every septic tank is
unique and must be designed to maintain minimum conditions. In this regard,
Poe (2001) noted that the key to effective sewage treatment is proper design,
installation, periodic maintenance and responsible operation.
4.5 THE NEW DESIGN APPROACH
The need and basis for a new and rational approach to the design of septic
tanks, especially in developing countries where outbreak of fecal-related
epidemics is rampant, have been set out in previous sections. The new design
approach developed in this research is such that even unlearned contractors can
use it to perform an accurate sizing of the septic tank. The new design approach
has been presented in three different packages to suit the designer‟s fancy and
level of education. The three aspects are
Use of Equations 3.44, 3.52 and 4.3 (for the learned designer),
Use of charts which will be presented shortly (for anyone),
Use of simple Microsoft Excel based programme (for the computer
literate designer).
(i) Use of Equations 3.42, 3.52 and 4.3
It has been previously stated that a good septic tank design must fix a
minimum residual detention time at which it becomes necessary to
desludge the tank. Many standards usually specify 24 hours. Also,
based on Equation 3.44, a minimum residual depth per occupant (hre)
corresponding to the chosen residual detention time should also be
specified. The overall residual depth (Hre) is the product of the
residual depth per occupant and the number of occupants. For good
design and for practical purposes, the value of the overall residual
depth should not be less than 10cm and not more than 75cm. This is
because too low residual depth will cause the wash out of sludge and
also interfere with inlet and outlet fittings while too high residual

91
depth will result in a tank with very low length to depth ratio which
will be inefficient. Narrow tanks have been found to provide
quiescent hydraulic conditions which favour settling and thus solids
removal. Then using Equation 3.44, the plan area of the tank is
determined. A desired desludging interval is chosen and then
Equation 4.1 is used to determine the volume of sludge that will
accumulate in that period of time. The depth of sludge in the tank at
this time is then obtained by dividing the volume of accumulated
sludge with the plan area obtained as described above. The total
depth of tank is obtained as the sum of sludge depth, the residual
depth and the depth of the reserve space. The reserve space should
correspond to a volume of 24 hours detention time. Finally a ratio of
length to width is chosen and hence, the length and the width can be
determined. The length should always be longer than the width to
provide for quiescent conditions.
(ii) Use of Charts
The steps described above have been translated into a series of charts
using the relevant equations and covering as many scenarios as
possible (see Figures 4.31 to 4.44). The overall residual depth is
chosen and the residual depth per occupant (horizontal axis)
corresponding to the number of occupants to use the septic tank is
read off on the vertical axis of Figure 4.32. The residual depth per
occupant obtained is located on the vertical axis of Figures 4.33 to
4.44 depending on the length to width ratio chosen. Figures 4.33 to
4.43 have been produced to cover cases where length to width ratio
is equal to 1, 2 and 3 as well as different water availability
conditions. Figures 4.33 to 4.35 are for simple house connections
where toilet is flushed by pouring with buckets. Figures 4.36 to 4.38
are for full house connection with adequate water supply conditions.
In this case, the shower, the sink taps, the water closet and kitchen

92
connections are in full service. Figures 4.39 to 4.41 are for an
average Nigerian house located in an urban area where water is
purchased from commercial water suppliers. Figures 4.42 to 4.44 are
for the basic water requirement. Here, water is not in abundance but
is sufficient to meet basic needs. The residual depth per occupant is
then traced horizontally to meet the residual depth per occupant
curve. From this point, the line is produced vertically to cut the
length and width curves as well as the horizontal axis which
represents the area of the tank. The length and width are noted. The
volume of sludge corresponding to the desired (chosen) desludging
interval is obtained from Figure 4.31. The depth of sludge is obtained
by dividing the volume of sludge by the plane area read off from
Figures 4.33 to 4.44. The total depth of tank becomes the sum of
sludge depth, overall residual depth and depth of reserve volume.
The depth of the reserve space should be equal to the residual depth
because it is based on 24 hours detention time. If the overall depth of
the tank is much higher than the length, a lower overall residual
depth should be chosen and the design repeated.

93
Figure 4.31: Chart for Determining Volume of Sludge for a Chosen
Desludging Interval
0
0.1
0.2
0.3
0.4
0.5
0.6
0.7
0.8
0.9
1
0 2 4 6 8 10 12 14 16 18 20
Vo
lum
e o
f S
ep
tag
e (m
3/c
ap
ita
)
Time (Years)

94
Figure 4.32: Residual Depth per Occupant (hre) versus Number of Occupants
0
5
10
15
20
25
0 10 20 30 40 50 60 70 80
Res
idu
al D
epth
per
Occ
up
an
t (cm
)
Number of Occupants
Hre (10cm) Hre(20cm) Hre(30cm) Hre(40cm) Hre(50cm)

95
Figure 4.33: Tank Dimensions and Residual Depth for Simple House Connection, pour flush (Q=0.064m
3/capita/day) and L = 2w
0
1
2
3
4
5
6
7
8
9
10
0 5 10 15 20 25 30 35 40 45
Tank
Lin
ear D
imen
sion
(m)
Tank Plan Area (m2)
Tank Width (m) Residual Depth (cm) Tank Length (m)
NB: Residual depth obtained should be multiplied by the number of occupants

96
Figure 4.34:Tank Dimensions and Residual Depth for Full Simple House Connection, Pour Flush (Q=0.064m3/capita/day) and
L = 3w
0
2
4
6
8
10
12
0 10 20 30 40 50 60 70
Tan
k L
inea
r D
imen
sion
(m)
Tank Plan Area (m2)
Tank Width (m) Residual Depth (cm) Tank Length (m)
Tank Length (m)
Tank Width (m)
Residual Depth per occupant (cm)

97
Figure 2.35: Tank Dimensions and Residual Depth for Simple House Connection, Pour Flush (Q=0.064m
3/capita/day) and L = w
0
1
2
3
4
5
6
7
0 5 10 15 20 25 30
Ta
nk
Lin
ear
Dim
ensi
on
(m)
Tank Plan Area (m2)
Tank Width (m) Residual Depth (cm) Tank Length (m)
Tank Length (m)
Residual Depth per occupant (cm)

98
Figure 4.36: Tank Dimensions and Residual Depth for Full house connection, urban with garden (Q= 0.22) and L = 2w
0
2
4
6
8
10
12
14
1 3 5 7 9 11 13 15
Tan
k L
inea
r D
imen
sion
(m
)
Tank Plan Area (m2)
Tank Width (m) Residual Depth (cm) Tank Length (m)
Tank Length (m)
Tank Width (m)
Residual Depth per occupant (cm)

99
Figure 4.37: Tank Dimensions and Residual Depth for Full house connection, urban with garden (Q= 0.22) and L = 3w
0
2
4
6
8
10
12
14
0 2 4 6 8 10 12 14 16 18 20
Tan
k L
inea
r D
imen
sion
(m)
Tank Plan Area (m2)
Tank Width (m) Residual Depth (cm) Tank Length (m)
Tank Length (m)
Tank Width (m)
Residual Depth per occupant (cm)

100
Figure 4.38: Tank Dimensions and Residual Depth for Full house connection, urban with garden (Q= 0.22) and L = w
0
2
4
6
8
10
12
0 5 10 15 20 25 30 35 40 45
Tan
k L
inea
r D
imen
sion
(m)
Tank Plan Area (m2)
Tank Width (m) Residual Depth (cm) Tank Length (m)
Tank Length (m)
Residual Depth per occupant (cm)

101
Figure 4.39: Tank Dimensions and Residual Depth for Nigerian Average, Urban Areas without Pipe Borne Water (Q=0.03) and
L = 2w
0
1
2
3
4
5
6
0 2 4 6 8 10 12 14
Tan
k L
inea
r D
imen
sion
(m)
Tank Plan Area (m2)
Tank Width (m) Residual Depth (cm) Tank Length (m)
Tank Length (m)
Tank Width (m)
Residual Depth per occupant (cm)

102
Figure 4.40: Tank Dimensions and Residual Depth for Nigerian Average, Urban Areas without Pipe Borne Water (Q=0.03) and
L = 3w
0
1
2
3
4
5
6
7
0 2 4 6 8 10 12
Tan
k L
inea
r D
imen
sion
(m)
Tank Plan Area (m2)
Tank Width (m) Residual Depth (cm) Tank Length (m)
Tank Length (m)
Tank Width (m)
Residual Depth per occupant (cm)

103
Figure 4.41: Tank Dimensions and Residual Depth for Nigerian Average, Urban Areas without Pipe Borne Water (Q=0.03) and
L = w
0
1
2
3
4
5
6
0 5 10 15 20 25 30
Tan
k L
inea
r D
imen
sion
(m
Tank Plan Area (m2)
Tank Width (m) Residual Depth (cm) Tank Length (m)
Tank Length (m)
Residual Depth per occupant (cm)

104
Figure 4.42: Tank Dimensions and Residual Depth for Basic Water Requirement (Q=0.04) and L = 2w
0
1
2
3
4
5
6
0 2 4 6 8 10 12 14
Ta
nk
Lin
ear
Dim
ensi
on
(m)
Tank Plan Area (m2)
Tank Width (m) Residual Depth (cm) Tank Length (m)
Tank Length (m)
Tank Width (m)
Residual Depth per occupant (cm)

105
Figure 4.43: Tank Dimensions and Residual Depth for Basic Water Requirement (Q=0.04) and L = 3w
0
1
2
3
4
5
6
7
1 3 5 7 9 11 13 15
Ta
nk
Lin
ear
Dim
ensi
on
(m)
Tank Plan Area (m2)
Tank Width (m) Residual Depth (cm) Tank Length (m)
Tank Length (m)
Tank Width (m)
Residual Depth per occupant (cm)

106
Figure 4.44 Tank Dimensions and Residual Depth for Basic Water Requirement (Q=0.04) and L = w
0
1
2
3
4
5
6
7
0 5 10 15 20 25 30 35 40
Ta
nk
Lin
ear
Dim
ensi
on
(m)
Tank Plan Area (m2)
Tank Width (m) Residual Depth (cm) Tank Length (m)
Tank Length (m)
Residual Depth per occupant (cm)

107
(iii) Use of simple MS. Excel based programme
A simple Microsoft Excel programme has been written to aid quick
and easy sizing of the septic tank. All the relevant mathematical
relationships have been coded into cells in MS Excel worksheet; and
all the user needs to do is to enter the desired desludging interval,
wastewater flow per capita per day and number of occupants.
Immediately this is done Excel will automatically produce a series of
tank sizes corresponding to the chosen desludging interval and
number of occupants based on different residual depths. The
designer does not need to write a fresh programme, neither can he
modify the codes in this programme because the cells containing
formulae have been protected to prevent modification. However, the
cells for receiving input have been clearly distinguished and are not
protected.
All the designer needs to do is to use engineering judgement to select
the appropriate dimensions. However, in order to aid the designer
who might get confused as to which dimension to choose, a
conditional formatting has been performed on the depth row such
that Excel highlights all the tank dimensions whose depths are less
than the length but greater than the width (Figure 4.45). It should be
noted that all the tanks whose dimensions are generated by this
programme for a specified desludging interval, flow rate and number
of occupants will have the same volume and require desludging at
the same time. However, it has been established that narrower tanks
enhance solids removal.
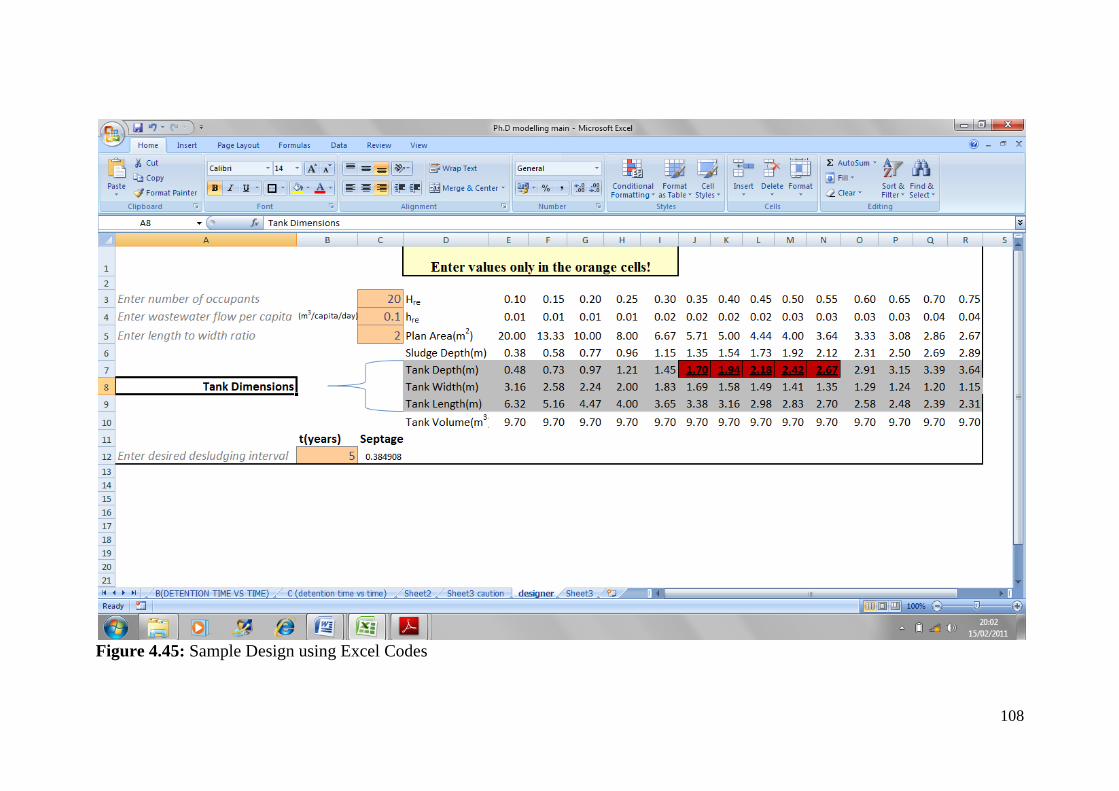
108
Figure 4.45: Sample Design using Excel Codes

109
4.6 DESIGN EXAMPLE
In order to demonstrate the use of the design approach developed in this
research, a design example shall be presented using the three packages.
Consider a building that will accommodate 15 people in a typical Nigerian
middle class city, say Enugu. It is required to construct a septic tank that will
require desludging once every five years.
Solution
(i) Using Equations (3.44), (3.51) and (4.3)
Q = 0.03 m3/capita/per day (based on UNDP average Nigerian water
use)
t = 5 years.
First determine the volume of septage accumulated in five years
using Equation (4.1): )1(56.0021.0043.0 11.0 t
septage etV where t =
5
Substituting t = 5 in the equation, we obtain V = 0.384m3 per capita.
Hence the total volume of sludge accumulated is 0.384 X 15 =
5.76m3.
Next, we use Equation (3.44) (A
Qh re
re
) to obtain the plan area of
the tank. Equation (3.44) is for one occupant, so for N occupants, the
overall residual depth (Hre) = A
NQNh re
re
. Using a minimum
residual detention time of 24 hours (1 day) and an overall residual
depth of 15cm, and substituting in the above equation, we obtain the
plan area as:
20.315.0
103.015m
XXA
Hence the depth of sludge is obtained as
mA
Vy 92.1
3
76.5

110
Total depth of tank = depth of sludge + residual depth (hre) + depth
of reserve space ( hrev). But previously, it has been shown that hre =
hrev. Hence total depth (D) of tank = y + 2hre = 1.92+ 2 x 0.15 =
2.22.
Finally, a suitable length to width ratio is chosen. For this design, let
L/W = 2. Hence
mA
W 22.12
3
2
and L = 2.5m
The tank dimension is 2.5m(length) x 1.2m(width) x 2.2m(depth)
for a desludging interval of 5 years, a minimum residual
detention time of 24 hours and a minimum residual depth of
0.15m.
For a large population, the design dimensions may become
excessive. When this is the case, two septic tanks or more should be
designed or the desludging interval may be reduced.
(ii) Using of charts
First, an overall residual depth per occupant is chosen. In the
preceding solution, the overall residual depth was taken as 15cm
(0.15m). The population (15) is located on the horizontal axis of
Figure 4.32. From here, a vertical line is drawn to meet the curve for
0.15m overall depth (see Figure 4.46). The residual depth per
occupant (hre) is 1cm.
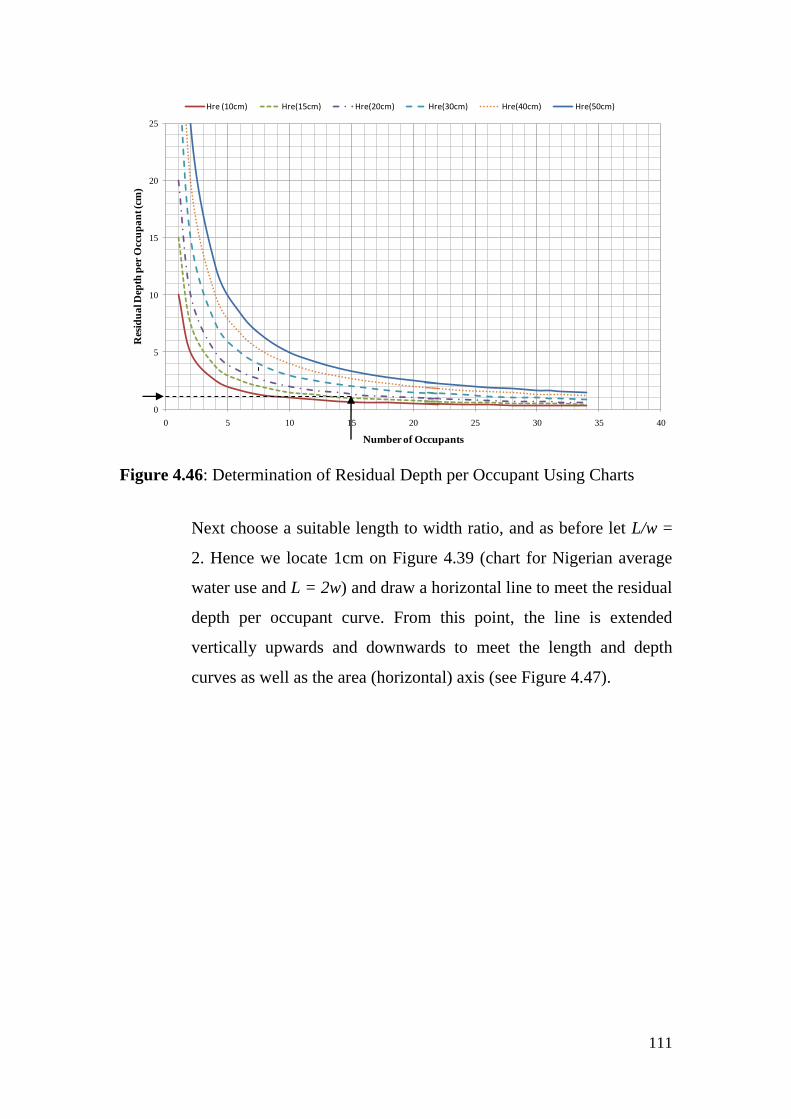
111
Figure 4.46: Determination of Residual Depth per Occupant Using Charts
Next choose a suitable length to width ratio, and as before let L/w =
2. Hence we locate 1cm on Figure 4.39 (chart for Nigerian average
water use and L = 2w) and draw a horizontal line to meet the residual
depth per occupant curve. From this point, the line is extended
vertically upwards and downwards to meet the length and depth
curves as well as the area (horizontal) axis (see Figure 4.47).
0
5
10
15
20
25
0 5 10 15 20 25 30 35 40
Res
idu
al D
epth
per
Occ
up
an
t (c
m)
Number of Occupants
Hre (10cm) Hre(15cm) Hre(20cm) Hre(30cm) Hre(40cm) Hre(50cm)

112
Figure 4.47: Determination of Tank Dimensions Using Charts
From Figure 4.47, L =2.4m, w =1.2m and A = 3m2. The depth of sludge
is obtained by dividing the volume of sludge obtained from Figure 4.31
with the area obtained. The total volume of sludge = 0.265 x 15 =
5.76m3, hence the depth of sludge (y) = 5.76/3 =1.92m. Finally, the total
depth of tank (D) = y + 2 x 0.15= 1.92 + 0.3 = 2.22m.
The tank dimension is 2.4m (length) x 1.2m (width) x 2.2m (depth) for
a desludging interval of 5 years, a minimum residual detention time
of 24 hours and a minimum residual depth of 0.15m. The slight
differences between these dimensions and those previously used
stemmed from the interpolation and reading errors inherent in the use of
graphs. However, for all intents and uses, the two tanks are practically
the same.
(iii) Using Excel Code
This is the simplest and most straightforward of the three
approaches. The only values required to be entered are wastewater
flow Q (m3/capita/day), suitable desludging interval in years (Excel
converts it to days before using it to compute), the number of

113
occupants and the desired length to width ratio. As can be seen from
Figure 4.48, tank dimensions corresponding to overall residual
depths from 0.1m to 0.75m will automatically be generated so that
the designer can make a pick. For a residual depth of 0.15m (used in
two previous approaches), the corresponding tank dimensions are
2.45m (length), 1.22m (width) and 2.07m(depth) to two decimal
places. Any other suitable dimensions can also be chosen from the
array of results.
Figure 4.48: Tank Design Using Excel Codes
Hence the tank dimension is 2.5m (length) x 1.3m (width) x 2.1m (depth) for
a desludging interval of 5 years, a minimum residual detention time of 24
hours and a minimum residual depth of 0.15m
4.7 CAUTION FOR USERS
The septic tank system is an on-site wastewater treatment facility and is
therefore limited in capacity. The septic tank system is most suitable for
individual buildings and as water use and number of users increase, the design
size can become unwieldy, making the system uneconomical and difficult to
114
maintain. For several dwelling units or housing estates, the option of a central
wastewater treatment unit such as waste stabilization pond is preferable.
115
CHAPTER FIVE
CONCLUSION AND RECOMMENDATIONS
5.1 CONCLUSION
The septic tank is pivotal to wastewater treatment as well as public health
especially in developing countries where central treatment plants are not
affordable. Just like every other waste management facility, the septic tank
deserves a rational design approach rather than the current haphazard sizing
method currently being employed. A preliminary investigation showed that
septic tank malfunctioning is common as a result of poor design, construction
and maintenance. In order to address this anomaly, a new design approach was
developed in this research. This method is based on specifying a desired
desludging interval, a minimum residual detention time and a residual depth. A
sludge accumulation model was developed and calibrated for the purpose of
estimating sludge accumulation per capita. This model shows that sludge
accumulation in septic tank is not constant as is commonly assumed.
It has also been shown that because the septic tank is also a storage system, the
detention time reduces as sludge accumulates. Charts that show the decline of
detention time with sludge accumulation have been produced. These charts
show that the usual recommendation that septic tanks be desludged when they
are one-third full could be irrational most of the times. It was shown that a tank
that is one-third full may still have enough residual detention time for optimal
performance. A more rational approach is that septic tanks should be desludged
when they no longer have enough detention time for efficient performance. In
order to simplify the new design approach, charts have been produced to aid
the designer who may not be learned enough to use the equations presented.
The reason for this is that preliminary investigation showed most people who
undertake the construction of buildings have no formal education in
engineering. This set of people will be more at ease with charts. The steps for
the new design approach have also been coded into cells in a Microsoft Excel
worksheet to facilitate design for the computer literate designer. All the

116
designer needs to supply are the desired desludging interval, wastewater
discharge, number of users and a desired length to width ratio. Several septic
tank dimensions appropriate for these conditions will be generated and designer
can make a choice by applying engineering judgment.
In summary:
Every septic tank is unique and therefore should be designed taking
cognisance of the number of users, desired desludging interval and
expected wastewater flow which is a function of water availability.
Users should always know when to expect to desludge their tanks. This
should be an intrinsic aspect of the design. Septic tanks should have
enough initial volume for long term storage of sludge to avoid frequent
desludging. Tanks with small initial volumes soon get silted up with
sludge thus requiring frequent desludging;
Concrete splash baffles should be completely phased out. Inlet tees
should be used instead;
All septic tanks should not be designed for a detention time of 24 hours
and desludging must not always necessary follow the one third tank
volume sludge accumulation specification. The designer should be able
to know whether his chosen detention time will maintain the desired
efficiency with regard to suspended solids removal efficiency and for
how long.
5.2 RECOMMENDATIONS
Based on the outcome of this research, the following recommendations are
necessary:
A general awareness campaign on the indispensable role of septic tanks
in municipal wastewater management and public health should be
mounted by the government and non-governmental organizations. In this

117
campaign, the place of proper design, construction and maintenance
should be emphasized.
People should not wait for their septic tanks to be overflowing with
sludge before desludging as this reduces the life span of the whole
system and also reduces the efficiency of the drain field or soak pit.
The Federal Ministry of Environment should support an extensive test of
this design approach and then incorporate it into the Nigerian septic
tanks design standard.

118
REFERENCES
Agunwamba, J. C. (2001). Waste Engineering and Management Tool.
Immaculate Publications Ltd., Enugu.
Ahmed, W., Neller, R. and Katouli, M. (2005). Evidence of septic system
failure determined by a bacterial biochemical fingerprinting method.
Journal of Applied Microbiology, 98, pp 910 – 920.
Al-Layla, A. M. and Al-Rawi, S. M. (1989). Evaluation of septic tank
performance in some parts of Mosul City in Iraq. Journal of
Environmental Science and Health, Part A, 24: 5, pp 543 – 556.
Aluko, T. M. (1978). The septic tank in nigerian building practice. Nigerian
Journal of Engineering and Technology Vol. 1 July/August 1978, pp.
33-42.
Baudisöva, D. (1997). Evaluation of Escherichia coli as the main indicator in
fecal pollution. Water Science and Technology.
Baumann, E. R., Jones, E. E, Jakubowski, W. M. and Nottingham, M. C,
(1978). Septic tanks in home sewage treatment: Proceedings of the
Second International Home Treatment Symposium. American Society of
Agricultural Engineers, St. Joseph, MI, pp 38-53
Blostein, J. (1991). Shigellosis from swimming in a park in Michigan. Public
Health Reports, 106: pp 317–322.
Bouma, J., Ziebell, W. A., Walker, W. G., Olocott, P. G., McCoy, E. and Hole,
F. D. (1972). Soil absorption of septic tank effluent: A field study of
some major soils in Wisconsin. Information Circular no. 20.
University of Wisconsin Extension Geological and Natural History
Survey, Madison, WI.
Bounds, T. R. (1997). Design and performance of septic tanks. Conference of
the American Society for Testing and Materials, Philadelphia,
Pennsylvania.
Bounds, T. R. (1995). Septic tank septage pumping intervals, Proceedings 8th
Northwest On-Site Wastewater Treatment Short Course and Equipment
Exhibition, University of Washington, Seattle, WA.

119
Bounds, T. R. (1994). Septic tank septage pumping intervals. Conference of
the American Society of Agricultural Engineers, in Atlanta, Georgia.
Bounds, T. R. (1990). Glide Audit 1986-1987 summary of sludge and scum
accumulation rates. Conference sponsored by the Rural Community
Assistance Corporation (RCAC), in San Francisco, California.
Bridgman, S.A., Robertson, R. M. P., Syed, Q., Speed, N., Andrews, N. and
Hunter, P. R.(1995). Outbreak of cryptosporidosis associated with a
disinfected groundwater supply. Epidemiology and Infection. Vol.
115, pp 555-556.
Burubai, W., Akor, A. J., Lilly, M. T. (2007). performance evaluation of a
septic system for high water-table areas. American Eurasian Journal
of Scientific Research 2 (2), pp112-116.
Canter, L. and Knox, R. (1985). Septic tank system effects on groundwater
quality. Lewis Publishers, Chelsea, MI, USA.
Close, M. E., Hodgson, L. R. and Tod, G. (1989). Field evaluation of
fluorescent whitening agents and Sodium Tripolyphosphates as
indicators of septic tank contamination in domestic wells. N.Z.J.
Mar. Freshwater Res. 23, pp 563-568
Cogger, C. (1988). On-site septic systems: the risk of groundwater
contamination. Journal of Environmental Health, Vol. 51, No.1, pp 12-
16.
Collick, A.S., Eaton, M.Z. Montalto, A. F, Gao, B., Kim, Y., Day, L. and
Steenhuis, S. T. (2006). Hydrological evaluation of septic disposal
field design in sloping terrain. Journal of Environmental Engineering
(ASCE) 0733-9372 (2006) 132:10, pp. 1289 - 1297
Cransberg, K., Van den Kerkhof, J. H., Banffer, J. R., Stijnen, C., Wernors, K.,
Van de Kar, N. C., Nauta, J., and Wolff, E. D. (1996). Four cases of
haemolytic uremic syndrome – source contaminated swimming water?
Clinical Nephrology, 46, pp 45–49.
Crites, R. W. and Tchobanoglous, G. (1997). Small and Decentralized
Wastewater Management Systems, McGraw-Hill, New York.

120
Dunbar, W. (1907). Principles of Sewage Treatment. Translated in 1908 by
H.T. Calvert. Griffin, London
Galmes, A., Nicolau A., Arbona, G., Gomis, E., Guma, M., Smith-Palmer, A.,
Hernandez-Pezzi, G., Soler, P. (2003). Cryptosporidiosis outbreak in
British tourists who stayed at a hotel in Majorca, Spain.
Eurosurveillance Weekly, 7(33).
Gary, F. N. (1995). The influence of sludge accumulation rate on septic tank
design. Environmental Technology ISSN 0959-3330, vol. 16, No.8,
pp. 795 – 800.
Geary, P. M. and Gardner, E. A. (1998). Sustainable on-site treatment systems,
individual and small community sewage systems. St. Joseph, Michigan.
American Society of Agricultural Engineers.
Gleick, P. H. (1996). Basic water requirement for human activities: meeting
basic needs. Water International, 21, pp 83 – 92.
Gordon, D. G. (1989). Managing Non-point Pollution. An Action Plan
Handbook for Puget Sound Watershed, Seattle, W. A: Puget Sound
Water Quality Authority.
Greensmith, C. T., Stanwick, R. S., Elliot, B. E., Fast, M. V. (1988). Giardiasis
associated with the use of a water slide. Pediatric Infectious
Diseases Journal, 7, pp 91–94.
Gross, M.A (1987). Assessment of the effects of household chemicals upon
individual septic tank performances. University of Arkansas at Little
Rock, Graduate Institute of Technology, Little Rock, AR 72203,
Publication No. 131
Heinss, U., Larmie, S. A. and Strauss, M. (1999). Characteristics of Fecal
Sludges and their Solids-Liquid Separation. SANDEC/EWAG, January
1999.
Ignatius, I. and Jowett, C. (2004). The Effect of household chemicals on
septic tank performance. Presented at the 2004 ASAE Conference,
Sacramento CA.

121
Jelliffe, P. A. (1995). Managing of On-site Effluent Disposal: Conclusions
from a Study on the Performance of 101 Systems in Maroochy Shire,
Queensland, Australia. Report Prepared for Maroochy Shire Council.
Jowett, E. C. and Lay, R. (2005). Comparative performance of closed-conduct,
laminar flow septic tanks. Submitted to Small Flow Quarterly,
University of West Virginia (In press).
Jowett, E. C., (2007). Comparing the performance of prescribed septic tank to
long, narrow, flooded design. Presented at 2007 WEFTEC Technical
Program 16. San Diego CA.
Kamel,. M. and Hgazy, B. E. (2006). A septic tank system: on site disposal.
Journal of Applied Sciences 6 (10), pp 2269-2274.
Kansas State Department of Health and Environment (1997). Minimum
Standards for Design and Construction of Onsite Wastewater System.
Bulletin 4-2, March.
Karathanasis, A. D., Mueller, T. G., Boone, B. and Thompson, Y. L. (2006).
Effects of soil depth and texture on fecal bacteria removal from septic
effluents. Journal of Water and Health, 04.3, pp 395 – 404.
Keeny, D. (1986). Sources of nitrate to ground water. CRC Critical Reviews
in Environmental Control. Vol. 16, pp. 257-304
Koottatep, T., Wanasen, A. and Schertenleib, R. (2004). Potential of the
anaerobic baffled reactor as decentralized wastewater treatment
system in the tropics. Presented at the 1st International Conference on
Onsite Wastewater Treatment and Recycling in Perth, Australia.
February 2004.
Kriessl, J.F. (1971). Waste treatment for small flows. Paper Presented to the
1971 Annual Meeting, American Society of Agricultural Engineers.
Washington State University, Pullman, Washington, June 27-30, 1971.
Lay, R., Weiss, M., Pataky, K and Jowett, E. C. (2005). Rethinking hydraulic
flow in septic tanks. Environmental Science & Engineering V. 18, No.
1 (March), pp. 50-52

122
Nguyen, V. A., Pham, T. N., Nguyen, H. T., Morel, A. and Tonderski, K. S.
(2007) Proceedings of the 2007 IWA-NOWRA International
Conference. March, Baltimore Maryland, USA.
Nicosia, L. A., Rose, J. B., Stark, L. and Stewart, M. T. (2001). A field study
of virus removal in septic tank drain fields. Journal of Environmental
Quality 30, pp 1933-1939.
Nirel, P. M. and Revaclier, R. (1999). Assessment of sewage treatment plants
effluents impact on river water quality using dissolved Rb/Sr ratio.
Environ. Sci. Technol., 33, pp 1996 - 2000.
Novac, J. T., McDaniel, C. R and Howard, S. C. (1990). The effect of boat
holding tank chemicals on treatment plant performance. Res J. Water
Pollut. Control Fed. 62 (288): 288-295.
Paing, J., Picot, B., Sambuco J. P. and Rambaud A., (1999). Sludge
accumulation and methanogenic activity in anaerobic lagoon. Water
Science and Technology.
Pang, L., Close, M., Goltz, M., Sinton, L., Davies, H., Hall, C and Santon, G.
(2003). Estimation of septic tank setback distance based on E.Coli and
F. RNA phages. Environ. Intl., 29, pp 907-921.
Pang, L., Nokes, C., Simunek, J., Kikkert, H. and Hector, R. (2006). Modeling
the impact of clustered septic tank system on groundwater quality.
Vadoze Zone J.5, pp 599-609.
Poe, K. F. (2001). Antibacterial products in septic systems. problem
environments for septic systems and communal treatment options,
Conference Proceedings. Waterloo Centre for Groundwater Research,
University of Waterloo.
Public Works Department (1943). Information Book, Sanitary Structures, 19 – 22.
Lagos, Nigeria.
Rahman, M., Shahidullah, A. H. M. and Ali, A. (1999). An Evaluation of
septic tank performance. 25th
WEDC Conference, Addis Ababa,
Ethiopia, 1999.

123
Rock, C. A. and Boyer, J. A., (1995). Influence of design on septic tank
effluent quality: in Proceedings, 8th
On-site Wastewater Treatment Short
Course and Equipment Exhibition, Seattle W.A. pp 45-62.
Rose, J. B. and Gerba, C. P. (1991). Use of risk assessment for development of
microbial standards. Water Sci. Technol., 24, pp 29-34.
Saqqar, M. M. and Pescod, M. B. (1995). Modelling sludge accumulation in
anaerobic wastewater stabilization ponds. Wat. Sci. Tech. No 12, pp 185
– 190.
Scalf, M. R., Dulap, W. J. and Kreissel, J. P. (1997). Environmental effects of
septic tank systems. US Environmental Protection Agency 18, EPA-
600/3-77-096.
Seabloom, R. W., Bounds, T., and Loudon, T. (2004). Septic Tanks
http:/./www.onsiteconsortium.org./files/septictankspaper.pdf62p
Siegrist, R., Witt, M. and Boyle, W. (1976). Characteristics of rural household
wastewater .J. Env. Eng. ASCE Vol. 102, pp. 533 – 548.
Taylor, J. W., Gary, G. N. and Greenberg, H. B. (1981). Norwalk-related
viral gastroenteritis due to contaminated drinking water. American
Journal of Epidemiology. Vol. 114, No. 4, pp 584-592.
United Nations Development Programme (2006). Human Development Report.
www.data360.org.
Vaishnav, D. D. and McCabe, J. W. (1996). Development of an anaerobic
sludge respiration inhibition test and its use to assess septic tank
safety of consumer products. Environmental Toxicology and
Chemistry, 15 (5), pp 663-669.
Washington, B., Ong, S. K., Smith, W. L. and McCabe, J. W. (1997). Fate of
absorbable organic halides from bleaching laundering in septic tank
systems. Env. Toxic and Chem. 17 (3): 398-403.
Watson, K. S., Farrell, R. P. and Anderson, J. S. (1967). The contribution from
individual homes to the sewer system. Journal of the Water Pollution
Control Federation.

124
Weibel, S. R., Bendixen, T. W. and Coulter, J. B. (1955). Studies on household
sewage disposal systems, Part III,” U.S. Public Health Service
Publication No. 397.
Weissman, J. B., Graun, G. F., Lawrence, D. N., Pollard, R. A., Saslaw, M. S.
and Gangarosa, E.J. (1976). An epidemic of gastroenteritis traced to a
contaminated pupil water supply. American Journal of Epidemiology.
Vol. 103, No.4, pp 391-398.
Wilhelm S. R, Schiff, S. L and Cherry, J. A. (1994). Biochemical evolution of
domestic wastewater in septic system: a conceptual model. Ground
Water Vol 32, No. 6, November –December 1994.
Winneberger, J. H. T., (1984). “The Septic Tank”. In Septic Tank Systems, a
Consultant‟s Toolkit. Volume II. Butterworth, Boston, 123p.
Yates, M. (1985). Septic tank density and groundwater contamination.
Groundwater 23, pp 586 – 591.

125
APPENDIX I: EXPERIMENTAL RESULTS
Table A1: Readings Obtained on 17/08/2010
Parameter Influent AM AO BM BO CM CO DM DO
pH 7.2 7.6 7.5 7.7 7.5 7.3 7.2 7.5 7.4
SS(mg/l) 166 126 160 160 68 56 104 163 165
Coliform (MPN/100ml) 23000000 240000 240000 240000 110000 240000 110000 240000 240000
BOD(mg/l) 1020 144 66 60 30 150 78 48 66
COD(mg/l) 2360 192 200 240 212 268 240 192 168
E-Coli(MPN/100ml) 9000000 7500 700 700 700 1400 1400 1400 400
Table A2: Readings Obtained on 19/08/2010
Parameter Influent AM AO BM BO CM CO DM DO
pH 6.9 7.3 7.3 7.2 7.1 7.4 6.9 7.4 7.2
SS(mg/l) 166 94 44 166 164 128 166 130 102
Coliform (MPN/100ml) 30000000 430000 750000 2100000 460000 2100000 2100000 1500000 430000
BOD(mg/l) 525 105 173 105 110 98 103 93 83
COD(mg/l) 944 160 180 300 320 252 240 220 200
E-Coli(MPN/100ml) 3000000 30000 40000 210000 70000 70000 70000 40000 30000

126
Table A3: Readings Obtained on 24/08/2010
Parameter Influent AM AO BM BO CM CO DM DO
pH 6.7 7.2 7.1 7.1 7.1 7 7 7.3 7.2
SS(mg/l) 608 272 100 286 248 190 190 20 300
Coliform (MPN/100ml) 2100000 70000 70000 1500000 200000 30000 140000 930000 280000
BOD(mg/l) 960 108 168 120 88 118 115 65 100
COD(mg/l) 1584 280 260 272 268 280 240 144 120
E-Coli(MPN/100ml) 150000 110000 40000 70000 70000 30000 70000 90000 30000
Table A4: Readings Obtained on 26/08/2010
Parameter Influent AM AO BM BO CM CO DM DO
pH 6.9 7.1 7 7.3 7.1 7 6.9 7 7.1
SS(mg/l) 286 238 206 264 248 202 152 228 236
Coliform (MPN/100ml) 2400000 24000 9300 2800 1500 700 2000 300 900
BOD(mg/l) 285 127 130 111 183 102 119 107 156
COD(mg/l) 424 140 140 144 120 212 160 200 180
E-Coli(MPN/100ml) 30000 2100 900 700 300 300 300 300 300
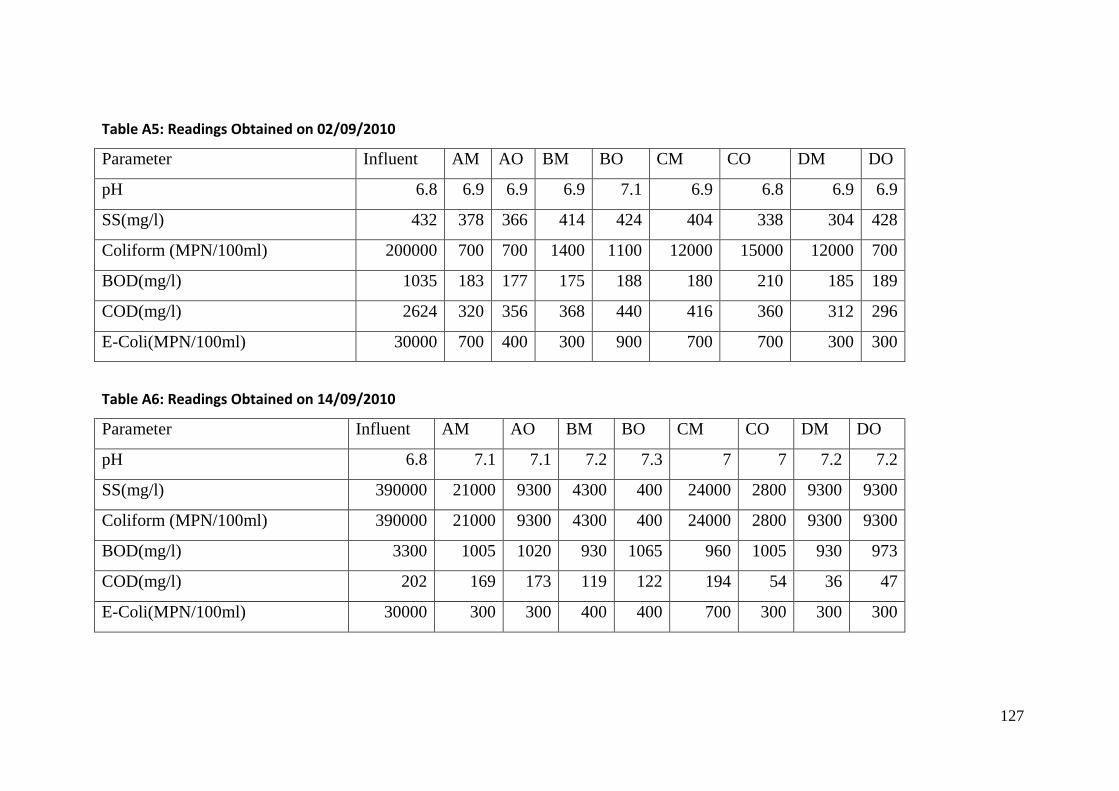
127
Table A5: Readings Obtained on 02/09/2010
Parameter Influent AM AO BM BO CM CO DM DO
pH 6.8 6.9 6.9 6.9 7.1 6.9 6.8 6.9 6.9
SS(mg/l) 432 378 366 414 424 404 338 304 428
Coliform (MPN/100ml) 200000 700 700 1400 1100 12000 15000 12000 700
BOD(mg/l) 1035 183 177 175 188 180 210 185 189
COD(mg/l) 2624 320 356 368 440 416 360 312 296
E-Coli(MPN/100ml) 30000 700 400 300 900 700 700 300 300
Table A6: Readings Obtained on 14/09/2010
Parameter Influent AM AO BM BO CM CO DM DO
pH 6.8 7.1 7.1 7.2 7.3 7 7 7.2 7.2
SS(mg/l) 390000 21000 9300 4300 400 24000 2800 9300 9300
Coliform (MPN/100ml) 390000 21000 9300 4300 400 24000 2800 9300 9300
BOD(mg/l) 3300 1005 1020 930 1065 960 1005 930 973
COD(mg/l) 202 169 173 119 122 194 54 36 47
E-Coli(MPN/100ml) 30000 300 300 400 400 700 300 300 300

128
Table A7: Readings Obtained on 28/09/2010
Parameter Influent AM AO BM BO CM CO DM DO
pH 6.8 7.2 7 7.4 7.3 7.5 7.2 7.3 7.5
SS(mg/l) 974 689 752 776 832 795 674 680 702
Coliform (MPN/100ml) 200000 7500 15000 110000 24000 4300 2000 2800 21000
BOD(mg/l) 2850 1920 2100 1680 1740 2350 2200 2050 2350
COD(mg/l) 295 288 160 188 212 116 88 120 220
E-Coli(MPN/100ml) 30000 300 300 1500 300 900 1100 700 1100
Table A8: Readings Obtained on 12/10/2010
Parameter Influent AM AO BM BO CM CO DM DO
pH 7.3 7.5 7.4 7.5 7.5 7.4 7.3 7.5 7.4
SS(mg/l) 17062 15262 6840 9312 5406 1282 4830 4934 7764
Coliform (MPN/100ml) 24000000 2100000 24000000 4600000 11000000 11000000 24000000 1200000 2100000
BOD(mg/l) 3000 1920 1560 1860 1500 780 3120 1980 2040
COD(mg/l) 216 128 148 128 68 48 56 48 52
E-Coli(MPN/100ml) 90000 110000 30000 30000 30000 70000 30000 30000 30000

129
Table A9: Readings Obtained on 19/10/2010
Parameter Influent AM AO BM BO CM CO DM DO
pH 7.1 7.4 7.4 7.5 7.4 7.4 7.4 7.5 7.4
SS(mg/l) 452 186 284 300 104 240 174 274 282
Coliform (MPN/100ml) 24000000 11000000 4600000 11000000 4600000 230000 11000000 11000000 1500000
BOD(mg/l) 2920 2340 1740 1920 1560 2160 1560 1680 1860
COD(mg/l) 1220 32 40 25 61 54 61 86 95
E-Coli(MPN/100ml) 30000 30000 30000 30000 30000 30000 30000 40000 30000
Table A10: Readings Obtained on 28/10/2010
Parameter Influent AM AO BM BO CM CO DM DO
pH 7.4 7.46 7.3 7.7 7.8 7.3 7.1 7.1 7.1
SS(mg/l) 1234 328 401 398 429 547 521 644 572
Coliform (MPN/100ml) 150000 70000 90000 150000 150000 70000 30000 90000 150000
BOD(mg/l) 2700 2160 2640 2160 2340 1650 1900 1850 1900
COD(mg/l) 828 135 141 110 73 98 167 64 65
E-Coli(MPN/100ml) 110000 70000 90000 70000 30000 30000 30000 30000 30000

130
Table A11: Readings Obtained on 11/11/2010
Parameter Influent AM AO BM BO CM CO DM DO
pH 7.5 7.4 7.4 7.8 7.8 7.3 7.2 7.1 7.2
SS(mg/l) 874 510 392 400 438 453 374 560 448
Coliform (MPN/100ml) 24000000 11000000 24000000 15000000 24000000 700000 21000000 280000 24000000
BOD(mg/l) 2970 1860 1705 1793 1380 851 2030 2004 2049
COD(mg/l) 856 168 148 32 84 100 140 80 60
E-Coli(MPN/100ml) 70000 40000 30000 30000 70000 30000 40000 40000 30000
Table A12: Readings Obtained on 18/11/2010
Parameter Influent AM AO BM BO CM CO DM DO
pH 7.1 7.3 7 7.7 7 7.3 6.9 7.2 7.3
SS(mg/l) 406 144 326 100 164 130 694 702 516
Coliform (MPN/100ml) 11000000 210000 280000 280000 2100000 90000 11000000 1200000 140000
BOD(mg/l) 2280 1920 2280 2040 2160 1320 2220 2100 2100
COD(mg/l) 268 88 232 132 52 132 132 124 84
E-Coli(MPN/100ml) 40000 30000 30000 30000 40000 30000 40000 40000 40000

131
Table A13: Readings Obtained on 25/11/2010
Parameter Influent AM AO BM BO CM CO DM DO
pH 7.2 7.3 7.3 7.7 7.7 7.3 7.4 7.2 7.3
SS(mg/l) 2536 260 278 354 86 74 186 164 410
Coliform (MPN/100ml) 430000 430000 230000 230000 40000 90000 150000 110000 200000
BOD(mg/l) 2890 1840 1732 1755 1430 975 1980 2010 2086
COD(mg/l) 1784 152 152 80 63 144 120 96 172
E-Coli(MPN/100ml) 30000 30000 30000 30000 40000 40000 70000 90000 40000

132
Table A14: Temperature Values (0C)
Date A B C D
17/08/1010 28 26 26.7 27
19/08/2010 - - -
24/08/2010 24 24 25 24
26/08/2010 - - -
02/09/2010 25 25 26 26
14/09/2010 26 26 26 26
28/09/2010 25.5 26 25 25
12/10/2010 27.5 27 27.5 28
19/10/2010 27 27.5 27 27
28/10/2010 28 26 27 28
11/11/2010 - - - -
18/11/2010 31 33 30 31
25/11/2010 28.5 29 28.5 28

133
APPENDIX II: IMPLEMENTATION OF EXCEL PROGRAMME
Sludge Volume
Equation 4.3 was coded into cell C12 of Figure 4.45 as follows:
= 0.043+0.021*B12-0.56*(exp(1-0.11*B12)-1)
Overall Residual Depth
The overall residual depths for different possible dimensions were specified in
cells E3 to R3. These cells do not contain any formula.
Residual Depth
Cells E4 to R4 contain residual depth per occupant. It was obtained by dividing
the overall residual depth by the number of occupants. For instance, the
formula in cell E4 is:
= E3/$C3
Plan Area
Cells E5 to R5 contains formulae (Equation 3.44) for plan area. For E21, the
formula is
= $C4/E4
C4 contains the specified number of occupants while E4 contains the residual
depth per occupant. The notation $ was used before C4 in order to hold the
value of C4 constant.
Sludge Depth
Cells E6 to R6 contain sludge depth for different residual depths. The sludge
depth was obtained by dividing the product of sludge volume per capita (cell
C12) and population (cell C3) by the plane area. The formula in cell E6, for
instance is:
=$C3*$C12/E5
Tank Depth
The tank depth was obtained by adding the sludge depth to the overall residual
depth. The formulae are contained in cells E7 to R7:
=E6+E3
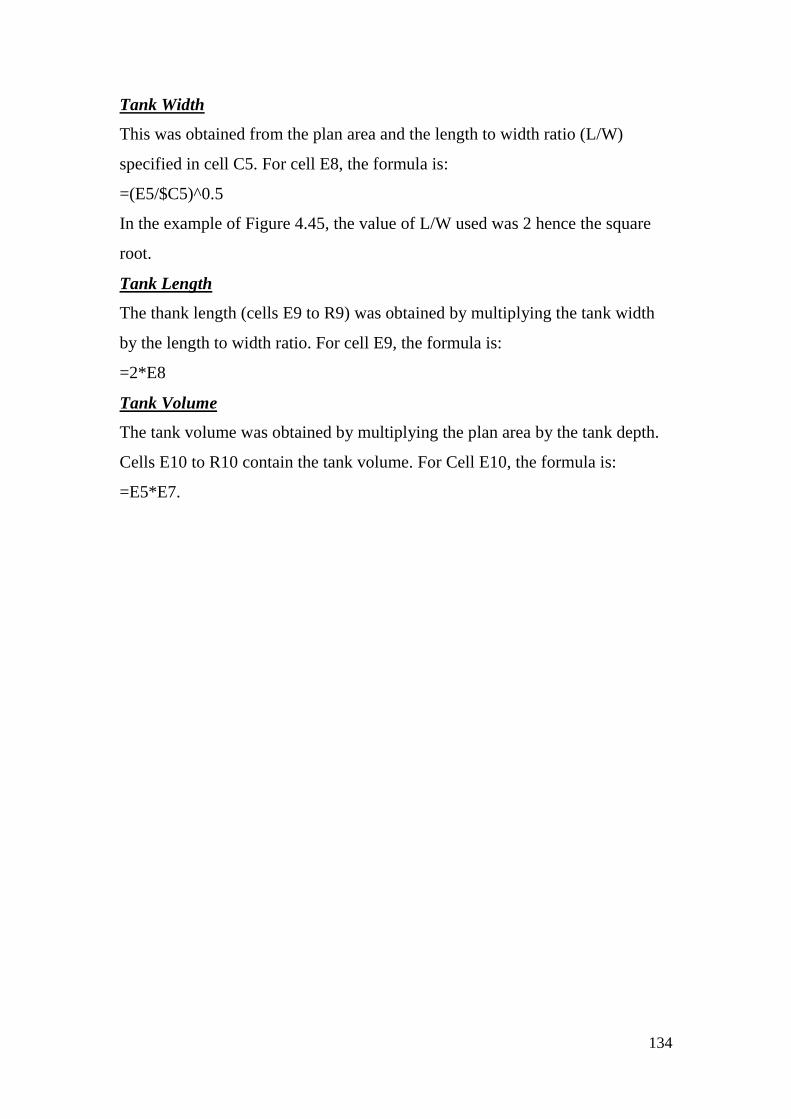
134
Tank Width
This was obtained from the plan area and the length to width ratio (L/W)
specified in cell C5. For cell E8, the formula is:
=(E5/$C5)^0.5
In the example of Figure 4.45, the value of L/W used was 2 hence the square
root.
Tank Length
The thank length (cells E9 to R9) was obtained by multiplying the tank width
by the length to width ratio. For cell E9, the formula is:
=2*E8
Tank Volume
The tank volume was obtained by multiplying the plan area by the tank depth.
Cells E10 to R10 contain the tank volume. For Cell E10, the formula is:
=E5*E7.