title oxidation-state control of nanoparticles synthesized
TRANSCRIPT

RIGHT:
URL:
CITATION:
AUTHOR(S):
ISSUE DATE:
TITLE:
Oxidation-State Control ofNanoparticles Synthesized viaChemical Reduction UsingPotential Diagrams
Yagi, Shunsuke; Nakanishi, Hidetaka; Ichitsubo,Tetsu; Matsubara, Eiichiro
Yagi, Shunsuke ...[et al]. Oxidation-State Control of Nanoparticles Synthesized viaChemical Reduction Using Potential Diagrams. JOURNAL OF THE ELECTROCHEMICALSOCIETY 2009, 156(8): D321-D325
2009
http://hdl.handle.net/2433/109936
© 2009 The Electrochemical Society

Oxidation-State Control of Nanoparticles Synthesized viaChemical Reduction Using Potential DiagramsShunsuke Yagi,*,z Hidetaka Nakanishi, Tetsu Ichitsubo, and Eiichiro Matsubara
Department of Materials Science and Engineering, Kyoto University, Kyoto 606-8501, Japan
A general concept for oxidation-state control of nanoparticles synthesized via chemical reduction has been developed. By com-paring kinetically determined mixed potential measured in reaction solution and thermodynamically drawn potential diagrams,e.g., potential–pH diagram, it is possible to know “what chemical species is stable in the reaction solution?.” It is predicted frompotential diagrams that nanoparticles in different oxidation states can be selectively synthesized by controlling mixed potential.This concept is verified by selectively synthesizing Cu and Cu2O nanoparticles from CuO aqueous suspension via chemicalreduction using the concept as an example. The dependency of mixed potential on pH and temperature is discussed in detail forthe selective synthesis of nanoparticles.© 2009 The Electrochemical Society. �DOI: 10.1149/1.3151966� All rights reserved.
Manuscript submitted March 13, 2009; revised manuscript received May 8, 2009. Published June 19, 2009.
Copper �Cu� nanoparticles are of great interest in various fields,specifically that of printable electronics. Cu interconnects less than20 �m wide can be made with a high resolution screen printer or asuper inkjet printer using an ink which contains dense Cu nanopar-ticles. Cu nanoparticles have been synthesized by various reductionprocesses from cupric or cuprous compounds, including direct elec-trochemical reduction,1-3 chemical reduction,4-8 thermal reduction,9
sonochemical reduction,9,10 laser irradiation,11 and gammaradiolysis.12 Many of these methods are conducted in liquid phaseand are often called “liquid-phase reduction.” Liquid-phase reduc-tion can generate nanoparticles in large quantity in a single processand also has the important advantage that nanoparticles can beformed in the presence of dispersing agents and no additional pro-cess for the addition of dispersing agents is required for the fabrica-tion of inks to avoid the agglomeration.
Cuprous oxide �Cu2O� is a p-type semiconductor13 and is also apromising material with potential applications in solar energy con-version, microelectronics, magnetic storage, catalysis, and gassensing.14 Cu2O is also used for the investigation into Bose–Einsteincondensation of excitons.15 Many methods have been reported tosynthesize Cu2O nanoparticles,14,16,17 nanocubes,18,19 octahedralnanocages,20 and nanowires.21 For example, Muramatsu and Sug-imoto reported that Cu2O particles with an average diameter of270 nm were synthesized in large quantities from a CuO aqueoussuspension using hydrazine as the reducing agent.16 Liu et al.formed CuO, Cu2O, and Cu nanoparticles using copper�II� acetylac-etonate �Cu�acac�2� as a precursor in oleylamine by controllingtemperature.17 Although many synthesis methods of Cu and Cu2Onanoparticles have been reported, the synthesis processes have notbeen well discussed from the viewpoint of thermodynamics.
Against such a background, we propose a general concept foroxidation-state control of nanoparticles synthesized by chemical re-duction using potential diagrams. In the present paper, the conceptfor oxidation-state control is described and verified by selectivelysynthesizing Cu and Cu2O nanoparticles from a CuO aqueous sus-pension by chemical reduction as an example. The advantage of thischemical reduction method in liquid phase is that abundant nanopar-ticles can be obtained for a short time by a simple operation.22,23 Anextremely small activity of Cu2+ aquo ion is achieved by usinginsoluble CuO powder as a Cu�II� ionic source, which is a key forthe synthesis of nanosized particles.
Theory
In this section, a general concept for selective synthesis of nano-particles will be introduced. All the data considered and used forthermodynamic calculation are listed in Table I.24-27 The constant a
and coefficients b and c for the specific-heat capacity of hydrazineare only estimated by fitting the discrete data of the specific heatcapacity of hydrazine in the temperature range from 100 to 600 K.27
At any point within the reaction volume, several partial reactionsoccur in parallel. The potential at a point is determined at the valuewhere the total of anodic currents Ia,total balances the total of ca-thodic currents Ic,total unless current flows outside �Fig. 1�. This po-tential is called the mixed potential. Stable chemical species in thereaction solution can be determined by comparing measured mixedpotential and calculated potential diagrams, and chemical speciessynthesized can be changed by controlling mixed potential.
As an example, considering a reaction system for the synthesis ofCu or Cu2O nanoparticles from a CuO aqueous suspension of pH 9via hydrazine reduction, anodic reactions are mainly the oxidationreactions of hydrazine as follows
N2H4 + 4OH− → N2 + 4H2O + 4e �1�
N2H4 + OH− → 12N2 + NH3 + H2O + e �2�
Cathodic reactions are mainly the reaction of the deposition of Cu orCu2O and hydrogen generation reaction as follows
Deposition of copper
Cu�II� + 2e → Cu �3�
Deposition of cuprous oxide
2Cu�II� + 2OH− + 2e → Cu2O + H2O �4�
Hydrogen generation
2H2O + 2e → H2 + 2OH− �5�
where Cu�II� represents all the copper�II� species and is distin-guished from a copper�II� aquo ion, Cu2+. The overall depositionreactions of Cu and Cu2O in this system can be expressed using thefollowing equations
Deposition of copper
CuO + 12N2H4 → Cu + 1
2N2 + H2O �6�
CuO + 2N2H4 → Cu + N2 + 2NH3 + H2O �7�
Deposition of cuprous oxide
2CuO + 12N2H4 → Cu2O + 1
2N2 + H2O �8�
2CuO + 2N2H4 → Cu2O + N2 + 2NH3 + H2O �9�
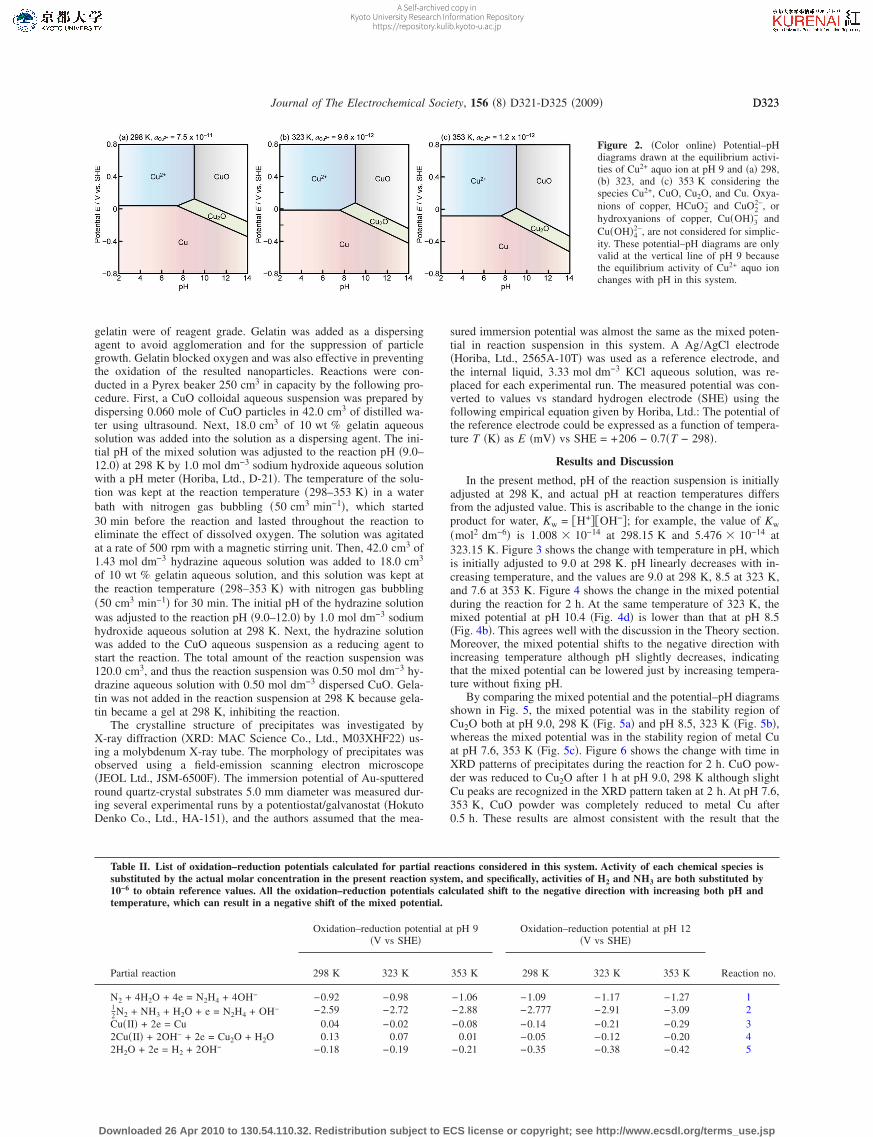
Figure 2 shows potential–pH diagrams �Pourbaix diagrams�28 drawnat an equilibrium activity of the Cu2+ aquo ion in the presence ofabundant CuO at pH 9. In this case, the equilibrium activity of Cu2+
aquo ion can be determined by considering an equilibrium reaction* Electrochemical Society Active Member.z E-mail: [email protected]
Journal of The Electrochemical Society, 156 �8� D321-D325 �2009�0013-4651/2009/156�8�/D321/5/$25.00 © The Electrochemical Society
D321
Downloaded 26 Apr 2010 to 130.54.110.32. Redistribution subject to ECS license or copyright; see http://www.ecsdl.org/terms_use.jsp
A Self-archived copy inKyoto University Research Information Repository
https://repository.kulib.kyoto-u.ac.jp

of Cu2+ and CuO, where the activities of CuO and H+ are assignedto 1 and 10−9, respectively. The species Cu2+, CuO, Cu2O, and Cuare only considered, and oxyanions of copper, such as HCuO2
− andCuO2
2−, or hydroxyanions of copper,29 Cu�OH�3− and Cu�OH�4
2−, arenot considered. This is only for simplicity because the oxidation–reduction potentials of CuO/Cu2O and Cu2O/Cu redox pairs at pH 9are important for the prediction of synthesized chemical species inthis case. For instance, the oxidation–reduction potentials of Cu2Oand any Cu�II� ionic species in equilibrium are the same at a con-stant pH and temperature in the presence of abundant solid CuOpowder, resulting in the same oxidation–reduction potential of theCu2O/Cu redox pair. The equilibrium activity of Cu2+ aquo ionchanges with pH and therefore, the potential–pH diagram is onlyvalid at the constant pH considered. Fortunately, pH of the solutionbarely changes during the reaction in the present method,22 and it ispossible to determine the most stable chemical species throughoutthe reaction by comparing the measured mixed potential to the ver-tical line of a constant pH �in this case, pH 9� in the potential–pHdiagrams. In other words, the kind of chemical species synthesizedcan be controlled if the mixed potential is changed as expected.Next, factors to change the mixed potential are discussed.
As described above, the mixed potential is determined by thebalance of each partial current. Therefore, the mixed potential ischanged when the oxidation–reduction potential of each partial re-action is changed. The oxidation–reduction potential E at a tempera-ture T and 1 atm is calculated using the following Nernst equation
E = −�GT
nF= −
1
nF��GT
0 + RT ln Q�
= −1
nF���HT
0 − T�ST0� + RT ln Q�
= −1
nF���H2980 + �
298
T
�CpdT� − T��S2980 + �
298
T�Cp
TdT�
+ RT ln Q �10�
where �GT is the change in Gibbs free energy at a temperature Tand 1 atm, �GT
0, �HT0, and �ST
0 are the changes in Gibbs free energy,enthalpy, and entropy that accompanies the formation of 1 mole of aproduct from its component elements at a temperature T and 1 atm,respectively, �CP is the change in specific heat at constant pressure�1 atm�, n is the number of electrons transferred in the half-cellreaction, F is the Faraday constant, R is the gas constant, T is theabsolute temperature in kelvins, and Q is the reaction quotient.24-27
Table II shows calculated results of the oxidation–reduction poten-tials of all the partial reactions considered. Activity of each chemicalin the reaction quotient is substituted by the same value as the actualmolar concentration of the chemical in the present reaction system,and specifically, both activities of H2 and NH3, which cannot bedetermined exactly, are substituted by 10−6 to obtain referential val-ues. As shown in Table II, all the oxidation–reduction potentialsshift to the negative direction with increasing both pH and tempera-ture, which can result in a negative shift of the mixed potential.Even the oxidation–reduction potentials of Reactions 3 and 4 shift tothe negative direction with increasing pH; the former is normallyconstant with pH and the latter increases with the increase in pH ata constant activity of Cu�II� ions. This is because, for example, theequilibrium activity of Cu2+ aquo ion decreases with increasing pHunder the coexistence of abundant solid CuO in equilibrium, whichbrings about the negative shift of the oxidation–reduction potentialsof Reactions 3 and 4. Thus, possibly the mixed potential is shifted tothe negative direction with increasing pH and temperature becausethe oxidation–reduction potentials of all the partial reactions shift tothe negative direction. Consequently, factors to change the mixedpotential are pH and temperature, which are easily controllable.
Experimental
Procedure.— Reaction solutions were prepared using cupric ox-ide �CuO� �Kanto Chemical, Inc.�, sodium hydroxide �NaOH�, hy-drazine monohydrate �N2H4·H2O� �Nacalai Tesque, Inc.�, and gela-tin �Jellice Co. Ltd., P459� as received. All chemicals except for
Table I. List of standard heat of formation, entropy at 298 K and 1 atm, and specific heat at constant pressure „1 atm… considered and used forthemodynamic calculation.
Chemical speciesStandard heat of formation
�kJ mol−1�Standard entropy
�J K−1 mol−1�
Specific heat at constant pressure�J K−1 mol−1�
Cp = a + b � 10−3 T + c � 105 T2
Referencesa b c
H+ �aq� 0.0 0.0 129.7 — — 24 and 25Cu2+ �aq� 64.4 −98.7 267.8 — — 24 and 25H2O �l� −285.8 70.0 75.4 — — 26H2 �g� 0.0 130.6 27.3 3.3 0.50 26Cu �s� 0.0 33.1 22.6 6.3 — 26Cu2O �s� −167.4 93.1 62.3 23.9 — 26CuO �s� −155.2 42.7 38.8 20.1 — 26N2 �g� 0.0 191.5 27.9 4.3 — 26NH3 �g� −45.9 192.7 37.3 18.7 −6.49 26N2H4 �l� 50.6 121.6 72.7 87.2 0.60 27
Figure 1. �Color online� Schematic potential–current curves: Mixed poten-tial is determined at the value where the total of anodic currents Ia,total bal-ances the total of cathodic currents Ic,total unless current flows outside.
D322 Journal of The Electrochemical Society, 156 �8� D321-D325 �2009�D322
Downloaded 26 Apr 2010 to 130.54.110.32. Redistribution subject to ECS license or copyright; see http://www.ecsdl.org/terms_use.jsp
A Self-archived copy inKyoto University Research Information Repository
https://repository.kulib.kyoto-u.ac.jp
gelatin were of reagent grade. Gelatin was added as a dispersingagent to avoid agglomeration and for the suppression of particlegrowth. Gelatin blocked oxygen and was also effective in preventingthe oxidation of the resulted nanoparticles. Reactions were con-ducted in a Pyrex beaker 250 cm3 in capacity by the following pro-cedure. First, a CuO colloidal aqueous suspension was prepared bydispersing 0.060 mole of CuO particles in 42.0 cm3 of distilled wa-ter using ultrasound. Next, 18.0 cm3 of 10 wt % gelatin aqueoussolution was added into the solution as a dispersing agent. The ini-tial pH of the mixed solution was adjusted to the reaction pH �9.0–12.0� at 298 K by 1.0 mol dm−3 sodium hydroxide aqueous solutionwith a pH meter �Horiba, Ltd., D-21�. The temperature of the solu-tion was kept at the reaction temperature �298–353 K� in a waterbath with nitrogen gas bubbling �50 cm3 min−1�, which started30 min before the reaction and lasted throughout the reaction toeliminate the effect of dissolved oxygen. The solution was agitatedat a rate of 500 rpm with a magnetic stirring unit. Then, 42.0 cm3 of1.43 mol dm−3 hydrazine aqueous solution was added to 18.0 cm3
of 10 wt % gelatin aqueous solution, and this solution was kept atthe reaction temperature �298–353 K� with nitrogen gas bubbling�50 cm3 min−1� for 30 min. The initial pH of the hydrazine solutionwas adjusted to the reaction pH �9.0–12.0� by 1.0 mol dm−3 sodiumhydroxide aqueous solution at 298 K. Next, the hydrazine solutionwas added to the CuO aqueous suspension as a reducing agent tostart the reaction. The total amount of the reaction suspension was120.0 cm3, and thus the reaction suspension was 0.50 mol dm−3 hy-drazine aqueous solution with 0.50 mol dm−3 dispersed CuO. Gela-tin was not added in the reaction suspension at 298 K because gela-tin became a gel at 298 K, inhibiting the reaction.
The crystalline structure of precipitates was investigated byX-ray diffraction �XRD: MAC Science Co., Ltd., M03XHF22� us-ing a molybdenum X-ray tube. The morphology of precipitates wasobserved using a field-emission scanning electron microscope�JEOL Ltd., JSM-6500F�. The immersion potential of Au-sputteredround quartz-crystal substrates 5.0 mm diameter was measured dur-ing several experimental runs by a potentiostat/galvanostat �HokutoDenko Co., Ltd., HA-151�, and the authors assumed that the mea-
sured immersion potential was almost the same as the mixed poten-tial in reaction suspension in this system. A Ag/AgCl electrode�Horiba, Ltd., 2565A-10T� was used as a reference electrode, andthe internal liquid, 3.33 mol dm−3 KCl aqueous solution, was re-placed for each experimental run. The measured potential was con-verted to values vs standard hydrogen electrode �SHE� using thefollowing empirical equation given by Horiba, Ltd.: The potential ofthe reference electrode could be expressed as a function of tempera-ture T �K� as E �mV� vs SHE = +206 − 0.7�T − 298�.
Results and Discussion
In the present method, pH of the reaction suspension is initiallyadjusted at 298 K, and actual pH at reaction temperatures differsfrom the adjusted value. This is ascribable to the change in the ionicproduct for water, Kw = �H+��OH−�; for example, the value of Kw�mol2 dm−6� is 1.008 � 10−14 at 298.15 K and 5.476 � 10−14 at323.15 K. Figure 3 shows the change with temperature in pH, whichis initially adjusted to 9.0 at 298 K. pH linearly decreases with in-creasing temperature, and the values are 9.0 at 298 K, 8.5 at 323 K,and 7.6 at 353 K. Figure 4 shows the change in the mixed potentialduring the reaction for 2 h. At the same temperature of 323 K, themixed potential at pH 10.4 �Fig. 4d� is lower than that at pH 8.5�Fig. 4b�. This agrees well with the discussion in the Theory section.Moreover, the mixed potential shifts to the negative direction withincreasing temperature although pH slightly decreases, indicatingthat the mixed potential can be lowered just by increasing tempera-ture without fixing pH.
By comparing the mixed potential and the potential–pH diagramsshown in Fig. 5, the mixed potential was in the stability region ofCu2O both at pH 9.0, 298 K �Fig. 5a� and pH 8.5, 323 K �Fig. 5b�,whereas the mixed potential was in the stability region of metal Cuat pH 7.6, 353 K �Fig. 5c�. Figure 6 shows the change with time inXRD patterns of precipitates during the reaction for 2 h. CuO pow-der was reduced to Cu2O after 1 h at pH 9.0, 298 K although slightCu peaks are recognized in the XRD pattern taken at 2 h. At pH 7.6,353 K, CuO powder was completely reduced to metal Cu after0.5 h. These results are almost consistent with the result that the
Table II. List of oxidation–reduction potentials calculated for partial reactions considered in this system. Activity of each chemical species issubstituted by the actual molar concentration in the present reaction system, and specifically, activities of H2 and NH3 are both substituted by10−6 to obtain reference values. All the oxidation–reduction potentials calculated shift to the negative direction with increasing both pH andtemperature, which can result in a negative shift of the mixed potential.
Partial reaction
Oxidation–reduction potential at pH 9�V vs SHE�
Oxidation–reduction potential at pH 12�V vs SHE�
Reaction no.298 K 323 K 353 K 298 K 323 K 353 K
N2 + 4H2O + 4e = N2H4 + 4OH− −0.92 −0.98 −1.06 −1.09 −1.17 −1.27 112N2 + NH3 + H2O + e = N2H4 + OH− −2.59 −2.72 −2.88 −2.777 −2.91 −3.09 2Cu�II� + 2e = Cu 0.04 −0.02 −0.08 −0.14 −0.21 −0.29 32Cu�II� + 2OH− + 2e = Cu2O + H2O 0.13 0.07 0.01 −0.05 −0.12 −0.20 42H2O + 2e = H2 + 2OH− −0.18 −0.19 −0.21 −0.35 −0.38 −0.42 5
Figure 2. �Color online� Potential–pHdiagrams drawn at the equilibrium activi-ties of Cu2+ aquo ion at pH 9 and �a� 298,�b� 323, and �c� 353 K considering thespecies Cu2+, CuO, Cu2O, and Cu. Oxya-nions of copper, HCuO2
− and CuO22−, or
hydroxyanions of copper, Cu�OH�3− and
Cu�OH�42−, are not considered for simplic-
ity. These potential–pH diagrams are onlyvalid at the vertical line of pH 9 becausethe equilibrium activity of Cu2+ aquo ionchanges with pH in this system.
D323Journal of The Electrochemical Society, 156 �8� D321-D325 �2009� D323
Downloaded 26 Apr 2010 to 130.54.110.32. Redistribution subject to ECS license or copyright; see http://www.ecsdl.org/terms_use.jsp
A Self-archived copy inKyoto University Research Information Repository
https://repository.kulib.kyoto-u.ac.jp

mixed potentials measured at pH 7.6, 353 K and pH 9.0, 298 Kwere always in the stability region of Cu and Cu2O, respectively. Incontrast, at pH 8.5, 323 K, all CuO powder was reduced to Cu2Oafter 0.5 h and then the resulting Cu2O was gradually reduced to Cumetal. This is not consistent with the measurement result of themixed potential. By carefully observing the change in the mixedpotential at pH 8.5, 323 K, the initial mixed potential is −0.045 V vsSHE and in the stability region of Cu2O, and the mixed potentialgradually decreases to −0.072 V with reaction time, which is justbeside the calculated oxidation–reduction potential of Cu2O/Cu,−0.077 V vs SHE; i.e., as CuO is reduced to Cu2O, the mixed po-tential approaches the oxidation–reduction potential of Cu2O/Cu re-dox pair, where Cu2O and Cu coexist. Nevertheless, the mixed po-tential is 5 mV higher than the calculated oxidation–reductionpotential of Cu2O/Cu and it is difficult to adequately elaborate onthe result that the deposition of Cu completely proceeded after 2 h.Here, pH of the solution tends to slightly decrease during the reac-tion, although ideally, pH would not be changed by taking into ac-count the overall reaction in the present reaction system. For ex-ample, pH actually decreased from 8.5 to approximately 8 at 323 K,resulting in a slight increase in the oxidation–reduction potential ofa Cu2O/Cu redox pair. Furthermore, there can be a slight differencebetween the mixed potential measured using Au electrode and theactual mixed potential in the reaction suspension. Therefore, theactual mixed potential is slightly lower than the oxidation–reductionpotential of the Cu2O/Cu redox pair. Nonetheless, a Au electrode ispreferable for the measurement of the mixed potential in this reac-tion system because a Au electrode does not have intense catalyticactivity for a specific partial reaction possible in the reactionsystem,30,31 and the effect of the immersion of the Au substrate isextremely low.
The scanning electron microscopy �SEM� images of the precipi-tates obtained by the reaction are shown in Fig. 7. Relatively largeCu2O particles with an average diameter of 475 nm are observed inthe precipitates obtained after 2 h at pH 9.0, 298 K. These largeparticles are attributable to the absence of gelatin. At pH 8.5, 323 K,Cu2O particles with an average diameter of 97 nm are observedafter 0.5 h and Cu particles with an average diameter of 82 nm areobserved after 2 h. Cu particles with an average diameter of 55 nmare observed after 2 h at 353 K. As above, the mean particle size isdecreased with the increase in temperature because nucleation siteincreases with the increase in temperature and an inordinate number
Figure 3. �Color online� Change in pH of the reaction suspension withtemperature; pH of the reaction suspension was initially adjusted to 9.0 at298 K.
Figure 4. �Color online� Mixed potentials measured during the reaction at�a� pH 9.0, 298 K �without gelatin�, �b� pH 8.5, 323 K, �c� pH 7.6, 353 K,and �d� pH 10.4, 323 K.
Figure 5. �Color online� Potential–pHdiagrams drawn at the equilibrium activi-ties of Cu2+ aquo ion at �a� pH 9.0, 298 K,�b� pH 8.5, 323 K, and �c� pH 7.6, 353 Kconsidering the species Cu2+, CuO, Cu2O,and Cu. Bars and circles indicate the rangeand average value of the measured mixedpotential, respectively.
Figure 6. �Color online� XRD patterns ofprecipitates obtained during the reaction at�a� pH 9.0, 298 K �without gelatin�, �b�pH 8.5, 323 K, and �c� pH 7.6, 353 K for2 h.
D324 Journal of The Electrochemical Society, 156 �8� D321-D325 �2009�D324
Downloaded 26 Apr 2010 to 130.54.110.32. Redistribution subject to ECS license or copyright; see http://www.ecsdl.org/terms_use.jsp
A Self-archived copy inKyoto University Research Information Repository
https://repository.kulib.kyoto-u.ac.jp
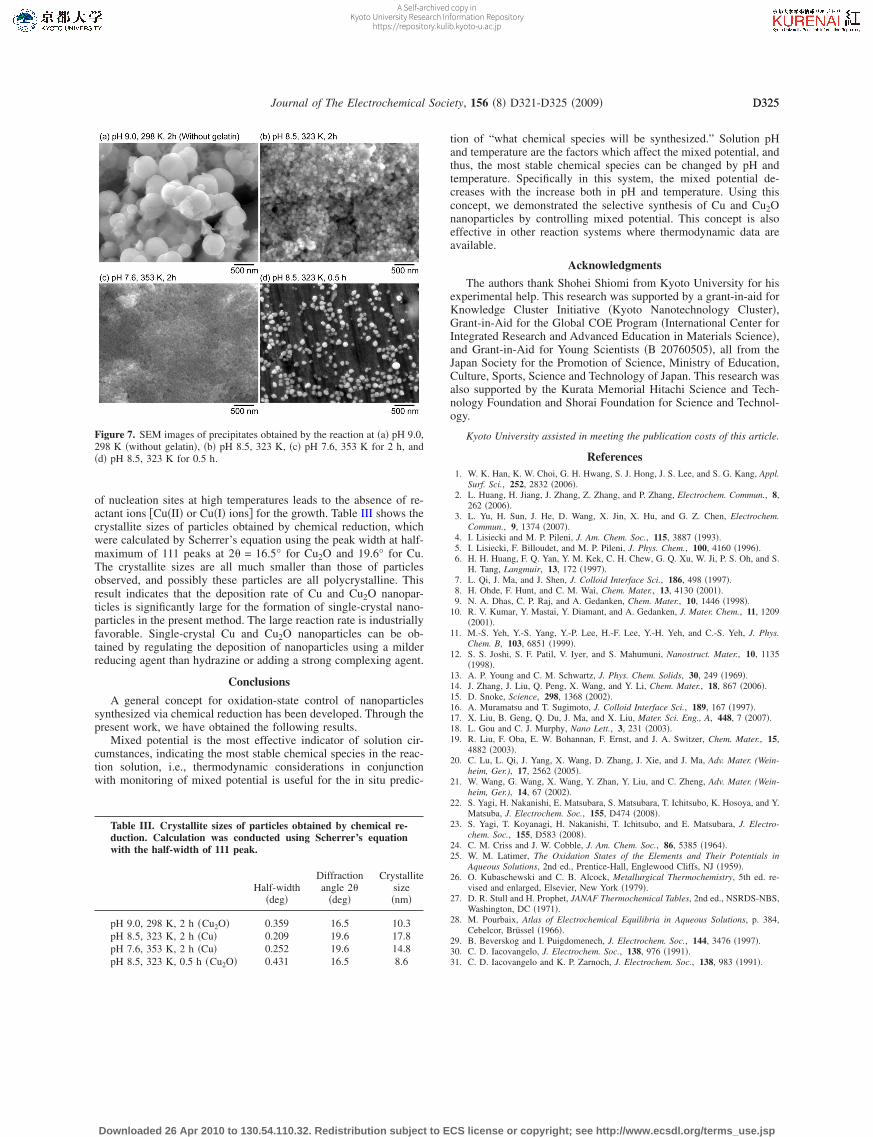
of nucleation sites at high temperatures leads to the absence of re-actant ions �Cu�II� or Cu�I� ions� for the growth. Table III shows thecrystallite sizes of particles obtained by chemical reduction, whichwere calculated by Scherrer’s equation using the peak width at half-maximum of 111 peaks at 2� = 16.5° for Cu2O and 19.6° for Cu.The crystallite sizes are all much smaller than those of particlesobserved, and possibly these particles are all polycrystalline. Thisresult indicates that the deposition rate of Cu and Cu2O nanopar-ticles is significantly large for the formation of single-crystal nano-particles in the present method. The large reaction rate is industriallyfavorable. Single-crystal Cu and Cu2O nanoparticles can be ob-tained by regulating the deposition of nanoparticles using a milderreducing agent than hydrazine or adding a strong complexing agent.
Conclusions
A general concept for oxidation-state control of nanoparticlessynthesized via chemical reduction has been developed. Through thepresent work, we have obtained the following results.
Mixed potential is the most effective indicator of solution cir-cumstances, indicating the most stable chemical species in the reac-tion solution, i.e., thermodynamic considerations in conjunctionwith monitoring of mixed potential is useful for the in situ predic-
tion of “what chemical species will be synthesized.” Solution pHand temperature are the factors which affect the mixed potential, andthus, the most stable chemical species can be changed by pH andtemperature. Specifically in this system, the mixed potential de-creases with the increase both in pH and temperature. Using thisconcept, we demonstrated the selective synthesis of Cu and Cu2Onanoparticles by controlling mixed potential. This concept is alsoeffective in other reaction systems where thermodynamic data areavailable.
Acknowledgments
The authors thank Shohei Shiomi from Kyoto University for hisexperimental help. This research was supported by a grant-in-aid forKnowledge Cluster Initiative �Kyoto Nanotechnology Cluster�,Grant-in-Aid for the Global COE Program �International Center forIntegrated Research and Advanced Education in Materials Science�,and Grant-in-Aid for Young Scientists �B 20760505�, all from theJapan Society for the Promotion of Science, Ministry of Education,Culture, Sports, Science and Technology of Japan. This research wasalso supported by the Kurata Memorial Hitachi Science and Tech-nology Foundation and Shorai Foundation for Science and Technol-ogy.
Kyoto University assisted in meeting the publication costs of this article.
References1. W. K. Han, K. W. Choi, G. H. Hwang, S. J. Hong, J. S. Lee, and S. G. Kang, Appl.
Surf. Sci., 252, 2832 �2006�.2. L. Huang, H. Jiang, J. Zhang, Z. Zhang, and P. Zhang, Electrochem. Commun., 8,
262 �2006�.3. L. Yu, H. Sun, J. He, D. Wang, X. Jin, X. Hu, and G. Z. Chen, Electrochem.
Commun., 9, 1374 �2007�.4. I. Lisiecki and M. P. Pileni, J. Am. Chem. Soc., 115, 3887 �1993�.5. I. Lisiecki, F. Billoudet, and M. P. Pileni, J. Phys. Chem., 100, 4160 �1996�.6. H. H. Huang, F. Q. Yan, Y. M. Kek, C. H. Chew, G. Q. Xu, W. Ji, P. S. Oh, and S.
H. Tang, Langmuir, 13, 172 �1997�.7. L. Qi, J. Ma, and J. Shen, J. Colloid Interface Sci., 186, 498 �1997�.8. H. Ohde, F. Hunt, and C. M. Wai, Chem. Mater., 13, 4130 �2001�.9. N. A. Dhas, C. P. Raj, and A. Gedanken, Chem. Mater., 10, 1446 �1998�.
10. R. V. Kumar, Y. Mastai, Y. Diamant, and A. Gedanken, J. Mater. Chem., 11, 1209�2001�.
11. M.-S. Yeh, Y.-S. Yang, Y.-P. Lee, H.-F. Lee, Y.-H. Yeh, and C.-S. Yeh, J. Phys.Chem. B, 103, 6851 �1999�.
12. S. S. Joshi, S. F. Patil, V. Iyer, and S. Mahumuni, Nanostruct. Mater., 10, 1135�1998�.
13. A. P. Young and C. M. Schwartz, J. Phys. Chem. Solids, 30, 249 �1969�.14. J. Zhang, J. Liu, Q. Peng, X. Wang, and Y. Li, Chem. Mater., 18, 867 �2006�.15. D. Snoke, Science, 298, 1368 �2002�.16. A. Muramatsu and T. Sugimoto, J. Colloid Interface Sci., 189, 167 �1997�.17. X. Liu, B. Geng, Q. Du, J. Ma, and X. Liu, Mater. Sci. Eng., A, 448, 7 �2007�.18. L. Gou and C. J. Murphy, Nano Lett., 3, 231 �2003�.19. R. Liu, F. Oba, E. W. Bohannan, F. Ernst, and J. A. Switzer, Chem. Mater., 15,
4882 �2003�.20. C. Lu, L. Qi, J. Yang, X. Wang, D. Zhang, J. Xie, and J. Ma, Adv. Mater. (Wein-
heim, Ger.), 17, 2562 �2005�.21. W. Wang, G. Wang, X. Wang, Y. Zhan, Y. Liu, and C. Zheng, Adv. Mater. (Wein-
heim, Ger.), 14, 67 �2002�.22. S. Yagi, H. Nakanishi, E. Matsubara, S. Matsubara, T. Ichitsubo, K. Hosoya, and Y.
Matsuba, J. Electrochem. Soc., 155, D474 �2008�.23. S. Yagi, T. Koyanagi, H. Nakanishi, T. Ichitsubo, and E. Matsubara, J. Electro-
chem. Soc., 155, D583 �2008�.24. C. M. Criss and J. W. Cobble, J. Am. Chem. Soc., 86, 5385 �1964�.25. W. M. Latimer, The Oxidation States of the Elements and Their Potentials in
Aqueous Solutions, 2nd ed., Prentice-Hall, Englewood Cliffs, NJ �1959�.26. O. Kubaschewski and C. B. Alcock, Metallurgical Thermochemistry, 5th ed. re-
vised and enlarged, Elsevier, New York �1979�.27. D. R. Stull and H. Prophet, JANAF Thermochemical Tables, 2nd ed., NSRDS-NBS,
Washington, DC �1971�.28. M. Pourbaix, Atlas of Electrochemical Equilibria in Aqueous Solutions, p. 384,
Cebelcor, Brüssel �1966�.29. B. Beverskog and I. Puigdomenech, J. Electrochem. Soc., 144, 3476 �1997�.30. C. D. Iacovangelo, J. Electrochem. Soc., 138, 976 �1991�.31. C. D. Iacovangelo and K. P. Zarnoch, J. Electrochem. Soc., 138, 983 �1991�.
Figure 7. SEM images of precipitates obtained by the reaction at �a� pH 9.0,298 K �without gelatin�, �b� pH 8.5, 323 K, �c� pH 7.6, 353 K for 2 h, and�d� pH 8.5, 323 K for 0.5 h.
Table III. Crystallite sizes of particles obtained by chemical re-duction. Calculation was conducted using Scherrer’s equationwith the half-width of 111 peak.
Half-width�deg�
Diffractionangle 2�
�deg�
Crystallitesize�nm�
pH 9.0, 298 K, 2 h �Cu2O� 0.359 16.5 10.3pH 8.5, 323 K, 2 h �Cu� 0.209 19.6 17.8pH 7.6, 353 K, 2 h �Cu� 0.252 19.6 14.8pH 8.5, 323 K, 0.5 h �Cu2O� 0.431 16.5 8.6
D325Journal of The Electrochemical Society, 156 �8� D321-D325 �2009� D325
Downloaded 26 Apr 2010 to 130.54.110.32. Redistribution subject to ECS license or copyright; see http://www.ecsdl.org/terms_use.jsp
A Self-archived copy inKyoto University Research Information Repository
https://repository.kulib.kyoto-u.ac.jp