title authors grace w. bucchianeri -...
TRANSCRIPT

Title: A Homeowner’s Dilemma: Anchoring in Residential Real Estate Transactions
Authors: Grace W. Bucchianeri The Wharton School, University of Pennsylvania, 3730 Walnut Street, Philadelphia, Pennsylvania 19104, [email protected] Julia Minson The Wharton School, University of Pennsylvania, 3730 Walnut Street, Philadelphia, Pennsylvania 19104, [email protected] Corresponding Author: Julia Minson The Wharton School, University of Pennsylvania, 3730 Walnut Street, Philadelphia, Pennsylvania 19104, (P) 1-215-898-3025, (F) 1-215-573-3664, [email protected] Abstract: We examine whether, and how, listing strategies impact sale prices in residential home sales. Literatures in housing economics, negotiations, and auctions offer diverse predictions around this question. On the one hand, housing studies typically treat home prices as an objective function of property and neighborhood characteristics. Yet, the large and robust literature on anchoring effects (Tversky & Kahneman, 1974) suggests a positive relationship between listing prices and sale prices. Finally, evidence from the auctions literature suggests the opposite pattern through herding behaviors. We analyzed more than 14,000 transactions, taking into account observable property heterogeneity, geographical location and timing of the sales. We find that higher starting prices are indeed associated with higher selling prices, consistent with anchoring. For the average home in our sample, over-pricing between 10 to 20 percent leads to an increase in the sale price of $117 to $163. This effect is particularly strong in areas with higher rates of mortgage foreclosure or serious delinquency. Additional analyses show that our results are unlikely to be driven by seller motivations or unobserved home qualities. We contrast our findings with recommendations and private beliefs of real estate agents, who provide services and advice for about 90 percent of home sales in the US. Keywords: anchoring; behavioral economics; housing; listing prices Classification Codes: D03, D12, D81, D83, Y80

1. Introduction
For the vast majority of homeowners, the home is the dominant asset in their portfolio. For
younger home-owning households, the house value can be several times the value of the
household’s net wealth (Flavin and Yamashita, 2009). Thus the sale of a home is likely to be the
most significant financial transaction of the owners’ lifetimes, and one that a typical home-
owning household faces repeatedly: over a two-year period, 12% home-owning households in
the US move (Ferreira, Gyourko and Tracy 2008, based on 1985-2005 AHS data). Among the
many stressful decisions that go into a home sale, perhaps the most agonizing one involves the
setting of the initial “listing price.” Yet, despite the importance and frequency of home sales, the
research literature is yet to offer a clear recommendation as to the basic strategy sellers should
pursue. In the present research we explore this issue from the vantage points of three different
literatures, analyze a large and diverse data set of market transactions, and contrast our findings
with realtors’ recommendations as well as their private beliefs.
Research on anchoring and insufficient adjustment (Tversky and Kahneman, 1974) has
repeatedly demonstrated that exposure to even irrelevant numbers makes individuals’ subsequent
quantitative judgments assimilate to the “anchor.” Anchoring affects the price that consumers are
willing to pay for goods and experiences (Ariely, Loewenstein, Prelec, 2003; Green, Jacowitz,
Kahneman, & McFadden 1998; Northcraft & Neale, 1989; Simonson & Drolet, 2004) and the
outcomes of distributive negotiations (Galinsky, Leonardelli, Okhuysen and Mussweiler, 2005;
Galinsky and Mussweiler, 2001; Galinsky, Mussweiler and Medvec, 2002). The available
evidence for anchoring effects suggests that home sellers would benefit from setting higher
listing prices.
This conclusion, however, is in direct contrast with most of the economic literature that

considers housing prices to be rational, and ultimately determined by characteristics such as
location and amenities (Sheppard, 1999). From this perspective, market forces are expected to
correct any strategic pricing behaviors. Laboratory results demonstrating a relationship between
opening prices and selling prices are generally dismissed as the product of experimental demand
in absence of real market conditions. Conversely, demonstrations of anchoring-like effects using
market data are often critiqued for failing to sufficiently control for potential confounds.
A third literature, one dealing with auction behavior (Gneezy, 2005; Gneezy &
Smorodisky, 2006) offers yet another set of predictions. A typical home sale begins with an
auction-like process, where one or more buyers might submit an offer in response to a listing
price. Recent findings show that auctions that open with low asking prices generate a greater
number of bids and ultimately finish with higher closing prices (Ku, Galinsky and Murnighan,
2006; Ku, Malhotra & Murnighan, 2005; Simonsohn and Ariely, 2007). This pattern has been
explained through “herding” behavior (Banerjee, 1992) whereby bids by earlier aspiring buyers
signal that a particular item is competitively priced and lead others to enter the bidding. Indeed,
an analysis of real estate-related web content reveals that professional consensus favors pricing a
home low, in the hopes of starting a “bidding war.”
Work by Janiszewski and Uy (2008) recently examined the effect of listing prices in the
residential housing market. These authors however, were interested in the effect of price
precision, and thus chose to eliminate all transactions with multiple offers from their data set,
leaving no room for testing herding behavior as an alternative explanation. Thus the question of
whether a seller ought to price a good relatively high or relatively low in the context of a
consequential information-rich market transaction remains very much unanswered.
In the current paper, we examine the question of initial listing prices in the real estate

market using two methods. First, we gather professional advice available to homeowners with
access to the internet. We analyzed the content and the tone of the published articles to find out
what strategy real estate agents recommend. We further investigate private beliefs of real estate
agents by soliciting their recommendations regarding specific, randomly chosen properties in
their general geographical area of practice (Study 1). We then compare these recommendations
and beliefs to findings based on data concerning all single-family home sales in Delaware, New
Jersey and Pennsylvania listed through the Multiple Listing Service (MLS) between January
2005 and April 2009 (Study 2). i
While the online recommendations of real estate agents seem to favor underpricing,
alluding to a potential herding effect, our market data do not provide any support for this
strategy. In fact, underpriced homes systematically fared less well in the data we examined, even
in hot markets with frequent transactions. On the other hand, our market data show evidence of
an anchoring effect, even after controlling for “fishing” behaviors whereby home sellers wait for
a longer period of time in order to receive a higher offer (Bokhari & Geltner, 2011). Private
beliefs of agents seemed to be in line with our market findings, and not their public
recommendations. When surveyed anonymously, real estate agents predicted that higher listing
prices would lead to higher sale prices, even after we account for individual differences, property
fixed effects, and listing time expectations.
We go beyond the prior literature in several ways. First we demonstrate the effect of
listing strategies on final prices using a large data set of real market data, in the context of a high-
stakes, information-rich transaction. Secondly, we utilize several novel empirical approaches to
rule out alternative explanations that have plagued such attempts in the past. Finally, by
comparing market data to recommendations of professional realtors we demonstrate a likely gap

in lay knowledge regarding the most consequential financial transaction of most consumers’
lifetimes.
2. Study 1 – Professional Pricing Advice
In a preliminary investigation of professional consensus regarding over- and under-
pricing, we first turned to the same source of knowledge as many home sellers: the internet. We
examined the first 100 web pages returned for each of the following Google searches: “home +
over-pricing + sell,” “home + under-pricing + sell,” “pricing + strategy + sell + home,” and
“pricing + home + for + sale.” 297 of these pages contained professional advice regarding how
the initial listing price should be set. Three raters, blind to hypothesis, concluded that of the 94
web pages that discussed under-pricing, 46% percent recommended it as a sound strategy.
Conversely, of the 163 web pages that discussed over-pricing, 96% warned against it.
While this exploratory analysis provides an unambiguous characterization of the advice
offered online, one might wonder about the sincerity of such advice. The real estate market is
plagued by the standard agency problem since realtors receive only a small portion of the
transaction price as commission (Anglin and Arnott 1991; Geltner, Kluger and Miller 1991;
Levitt and Syverson 2008; Miceli, 1991; Rutherford and Yavas 2012). Furthermore, internet
advice might not be reflective of the private beliefs of realtors. Thus in Study 1 we explored the
extent to which realtors privately adhere to the publicly recommended under-pricing strategy by
presenting expert participants with specific properties and soliciting their pricing
recommendations and expectations regarding transaction outcomes.
2.1 Method

2.1.1 Participants: Thirty-five local realtors (42.9% female, 44.7 years old, 6.8 years of
real estate experience) completed the study online between March 28 and May 2, 2011. We
compensated participants by entering them into a lottery for a $100 Amazon.com gift card.
2.1.2 Procedure: We randomly selected 10 homes listed for sale in Montgomery and
Philadelphia Counties of Pennsylvania in October 2010. Each participant viewed detailed
descriptive information regarding six randomly selected homes, three located in Montgomery
County (“suburban setting”) and three in Philadelphia County (“city setting”). They then saw the
median listing price of homes in the same zip code in October 2010 according to Zillow.com.
Participants then provided a recommended listing price for the home and predicted the final sale
price and time on market, given the listing price they had recommended.
2.2 Results and Discussion
After discarding data from one realtor who entered all the listing prices as $1 and one
observation from another realtor who entered the expected time-on-market as 169,000 days, we
analyzed 203 observations. We defined “under-pricing” as recommending a price of 99% or less
of the median price and “over-pricing” as recommending a price that is 101% of the median
price.
Participants recommended under-pricing in 70.4 percent of cases. Ten of our 34 realtors
recommending under-pricing on all six homes they evaluated, whereas the remaining 24
recommended a mix of over- and under-pricing strategies.
To examine participants’ expectations regarding the effect of their strategies on
transaction outcomes, we regressed the percentage difference between the expected sale price
and the reference price on the realtors’ recommended strategy, controlling for participant and

property fixed effects as well as the expected time-on-market. We found that when realtors
recommended under-pricing they expected the home to sell for a significantly smaller amount
than the reference price (B = -6.21, t = -2.14, p < 0.05). Furthermore, when realtors
recommended over-pricing they expected the home to sell for a significantly higher price than
the reference price (B = 16.83, t = 3.58, p < 0.001). Since property and realtor fixed effects were
controlled for, this pattern is not driven by property characteristics or realtor disposition. Finally,
we regressed realtors’ expected time-on-market on the recommended pricing strategy as well as
participant and property fixed effects. We found no significant relationship for either under- (B =
7.02, t = 1.11, ns) or over-pricing (B = -4.53, t = -0.43, ns).
Our data suggest that although realtors recommend underpricing, they believe that homes
listed lower than comparable properties tend to sell for lower prices and homes listed higher than
comparable homes sell for higher prices. Given that we find no relationship between the realtors’
recommendations and their expectations regarding time on market, we cannot conclude that
these recommendations are strictly self-serving. It might be that similarly to decision scientists,
professional realtors entertain two competing sets of predictions about the effect of listing prices
on selling prices: one based on herding and one based on anchoring. In Study 2 we use a large
and diverse data set of transaction data to examine which of these processes actually takes place
in a real market context.
3. Study 2: Listing Strategies in the Housing Market
In Study 2 we use a dataset of all residential real-estate transactions in DE, NJ and PA
listed on the MLS from 2005 to 2009 in order to examine the relationship between listing prices
and final sale prices. We utilize several novel empirical approaches to mitigate concerns over

alternative explanations based on seller motivations or property characteristics for any such
relationship.
Laboratory studies of anchoring have identified two reasons why a higher listing price
might ultimately lead to a higher selling price. First, individuals tend to adjust insufficiently
away from salient anchors (Epley & Gilovich, 2006). Thus a home buyer exposed to a high
listing price might adjust downward, but stop adjusting when they encounter the highest amount
they would be willing to pay for the home. Furthermore, individuals tend to generate more
arguments that are consistent than inconsistent with the anchor (Strack & Mussweiler, 1997;
Mussweiler, Strack & Pfeiffer, 2000). Thus, a buyer exposed to a high-priced property might
attend more to the attractive landscaping, than to the outdated plumbing. This “selective
accessibility model” of anchoring has been invoked to explain the effects of opening prices on
selling prices in laboratory negotiations (e.g. Galinsky & Mussweiler, 2001).
The main challenge in demonstrating such anchoring effects using market data is one of
showing that the relationship between listing prices and selling prices does not simply arise from
objective home qualities. Therefore, to identify the effect of over- or underpricing a home we
first must identify the sale price that a given home should command based on objective
characteristics if listing behaviors had no impact. To proxy the expected sale price based on
objective characteristics such as the number of bedrooms, bathrooms, and lot size, we conduct a
hedonic sale price regression using 331,000 home sales in a data set of all MLS transactions for
Delaware, New Jersey and Pennsylvania from Jan 2005 to April 2009. To demonstrate the
robustness of our results, we also use a total of six alternative reference points other than the
price predicted by our regression.
An additional challenge is that a home might be priced higher (or lower) because of

qualities that are important to buyers but unobserved by the econometrician, (e.g. ample sunlight
or a particularly attractive layout). To deal with this concern, for each listing that we were able to
match to a previous sale, we calculated the component of the previous sale price that our hedonic
regression did not predict. We interpret this as a measure of the time-constant unobserved home
qualities that partly drove the previous sale price. As long as these qualities do not change
significantly over time, the residual term from a previous sale price prediction will be a
reasonable, if noisy, proxy for their impact on the future sale price.
Controlling for time-constant unobserved home characteristics still leaves the issue of
time-variable home characteristics (e.g. a recent kitchen remodel) that might inflate the
relationship between listing prices and selling prices. In the current investigation we also look at
the effect of price heterogeneity in the zip code on the relationship between listing prices and
selling prices. If the relationship between listing and sale prices is stronger in zip codes with high
price heterogeneity, unobserved home qualities are of greater concern. In contrast, a weakened
relationship between listing price and sale price in more heterogeneous zip codes would provide
additional evidence for the selective accessibility interpretation of anchoring. Prior studies have
demonstrated that “considering the opposite” reduces anchoring effects (Mussweiler, Strack &
Pfeffer, 2000). A buyer being exposed to multiple houses with varied prices may be less
influenced by the listing price of any particular house because information about alternative
prices is readily available. In essence, high price heterogeneity makes it easier for buyers to
“consider the opposite.”
In order to more rigorously test the herding prediction we look at the relationship
between listing and sale prices overall, as well as in particularly “hot” or “cold” markets. Both
the literature on auctions as well as the anecdotal accounts of realtors point to market thickness

as a moderator of herding. In other words, in order to create a bidding war by setting a low price,
there must be many interested buyers in the market. Finally, in each analysis we control for time
on market (Taylor, 1999), zip code, school district, listing office, year and month fixed effects to
rule out seller motivation, local characteristics, and time trends respectively, as alternative
explanations.
3.1 Method
3.1.1 Data
Main Data Set – Multiple Listing Service Data: We obtained data on all sold homes in
Delaware, New Jersey and Pennsylvania that were listed through the Multiple Listing Service
(MLS) from Jan 2005 to April 2009 (MLS data). After discarding non-arms-length transactions
(for example, sales between family members) and extreme outliers (listings with a sale price
below $1,000 or a total area below 10 square feet), we retained 335,852 observations, across
over a thousand zip codes (Table 1).
Repeat-Sale Data: For our main analysis we used the 14,616 complete records for homes
that we matched to a previous sale. For home listings outside of Philadelphia County, we were
constrained to matching repeat-sales between Jan 2005 to April 2009. We complemented the
Philadelphia County MLS data with the complete home sale tax records for Philadelphia County
from 1988 to 2004 (PHL data) containing 148,331 usable observations.
Creating the Predicted Sale Price: By performing a hedonic regression on the sale price
per square foot using 331,333 home sales with adequate property and transaction information
between 1988 and 2009, we created a predicted sale price for each property at the time of the
listing in the MLS data. The following variables were controlled for in the hedonic regression on
price per square foot: lot size, floor-to-area ratio, type of property (semi-detached, attached,
detached), exterior material type, a garage dummy, number of fireplaces, a dummy for an
irregular lot and central air conditioning, a quadratic time trend, as well as month, school district,
and zip code fixed effects.
Market warmth: Depending on the year-on-year change in the housing transaction
volume, each zip code in a given month and year was classified into one of the seven categories
in terms of market warmth or thickness: hot (up by 30% or more), warm (up by between 20 to
30%), lukewarm (up by between 10 to 20%), cool (down by between 10 to 20%), cold (down by
between 20 to 30%), dead (down by 30% or more), or neutral.
Price heterogeneity: For each zip code, we calculated the standard deviation of listing
and sale prices during the previous six months. This reflects the variation in both the expectation
and realization of prices for homes in each zip code. Price heterogeneity dummies were
generated for each zip code, equal to one if the standard deviation of listing or sale prices in a
given zip code was above median.
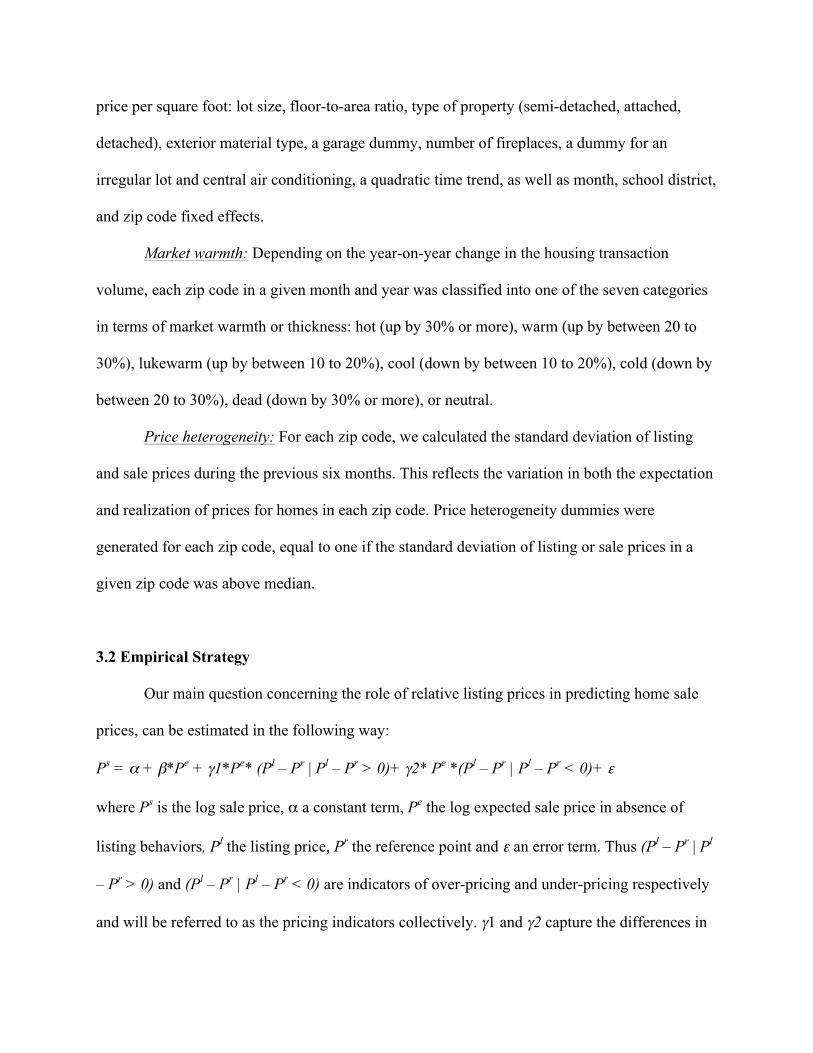
3.2 Empirical Strategy
Our main question concerning the role of relative listing prices in predicting home sale
prices, can be estimated in the following way:
Ps = α + β*Pe + γ1*Pe* (Pl – Pr | Pl – Pr > 0)+ γ2* Pe *(Pl – Pr | Pl – Pr < 0)+ ε
where Ps is the log sale price, α a constant term, Pe the log expected sale price in absence of
listing behaviors, Pl the listing price, Pr the reference point and ε an error term. Thus (Pl – Pr | Pl
– Pr > 0) and (Pl – Pr | Pl – Pr < 0) are indicators of over-pricing and under-pricing respectively
and will be referred to as the pricing indicators collectively. γ1 and γ2 capture the differences in

the log sale price (expressed as a portion of the log expected price) due to listing behaviors. ε is
an error term.
We proxy Pe using a predicted hedonic sale price derived from all property sales in our
sample. We also match the previous sale of the property to the current listing and include the
residual from the same predicted hedonic regression on the previous sale as an additional control.
We explore three main types of indicators to proxy the reference point Pr. First, we
calculate the median sale and listing prices of all historical sales of similar homes in the zip code
of a given listing during a 180-day window prior to the listing. Second, to alleviate the concerns
related to market trends, we also calculate median listing prices of concurrently listed homes,
instead of historical sales. We calculate all of these indicators by zip code only, and also by zip
code and bedroom groups (1 to 3 bedrooms, 4 to 6 bedrooms and 7+ bedrooms). The third metric
is a predicted listing price derived from a hedonic regression of all listing prices in our sample.
Regressing the listing price for 281,868 listings on property characteristics and zip code, school
district, listing office, year and month fixed effects, we explained around 70 percent of the
variation.
Thus after including all the controls listed above, we estimate the following:
Psizt = α + β1*Ph
izt + β2*TOMizt + β3*Rizt + γ1* Phizt*(Pl
izt – Prizt | Pl
izt – Prizt > 0) + γ2* Ph
izt*
(Plizt – Pr
izt | Plizt – Pr
izt < 0) + D_z + D_s + D_l + D_year + D_month + εizt
where Psizt refers to the log sale price of a listing i located in zip code z at time t, Ph
izt the log
predicted hedonic sale price, TOMizt the number of days the listing spent on the market, Rizt the
first-sale hedonic prediction residual, Plizt the listing price, Pr
izt a reference price, and D_z, D_s,
D_l, D_year and D_month are the zip code, school district, listing office, year and month fixed
effects respectively.
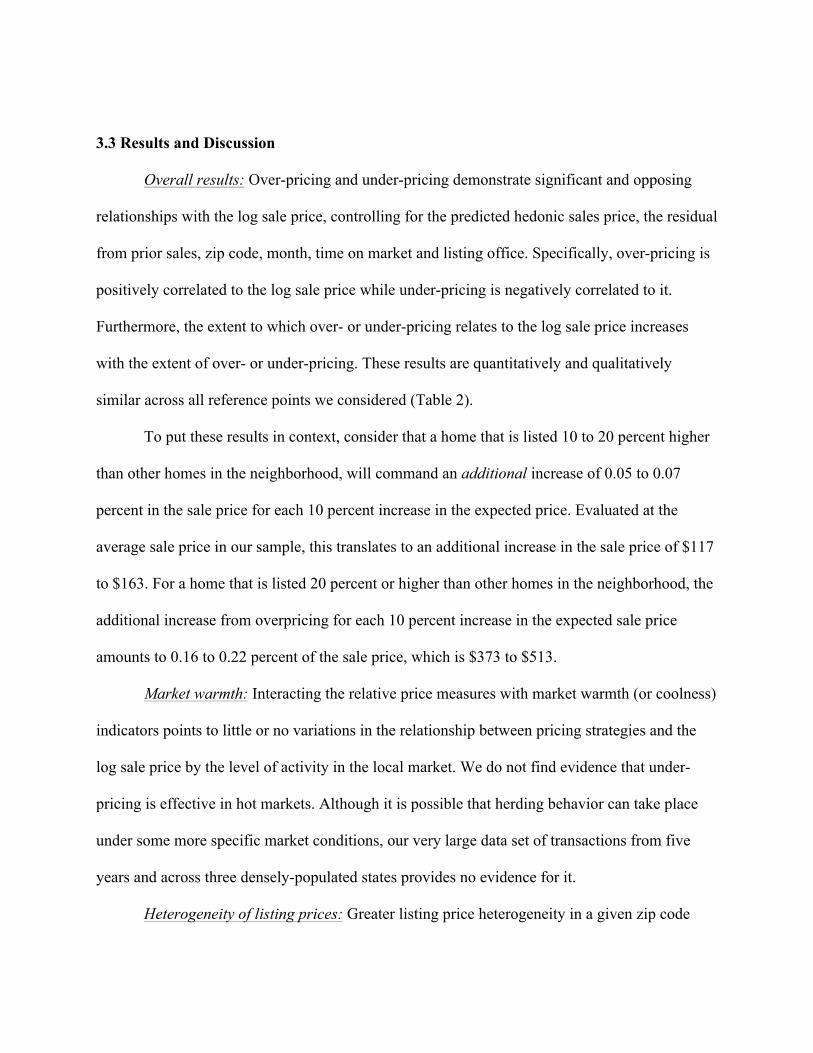
3.3 Results and Discussion
Overall results: Over-pricing and under-pricing demonstrate significant and opposing
relationships with the log sale price, controlling for the predicted hedonic sales price, the residual
from prior sales, zip code, month, time on market and listing office. Specifically, over-pricing is
positively correlated to the log sale price while under-pricing is negatively correlated to it.
Furthermore, the extent to which over- or under-pricing relates to the log sale price increases
with the extent of over- or under-pricing. These results are quantitatively and qualitatively
similar across all reference points we considered (Table 2).
To put these results in context, consider that a home that is listed 10 to 20 percent higher
than other homes in the neighborhood, will command an additional increase of 0.05 to 0.07
percent in the sale price for each 10 percent increase in the expected price. Evaluated at the
average sale price in our sample, this translates to an additional increase in the sale price of $117
to $163. For a home that is listed 20 percent or higher than other homes in the neighborhood, the
additional increase from overpricing for each 10 percent increase in the expected sale price
amounts to 0.16 to 0.22 percent of the sale price, which is $373 to $513.
Market warmth: Interacting the relative price measures with market warmth (or coolness)
indicators points to little or no variations in the relationship between pricing strategies and the
log sale price by the level of activity in the local market. We do not find evidence that under-
pricing is effective in hot markets. Although it is possible that herding behavior can take place
under some more specific market conditions, our very large data set of transactions from five
years and across three densely-populated states provides no evidence for it.
Heterogeneity of listing prices: Greater listing price heterogeneity in a given zip code

significantly decreases the relationship between pricing strategies and log sale price. This is
again true across multiple specifications. This pattern is clearly in line with an interpretation of
anchoring based on availability of anchor-consistent information (Strack and Mussweiler, 1997).
In zip codes with high listing price heterogeneity, the presence of homes with similar basic
characteristics listed at different prices may provide sellers with salient anchor-disconfirming
evidence. Furthermore, if unobserved home qualities were the main driver of our findings, we
would have expected them to play a greater role in more heterogeneous zip codes, leading to an
amplified, not attenuated, listing price effect (Tables 3A and 3B).
Distressed zip codes: Being located in a distressed zip code exacerbates the impact of
over- and under-pricing on the sale price. The differences are substantial and economically
important: compared to a zip code with a zero rate of foreclosure or serious delinquency, the
impact of over-pricing in a zip code with an average rate of foreclosure or serious delinquency
increases by around 0.5 percentage points. Similarly, the negative impact of under-pricing in a
typically distressed zip code is more severe by 1 percentage point than in a zero-foreclosure or
serious delinquency zip code. Evaluated at the median home in our sample, this amounts to
doubling both the over- and under-pricing effects in the average zip code as compared to the
zero-distress zip code (Table 4).
While interesting in their own right, these results confirm that unobserved qualities are
not the main driver of our results. Due to the well-documented damage done to homes facing
imminent foreclosure (Skogan, 1990), unobserved qualities likely play a more prominent role in
explaining the under-pricing effect. This asymmetrical amplification of the pricing effects is not
shown in our data. In fact, the symmetrical amplification of the pricing effects is again consistent
with anchoring, which has been shown to be stronger in environments with greater uncertainty

(Mussweiler & Strack, 2000).
4. General Discussion
A home sale is the most significant financial transaction undertaken by the average
home-owning household. Despite the high-stakes and deliberative nature of this transaction,
prior research has not offered a conclusive answer regarding the optimal strategy that sellers
should pursue. Our work shows that although most professional advice recommends under-
pricing, over-pricing one’s home relative to any of several benchmarks used in our analyses
results in a higher sale price, controlling for how long one waits to sell. These results emerge
when we include a variety of controls for unobserved home quality and time-on-market. Because
we use data from a high-stakes, information-rich context, it cannot be argued that the observed
effect is merely the result of individuals’ failure to sufficiently consider their actions, lack of
available decision aids, or absence of other alternatives. The effect we demonstrate is robust and
significant.
Our research goes beyond prior attempts to demonstrate pricing effects in the real-estate
domain. First, we use a more comprehensive data set that allows us to experiment with a wide
array of reference points and to more fully alleviate concerns about unobserved variables,
including home qualities, marketing strategies promoted by the listing offices, time on market, as
well as zip code, school district, listing office, year and month fixed effects. Secondly, we
explore the possibility that over- and under-pricing might vary by the local market conditions.
We use both the zip code-level transaction volume changes and information on listing price
heterogeneity to provide a more rigorous test of both the herding and anchoring hypotheses.
Contrary to commonly cited anecdotes concerning market excitement and bidding wars, our

results point to little or no herding effect in a hot market.
Our findings directly contradict the advice most real-estate professionals offer to their
clients. Realtors in Study 1 recommended under-pricing in the majority of cases, while at the
same time expecting this strategy to lead to lower sale prices. The flavor of the warnings against
over-pricing is well-captured by an article from About.com with the attention-grabbing headline
“The Worst Home Selling Mistake.” The article relates the history of a specific house that
according to the author never sold due to agent inexperience and seller greed. It is now “…stale,
dated, a market-worn home that was over-priced for too long.” Our findings, however, should
give serious pause to any seller who is tempted to under-price a property in the hopes of
generating a “bidding war” per the advice of their realtor.

References
Anglin, P.M., Arnott, R., 1991. Residential Real Estate Brokerage as a Principal-Agent Problem.
Journal of Real Estate Finance and Economics 4 (2), 99-125.
Ariely, D., Loewenstein, G., Prelec, D., 2003. Coherent Arbitrariness: Stable Demand Curves
Without Stable Preferences. The Quarterly Journal of Economics 118 (1), 73-106.
Banerjee, D., 1992. Ethical behavior of IS personnel: in search of a behavioral model.
Unpublished doctoral dissertation. Fayettesville: University of Arkansas.
Bokhari, S., Geltner, D., 2011. Loss Aversion and Anchoring in Commercial Real Estate Pricing.
Real Estate Economics 39 (4), forthcoming.
Epley, N., Gilovich, T., 2006. The anchoring and adjustment heuristic: Why adjustments are
insufficient. Psychological Science 17, 311–318.
Ferreira, F., Gyourko, J., Tracy, J., 2008. Housing Busts and Household Mobility. Journal of
Urban Economics 68 (1), 34 - 35.
Flavin, M., Yamashita, T., 2002. Owner-occupied Housing and the Composition of the
Household Portfolio. The American Economic Review 92 (1), 345-362.

Galinsky, A. D., Leonardelli, G. J., Okhuysen, G. A., Mussweiler, T., 2005. Regulatory focus at
the bargaining table: Promoting distributive and integrative success. Personality and Social
Psychology Bulletin 31: 1087-1098.
Galinsky, A.D., Mussweiler, T., 2001. First Offers as Anchors: The Role of Perspective-taking
and Negotiator Focus. Journal of Personality and Social Psychology 81 (4), 657-669.
Galinsky, A.D., Mussweiler, T., Medvec, V.H., 2002. Disconnecting outcomes and evaluations:
The role of negotiator focus. Journal of Personality and Social Psychology 83 (5), 1131-1140.
Geltner, D., Kluger, B., Miller, N., 1991. Optimal Price and Selling Effort from the
Perspectives of the Broker and Seller. AREUEA Journal 19 (1), 1-24.
Genesove, D., Mayer, C., 2001. Loss Aversion and Seller Behavior: Evidence from the Housing
Market. The Quarterly Journal of Economics 116 (4), 1233-1260.
Gneezy, U. 2005. Step-Level Reasoning and Bidding in Auctions. Management Science, 51 (11),
1633-1642.
Gneezy, U., Smorodinsky R., 2006. All-pay auction: An experimental study. Journal of
Economic Behavior and Organization, 61, 255-275.
Green D., Jacowitz K.E., Kahneman D., McFadden D., 1998. Referendum contingent valuation,
anchoring, and willingness to pay for public goods. Resource and Energy Economics 20 (2), pp.

85-116.
Janiszewski, C., Uy, D., 2008. Anchor Precision Influences the Amount of Adjustment.
Psychological Science 19 (2), 121-127.
Ku, G., Galinsky, A.D., Murnighan, J.K., 2006. Starting Low But Ending High: A Reversal of
the Anchoring Effect in Auctions. Journal of Personality and Social Psychology 90 (6), 975-986.
Ku, G., Malhotra, D., Murnighan, J.K., 2005. Towards a Competitive Arousal Model of
Decision-making: A Study of Auction Fever in Live and Internet Auctions. Organizational
Behavior and Human Decision Processes 96 (2), 89-103.
Levitt, S.D., Syverson, C., 2008. Market Distortions When Agents Are Better Informed: The
Value of Information in Real Estate Transactions. The Review of Economics and Statistics 90
(4), 599–611.
Miceli, T.J., 1991. The Multiple Listing Service, Commission Splits and Broker Effort. Real
Estate Economics 19 (4), 548–566.
Mussweiler, T., Strack, F., Pfeiffer, T., 2000. Overcoming the Inevitable Anchoring Effect:
Considering the Opposite Compensates for Selective Accessibility. Personality and Social
Psychology Bulletin 26 (9), 1142-1150.

Rutherford, R., Yavas, A., 2012. Discount Brokerage in Residential Real Estate Markets. Real
Estate Economics 40 (2), forthcoming.
Sheppard, S., 1999. Hedonic Analysis of Housing Markets. In: Cheshire, P., Mills, E.S. (Eds.)
Handbook of Regional and Urban Economics, Vol. III. North Holland: Elsevier, 1595-1635.
Simonsohn, U., Ariely, D., 2007. When Rational Sellers Face Non-Rational Buyers: Evidence
from Herding on eBay. Management Science 54 (9), 1624-1637.
Simonson, I., Drolet, A., 2004. Anchoring Effects on Consumers’ Willingness-to-Pay and
Willingness-to-Accept. Journal of Consumer Research 31 (3), 681-690.
Skogan, W.G., 1990. Disorder and Decline: Crime and the Spiral of Decay in American
Neighborhoods. New York: Free Press.
Strack, F., Mussweiler, T., 1997. Explaining the enig matic anchoring effect: Mechanisms of
selective accessibility. Journal of Personality and Social Psychology 73, 437-446.
Taylor, C., 1999. Time-on-the-Market as a Sign of Quality. Review of Economic Studies 66 (3),
555-578.
Tversky, A., Kahneman, D., 1974. Judgment under uncertainty: Heuristics and biases. Science
185, 1124-1131.

Endnote i It is estimated that around 90 percent of all homes sales are listed on the MLS. (source: http://www.forsalebyownerhomes.com/mlslisting.html)