timor-leste: country environmental analysis...timor-leste is a young country that regained...
TRANSCRIPT
Timor-Leste:
Country Environmental Analysis
July 2009
Sustainable Development Department
East Asia & Pacific Region
World Bank
Table of Contents
Abbreviations and Acronyms………………………………………… … ii
Acknowledgments………………………………………………………… iv
Executive Summary……………………………………………………….. v
1. Background and Rationale…………………………….............. 1
2. The Policy and Institutional Context……………………………. 3
2.1 Country Context………………………………………………... 3
2.2 National Wealth………………………………………………... 4
2.3 Economic Development………………………………………... 6
2.4 National Development Planning……………………………….. 7
2.5 Environmental Institutions……………………………………... 8
3. Priority Environmental Problems……………………………... 15
3.1 Environmental Health………………………………………….. 15
3.2 Natural Resources Management……………………………….. 21
3.3 Climate Change……….……………………………………….. 30
4. Operational Responses ……………..…………………………… 33
5. Tackling Environmental Priorities…………………………..… 39
5.1 Enacting New Environmental Legislation and Regulations
and Enhancing Human Resources…………………… ………39
5.2 Addressing Indoor Air Pollution………………………………..40
5.3 Improving Water Supply and Sanitation ……………………….42
Bibliography………………………………………………….………….. 44
Annexes
A Estimation of National Wealth…...……..……………………... 49
B. The Cost of Indoor Air Pollution……………………………… 55
C. The Cost of Inadequate Water Supply, Sanitation, and
Hygiene…………………………………………………………. 66
D. Land Management Survey……………………………………. 72
E. National Development Planning………………………………. 78
_____________________________________________________________________
All dollar amounts are United States dollars.
ii
Abbreviations and Acronyms
ADB Asian Development Bank
ALRI acute lower respiratory infections
ARI acute respiratory infections
CEA Country Environmental Analysis
COI cost of illness
COPD chronic obstructive pulmonary disease
DALY disability-adjusted life year
DHS Demographic and Health Survey
DNSAS National Directorate for Water and Sanitation
DNMA National Directorate for Environment
EDTL Timor-Leste Electricity
EEZ exclusive economic zone
EIA environmental impact assessment
EKKN Elang, Kakatua, and Kakatua North
FAO Food and Agriculture Organization
F-FDTL Timor-Leste Defense Force
FY Fiscal Year
GDP gross domestic product
GoTL Government of Timor-Leste
GNI gross national income
HCA human capital approach
IAP indoor air pollution
IDPs internally displaced persons
JICA Japan International Cooperation Agency
JPDA Joint Petroleum Development Area
LLP Land Law Program
LPG liquefied petroleum gas
MAF Ministry of Agriculture and Fisheries
MDG Millennium Development Goals
NAP National Action Program
NCSA National Capacity Self Assessment
NDES National Directorate for Environmental Services
NDP National Development Plan
NGO nongovernmental organization
NP National Priority
PM particulate matter
PNTL Policia Nacional de Timor-Leste
SDS-SEA Sustainable Development Strategy for the Seas of East Asia
SEMA State Secretariat for the Environment
SERN Secretary of Natural Resources
SFU solid fuel use
SIP Sector Investment Programs
SSEP State Secretary for Energy Policy
iii
TFET Trust Fund for East-Timor
TLEA Timor-Leste Exclusive Area
TLSLS Timor-Leste Standard of Living Survey
UNCBD United Nations Convention on Biodiversity
UNCCD United Nations Convention to Combat Desertification
UNDP United Nations Development Programme
UNFCCC United Nations Framework Convention on Climate Change
UNTAET United Nations Transitional Administration
USAID United States Agency for International Development
USDA United States Department of Agriculture
VSL value of statistical life
WHO World Health Organization
WSS water supply and sanitation
YLL years of life lost
iv
Acknowledgments
This document was written primarily by Jan Bojö (Lead Economist, Task Team Leader) and
Fernanda Ruiz Nuñez (Young Professional) of the Operations and Policy Unit, East Asia &
Pacific Sustainable Development Department (EASOP), World Bank. Important contributions to
specific chapters were made by Laura Barreto (Environmental Law Consultant), Giovanni Ruta
(Economist, ENV), Sushenjit Bandyopadhyay (Sr. Environmental Economist, ENV), and Yabei
Zhang (Young Professional, EASOP).
Comments by Antonio Franco (Country Manager, World Bank, Timor-Leste), Homa-Zahra
Fotouhi (Sr. Operations Officer, World Bank, Timor-Leste), Rui Gomes (Head, Pro-poor Policy
Unit, UNDP, Timor-Leste), Joana Lima (Environment Officer, UNDP, Timor-Leste), August
Pinto (Director, National Directorate for the Environment), Jesse Shapiro (Sanitation Adviser,
Ministry of Health), and Steffi Stallmeister (Sr. Operations Officer, World Bank Timor-Leste)
are gratefully acknowledged.
The authors wish to thank all participants in the June 2008 workshop at the Ministry for Foreign
Affairs, Timor-Leste, and participants at the World Bank’s Decision Meeting in April 2009
(chaired by Sector Manager Magda Lovei) for their comments on previous version of this CEA.
Peer reviewers were Sergio Margulis (Lead Environmental Economist, ENV), Juan Carlos
Belausteguigoitia (Lead Environmental Economist, LCSEN), and Poonam Pillai (Sr.
Environmental Specialist, ENV). Editing was done by Linda Starke.
Generous funding from the Bank Netherlands Partnership Program was crucial as a complement
to the World Bank’s own budget.
Sector Manager/Leader: Rahul Raturi (EASRE)/Charles Feinstein (EASNS)
Sector Director: Christian Delvoie/John Roome
Vice-President: James Adams
v
Executive Summary
The Country Environmental Analysis (CEA) for Timor-Leste identifies environmental priorities
through a systematic review of environmental issues in natural resources management and
environmental health in the context of the country’s economic development and environmental
institutions. Lack of data has been the main limitation in presenting a more rigorous analysis.
Nevertheless, the report builds on the best available secondary data, presents new data on the
country’s wealth composition, and derives new results on the costs of water and air pollution.
The CEA calls for urgent attention to gaps in the environmental management framework, the
lack of capacity to implement the few regulations in place, and the high cost of indoor air
pollution and poor water, sanitation, and hygiene.
Timor-Leste is a young country that regained independence in 2002, and it has emerged from a
bitter past burdened by colonialism and violent conflicts. It is still a fragile state facing enormous
challenges. The Human Development Index for Timor-Leste in 2006 was 0.547, with a rank of
141 out of 179 countries. Timor-Leste is now classified as a lower middle-income country with a
gross national income (GNI) per capita in 2007 of more than $1,500. However, the non-oil per
capita income is less than $400, which gives a better perspective of the living standard facing
most Timorese. Timor-Leste is a market economy, democratically governed, and richly endowed
with natural resources—primarily oil and gas. A sound system of financial management of these
assets is in place to prevent a sudden burst of spending from crowding out other sectors of the
economy. Much of its nature—world class coral reefs, untouched forests, and scenic vistas—
remains relatively unspoiled and could be the basis of a thriving tourism sector. Tourism is
currently marginal but well managed. These are tremendous assets, which could provide for
much needed employment to a rapidly growing population. Many nations have started out with a
worse balance sheet.
Both the constitution and the current government of Timor-Leste (GoTL) have recognized the
importance of environmental protection. However, the country lacks a comprehensive
environmental management framework in terms of legislation, regulation, and adequately
resourced institutions. The existing environmental legislation is a legacy of the past and is not
well recognized in current day Timor-Leste. The GoTL made some progress in the development
of two important draft environmental laws (on environmental impact assessment and pollution
control) in 2006, but they were not approved. In the second part of 2008 the Ministry of
Economy and Development, which is responsible for the environmental area, decided to return to
the subject. With support from the World Bank, a new draft was prepared that integrated the two
diplomas and created the environmental license system. The draft was presented to the Council
of Ministers in February 2009. It will be important to complete this process in order to lay the
ground for the challenges that future growth and investment will pose to the environment.
While many of the environmental problems today are the result of too little economic growth, the
problems of tomorrow will increasingly become the problems of increased economic activity.
Human capital with skills in environmental management is quite scarce, and insufficient
information makes their task formidable. There is a severe lack of data and public records that
can promote environmental awareness. Hence, building an appropriate legal and regulatory
vi
framework and building modest but adequate capacity for environmental management emerge as
a first-rate priority.
The CEA draws attention to indoor air pollution as an environmental priority. Many young
children and women die prematurely or get sick because of breathing polluted air while cooking
with firewood. Using statistics on related diseases and the associated income losses and medical
costs, the economic cost of indoor air pollution is estimated at approximately $13 million per
year. This amounts to about 1.4 percent of the Timor-Leste GNI or 3.5 percent of the gross
domestic product (GDP) in 2006. This is a significant burden, but too little has been done to
address it. The situation can be mitigated by a combination of simple measures, including
improved stoves, better ventilation, cleaner fuels, and increased health awareness and basic
education. Timor-Leste has significant oil and gas reserves, and the potential for a much larger
liquefied petroleum gas market in urban areas should be investigated. These measures have been
shown to be cost-effective in other countries. They do require collaboration across institutional
boundaries and adaptation to local culture.
The report also points out the lack of clean water, appropriate sanitation, and hygiene as an
environmental priority. The CEA estimates that this imposes an economic cost of about $17
million per year by way of illness and premature death. This amounts to about 2 percent of
Timor-Leste GNI or 5 percent of GDP in 2006. While the government is trying to address this
problem, most of the efforts have been concentrated on water supply rather than on water
treatment and sanitation. Again, interventions can be simple, effective, and low-cost: hygiene
education, hand-washing with soap, building of latrines, disinfection of water at the household
level, and so on. All these measures have been shown to strongly reduce the incidence of disease
and will reduce mortality, particularly among children.
The CEA also looks at outdoor air pollution and at natural resource management for land,
forestry, and coastal and marine resources. Outdoor air pollution is not a serious problem for the
time being, but it could become so in the long run if the economy grows rapidly, urbanization
continues, heavy industry emerges, and motorization increases rapidly. This underlines the need
for good forward territorial and development planning.
Data are quite deficient when it comes to land degradation and forestry. A pioneering study on
land management, soil conservation, and invasive alien species has been undertaken as part of
the CEA process. This survey of over 1,800 households indicates that fallow, residue
management and tree planting are widely practiced. Siam weed is a widespread nuisance,
affecting about one-fifth of all cropland. Forestry data are being collected through a multidonor
effort in collaboration with the government, and this information will make a thorough
assessment possible. Existing information indicates that deforestation due to fuelwood gathering
is a local problem around Dili but not yet a national issue. However, slash-and-burn agriculture
and a rapidly growing population put strong pressure on the forests. Finally, the marine
environment is poorly documented, but informal evidence indicates that coral reefs and fisheries
are in relatively good shape. Prudent management of these resources represents an important
source of future income.
vii
In conclusion, much good work has already been done to enhance the quality of the environment
in Timor-Leste. Efforts are under way to improve the data base for environmental management.
Meanwhile, several areas of importance call for urgent attention:
The gaps in environmental legislation and regulations and the very limited human
resources available for effective implementation
The need to address indoor air pollution
The need to address deficient water-quality and sanitation
In each of these areas, the CEA gives examples of what can be done to effectively and efficiently
address the problems.
1
Chapter 1: Background and Rationale
Timor-Leste regained independence in May 2002. It has a current population of
approximately 1 million.1 The country consists of the eastern portion of the island of Timor and
includes the enclave of Oecussi (also known as Ambeno; 2,500 square kilometers) and the
islands of Atauro (144 square kilometers) and Jaco (8 square kilometers). Timor is part of the
Malay Archipelago, representing the largest and easternmost of the Lesser Sunda Islands. The
area of Timor-Leste is approximately 14,874 square kilometers, or 1,487,000 hectares (larger
than Cyprus or Jamaica but smaller than Fiji), with a total length of approximately 265
kilometers and a maximum width of 97 kilometers (Sandlund et al. 2001).
Timor-Leste is a young democracy struggling to build and strengthen the institutions of
state. Independence has been restored after 24 years of Indonesian control and three years of
U.N. administration, and Timor-Leste has experienced a series of riots and civil unrest that have
tested the government. The Human Development Index for Timor-Leste in 2006 was 0.547, with
a rank of 141 out of 179 countries (UNDP 2008). Timor-Leste is now classified as a lower
middle-income country, with a gross national income (GNI) per capita in 2007 of more than
$1,500 (World Bank 2009b). However, the non-oil per capita income is less than $400, which
gives a better perspective of the living standard facing most Timorese (GoTL 2008).
Agriculture is the main employer of the country, while oil production is the main growth
sector. The geographic characteristics of Timor-Leste make it less than ideal for agricultural
production: rugged, erosion-prone terrain, poor soils, and varying, often unpredictable rainfall.
Nonetheless, the economy is predominantly agricultural, with more than 70 percent of the
population living in rural areas (World Bank 2009a). Petroleum production constitutes the largest
growth sector in the country. Production in the Bayu Undan petroleum field began in early 2004,
dramatically increasing the country’s GNI. This income is prudently managed through a
Petroleum Fund, discussed further later.
The country has experienced economic hardship since it has regained independence. The
gross domestic product (GDP) fell during 2002 and 2003 due in part to a drought that adversely
affected crop yields. In 2004, non-petroleum GDP started a slow recovery, reaching a 2.3 percent
growth rate in 2005, but real non-oil GDP declined by 5.8 percent in 2006 (World Bank
2007a).With the buildup of the new United Nations mission and higher government spending,
non-oil GDP growth rebounded to about 8 percent in 2007. Total economic growth was
estimated to have reached 12 percent in 2008 (GoTL 2009). The country now faces the challenge
of building on its early progress in the context of very limited human resources, embryonic
institutions, and high levels of poverty and unemployment.
2
The sustainable management of natural resources is a major challenge for Timor-Leste.
With the rural population relying heavily on renewable natural resources for their livelihood and
the beginning of hydrocarbon extraction, Timor-Leste’s dependence on natural wealth is clear.
How effectively and efficiently natural wealth is managed and transformed into financial assets,
produced assets, and human capital is a key policy issue.
Against this background, the objectives of the Timor-Leste Country Environmental Analysis
(CEA) were to:
Measure the wealth of Timor-Leste, including nonrenewable natural wealth, renewable
natural wealth, produced capital, and intangible (i.e., human, institutional) capital
Identify and when possible quantify the country’s environmental priorities
Establish the relevant linkages between environmental and natural resource management
policies and the development agenda, including specific policy instruments where
feasible
Assess the institutional capacity within the country for sound environmental management
Provide policy advice and contribute to building capacity on environmental issues linked
to growth and development
Assist the Country Assistance Strategy process
3
Chapter 2: The Policy and Institutional Context
2.1 Country Context
Timor-Leste was colonized by Portugal in the sixteenth century and invaded by Indonesia
in 1975. In the sixteenth century it was known as Portuguese Timor until Portugal's
decolonization of the country. In late 1975 Timor-Leste declared its independence, but it was
invaded and occupied by Indonesia later that year and became Indonesia's 27th province, known
as East Timor.
In 1999 the population voted overwhelmingly for the restoration of independence from
Indonesia, but the outcome of the referendum was met with an orchestrated campaign of
violence and destruction. More than a thousand people lost their lives, and the country’s
infrastructure was left in ruins. An estimated 75 percent of the population was displaced and
nearly 70 percent of all buildings, homes, schools, etc. were destroyed by a campaign of violence
carried out by militia groups. Bridges and power lines were demolished, and the
telecommunications system was rendered inoperable. Valuable files, including land and property
titles, civil registry, and education records were destroyed. Following the ballot, most Indonesian
citizens left the territory, causing a severe shortage of qualified and experienced professionals
(World Bank 2005a).
Major steps have been taken to build the nation, but peace and political stability are still
major challenges. After three years of United Nations Transitional Administration (UNTAET),
elections were held in April 2002. Commander Ray Kala (Xanana) Gusmao won the election to
become the first democratically elected president of the country. Soon after, Timor-Leste was
recognized as a sovereign nation by the United Nations. In April 2006, the country slid into a
complex crisis sparked by the dismissal of nearly half the soldiers in Timor-Leste’s army (F-
FDTL). The crisis was accompanied by fighting between the army and police, widespread
communal violence in Dili, and the displacement of over 100,000 people.2 The United Nations
took on a renewed executive policing mandate. More than 2,500 foreign troops and police
remained in Timor-Leste in 2008, though a decrease in troop numbers was expected in mid-
2009. In some posts, control of policing responsibilities has been transferred to the Policia
Nacional de Timor-Leste (PNTL), and the U.N. expects that 70 percent of the sites will be
managed by the PNTL by mid-2009.
Presidential and parliamentary elections were held in April/May and June 2007,
respectively, and were generally judged free and fair. Following a second-round run-off
election, José Ramos-Horta became the country’s new president. While no single party gained
2 As of May 2009, most of the camps had been dismantled and the people resettled.
4
enough seats to form a government on its own, the president invited a coalition, the
Parliamentary Majority Alliance, to establish a government. With former President Gusmao as
Prime Minister, the IV Constitutional Government took office on August 8, 2007. Soon after, the
program of the new IV Constitutional Government acknowledged that the environment occupied
a marginal position in the previous governments and stated that the newly elected government
will give a strategic position to the environment in the development plans of the country (Barreto
2008).
Significant progress has been made with demilitarization. The two most pressing risks to
national stability, the Petitioners and Alfredo Reinado and his supporters, have been addressed.
The Petitioners—a breakaway group of the armed forces—have been financially compensated
and largely disbanded, although there is some concern that many grievances have been left
unresolved. Alfredo Reinado was killed during an assassination attempt on the president on
February 11, 2008, and his armed supporters have either surrendered or been captured. There has
been a significant reduction of the number of small arms in circulation in the community. The
armed forces have largely absorbed the former resistance fighters. As a result, the F-FDTL
retains much of its character from the resistance years, including a decentralized power structure.
2.2 National Wealth3
Timor-Leste total wealth per capita is among the highest in the region. Natural resources can
be valued by taking the present value of resource rents over an assumed lifetime and calculating
the net present value of such rents using a discount rate—in this case, 4 percent (World Bank
2008a).Using this method, Timor-Leste’s total wealth per capita ($56,000) is more than three
times higher than the average for the region and is comparable to upper middle-income countries
like Malaysia. (See Table 2.1 and Annex A for a technical discussion of the estimation of Timor-
Leste national wealth.)
3 This section draws heavily on notes prepared by Giovanni Ruta (Economist, World Bank), which
appears in edited form in Annex A.
5
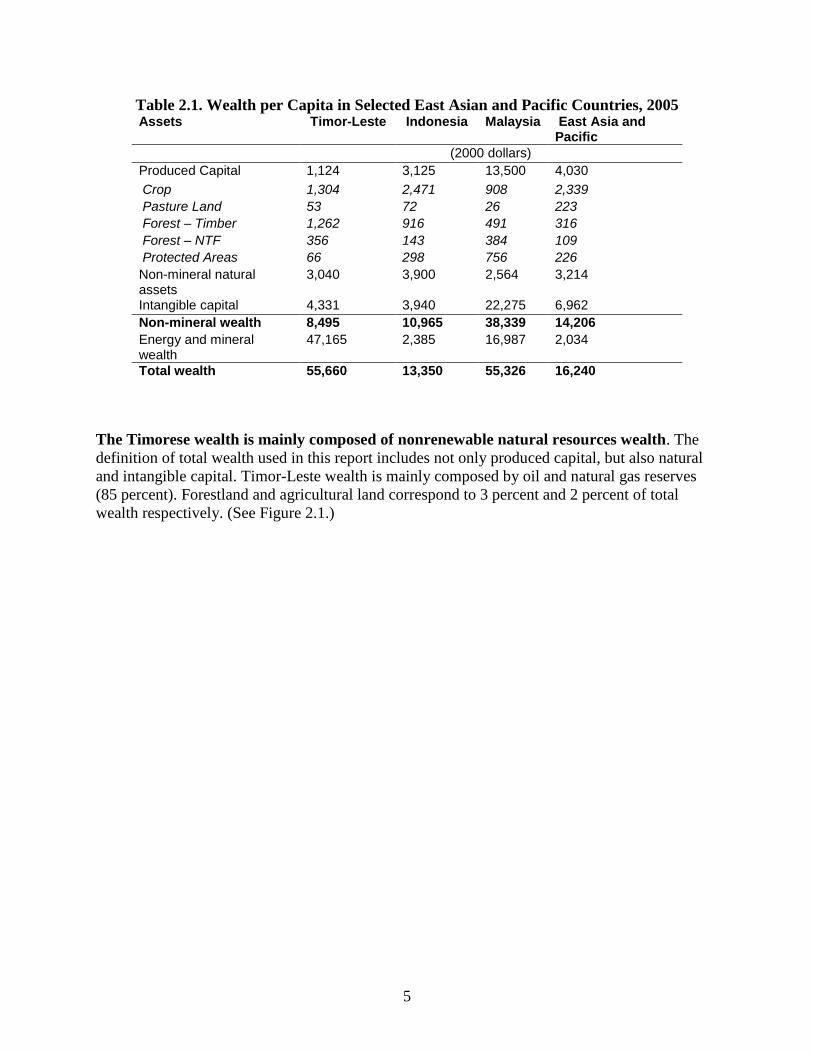
Table 2.1. Wealth per Capita in Selected East Asian and Pacific Countries, 2005 Assets Timor-Leste Indonesia Malaysia East Asia and
Pacific
(2000 dollars)
Produced Capital 1,124 3,125 13,500 4,030
Crop 1,304 2,471 908 2,339
Pasture Land 53 72 26 223
Forest – Timber 1,262 916 491 316
Forest – NTF 356 143 384 109
Protected Areas 66 298 756 226
Non-mineral natural assets
3,040 3,900 2,564 3,214
Intangible capital 4,331 3,940 22,275 6,962
Non-mineral wealth 8,495 10,965 38,339 14,206
Energy and mineral wealth
47,165 2,385 16,987 2,034
Total wealth 55,660 13,350 55,326 16,240
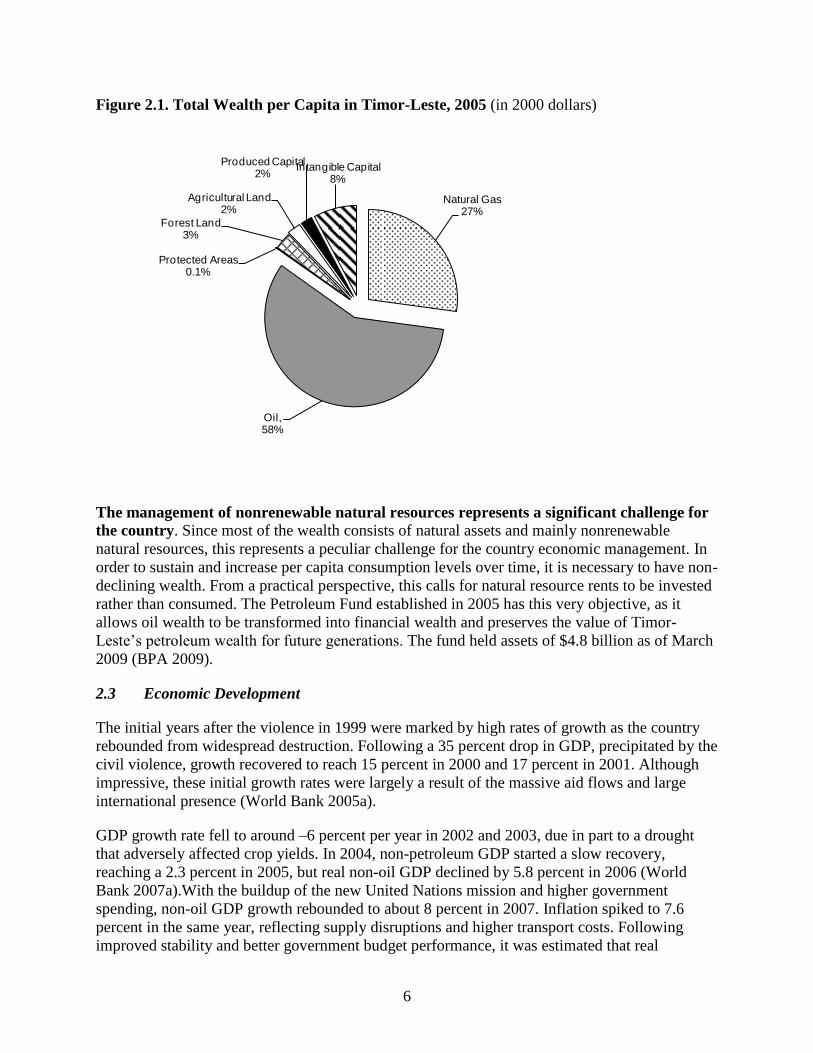
The Timorese wealth is mainly composed of nonrenewable natural resources wealth. The
definition of total wealth used in this report includes not only produced capital, but also natural
and intangible capital. Timor-Leste wealth is mainly composed by oil and natural gas reserves
(85 percent). Forestland and agricultural land correspond to 3 percent and 2 percent of total
wealth respectively. (See Figure 2.1.)
6
Figure 2.1. Total Wealth per Capita in Timor-Leste, 2005 (in 2000 dollars)
Natural Gas27%
Oil, 58%
Protected Areas0.1%
Forest Land3%
Agricultural Land2%
Produced Capital2%
Intangible Capital8%
The management of nonrenewable natural resources represents a significant challenge for
the country. Since most of the wealth consists of natural assets and mainly nonrenewable
natural resources, this represents a peculiar challenge for the country economic management. In
order to sustain and increase per capita consumption levels over time, it is necessary to have non-
declining wealth. From a practical perspective, this calls for natural resource rents to be invested
rather than consumed. The Petroleum Fund established in 2005 has this very objective, as it
allows oil wealth to be transformed into financial wealth and preserves the value of Timor-
Leste’s petroleum wealth for future generations. The fund held assets of $4.8 billion as of March
2009 (BPA 2009).
2.3 Economic Development
The initial years after the violence in 1999 were marked by high rates of growth as the country
rebounded from widespread destruction. Following a 35 percent drop in GDP, precipitated by the
civil violence, growth recovered to reach 15 percent in 2000 and 17 percent in 2001. Although
impressive, these initial growth rates were largely a result of the massive aid flows and large
international presence (World Bank 2005a).
GDP growth rate fell to around –6 percent per year in 2002 and 2003, due in part to a drought
that adversely affected crop yields. In 2004, non-petroleum GDP started a slow recovery,
reaching a 2.3 percent in 2005, but real non-oil GDP declined by 5.8 percent in 2006 (World
Bank 2007a).With the buildup of the new United Nations mission and higher government
spending, non-oil GDP growth rebounded to about 8 percent in 2007. Inflation spiked to 7.6
percent in the same year, reflecting supply disruptions and higher transport costs. Following
improved stability and better government budget performance, it was estimated that real
7
economic growth reached 12 percent in 2008 and would decrease to 8 percent in 2009 (GoTL
2009). Inflation has risen to an estimated 9 percent mainly due to food prices. This growth rate
should be seen in the context of the explosive population growth (3 percent per year), which is
among the highest in the world. About half of the population is below the aged of 18 (GoTL
2008).
Poverty is pervasive and has recently increased. The national upper poverty line for Timor-Leste
is defined for 2007 as about $27 per person per month. The national line defining extreme
poverty is set to about $22 per month. Half of the Timorese population lives below the upper
poverty line and about one-third are below the lower poverty line. A comparison of the two
poverty assessements available (for 2001 and 2007) shows a significant increase in poverty
levels over time. (World Bank, MoF, and DNS 2008). Whereas poverty rates are especially high
in rural areas, many people in urban areas suffer from unemployment. Unemployment in Dili,
where about a quarter of the formal labor force resides, is a particular problem that appears to
have exacerbated the intensity of the recent conflicts. Unemployment rates in the rest of the
country are much lower, with the national rate estimated at 3.5 percent, reflecting the prevalence
of self-employed and subsistence workers. However, it should be noted that more than one-third
of the population is registered as outside of the labor force and therefore not counted among the
unemployed. (World Bank, MoF, and DNS 2008).
Even though the agriculture sector contributes to only 30 percent of the GDP, it is estimated that
it provides subsistence to 80 percent of the population. Households rely heavily on the
cultivation of staple crops such as maize, rice, cassava, and sweet potato. Crop yields are well
below the average for East Asia, leading to problems of food security in many communities.
These low crop yields are devastating for communities during the country’s dry seasons.
As described in the previous section, petroleum production constitutes the largest source of
growth, yet it is an exhaustible resource that requires cautious management. In light of high oil
prices and expanding production, the gross national disposable income in Timor-Leste is
expected to grow rapidly. Non-petroleum sectors have unfortunately lagged behind (World Bank
2006).
2.4 National Development Planning
Since the country has regained independence, the government has articulated its vision for
the development of the country and, with the help of the donor community, has set about the
pursuit of this vision. The National Development Plan (NDP) set out the strategy for the period
2002–07. In August 2007, however, the new government suspended the NDP framework and six
National Priorities Working Groups, which became fully operational in June 2008 and started a
National Priorities 2009 process. The government’s National Priorities 2009 have been grouped
into seven areas: agriculture and food security; rural development; human resources
development; social protection and social services (including health); security and public safety;
clean and effective government; and access to justice. (See Annex E for a more detailed
description.) These reflect the government’s priorities as approved by the Council of Ministers
and reflect detailed work developed by the Working Groups formed for each priority.
8
The preparation of the Medium-Term Strategic Plan has already commenced. Given the
scope of this exercise, it is expected that a strategic framework will be developed by June 2009
and that in July the preliminary sector and national priorities will be defined and presented to the
Council of Ministers. After public consultations, this will be presented to the National Parliament
for approval in September 2009.
The medium-term strategy will focus on human resources development, rural development,
private sector participation, and infrastructure development. The objectives will be to lift
the majority of the poor out of poverty, with a particular emphasis on rural development; to
develop the private sector through enabling a more conducive business environment, and to
develop core infrastructure, including in regard to roads and bridges, ports and airports, dams,
irrigation schemes and water supplies, electricity, and telecommunications.
2.5 Environmental Institutions
Environmental Administrative Framework
The State Secretariat for the Environment (SEMA), under the Ministry of Economy and
Development, and the Ministry of Agriculture and Fisheries (MAF) are the two
government agencies with primary responsibilities for the environment. SEMA deals with
the environmental issues in the sectors, and MAF deals with resource management, including
forests, fisheries, and biodiversity conservation. The MAF has three Secretaries of State: the
Secretary of State of Agriculture and Forestry, the Secretary of State of Fisheries, and the
Secretary of State of Livestock. MAF has about 235 staff, with 4–10 staff in each district, but
with insufficient qualified personnel.
SEMA has responsibility for environmental monitoring, control, and protection. Its sectors
cover a wide range of environmental issues, such as environmental impact assessment (EIA),
pollution control, environmental law and enforcement, biodiversity conservation, environmental
awareness, environmental databases, environmental laboratories, and international environmental
affairs.4 Staffing has recently increased significantly, up to a total of 73 staff, with 39 of them
based in districts.5 However, only three of these staff have a master’s degree, and only four are
assigned to manage EIAs. There is no adequate infrastructure to perform monitoring activities.
There is just one laboratory to conduct very basic water analysis. SEMA is composed of the
Chief of Cabinet of the Secretary of State and two Directorates: the National Directorate for
Environmental Services (DNMA), with most of the employees, and the National Directorate of
Environmental Issues.
Environment is a cross-cutting topic, and therefore other Secretaries of State share
responsibilities in this area. The two main secretaries are the Secretary of Natural Resources
(SERN) and the State Secretary of Energy Policy (SSEP).
SERN is responsible for mineral and natural resources, including oil and gas, as well as
related industries. This department is under the Prime Minister and has a total of 36 employees.
Its budget has increased considerably from $500,000 (FY07) to $4.5 million (FY08). It plans to
4 More information is available in Leitão (2007).
5 Augusto Pinto, Director of Environment, personal communication, May 2009.
9
recruit 5 more staff and to carry out some important assessment studies, including a Timor-Leste
pipeline and gas hub option study, a supply base study, and a geological mapping of natural
resources (oil, gas, and minerals) (GoTL 2008b).
SSEP is responsible for implementing the 2008 development program that promotes the
use of renewable and alternative energy sources throughout the country. It has a total of 17
staff and its 2008 budget amounted to $3.3 million to undertake the 2008 development program,
which includes databases and studies on renewable energy sources; biogas pilot power plants;
thermoelectric plants; hydropower plants, including Iralalaro and Ainaro; and communication
(e.g., seminars to promote renewable energy) (GoTL 2008b).
The National Directorate for Water and Sanitation (DNSAS, Direccao Nasional Serbisu
Aguas e Saneamento) is the agency responsible for most of the water and sanitation sector
activity and is under the Ministry of Infrastructure. This agency is responsible for the
national management of water resources. It formulates sector policy, manages the distribution of
water for human consumption, and monitors water quality through the DNSAS laboratory.
Two other government stakeholders share part of these responsibilities with DNSAS: the DNMA
is in charge of water issues related to the agricultural and fishery sectors (i.e., irrigation and
aquaculture), and the Ministry of Health sets standards, codes of practice, and enforces
legislation.
Land management and forestry are under the current jurisdiction of the MAF. Forestry
management is currently handled by National Directorate of Agriculture and Forestry of MAF.
However, the Secretary of State of Environment and Reforestation is under the Ministry of
Economy and Development. There are only 26 forest guards in the country, and the forestry staff
have few resources available. Currently district officers are being instructed, and it is expected
that they will be trained by the end of 2009.
Land, water, and coastal zones provide many functions for many users, and therefore there
are potential conflicts that require an integrated approach. The GoTL recognizes that an
integrated approach to managing these resources is essential (GoTL 2006c), and it will help to
allocate resource more optimally while taking advantage of the inter-sectoral measures and
synergies. At present, Timor-Leste does not yet have an integrated management system for land,
water, and coastal zones.
10
Environmental Legal Framework6
Even though the Constitution of Timor-Leste has clearly established the importance of
protecting the environment, this has not yet been translated into legislation. The
Constitution of Timor-Leste enshrines a healthy environment as a constitutional right. Also in the
Constitution, the concept of environmental protection includes the idea to ―preserve and
rationalize natural resources‖ and the responsibility of the state to promote the sustainable
development of the economy. The Constitution prescribes that:
1. Everyone has the right to a humane, healthy, and ecologically balanced environment
and the duty to protect it and improve it for the benefit of the future generations.
2. The State shall recognize the need to preserve and rationalize natural resources.
3. The State should promote actions aimed at protecting the environment and
safeguarding the sustainable development of the economy.
Timor-Leste needs to develop the legal framework in many areas including the
environment. The country does not have a law that defines the generic legal and institutional
framework for the protection of the environment. The environmental laws from the Indonesian
period were sought as the framework to follow until a new one is gradually developed and
promulgated. This was clear during the UNTAET period, when environmental regulations were
promulgated only in the areas where there were legal gaps. However, the Indonesian laws lost
their political legitimacy after a legal battle in July 2003 that led to a Supreme Court decision
against their application and in favor of the Law of Portugal. Despite subsequent regulatory
clarification, supporting the position that the Indonesian legislation and UNTAET regulations are
part of the legal system until they are revoked, the legitimacy of the Indonesian laws is still
questioned.
During the UNTAET period, only a few regulations were promulgated in the
environmental area. As such, without the legitimacy of the previous Indonesian legal
framework, Timor-Leste has almost no environmental regulations or dispositions. Moreover,
there is some evidence to suggest that environmental protection is considered as a luxury for the
newly developing country.
The few regulations in force consist of two Guidelines from the Secretary of State of
Tourism (2001) and the Protected Areas Regulation from the UNTAET period (2000). The
main objectives of Guideline 1 (Environmental Requirements for Development Proposals) and
Guideline 5 (On Prescribed Activities for Pollution) are to define a simplified and incremental
process for environmental assessment evaluation and approval and to provide a framework for
environmental inspections and license issuing. The actual legal value of the Guidelines is also in
question, as the regulations associated with the Guidelines date from the Indonesian period.
In reference to the protected areas regulation 19/2000 from UNTAET, the act has the advantage
of being very simple and clear in its objective to protect specific areas or sites, but unfortunately
this regulation was not complemented by an appropriate management system for protecting more
broadly the different ecosystems of Timor-Leste. As a result, the legislation is limited to creating
6 This section draws heavily on a special report commissioned for the CEA; see Barreto (2008) for a more
detailed discussion.
11
only one category of protected areas—Wild Protected Areas.7 This regulation allows the
application of Indonesia Law No 23/1997 until domestic legislation is completed.8
There are two important draft environmental laws, but despite those efforts, the
environmental management of Timor-Leste lacks several important elements. The
government has made some progress in the development of two important draft laws related to
Environmental Impact Assessment and Pollution Control. These were initiated in 2006 but never
were approved. In 2008 SEMA returned to the subject with the goal of developing a new draft
that would simplify and consolidate the two proposed systems into one environmental license
system. The draft was finished in the end of 2008 with the work of a national counterpart (a
national lawyer and a SEMA environmental engineer adviser) and an international
environmental lawyer supported by the World Bank. The draft decree-law was presented to the
Council of Ministers in February 2009. Further work is now being done on the standards for
EIAs, after which the draft will once again be presented.
In 2009 SEMA planned to continue the development of the environmental legal framework. The
priorities are the development of the National Environmental Policy Law (Lei de Bases do Meio
Ambiente) and the completion of the necessary legal package for the implementation of the
decree-law for the environmental license system.
Overall, inconsistent language and lack of human technical capacity are important
obstacles for the development of the Timor-Leste legal framework. Even though the official
languages in the Country are Portuguese and Tetum, the constitution also recognizes Indonesian
and English as working languages in public administration. As a result, there are challenges
related to translation, legal vocabulary, and interpretation of laws.
There is no specific legislation of the protection of coastal and marine resources. The
Protected Areas Regulation of Timor-Leste includes some of the coastal and marine resources in
the list of Wild Protected Areas, but it does not adequately protect all the main ecosystems of the
country. A great deal of attention has been given to the development of the regulations for
fishing sector, but the main problem identified by the study in the fishing sector is the illegal
fishing activities that in most cases are related to boats of other nationalities fishing in Timor-
Leste waters (Barreto 2008). This could constitute a threat to marine resources, including reefs
and coral ecosystems, because of the harmful methods and techniques used for fishing. This type
of problem could be more effectively resolved through bilateral agreements between Timor-
7 The Wild Protected Areas are: (a) the total land area of Jako Island together with surrounding rocks,
reefs, and other surface and sub-surface features; (b) Tutuala Beach together with forest adjacent to the
beach; (c) Cristo Rei Beach and the hinterland; (d) the summit of Tata Mailau Mountain, all elevations on
Tata Mailau Mountain above 2,000 meters and the surrounding forest; (e) the summit of Sadoria
Mountain, all elevations on Sadoria Mountain above 2000 meters and the surrounding forest; (f) the
summit of Malobu Mountain, all elevations on Malobu Mountain above 2000 meters and the surrounding
forest; (g) the summit of Mount Diatuto and the surrounding forests; (h) the summit of Mount Fantumasin
and the surrounding forests; (i) the Riverlet Clere Sanctuary; (j) the Tilomar Reserve; (k) the Lore
Reserve; (l) the Monte Mundo Perdido and the surrounding forest; (m) the summit of Monte Matebian
and all elevations on Monte Matebian above 2000 metres and the surrounding forest; (n) the Monte
Cablaque and the surrounding forest; and (o) the Manucoco Reserve. 8 Augusto Pinto, Director of Environment, personal communication, May 2009.
12
Leste and the home countries of the boats involved in illegal fishing. These bilateral agreements
could also include joint patrols in national waters of both countries involved in the problem.
In the water sector, a National Water Policy has been formulated but not yet approved. The
GoTL has been working with the Asian Development Bank (ADB) on a National Water Policy
that incorporates the key principles of integrated water resource management. According to their
assessment, the implementation of the policy requires strengthening the capacity of water
resources management, and coordination with DNSAS, MAF, DNMA, and others. The approval
of this policy has been delayed, and this had implications for the development of the institutional
and legal frameworks.
There is no specific or independent water and sanitation sector regulation of service
provision. Currently the activities of the sector are guided by the strategic plan for service
delivery developed during the UNTAET period and the standards and code of practices set by
the Ministry of Health and the previous Secretary of Environmental Coordination, Territorial
Zoning and Physical Development (GoTL 2006e). Donors through the Trust Fund for East-
Timor (TFET) and AusAID have assisted policy and planning through preparation of investment
strategies, legislation, and guidelines. Although there is no regulation of service, a rural water
and sanitation and hygiene sector strategy was developed and signed in 2008 by the Ministries of
Health and Infrastructure with support from the Rural Water Supply and Sanitation Program. As
dictated by the strategy, separate water and sanitation policies are now under way. Under the
plan, they are scheduled to become law by 2010–11.9
Timor-Leste has concentrated legislative efforts in the development of regulations for
sanitation and water for public consumption. In the sanitation area, one decree of law was
approved on Sanitary Surveillance Authorities, and two additional legal acts are in the process of
being approved: One is in relation to multi-village water supply systems and the other is on the
management of sanitation services, septic tanks, and wastewater treatment systems, with
provisions for health and environmental issues. The World Health Organization (WHO) has been
working on water standards.
In terms of water consumption, two regulations were promulgated: Decree-Law 04/2004 on
Water Supply for Public Consumption and Ministerial Order 1/2004 on Fees and Charges for
Water Supply. The Decree-Law is a standard regulation except in the creation of two systems for
water supply: one for urban areas managed by the government and another for rural areas
managed by the community.10
The fees policy is an attempt to balance the need to charge user
fees for financial and environmental reasons with the reality of the economic situation of the
population and their right to have access to water.
There is no specific legislation on air quality. The only environmental legislation related to
emissions standards for stationary sources is the Ministerial decree 13/1995 from the Indonesian
period.
9 Jesse Shapiro, Sanitation Adviser, personal communication, May 2009.
10 The approach to community water management explicitly recognizes the advantages of using
traditional laws in the management of rural water supplies. The role of the Water and Sanitation Service
in assisting the communities in dispute resolution can be very important, particularly for disputes outside
the community where the traditional structures have less ability to be effective.
13
Timor-Leste has a very complex situation related to land rights and tenure. This situation is
a historical legacy of the successive processes of dispossession and resettlement during
Portuguese and Indonesian rule, a lack of official recognition of traditional land rights, and
finally the destruction of the existing land records and registries in the last days of Indonesian
occupation.
The Timor-Leste Land Reform was done in phases, using a participatory approach, but the
most important land laws have not yet been approved. The reform included the formulation
of a package of laws based on field research carried out under the Timor-Leste Land Law
Program (LLP) and supported by the U.S. Agency for International Development (USAID). The
LLP drafted the following laws/decrees that can support new legislation on land tenure in the
country: decree law on leasing of state property and on land dispute mediation (already approved
by the National Parliament), and acts on property system, land transfer and registration, pre-
existing land rights, and title restitution (not yet enacted). The latter are the most important in
terms of completing the creation of a legal system of land property in Timor-Leste and solving
the uncertainty about land property.11
However, they have been in the approval process since
2005.
MAF drafted the National Forest Policy, but the legislation and regulations to support this
policy is still pending. MAF and the NDCF, supported by the Food and Agriculture
Organization (FAO) and the Netherland Partnership Programme, drafted the National Forest
Policy. This was approved following public hearings involving a broad range of stakeholders.
The aim of the National Forest Policy is to provide a framework for the development of an
appropriate Forest Law and Regulations. Supporting forest legislation is being formulated. A
concept for implementing participatory forestry practices has also been drafted and is under
decentralized review (Heino 2006). At present, there are only two regulations, formulated during
the UNTAET period, that are in effect: Regulation 2000/17 prohibits logging and Protected
Areas Regulation 2000/19 (described previously) defines the majority of the remaining forest
cover in Timor-Leste as protected areas.
Timor-Leste has been very active in developing the institutional and legal framework for
oil and gas and has created two systems: the Joint Petroleum Development Area (JPDA) and
the Timor-Leste Exclusive Area (TLEA) regimes. The JPDA regime is based on the Timor Sea
Treaty. It is supported by several legal diplomas that were promulgated in the areas of
exploration, drilling, development and production, fiscal regime, and institutional arrangements.
In addition to the JDPA, the TLEA has regulatory conditions for oil and gas operations. It has
promulgated a law governing petroleum activities and a model production sharing contract, as
well as rules for taxation and the dedicated use of petroleum revenues through the creation of a
petroleum fund.
The law governing petroleum activities does not have a specific chapter on environmental
protection, but it does have a generic set of environmental principles. Despite the clear
acknowledgement within the Timor Sea Treaty of the importance of the environmental
11
Public estimates suggest that there approximately 50,000 land titles have been issued since the
Portuguese colonial era: about 2,000 by the Portuguese administration and approximately 48,000 during
the Indonesian regime (GoTL 2008b).
14
dimensions of oil and gas production, the subsequent regulations (which include the Interim
Petroleum Mining Code and the Petroleum Act), do not address these issues. The approach relies
on a ―Good Oil Field Practices‖ concept as a standard or solution for achieving environmental
protection, as well as on the best management of the oil and gas resources.
In terms of policy and regulation in the mining sector, the government is now giving
attention to the drafting of the regulatory framework for mining operations. The
framework, plus building sectoral knowledge and internal capacity, are the emphasized priorities.
The initial law for the mineral sector was drafted in 2002, but it did not appear to meet the
expectations and needs of the government. As a result, a new law proposal is being drafted. The
first draft had a chapter on the environment, but it did not recognize the variability in capacity
across the range of small and large mining projects. Some key elements of value in the existing
draft include requirements for an ecological and social baseline survey, an EIA, a mine
feasibility study, and the establishment of a mine reclamation guarantee trust fund. Clearly, some
of these requirements only make sense for big mining projects, and a less rigorous approach
would be more appropriate for the smaller projects that are expected to be exploited first in
Timor-Leste.
There is no specific environmental legal framework for electricity projects. At the regulatory
level the government has successfully promulgated the basis for the national electricity system.
The emphasis of the regulation is on the creation of an electricity system that is efficient,
integrated, flexible, and economically sustainable. In terms of implementation, important
measures did not get beyond the initial recommendations, e.g. the creation of Water and
Electricity Regulatory Authority and the drafting of regulations associated with the new policy
related with fees and tariffs, as defined in the decree-law 13/2003.

15
Chapter 3: Priority Environmental Problems
This chapter reviews a selection of environmental issues that have been chosen on the basis of
their impacts on human health and ecosystems. Even though these impacts can be translated into
economic terms, the lack of reliable data has limited the analysis. The two main sections concern
environmental health and natural resources management analysis.
3.1 Environmental Health
This section looks at the environmental health damages related to outdoor air pollution, indoor
air pollution, and lack of appropriate water and sanitation services and hygiene. Technical
discussions of indoor air pollution and water and sanitation services and hygiene are presented in
Annexes 2 and 3.
Outdoor Air Quality
At present, outdoor air pollution is a minor problem. It is mainly limited to Dili, but the
situation nevertheless needs attention considering the rapid urban population growth rate that
Timor-Leste is experiencing and the potential economic growth of the country. Dili already
accounts for 20 percent of the population. The urban population is growing much faster than the
rural population. Other secondary urban centers should also grow, but growth in Dili is expected
to be faster than average due to high urban fertility as well as migration from the countryside and
from other smaller urban centers. If population growth is accompanied by economic growth, it is
expected that the number of vehicles will significantly increase in Dili.
The Timor-Leste vehicle fleet is very small and mainly concentrated in Dili. Louis Berger
Group and Kmaneck (2005) estimate that the operational vehicle fleet in Timor-Leste im imd-
2004 was 22,150 vehicles, which was approximately 24 vehicles per 1,000 people. The number
has probably increased significantly since then. The fleet consisted of 11,000 motorcycles, 3,600
private cars and taxis, 1,800 four wheel drive vehicles, 1,800 pickups and vans, 1,750 buses, and
2,200 trucks. Small vehicles dominate the bus fleet (90 percent), with micro and mini-buses
having up to 20 seats. More than three-quarters of the vehicles are registered in Dili District.
Emissions of greenhouse gases and other pollutants from road transport are modest, given
the small number of motor vehicles in use in Timor-Leste. Growth in the number of road
vehicles that is expected to accompany economic and population growth will increase the
seriousness of vehicle emissions. At the same time, rising income will allow people to purchase
better quality vehicles, to replace old vehicles, and to maintain vehicles in better condition,
which will reduce emissions. In reaching the balance between these two opposite forces, the
government plays a key role on the enforcement of traffic regulations, including the requirement
for regular inspection of vehicles.
16
Industrial emissions are also limited since the industrial sector represents a small
proportion of the economy of Timor-Leste. The industrial sector represents 15 percent of
GDP, and it is expected to increase as the economy grows (World Bank 2007b). (Agriculture is
32 percent and services, 54 percent). The minimal production in the minerals and petroleum
sectors has kept their environmental impacts small and localized. Shipping, petroleum
exploitation and energy exploitation, and energy generation are likely to be the main large-scale
source of industrial pollution (GoTL 2006c).
Open burning is also contributing to outdoor air pollution. Open burning of small amounts of
waste takes place along the roads of Dili, and this lowers urban air quality. The practice was
inherited from the Indonesian occupation, but it still goes on daily all over the country and
includes the burning of both organic and inorganic waste. In addition, people in the outskirts of
the city have the custom of burning the hillsides in the dry season to produce new vegetation for
cattle and farmable area (Leitao 2007).
Air quality is not currently monitored in Timor-Leste, and the country does not have
technical capacity to provide monitoring. According to DNMA, this responsibility falls on its
Environmental Laboratory. This laboratory possesses a particulate matter (PM10) analyzer, but
the equipment is not working properly and there are neither trained people nor the equipment
needed to conduct reliable air quality monitoring (Leitao 2007).
Indoor Air Quality
Although outdoor sources often dominate air pollution emissions, indoor sources
frequently dominate air pollution exposures. Exposure is a function of both the pollutant
concentration in an environment and the person-time spent in the environment. The household
combustion of biomass (such as dung, charcoal, wood, or crop residues) or coal is the main
factor behind of indoor air pollution (IAP) (Desai et al. 2004).
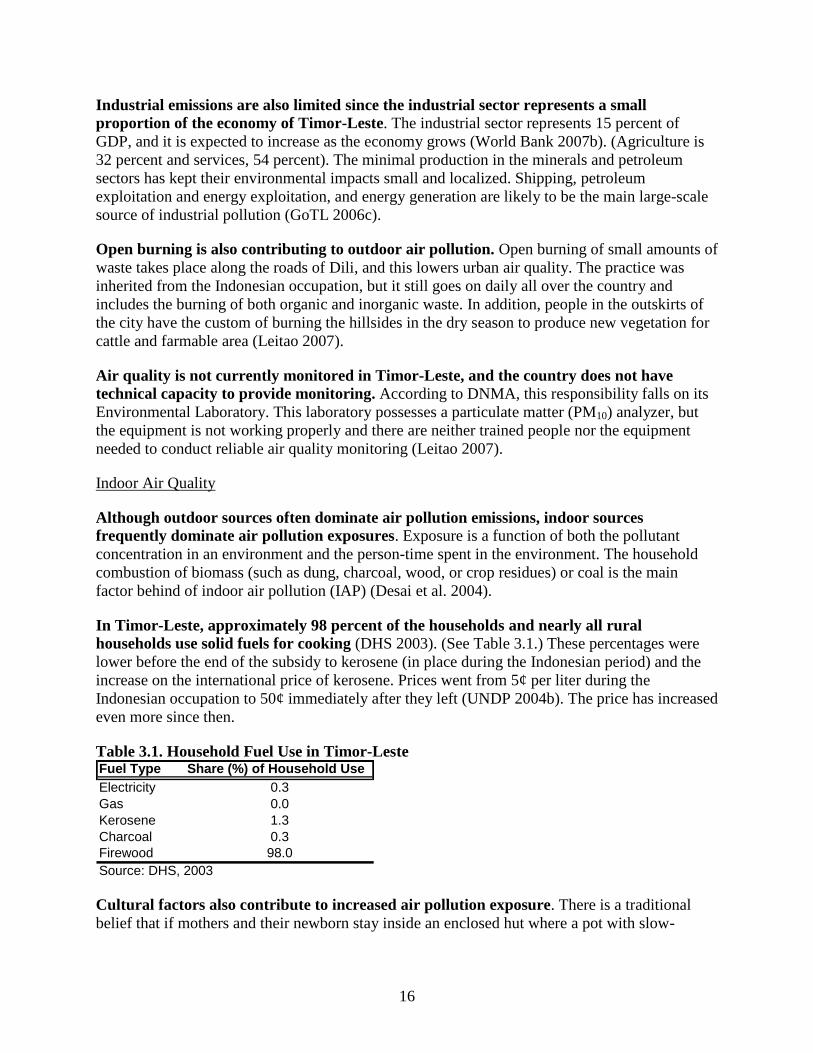
In Timor-Leste, approximately 98 percent of the households and nearly all rural
households use solid fuels for cooking (DHS 2003). (See Table 3.1.) These percentages were
lower before the end of the subsidy to kerosene (in place during the Indonesian period) and the
increase on the international price of kerosene. Prices went from 5¢ per liter during the
Indonesian occupation to 50¢ immediately after they left (UNDP 2004b). The price has increased
even more since then.
Table 3.1. Household Fuel Use in Timor-Leste Fuel Type Share (%) of Household Use
Electricity 0.3
Gas 0.0
Kerosene 1.3
Charcoal 0.3
Firewood 98.0
Source: DHS, 2003
Cultural factors also contribute to increased air pollution exposure. There is a traditional
belief that if mothers and their newborn stay inside an enclosed hut where a pot with slow-
17
burning fuel creates an atmosphere of smoke and warmth, both will be protected from possible
sickness (Leitao 2007).
Solid fuel use (SFU) generates substantial emissions of many health-damaging pollutants,
including respirable particulates and carbon monoxide when it is burned in inefficient simple
stoves or used in houses without ventilation. Cooking facilities are generally quite simple, using
three stones as the foundation (UNDP and GoTL 2008).
The health outcomes that have strong association with SFU include acute lower respiratory
infections in young children and chronic obstructive pulmonary disease and lung cancer
(from exposure to coal smoke) in adult women (more than 30 years old). It is these
population groups who suffer the most from indoor air pollution because they spend much more
of their time at home and more time cooking than older children and adult males do.
The methodology used by Desai et al. (2004) and international best practice were followed
in order to calculate the burden of disease from household SFU for Timor-Leste. (See
Annex 2 for a technical discussion of the estimation of the cost.)
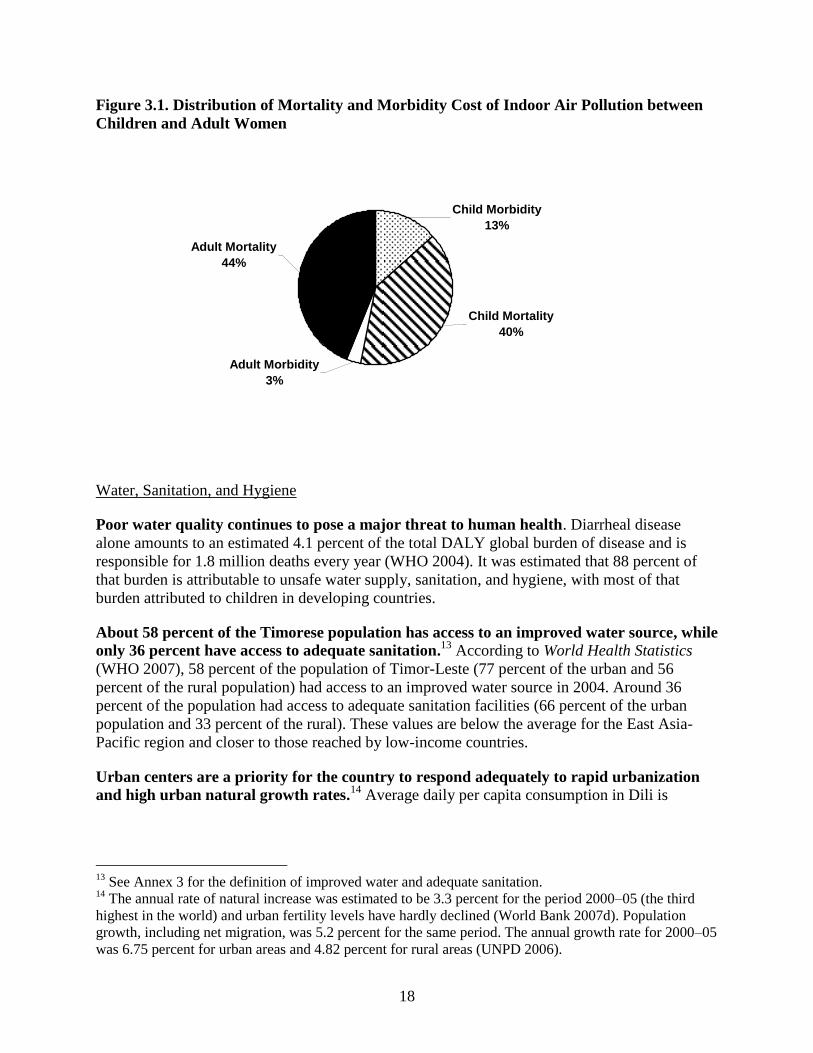
Children bear most of the estimated attributable burden from SFU. (See Figure 3.1.) The
burden is about 8,000 disability-adjusted life years (DALYs)12
lost and some 300 deaths, which
respectively represent 5 percent and 4 percent of the national total in 2002.
The annual value of the damage of indoor air pollution is estimated by taking into account
both mortality (early death) and morbidity (sickness). There are different methods of
estimating this cost in dollars (see Annex 2). In principle, we estimate the cost of lost income due
to poor health or early death, and the cost of treatment.
The annual morbidity and mortality cost of health effects from indoor air pollution
associated with the use of solid fuel is estimated at some $12.5 million. The lower bound is $5
million and the upper bound is $20 million. The mean estimate is equivalent to about 1.4 percent
of Timor-Leste GNI, or 3.5 percent of GDP in 2006.
12
See Annex 2 for the definition of DALY.
18
Figure 3.1. Distribution of Mortality and Morbidity Cost of Indoor Air Pollution between
Children and Adult Women
Adult Morbidity
3%
Child Mortality
40%
Child Morbidity
13%
Adult Mortality
44%
Water, Sanitation, and Hygiene
Poor water quality continues to pose a major threat to human health. Diarrheal disease
alone amounts to an estimated 4.1 percent of the total DALY global burden of disease and is
responsible for 1.8 million deaths every year (WHO 2004). It was estimated that 88 percent of
that burden is attributable to unsafe water supply, sanitation, and hygiene, with most of that
burden attributed to children in developing countries.
About 58 percent of the Timorese population has access to an improved water source, while
only 36 percent have access to adequate sanitation.13
According to World Health Statistics
(WHO 2007), 58 percent of the population of Timor-Leste (77 percent of the urban and 56
percent of the rural population) had access to an improved water source in 2004. Around 36
percent of the population had access to adequate sanitation facilities (66 percent of the urban
population and 33 percent of the rural). These values are below the average for the East Asia-
Pacific region and closer to those reached by low-income countries.
Urban centers are a priority for the country to respond adequately to rapid urbanization
and high urban natural growth rates.14
Average daily per capita consumption in Dili is
13
See Annex 3 for the definition of improved water and adequate sanitation. 14
The annual rate of natural increase was estimated to be 3.3 percent for the period 2000–05 (the third
highest in the world) and urban fertility levels have hardly declined (World Bank 2007d). Population
growth, including net migration, was 5.2 percent for the same period. The annual growth rate for 2000–05
was 6.75 percent for urban areas and 4.82 percent for rural areas (UNPD 2006).
19
estimated at 208 liters, with water losses estimated at 40 percent (JICA/TEC 2001).15
Currently,
less than half of the daily demand for water in Dili is satisfied from the water treatment plant; the
rest is supplied by 10 deep wells that provide adequate quality water without treatment other than
chlorination (GoTL 2006e).
In Dili, the provision of drinkable water faces many challenges. First, the sector has a high
record of households connected to the network informally. This deteriorates the water quality
within the distribution system due to low pressures and a lack of adequate water main
maintenance, allowing the intrusion of contaminated groundwater and thus increasing the
probability for waterborne diseases. Unfortunately, the level of service available to the
substantial areas of ―informal‖ urban settlements is not well documented.
The second issue is the lack of proper sanitation. Currently, no sewerage system exists in
Timor-Leste (GoTL 2008b). Even though 36 percent of the population has access to toilets or
adequate excretal disposal facilities, the waste is generally left untreated. In the absence of
proper facilities, many households use drains, rivers, fields, or gardens. This is leading to
biological, chemical, and physical pollution of the water, where the shallow wells are often
contaminated by nearby domestic sewage treatment systems that in the main have a very low
degree of effectiveness. This problem is particularly important in Dili, where half the households
rely on shallow wells for their water supply.
Inadequate solid waste management is also contributing to the lack of proper sanitation.
Solid waste is collected in Dili by commercial operators, but there is not complete coverage, and
much waste is not collected, left lying on the streets, dried up streams, and the sea. Moreover,
there are no formal systems for collecting and disposing of waste outside Dili (GoTL 2008b).
The third issue is the impact of agriculture and animal activities. The water is supplied to the
city through three rivers on the outskirts. This makes the system very vulnerable to activities
such as animal herding, agriculture, or slash-and-burn that take place upstream and influence
both the quality of the water and the physical integrity of the treatment system downstream.
Moreover, the high levels of sedimentation for erosion and turbidity make the water treatment
more costly.
Another problem brought up by the DNMA is the issue of waste oil and its infiltration into
the soil and groundwater. A great number of small workshops and also a few larger activities,
such as Electricity of Timor-Leste (EDTL), produce waste oil. Most of this oil is going into the
city drainage and/or soil, which presents a problem regarding water contamination with heavy
metals such as lead, chromium, and cadmium, with naphthalene, with chlorinated hydrocarbons,
and with other toxic materials (Leitao 2007). SEMA has initiated a project to collect waste oil
from Dili and surrounding districts. Waste oil will start to be collected in 2010.16
15
This includes technical and commercial losses and it varies from 25 to 70 percent, depending of the
area. 16
Augusto Pinto, Director of Environment, personal communication, May 2009.
20
These problems not only increase the cost of water treatment and are obstacles to the
provision of clean water to the population, they also have adverse impacts on the biological
diversity of local waterways and coastal ecosystems. For example, high concentrations of
nutrients from wastewater can damage corals reefs and their internal ecosystems. The
environmental contamination reduces productivity and revenues in fisheries, agriculture, and
tourism (Green 2006).
In its effort to respond to those issues, Timor-Leste subscribes to the Millennium
Development Goals (MDGs). Timor-Leste is committed to reach MDG7, ensure environmental
sustainability, and its target 10: reduce by half the proportion of people without sustainable
access to safe drinking water. This target involves both the proportion of the population with
sustainable access to an improved water source and the proportion with access to improved
sanitation.
To measure progress toward these goals, Timor-Leste adopted 2001 as its baseline. While
most countries have been able to define their targets, Timor-Leste has recently regained
independence and therefore it does not have such historical information. The major disruption
suffered by Timor-Leste in 1999 also means that any information on the country’s situation in
1990 would probably be meaningless. Hence, the baseline year used in the first MDG Report is
2001. A direct implication for Timor-Leste is the need to adjust the targets according to the
shorter time frame allowed to attain the goals (UNDP 2004a). Following this adjustment, the
GoTL has shown commitment to achieve target 10 in MDG7.
The agreed targets in the sector require substantial and sustained programs to overcome
important challenges recognized by the GoTL. These include low service coverage, rapid
population growth, increasing expectations on government and community, and limited human
and financial resources (GoTL 2006e). Even though Timor-Leste has improved the access to safe
drinking water and sanitation significantly, many people are still left without access to those
services. Moreover, those who have access to sanitation are not connected to a sewerage system
or to adequate isolation of human excreta.
Timor-Leste is performing better, in relative terms, than other low-income countries. While
diarrheal illness is generally not as severe as other water-related illness, it is more common and
affects a larger number of people. The statistics show that Timor-Leste is performing better than
very-low income countries, such as Sierra Leone. Moreover, it is even doing better than a
country like Lao PDR that has the same per capita income level. In absolute terms, however, the
death and DALY rates of diarrheal disease are high, and they impose a significant economic cost
on the country.
A rough estimate of the health impact of diarrheal illness cases attributable to inadequate
water supply, sanitation and hygiene indicates that a cost of approximately $16.9 million.
This central estimate corresponds to 2 percent of the Timor-Leste GNI or 5 percent of GDP in
2006.
This economic cost is limited to health effects; however, other important welfare impacts
are associated with lack of adequate water supply, sanitation, and hygiene. A recent study
by the World Bank (2007f) analyzes the economic impacts of poor sanitation on health, water,
21
external environment, tourism, and other welfare measures such as time loss for toilet access.
The study was limited to Cambodia, Indonesia, the Philippines, and Vietnam. The estimated total
cost was 1.3 percent of GDP in the Philippines and Vietnam, 2.3 percent in Indonesia, and 7.2
percent in Cambodia.
A rough extrapolation from this study indicates that the total cost of poor sanitation in
Timor-Leste could be around $17 million per year. Timor-Leste has a rate of access to
improved sanitation below Indonesia’s level but much higher than Cambodia’s. Timor-Leste has
a GDP per capita similar to Vietnam but much lower than Indonesia’s. Considering those
variables, a rough extrapolation indicates that the total cost of poor sanitation in Timor-Leste
could be around 5 percent of GDP, or 2 percent of GNI in 2006.
3.2 Natural Resources Management
Most people in Timor-Leste are directly dependent for their livelihood on cultivating the
land, using forest products, and, to a lesser extent, harvesting marine life. In addition,
marine ecosystems contain an important potential source of protein to combat malnourishment
and possibly significant income from nature-based tourism.
This section on natural resources management covers three areas of interest: land management,
with a focus on crop production and land degradation; forestry, with a discussion of the main
factors behind forest degradation; and coastal zone and marine ecosystems management, with an
emphasis on coral reefs and fisheries. Biodiversity is discussed as an integral part of the two
latter ecosystems in particular. All areas suffer from a lack of quantitative data.
Land Management
Information on land use and land cover in Timor-Leste is sparse and inconsistent. The most
recent aerial photographic survey was conducted by the Royal Australian Air Force in 2001. The
Land and Property Unit of the Ministry of Justice is undertaking an analysis of these photographs
with the eventual goal of creating a comprehensive land cover database (GoTL 2006c).
There are currently major discrepancies in land cover categories and estimates. The World
Bank Country Assistance Strategy (World Bank 2005a:51) reported that ―[76] percent of the land
area is covered by secondary (mostly scrub) forest and 10 percent by grassland.‖ However,
UNDP (2001), using 1999 satellite images, concluded that 16 percent of Timor-Leste is dense
forest; 19 percent is sparse forest, woodland, or mixtures of small fields and secondary forest;
and 65 percent contains no forest cover of any sort.
The GoTL (2006c) provides the most recently published land cover estimates. However, because
of a lack of comprehensive information they defer to the 2001 MAF assessment that used
Indonesian aerial photography from 1993. (See Table 3.3.)
22
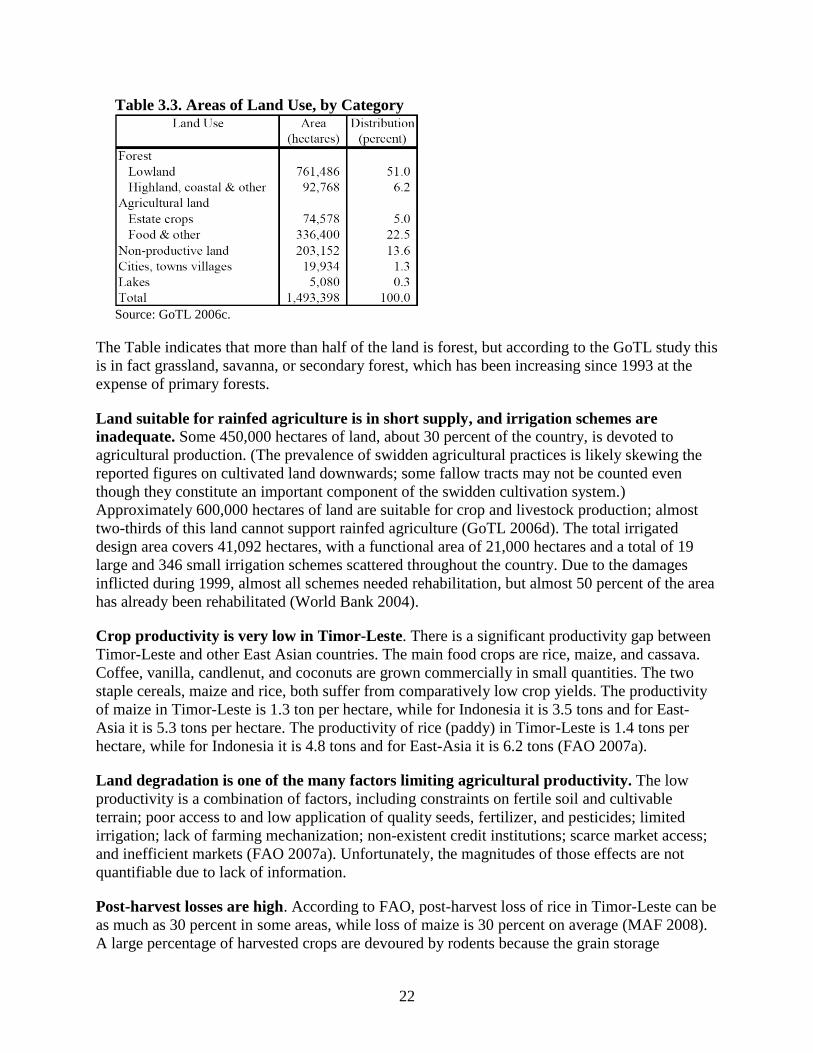
Table 3.3. Areas of Land Use, by Category
Source: GoTL 2006c.
The Table indicates that more than half of the land is forest, but according to the GoTL study this
is in fact grassland, savanna, or secondary forest, which has been increasing since 1993 at the
expense of primary forests.
Land suitable for rainfed agriculture is in short supply, and irrigation schemes are
inadequate. Some 450,000 hectares of land, about 30 percent of the country, is devoted to
agricultural production. (The prevalence of swidden agricultural practices is likely skewing the
reported figures on cultivated land downwards; some fallow tracts may not be counted even
though they constitute an important component of the swidden cultivation system.)
Approximately 600,000 hectares of land are suitable for crop and livestock production; almost
two-thirds of this land cannot support rainfed agriculture (GoTL 2006d). The total irrigated
design area covers 41,092 hectares, with a functional area of 21,000 hectares and a total of 19
large and 346 small irrigation schemes scattered throughout the country. Due to the damages
inflicted during 1999, almost all schemes needed rehabilitation, but almost 50 percent of the area
has already been rehabilitated (World Bank 2004).
Crop productivity is very low in Timor-Leste. There is a significant productivity gap between
Timor-Leste and other East Asian countries. The main food crops are rice, maize, and cassava.
Coffee, vanilla, candlenut, and coconuts are grown commercially in small quantities. The two
staple cereals, maize and rice, both suffer from comparatively low crop yields. The productivity
of maize in Timor-Leste is 1.3 ton per hectare, while for Indonesia it is 3.5 tons and for East-
Asia it is 5.3 tons per hectare. The productivity of rice (paddy) in Timor-Leste is 1.4 tons per
hectare, while for Indonesia it is 4.8 tons and for East-Asia it is 6.2 tons (FAO 2007a).
Land degradation is one of the many factors limiting agricultural productivity. The low
productivity is a combination of factors, including constraints on fertile soil and cultivable
terrain; poor access to and low application of quality seeds, fertilizer, and pesticides; limited
irrigation; lack of farming mechanization; non-existent credit institutions; scarce market access;
and inefficient markets (FAO 2007a). Unfortunately, the magnitudes of those effects are not
quantifiable due to lack of information.
Post-harvest losses are high. According to FAO, post-harvest loss of rice in Timor-Leste can be
as much as 30 percent in some areas, while loss of maize is 30 percent on average (MAF 2008).
A large percentage of harvested crops are devoured by rodents because the grain storage
23
facilities tend to be unsecured. Protective measures like rodent traps are seldom used because
they are deemed too costly by many farmers (GoTL 2006d).
Invasive species threaten agriculture. In recent years Siam weed (Chromolaena odorata), one
of the world’s worst tropical weeds, has become a widespread nuisance in Timor-Leste, causing
difficulties with plantation establishment and for agriculture generally. The expansion of this
weed may be facilitated by the frequent fires, as regrowth occurs rapidly after burning, giving it
an advantage over plants that recover more slowly. Additionally, deforestation also favors the
weed, which does not do well in shaded forest (Mcfadyen 2003). Although it has not been
quantified, the direct and indirect economic losses due to Siam weed are likely to be significant.
The only effective control is natural predators such as gall fly (Cecidochares connexa), and an
experiment with this method was started in Timor-Leste in 2005.
The combination of geological and climate conditions, slash-and-burn agriculture,
overgrazing (by goats), and deforestation have contributed to the partial/severe
degradation of one-third of the land area of Timor-Leste (World Bank 2005). In addition to
decreasing agricultural productivity, high levels of erosion disrupt the hydrological cycle needed
to absorb and release water throughout the year. Erosion also yields additional problems through
increased sedimentation in lowland areas, estuaries, and reefs. Once deposited in lowland areas,
the eroded sediments silt up agricultural fields and damage irrigation systems and water storage
facilities. In coral reefs and estuaries the accumulation of sediments can lead to eutrophication,
choking aquatic vegetation and disrupting ecosystem functioning (Sandlund et al. 2001).
The geological condition of the country makes it susceptible to land degradation.17
The
island is characterized by a dramatic topography. The Ramelau mountain range stretches across
the island from east to west to form a central backbone. Relatively short, steep slopes run down
from the Ramelau Mountains to the island’s north and south coasts. The mountainous nature of
the island decreases the availability of arable land, and the abundance of steep inclines
contributes to high levels of erosion. Nearly half of the country is estimated to have a slope of 40
percent or more. The steep slopes, with shallow soils, are very susceptible to erosion. Timor
Island is derived from limestone and metamorphosed marine clays. This geologic composition
contributes to rather thin, fragile soils with low levels of fertility. The fertility of the soils is
further reduced by the rapid decomposition of organic matter induced by the tropical climate
(GoTL 2006c).
Climatic conditions contribute to erosion. The country has distinct wet and dry seasons, with a
climate that can be broadly characterized as ―hot and humid.‖ Timor-Leste’s climate is tropical,
but drier than that of many of the surrounding islands. A significant characteristic of the
precipitation is that it comes in torrential downpours. The hard driven rains cause a high degree
of surface runoff, increasing the risk of soil erosion. The northern regions are likely the most
17
Land degradation is defined here as a process that lowers the productivity of the land, assuming other
factors such as technology, management, and weather are held constant. A subset of this is soil
degradation, which can manifest itself as water erosion (sheet, rill, gully erosion, mass movements), wind
erosion, biological degradation (decrease in humus), physical degradation (increase in bulk density,
decrease in permeability), chemical degradation (acidification, toxicity), and excess of salts (salinization,
alkalinization).
24
susceptible to erosion because of their longer dry periods and more concentrated rainfalls (Green
2006).
Agricultural practices induce land degradation. High rates of population growth and the high
dependence on agriculture have speeded up the conversion of forested land to agricultural use. In
Timor-Leste, land degradation stems largely from swidden agricultural practices and the
overharvesting of forest products. Swidden (or ―slash-and-burn‖) agriculture is a widespread
agriculture practice (Sandlund et al. 2001). It involves rotating fields in a cycle of cropping and
fallowing. It can be a viable system when population is low and fallow periods are sufficient for
rejuvenation of vegetation. But the system becomes environmentally problematic in higher
density communities, either because agricultural land is not given the time to replenish its
nutrients or because forest land is cleared—often through burning.
Even though the level of land degradation cannot be measured accurately in Timor-Leste due to
lack of data, it is considered an environmental priority. The high dependence on agriculture
makes land degradation an important environmental concern.
Land rights in Timor-Leste are being redefined, but even basic data about land
management are hard to come by. Hence, the World Bank organized a new survey in
collaboration with the Government’s Statistical Services. The study covered more than 1,800
households and looked at the linkages between their land management decisions and welfare
indicators. It focused on both investments in sustainable land management and practices leading
to land degradation, such as slash-and-burn deforestation. Annex 4 contains the details of the
study.
The main conclusions of this study are:
Rural households practice sustainable land management practices such as residue
management and tree planting to a very high degree. However, slash-and-burn is widely
used to clear land, which is inexpensive and provides short-term fertilization but can be
very destructive, in particular if fires run amok.
There are only marginal differences between the poor and non-poor households in terms
of land management and investment patterns.
The predominance of slash-and-burn plot clearing methods is reinforced by the large
prevalence of the Siam weed in the plots held by most households. However, this is not
an effective means of eradication, and biological methods would need to be implemented
to combat this infestation.
Clearing forests for agricultural use is small in relative terms. There appears to be no
significant difference between poor and non-poor households in this regard.
Firewood is universally used as cooking fuel, though a surprisingly low share of
households collect their own wood. Relatively more poor households collect firewood.
Forestry
There is no up-to-date and comprehensive information on the forests of Timor-Leste. Maps
for forest cover produced by the Australian Government–funded ALGIS project continue to rely
on information collected during the Indonesian period for the 1993 inventory. It is generally
believed that the forests have been severely overharvested and degraded in recent times.
25
However, it is not likely that all the open and poor quality forests are the result of degradation,
especially on steep land. Skeletal soils and poor moisture have produced extensive areas of
natural savannah formations.
Using remote sensing data, FAO estimated that the country’s total forest area fell from
966,000 hectares in 1990 to 798,000 hectares in 2005 (FAO 2005). These estimates suggest
that Timor-Leste lost about 17 percent of its total forest area in 15 years. FAO calculated an
annual deforestation rate of 1.16 percent during 1990–2000 and 1.31 percent during 2000–2005
(Green 2006).
Forestry has always been important in the economy of Timor-Leste. Very valuable
sandalwood has been harvested for centuries and—at other times—honey, beeswax, and timbers
such as teak and kayu merah have been significant. According to GoTL (2006c), a very
simplified grouping of the main natural forest types of Timor-Leste is as follows:
Savannah formations dominated by Eucalyptus alba, where the tree component has
value only for fuelwood
Open or moderately dense forest dominated by Eucalyptus urophylla, but with several
associated species; used for fuelwood and for poles
Tropical dry monsoon forest carrying a mixture of species, some with timber
production potential, the most important of which is kayu merah (Pterocarpus indicus)
Timber is produced from species of the native trees suren (Toona sureni), sandalwood (Santalum
album), and aina (Pterocarpus indicus). Teak is not a native timber tree of Timor-Leste but has
been planted for more than a century. During the Indonesian period, some extensive plantations
of teak and fast-growing species such as gmelina were established. Suren was only ever available
in small quantities but is a keenly sought after furniture timber, with export potential.
Sandalwood is one of the most valuable of timbers, with a strong overseas market. It is so
valuable that control of its harvest is a major problem wherever it occurs. Sandalwood has been
harvested from Timor for a millennium. Of all the forest products of Timor-Leste, sandalwood
offers the best prospect for profitable commercial activity. Currently, this resource is said to be
in a very poor state, but its reestablishment would provide rural employment in the short term
and good financial returns in 20–40 years. Sandalwood was found widely distributed in the more
favored savannah sites and especially in old gardens and ladang in the other types. Key resources
like sandalwood are much reduced, and illegal harvesting remains a problem (GoTL 2006c).
Harvesting of wood for local construction and furniture manufacturing contributes to
deforestation, but it also provides important livelihoods. There is high demand for sawn
timber for construction purposes and for value-added products such as local furniture
manufacture. Excessive logging by Indonesian companies has been blamed for the apparent
acceleration of forest loss in the last decades (Bouma and Kobryn 2004). Imports of sawn timber
are said to be meeting most of the local demand at the present time. Local resources of suitable
timber trees, especially teak and kayu merah, are reported to have been severely overharvested in
the past, so that relatively little is currently available. There appears to be little prospect for local
timber supplies meeting local demand in the near future. However, the proposed national forest
resource assessment will clarify this situation. One potential source of sawlogs in the short term
(although of poor quality) is salvage of Albizzia (Paraserianthes falcataria) trees in coffee
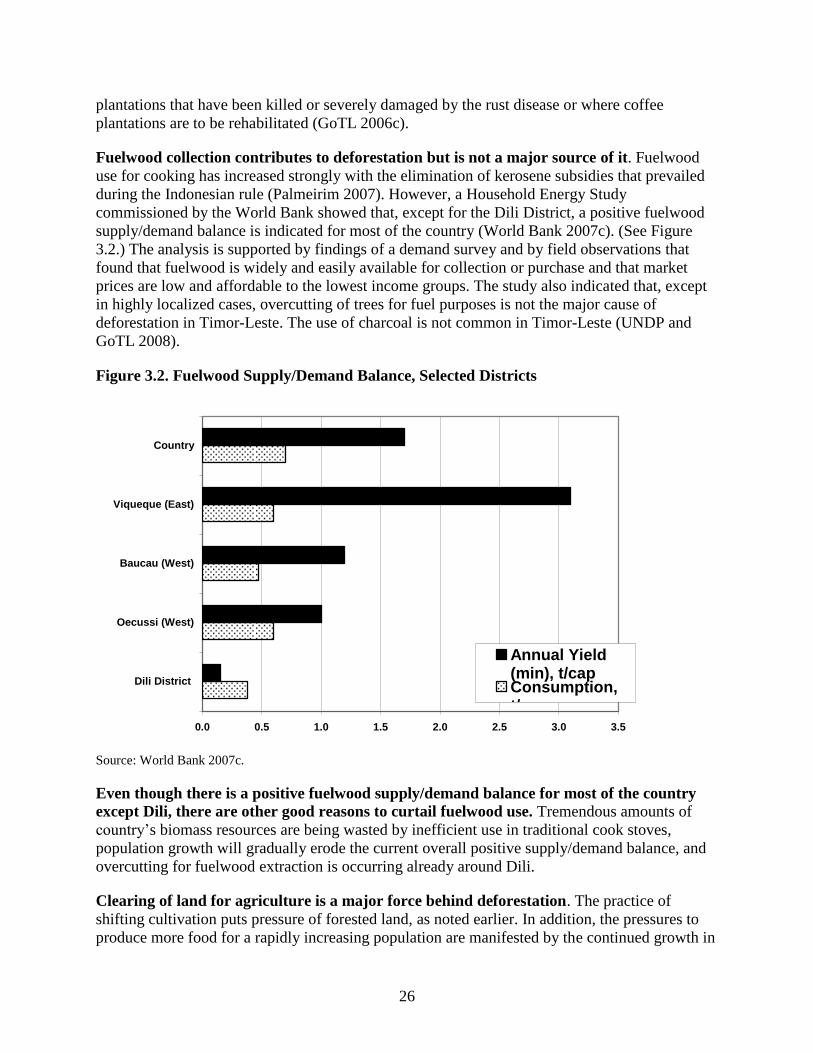
26
plantations that have been killed or severely damaged by the rust disease or where coffee
plantations are to be rehabilitated (GoTL 2006c).
Fuelwood collection contributes to deforestation but is not a major source of it. Fuelwood
use for cooking has increased strongly with the elimination of kerosene subsidies that prevailed
during the Indonesian rule (Palmeirim 2007). However, a Household Energy Study
commissioned by the World Bank showed that, except for the Dili District, a positive fuelwood
supply/demand balance is indicated for most of the country (World Bank 2007c). (See Figure
3.2.) The analysis is supported by findings of a demand survey and by field observations that
found that fuelwood is widely and easily available for collection or purchase and that market
prices are low and affordable to the lowest income groups. The study also indicated that, except
in highly localized cases, overcutting of trees for fuel purposes is not the major cause of
deforestation in Timor-Leste. The use of charcoal is not common in Timor-Leste (UNDP and
GoTL 2008).
Figure 3.2. Fuelwood Supply/Demand Balance, Selected Districts
0.0 0.5 1.0 1.5 2.0 2.5 3.0 3.5
Dili District
Oecussi (West)
Baucau (West)
Viqueque (East)
Country
Annual Yield(min), t/capConsumption,t/cap
Source: World Bank 2007c.
Even though there is a positive fuelwood supply/demand balance for most of the country
except Dili, there are other good reasons to curtail fuelwood use. Tremendous amounts of
country’s biomass resources are being wasted by inefficient use in traditional cook stoves,
population growth will gradually erode the current overall positive supply/demand balance, and
overcutting for fuelwood extraction is occurring already around Dili.
Clearing of land for agriculture is a major force behind deforestation. The practice of
shifting cultivation puts pressure of forested land, as noted earlier. In addition, the pressures to
produce more food for a rapidly increasing population are manifested by the continued growth in
27
land areas for both arable agriculture and shifting cultivation practices. It has been estimated that
each new person would need about 0.24 hectares planted of rice or maize to meet a 2,000
calories a day food requirement (World Bank 2007c). Hence if the population of about 1 million
increases with about 3 percent per year, this implies an increased demand for more than 7,000
hectares of land just for rice cultivation each year.
Deforestation has significant consequences for the environment since the forest is important
for protecting watersheds, reducing flood peaks, stabilizing soil cover, and preserving
biodiversity. Deforestation threatens the flora and fauna of cleared land (through species
destruction or habitat destruction and fragmentation). All the threatened bird species of the
territory are forest-dependent (Trainor et al. 2007), and this is likely to be the case for most other
plants and animals. Deforestation also leads to increased erosion by decreasing the amount of
vegetation that anchors the soil. The country’s steep terrain and monsoonal rains makes the need
for protective vegetation even more crucial. Without sufficient vegetative cover, soil nutrients
are washed away, soil fertility is reduced, and landslides and flashfloods become more frequent
and devastating. Upstream forests and land naturally regulate the hydrological cycle, releasing
water to aquifers and rivers over a period of time, thereby reducing floods and providing water in
dry season. Destruction of forests and the related land degradation damages the hydrological
cycle, leading to an increased frequency and severity of floods and droughts.
Deforestation provides short-run income but is not sustainable in the long run. The forest is
also an important source on non-timber products such as fuelwood, medicinal plants, honey,
rattan, bamboo, animals for meat, and spiritual values (GoTL 2006d). The preparation,
distribution, and marketing of fuelwood is a highly important source of employment, especially
in rural areas (World Bank 2007c). Without clear and enforced property rights, these assets are
open access property sources of income that will be harvested without regard to sustainability.
A rust epidemic of the albizia coffee shade trees is expected to result in a significant
reduction in coffee yield. Albizia currently shades 53,000 of the total 55,000 hectares of coffee
grown in Timor-Leste, but unfortunately the infestation incidence is estimated at 95 percent
(USDA 2006). The three districts most affected are Ermera, Liquica, and Manufahi. Coffee is the
primary non-petroleum export, and approximately 28 percent of households earn some income
from coffee. Part of the harvest is certified organic and marketed through fair-trade channels,
capturing prices on the high end of the coffee market (World Bank 2008). Since the use of
fungicides will make Timor-Leste lose its market niche as an organic product, Old (2002) and
the U.S. Department of Agriculture (USDA 2006) recommend the establishment of a formal
national coffee rejuvenation program that replace dead and diseased albizia coffee shade trees.
Currently, the Cooperativa Cafe Timor’s USAID funding supports a tree nursery program to
provide replacement shade tree seedlings to coffee farmers.
Coastal and Marine Management
The majority of the people live on or near the coast, and all significant urban areas are
located in the coastal zone. Timor-Leste has a coastline approximately 700 kilometers in length,
28
and a potential exclusive economic zone18
of approximately 75,000 square kilometers, although
the precise boundaries of this zone have not yet been determined (GoTL 2006d).
There is high diversity along the coastal zone of Timor-Leste. It includes marine, inter-tidal,
and shorelines areas that contain a vast diversity of interconnected ecosystems, including coral
reefs, deep-sea bottoms, mangrove forests, beaches, and river estuaries. The interconnectedness
of these systems is demonstrated by the essential roles played by mangroves and reefs in the life
and feeding cycles of most marine fish species (GoTL 2006c). The habitats vary along the
coastline because of the local influences of seasonal rainfall, local geology and topography, river
discharges, and regional offshore oceanographic features, as well as the impact of human
occupation. This results in spatial difference in marine habitats, with the north coast being
different from the south coast and with the eastern edge of the island having attributes that differ
from those to the west (GoTL 2006d).
Timor-Leste is one of the Coral Reef Triangle countries, along with Indonesia, Malaysia,
Papua New Guinea, the Philippines, and Solomon Islands. The Coral Triangle is a marine
biodiversity hotspot of global significance. It contains 75 percent of all coral species known to
science, over 3,000 species of reef fish, and the largest tuna fisheries in the world (WWF 2008).
Coastal marine resources are poorly documented in Timor-Leste.19
Data from the Indonesian
period are highly aggregated, and there are legitimate concerns as to their accuracy (Stockwell
2003). The National Department of Fisheries and Aquaculture, in charge of the management,
monitoring, and control of marine resources, lacks reliable and up-to-date information on the
distribution and abundance of the major species and on the various marine habitats throughout
the country. Some estimates of the nature and size of the offshore resource will be made with
ongoing AusAID assistance.
The coastal and marine resources represent a significant source of economic value. The
marine resources are valuable for their contribution to national food sources (mostly subsistence
use), as a potential income generation activity, and as a potential basis for tourism. Commercial
species such as snappers and groupers are in the near shore of Timor-Leste, and mackerel and
tuna are in the offshore, along with other pelagic and midwater species. During the Indonesian
rule, there was an influx of better-equipped fisherfolk from other parts of the archipelago, and
fishing pressure extended further offshore than previously. The limited data available on fishing
activities prior to 1999 indicate that some 630 vessels with outboard motors and 11,387 canoes
were active in fishing. Control over operations was rather loose, and on occasion destructive
methods such as explosives and poisons were used, resulting in damage to the marine habitat in
some regions (GoTL 2006d).
18
Under the United Nations Convention on Law of the Sea, the exclusive economic zone (EEZ) is
covered by Articles 56, 58, and 59. The EEZ is defined as that portion of the seas and oceans extending
up to 200 nautical miles in which coastal states have the right to explore and exploit natural resources as
well as to exercise jurisdiction over marine science research and environmental protection. Freedom of
navigation and overflight, laying of submarine cables and pipelines, and other uses consented to on the
high seas are still allowed. 19
However, several surveys are under way through MAF, with support from JICA. These will cover both
artisanal and commercial fisheries (interviews with MAF spokespersons, World Bank mission, February
2008).
29
Following the withdrawal of Indonesia, fishing activity fell dramatically, both as a result of a
number of Indonesian fishers leaving the country and from the serious damage inflicted on
fishing boats, gear, and infrastructure. Fisheries contribute approximately 1 percent of Timor-
Leste’s GDP. Replacement of vessels and gear and rehabilitation of infrastructure have been a
major focus in recent years, and catch levels have increased, especially in areas close to urban
centers. Subsistence fishing has largely recovered since the Indonesian withdrawal and continues
to be focused on local requirements as an important element of food security. Commercial
fisheries appear not to have recovered, and legally registered activity is quite limited.20
The
Fisheries Management Capacity Building Project financed by AusAID is undertaking a
preliminary survey of the country’s fish resources, which was expected to be released by mid-
2008.
The available information suggests that coastal and marine resources are in good condition
and internationally competitive. The scarce data suggest that the coastal zone resources are
largely unspoiled compared with other countries in the region (GoTL 2006c).21
Nature-based
tourism is seen as having great potential for growth and employment generation. A national
tourism policy is under development, but tourism statistics are not available. Informal estimates
by staff dealing with tourism in the ministry put the number of annual tourism arrivals in the area
of 1,500. International marketing is being improved, but no major infrastructure is expected to be
constructed in the coming years to respond for the growing demand. If the security situation
improves, tourism could be a major potential market, particularly given the proximity to
Australia (only 500 kilometers away). The GoTL has been supporting the development of the
sector, and the country is a member of the World Tourism Organization. Since the tourism
industry is in its very early stage, the environmental impact of the sector is minimal.
The country’s coral reefs are in good condition. Shallow inshore reef flats are used
extensively by women and children in the coastal communities of Timor-Leste for harvesting
small fish and invertebrates. These activities involve walking out during low tides and also using
intertidal traps. According to GoTL (2006c), resources are being harvested within their capacity.
There is not enough data to quantify overfishing in reefs, particularly in the Dili area. There is
physical evidence of explosive fishing having occurred in a number of reefs, and this evidence is
also supported by local fishers and people in the coastal communities. However, it appears that
these destructive activities have been reduced since the Indonesian period (Stockwell 2002).
With respect to sedimentation, it is not very clear what effects the sediments entering the marine
environment are having on coral reefs. Large volumes of sediments are transported to coastal
areas by rivers during the rainy season, and it is clear that this periodically prevents the marine
tourism industry from operating.
Several mangroves areas were damaged in the past. In particular, the stand at Tibar, just West
of Dili, was severely damaged during Indonesian times when aquaculture ponds were
constructed in the intertidal zone. These ponds are currently lying dormant and would require
20
Timor-Leste lacks resources to monitor any illegal commercial fisheries. However, the four
commercially licensed trawlers that operate in its waters have on-board dedicated staff to monitor catches
(personal information from MAF spokesperson, interview with World Bank mission, February 2008).
Anecdotic evidence indicates that there are illegal fishing activities. 21
Data are lacking on any pollution from oil and gas fields and from international shipping.
30
substantial renovation. A minor amount of mangrove cutting took place on the inner margin of
most of the mangrove stands during the Indonesian period.
The impact of small-scale cutting of mangroves by family groups in the north coast of
Timor-Leste was found to be substantial. Alongi and Carvalho (2008) found that
approximately one year after the start of the harvesting, the forest experienced a 30–50 percent
decline in live stems and a 46–86 percent loss of above-ground biomass, with more canopy gaps
between dense, smaller trees. Soil chemistry has also deteriorated to a condition where mangrove
regrowth is slow and establishment difficult.
Illegally harvested wood from the mangrove forests around Metinaro is sold for firewood
and building material. There are informal reports of substantial illegal cutting, for example near
Metinaro (Haburas Foundation 2008). This is one of the few economic activities available to the
marginalized communities in the area, but it represents a serious threat to fish stocks and
livelihoods in the long run.
The coastal community survey reported that there is a relatively high level of awareness in
coastal communities regarding the ecological importance of mangrove habitat.
Unfortunately, many of the mangroves are used as dump grounds for solid waste, particularly in
the areas adjacent to the coastal highways. Although they are not a threat to the health of the
mangrove, there are potential pollution issues in the long run (Stockwell 2002).
3.3 Climate Change
Currently, there is little information and analysis on the likely impacts of climate change in
Timor-Leste. Flooding is already a significant problem and may be aggravated by climate
change. In the longer term, the greatest threat to the coastal zone may come from climate change
(GoTL 2006c). Coral reefs are very sensitive to changes in water temperature and chemical
composition.
Barnett et al. (2007) found that Timor-Leste is vulnerable to climate change and that its
climate may become hotter and drier in the dry season and increasingly variable. They
considered three natural resources—water, soil, and the coastal zone—and found all to be
susceptible to changes in climate and sea level. These changes could have consequences in
agriculture production and food security; if sea level rises, it is likely to damage coastal areas,
including Dili.
Timor-Leste is a minor emitter of greenhouse gases, and therefore mitigation is not
currently an important issue in the country but adaptation will be. Timor-Leste emits 0.2
tons of carbon dioxide per capita (World Bank 2007b). This value for 2005 has not changed
since 2000, which is the earliest information available. Carbon dioxide emissions are low
compared with Indonesia (1.4 tons) but at the same level as Lao PDR.
Timor-Leste is in the process of building capacity and increasing its technical and financial
support for adaptation and transfer of technology. The National Adaptation Plan of Action
and an Initial National Communication plan are the starting points for shaping this process.
31
The GoTL has recently joined the Rio Conventions. In January 2007, Timor-Leste has
acceded to all three Rio Conventions: the United Nations Convention to Combat Desertification
(UNCCD), United Nations Framework Convention on Climate Change (UNFCCC), and the
United Nations Convention on Biodiversity (UNCBD) (GoTL 2008b). Timor-Leste obtained
access to the Clean Development Mechanism fund for adaptation, mitigation, and technology
transfer projects after the National Parliament ratified the Kyoto Protocol.
Timor-Leste has already completed the National Capacity Self Assessment (NCSA). As a
result of its accession to the UNCCD, Timor-Leste completed the NCSA project in November
2005 (GEF et al. 2007). The NCSA is a development action plan for global environmental
management that examines the country’s capacity and identifies barriers in the implementation
of multilateral environmental agreements.22
The assessment included an inception report,
stocktaking, thematic capacity assessment, cross-cutting capacity assessment, and a capacity
action plan.
Insufficient legislation, ineffective implementation of existing legislations and policies, lack
of coordination among institutions, and lack of human capacity were the main constraints
identified. The assessment found that some aspects of the Rio conventions are covered in
sectoral policies and regulation, but they have not directly addressed the issues of biodiversity,
climate change, or land degradation. Implementation of existing legislation was also found to be
ineffective due to lack of public awareness and political will to finance awareness programs.
Another challenge identified was the lack of coordination among institutions. Responsibilities for
the implementation of the Rio conventions are currently shared among different government
agencies, and this could generate conflicts of interest. The assessment also found that lack of
enough skilled human resources is one of the most significant capacity gaps in the country.
The NCSA identified six cross-cutting capacity areas as priorities: capacity to prepare
national reports for the respective convention secretariats; capacity to develop policy and legal
frameworks to enable effective implementation of the UNCBD, UNFCCC, and UNCCD;
capacity to access national and international financial resources to implement programs and
projects under each convention; capacity to plan and implement public awareness programs;
capacity to conduct research and monitoring; and capacity to obtain and share information and
adopt new and clean technology.
The NCSA action plan consists of six project concepts with the identified implementing
agency. The projects are to develop and review national environment education curriculum to
22
The capacity needs identified were as follows: to develop the National Action Programs (NAPs) for
Climate Change and Land Degradation; to develop the National Biodiversity Strategy and Action Plan, an
obligation under the UNCBD; to establish an effective administrative mechanism to oversee and
coordinate implementation of the obligations under the conventions, including the NAPs (reporting,
accountability, coordination, performance targets); to establish a harmonious legal and policy framework
to achieve the objectives of conservation, adaptation, mitigation, and sustainable utilization of natural
resources; to incorporate the NAPs into corporate plans and work programs of government agencies; to
establish a comprehensive yet integrated public awareness program to create awareness at all levels of the
community and within schools; and to establish an effective and coordinated structure for the collection
and distribution of financial resources available under the conventions.
32
incorporate environmental issues and the Rio conventions;23
to strengthen the National Public
Awareness Programme;24
to organize an annual international conference on environmental
issues, management, and policies in Timor-Leste;25
to gain access to financing and financial and
project management training; to build capacity for research, monitoring, and evaluation in order
to establish an institutional structure and plan to deliver training and skills upgrading for officers
in various related agencies, so that they can draft project proposals, oversee the implementation
of projects, and effectively manage the budget and financing of the proposal; and to develop and
strengthen capacity for conducting research, monitoring, and evaluation across the three
conventions.
23
The Ministry of Education, Directorate for National Curriculum will be the lead agency. The
Directorate will seek the assistance and collaboration of the National Directorate for Environmental
Services (NDES), Ministry of the Interior/National Disaster Management Office, nongovernmental
organizations (NGOs), Ministry of Development/Industry Unit, Convention National Focal Points, United
Nations Development Programme (UNDP), and the Capacity Development Coordination Unit. 24
The NDES Public Awareness Unit will lead the Working Group, which will include officers from
MAFF, MI/NDMO, CDCU, MPW, UNDP, and NGOs. 25
The lead agency is the National University of Timor-Leste, with secretariat support from NDES
Multilateral Environmental Agreement Secretariat. The key agencies will be NDES, MFAC, Tourism,
UNDP, and NGOs, with support and contribution from line Ministries such as MAFF and MI/NDMO.
33
Chapter 4: Operational Responses
The previous chapters have described the environmental situation in Timor-Leste. This chapter
briefly reviews the responses to those problems thus far. It also identifies several areas that have
been neglected.
In terms of environmental management, the country lacks a comprehensive approach. The
current approach does not include several important elements: an environmental policy and
associated institutional framework law; environmental management plans and standards; a
comprehensive protected areas system and endangered species laws; systems for environmental
information and reporting, and a plan for environmental education. The environmental impact
assessment and environmental licenses regulation are draft laws not yet approved. The forest
management policy was approved, but the legislation and regulations to support it are still
pending.
The government of Timor-Leste and its constitution recognize the importance of
environmental protection. However, many of the regulations promulgated and the proposals in
process to date (with the exception of land tenure regulation) have been inspired by other
jurisdictions and require a critical analysis of their applicability to Timor-Leste. Hence, the
country needs to quickly develop basic environmental legislation that has full legitimacy and is
adapted to its specific needs and constraints. In a country that already imposes severe restrictions
on private investments, it is also important that new regulations do not present an unnecessary
obstacle to economic development. Importantly, the 2008–2012 Development Program of the IV
Constitutional Government of Democratic Republic of Timor-Leste includes specifically the
development of an environmental policy and the elaboration and consolidation of the
environmental legislation.
The lack of human resources and data in the country are important impediments. There is a
severe lack of databases and public records that can promote environmental awareness. The
2008–2012 plan includes a program for the provision of adequate information on environment
and campaigns and programs of environmental education, inside and outside the educational
system (GoTL 2008b). The approach to address the lack of human capital capacity has been to
invest in one-on-one mentoring and skills transfer programs. This was an important start, but it
proved to have limitations both in terms of coverage of the adequate numbers of civil service
staff and cost-effectiveness of program delivery. In terms of environmental information and
databases, there are development plans but no significant concrete progress has been made on
this front.
The United Nations Development Programme (UNDP) provides laudable support for
capacity building for environmental management. From 2006/2007 national budget point
offices in 13 districts have been rehabilitated and they have had the opportunity to take courses
overseas on environmental management and technical capabilities. DNMA is seeking
34
international funding to train staff in specific areas such as water and air quality testing,
environment and biodiversity monitoring, etc. Even though those have been important steps,
much more needs to be done in collaboration with the donor community.
With respect to human and financial resources, the government of Timor-Leste has made
important progress in this area. It has increased significantly the budget for the State
Secretariat for the Environment in 2008, allocating $2.2 million26
to implement its 2008
programs, and it aims to recruit 82 national staff for SEMA in order to implement its plan. The
major components of the program are: improved management; regulation and environmental
law; environmental education awareness; evaluation, monitoring, investigation, and permitting of
environmental pollution license; reduced environmental impact; protection and conservation of
biodiversity and natural resources; enhanced participation in multilateral environmental
agreements program; knowledge and quantification of environmental data; data analysis and
sampling of environmental pollution in Timor-Leste; and regional and districts focal point for
environmental conservation and monitoring (GoTL 2008b).
This report draws attention to indoor air pollution as an environmental priority. Its
economic cost is estimated to be approximately 1.4 percent of the Timor-Leste GNI, or 3.5
percent of GDP in 2006. Even though this is a significant burden, very little has been done to
address it. Several local NGOs have been developing and promoting various types of improved
stoves since 2001. NGOs such as the Haburas Foundation, the ETADEP Foundation, and the
Permatil Foundation, with funding from external donors, have implemented improved stoves
projects. They mainly produce portable clay stoves for fuelwood and agricultural residues. Some
small commercial stove producers are operating in Dili and sell portable ceramic stoves with a
metal cladding for $5–12, depending on size. They have had little formal training and few tools,
and the efficiency of the stoves is unknown. The impression is that these efforts lack critical
mass; only a few hundred improved stoves at the most have been disseminated so far, and there
is little documentation on the effectiveness of the stoves or the programs. It is by no means an
easy task. The two biggest barriers in Timor-Leste are the still relative abundance of fuelwood
supplies at low prices (compared with relatively expensive alternative sources such as kerosene),
and the absence of a culture of purchasing household stoves (World Bank 2007c).
The substitution away from fuelwood toward alternative fuels is still in a very early stage.
Access to electricity is very low in Timor-Leste. Electricity supply in rural areas consists of 58
isolated grids, powered by diesel generators, of which only some are still operational (UNDP and
GoTL 2008). The World Bank has concentrated funds in two projects to improve the supply of
electricity, mainly in Dili. The Energy Service Delivery Project (International Development
Association grant of $2.5 million) will finance the repair of the Comoro power station and the
rehabilitation of the power distribution system in Dili. It includes a technical assistance
component for the policy strengthening of the power sector. The second one, the Power Sector
Priority Investments Project, seeks to improve the capacity and efficiency of the generation, and
distribution of Timor-Leste Electricity.
26
According to the Budget Execution Report up to Second Quarter 2008 produced by the Ministry of
Finance of Timor-Leste, the aggregate budget for the Office of the Secretary of State for Environment, the
National Directorate of Environment Services, and the National Directorate of International
Environmental Affairs was $585,000 at June 2008.
35
In order to contribute to the knowledge of the energy sector of Timor-Leste, the World
Bank has recently completed two analytical pieces: Options for Renewable Energy
Technologies (Clouston 2006) and Timor-Leste Issues and Options in the Household Energy
Sector (World Bank 2007c). The latter is a scoping study that analyzes the fuelwood supply-
demand patterns in the country and underlines the need to address indoor air pollution also from
a natural resources management perspective. However, there has not been any follow-up of this
study. The former study concludes that ―the potential exists to produce a significant energy
supply in forms useful to most of the Timorese population at an affordable cost‖ (Clouston
2006:1). It contains a detailed review of options, including biogas, biomass briquettes, coconut
oil as substitute for diesel, solar power, biodiesel, and the introduction of better stoves. The study
focuses on small to medium-scale energy production, with some discussion of more-intensive
systems, energy conservation, and efficiency. Clouston (2006) shows that these technologies are
often suitable to be built and managed by the local consumers at a very low cost, but he points
out that that the success of any program to introduce renewable energy will depend on the ability
to train qualified local technicians and to enable them and educational institutions to train more
people.
Renewable energy is a priority in the 2008–2012 Development Plan. A renewable energy
assessment for preparation and formulation of energy policy was undertaken by SSEP in January
2008, and a proposal for renewable energy development in rural areas is being formulated. SSEP
has been undertaking an integrated rural energy development program in various places since
2005, covering projects of solar power, biogas, mini hydropower, and cooking stoves (GoTL
2008b). The 2008 SSEP Development Program covers research, maps, and databases on reserves
and on potential and renewable energy sources; the establishment of pilot biogas project plants;
reform of EDTL and reduction of imported fuel dependency; construction and monitoring of the
hydro-power plants in Iralalaro and Ainaro; and promotion of renewable and alternative energy.
A special plan for energy development in rural areas has recently been developed by UNDP and
the Government of Timor-Leste (UNDP and GoTL 2008). It features an ambitious program for
energy efficiency and renewable energy development.
Hydropower seems to be a sector that may in some cases come into direct competition with
other water-users. The Iralalaro Hydropower project in the eastern tip of the island is predicted
to supply electricity by means of water use from the Iralalaro Lake. The international bidding
process for this project has already begun. To add to this particular project, other projects, like
hydroelectric schemes with mini-hydros in bigger catchments areas that also supply irrigation
schemes, are under study (Leitao 2007).
This report also points out the lack of appropriate sanitation as an environmental priority.
The GoTL attaches a very high priority to achieve sustained progress towards the NDP
targets (and MDGs) through a significant but still insufficient program. That includes urban
and rural water supply and sanitation (WSS) projects, policy, planning, and administration
projects and community awareness programs. The expenditure for the period 1999–2005 totaled
$79.1 million, with 85 percent of the funding coming from donors, mainly Japan (38 percent),
Australia (18 percent), and TFET (14 percent). The allocation of the expenditure was mainly for
urban water services (58.3 percent), with only 1.3 percent for urban sanitation. Rural WSS
captured 32.4 percent of the expenditure, and 7.8 percent was assigned to policy, planning, and
administration. The GoTL increased the overall level of spending to a third higher from the
36
period FY05/06 to FY09/10. It also significantly shifted the allocation toward urban water,
sanitation, and drainage.
The percentage of people who have access to safe drinking water has not yet reached the
level targeted by the MDG, but many donors, the UNDP, and the ADB has been actively
participating in the sector, mainly in urban areas. Current projects include the Urban Water
Supply and Sanitation Project ($6.5 million) and the Dili Water Supply Performance
Improvement (technical assistance $1 million), which will support the improvement of
performance of DNSAS in managing and operating its Dili city water supply services. The ADB
also has completed the Integrated Water Resources Management Project ($600,000) and a
technical assistance to create the National Water Policy. Other key donors investing in the sector
are Japan, AusAID, CARE Canada, UNICEF, and Portugal.27
The World Bank does not have
any specific project in the WSS sector.
The CEA also looks at outdoor air pollution and at natural resource management
comprising land, forestry and coastal and marine resources. These areas are very important
for the sustainable development of Timor-Leste, and the lack of adequate legal and regulatory
framework places them under risk.
Land management is a very important factor for sustainable development in an
agricultural country such as Timor-Leste. The Timor-Leste Land Reform was done in phases,
and it includes a package of laws based on field research. However, the most important land laws
are not yet approved. UNDP has made some efforts in this area, with two projects on land
management: one ongoing on capacity building for sustainable land management that is
investing $400,000 in Timor-Leste (Mainstreaming and Capacity Building of Sustainable Land
Management in Timor-Leste) and the other a small one on land degradation in Timor-Leste
($24,000). USAID, building in its past Land Law Program, started in October 2007 a new project
to strengthening property rights in Timor-Leste ($10 million). The project is implemented by
ARD, and its includes an awareness component, an activity to support the Land Policy Laws and
the implementation of regulations, and a component to support a National Land Commission, a
Land Administration, and a Dispute Resolution system. After one year of being effective, they
have hired staff, commenced pilot activities in two areas (Liquica and Manatuto), and started
collecting data to demark all areas/parcels in the country. They have also facilitated the
promulgation of a Ministerial Regulation on the Cadastre and have been behind a policy
27
The projects funded by Japan are Improve Water Supply in Same and Ainaro ($5.3 million) and
Improve Water Supply in Ermira/Gleno & Maubess ($2 million). AusAID funded the Rural Water Supply
and Sanitation Project that helped re-establish the community-based water supply and sanitation systems
in rural districts and the provision of technical experts (www.ausaid.gov.au). UNICEF is supporting the
Rural Water for Households & School (in five districts) ($1.2 million), and it has supported the major
water supply projects for district town water supply system in Dili (2000–04) and in Liquica, Manatuto,
and Lospalos (2002–03), for irrigation such as the rehabilitation of Laclo Irrigation Scheme (2002–03),
and for rural WSS services in Aileu and Baucau (2001–03). Portugal is funding four small projects in the
sector (total $1.5 million): update urban drainage master plan, Oeccusi District Water and Sanitation
Improvement, Technical Training for DNSAS staff, and Atauro Family Sanitation (1,000 household
toilets). CARE Canada has also been involved in the sector; during 2001–04 is has implemented a project
focused on poor rural areas covering almost 24,000 people (www.care.ca).
37
statement for the development of a Transitional Land Law that has been distributed to the
Council of Ministers.28
Lack of data is still the main barrier to understanding the magnitude of the cost of land
degradation in Timor-Leste. A first attempt to analyze land management in the Comoro and
Laclo watershed was undertaken with funds from the Japan International Cooperation Agency
(JICA) (2008). However, a more comprehensive national study is needed.
The World Bank has been involved in the rural sector, and it has completed two projects on
agriculture rehabilitation, with the third currently on implementation. The Third Agriculture
Rehabilitation Project ($11.4 million) has a component to strengthen the capacity of MAF to
continue developing key national policies and to strengthen the Ministry's managerial and
technical capacity.
The CEA has launched a study of land management, soil and water conservation, and invasive
species. Gathering new information from more than 1,000 households, this study will throw new
light on how farmers perceive and act on tenure, conservation practices, and invasive threats.
Results from the survey were expected toward the end of 2008. They will underpin more specific
proposals for operational follow-up.
Forestry is an area that has received the attention of many donors. Between 1999 and 2005,
$5.6 million were spent in programs of forestry for Timor-Leste. Three quarters of the total were
contributions from donors mainly into small-scale reforestation programs, and related training
for local communities. The Trust Fund for East-Timor (TFET) has been the main donor (17
percent). The World Bank is the TFET trustee, and ADB and the World Bank administer the
projects. Canada and Japan were also important donors, with Australia as a minor contributor.
The Forestry program includes Forestry Policy regulation funded by FAO ($280,000),
Reforestation I and II funded by Australia ($13,000), plantation programs financed by Japan
($600,000), and Oecussi Community Activation Project by UNDP ($4 million). Finally, the
TFET has supported the Agricultural Rehabilitation Project ($2 million) to include a component
on community development and forestry training. USAID has a small grants program to assist in
sustainable agricultural practices, such as the use of organic fertilizer. They are also assisting in
the distribution of improved varieties of seeds and seedlings.
In terms of data, the Ministry of Agriculture with support from the European Community, FAO,
the German aid agency, and Portuguese Aid will carry out a nationwide Forest Resource
Assessment using satellite imagery. The study is expected to be completed in four years. Current
data are insufficient to propose any specific programs at this point, but this situation is about to
be remedied.
Another important natural resource for Timor-Leste is its very rich coastal and marine
area. The value of this asset is not yet determined due to scarce data. A research project,
including mapping of coral reefs in the north coast of Timor-Leste, is under way with the
collaboration of the National Directorate of Fisheries, the Northern Territory Government of
28
The information on the USAID strengthening property rights in Timor-Leste project was provided by
Nigel Thompson (ARD Inc.)
38
Australia, and the Charles Darwin University. JICA is sponsoring a Fisheries Advisor for MAF,
and several surveys are under way to map out both commercial and artisanal fisheries. The
overall impression is that both coral reefs and fisheries are in relatively good condition but in
need of ensured protection in the future. Well managed, they present an excellent basis for
employment and a thriving tourism industry.
During the U.N. climate change conference in Bali in December 2007, leaders from the six coral
countries agreed to develop a plan of action, which includes establishment of marine protected
areas, management of sustainable fisheries, protection of threatened species, and adaptation to
climate change. The U.S. government pledged $4.35 million to launch the process. The Global
Environment Facility (GEF) expects to focus at least $25 million on the program, and ADB
committed $2 million in designing funds for 2008. Specifically in Timor-Leste, GEF has
allocated $270,000 (GoTL 2008b). WWF, The Nature Conservancy, and Conservation
International also made financial commitments (WWF 2008). The CTI Arafura and Timor Seas
Ecosystem Action Programme, under the Coral Triangle Initiative ($8 million with $2.5 million
from GEF), is a regional project to be implemented in 2008–09.
Timor-Leste also joined 10 other countries in East Asia on 15 December 2006 in signing the
Haikou Partnership Agreement for the implementation of the Sustainable Development Strategy
for the Seas of East Asia (SDS-SEA), through the Global Environment
Facility/UNDP/Partnerships in Environmental Management for the Seas of East Asia Project on
the Implementation of the SDS-SEA (PEMSEA 2008).
39
Chapter 5: Tackling Environmental Priorities
As the previous chapter has shown, much good work has already been done to enhance the
quality of the environment in Timor-Leste. However, several areas of importance call for urgent
attention. This chapter selects just a few of them to focus on issues where problems are
significant but where clear actions can also be identified:
The gap in environmental legislation and regulations and the very limited human
resources available for effective implementation
The need to address indoor air pollution
The need to address deficient water-quality and sanitation
5.1 Enacting New Environmental Legislation and Regulations and Enhancing Human
Resources
The World Bank has provided environmental legal advice as part of the CEA process. This
report clearly identifies the legislative and regulatory framework as one of the priority areas for
improvement. At the request of the Secretary of Environment of Timor-Leste for support, the
World Bank provided environmental legal advice focused on the environment policy framework
law, the EIA, and environmental licenses.
The support had been mainly concentrated in capacity building through short workshops, advice
about the process of engaging relevant stakeholders in the development of laws, and advice to
the national legal counterpart through comments and recommendations on specific draft
regulations. Initially the following priorities were identified: the environmental policy
framework law (Lei de Bases do Meio Ambiente), the EIA and environmental licenses, the
environmental penalties act, and the law on protected areas.
Despite the previous identification of priorities, the environmental legal advice that the World
Bank provided during 2008 concentrated on the development a new draft decree-law to create an
environmental license system. This responds to a Timor-Leste need to create an incremental
system that deals with projects that have the potential to generate environmental impacts through
environmental evaluation and pollution controls using instruments like environmental
assessment, environmental licenses, and management plans and closure plans.
The advice also concentrated on capacity building activities, especially for the team that is
responsible for drafting the decree-law, and on building recommendations for the internal and
external processes of consultation.
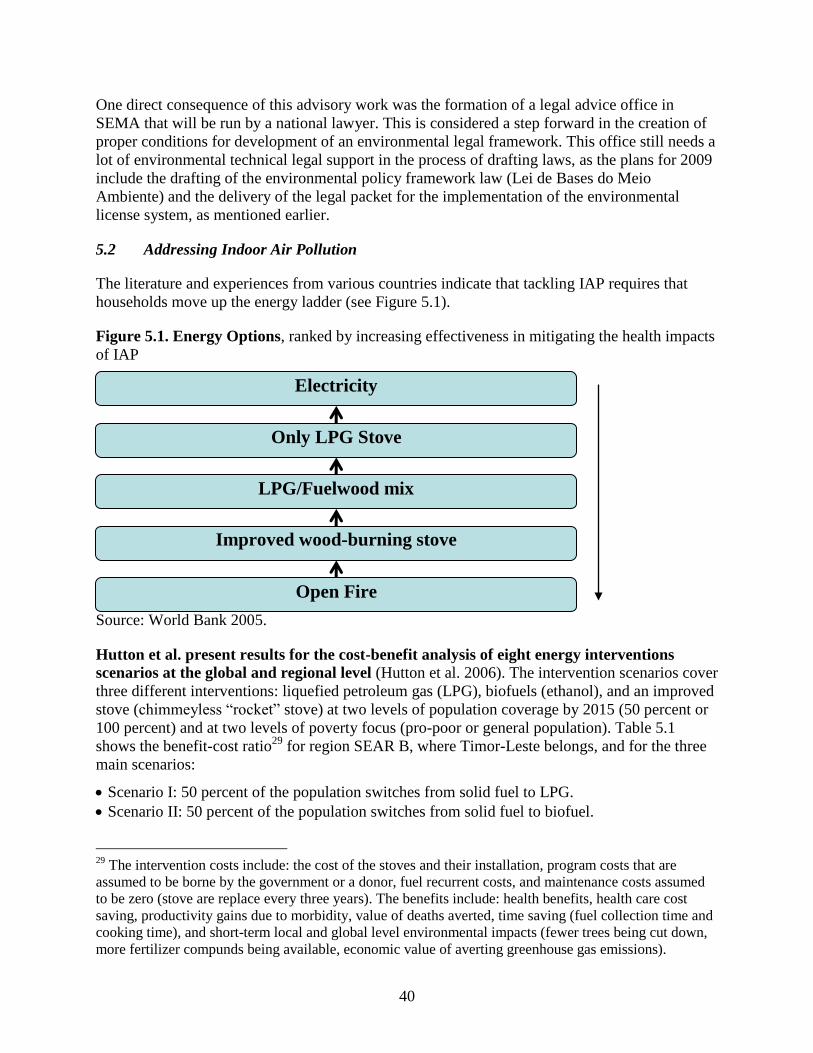
40
One direct consequence of this advisory work was the formation of a legal advice office in
SEMA that will be run by a national lawyer. This is considered a step forward in the creation of
proper conditions for development of an environmental legal framework. This office still needs a
lot of environmental technical legal support in the process of drafting laws, as the plans for 2009
include the drafting of the environmental policy framework law (Lei de Bases do Meio
Ambiente) and the delivery of the legal packet for the implementation of the environmental
license system, as mentioned earlier.
5.2 Addressing Indoor Air Pollution
The literature and experiences from various countries indicate that tackling IAP requires that
households move up the energy ladder (see Figure 5.1).
Figure 5.1. Energy Options, ranked by increasing effectiveness in mitigating the health impacts
of IAP
Source: World Bank 2005.
Hutton et al. present results for the cost-benefit analysis of eight energy interventions
scenarios at the global and regional level (Hutton et al. 2006). The intervention scenarios cover
three different interventions: liquefied petroleum gas (LPG), biofuels (ethanol), and an improved
stove (chimmeyless ―rocket‖ stove) at two levels of population coverage by 2015 (50 percent or
100 percent) and at two levels of poverty focus (pro-poor or general population). Table 5.1
shows the benefit-cost ratio29
for region SEAR B, where Timor-Leste belongs, and for the three
main scenarios:
Scenario I: 50 percent of the population switches from solid fuel to LPG.
Scenario II: 50 percent of the population switches from solid fuel to biofuel.
29
The intervention costs include: the cost of the stoves and their installation, program costs that are
assumed to be borne by the government or a donor, fuel recurrent costs, and maintenance costs assumed
to be zero (stove are replace every three years). The benefits include: health benefits, health care cost
saving, productivity gains due to morbidity, value of deaths averted, time saving (fuel collection time and
cooking time), and short-term local and global level environmental impacts (fewer trees being cut down,
more fertilizer compunds being available, economic value of averting greenhouse gas emissions).
Electricity
Only LPG Stove
LPG/Fuelwood mix
Improved wood-burning stove
Open Fire
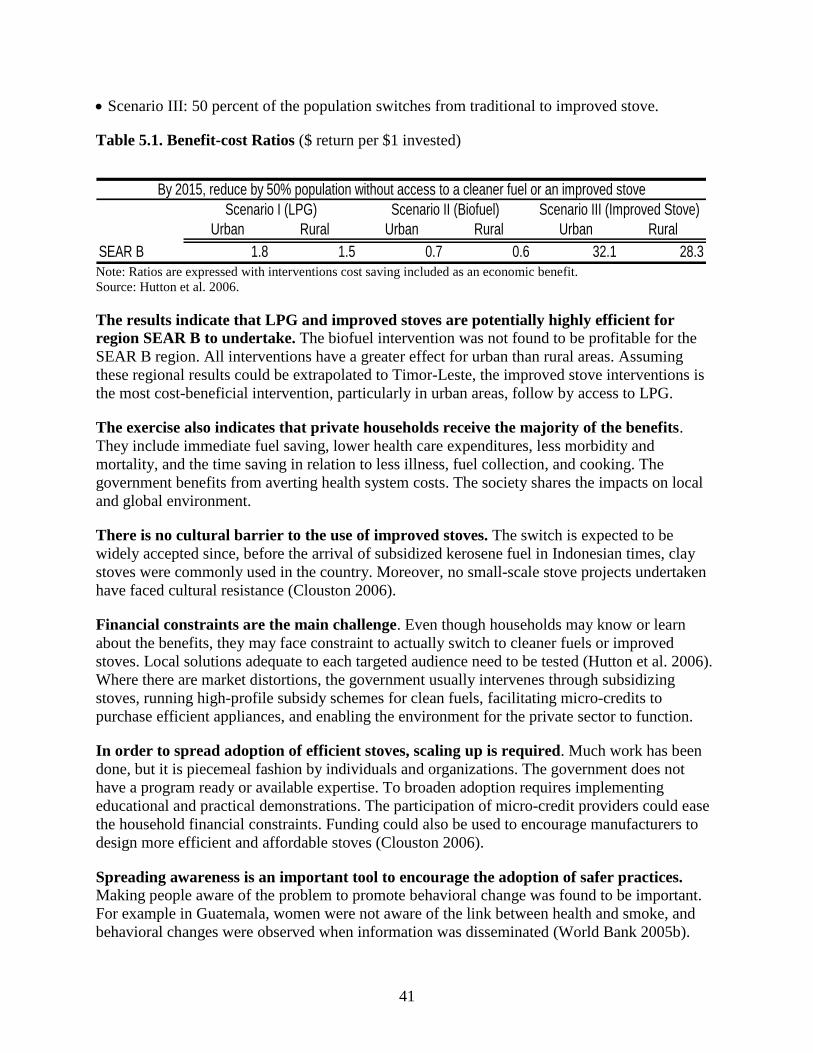
41
Scenario III: 50 percent of the population switches from traditional to improved stove.
Table 5.1. Benefit-cost Ratios ($ return per $1 invested)
Urban Rural Urban Rural Urban Rural
SEAR B 1.8 1.5 0.7 0.6 32.1 28.3
By 2015, reduce by 50% population without access to a cleaner fuel or an improved stove
Scenario I (LPG) Scenario II (Biofuel) Scenario III (Improved Stove)
Note: Ratios are expressed with interventions cost saving included as an economic benefit.
Source: Hutton et al. 2006.
The results indicate that LPG and improved stoves are potentially highly efficient for
region SEAR B to undertake. The biofuel intervention was not found to be profitable for the
SEAR B region. All interventions have a greater effect for urban than rural areas. Assuming
these regional results could be extrapolated to Timor-Leste, the improved stove interventions is
the most cost-beneficial intervention, particularly in urban areas, follow by access to LPG.
The exercise also indicates that private households receive the majority of the benefits.
They include immediate fuel saving, lower health care expenditures, less morbidity and
mortality, and the time saving in relation to less illness, fuel collection, and cooking. The
government benefits from averting health system costs. The society shares the impacts on local
and global environment.
There is no cultural barrier to the use of improved stoves. The switch is expected to be
widely accepted since, before the arrival of subsidized kerosene fuel in Indonesian times, clay
stoves were commonly used in the country. Moreover, no small-scale stove projects undertaken
have faced cultural resistance (Clouston 2006).
Financial constraints are the main challenge. Even though households may know or learn
about the benefits, they may face constraint to actually switch to cleaner fuels or improved
stoves. Local solutions adequate to each targeted audience need to be tested (Hutton et al. 2006).
Where there are market distortions, the government usually intervenes through subsidizing
stoves, running high-profile subsidy schemes for clean fuels, facilitating micro-credits to
purchase efficient appliances, and enabling the environment for the private sector to function.
In order to spread adoption of efficient stoves, scaling up is required. Much work has been
done, but it is piecemeal fashion by individuals and organizations. The government does not
have a program ready or available expertise. To broaden adoption requires implementing
educational and practical demonstrations. The participation of micro-credit providers could ease
the household financial constraints. Funding could also be used to encourage manufacturers to
design more efficient and affordable stoves (Clouston 2006).
Spreading awareness is an important tool to encourage the adoption of safer practices. Making people aware of the problem to promote behavioral change was found to be important.
For example in Guatemala, women were not aware of the link between health and smoke, and
behavioral changes were observed when information was disseminated (World Bank 2005b).
42
The source of information and the form it is presented in are crucial. The information should be
readily understandable and delivered by a reliable source. Medical practitioners and other health
workers are perceived to be the most credible, according to surveys done around the world.
Changes in cooking habits can reduce exposure to IAP. Women should be encouraged to
keep children away from smoke when cooking, to dry the wood before use, to push the wood
deeper in the stove so there will be less smoke, and to keep lids on pots to reduce cooking time
(WHO 2000). Timorese women can be guided by experts in thinking of better ways to improve
their cooking practices, taking into account the cultural norms and beliefs to avoid resistance.
5.3 Improving Water Supply and Sanitation
Effective interventions to improve human health are well documented. In a comprehensive
international survey, Fewtrell and Colford (2004) review five type of interventions: hygiene
(health education and encouragement of specific behaviors such as hand-washing); sanitation
(means of excreta disposal, often a latrine); water supply (provision of a new source or improved
distribution system, such as hand-pump or household installation); water quality (treatment to
remove pathogens, either at the source or in the household); and multiple interventions (hygiene,
sanitation, and water combined). The study confirmed that all these interventions were broadly
effective in improving health. Health education and hand-washing promotion were found to
reduce disease risk by 37 percent. Treating water in the household (boiling, chemical, or solar
disinfection) reduces diarrhea risk by 35 percent, while treating water at the source reduces risk
by only 11 percent. Surprisingly, multiple interventions were not found to be more effective than
single interventions.
Household-based chlorination is the most cost-effective intervention. Cost-efficient
interventions to mitigate health impacts of poor sanitation and polluted water are documented in
Clasen and Haller (2008). This study shows that household-based chlorination is the most cost-
effective intervention among the seven analyzed.30
This result holds in all WHO regions
examined. For the particular case of SEAR D region, the cost per DALY averted is $125 for
household chlorination. Solar disinfection is only slightly less cost-effective ($144). Traditional
source-based interventions have about the same mean cost per DALY averted ($143) as solar
disinfection. Household-based ceramic filtration follows in rank ($336) because of the additional
investment required. Combined flocculation-disinfection is at the bottom of the list, with a cost
per DALY averted of about $1,116. Even though these cost-effectiveness ratios cannot be
directly applied to Timor-Leste, the level is indicative, and the rank of intervention is expected to
hold. Hence, it is vital that efforts be made to implement a cost-efficient program for better
environmental health in Timor-Leste.
30
The cost-effectiveness was computed for conventional improvements of water quality at the source
(well, borehole, and communal stand post) and at the household level (chlorination, filtration, solar
disinfection, and combined flocculation/disinfection). Chlorination uses sodium hypochlorite following
the Safe Water System, with safe storage and behavior change techniques to promote adoption of
consistent use. Gravity filtration uses commercial ―candle‖ or pot-style filters. Solar disinfection uses the
―Sodis‖ method, in which clear two-liter PET bottles are filled with raw water and then exposed to the
sun’s ultraviolet and infrared radiation for 6–48 hours in order to kill microbes. Flocculation-disinfection
uses Procter & Gambles PUR® sachets, which combine an iron–based flocculent with a chlorine-based
disinfectant to treat water in 10-liter batches.
43
In Asia, the construction of a borehole is the less expensive way to supply water, while
simple pit latrine is the cheapest sanitation facilities to construct. Cairncross and Valdamanis
(2006) estimated the cost of constructing water supply in facilities in Africa, Asia, and Latin
America. They compared house connection, standpost, borehole, dug well, and rainwater
facilities. In Asia, they estimated that borehole has a median construction cost of $17 per capita
while the most expensive is the construction of a house connection, which amounts to $92 per
capita. The study also found that the mean construction cost of simple pit latrines is $26 per
capita while sewer connections are the most expensive, at approximately $154 per capita. While
the estimated cost may not be extrapolated directly to Timor-Leste, the categorization of
facilities according to their cost is expected to hold.
Emphasis should be placed on interventions likely to accelerate health gains for children
who bear the most of the burden. Disinfection at the point of use has a relative low cost and a
high health impact in a region with high child mortality, such as Timor-Leste. Using this type of
technology combined with better hygiene appears to be one of the most cost-effective water-
related health interventions in many developing countries. This would complement the continued
expansion of coverage and upgrading of piped water and sanitation services, which is a long-run
goal for the country (WHO 2002b).
44
BIBLIOGRAPHY
Alongi, D. M., and N. A. Carvalho. 2008. ―The Effect of Small-scale Logging on Stand
Characteristics and Soil Biogeochemistry in Mangrove Forests of Timor Leste.‖ Forest
Ecology and Management 255 (3–4).
Barnett, Jon, Suraje Dessai, and Roger N. Jones. 2007. ―Vulnerability to Climate Variability and
Change in East Timor.‖ Ambio 36 (5).
Barreto, Maria Laura. 2008. ―Draft Report on Timor-Leste Legal Environmental Framework.‖
Materials Efficiency Research Group. March.
Bouma, G. A., and H. T. Kobryn. 2004. ―Change in Vegetation Cover in East Timor, 1989–
1999.‖ Natural Resources Forum 28: 1–12.
BPA (Banking & Payments Authority). 2009. Petroleum Fund of Timor-Leste: Quarterly Report.
Dili.
Cairncross, S., D. O’Neill, A. McCoy, and D. Sethi. 2003. ―Health, Environment, and the Burden
of Disease: A Guidance Note.‖ Department for International Development. London.
Cairncross, S., and V. Valdmanis. 2006. ―Water Supply, Sanitation and Hygiene Promotion.‖ In
Disease Control Priorities in Developing Countries, ed. D. T. Jamison, J. G. Breman, A.
R. Measham et al., 771–92. Washington DC: World Bank.
Central Intelligence Agency. 2007. The World Factbook. Available at:
www.cia.gov/library/publications/the-world-factbook/geos/tt.html.
Clasen, Thomas F., and Laurence Haller. 2008. Water Quality Interventions to Prevent
Diarrhoea: Cost and Cost-Effectiveness. Geneva: World Health Organization.
Clouston, Jonathan. 2006. Options for Renewable Energy Technologies in Timor-Leste. World
Bank Energy Services Delivery Project, Timor-Leste. Washington, DC: World Bank..
Dasgupta, S., M. Huq, M. Khaliquzzaman, K. Pandey, and D. Wheeler. 2004. Indoor Air Quality
for Poor Families. New evidence form Bangladesh. Policy Research Working Paper
3393. Washington, DC: World Bank.
Desai, Manish, S. Mehta, and K. Smith. 2004. Indoor Smoke form Solid Fuels: Assessing the
Environmental Burden of Disease at National and Local Levels. Geneva: World Health
Organization.
DHS (Demographic and Health Survey). 2003. Extracted from ICF Macro, ―Demographic and
Health Surveys.‖ Available at www.measuredhs.com.
Dimaranan, Betina V., ed. 2006. Global Trade, Assistance, and Production: The GTAP 6 Data
Base. West Lafayette, IN: Center for Global Trade Analysis, Purdue University.
Elshof, A. J. 1990. Irrigated Sawah and Swamp—Development Potential and Use. Jakarta,
Indonesia: Ministry of Public Works.
Ezzati, M., and D. Kammen. 2001. ―Quantifying the Effects of Exposure to Indoor Air Pollution
from Biomass Combustion on Acute Respiratory Infections in Developing Countries.‖
Environmental Health Perspectives 109 (5).
FAO/WFP (Food and Agriculture Organization/World Food Programme). 2003. ―FAO/WFP
Crop and Food Supply Assessment Mission to Timor-Leste. Special Report.‖ Rome:
FAO/WFP.
FAO (Food and Agriculture Organization). 2005. Global Forest Resources Assessment 2005.
Available at: www.fao.org/forestry/site/fra/en.
———. 2007a. FAOSTAT Statistical Database. Avaialbel at: faostat.fao.org.
45
———. 2007b. ―Community Forestry Policy for Timor-Leste‖ (draft). April.
Fewtrell, L., and J. M. Colford. 2004. Water, Sanitation and Hygiene: Interventions and
Diarrhoea—A Systematic Review and Meta-analysis. Washington, DC: World Bank.
Fisher, I. 1906. The Nature of Capital and Income. New York: Macmillan.
Gleick, Peter H. 2002. Dirty Water: Estimated Deaths from Water Related Diseases 2000–2020.
Oakland, CA: Pacific Institute for Studies in Development, Environment, and Security.
GEF (Global Environment Facility), Government of Timor-Leste, and United Nations
Development Programme. 2007. National Capacity Self Assessment Prepared by GEF.
Final Report. Dili.
GoTL (Government of Timor-Leste). 2006a. Combating Poverty as a National Cause:
Promoting Balanced Development and Poverty Reduction.
———. 2006b. ―Overview of the Sector Investment Programs, Sector Priorities, Programs and
Expenditure.‖
———. 2006c. ―Natural Resources and Environment: Priorities and Proposed Sector Investment
Program.‖
———. 2006d. ―Agriculture, Forestry and Fisheries: Priorities and Proposed Sector Investment
Program.‖
———. 2006e. ―Water Supply and Sanitation: Priorities and Proposed Sector Investment
Program.‖
———. 2006f. ―Transport: Priorities and Proposed Sector Investment Program.‖
———. 2006g. ―Public Sector Management: Priorities and Proposed Sector Investment
Program.‖
———. 2006h. Petroleum Fund 2005-06 Annual Report. Ministry of Planning and Finance –
Director of Treasury.
———. 2008. Timor-Leste State of the Nation Report 2008. (draft). National Commission for
Research and Development. Ministry of Economy and Development.
———. 2009. ―Goodbye Conflict and Welcome Development.‖ Ministry of Finance, TLDPM
Background paper.
Government of Timor-Leste and United Nations. 2004. Timor-Leste Millennium Development
Goal Report.
Green, Will. 2006. ―Looking Towards Sustainable Future: Environmental Priorities and the
Pathway ahead for Timor-Leste.‖ Prepared for World Bank.
Haburas Foundation. 2008. Mangrove Devastation in Metinaru—What Are the Issues. Critical
Issues Series (English Edition). Dili.
Hamilton, K., and J. M. Hartwick. 2005. ―Investing Exhaustible Resource Rents and the Path of
Consumption.‖ Canadian Journal of Economics 38 (2): 615–21.
Heino, J. 2006. ―National Forest Programmes: What FAO Can Do.‖ Unasylva. No. 225.
Hutton, G., and Laurence Haller. 2004. Evaluation of the Costs and Benefits of Water and
Sanitation Improvements at the Global Level. Water, Sanitation and Health Protection of
the Human Environment. Geneva: World Health Organization.
Hutton, G., E. Rehfuess, F. Tediosi, and S. Weiss. 2006. Evaluation of the Costs and Benefits of
Household Energy and Health Interventions at Global and Regional Levels. Geneva:
World Health Organization.
IMF (International Monetary Fund). 2005. World Economic Outlook 2005, Washington, DC:
IMF.
46
JICA/TEC (Japan International Cooperation Agency/Tokyo Engineering Consultants). 2001.
―The Study on Urgent Improvement Project for Water Supply System in East Timor.‖
Tokyo.
JICA (Japan International Cooperation Agency). 2007. ―Focus on Timor-Leste: More Rice for
the Pot.‖ Tokyo.
———. 2008. The Study on Community-based Integrated Watershed Management in Laclo and
Comoro River Basins in the Democratic Republic of Timor-Leste: Main Report. Tokyo:
Nippon Koei CO., Ltd.
Larsen, Bjorn. 2004. Cost of Environmental Damage in Colombia: A Socio-Economic and
Environmental Health Risk Assessment. Prepared for the Ministry of Environment,
Housing and Land Development, Republic of Colombia.
———. 2006. ―Ghana Cost of Environmental Damage Study.‖ Prepared for World Bank.
Leitao, Vasco. 2007. ―Concept Note Scoping Mission. Technical Report- Environmental
Engineering.‖ Prepared for World Bank.
Louis Berger Group and Kai Watu Kmanek. 2005. ―Transport Sector Improvement–Draft Final
Report.‖ Prepared for Asian Development Bank.
MAF (Ministry of Agriculture and Fisheries). 2008. Information from Website. Available at:
http://www.maf.gov.tl.
Mcfayden, R. C. 2003. ―Chromolaena in Southeast Asia and the Pacific.‖ In Agriculture: New
Directions for a New Nation- East Timor (Timor-Leste), ed. H. da Costa, C. Piggin, C. J.
da Cruz, and J. J. Fox, 130–34. ACIAR Proceeding No. 113.
Mrozek, J., and L. Taylor. 2002. ―What Determines the Value of Life? A Meta Analysis.‖
Journal of Policy Analysis and Management 21 (2): 253–70.
Niederman, M. S., J. S. McCombs, A. N. Unger, A. Kuman, and R. Popovian. 1999. ―Treatment
Cost of Acute Exacerbations of Chronic Bronchitis.‖ Clinical Therapy 21 (3): 576–91.
Old, Ken. 2002. ―Madre Cacau Disease Study Mission.‖ Australia Agency for International
Development. Client Report No. 1119.
OPEC (Organization of the Petroleum Exporting Countries). 2006. Annual Statistical Bulletin,
Tables 77 and 80. 1970–1979, 1980–2006.
Palmeirim, Jorge. 2007. ―Living Natural Resources of Timor-Leste: A Contribution for the
Definition of Focal Areas for the Country Environmental Analysis (CEA).‖ Technical
Report.
Pearce, D. W., and G. Atkinson. 1993. ―Capital Theory and the Measurement of Sustainable
Development: An Indicator of Weak Sustainability.‖ Ecological Economics 8 (2): 103–
08.
PEMSEA (Partnership in Environmental Management for the Seas of East Asia). 2008.
Extracted from Website. Available at: www.pemsea.org.
Sandlund, Odd Terje, et al. 2001. Assessing Environmental Needs and Priorities in Timor-Leste.
United Nations Development Programme (UNDP) commissioned paper. New York:
UNDP.
Schulman, Ronca, and Bucuvalas, Inc. 2001. Confronting COPD in North America and Europe:
A Survey of Patients and Doctors in Eight Countries. New York.
Shibuya, K., C. Mathers, and A. Lopez. 2001. Chronic Obstructive Pulmonary Disease (COPD):
Consistent Estimates of Incidence, Prevalence, and Mortality by WHO Region. Global
Programme on Evidence for Health Policy. Geneva: World Health Organization.
47
Stockwell, Alan. 2002. ―Development of Community-based Coastal Resource Management in
East Timor.‖ Project Proposal Document. Prepared for Second Agricultural
Rehabilitation Project and Department of Fisheries and the Marine Environment. Dili.
———. 2003. ―Introduction to Co-Management or Community-based Management of Coastal
Resources.‖ Prepared for Second Agricultural Rehabilitation Project and Department of
Fisheries and the Marine Environment. Dili.
Synergies Working Group. 2007. ―Cross-Cutting Requirements and Capacity Development
Needs for the Implementation of Rio Conventions: Climate Change, Land Degradation
and Biodiversity.‖ Timor-Leste NCSA Project. Dili.
TSDA (Timor Sea Designated Authority). 2006. Annual Report 2006. Dili.
Trainor, C., B. Coates, and K. Bishop. 2007. Birds of Timor-Leste. Cambridge, U.K.: BirdLife
International and Dove Publications.
UNDP (United Nations Development Programme). 2004a. Timor-Leste: Costing the MDGs:
Concept and Strategy. United Nations Development Group.
———. 2004b. Participatory Rural Energy Development Programme in Timor-Leste (draft). ———. 2008a. Human Development Indices: A Statistical Update 2008. New York.
———. 2008b. MDG Targets and Indicators. Available at: www.undp.org/mdg/goallist.shtml.
UNDP and GoTL (United Nations Development Programme and Government of Timor-Leste).
2008. Rural Energy Policy for Timor-Leste. Final Version. Prepared by Detlef Loy and
Lino Correia. UNDP Country Office of Timor-Leste in collaboration with the Secretariat
of State for Energy Policy.
UNDP, GoTL, and GEF (United Nations Development Programme, Government of Timor-
Leste, and Global Environment Facility). 2007. National Capacity Development Action
Plan for Global Environmental Management.
UNESCAP (United Nations Economic and Social Commission for Asia and the Pacific). 2003.
Exploring East Timor, Mineral and Hydrocarbon Potential. Dili: United Nations
Development Programme.
———. 2005. State of the Environment 2005. Dili.
United Nations. 2005. Millennium Development Goals Indicators. Website available at:
mdgs.un.org/unsd/mdg/Metadata.aspx?IndicatorId=32.
UNPD (United Nations Population Division). 2006. World Population Prospects: The 2006
Revision and World Urbanization Prospects: The 2007 Revision. New York.
USDA (U.S. Department of Agriculture). 2006. An Assessment of the Conditions of East Timor’s
Albizia Coffee-Shade and its Potential for Commercial Salvage. Report of USDA Forest
Service Mission to USAID-East Timor 10/30–11/17/05.
World Bank. 2004. ―Third Agriculture Rehabilitation Project.‖ Project Appraisal Document,
Timor-Leste, Report No. 26799-TP. Washington DC: World Bank.
———. 2005a. ―Country Assistance Strategy (CAS) for the Democratic Republic of Timor-
Leste for the period FY06-FY08.‖ Washington DC: World Bank.
———. 2005b. Environmental Matters at the World Bank. Annual Review. July 2004-June 2005
(FY05). Washington DC: World Bank.
———. 2006. ―Background paper for the Timor-Leste and Development Partners Meeting, 3–4
April.‖ Washington DC: World Bank.
———. 2006b. ―Timor-Leste Health Sector Review. Meeting Health Challenges and Improving
Health Outcomes.‖ Washington DC: World Bank.
48
———. 2006c. Where is the Wealth of Nations? Measuring Capital in the 21st Century.
Washington DC: World Bank.
———. 2007a. World Development Indicators. Washington DC: World Bank.
———. 2007b. The Little Green Data Book 2007.. Washington DC: World Bank.
———. 2007c. ―Timor-Leste Issues and Options in the Household Energy Sector: A Scoping
Study.‖ Transport, Energy and Mining Sector, Sustainable Development Department,
Washington, DC: World Bank.
———. 2007d. ―Population Growth and Its Implications in Timor-Leste‖ (draft). Washington
DC: World Bank.
———. 2007e. ―Timor-Leste Youth Development and the Labor Market.‖ Washington DC:
World Bank.
———. 2007f. Economic Impacts of Sanitation in Southeast Asia. The Water and Sanitation
Program. Washington DC: World Bank.
———. 2008a. Global Monitoring Report. Washington, DC: World Bank.
———. 2008b. World Development Indicators. Washington, DC: World Bank.
———. 2008c. ―Timor-Leste Agriculture Brief.‖ Washington DC: World Bank.
———. 2008d. ―Policy Note on Population Growth and Its Implications in Timor-Leste.‖
Washington, DC: World Bank.
———. 2009a. The Little Green Data Book 2009. Washington DC: World Bank.
———. 2009b. World Development Indicators. ddp-
ext.worldbank.org/ext/DDPQQ/report.do?method=showReport. Accessed June 23, 2009.
World Bank, MoF (Ministry of Finance), and DNS (Directorate of National Statistics). 2008.
―Timor-Leste: Poverty in a Young Nation.‖ Washington DC: World Bank.
WHO (World Health Organization). 2000. Addressing the Link between Indoor Air Pollution,
Household Energy and Human Health. Report from Washington Consultation. Geneva:
WHO.
———. 2001. World Health Report 2001. Geneva: WHO.
———. 2002a. Global Burden of Disease 2002. Geneva: WHO.
———. 2002b. World Health Report 2002: Reducing Risks, Promoting Healthy Life. Geneva:
WHO.
———. 2004. ―Water, Sanitation and Hygiene Links to Health: Facts and Figures Updated.‖
Geneva: WHO.
———. 2007. World Health Statistics 2007. Geneva: WHO.
———. 2008. Health Statistics and Health Information Systems. Available at:
www.who.int/healthinfo/boddaly/en.
WWF. 2008. ―Leaders Commit to Protecting Coral Triangle.‖ Focus Newsletter 30 (2).
Annex A: Estimation of National Wealth
Economic development can be likened to a process of portfolio management in which a
country’s authorities decide how to use up, invest on, or conserve its endowments of available
resources or wealth to generate consumption possibilities over time. Wealth here refers to a
concept that is broader than commonly used in economic sector work. Following a long tradition
that starts with Adam Smith, the measure of wealth here includes produced assets such as
buildings and machinery, human capital, institutional assets, and natural wealth in the form of
land, forests, and subsoil assets.
Total wealth in Timor-Leste is calculated at nearly $56,000 per capita. (See Box A.1.) Oil and
natural gas reserves are predominant, accounting for 85 percent of total wealth. Intangible
capital—an aggregate including human, social, and institutional capital—and non-oil natural
assets follow in importance.
Box A.1. Estimating Wealth
Natural capital
Following the methodology that underpins the wealth estimates of the World Bank (2008a),
natural capital encompasses nonrenewable resources (including oil, natural gas, coal, and mineral
resources), cropland, pastureland, forested areas (including areas used for timber extraction and
non-timber forest products), and protected areas. Most commercial natural resources are valued
by taking the present value of resource rents—the economic profit on exploitation—over an
assumed lifetime and calculating the net present value of such rents using a discount rate of 4
percent. While forests can, in principle, yield benefits forever if sustainably managed,
overexploitation is accounted for by calculating the effective lifetime of the resource given
current harvest rates. Agricultural land rents are estimated calculating profits from different types
of crops, assuming that the products of the land are sold at world prices. The values for non-
timber forest resources and protected areas are estimated only crudely. In the case of non-timber
forest products, world average values of benefits per hectare, distinguishing industrial and
developing countries, are applied to a share of the country’s forested area. Protected areas are
valued using country-specific per hectare values for cropland or pastureland (whichever is
lower).
Produced capital
Produced capital includes physical infrastructure and urban land and is estimated by cumulating
investment time series using an appropriate depreciation rate (assumed to be 5 percent per year).
Investment time series of at least 20 years of data are needed to obtain a robust estimate of
physical capital (investments older than that have a negligible remaining value today owing to
depreciation).
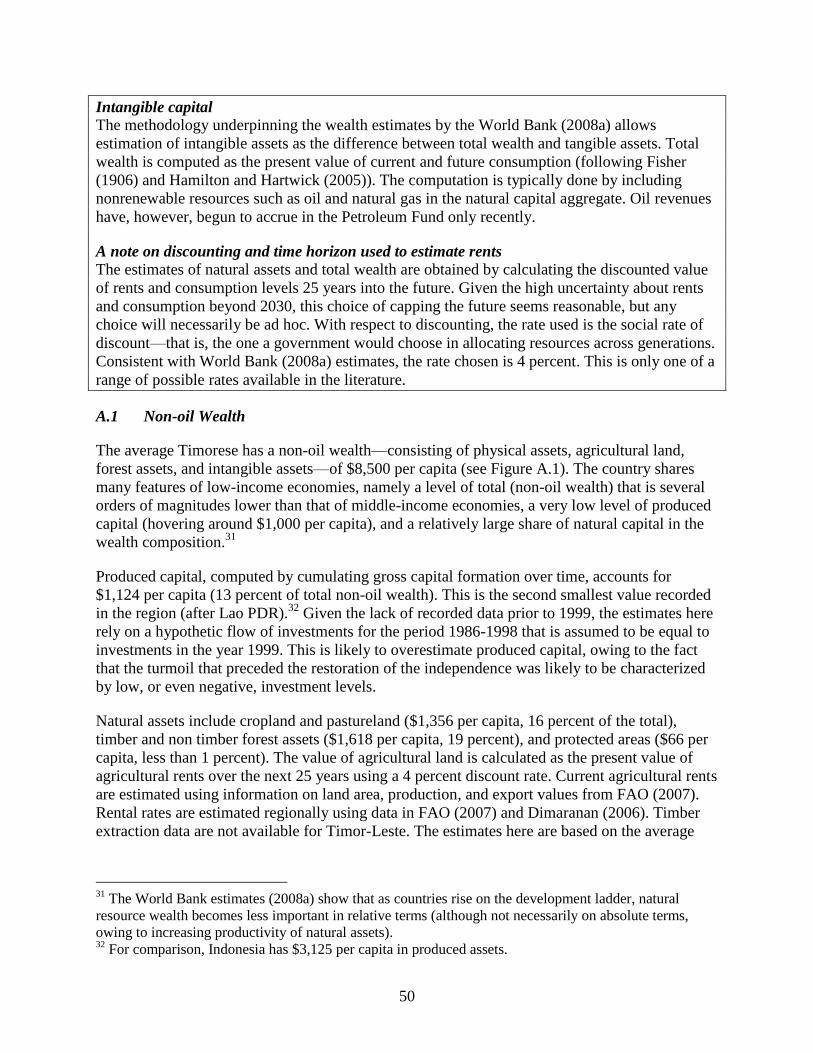
50
Intangible capital
The methodology underpinning the wealth estimates by the World Bank (2008a) allows
estimation of intangible assets as the difference between total wealth and tangible assets. Total
wealth is computed as the present value of current and future consumption (following Fisher
(1906) and Hamilton and Hartwick (2005)). The computation is typically done by including
nonrenewable resources such as oil and natural gas in the natural capital aggregate. Oil revenues
have, however, begun to accrue in the Petroleum Fund only recently.
A note on discounting and time horizon used to estimate rents
The estimates of natural assets and total wealth are obtained by calculating the discounted value
of rents and consumption levels 25 years into the future. Given the high uncertainty about rents
and consumption beyond 2030, this choice of capping the future seems reasonable, but any
choice will necessarily be ad hoc. With respect to discounting, the rate used is the social rate of
discount—that is, the one a government would choose in allocating resources across generations.
Consistent with World Bank (2008a) estimates, the rate chosen is 4 percent. This is only one of a
range of possible rates available in the literature.
A.1 Non-oil Wealth
The average Timorese has a non-oil wealth—consisting of physical assets, agricultural land,
forest assets, and intangible assets—of $8,500 per capita (see Figure A.1). The country shares
many features of low-income economies, namely a level of total (non-oil wealth) that is several
orders of magnitudes lower than that of middle-income economies, a very low level of produced
capital (hovering around $1,000 per capita), and a relatively large share of natural capital in the
wealth composition.31
Produced capital, computed by cumulating gross capital formation over time, accounts for
$1,124 per capita (13 percent of total non-oil wealth). This is the second smallest value recorded
in the region (after Lao PDR).32
Given the lack of recorded data prior to 1999, the estimates here
rely on a hypothetic flow of investments for the period 1986-1998 that is assumed to be equal to
investments in the year 1999. This is likely to overestimate produced capital, owing to the fact
that the turmoil that preceded the restoration of the independence was likely to be characterized
by low, or even negative, investment levels.
Natural assets include cropland and pastureland ($1,356 per capita, 16 percent of the total),
timber and non timber forest assets ($1,618 per capita, 19 percent), and protected areas ($66 per
capita, less than 1 percent). The value of agricultural land is calculated as the present value of
agricultural rents over the next 25 years using a 4 percent discount rate. Current agricultural rents
are estimated using information on land area, production, and export values from FAO (2007).
Rental rates are estimated regionally using data in FAO (2007) and Dimaranan (2006). Timber
extraction data are not available for Timor-Leste. The estimates here are based on the average
31
The World Bank estimates (2008a) show that as countries rise on the development ladder, natural
resource wealth becomes less important in relative terms (although not necessarily on absolute terms,
owing to increasing productivity of natural assets). 32
For comparison, Indonesia has $3,125 per capita in produced assets.
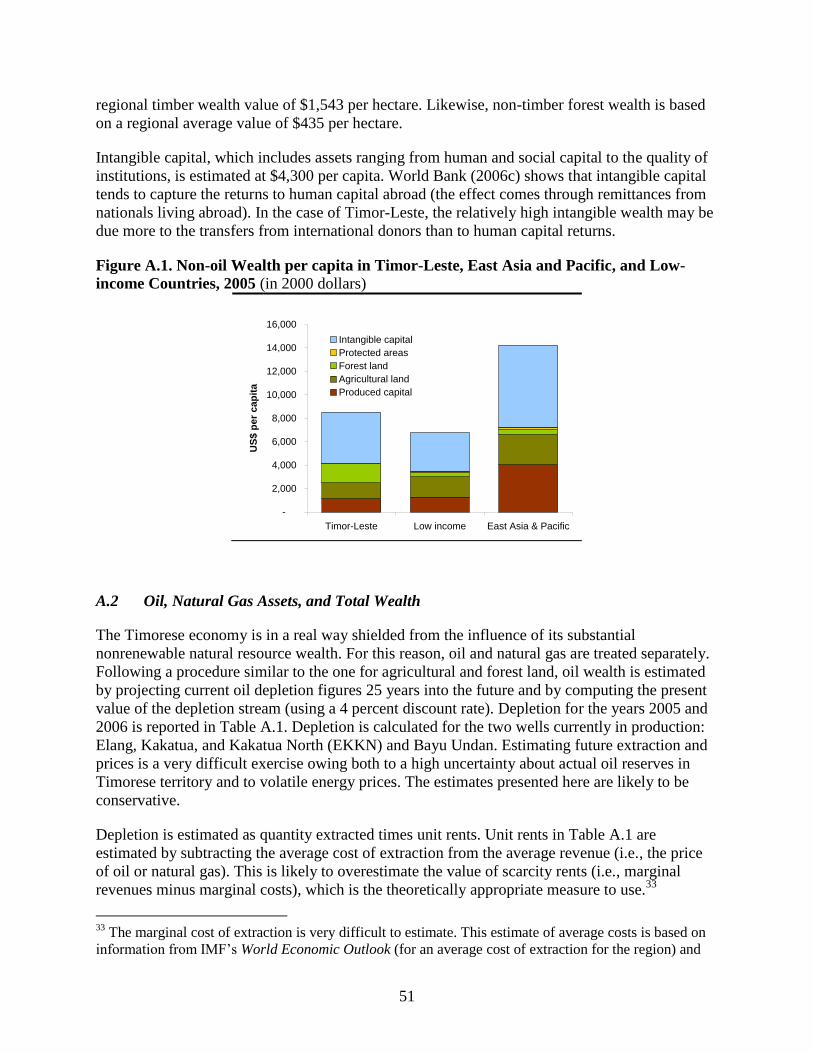
51
regional timber wealth value of $1,543 per hectare. Likewise, non-timber forest wealth is based
on a regional average value of $435 per hectare.
Intangible capital, which includes assets ranging from human and social capital to the quality of
institutions, is estimated at $4,300 per capita. World Bank (2006c) shows that intangible capital
tends to capture the returns to human capital abroad (the effect comes through remittances from
nationals living abroad). In the case of Timor-Leste, the relatively high intangible wealth may be
due more to the transfers from international donors than to human capital returns.
Figure A.1. Non-oil Wealth per capita in Timor-Leste, East Asia and Pacific, and Low-
income Countries, 2005 (in 2000 dollars)
-
2,000
4,000
6,000
8,000
10,000
12,000
14,000
16,000
Timor-Leste Low income East Asia & Pacific
US
$ p
er
ca
pit
a
Intangible capital
Protected areas
Forest land
Agricultural land
Produced capital
A.2 Oil, Natural Gas Assets, and Total Wealth
The Timorese economy is in a real way shielded from the influence of its substantial
nonrenewable natural resource wealth. For this reason, oil and natural gas are treated separately.
Following a procedure similar to the one for agricultural and forest land, oil wealth is estimated
by projecting current oil depletion figures 25 years into the future and by computing the present
value of the depletion stream (using a 4 percent discount rate). Depletion for the years 2005 and
2006 is reported in Table A.1. Depletion is calculated for the two wells currently in production:
Elang, Kakatua, and Kakatua North (EKKN) and Bayu Undan. Estimating future extraction and
prices is a very difficult exercise owing both to a high uncertainty about actual oil reserves in
Timorese territory and to volatile energy prices. The estimates presented here are likely to be
conservative.
Depletion is estimated as quantity extracted times unit rents. Unit rents in Table A.1 are
estimated by subtracting the average cost of extraction from the average revenue (i.e., the price
of oil or natural gas). This is likely to overestimate the value of scarcity rents (i.e., marginal
revenues minus marginal costs), which is the theoretically appropriate measure to use.33
33
The marginal cost of extraction is very difficult to estimate. This estimate of average costs is based on
information from IMF’s World Economic Outlook (for an average cost of extraction for the region) and
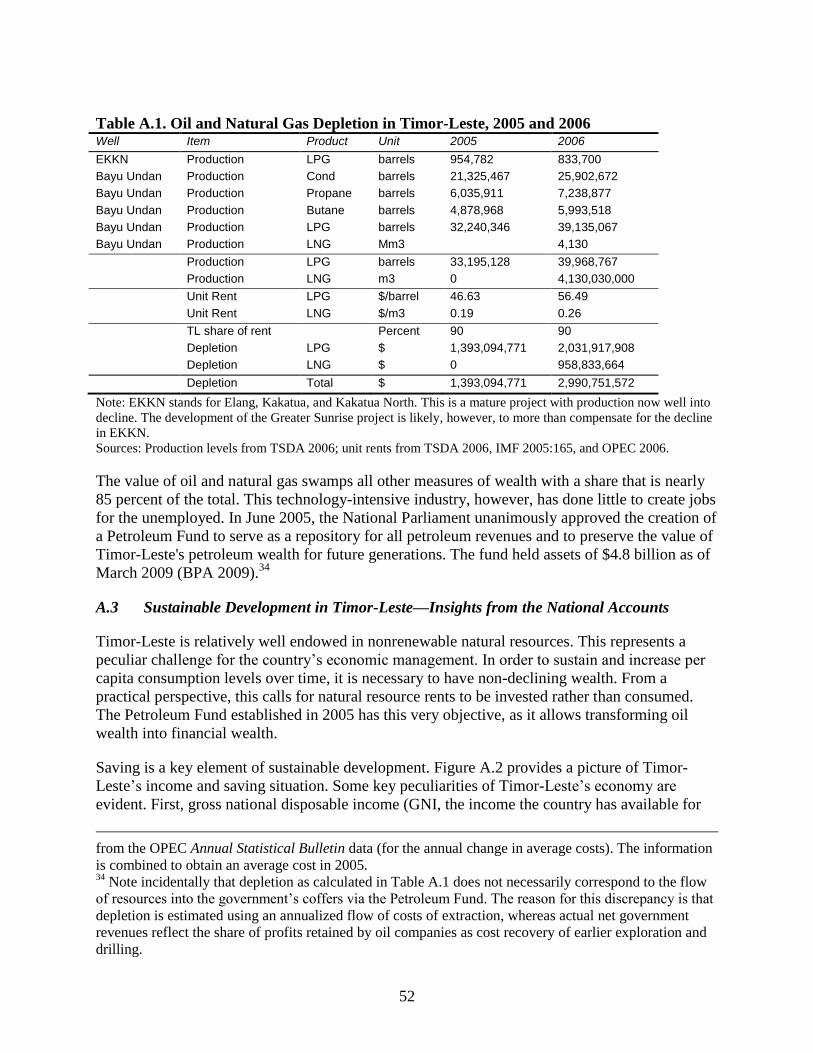
52
Table A.1. Oil and Natural Gas Depletion in Timor-Leste, 2005 and 2006 Well Item Product Unit 2005 2006
EKKN Production LPG barrels 954,782 833,700
Bayu Undan Production Cond barrels 21,325,467 25,902,672
Bayu Undan Production Propane barrels 6,035,911 7,238,877
Bayu Undan Production Butane barrels 4,878,968 5,993,518
Bayu Undan Production LPG barrels 32,240,346 39,135,067
Bayu Undan Production LNG Mm3 4,130
Production LPG barrels 33,195,128 39,968,767
Production LNG m3 0 4,130,030,000
Unit Rent LPG $/barrel 46.63 56.49
Unit Rent LNG $/m3 0.19 0.26
TL share of rent Percent 90 90
Depletion LPG $ 1,393,094,771 2,031,917,908
Depletion LNG $ 0 958,833,664
Depletion Total $ 1,393,094,771 2,990,751,572
Note: EKKN stands for Elang, Kakatua, and Kakatua North. This is a mature project with production now well into
decline. The development of the Greater Sunrise project is likely, however, to more than compensate for the decline
in EKKN.
Sources: Production levels from TSDA 2006; unit rents from TSDA 2006, IMF 2005:165, and OPEC 2006.
The value of oil and natural gas swamps all other measures of wealth with a share that is nearly
85 percent of the total. This technology-intensive industry, however, has done little to create jobs
for the unemployed. In June 2005, the National Parliament unanimously approved the creation of
a Petroleum Fund to serve as a repository for all petroleum revenues and to preserve the value of
Timor-Leste's petroleum wealth for future generations. The fund held assets of $4.8 billion as of
March 2009 (BPA 2009).34
A.3 Sustainable Development in Timor-Leste—Insights from the National Accounts
Timor-Leste is relatively well endowed in nonrenewable natural resources. This represents a
peculiar challenge for the country’s economic management. In order to sustain and increase per
capita consumption levels over time, it is necessary to have non-declining wealth. From a
practical perspective, this calls for natural resource rents to be invested rather than consumed.
The Petroleum Fund established in 2005 has this very objective, as it allows transforming oil
wealth into financial wealth.
Saving is a key element of sustainable development. Figure A.2 provides a picture of Timor-
Leste’s income and saving situation. Some key peculiarities of Timor-Leste’s economy are
evident. First, gross national disposable income (GNI, the income the country has available for
from the OPEC Annual Statistical Bulletin data (for the annual change in average costs). The information
is combined to obtain an average cost in 2005. 34
Note incidentally that depletion as calculated in Table A.1 does not necessarily correspond to the flow
of resources into the government’s coffers via the Petroleum Fund. The reason for this discrepancy is that
depletion is estimated using an annualized flow of costs of extraction, whereas actual net government
revenues reflect the share of profits retained by oil companies as cost recovery of earlier exploration and
drilling.
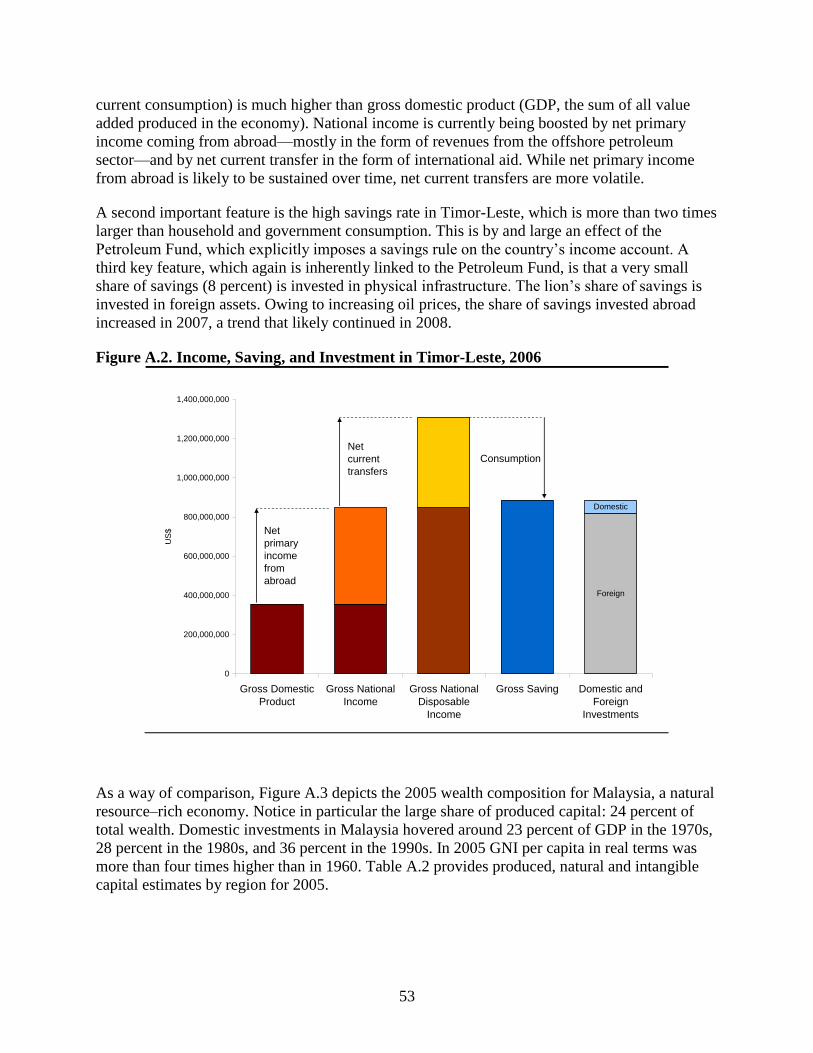
53
current consumption) is much higher than gross domestic product (GDP, the sum of all value
added produced in the economy). National income is currently being boosted by net primary
income coming from abroad—mostly in the form of revenues from the offshore petroleum
sector—and by net current transfer in the form of international aid. While net primary income
from abroad is likely to be sustained over time, net current transfers are more volatile.
A second important feature is the high savings rate in Timor-Leste, which is more than two times
larger than household and government consumption. This is by and large an effect of the
Petroleum Fund, which explicitly imposes a savings rule on the country’s income account. A
third key feature, which again is inherently linked to the Petroleum Fund, is that a very small
share of savings (8 percent) is invested in physical infrastructure. The lion’s share of savings is
invested in foreign assets. Owing to increasing oil prices, the share of savings invested abroad
increased in 2007, a trend that likely continued in 2008.
Figure A.2. Income, Saving, and Investment in Timor-Leste, 2006
Foreign
Domestic
0
200,000,000
400,000,000
600,000,000
800,000,000
1,000,000,000
1,200,000,000
1,400,000,000
Gross Domestic
Product
Gross National
Income
Gross National
Disposable
Income
Gross Saving Domestic and
Foreign
Investments
US
$ Net
primary
income
from
abroad
Net
current
transfers
Consumption
As a way of comparison, Figure A.3 depicts the 2005 wealth composition for Malaysia, a natural
resource–rich economy. Notice in particular the large share of produced capital: 24 percent of
total wealth. Domestic investments in Malaysia hovered around 23 percent of GDP in the 1970s,
28 percent in the 1980s, and 36 percent in the 1990s. In 2005 GNI per capita in real terms was
more than four times higher than in 1960. Table A.2 provides produced, natural and intangible
capital estimates by region for 2005.
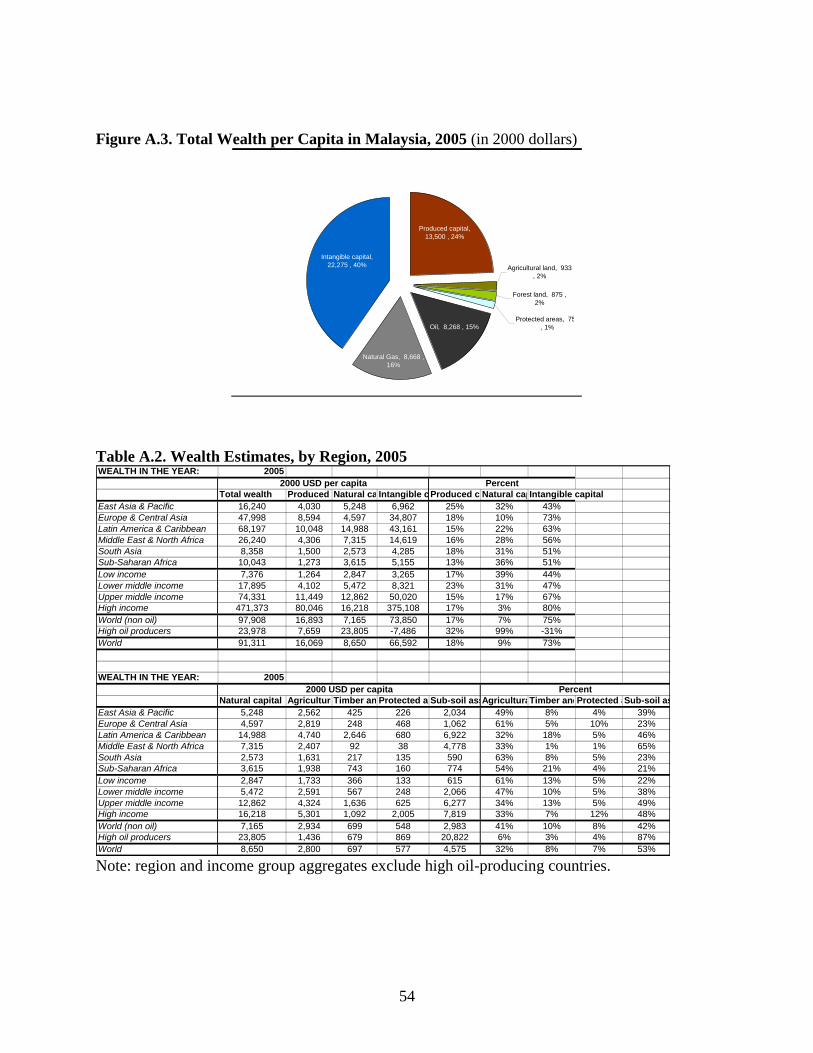
54
Figure A.3. Total Wealth per Capita in Malaysia, 2005 (in 2000 dollars)
Oil, 8,268 , 15%
Natural Gas, 8,668 ,
16%
Intangible capital,
22,275 , 40% Agricultural land, 933
, 2%
Produced capital,
13,500 , 24%
Protected areas, 756
, 1%
Forest land, 875 ,
2%
Table A.2. Wealth Estimates, by Region, 2005 WEALTH IN THE YEAR: 2005
Total wealth Produced capitalNatural capitalIntangible capitalProduced capitalNatural capitalIntangible capital
East Asia & Pacific 16,240 4,030 5,248 6,962 25% 32% 43%
Europe & Central Asia 47,998 8,594 4,597 34,807 18% 10% 73%
Latin America & Caribbean 68,197 10,048 14,988 43,161 15% 22% 63%
Middle East & North Africa 26,240 4,306 7,315 14,619 16% 28% 56%
South Asia 8,358 1,500 2,573 4,285 18% 31% 51%
Sub-Saharan Africa 10,043 1,273 3,615 5,155 13% 36% 51%
Low income 7,376 1,264 2,847 3,265 17% 39% 44%
Lower middle income 17,895 4,102 5,472 8,321 23% 31% 47%
Upper middle income 74,331 11,449 12,862 50,020 15% 17% 67%
High income 471,373 80,046 16,218 375,108 17% 3% 80%
World (non oil) 97,908 16,893 7,165 73,850 17% 7% 75%
High oil producers 23,978 7,659 23,805 -7,486 32% 99% -31%
World 91,311 16,069 8,650 66,592 18% 9% 73%
WEALTH IN THE YEAR: 2005
Natural capital Agricultural landTimber and non-timber forest resourcesProtected areasSub-soil assetsAgricultural landTimber and non-timber forest resourcesProtected areasSub-soil assets
East Asia & Pacific 5,248 2,562 425 226 2,034 49% 8% 4% 39%
Europe & Central Asia 4,597 2,819 248 468 1,062 61% 5% 10% 23%
Latin America & Caribbean 14,988 4,740 2,646 680 6,922 32% 18% 5% 46%
Middle East & North Africa 7,315 2,407 92 38 4,778 33% 1% 1% 65%
South Asia 2,573 1,631 217 135 590 63% 8% 5% 23%
Sub-Saharan Africa 3,615 1,938 743 160 774 54% 21% 4% 21%
Low income 2,847 1,733 366 133 615 61% 13% 5% 22%
Lower middle income 5,472 2,591 567 248 2,066 47% 10% 5% 38%
Upper middle income 12,862 4,324 1,636 625 6,277 34% 13% 5% 49%
High income 16,218 5,301 1,092 2,005 7,819 33% 7% 12% 48%
World (non oil) 7,165 2,934 699 548 2,983 41% 10% 8% 42%
High oil producers 23,805 1,436 679 869 20,822 6% 3% 4% 87%
World 8,650 2,800 697 577 4,575 32% 8% 7% 53%
2000 USD per capita Percent
2000 USD per capita Percent
Note: region and income group aggregates exclude high oil-producing countries.
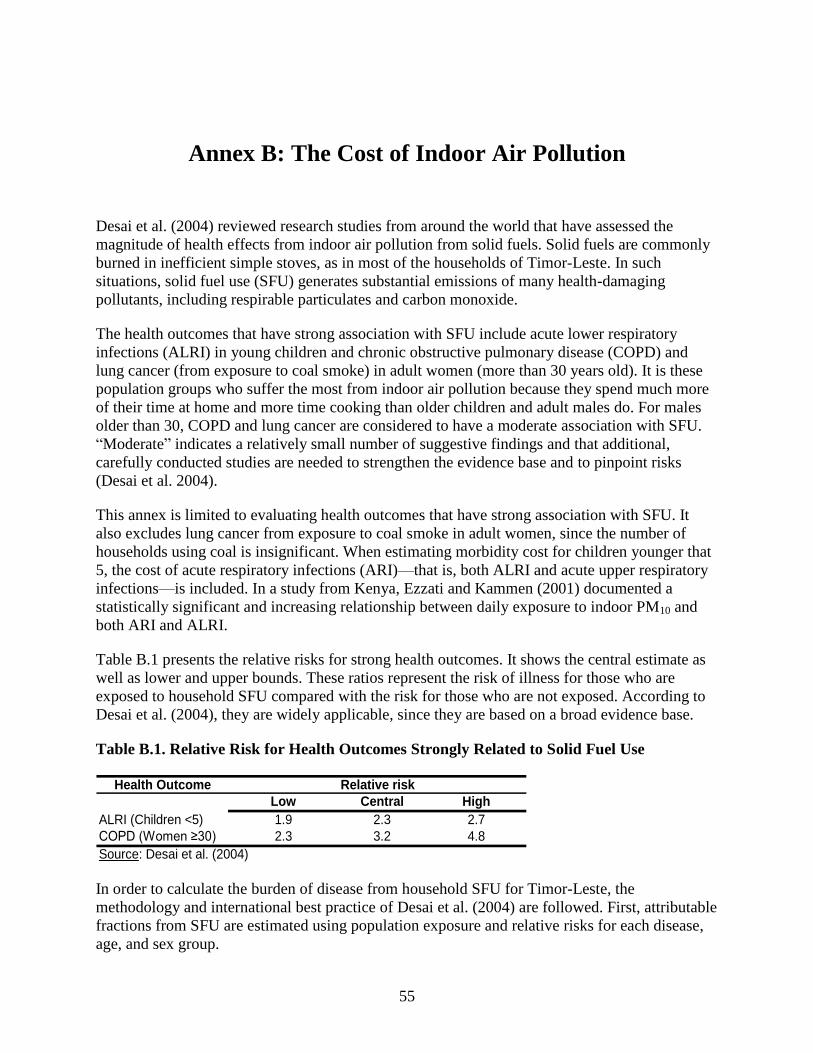
55
Annex B: The Cost of Indoor Air Pollution
Desai et al. (2004) reviewed research studies from around the world that have assessed the
magnitude of health effects from indoor air pollution from solid fuels. Solid fuels are commonly
burned in inefficient simple stoves, as in most of the households of Timor-Leste. In such
situations, solid fuel use (SFU) generates substantial emissions of many health-damaging
pollutants, including respirable particulates and carbon monoxide.
The health outcomes that have strong association with SFU include acute lower respiratory
infections (ALRI) in young children and chronic obstructive pulmonary disease (COPD) and
lung cancer (from exposure to coal smoke) in adult women (more than 30 years old). It is these
population groups who suffer the most from indoor air pollution because they spend much more
of their time at home and more time cooking than older children and adult males do. For males
older than 30, COPD and lung cancer are considered to have a moderate association with SFU.
―Moderate‖ indicates a relatively small number of suggestive findings and that additional,
carefully conducted studies are needed to strengthen the evidence base and to pinpoint risks
(Desai et al. 2004).
This annex is limited to evaluating health outcomes that have strong association with SFU. It
also excludes lung cancer from exposure to coal smoke in adult women, since the number of
households using coal is insignificant. When estimating morbidity cost for children younger that
5, the cost of acute respiratory infections (ARI)—that is, both ALRI and acute upper respiratory
infections—is included. In a study from Kenya, Ezzati and Kammen (2001) documented a
statistically significant and increasing relationship between daily exposure to indoor PM10 and
both ARI and ALRI.
Table B.1 presents the relative risks for strong health outcomes. It shows the central estimate as
well as lower and upper bounds. These ratios represent the risk of illness for those who are
exposed to household SFU compared with the risk for those who are not exposed. According to
Desai et al. (2004), they are widely applicable, since they are based on a broad evidence base.
Table B.1. Relative Risk for Health Outcomes Strongly Related to Solid Fuel Use
Health Outcome
Low Central High
ALRI (Children <5) 1.9 2.3 2.7
COPD (Women ≥30) 2.3 3.2 4.8
Source: Desai et al. (2004)
Relative risk
In order to calculate the burden of disease from household SFU for Timor-Leste, the
methodology and international best practice of Desai et al. (2004) are followed. First, attributable
fractions from SFU are estimated using population exposure and relative risks for each disease,
age, and sex group.
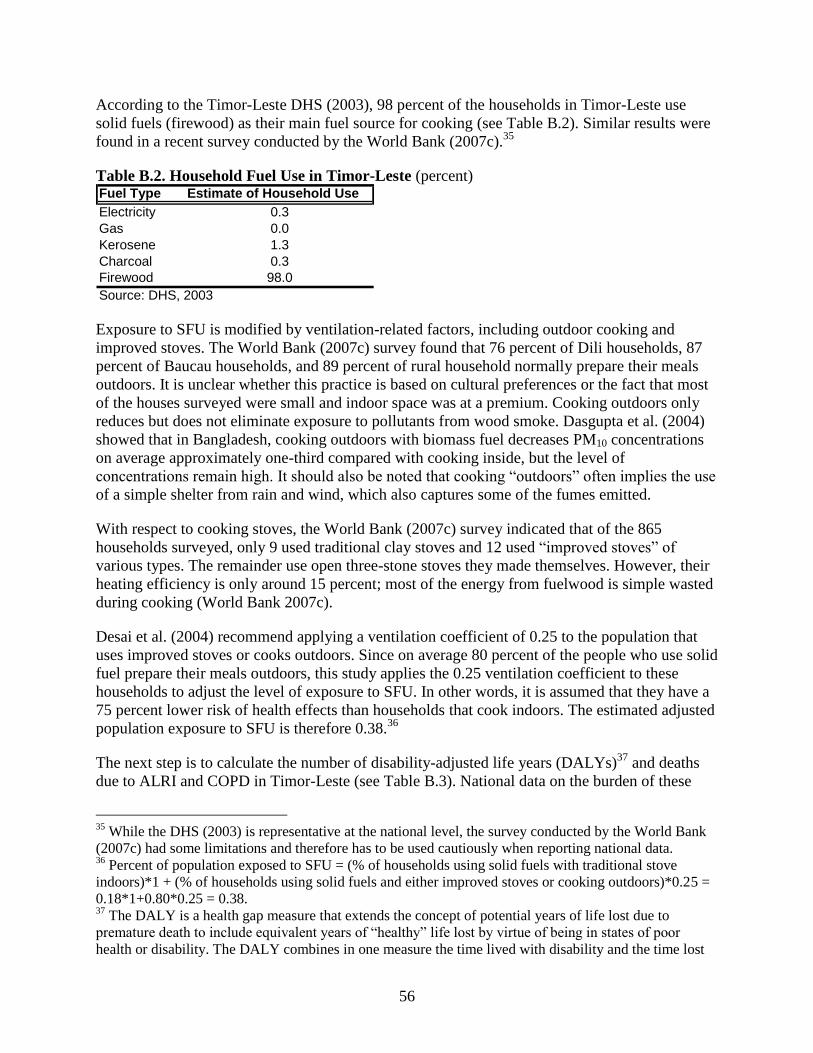
56
According to the Timor-Leste DHS (2003), 98 percent of the households in Timor-Leste use
solid fuels (firewood) as their main fuel source for cooking (see Table B.2). Similar results were
found in a recent survey conducted by the World Bank (2007c).35
Table B.2. Household Fuel Use in Timor-Leste (percent) Fuel Type Estimate of Household Use
Electricity 0.3
Gas 0.0
Kerosene 1.3
Charcoal 0.3
Firewood 98.0
Source: DHS, 2003
Exposure to SFU is modified by ventilation-related factors, including outdoor cooking and
improved stoves. The World Bank (2007c) survey found that 76 percent of Dili households, 87
percent of Baucau households, and 89 percent of rural household normally prepare their meals
outdoors. It is unclear whether this practice is based on cultural preferences or the fact that most
of the houses surveyed were small and indoor space was at a premium. Cooking outdoors only
reduces but does not eliminate exposure to pollutants from wood smoke. Dasgupta et al. (2004)
showed that in Bangladesh, cooking outdoors with biomass fuel decreases PM10 concentrations
on average approximately one-third compared with cooking inside, but the level of
concentrations remain high. It should also be noted that cooking ―outdoors‖ often implies the use
of a simple shelter from rain and wind, which also captures some of the fumes emitted.
With respect to cooking stoves, the World Bank (2007c) survey indicated that of the 865
households surveyed, only 9 used traditional clay stoves and 12 used ―improved stoves‖ of
various types. The remainder use open three-stone stoves they made themselves. However, their
heating efficiency is only around 15 percent; most of the energy from fuelwood is simple wasted
during cooking (World Bank 2007c).
Desai et al. (2004) recommend applying a ventilation coefficient of 0.25 to the population that
uses improved stoves or cooks outdoors. Since on average 80 percent of the people who use solid
fuel prepare their meals outdoors, this study applies the 0.25 ventilation coefficient to these
households to adjust the level of exposure to SFU. In other words, it is assumed that they have a
75 percent lower risk of health effects than households that cook indoors. The estimated adjusted
population exposure to SFU is therefore 0.38.36
The next step is to calculate the number of disability-adjusted life years (DALYs)37
and deaths
due to ALRI and COPD in Timor-Leste (see Table B.3). National data on the burden of these
35
While the DHS (2003) is representative at the national level, the survey conducted by the World Bank
(2007c) had some limitations and therefore has to be used cautiously when reporting national data. 36
Percent of population exposed to SFU = (% of households using solid fuels with traditional stove
indoors)*1 + (% of households using solid fuels and either improved stoves or cooking outdoors)*0.25 =
0.18*1+0.80*0.25 = 0.38. 37
The DALY is a health gap measure that extends the concept of potential years of life lost due to
premature death to include equivalent years of ―healthy‖ life lost by virtue of being in states of poor
health or disability. The DALY combines in one measure the time lived with disability and the time lost
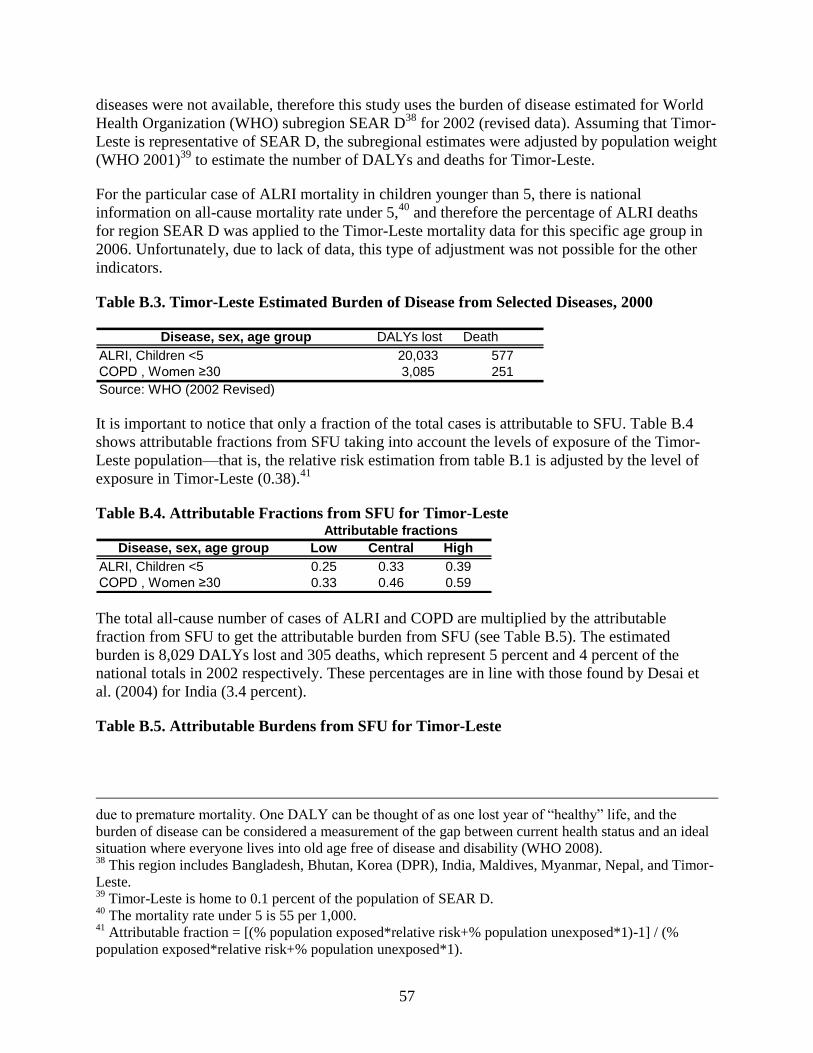
57
diseases were not available, therefore this study uses the burden of disease estimated for World
Health Organization (WHO) subregion SEAR D38
for 2002 (revised data). Assuming that Timor-
Leste is representative of SEAR D, the subregional estimates were adjusted by population weight
(WHO 2001)39
to estimate the number of DALYs and deaths for Timor-Leste.
For the particular case of ALRI mortality in children younger than 5, there is national
information on all-cause mortality rate under 5,40
and therefore the percentage of ALRI deaths
for region SEAR D was applied to the Timor-Leste mortality data for this specific age group in
2006. Unfortunately, due to lack of data, this type of adjustment was not possible for the other
indicators.
Table B.3. Timor-Leste Estimated Burden of Disease from Selected Diseases, 2000
Disease, sex, age group DALYs lost Death
ALRI, Children <5 20,033 577
COPD , Women ≥30 3,085 251
Source: WHO (2002 Revised)
It is important to notice that only a fraction of the total cases is attributable to SFU. Table B.4
shows attributable fractions from SFU taking into account the levels of exposure of the Timor-
Leste population—that is, the relative risk estimation from table B.1 is adjusted by the level of
exposure in Timor-Leste (0.38).41
Table B.4. Attributable Fractions from SFU for Timor-Leste
Disease, sex, age group Low Central High
ALRI, Children <5 0.25 0.33 0.39
COPD , Women ≥30 0.33 0.46 0.59
Attributable fractions
The total all-cause number of cases of ALRI and COPD are multiplied by the attributable
fraction from SFU to get the attributable burden from SFU (see Table B.5). The estimated
burden is 8,029 DALYs lost and 305 deaths, which represent 5 percent and 4 percent of the
national totals in 2002 respectively. These percentages are in line with those found by Desai et
al. (2004) for India (3.4 percent).
Table B.5. Attributable Burdens from SFU for Timor-Leste
due to premature mortality. One DALY can be thought of as one lost year of ―healthy‖ life, and the
burden of disease can be considered a measurement of the gap between current health status and an ideal
situation where everyone lives into old age free of disease and disability (WHO 2008). 38
This region includes Bangladesh, Bhutan, Korea (DPR), India, Maldives, Myanmar, Nepal, and Timor-
Leste. 39
Timor-Leste is home to 0.1 percent of the population of SEAR D. 40
The mortality rate under 5 is 55 per 1,000. 41
Attributable fraction = [(% population exposed*relative risk+% population unexposed*1)-1] / (%
population exposed*relative risk+% population unexposed*1).
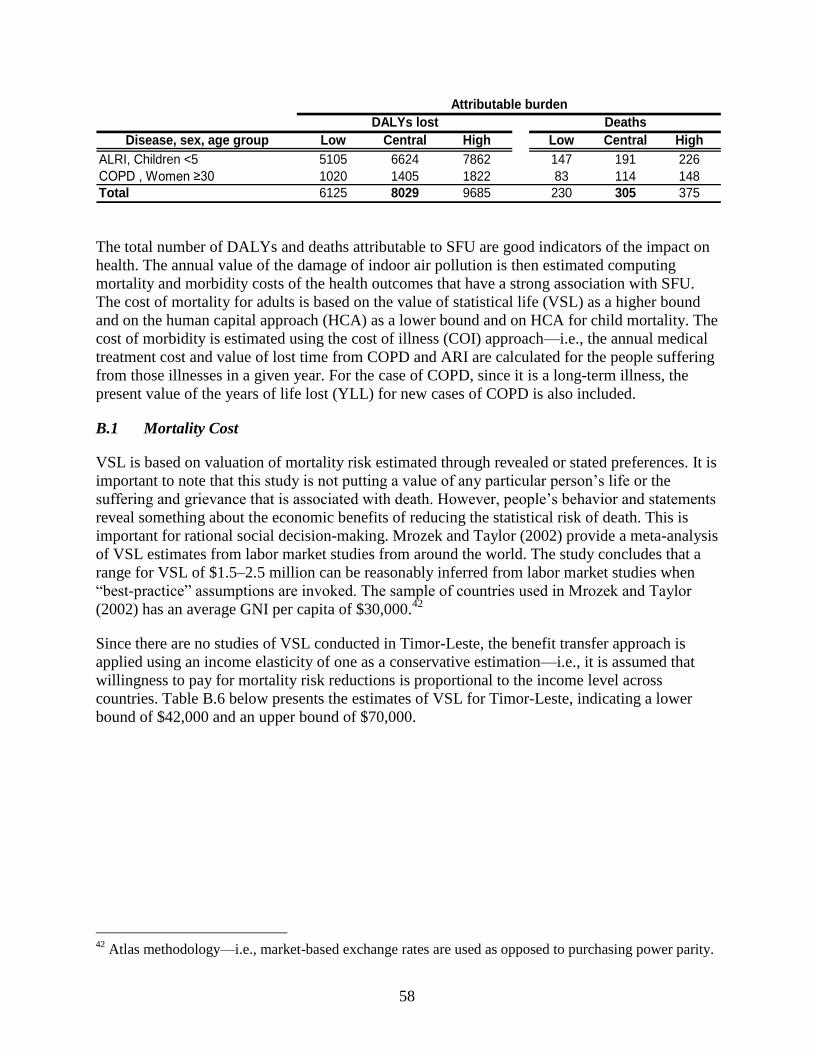
58
Disease, sex, age group Low Central High Low Central High
ALRI, Children <5 5105 6624 7862 147 191 226
COPD , Women ≥30 1020 1405 1822 83 114 148
Total 6125 8029 9685 230 305 375
Attributable burden
DALYs lost Deaths
The total number of DALYs and deaths attributable to SFU are good indicators of the impact on
health. The annual value of the damage of indoor air pollution is then estimated computing
mortality and morbidity costs of the health outcomes that have a strong association with SFU.
The cost of mortality for adults is based on the value of statistical life (VSL) as a higher bound
and on the human capital approach (HCA) as a lower bound and on HCA for child mortality. The
cost of morbidity is estimated using the cost of illness (COI) approach—i.e., the annual medical
treatment cost and value of lost time from COPD and ARI are calculated for the people suffering
from those illnesses in a given year. For the case of COPD, since it is a long-term illness, the
present value of the years of life lost (YLL) for new cases of COPD is also included.
B.1 Mortality Cost
VSL is based on valuation of mortality risk estimated through revealed or stated preferences. It is
important to note that this study is not putting a value of any particular person’s life or the
suffering and grievance that is associated with death. However, people’s behavior and statements
reveal something about the economic benefits of reducing the statistical risk of death. This is
important for rational social decision-making. Mrozek and Taylor (2002) provide a meta-analysis
of VSL estimates from labor market studies from around the world. The study concludes that a
range for VSL of $1.5–2.5 million can be reasonably inferred from labor market studies when
―best-practice‖ assumptions are invoked. The sample of countries used in Mrozek and Taylor
(2002) has an average GNI per capita of $30,000.42
Since there are no studies of VSL conducted in Timor-Leste, the benefit transfer approach is
applied using an income elasticity of one as a conservative estimation—i.e., it is assumed that
willingness to pay for mortality risk reductions is proportional to the income level across
countries. Table B.6 below presents the estimates of VSL for Timor-Leste, indicating a lower
bound of $42,000 and an upper bound of $70,000.
42
Atlas methodology—i.e., market-based exchange rates are used as opposed to purchasing power parity.
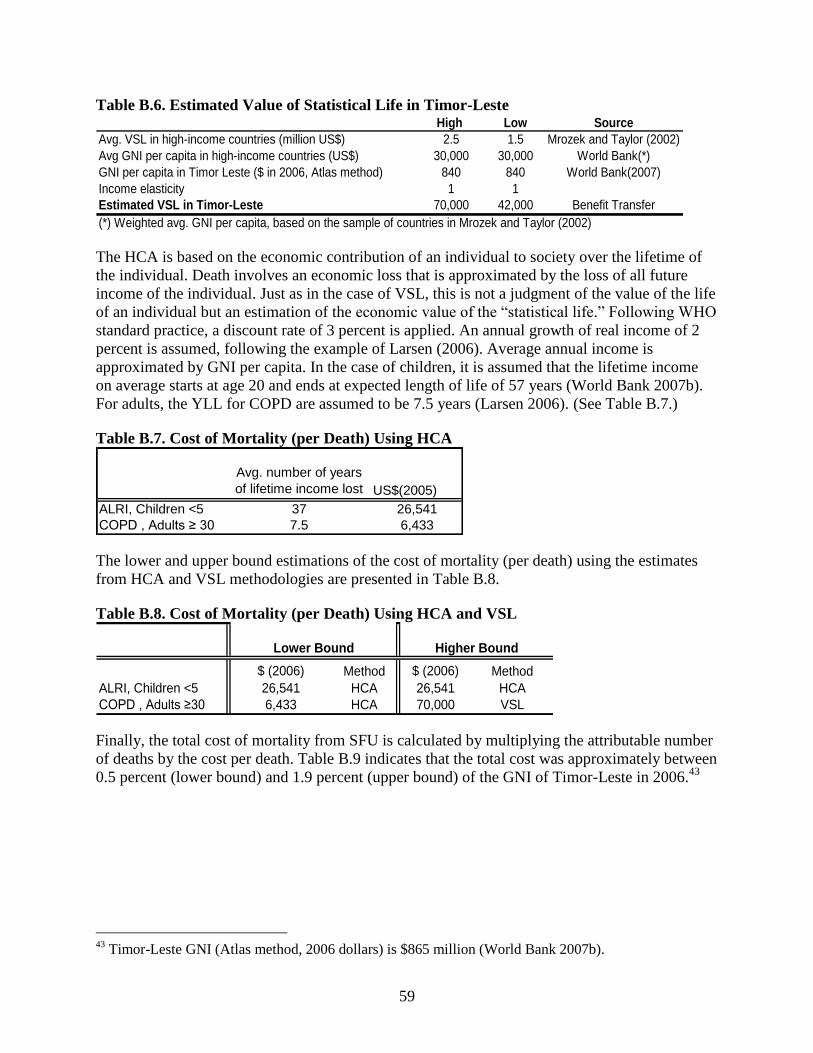
59
Table B.6. Estimated Value of Statistical Life in Timor-Leste High Low Source
Avg. VSL in high-income countries (million US$) 2.5 1.5 Mrozek and Taylor (2002)
Avg GNI per capita in high-income countries (US$) 30,000 30,000 World Bank(*)
GNI per capita in Timor Leste ($ in 2006, Atlas method) 840 840 World Bank(2007)
Income elasticity 1 1
Estimated VSL in Timor-Leste 70,000 42,000 Benefit Transfer
(*) Weighted avg. GNI per capita, based on the sample of countries in Mrozek and Taylor (2002)
The HCA is based on the economic contribution of an individual to society over the lifetime of
the individual. Death involves an economic loss that is approximated by the loss of all future
income of the individual. Just as in the case of VSL, this is not a judgment of the value of the life
of an individual but an estimation of the economic value of the ―statistical life.‖ Following WHO
standard practice, a discount rate of 3 percent is applied. An annual growth of real income of 2
percent is assumed, following the example of Larsen (2006). Average annual income is
approximated by GNI per capita. In the case of children, it is assumed that the lifetime income
on average starts at age 20 and ends at expected length of life of 57 years (World Bank 2007b).
For adults, the YLL for COPD are assumed to be 7.5 years (Larsen 2006). (See Table B.7.)
Table B.7. Cost of Mortality (per Death) Using HCA
Avg. number of years
of lifetime income lost US$(2005)
ALRI, Children <5 37 26,541
COPD , Adults ≥ 30 7.5 6,433
The lower and upper bound estimations of the cost of mortality (per death) using the estimates
from HCA and VSL methodologies are presented in Table B.8.
Table B.8. Cost of Mortality (per Death) Using HCA and VSL
$ (2006) Method $ (2006) Method
ALRI, Children <5 26,541 HCA 26,541 HCA
COPD , Adults ≥30 6,433 HCA 70,000 VSL
Lower Bound Higher Bound
Finally, the total cost of mortality from SFU is calculated by multiplying the attributable number
of deaths by the cost per death. Table B.9 indicates that the total cost was approximately between
0.5 percent (lower bound) and 1.9 percent (upper bound) of the GNI of Timor-Leste in 2006.43
43
Timor-Leste GNI (Atlas method, 2006 dollars) is $865 million (World Bank 2007b).
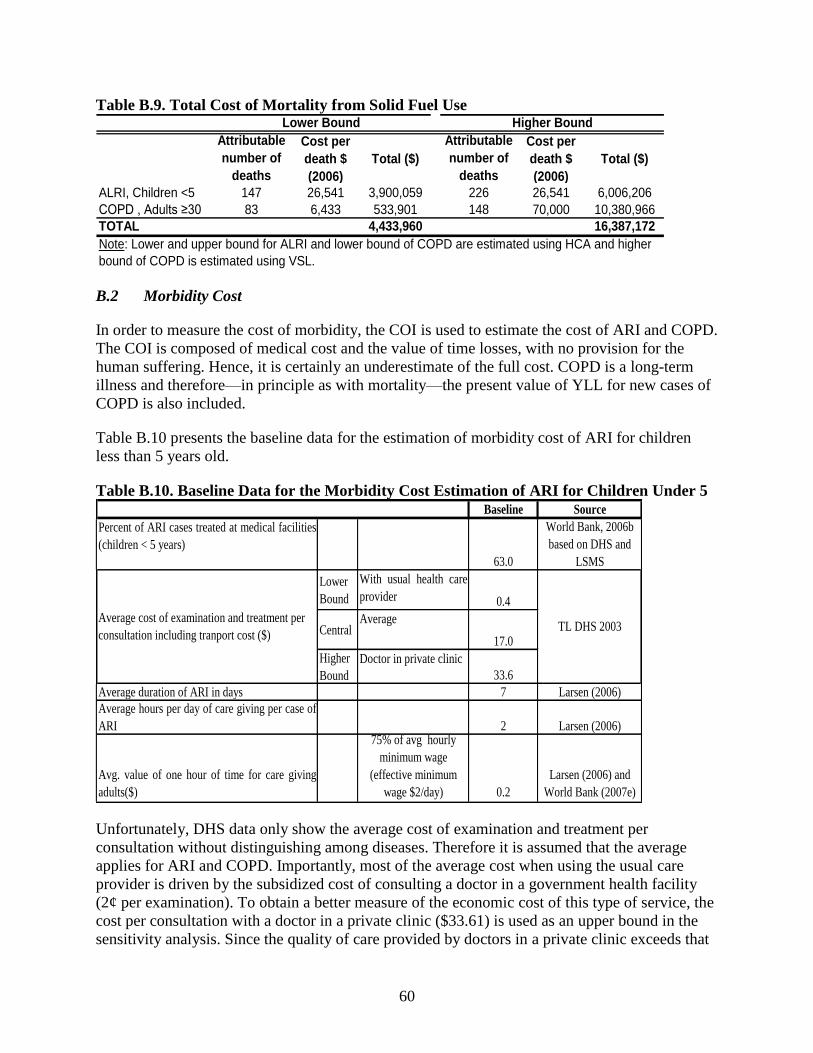
60
Table B.9. Total Cost of Mortality from Solid Fuel Use
Attributable
number of
deaths
Cost per
death $
(2006)
Total ($)
Attributable
number of
deaths
Cost per
death $
(2006)
Total ($)
ALRI, Children <5 147 26,541 3,900,059 226 26,541 6,006,206
COPD , Adults ≥30 83 6,433 533,901 148 70,000 10,380,966
TOTAL 4,433,960 16,387,172
Higher BoundLower Bound
Note: Lower and upper bound for ALRI and lower bound of COPD are estimated using HCA and higher
bound of COPD is estimated using VSL.
B.2 Morbidity Cost
In order to measure the cost of morbidity, the COI is used to estimate the cost of ARI and COPD.
The COI is composed of medical cost and the value of time losses, with no provision for the
human suffering. Hence, it is certainly an underestimate of the full cost. COPD is a long-term
illness and therefore—in principle as with mortality—the present value of YLL for new cases of
COPD is also included.
Table B.10 presents the baseline data for the estimation of morbidity cost of ARI for children
less than 5 years old.
Table B.10. Baseline Data for the Morbidity Cost Estimation of ARI for Children Under 5
Baseline Source
Percent of ARI cases treated at medical facilities
(children < 5 years)
63.0
World Bank, 2006b
based on DHS and
LSMS
Lower
Bound
With usual health care
provider 0.4
CentralAverage
17.0
Higher
Bound
Doctor in private clinic
33.6
Average duration of ARI in days 7 Larsen (2006)
Average hours per day of care giving per case of
ARI 2 Larsen (2006)
Avg. value of one hour of time for care giving
adults($)
75% of avg hourly
minimum wage
(effective minimum
wage $2/day) 0.2
Larsen (2006) and
World Bank (2007e)
Average cost of examination and treatment per
consultation including tranport cost ($)TL DHS 2003
Unfortunately, DHS data only show the average cost of examination and treatment per
consultation without distinguishing among diseases. Therefore it is assumed that the average
applies for ARI and COPD. Importantly, most of the average cost when using the usual care
provider is driven by the subsidized cost of consulting a doctor in a government health facility
(2¢ per examination). To obtain a better measure of the economic cost of this type of service, the
cost per consultation with a doctor in a private clinic ($33.61) is used as an upper bound in the
sensitivity analysis. Since the quality of care provided by doctors in a private clinic exceeds that
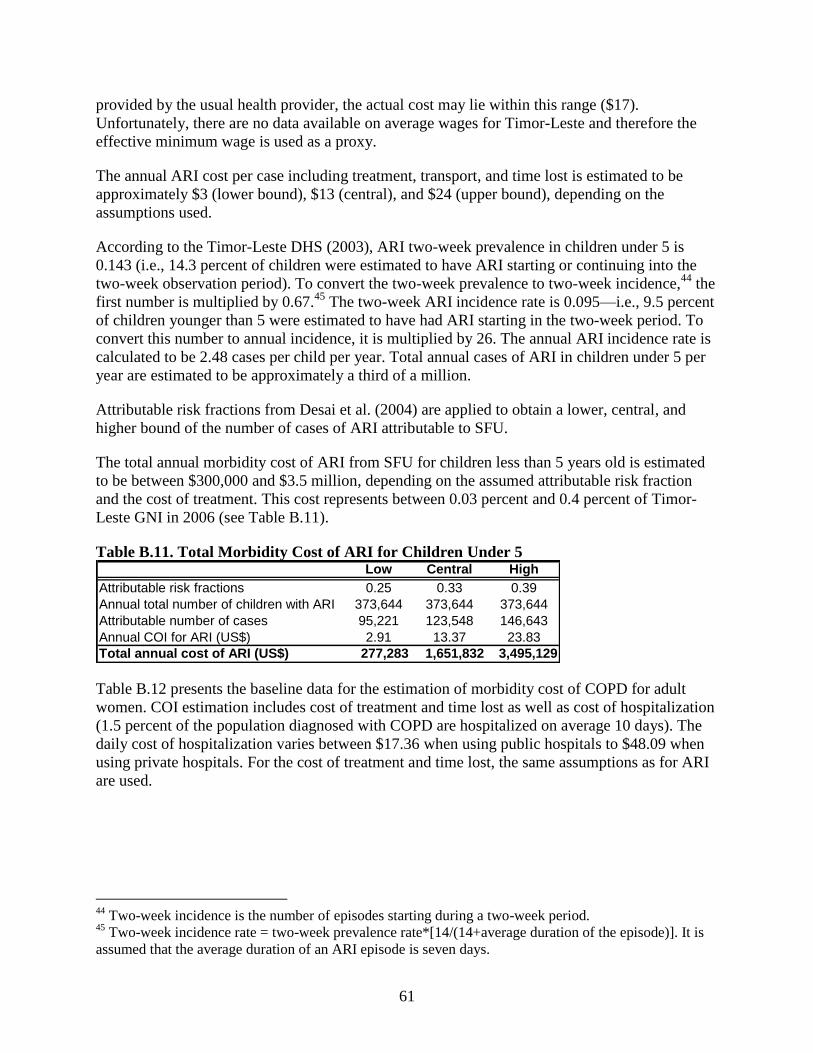
61
provided by the usual health provider, the actual cost may lie within this range ($17).
Unfortunately, there are no data available on average wages for Timor-Leste and therefore the
effective minimum wage is used as a proxy.
The annual ARI cost per case including treatment, transport, and time lost is estimated to be
approximately $3 (lower bound), $13 (central), and $24 (upper bound), depending on the
assumptions used.
According to the Timor-Leste DHS (2003), ARI two-week prevalence in children under 5 is
0.143 (i.e., 14.3 percent of children were estimated to have ARI starting or continuing into the
two-week observation period). To convert the two-week prevalence to two-week incidence,44
the
first number is multiplied by 0.67.45
The two-week ARI incidence rate is 0.095—i.e., 9.5 percent
of children younger than 5 were estimated to have had ARI starting in the two-week period. To
convert this number to annual incidence, it is multiplied by 26. The annual ARI incidence rate is
calculated to be 2.48 cases per child per year. Total annual cases of ARI in children under 5 per
year are estimated to be approximately a third of a million.
Attributable risk fractions from Desai et al. (2004) are applied to obtain a lower, central, and
higher bound of the number of cases of ARI attributable to SFU.
The total annual morbidity cost of ARI from SFU for children less than 5 years old is estimated
to be between $300,000 and $3.5 million, depending on the assumed attributable risk fraction
and the cost of treatment. This cost represents between 0.03 percent and 0.4 percent of Timor-
Leste GNI in 2006 (see Table B.11).
Table B.11. Total Morbidity Cost of ARI for Children Under 5 Low Central High
Attributable risk fractions 0.25 0.33 0.39
Annual total number of children with ARI 373,644 373,644 373,644
Attributable number of cases 95,221 123,548 146,643
Annual COI for ARI (US$) 2.91 13.37 23.83
Total annual cost of ARI (US$) 277,283 1,651,832 3,495,129
Table B.12 presents the baseline data for the estimation of morbidity cost of COPD for adult
women. COI estimation includes cost of treatment and time lost as well as cost of hospitalization
(1.5 percent of the population diagnosed with COPD are hospitalized on average 10 days). The
daily cost of hospitalization varies between $17.36 when using public hospitals to $48.09 when
using private hospitals. For the cost of treatment and time lost, the same assumptions as for ARI
are used.
44
Two-week incidence is the number of episodes starting during a two-week period. 45
Two-week incidence rate = two-week prevalence rate*[14/(14+average duration of the episode)]. It is
assumed that the average duration of an ARI episode is seven days.
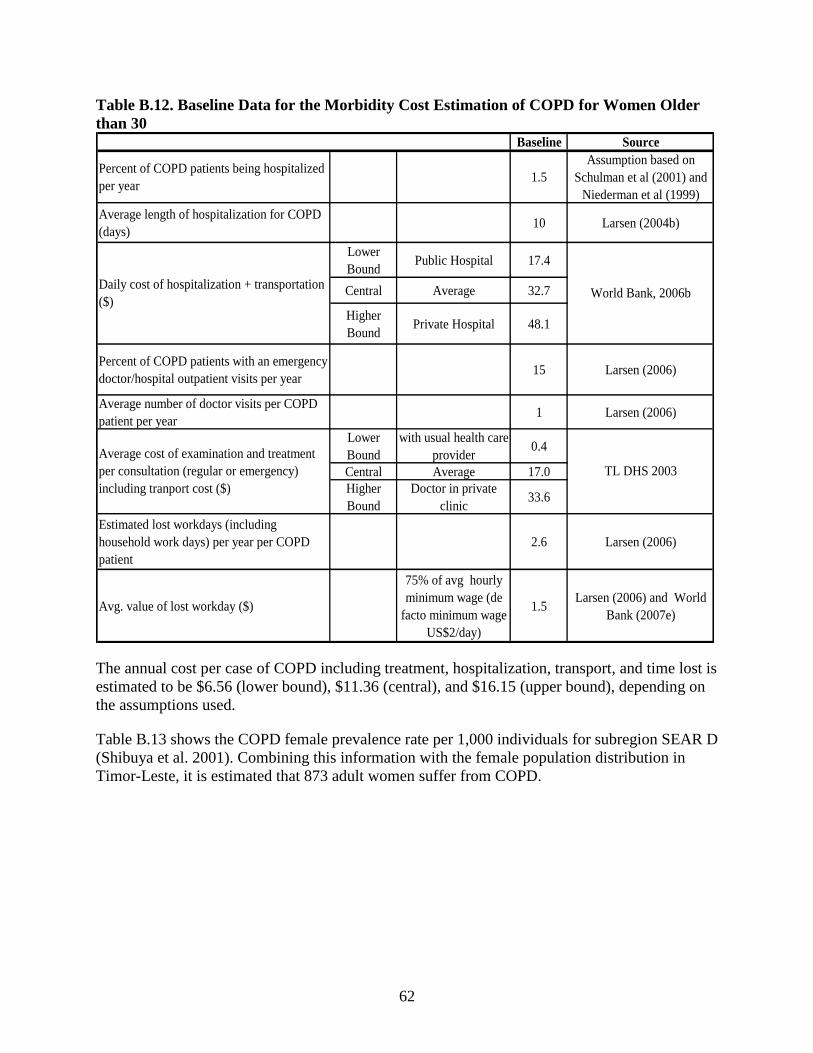
62
Table B.12. Baseline Data for the Morbidity Cost Estimation of COPD for Women Older
than 30
Baseline Source
Percent of COPD patients being hospitalized
per year1.5
Assumption based on
Schulman et al (2001) and
Niederman et al (1999)
Average length of hospitalization for COPD
(days)10 Larsen (2004b)
Lower
BoundPublic Hospital 17.4
Central Average 32.7
Higher
BoundPrivate Hospital 48.1
Percent of COPD patients with an emergency
doctor/hospital outpatient visits per year15 Larsen (2006)
Average number of doctor visits per COPD
patient per year1 Larsen (2006)
Lower
Bound
with usual health care
provider0.4
Central Average 17.0
Higher
Bound
Doctor in private
clinic33.6
Estimated lost workdays (including
household work days) per year per COPD
patient
2.6 Larsen (2006)
Avg. value of lost workday ($)
75% of avg hourly
minimum wage (de
facto minimum wage
US$2/day)
1.5Larsen (2006) and World
Bank (2007e)
Average cost of examination and treatment
per consultation (regular or emergency)
including tranport cost ($)
TL DHS 2003
Daily cost of hospitalization + transportation
($)World Bank, 2006b
The annual cost per case of COPD including treatment, hospitalization, transport, and time lost is
estimated to be $6.56 (lower bound), $11.36 (central), and $16.15 (upper bound), depending on
the assumptions used.
Table B.13 shows the COPD female prevalence rate per 1,000 individuals for subregion SEAR D
(Shibuya et al. 2001). Combining this information with the female population distribution in
Timor-Leste, it is estimated that 873 adult women suffer from COPD.
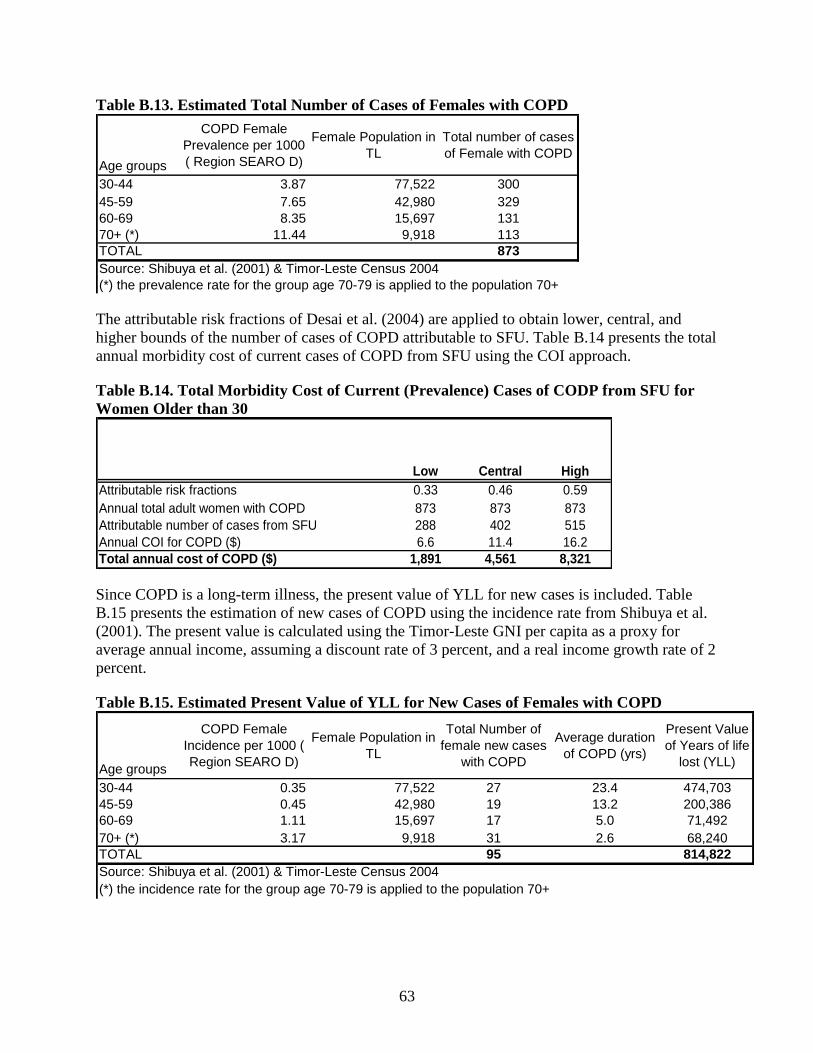
63
Table B.13. Estimated Total Number of Cases of Females with COPD
Age groups
COPD Female
Prevalence per 1000
( Region SEARO D)
Female Population in
TL
Total number of cases
of Female with COPD
30-44 3.87 77,522 300
45-59 7.65 42,980 329
60-69 8.35 15,697 131
70+ (*) 11.44 9,918 113
TOTAL 873
Source: Shibuya et al. (2001) & Timor-Leste Census 2004
(*) the prevalence rate for the group age 70-79 is applied to the population 70+
The attributable risk fractions of Desai et al. (2004) are applied to obtain lower, central, and
higher bounds of the number of cases of COPD attributable to SFU. Table B.14 presents the total
annual morbidity cost of current cases of COPD from SFU using the COI approach.
Table B.14. Total Morbidity Cost of Current (Prevalence) Cases of CODP from SFU for
Women Older than 30
Low Central High
Attributable risk fractions 0.33 0.46 0.59
Annual total adult women with COPD 873 873 873
Attributable number of cases from SFU 288 402 515
Annual COI for COPD ($) 6.6 11.4 16.2
Total annual cost of COPD ($) 1,891 4,561 8,321
Since COPD is a long-term illness, the present value of YLL for new cases is included. Table
B.15 presents the estimation of new cases of COPD using the incidence rate from Shibuya et al.
(2001). The present value is calculated using the Timor-Leste GNI per capita as a proxy for
average annual income, assuming a discount rate of 3 percent, and a real income growth rate of 2
percent.
Table B.15. Estimated Present Value of YLL for New Cases of Females with COPD
Age groups
COPD Female
Incidence per 1000 (
Region SEARO D)
Female Population in
TL
Total Number of
female new cases
with COPD
Average duration
of COPD (yrs)
Present Value
of Years of life
lost (YLL)
30-44 0.35 77,522 27 23.4 474,703
45-59 0.45 42,980 19 13.2 200,386
60-69 1.11 15,697 17 5.0 71,492
70+ (*) 3.17 9,918 31 2.6 68,240
TOTAL 95 814,822
Source: Shibuya et al. (2001) & Timor-Leste Census 2004
(*) the incidence rate for the group age 70-79 is applied to the population 70+
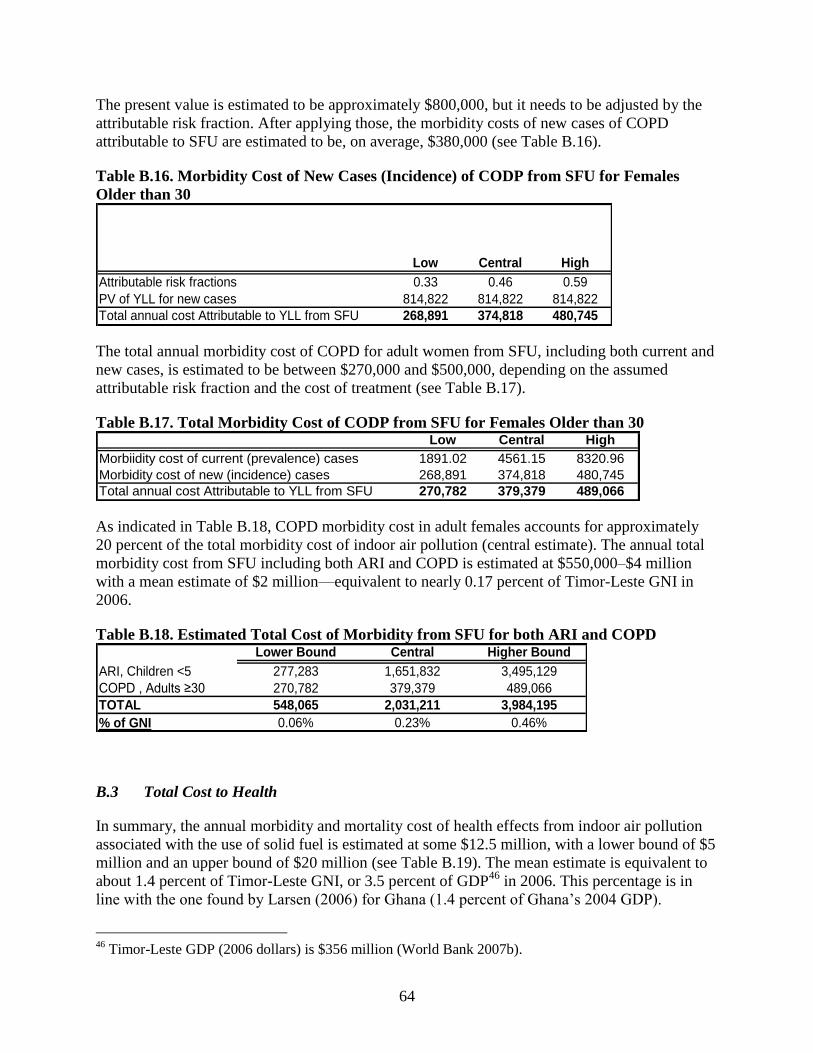
64
The present value is estimated to be approximately $800,000, but it needs to be adjusted by the
attributable risk fraction. After applying those, the morbidity costs of new cases of COPD
attributable to SFU are estimated to be, on average, $380,000 (see Table B.16).
Table B.16. Morbidity Cost of New Cases (Incidence) of CODP from SFU for Females
Older than 30
Low Central High
Attributable risk fractions 0.33 0.46 0.59
PV of YLL for new cases 814,822 814,822 814,822
Total annual cost Attributable to YLL from SFU 268,891 374,818 480,745
The total annual morbidity cost of COPD for adult women from SFU, including both current and
new cases, is estimated to be between $270,000 and $500,000, depending on the assumed
attributable risk fraction and the cost of treatment (see Table B.17).
Table B.17. Total Morbidity Cost of CODP from SFU for Females Older than 30 Low Central High
Morbiidity cost of current (prevalence) cases 1891.02 4561.15 8320.96
Morbidity cost of new (incidence) cases 268,891 374,818 480,745
Total annual cost Attributable to YLL from SFU 270,782 379,379 489,066
As indicated in Table B.18, COPD morbidity cost in adult females accounts for approximately
20 percent of the total morbidity cost of indoor air pollution (central estimate). The annual total
morbidity cost from SFU including both ARI and COPD is estimated at $550,000–$4 million
with a mean estimate of $2 million—equivalent to nearly 0.17 percent of Timor-Leste GNI in
2006.
Table B.18. Estimated Total Cost of Morbidity from SFU for both ARI and COPD Lower Bound Central Higher Bound
ARI, Children <5 277,283 1,651,832 3,495,129
COPD , Adults ≥30 270,782 379,379 489,066
TOTAL 548,065 2,031,211 3,984,195
% of GNI 0.06% 0.23% 0.46%
B.3 Total Cost to Health
In summary, the annual morbidity and mortality cost of health effects from indoor air pollution
associated with the use of solid fuel is estimated at some $12.5 million, with a lower bound of $5
million and an upper bound of $20 million (see Table B.19). The mean estimate is equivalent to
about 1.4 percent of Timor-Leste GNI, or 3.5 percent of GDP46
in 2006. This percentage is in
line with the one found by Larsen (2006) for Ghana (1.4 percent of Ghana’s 2004 GDP).
46
Timor-Leste GDP (2006 dollars) is $356 million (World Bank 2007b).
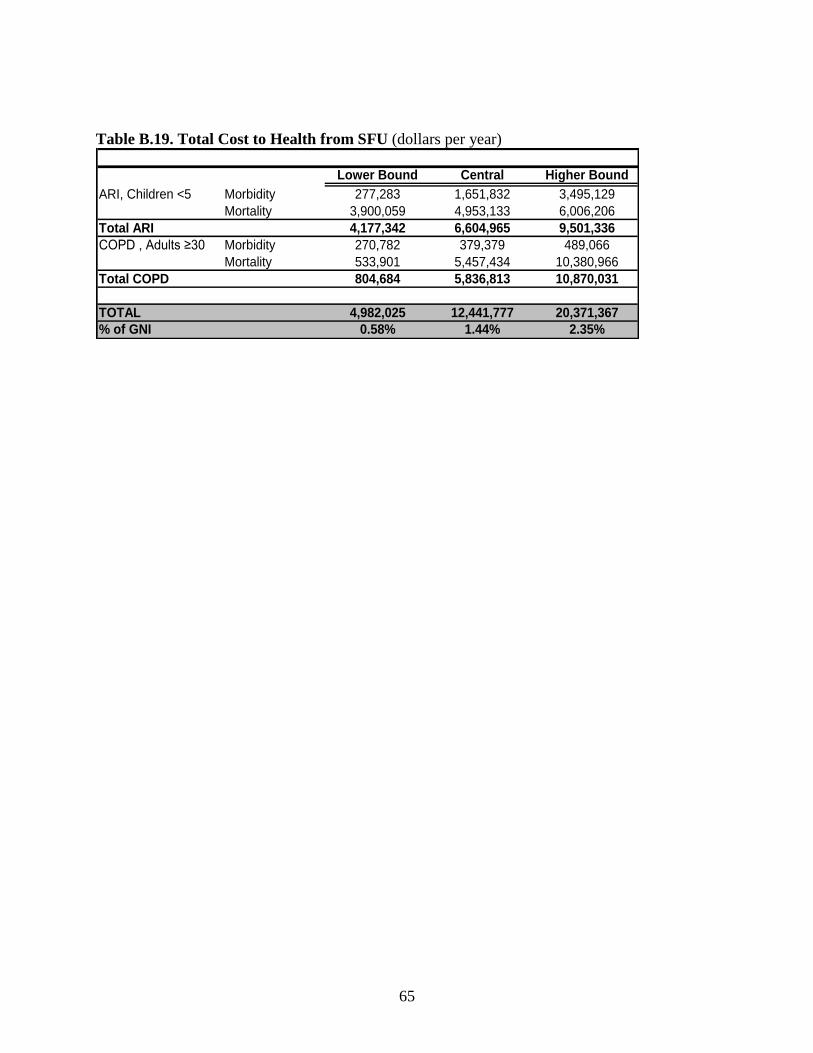
65
Table B.19. Total Cost to Health from SFU (dollars per year)
Lower Bound Central Higher Bound
ARI, Children <5 Morbidity 277,283 1,651,832 3,495,129
Mortality 3,900,059 4,953,133 6,006,206
Total ARI 4,177,342 6,604,965 9,501,336
COPD , Adults ≥30 Morbidity 270,782 379,379 489,066
Mortality 533,901 5,457,434 10,380,966
Total COPD 804,684 5,836,813 10,870,031
TOTAL 4,982,025 12,441,777 20,371,367
% of GNI 0.58% 1.44% 2.35%
Annex C: The Cost of Inadequate Water Supply, Sanitation,
and Hygiene
Water-related diseases are typically placed in four classes: waterborne, water-washed, water-
based, and water-related insect vectors (Gleick 2002). The first three are most clearly associated
with lack of improved domestic water supply.47
Box C.1 lists the diseases associated with each
class.
Box C.1. Water-related Diseases
Waterborne diseases are caused by the ingestion of water contaminated by human or
animal feces or urine containing pathogenic bacteria or viruses; they include cholera,
typhoid, amoebic and bacillary dysentery, and other diarrheal diseases.
Water-washed diseases are caused by poor personal hygiene and skin or eye contact with
contaminated water; they include scabies, trachoma, and flea, lice, and tick-borne diseases.
Water-based diseases are caused by parasites found in intermediate organisms living in
contaminated water; they include dracunculiasis, schistosomiasis, and other helminths.
Water-related diseases caused by insect vectors, especially mosquitoes that breed in
water, include dengue, filariasis, malaria, onchocerciasis, trypanosomiasis, and yellow
fever.
Source: Gleick 2002.
47
According to the United Nations Statistics Division (United Nations 2005), a household is considered
to have access to an improved water supply if it uses improved drinking water sources or delivery points.
Improved drinking water sources include piped water into dwelling, plot, or yard; public tap/standpipe;
tube well/borehole; protected dug well; protected spring; and rainwater collection. Unimproved drinking
water sources include unprotected dug well; unprotected spring; cart with small tank/drum; bottled water;
tanker-truck; and surface water (river, dam, lake, pond, stream, canal, irrigation channels). A household is
considered to have access to improved sanitation if it uses improved sanitation facilities, which includes
flush or pour-flush to piped sewer system, septic tank, or pit latrine; ventilated improved pit latrine; pit
latrine with slab; and composting toilet. Unimproved sanitation facilities include flush or pour-flush to
elsewhere; pit latrine without slab or open pit; bucket; hanging toilet or hanging latrine; and no facilities
or bush or field.
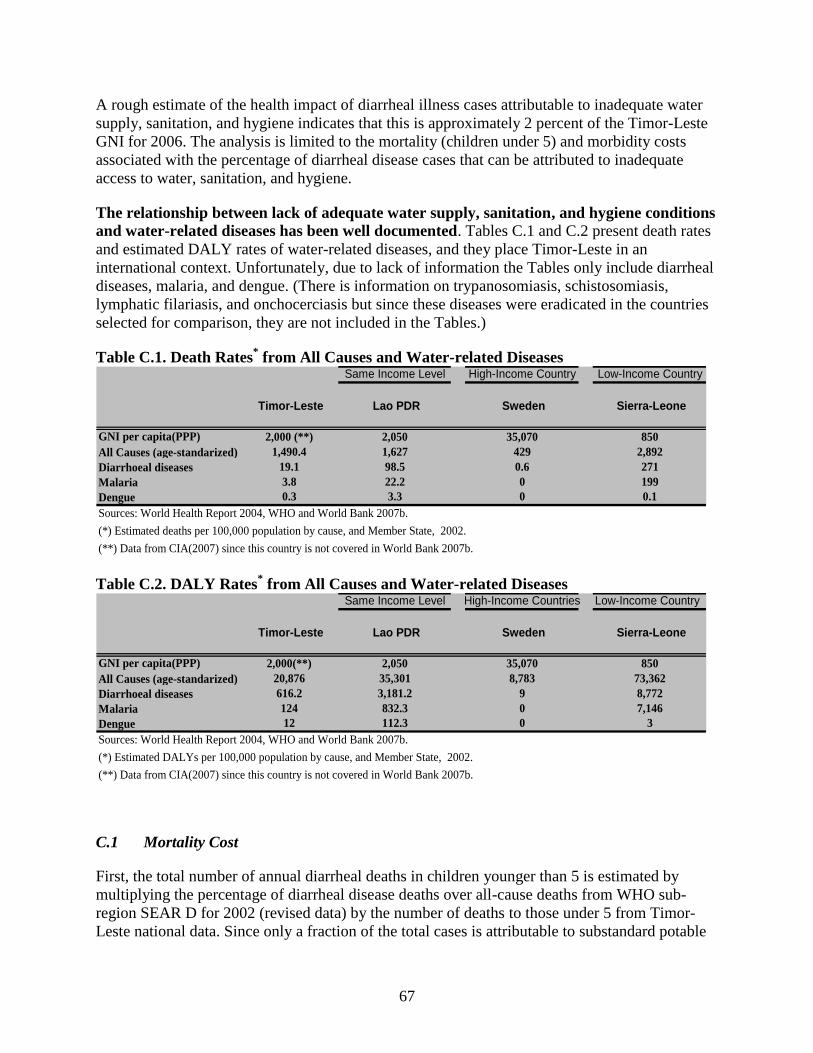
67
A rough estimate of the health impact of diarrheal illness cases attributable to inadequate water
supply, sanitation, and hygiene indicates that this is approximately 2 percent of the Timor-Leste
GNI for 2006. The analysis is limited to the mortality (children under 5) and morbidity costs
associated with the percentage of diarrheal disease cases that can be attributed to inadequate
access to water, sanitation, and hygiene.
The relationship between lack of adequate water supply, sanitation, and hygiene conditions
and water-related diseases has been well documented. Tables C.1 and C.2 present death rates
and estimated DALY rates of water-related diseases, and they place Timor-Leste in an
international context. Unfortunately, due to lack of information the Tables only include diarrheal
diseases, malaria, and dengue. (There is information on trypanosomiasis, schistosomiasis,
lymphatic filariasis, and onchocerciasis but since these diseases were eradicated in the countries
selected for comparison, they are not included in the Tables.)
Table C.1. Death Rates* from All Causes and Water-related Diseases
Same Income Level High-Income Country Low-Income Country
Timor-Leste Lao PDR Sweden Sierra-Leone
GNI per capita(PPP) 2,000 (**) 2,050 35,070 850
All Causes (age-standarized) 1,490.4 1,627 429 2,892
Diarrhoeal diseases 19.1 98.5 0.6 271
Malaria 3.8 22.2 0 199
Dengue 0.3 3.3 0 0.1
Sources: World Health Report 2004, WHO and World Bank 2007b.
(*) Estimated deaths per 100,000 population by cause, and Member State, 2002.
(**) Data from CIA(2007) since this country is not covered in World Bank 2007b.
Table C.2. DALY Rates* from All Causes and Water-related Diseases
Same Income Level High-Income Countries Low-Income Country
Timor-Leste Lao PDR Sweden Sierra-Leone
GNI per capita(PPP) 2,000(**) 2,050 35,070 850
All Causes (age-standarized) 20,876 35,301 8,783 73,362
Diarrhoeal diseases 616.2 3,181.2 9 8,772
Malaria 124 832.3 0 7,146
Dengue 12 112.3 0 3
Sources: World Health Report 2004, WHO and World Bank 2007b.
(*) Estimated DALYs per 100,000 population by cause, and Member State, 2002.
(**) Data from CIA(2007) since this country is not covered in World Bank 2007b.
C.1 Mortality Cost
First, the total number of annual diarrheal deaths in children younger than 5 is estimated by
multiplying the percentage of diarrheal disease deaths over all-cause deaths from WHO sub-
region SEAR D for 2002 (revised data) by the number of deaths to those under 5 from Timor-
Leste national data. Since only a fraction of the total cases is attributable to substandard potable
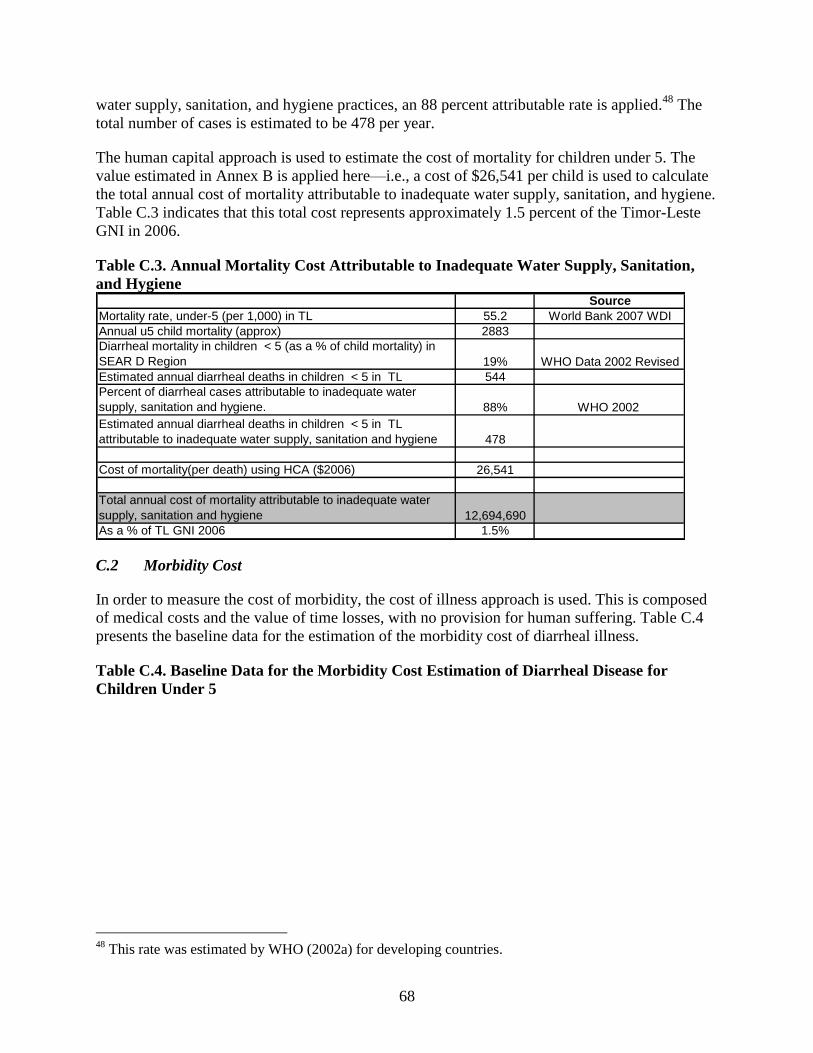
68
water supply, sanitation, and hygiene practices, an 88 percent attributable rate is applied.48
The
total number of cases is estimated to be 478 per year.
The human capital approach is used to estimate the cost of mortality for children under 5. The
value estimated in Annex B is applied here—i.e., a cost of $26,541 per child is used to calculate
the total annual cost of mortality attributable to inadequate water supply, sanitation, and hygiene.
Table C.3 indicates that this total cost represents approximately 1.5 percent of the Timor-Leste
GNI in 2006.
Table C.3. Annual Mortality Cost Attributable to Inadequate Water Supply, Sanitation,
and Hygiene Source
Mortality rate, under-5 (per 1,000) in TL 55.2 World Bank 2007 WDI
Annual u5 child mortality (approx) 2883
Diarrheal mortality in children < 5 (as a % of child mortality) in
SEAR D Region 19% WHO Data 2002 Revised
Estimated annual diarrheal deaths in children < 5 in TL 544
Percent of diarrheal cases attributable to inadequate water
supply, sanitation and hygiene. 88% WHO 2002
Estimated annual diarrheal deaths in children < 5 in TL
attributable to inadequate water supply, sanitation and hygiene 478
Cost of mortality(per death) using HCA ($2006) 26,541
Total annual cost of mortality attributable to inadequate water
supply, sanitation and hygiene 12,694,690
As a % of TL GNI 2006 1.5%
C.2 Morbidity Cost
In order to measure the cost of morbidity, the cost of illness approach is used. This is composed
of medical costs and the value of time losses, with no provision for human suffering. Table C.4
presents the baseline data for the estimation of the morbidity cost of diarrheal illness.
Table C.4. Baseline Data for the Morbidity Cost Estimation of Diarrheal Disease for
Children Under 5
48
This rate was estimated by WHO (2002a) for developing countries.
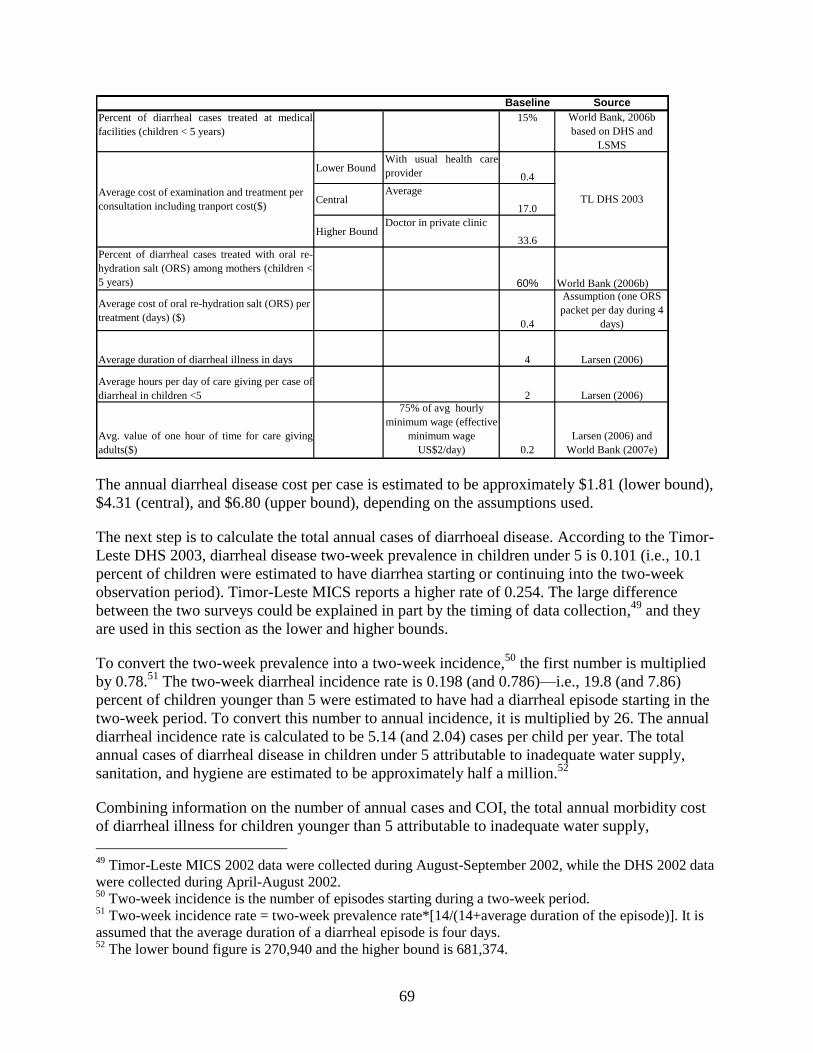
69
Baseline Source
Percent of diarrheal cases treated at medical
facilities (children < 5 years)
15% World Bank, 2006b
based on DHS and
LSMS
Lower BoundWith usual health care
provider 0.4
CentralAverage
17.0
Higher BoundDoctor in private clinic
33.6
Percent of diarrheal cases treated with oral re-
hydration salt (ORS) among mothers (children <
5 years) 60% World Bank (2006b)
Average cost of oral re-hydration salt (ORS) per
treatment (days) ($)0.4
Assumption (one ORS
packet per day during 4
days)
Average duration of diarrheal illness in days 4 Larsen (2006)
Average hours per day of care giving per case of
diarrheal in children <5 2 Larsen (2006)
Avg. value of one hour of time for care giving
adults($)
75% of avg hourly
minimum wage (effective
minimum wage
US$2/day) 0.2
Larsen (2006) and
World Bank (2007e)
Average cost of examination and treatment per
consultation including tranport cost($)TL DHS 2003
The annual diarrheal disease cost per case is estimated to be approximately $1.81 (lower bound),
$4.31 (central), and $6.80 (upper bound), depending on the assumptions used.
The next step is to calculate the total annual cases of diarrhoeal disease. According to the Timor-
Leste DHS 2003, diarrheal disease two-week prevalence in children under 5 is 0.101 (i.e., 10.1
percent of children were estimated to have diarrhea starting or continuing into the two-week
observation period). Timor-Leste MICS reports a higher rate of 0.254. The large difference
between the two surveys could be explained in part by the timing of data collection,49
and they
are used in this section as the lower and higher bounds.
To convert the two-week prevalence into a two-week incidence,50
the first number is multiplied
by 0.78.51
The two-week diarrheal incidence rate is 0.198 (and 0.786)—i.e., 19.8 (and 7.86)
percent of children younger than 5 were estimated to have had a diarrheal episode starting in the
two-week period. To convert this number to annual incidence, it is multiplied by 26. The annual
diarrheal incidence rate is calculated to be 5.14 (and 2.04) cases per child per year. The total
annual cases of diarrheal disease in children under 5 attributable to inadequate water supply,
sanitation, and hygiene are estimated to be approximately half a million.52
Combining information on the number of annual cases and COI, the total annual morbidity cost
of diarrheal illness for children younger than 5 attributable to inadequate water supply,
49
Timor-Leste MICS 2002 data were collected during August-September 2002, while the DHS 2002 data
were collected during April-August 2002. 50
Two-week incidence is the number of episodes starting during a two-week period. 51
Two-week incidence rate = two-week prevalence rate*[14/(14+average duration of the episode)]. It is
assumed that the average duration of a diarrheal episode is four days. 52
The lower bound figure is 270,940 and the higher bound is 681,374.
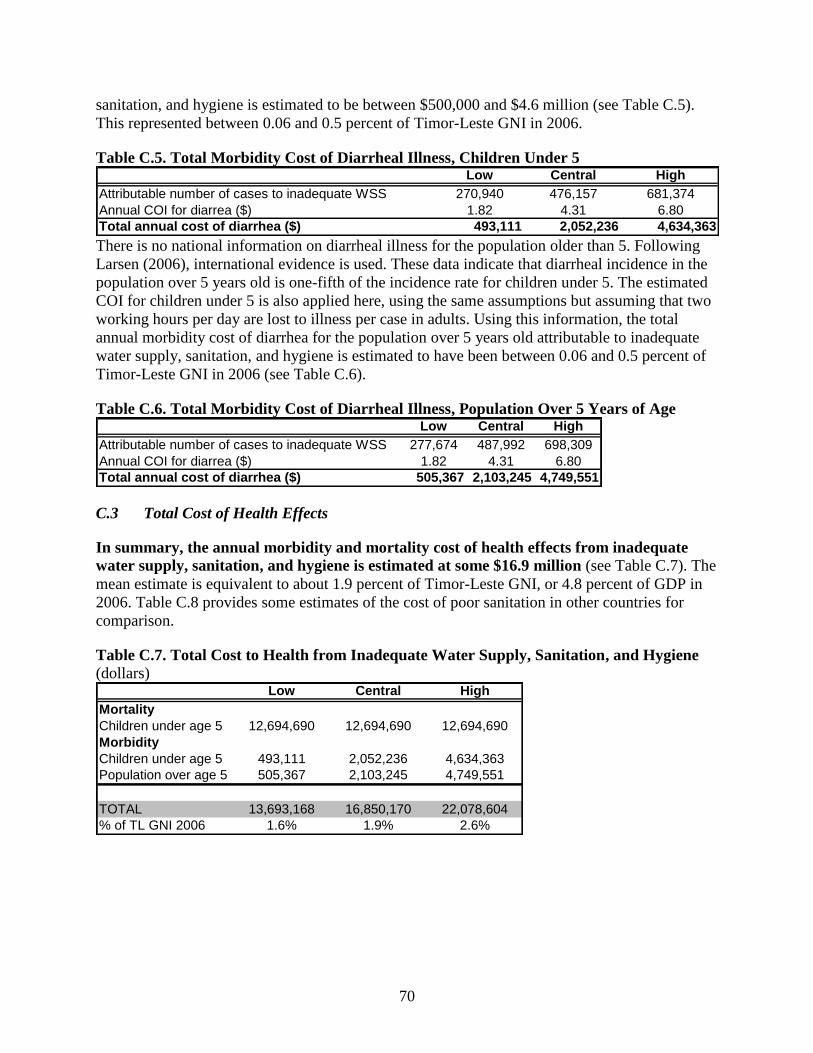
70
sanitation, and hygiene is estimated to be between $500,000 and $4.6 million (see Table C.5).
This represented between 0.06 and 0.5 percent of Timor-Leste GNI in 2006.
Table C.5. Total Morbidity Cost of Diarrheal Illness, Children Under 5 Low Central High
Attributable number of cases to inadequate WSS 270,940 476,157 681,374
Annual COI for diarrea ($) 1.82 4.31 6.80
Total annual cost of diarrhea ($) 493,111 2,052,236 4,634,363
There is no national information on diarrheal illness for the population older than 5. Following
Larsen (2006), international evidence is used. These data indicate that diarrheal incidence in the
population over 5 years old is one-fifth of the incidence rate for children under 5. The estimated
COI for children under 5 is also applied here, using the same assumptions but assuming that two
working hours per day are lost to illness per case in adults. Using this information, the total
annual morbidity cost of diarrhea for the population over 5 years old attributable to inadequate
water supply, sanitation, and hygiene is estimated to have been between 0.06 and 0.5 percent of
Timor-Leste GNI in 2006 (see Table C.6).
Table C.6. Total Morbidity Cost of Diarrheal Illness, Population Over 5 Years of Age Low Central High
Attributable number of cases to inadequate WSS 277,674 487,992 698,309
Annual COI for diarrea ($) 1.82 4.31 6.80
Total annual cost of diarrhea ($) 505,367 2,103,245 4,749,551
C.3 Total Cost of Health Effects
In summary, the annual morbidity and mortality cost of health effects from inadequate
water supply, sanitation, and hygiene is estimated at some $16.9 million (see Table C.7). The
mean estimate is equivalent to about 1.9 percent of Timor-Leste GNI, or 4.8 percent of GDP in
2006. Table C.8 provides some estimates of the cost of poor sanitation in other countries for
comparison.
Table C.7. Total Cost to Health from Inadequate Water Supply, Sanitation, and Hygiene
(dollars) Low Central High
Mortality
Children under age 5 12,694,690 12,694,690 12,694,690
Morbidity
Children under age 5 493,111 2,052,236 4,634,363
Population over age 5 505,367 2,103,245 4,749,551
TOTAL 13,693,168 16,850,170 22,078,604
% of TL GNI 2006 1.6% 1.9% 2.6%
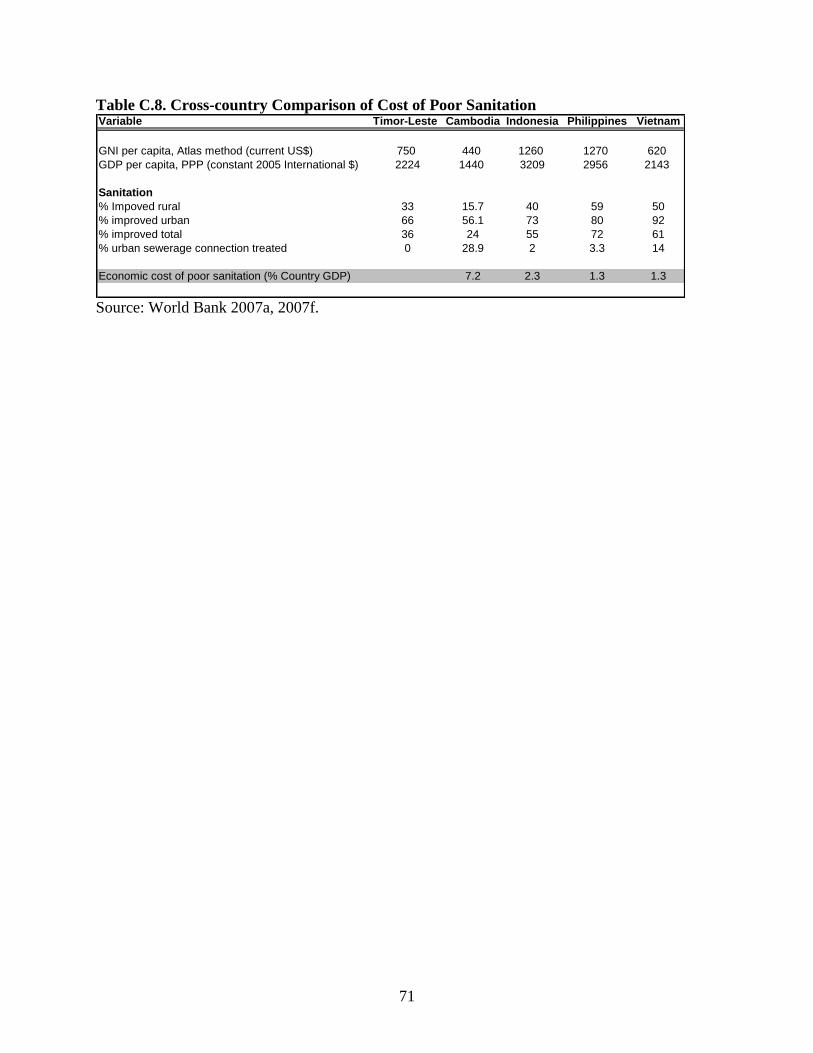
71
Table C.8. Cross-country Comparison of Cost of Poor Sanitation Variable Timor-Leste Cambodia Indonesia Philippines Vietnam
GNI per capita, Atlas method (current US$) 750 440 1260 1270 620
GDP per capita, PPP (constant 2005 International $) 2224 1440 3209 2956 2143
Sanitation
% Impoved rural 33 15.7 40 59 50
% improved urban 66 56.1 73 80 92
% improved total 36 24 55 72 61
% urban sewerage connection treated 0 28.9 2 3.3 14
Economic cost of poor sanitation (% Country GDP) 7.2 2.3 1.3 1.3
Source: World Bank 2007a, 2007f.
72
Annex D: Land Management Survey
The land management survey was conceived as an extension of the Timor Leste Survey of
Living Standards (TLSLS) carried out in 2007. The TLSLS collected detailed household living
standards data from a nationally representative sample. This survey contained a brief section on
agricultural plots managed by the households. However, it did not collect land management
practice data.
The extension to TLSLS allowed detailed data collection aimed at meeting needs of diverse areas
of research, such as finance, vulnerability, justice, and land management. The land management
module of the extension focused on plot and forest clearing practices, long-term land
management, and investment practices. The extension also looked at the extent of the Siam weed
infestation at the plot level and various coping strategies. The design of the extension survey
followed the original survey closely. A nationally representative random subset of households in
the original sample was selected to be visited again for the extension. This survey design method
allowed the merging of household-level data from the original survey with that from the
extension for a richer analysis.
The first round of the extension survey took place in May-August 2008 and collected data from
1,559 households previously surveyed in the TLSLS from 13 districts. Initial review of the data
indicated errors in the data collection. As a result, the complete survey was implemented to about
300 additional households in the districts where errors had been uncovered. The field work was
undertaken by the end of 2008. This analysis uses data from both the original and the
replacement households.
The land management module was initially intended to collect very detailed information on
specific types of land management practices. Some of the details were lost in the translation
during the implementation of the survey. Preliminary analysis showed that respondents tended to
answer one way or the other for broad groups of land management questions. Thus, it was
concluded that the respondents grasped a variety of land management practices, such as crop
rotation and crop residue management, but details of specific methods of these practices may
have been lost in translation. To compensate for these difficulties, the data from related practices
were aggregated. For example, detailed information about improved fallow, stripped fallow, and
fallowing of whole plots were aggregated to indicate whether households practiced any type of
fallowing.
The survey included both urban and rural households. About 75 percent of the population in the
country is rural. Preliminary analysis indicated that both urban and rural households were
involved in agriculture and actively managed agricultural plots. As a result, this study uses all the
households in the sample, though different weights were used for urban and rural households to
account for their representativeness in the national population.
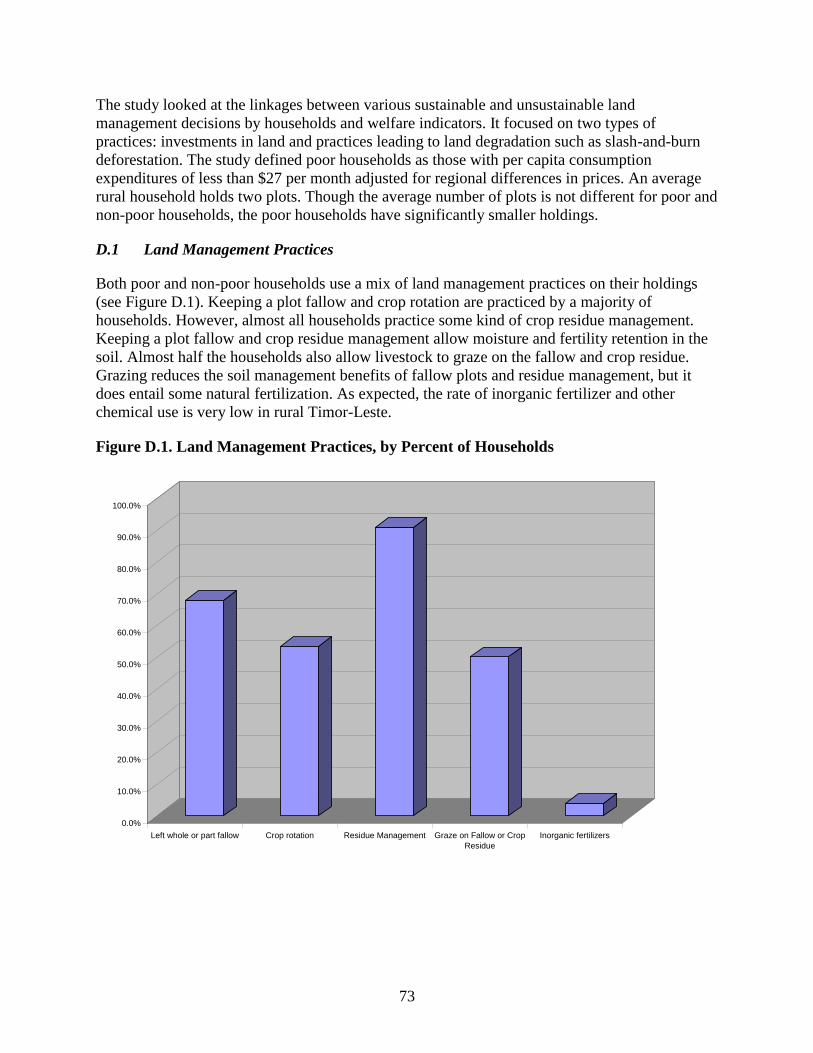
73
The study looked at the linkages between various sustainable and unsustainable land
management decisions by households and welfare indicators. It focused on two types of
practices: investments in land and practices leading to land degradation such as slash-and-burn
deforestation. The study defined poor households as those with per capita consumption
expenditures of less than $27 per month adjusted for regional differences in prices. An average
rural household holds two plots. Though the average number of plots is not different for poor and
non-poor households, the poor households have significantly smaller holdings.
D.1 Land Management Practices
Both poor and non-poor households use a mix of land management practices on their holdings
(see Figure D.1). Keeping a plot fallow and crop rotation are practiced by a majority of
households. However, almost all households practice some kind of crop residue management.
Keeping a plot fallow and crop residue management allow moisture and fertility retention in the
soil. Almost half the households also allow livestock to graze on the fallow and crop residue.
Grazing reduces the soil management benefits of fallow plots and residue management, but it
does entail some natural fertilization. As expected, the rate of inorganic fertilizer and other
chemical use is very low in rural Timor-Leste.
Figure D.1. Land Management Practices, by Percent of Households
0.0%
10.0%
20.0%
30.0%
40.0%
50.0%
60.0%
70.0%
80.0%
90.0%
100.0%
Left whole or part fallow Crop rotation Residue Management Graze on Fallow or Crop
Residue
Inorganic fertilizers
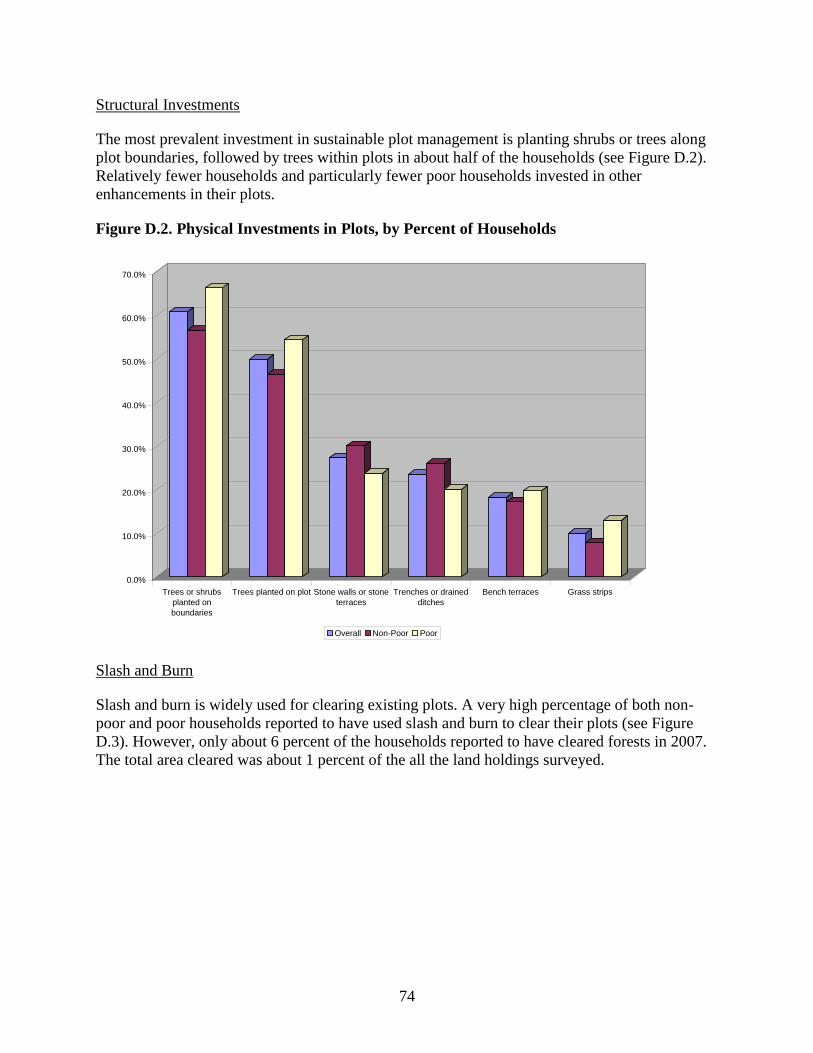
74
Structural Investments
The most prevalent investment in sustainable plot management is planting shrubs or trees along
plot boundaries, followed by trees within plots in about half of the households (see Figure D.2).
Relatively fewer households and particularly fewer poor households invested in other
enhancements in their plots.
Figure D.2. Physical Investments in Plots, by Percent of Households
0.0%
10.0%
20.0%
30.0%
40.0%
50.0%
60.0%
70.0%
Trees or shrubs
planted on
boundaries
Trees planted on plot Stone walls or stone
terraces
Trenches or drained
ditches
Bench terraces Grass strips
Overall Non-Poor Poor
Slash and Burn
Slash and burn is widely used for clearing existing plots. A very high percentage of both non-
poor and poor households reported to have used slash and burn to clear their plots (see Figure
D.3). However, only about 6 percent of the households reported to have cleared forests in 2007.
The total area cleared was about 1 percent of the all the land holdings surveyed.
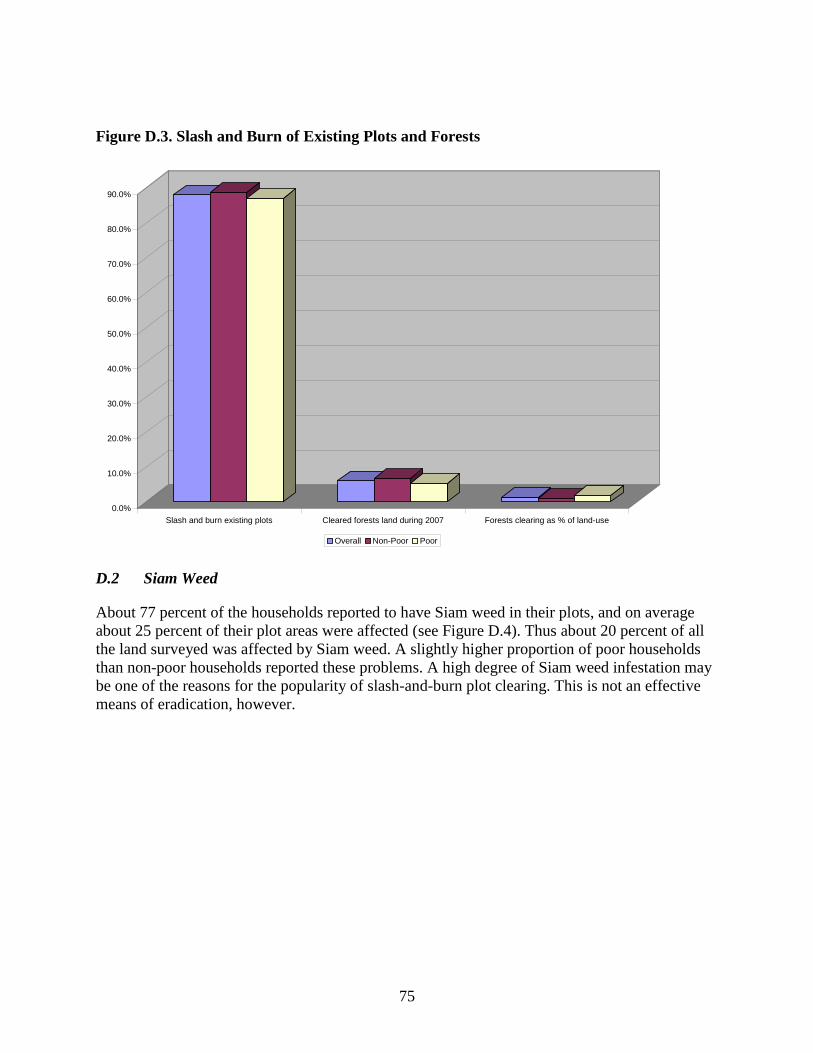
75
Figure D.3. Slash and Burn of Existing Plots and Forests
0.0%
10.0%
20.0%
30.0%
40.0%
50.0%
60.0%
70.0%
80.0%
90.0%
Slash and burn existing plots Cleared forests land during 2007 Forests clearing as % of land-use
Overall Non-Poor Poor
D.2 Siam Weed
About 77 percent of the households reported to have Siam weed in their plots, and on average
about 25 percent of their plot areas were affected (see Figure D.4). Thus about 20 percent of all
the land surveyed was affected by Siam weed. A slightly higher proportion of poor households
than non-poor households reported these problems. A high degree of Siam weed infestation may
be one of the reasons for the popularity of slash-and-burn plot clearing. This is not an effective
means of eradication, however.
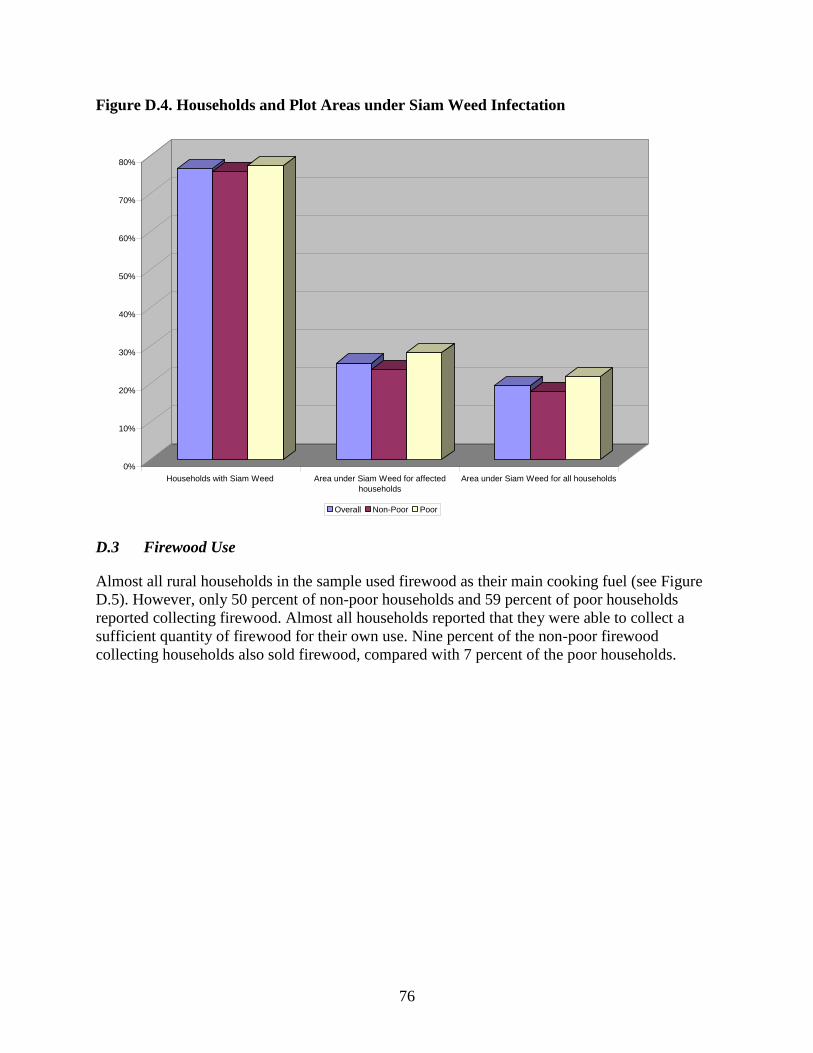
76
Figure D.4. Households and Plot Areas under Siam Weed Infectation
0%
10%
20%
30%
40%
50%
60%
70%
80%
Households with Siam Weed Area under Siam Weed for affected
households
Area under Siam Weed for all households
Overall Non-Poor Poor
D.3 Firewood Use
Almost all rural households in the sample used firewood as their main cooking fuel (see Figure
D.5). However, only 50 percent of non-poor households and 59 percent of poor households
reported collecting firewood. Almost all households reported that they were able to collect a
sufficient quantity of firewood for their own use. Nine percent of the non-poor firewood
collecting households also sold firewood, compared with 7 percent of the poor households.
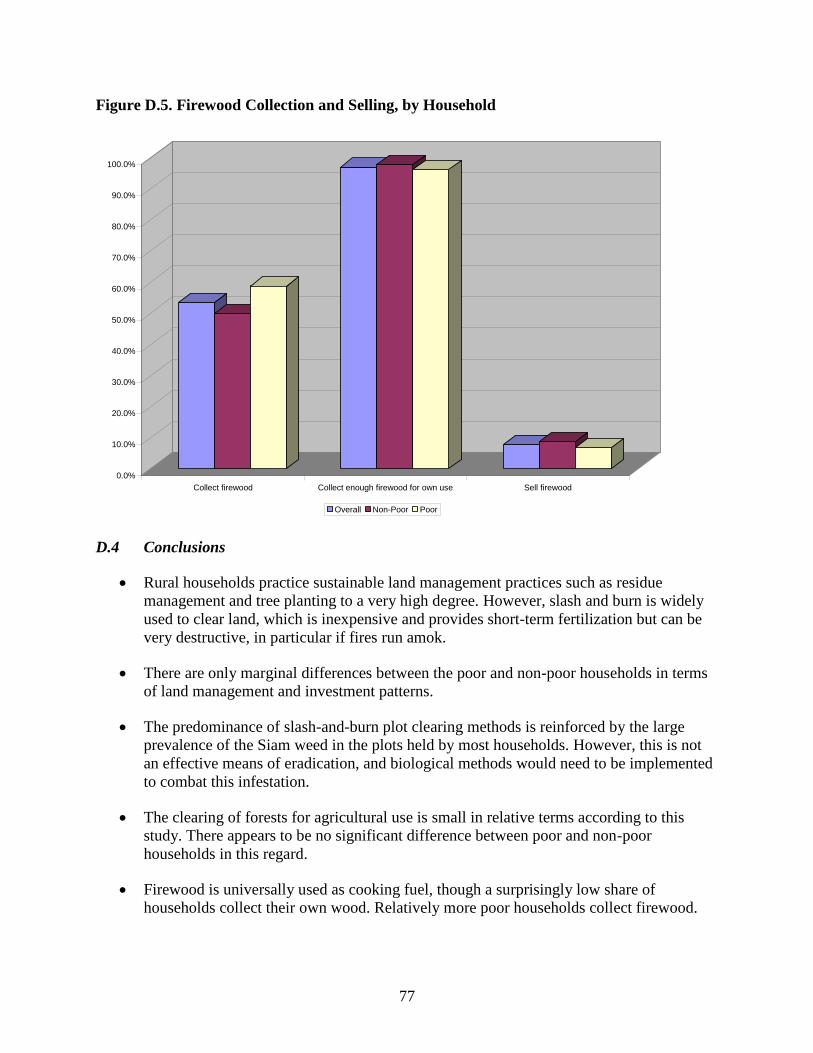
77
Figure D.5. Firewood Collection and Selling, by Household
0.0%
10.0%
20.0%
30.0%
40.0%
50.0%
60.0%
70.0%
80.0%
90.0%
100.0%
Collect firewood Collect enough firewood for own use Sell firewood
Overall Non-Poor Poor
D.4 Conclusions
Rural households practice sustainable land management practices such as residue
management and tree planting to a very high degree. However, slash and burn is widely
used to clear land, which is inexpensive and provides short-term fertilization but can be
very destructive, in particular if fires run amok.
There are only marginal differences between the poor and non-poor households in terms
of land management and investment patterns.
The predominance of slash-and-burn plot clearing methods is reinforced by the large
prevalence of the Siam weed in the plots held by most households. However, this is not
an effective means of eradication, and biological methods would need to be implemented
to combat this infestation.
The clearing of forests for agricultural use is small in relative terms according to this
study. There appears to be no significant difference between poor and non-poor
households in this regard.
Firewood is universally used as cooking fuel, though a surprisingly low share of
households collect their own wood. Relatively more poor households collect firewood.
78
Annex E: National Development Planning
This annex describes the National Priority (NP) areas identified by the six National Priorities
Working Groups that became fully operational in June and the investment programs prepared to
set detailed policies by the previous government.
The government’s National Priorities 2009 are grouped into seven areas: agriculture and food
security, rural development, human resources development, social protection and social services
(including health), security and public safety, clean and effective government, and access to
justice.
Agriculture and Food Security. This NP area is co-led by the Ministry of Agriculture and the
Ministry of Commerce, Tourism and Industry. For its primary goal of boosting food production,
the government sets out to increase the area under paddy cultivation and the second paddy crop,
along with a higher percentage of high-yielding seeds, agricultural mechanization, and crop
intensification systems delivered by trained extension workers.
Rural Development. Jointly led by the Ministry of Economy and Development and the Ministry
of Infrastructure, this NP area undertakes to alleviate poverty through both the promotion of
business initiatives and the improvement of infrastructure targeted for rural development, mainly
focused on the promotion of agribusiness.
Human Resources Development. This NP priority area has three distinct targets: improve the
quality of basic and technical professional education; prepare young people for the labor market,
and ensure participation of young people, under the joint leadership of the Ministry of Education,
the Secretary of State for Vocational Training and Employment, and the Secretary of State for
Youth and Sports.
Social Protection and Social Services. This priority area is led by the Ministry of Social
Solidarity and the Ministry of Health. Continued emphasis is placed on the sustainable
reintegration of internally displaced persons (IDPs) through delivering relocation assistance,
including recovery packages for IDPs, and the completion of an exit strategy for IDPs in
transitional shelters. Social stabilization programs in conflict-prone communities will be run by a
dedicated Ministry of Social Solidarity peace building unit. A multi-pronged approach will be
used to protect vulnerable groups.
Security and Public Safety. This NP area is jointly led by the Secretary of State for Defense and
the Secretary of State for Security. Establishing an overarching reform framework for the Timor-
Leste Defense Force and the Policia Nacional de Timor-Leste has highest priority. This will be
79
accomplished through submission of a revised National Security Policy to the Council of
Ministers, as well as drafts of a National Security Law and an Internal Security Law. Drafting of
a Maritime Strategy with a model integrated maritime administration is intended to promote this
reform framework.
Clean and Effective Government. Under the leadership of the Ministry of Finance, continued
emphasis will be placed on aid effectiveness as an objective to harmonize official development
assistance with government priorities. Government accountability, transparency, and integrity
will be promoted through improved government efficiency and transparency in handling funds as
well as an Expenditure Review Unit with trained staff. A performance budgeting module will be
introduced for the FY 2010 budget preparations.
Access to Justice. This important new NP segment is led by the Ministry of Justice, in
cooperation with the General Prosecutor’s Office and the Office of the President of the Court of
Appeal. Three distinct priority areas are foreseen in order to realize access to justice, including
for vulnerable groups: strengthening the justice system, bringing justice to citizens, and
promoting private sector development. A policy on gender justice will be developed for
implementation. The Ministry of Justice will promote private sector development through
implementation of land and property registration (as land laws and Properties Registry Code
package solution) as well as through proposals and recommendations from an expert Working
Group that are approved and implemented.
The main focus areas for the different sectors can be described based on the State of the Nation
Report for Natural Resources and the Environment Sector (GoTL 2008b) and on Sector
Investment Programs (SIPs) elaborated by the previous government.
SIPs were prepared as action plans by the previous government. Subsequent to the
preparation of the National Development Plan (NDP), the government recognized the need for a
mechanism by which the longer-term goals and aspirations of the nation could be translated into
action. By mid-2005, a total of 17 individual SIPs were prepared to set detailed policies,
programs, and expenditure requirements for each sector for the period FY2005/06 to FY2009/10
(GoTL 2006a).
The SIP for the natural resources and environment sector and for the agriculture, forestry,
and fisheries sector are the two most relevant action plans for environmental issues. The
SIP on natural resources and the environment (GoTL 2006c) describes four priority themes:
capacity building (there is still a very serious shortage of trained individuals with the necessary
knowledge and technical and managerial skills in each of these sectors); further development of
institutional capacities; building a better understanding of the resource base of the country (the
development of appropriate plans, policies, and legislation ultimately relies on reliable,
comprehensive, and up-to-date information); and enabling the environment for the private
investment (this will be needed for commercial development of natural resources in a sustainable
manner).
The SIP for the agriculture, forestry, and fisheries sector (GoTL 2006d) includes the Policy and
Strategic Framework for the sector developed by the Ministry of Agriculture, Forestry, and
Fisheries (currently the Ministry of Agriculture and Fisheries). The agriculture and livestock
80
sector continues to be the most important source of livelihood for the majority of the population
of Timor-Leste and therefore it makes an important contribution to the objectives of the NDP
and the Millennium Development Goals. The plans for the sub-sector include measures to
increase food production, improve food quality, improve animal production, support the
development of agricultural industries for domestic and export markets, design effective
agricultural planning based on improved data, provide an appropriate legislative and regulatory
framework, and increase the amount and quality of information services to farmers.
The forestry sector policy was approved by the government in 2007. The purpose of the
community forestry policy is to operationalize the government’s agenda for
decentralization and devolution of authority for the management of natural resources to
lower levels of government and to civil society. It will enable, rather than enforce, rural
communities to improve their livelihoods and the condition of the forests in their vicinity by
removing any constraints that inhibit them from doing so. Government agencies and other
service providers will adopt a supportive and facilitative role to support communities in these
efforts. There are two categories of forests for community management. All traditional
community lands (rai adat) can be allocated to communities for community forestry
management to the extent that communities are able and willing to carry out sustainable forest
management; and communities can make application for public land (rai estado) to be allocated
for community forest management if they can demonstrate that they can carry out sustainable
forest management (FAO 2007b).
The 2008–2010 development plan includes a reforestation and a capacity building
program. The plan includes the creation of tree nurseries with trees for domestic use, trees for
human and environmental rehabilitation, and trees for commercial use in all districts, but with a
particular focus on dry/arid and waste lands. The program also includes capacity building for
foresters, the creation and protection of Forest Centers supported by the creation of adequate
legislation, and civic education programs (GoTL 2008b).
The National Department of Fisheries and Aquaculture has focused its plan on improving
information and on creating a monitoring system. The plan aims to: continue institutional
capacity building, including policy and legislative development; enhance the capacity of staff to
undertake their core functions; gather data to determine sustainable production levels for fish
resources and to base local and national management planning to maintain a healthy marine
environment; work with coastal communities to develop effective inshore/near-shore catch
monitoring systems; encourage and facilitate private sector investments, first in an offshore
fishery and second in better facilities for storage, processing, and distribution of local fish
supplies; and implement regulatory measures and enforcement (GoTL 2006d).
The water and sanitation sector considers that adequate land use, sanitation, and other
pollution prevention measures need to be adopted to protect the environment (GoTL
2006e). The primary sector key results areas are: adequate, safe, and sustainable water supplies;
safe disposal of sewerage and wastewater in urban areas; the collection and safe disposal of
nuisance surface waters from major urban areas; the collection and safe disposal of solid and
hazardous wastes from major urban areas; management of water resources for the purpose of
water supply and sanitation in cooperation with other relevant ministries; and adoption of safe
81
water supply and sanitation practices that contribute to improved human health and
environmental protection.
The main policy objective of the energy sector is to gradually substitute imported with
indigenous energy resources, including renewable energy. The strategy for the sector is less
clear since further evaluation and assessment of the alternative sources are needed.
In the mining sector, the government plans to develop geological information and
institutional capacity and to draft regulations for mining. The mining sector in Timor-Leste
is currently restricted to sand and gravel operations. An inventory of the on-shore potential for
Timor-Leste was carried out in 2002–03 (UNESCAP 2003) to improve the information on
mineral reserves. The inventory suggested that a limited number of larger-scale operations may
develop, but it also indicated that there is some potential for mineral extraction in relatively
small-scale mining projects.