timor-leste - home | food and agriculture organization of ... · fra 2015 – country report,...
TRANSCRIPT
Timor-Leste
GLOBAL FOREST RESOURCES ASSESSMENT 2015
COUNTRY REPORT
Rome, 2014
FAO, at the request of its member countries, regularly monitors the world´s forests and theirmanagement and uses through the Global Forest Resources Assessment (FRA). This country reportis prepared as a contribution to the FAO publication, the Global Forest Resources Assessment 2015(FRA 2015).The content and the structure are in accordance with the recommendations and guidelines given byFAO in the document Guide for country reporting for FRA 2015 (http://www.fao.org/3/a-au190e.pdf).These reports were submitted to FAO as official government documents.
The content and the views expressed in this report are the responsibility of the entity submitting thereport to FAO. FAO may not be held responsible for the use which may be made of the informationcontained in this report.

FRA 2015 – Country Report, Timor-Leste
3
TABLE OF CONTENTSReport preparation and contact persons...............................................................................................................................41. What is the area of forest and other wooded land and how has it changed over time? ................................................. 62. What is the area of natural and planted forest and how has it changed over time? ..................................................... 163. What are the stocks and growth rates of the forests and how have they changed? .....................................................214. What is the status of forest production and how has it changed over time? .................................................................275. How much forest area is managed for protection of soil and water and ecosystem services? ..................................... 336. How much forest area is protected and designated for the conservation of biodiversity and how has it changed overtime? ................................................................................................................................................................................... 397. What is the area of forest affected by woody invasive species? .................................................................................. 438. How much forest area is damaged each year? ............................................................................................................ 469. What is the forest area with reduced canopy cover? ....................................................................................................5010. What forest policy and regulatory framework exists to support implementation of sustainable forest managementSFM? .................................................................................................................................................................................. 5111. Is there a national platform that promotes stakeholder participation in forest policy development? ............................ 5312. What is the forest area intended to be in permanent forest land use and how has it changed over time? .................. 5413. How does your country measure and report progress towards SFM at the national level? ........................................ 5714. What is the area of forest under a forest management plan and how is this monitored? ........................................... 5915. How are stakeholders involved in the management decision making for publicly owned forests? .............................. 6116. What is the area of forest under an independently verified forest certification scheme? .............................................6217. How much money do governments collect from and spend on forests? .....................................................................6418. Who owns and manages the forests and how has this changed? ..............................................................................6619. How many people are directly employed in forestry? ................................................................................................. 7120. What is the contribution of forestry to Gross Domestic Product (GDP)? .................................................................... 7321. What is forest area likely to be in the future ...............................................................................................................74

FRA 2015 – Country Report, Timor-Leste
4
Report preparation and contact personsContact personsThe present report was prepared by the following person(s)
Name (FAMILYNAME, first name)
Institution/address Email Tables
DESK STUDY N/A N/A N/A
N/A N/A N/A N/A
N/A N/A N/A N/A
N/A N/A N/A N/A
Introductory TextPlace an introductory text on the content of this report
No report has been received from the country. This report is the result of a desk study prepared by theFRA secretariat in Rome, which is based on the existing available information using the establishedformat for FRA 2015/CFRQ format
The independent Democratic Republic of Timor-Leste was established in May 2002. Prior to this Timor-Lestewas under the United Nations Transitional Administration in East Timor\ (UNTAET, October 1999-May 2002)
and under the administration of the Republic of Indonesia (1975 to 1999) and Portugal (16 th century-1975).The violent historical and political events associated with the establishment of independence resulted in thetotal destruction of the majority of infrastructure, the administration and associated resources within Timor-Leste. Thus, much historical information and data of the state of the forests was destroyed and is no longerreliably or consistently available.
Further, the current state of the forests of Timor-Leste is also unknown as there has been no recent nationalforest resource inventory and the establishment of forestry data collection process in Timor–Leste is still in itsdevelopment stage. Various forest data have been collected by various groups since 2000 but the overall valueof this data is limited due to the ad hoc nature of its collection (e.g. lack of coordination and collaboration).
The Government groups responsible for forest data collection are now established. Within the State Secretaryfor Agriculture and Arboriculture of the Ministry of Agriculture and Fisheries, there are two areas responsiblefor the collection of agriculture and forest data. These are the Agriculture and Land-use Geographic InformationSystem (ALGIS) Unit, under the National Directorate of Policy Formulation and Planning directly under theMinister for MAF; and the National Directorate of Forestry (NDF). ALGIS is establishing a spatial informationdatabase for the storage and management of spatial data, the production of maps etc. Within NDF variousDivisions (principally the Forest Inventory, Policy and Planning Unit, FIPPU) collect technical field data. Todate there is no established consistent methodology for data collection, no validation process and no informationdatabase for non-spatial data storage and management.

FRA 2015 – Country Report, Timor-Leste
5
Preparation of a national inventory of forest resources is a major priority under the National Directorate ofForestry Sector Investment Program (SIP) in which the priorities for funding are outlined by the governmentof RDTL for donor investment. Activities undertaken to date by the ALGIS and NDF FIPP Units include thepreparation of a national land-use map, survey of sandalwood resources in specific areas and a compilation ofdata collected from various sources.
To date, there are no consistent and agreed land and vegetation classification systems in Timor-Leste.Terminologies in use are inconsistent and often borrowed from other sources.
This limits the ability to accurately fulfill reporting requirements for the FRA. The data from
JICA 2002 (i.e. Indonesia 1997 data) is inconsistent with sheet of “Luas Penyebaran”. It is not clear how theyextrapolated their figures from JICA report.
Desk Study?
Check "yes" if this survey is a Desk Study, "no" otherwise
Desk Study? yes
FRA 2015 – Country Report, Timor-Leste
6
1. What is the area of forest and other wooded land and how has it changed over time?Documents for this question:
• Guide for country reporting FRA 2015• FRA 2015 Terms and Definitions
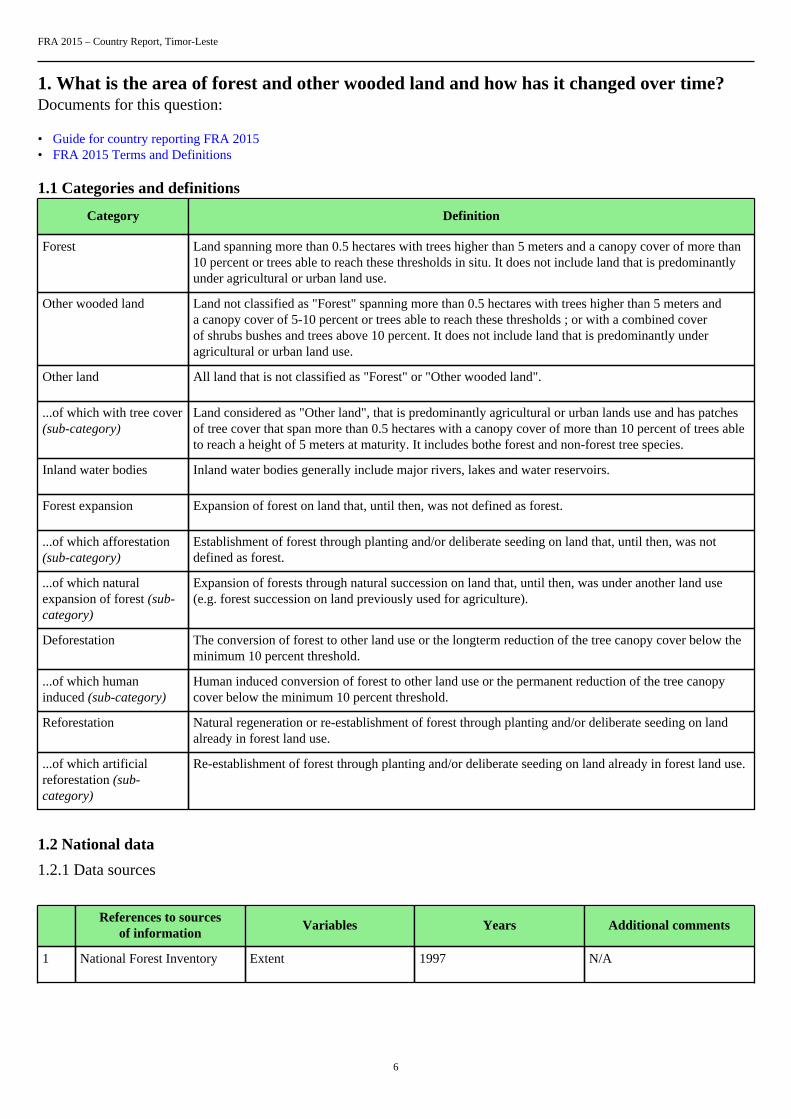
1.1 Categories and definitions
Category Definition
Forest Land spanning more than 0.5 hectares with trees higher than 5 meters and a canopy cover of more than10 percent or trees able to reach these thresholds in situ. It does not include land that is predominantlyunder agricultural or urban land use.
Other wooded land Land not classified as "Forest" spanning more than 0.5 hectares with trees higher than 5 meters anda canopy cover of 5-10 percent or trees able to reach these thresholds ; or with a combined coverof shrubs bushes and trees above 10 percent. It does not include land that is predominantly underagricultural or urban land use.
Other land All land that is not classified as "Forest" or "Other wooded land".
...of which with tree cover(sub-category)
Land considered as "Other land", that is predominantly agricultural or urban lands use and has patchesof tree cover that span more than 0.5 hectares with a canopy cover of more than 10 percent of trees ableto reach a height of 5 meters at maturity. It includes bothe forest and non-forest tree species.
Inland water bodies Inland water bodies generally include major rivers, lakes and water reservoirs.
Forest expansion Expansion of forest on land that, until then, was not defined as forest.
...of which afforestation(sub-category)
Establishment of forest through planting and/or deliberate seeding on land that, until then, was notdefined as forest.
...of which naturalexpansion of forest (sub-category)
Expansion of forests through natural succession on land that, until then, was under another land use(e.g. forest succession on land previously used for agriculture).
Deforestation The conversion of forest to other land use or the longterm reduction of the tree canopy cover below theminimum 10 percent threshold.
...of which humaninduced (sub-category)
Human induced conversion of forest to other land use or the permanent reduction of the tree canopycover below the minimum 10 percent threshold.
Reforestation Natural regeneration or re-establishment of forest through planting and/or deliberate seeding on landalready in forest land use.
...of which artificialreforestation (sub-category)
Re-establishment of forest through planting and/or deliberate seeding on land already in forest land use.
1.2 National data
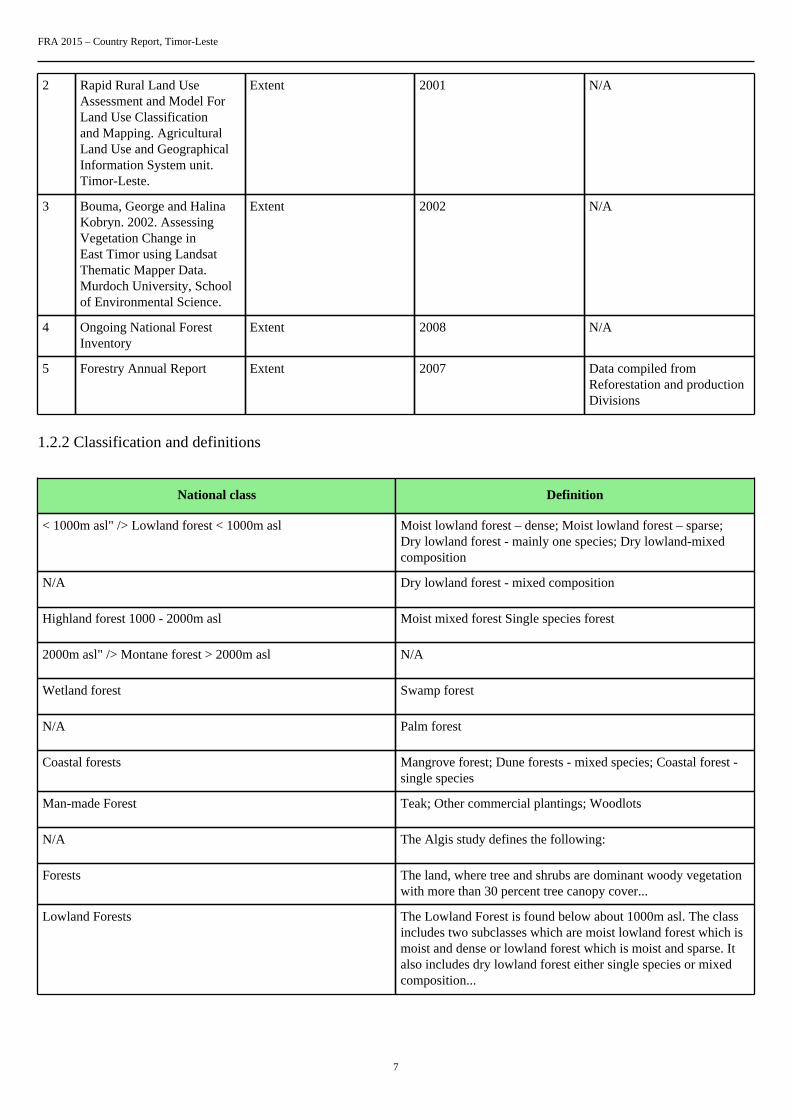
1.2.1 Data sources
References to sourcesof information
Variables Years Additional comments
1 National Forest Inventory Extent 1997 N/A
FRA 2015 – Country Report, Timor-Leste
7
2 Rapid Rural Land UseAssessment and Model ForLand Use Classificationand Mapping. AgriculturalLand Use and GeographicalInformation System unit.Timor-Leste.
Extent 2001 N/A
3 Bouma, George and HalinaKobryn. 2002. AssessingVegetation Change inEast Timor using LandsatThematic Mapper Data.Murdoch University, Schoolof Environmental Science.
Extent 2002 N/A
4 Ongoing National ForestInventory
Extent 2008 N/A
5 Forestry Annual Report Extent 2007 Data compiled fromReforestation and productionDivisions
1.2.2 Classification and definitions
National class Definition
< 1000m asl" /> Lowland forest < 1000m asl Moist lowland forest – dense; Moist lowland forest – sparse;Dry lowland forest - mainly one species; Dry lowland-mixedcomposition
N/A Dry lowland forest - mixed composition
Highland forest 1000 - 2000m asl Moist mixed forest Single species forest
2000m asl" /> Montane forest > 2000m asl N/A
Wetland forest Swamp forest
N/A Palm forest
Coastal forests Mangrove forest; Dune forests - mixed species; Coastal forest -single species
Man-made Forest Teak; Other commercial plantings; Woodlots
N/A The Algis study defines the following:
Forests The land, where tree and shrubs are dominant woody vegetationwith more than 30 percent tree canopy cover...
Lowland Forests The Lowland Forest is found below about 1000m asl. The classincludes two subclasses which are moist lowland forest which ismoist and dense or lowland forest which is moist and sparse. Italso includes dry lowland forest either single species or mixedcomposition...

FRA 2015 – Country Report, Timor-Leste
8
Highland Forests The Highland forests are found between 1000 - 2000m asl.Identification is possible for highland forest areas based oncontour data but it is more difficult to distinguish between moistmixed and single species forest given the resolution factor of25m available from the image.
Montane forests The Montane forests are found at levels of greater than 2000masl.
Wetland Forests The Wetland forests are identified with drainage and slope.Normally flat poorly drained lowland areas or basin type featureswill contain wetland vegetation and/or related land uses
Coastal forests The Coastal forests includes three subclasses Mangrove forest(ii) Dune forest and (ii) Coastal forest (single species)
Manmade Forests The Manmade forest have been classified into (i) Teak forest,(ii) other Commercial plantings and (iii) Woodlots. In TimorLorosa’e, these plantings cover such small areas. Teak has beenplanted along roadways (up to 100 metres on either side) to thesouthwest of Viqueque as well as in many other areas primarilyin logged out areas.
1.2.3 Original data
Forest area
a. For 2000
Land Use Class Hectares
Coastal Forest 19,709
Coastal Forest-Mangroves 1,802
High land Forest-Moist Mixed 65,103
High Land Forest-Single Species 2,356
Dry Lowland Forest-Single Species 135,720
Moist Lowland Forest-Sparse 174,992
Moist Lowland Forest-Dense 261,694
Dry Lowland Forest-Mixed 189,080
Montane Forest 2,611
Wetland Forest-Swamp 269
Man Made Forest 918
FRA 2015 – Country Report, Timor-Leste
9
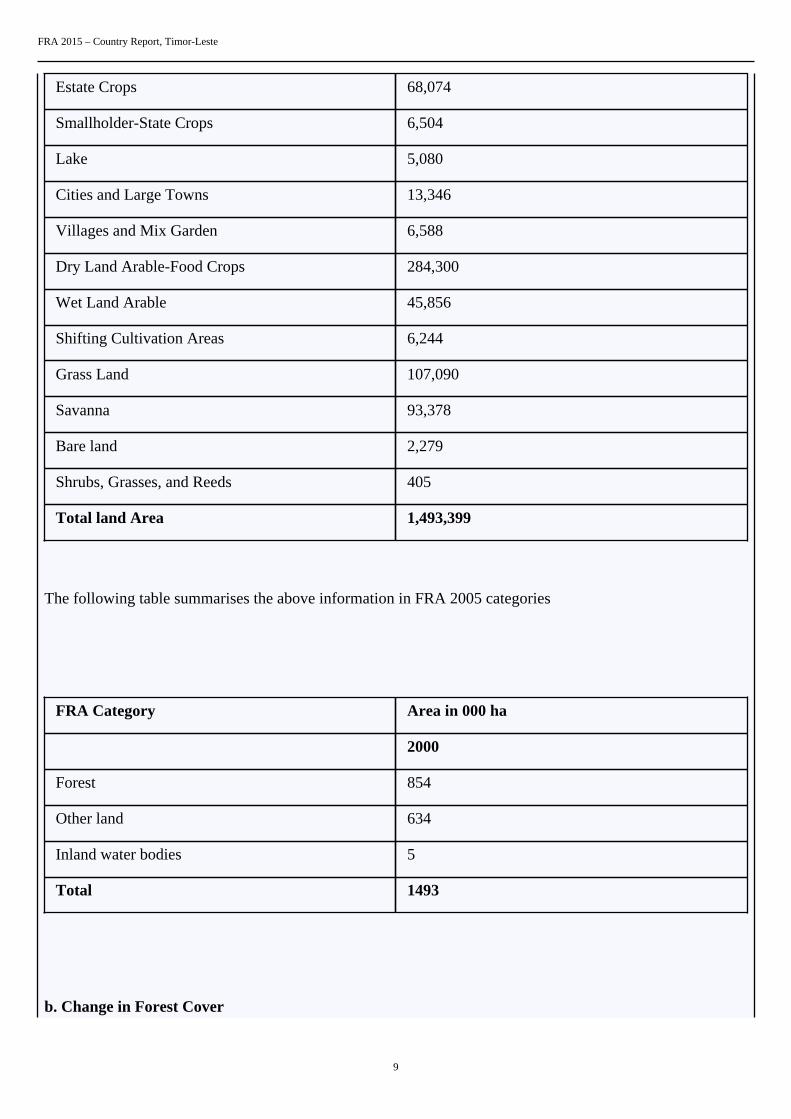
Estate Crops 68,074
Smallholder-State Crops 6,504
Lake 5,080
Cities and Large Towns 13,346
Villages and Mix Garden 6,588
Dry Land Arable-Food Crops 284,300
Wet Land Arable 45,856
Shifting Cultivation Areas 6,244
Grass Land 107,090
Savanna 93,378
Bare land 2,279
Shrubs, Grasses, and Reeds 405
Total land Area 1,493,399
The following table summarises the above information in FRA 2005 categories
FRA Category Area in 000 ha
2000
Forest 854
Other land 634
Inland water bodies 5
Total 1493
b. Change in Forest Cover
FRA 2015 – Country Report, Timor-Leste
10
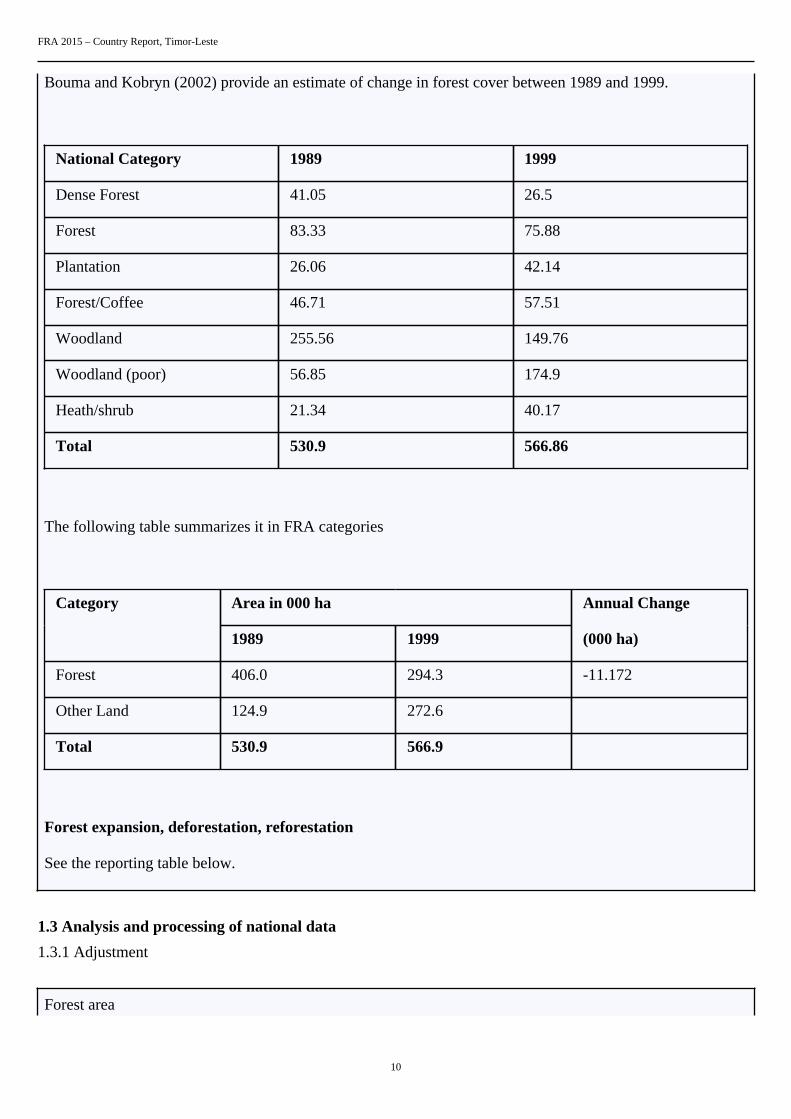
Bouma and Kobryn (2002) provide an estimate of change in forest cover between 1989 and 1999.
National Category 1989 1999
Dense Forest 41.05 26.5
Forest 83.33 75.88
Plantation 26.06 42.14
Forest/Coffee 46.71 57.51
Woodland 255.56 149.76
Woodland (poor) 56.85 174.9
Heath/shrub 21.34 40.17
Total 530.9 566.86
The following table summarizes it in FRA categories
Area in 000 haCategory
1989 1999
Annual Change
(000 ha)
Forest 406.0 294.3 -11.172
Other Land 124.9 272.6
Total 530.9 566.9
Forest expansion, deforestation, reforestation
See the reporting table below.
1.3 Analysis and processing of national data
1.3.1 Adjustment
Forest area
FRA 2015 – Country Report, Timor-Leste
11
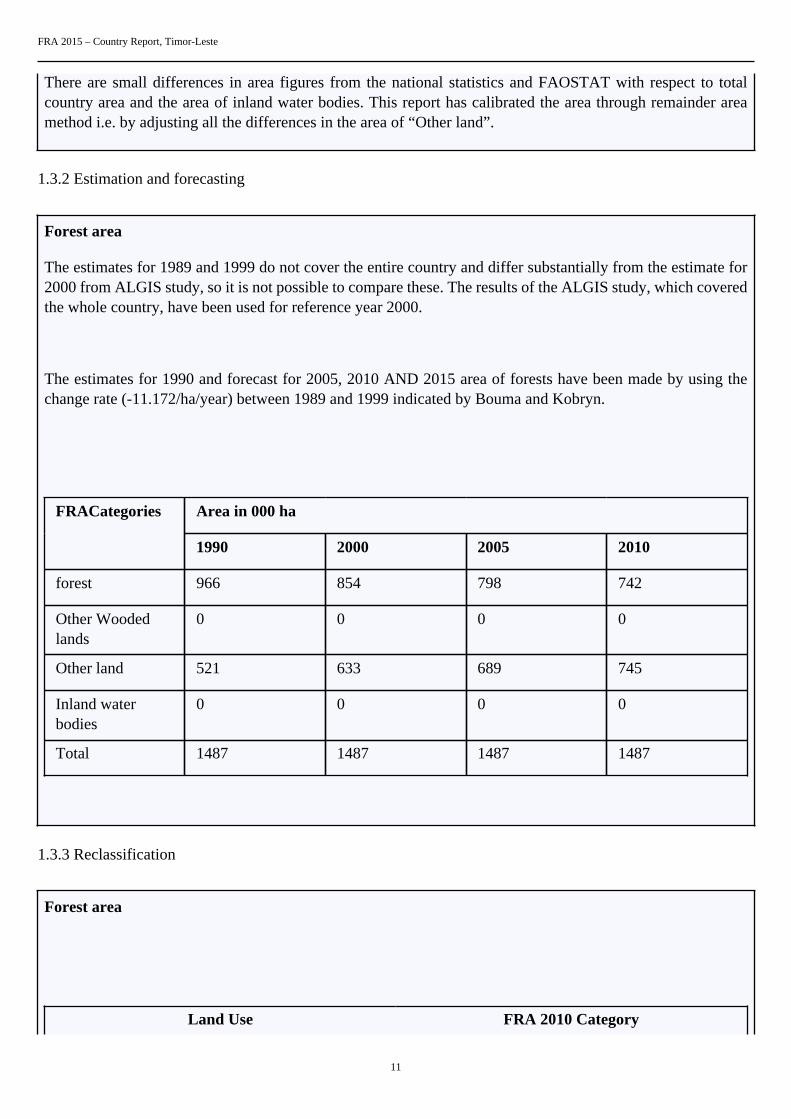
There are small differences in area figures from the national statistics and FAOSTAT with respect to totalcountry area and the area of inland water bodies. This report has calibrated the area through remainder areamethod i.e. by adjusting all the differences in the area of “Other land”.
1.3.2 Estimation and forecasting
Forest area
The estimates for 1989 and 1999 do not cover the entire country and differ substantially from the estimate for2000 from ALGIS study, so it is not possible to compare these. The results of the ALGIS study, which coveredthe whole country, have been used for reference year 2000.
The estimates for 1990 and forecast for 2005, 2010 AND 2015 area of forests have been made by using thechange rate (-11.172/ha/year) between 1989 and 1999 indicated by Bouma and Kobryn.
Area in 000 haFRACategories
1990 2000 2005 2010
forest 966 854 798 742
Other Woodedlands
0 0 0 0
Other land 521 633 689 745
Inland waterbodies
0 0 0 0
Total 1487 1487 1487 1487
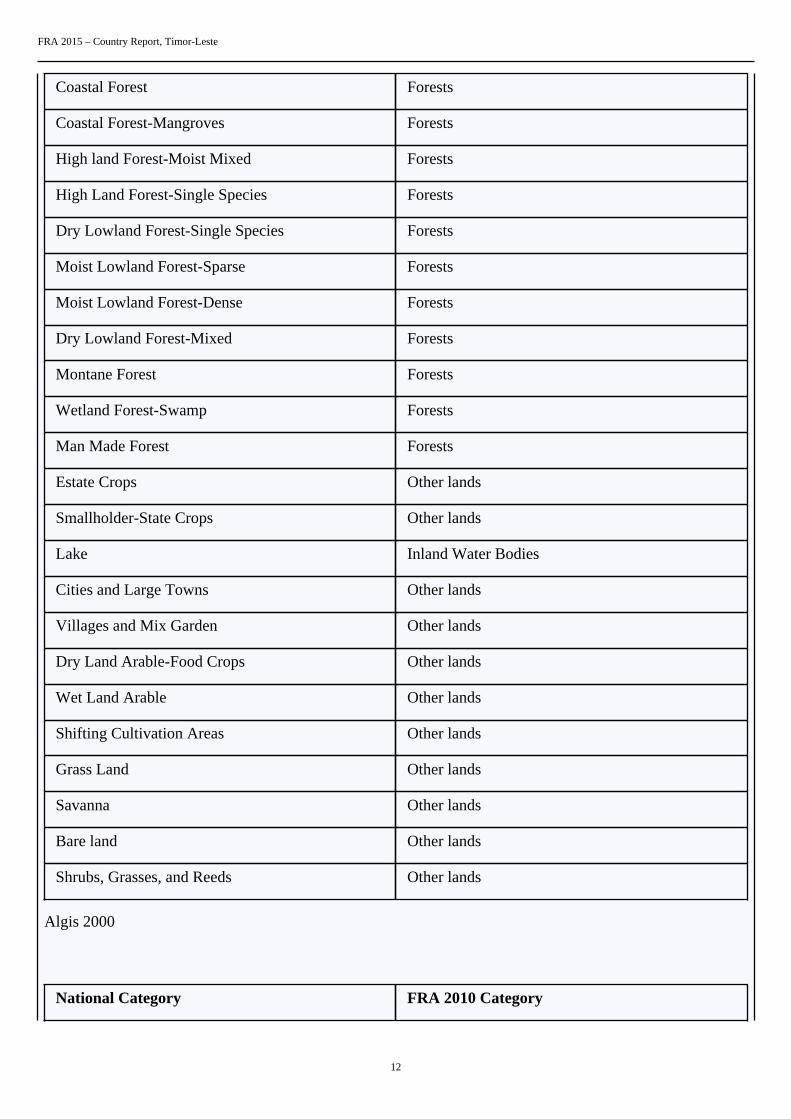
1.3.3 Reclassification
Forest area
Land Use FRA 2010 Category
FRA 2015 – Country Report, Timor-Leste
12
Coastal Forest Forests
Coastal Forest-Mangroves Forests
High land Forest-Moist Mixed Forests
High Land Forest-Single Species Forests
Dry Lowland Forest-Single Species Forests
Moist Lowland Forest-Sparse Forests
Moist Lowland Forest-Dense Forests
Dry Lowland Forest-Mixed Forests
Montane Forest Forests
Wetland Forest-Swamp Forests
Man Made Forest Forests
Estate Crops Other lands
Smallholder-State Crops Other lands
Lake Inland Water Bodies
Cities and Large Towns Other lands
Villages and Mix Garden Other lands
Dry Land Arable-Food Crops Other lands
Wet Land Arable Other lands
Shifting Cultivation Areas Other lands
Grass Land Other lands
Savanna Other lands
Bare land Other lands
Shrubs, Grasses, and Reeds Other lands
Algis 2000
National Category FRA 2010 Category
FRA 2015 – Country Report, Timor-Leste
13
Dense Forest Forest
Forest Forest
Plantation Forest
Forest/Coffee Other land
Woodland Forest
Woodland (poor) Other land
Heath/shrub Other land
Bouma and Kobryn (2002)
1.4 DataTable 1a
Area (000 hectares)Categories
1990 2000 2005 2010 2015
Forest 966 854 798 742 686
Other wooded land 0 0 0 0 0
Other land 521 633 689 745 801
... of which with tree cover N/A N/A N/A N/A N/A
Inland water bodies 0 0 0 0 0
TOTAL 1487.00 1487.00 1487.00 1487.00 1487.00
Table 1bAnnual forest establishment /loss (000 hectares per year)
...of which of introducedspecies (000 hectares per year)
Categories
1990 2000 2005 2010 1990 2000 2005 2010
Forest expansion N/A N/A N/A N/A N/A N/A N/A N/A
... of which afforestation N/A 0.028 0.028 0.028 N/A 0.028 0.028 0.028
... of which natural
expansion of forest
N/A N/A N/A N/A N/A N/A N/A N/A
Deforestation N/A N/A N/A N/A N/A N/A N/A N/A
... of which human induced N/A N/A N/A N/A N/A N/A N/A N/A
FRA 2015 – Country Report, Timor-Leste
14
Reforestation N/A 0.104 0.104 0.104 N/A N/A N/A N/A
... of which artificial N/A 0.104 0.104 0.104 N/A 0.07 0.07 0.7
Tiers
Category Tier for status Tier for reported trend
Forest Tier 1 Tier 1
Other wooded land Tier 1 Tier 1
Forest expansion Tier 1 Tier 1
Deforestation N/A N/A
Reforestation Tier 1 Tier 1
Tier criteria
Category Tier for status Tier for reported trend
• Forest• Other wooded land• Afforestation• Reforestation• Natural expansion of forest• Deforestation
Tier 3 : Data sources: Either recent(less than 10 years ago) National ForestInventory or remote sensing, with groundtruthing, or programme for repeatedcompatible NFIs Tier 2 : Data sources:Full cover mapping / remote sensing orold NFI (more than 10 years ago) Tier 1 :Other
Tier 3 : Estimate based on repeatedcompatible tiers 3 (tier for status) Tier 2 :Estimate based on repeated compatible tier2 or combination tier 3 and 2 or 1 (tier forstatus) Tier 1 : Other
1.5 Comments
CategoryComments related todata definitions etc
Comments on the reported trends
Forest Forest and non forest are identified ormapped from Landsat imagery usingvisual interpretation.
As the estimated change is based on apartial study, the annual loss of forest maybe underestimated.
Other wooded land There is a lack of reliable data on theother wooded lands which have beenincluded under other land.
N/A
Other land All non forested areas are classified as"Other land". Shrub and bushes whichmay still have small trees will belong to"Other land".
N/A
Other land with tree cover N/A N/A
Inland water bodies N/A N/A
Forest expansion N/A N/A
Deforestation N/A N/A
FRA 2015 – Country Report, Timor-Leste
15
Reforestation N/A N/A
Other general comments to the table
Government of Timor-Leste has established center for nursery with the capacity of 400,000 seedlings per annum. Timor-Lesteneeds assistance to measure Natural expansion of forest.
FRA 2015 – Country Report, Timor-Leste
16
2. What is the area of natural and planted forest and how has it changed over time?Documents for this question:
• Guide for country reporting FRA 2015• FRA 2015 Terms and Definitions
2.1 Categories and definitions
Term Definition
Naturally regeneratedforest
Forest predominantly composed of trees established through natural regeneration.
Naturalized introducedspecies
Other naturally regenerated forest where the tree species are predominantly non-native and do not needhuman help to reproduce/maintain populations over time.
Introduced species A species, subspecies or lower taxon occurring outside its natural range (past or present) and dispersalpotential (i.e. outside the range it occupies naturally or could occupy without direct or indirectintroduction or care by humans).
Category Definition
Primary forest Naturally regenerated forest of native species where there are no clearly visible indications of humanactivities and the ecological processes are not significantly disturbed.
Other naturallyregenerated forest
Naturally regenerated forest where there are clearly visible indications of human activities.
...of which of introducedspecies (sub-category)
Other naturally regenerated forest where the trees are predominantly of introduced species.
...of which naturalized(sub-sub category)
Other naturally regenerated forest where the trees are predominantly of naturalized introduced species.
Planted forest Forest predominantly composed of trees established through planting and/or deliberate seeding.
...of which of introducedspecies (sub-category)
Planted forest where the planted/seeded trees are predominantly of introduced species.
Mangroves Area of forest and other wooded land with mangrove vegetation.
...of which planted (sub-category)
Mangroves predominantly composed of trees established through planting.
2.2 National data
2.2.1 Data sources
References to sourcesof information
Variables Years Additional comments
1 The study on integratedAgricultural Development inEast Timor by JICA
Designation 2002 N/A
FRA 2015 – Country Report, Timor-Leste
17
2 Bouma,George and HalinaKobrya.2002 AssessingVegetation Change inEast Timor using Landsat Thematic Map perData. Murdoch University,School of EnvironmentalScience. Technical reportNo.01/02.March 2002.
Change in land use 1989 and 1999 N/A
3 FAO.2007.Mangroves ofAsia. FRA Working paper
Mangroves estimates N/A Secondary source
4 N/A N/A N/A N/A
2.2.2 Classification and definitions
National class Definition
N/A N/A
N/A N/A
N/A N/A
N/A N/A
2.2.3 Original data
Bouma and Kobryn (2002) indicate that percentage of plantation in forest areas in 1989 and 1999 is about 3and 5 percent respectively.
The FAO Study on Mangroves cites the following sources for deriving estimates on mangroves for 1990, 2000and 2005
1) MacKinnon, J.; Beudels R.C, Robinson A.H. 1982. National conservation plan for Indonesia. V. 4: NusaTenggara. FAO-FO-- INS /78/061 Field report 45 (Secondary reference, no primary source provided)
This source reports 4000 ha of mangroves for the year 1982.
2) GOTL . 2001. Rapid Rural Land Use Assessment and Model For Land Use Classification and Mapping.Agricultural Land Use and Geographical Information System unit. Timor-Leste. X Cited in: FAO. 2005.Global Forest Resources Assessment 2005 - Timor-Leste. By da Silva, M. FRA 2005 Country Report No. 218.Unpublished. This source reports 1 802 ha of mangroves for the year 2000.
FRA 2015 – Country Report, Timor-Leste
18
2.3 Analysis and processing of national data
2.3.1 Adjustment
2.3.2 Estimation and forecasting
It is assumed that there are no primary forests.
For plantations, the percentage for 1989 is being assumed for 1990 and that of 1999 for 2000. The figure for2000 is being assumed for 2005 and 2010. It leads to following estimated areas of plantations.
Area in 000 haCategory
1990 2000 2005 2010
Plantation 29 43 43 43
All forest areas excluding plantations are being assumed to be other naturally regenerated forests.
2.3.3 Reclassification
2.4 DataTable 2a
Forest area (000 hectares)Categories
1990 2000 2005 2010 2015
Primary forest 0 0 0 0 0
Other naturally regeneratedforest
937 811 755 699 643
... of which of introducedspecies
N/A N/A N/A N/A N/A
... of which naturalized N/A N/A N/A N/A N/A
FRA 2015 – Country Report, Timor-Leste
19
Planted forest 29 43 43 43 43
... of which of introducedspecies
N/A N/A N/A N/A N/A
TOTAL 966.00 854.00 798.00 742.00 686.00
Table 2b
Primary forest converted to (000 ha)
1990-2000 2000-2010 2010-2015
Othernatural
regenerationPlanted Other land
Othernatural
regenerationPlanted Other land
Othernatural
regenerationPlanted Other land
0 0 0 0 0 0 0 0 0
Table 2c
Area (000 hectares)Categories
1990 2000 2005 2010 2015
Mangroves (forest and OWL) 3 1.8 1.8 1.8 1.8
... of which planted N/A N/A N/A N/A N/A
Tiers
Category Tier for status Tier for reported trend
Primary forest Tier 1 Tier 1
Other naturally regenerated forest Tier 1 Tier 1
Planted forest Tier 1 Tier 1
Mangroves Tier 1 Tier 1
Tier Criteria
Category Tier for status Tier for reported trend
Primary forest/Other naturally regeneratedforest/Planted forest
Tier 3 : Data sources: Recent (less than10 years) National Forest Inventory orremote sensing with ground truthing ordata provided by official agencies orprogramme for repeated compatible NFIsTier 2 : Data sources: Full cover mapping/remote sensing or old NFI (more than 10years) Tier 1 : Other
Tier 3 : Estimate based on repeatedcompatible tiers 3 (tier for status) Tier 2 :Estimate based on repeated compatible tier2 or combination tier 3 and 2 or 1 (tier forstatus) Tier 1 : Other
2.5 Comments

FRA 2015 – Country Report, Timor-Leste
20
CategoryComments related todata definitions etc
Comments on reported trend
Primary forest N/A N/A
Other naturally regenerating forest N/A N/A
Planted forest N/A N/A
Mangroves N/A Same estimated figures have been usedfor 2010 AND 2015 due to lack of data
Other general comments to the table
N/A
FRA 2015 – Country Report, Timor-Leste
21
3. What are the stocks and growth rates of the forests and how have they changed?Documents for this question:
• Guide for country reporting FRA 2015• FRA 2015 Terms and Definitions
3.1 Categories and definitions
Category Definition
Growing stock Volume over bark of all living trees with a minimum diameter of 10 cm at breast height (or abovebuttress if these are higher). Includes the stem from ground level up to a top diameter of 0 cm,excluding branches.
Net Annual Increment(NAI)
Average annual volume of gross increment over the given reference period less that of natural losses onall trees, measured to minimum diameters as defined for "Growing stock".
Above-ground biomass All living biomass above the soil including stem stump branches bark seeds and foliage.
Below-ground biomass All biomass of live roots. Fine roots of less than 2 mm diameter are excluded because these often cannotbe distinguished empirically from soil organic matter or litter.
Dead wood All non-living woody biomass not contained in the litter either standing lying on the ground or in thesoil. Dead wood includes wood lying on the surface dead roots and stumps larger than or equal to 10 cmin diameter or any other diameter used by the country.
Carbon in above-groundbiomass
Carbon in all living biomass above the soil including stem stump branches bark seeds and foliage.
Carbon in below-groundbiomass
Carbon in all biomass of live roots. Fine roots of less than 2 mm diameter are excluded because theseoften cannot be distinguished empirically from soil organic matter or litter.
Carbon in dead wood Carbon in all non-living woody biomass not contained in the litter, either standing, lying on the ground,or in the soil. Dead wood includes wood lying on the surface, dead roots and stumps larger than or equalto 10 cm in diameter or any other diameter used by the country.
Carbon in litter Carbon in all non-living biomass with a diameter less than the minimum diameter for dead wood (e.g.10 cm ) lying dead in various states of decomposition above the mineral or organic soil.
Soil carbon Organic carbon in mineral and organic soils (including peat) to a soil depth of 30 cm.
3.2 National data
3.2.1 Data sources
References to sourcesof information
Variables Years Additional comments
1 N/A N/A N/A N/A
2 N/A N/A N/A N/A
3 N/A N/A N/A N/A
4 N/A N/A N/A N/A
FRA 2015 – Country Report, Timor-Leste
22
3.2.2 Classification and definitions
National class Definition
N/A N/A
N/A N/A
N/A N/A
N/A N/A
3.2.3 Original data
3.3 Analysis and processing of national data
3.3.1 Adjustment
3.3.2 Estimation and forecasting
3.3.3 Reclassification
3.4 DataTable 3a
Growing stock volume (million m 3 over bark)
Forest Other wooded landCategory
1990 2000 2005 2010 2015 1990 2000 2005 2010 2015
Totalgrowingstock
N/A N/A N/A N/A N/A N/A N/A N/A N/A N/A
... ofwhichconiferous
N/A N/A N/A N/A N/A N/A N/A N/A N/A N/A
... ofwhichbroadleaved
N/A N/A N/A N/A N/A N/A N/A N/A N/A N/A
Table 3b
FRA 2015 – Country Report, Timor-Leste
23
Category/Species name Growing stock in forest (million cubic meters)
Rank Scientific name Common name 1990 2000 2005 2010
1 st N/A N/A N/A N/A N/A N/A
2 nd N/A N/A N/A N/A N/A N/A
3 rd N/A N/A N/A N/A N/A N/A
4 th N/A N/A N/A N/A N/A N/A
5 th N/A N/A N/A N/A N/A N/A
6 th N/A N/A N/A N/A N/A N/A
7 th N/A N/A N/A N/A N/A N/A
8 th N/A N/A N/A N/A N/A N/A
9 th N/A N/A N/A N/A N/A N/A
10 th N/A N/A N/A N/A N/A N/A
Remaining N/A N/A N/A N/A
TOTAL .00 .00 .00 .00
THE PRE-FILLED VALUES FOR GROWING STOCK REFER TO THE FOLLOWINGTHRESHOLD VALUES (SEE TABLE BELOW)
Item Value Complementary information
Minimum diameter (cm) at breast heightof trees included in growing stock (X)
N/A N/A
Minimum diameter (cm) at the top end ofstem for calculation of growing stock (Y)
N/A N/A
Minimum diameter (cm) of branchesincluded in growing stock (W)
N/A N/A
Volume refers to above ground (AG) orabove stump (AS)
N/A N/A
PLEASE NOTE THAT THE DEFINITION OF GROWING STOCK HAS CHANGED AND SHOULDBE REPORTED AS GROWING STOCK DBH 10 CM INCLUDING THE STEM FROM GROUNDLEVEL UP TO A DIAMETER OF 0 CM, EXCLUDING BRANCHES.
Table 3c
Net annual increment (m 3 per hectare and year)Category
Forest
FRA 2015 – Country Report, Timor-Leste
24
1990 2000 2005 2010 2015
Net annualincrement
N/A N/A N/A N/A N/A
... of whichconiferous
N/A N/A N/A N/A N/A
... of whichbroadleaved
N/A N/A N/A N/A N/A
Table 3d
Biomass (million metric tonnes oven-dry weight)
Forest Other wooded landCategory
1990 2000 2005 2010 2015 1990 2000 2005 2010 2015
Abovegroundbiomass
N/A N/A N/A N/A N/A N/A N/A N/A N/A N/A
Belowgroundbiomass
N/A N/A N/A N/A N/A N/A N/A N/A N/A N/A
Deadwood
N/A N/A N/A N/A N/A N/A N/A N/A N/A N/A
TOTAL .00 .00 .00 .00 .00 .00 .00 .00 .00 .00
Table 3e
Carbon (Million metric tonnes)
Forest Other wooded landCategory
1990 2000 2005 2010 2015 1990 2000 2005 2010 2015
Carbonin abovegroundbiomass
N/A N/A N/A N/A N/A N/A N/A N/A N/A N/A
Carbonin belowgroundbiomass
N/A N/A N/A N/A N/A N/A N/A N/A N/A N/A
SubtotalLivingbiomass
N/A N/A N/A N/A N/A N/A N/A N/A N/A N/A
Carbonin deadwood
N/A N/A N/A N/A N/A N/A N/A N/A N/A N/A
Carbonin litter
N/A N/A N/A N/A N/A N/A N/A N/A N/A N/A
FRA 2015 – Country Report, Timor-Leste
25
SubtotalDeadwoodand litter
N/A N/A N/A N/A N/A N/A N/A N/A N/A N/A
Soilcarbon
N/A N/A N/A N/A N/A N/A N/A N/A N/A N/A
TOTAL .00 .00 .00 .00 .00 .00 .00 .00 .00 .00
Tiers
Variable/category Tier for status Tier for trend
Total growing stock N/A N/A
Net annual increment N/A N/A
Above ground biomass N/A N/A
Below ground biomass N/A N/A
Dead wood N/A N/A
Carbon in above-ground biomass N/A N/A
Carbon in below ground biomass N/A N/A
Carbon in dead wood and litter N/A N/A
Soil carbon N/A N/A
Tier criteria
Category Tier for status Tier for reported trend
Total growing stock Tier 3: Data sources Recent 10 yearsNational Forest Inventory or remotesensing with ground truthing orprogramme for repeated compatible NFI10 years Domestic volume functions Tier2: Data sources/registers and statisticsmodelling or old NFI 10 years or partialfield inventory Tier 1: Other data sources
Tier 3: Estimate based on repeatedcompatible tiers 3 (tier for status)Domestic growth functions Tier 2:Estimate based on repeated compatible tier2 or combination tier 3 and 2 or 1 tier forstatus Tier 1: Other
Net annual increment Tier 3: Scientifically tested nationalvolume and growth functions Tier 2:Selection of volume and growth functionsas relevant as possible Tier 1: Other
Tier 3: Confirmation/adjustment offunctions used through scientific workTier 2: Review work done to seekalternative functions Tier: 1 Other

FRA 2015 – Country Report, Timor-Leste
26
Biomass Tier 3: Country-specific national or sub-national biomass conversion expansionfactors applied or other domestic orotherwise nationally relevant biomassstudies Tier 2: Application of countryspecific national or sub-national biomassconversion factors from other countrywith similar climatic conditions and foresttypes Tier 1: International/regional defaultbiomass expansion factors applied
Tier 3 : Estimate based on repeatedcompatible tiers 3 (tier for status) Tier 2 :Estimate based on repeated compatible tier2 or combination tier 3 and 2 or 1 (tier forstatus) Tier 1 : Other
• Carbon in above ground biomass• Carbon in below ground biomass• Carbon in dead wood and litter• Soil carbon
Tier 3: Country-specific national or sub-national biomass conversion expansionfactors applied Tier 2: Applicationof country specific national or sub-national biomass conversion factorsform from other country with similarclimatic conditions and forest types Tier1: International/regional default biomassexpansion factors applied
Tier 3 : Estimate based on repeatedcompatible tiers 3 (tier for status) Tier 2 :Estimate based on repeated compatible tier2 or combination tier 3 and 2 or 1 (tier forstatus) Tier 1 : Other
3.5 Comments on growing stock biomass and carbon
CategoryComments related todata definitions etc
Comments on the reported trend
Total growing stock N/A N/A
Growing stock of broadleaved coniferous N/A N/A
Growing stock composition N/A N/A
Net annual increment N/A N/A
Above-ground biomass N/A N/A
Below-ground biomass N/A N/A
Dead wood N/A N/A
Carbon in above-ground biomass N/A N/A
Carbon in below-ground biomass N/A N/A
Carbon in dead wood N/A N/A
Carbon in litter N/A N/A
Soil carbon N/A N/A
Other general comments to the table
N/A
FRA 2015 – Country Report, Timor-Leste
27
4. What is the status of forest production and how has it changed over time?Documents for this question:
• Guide for country reporting FRA 2015• FRA 2015 Terms and Definitions
4.1 Categories and definitions
Term Definition
Primary designatedfunction
The primary function or management objective assigned to a management unit either by legalprescription documented decision of the landowner/manager or evidence provided by documentedstudies of forest management practices and customary use.
Non wood forest product(NWFP)
Goods derived from forests that are tangible and physical objects of biological origin other than wood.
Commercial value ofNWFP
For the purpose of this table, value is defined as the commercial market value at the forest gate.
Category Definition
Production forest Forest area designated primarily for production of wood, fibre, bio-energy and/or non-wood forestproducts.
Multiple use forest Forest area designated for more than one purpose and where none of these alone is considered as thepredominant designated function.
Total wood removals The total of industrial round wood removals and woodfuel removals.
...of which woodfuel The wood removed for energy production purposes, regardless whether for industrial, commercial ordomestic use.
4.2 National data
4.2.1 Data sources
References to sourcesof information
Variables Years Additional comments
1 The study on IntegratedAgricultural Development inEast Timor by JICA
Designation 2002 N/A
2 Bouma, George and HalinaKobrya. 2002. AssessingVegetation Change inEast Timor using LandsatThematic Mapper Data.Murdoch University,School of EnvironmentalScience. Technical ReportNo.01/02.March 2002.
Change in Land use 1989 and 1999 N/A
3 N/A N/A N/A N/A
4 N/A N/A N/A N/A

FRA 2015 – Country Report, Timor-Leste
28
4.2.2 Classification and definitions
National class Definition
Production Forest Production Forest
Limited Production Forest Limited use, steep slopes, selective harvesting
Converted Forest Production forest, harvested and now converted to other function(e.g. Livestock grazing)
Forest Protection Steep, harvesting not allowed
Conservation of Forest Conservation of biodiversity
N/A Currently, there are no land or vegetation classification systems.The current generally recognized forest uses are ProtectedNatural Areas, Watershed and Industrial Tree Plantationcategories:
Protected Natural Areas UNTAET Regulation 2000/19 on Protected Places declares15 Protected Wild Areas (commonly known as ProtectedNatural Areas, PNAs). They cover an area of 187.6 (000 ha) andprovides protection to a range of threatened species. Sites wereselected on preliminary information on the basis of ecological,historical, cultural and religious significance.
Watershed Watershed areas are identified based on topographic conditions.
Industrial Tree Plantation Identified based on species composition.
4.2.3 Original data
A. 1997 and before
Area (in’000 ha) Percentage
National classification
1997 1997
Production forests 122 16.33
Limited Production 120 16.05
Converted Production Forests 7 0.91
Forest Protection 418 56.19
Conservation Forests 48 10.52
FRA 2015 – Country Report, Timor-Leste
29
Total 745 100
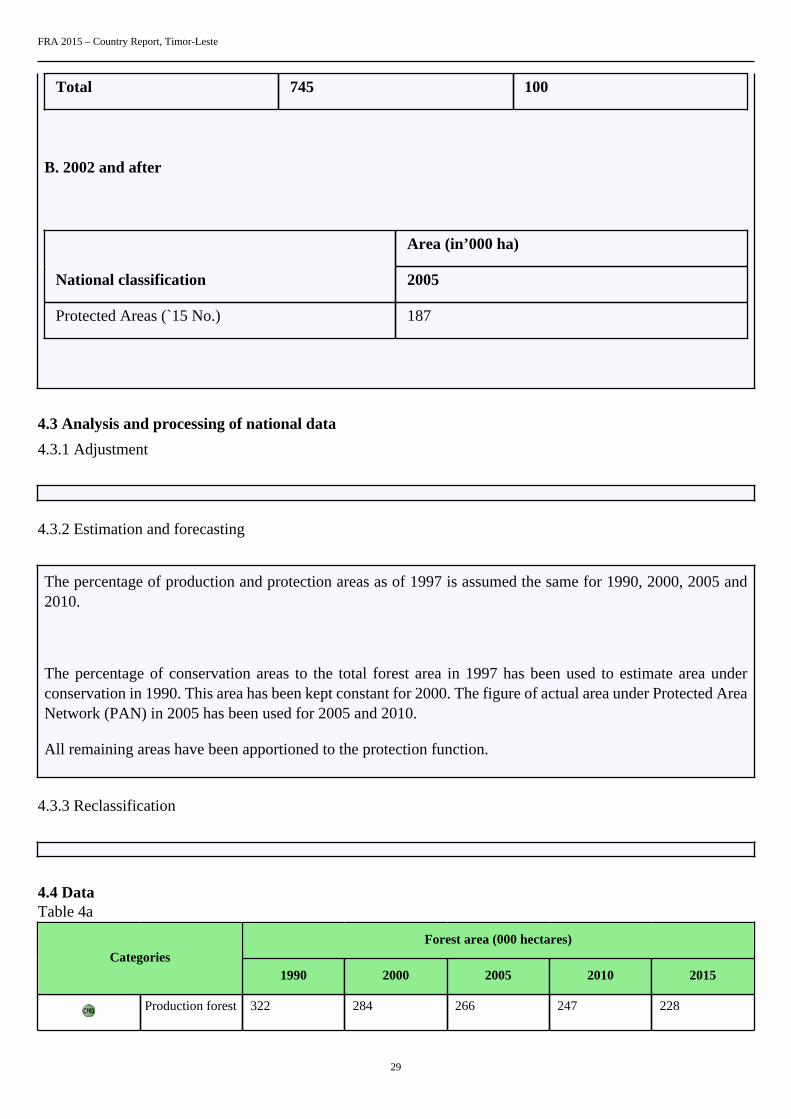
B. 2002 and after
Area (in’000 ha)
National classification 2005
Protected Areas (`15 No.) 187
4.3 Analysis and processing of national data
4.3.1 Adjustment
4.3.2 Estimation and forecasting
The percentage of production and protection areas as of 1997 is assumed the same for 1990, 2000, 2005 and2010.
The percentage of conservation areas to the total forest area in 1997 has been used to estimate area underconservation in 1990. This area has been kept constant for 2000. The figure of actual area under Protected AreaNetwork (PAN) in 2005 has been used for 2005 and 2010.
All remaining areas have been apportioned to the protection function.
4.3.3 Reclassification
4.4 DataTable 4a
Forest area (000 hectares)Categories
1990 2000 2005 2010 2015
Production forest 322 284 266 247 228
FRA 2015 – Country Report, Timor-Leste
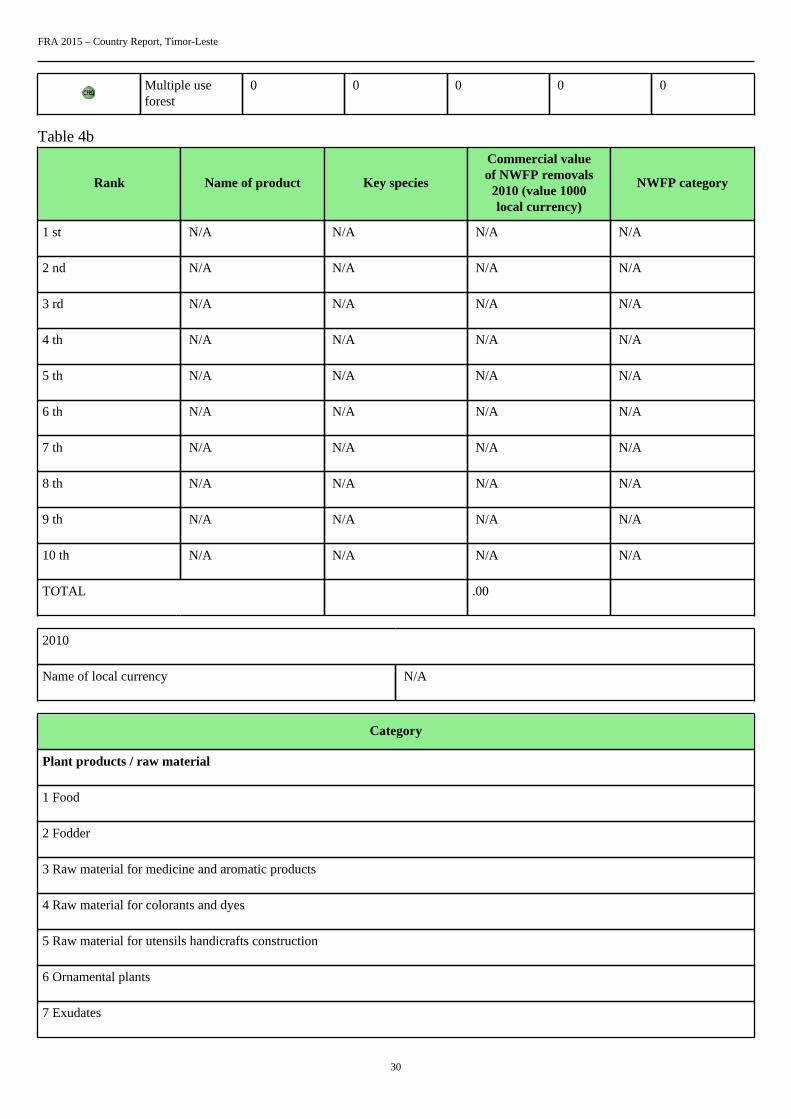
30
Multiple useforest
0 0 0 0 0
Table 4b
Rank Name of product Key species
Commercial valueof NWFP removals
2010 (value 1000local currency)
NWFP category
1 st N/A N/A N/A N/A
2 nd N/A N/A N/A N/A
3 rd N/A N/A N/A N/A
4 th N/A N/A N/A N/A
5 th N/A N/A N/A N/A
6 th N/A N/A N/A N/A
7 th N/A N/A N/A N/A
8 th N/A N/A N/A N/A
9 th N/A N/A N/A N/A
10 th N/A N/A N/A N/A
TOTAL .00
2010
Name of local currency N/A
Category
Plant products / raw material
1 Food
2 Fodder
3 Raw material for medicine and aromatic products
4 Raw material for colorants and dyes
5 Raw material for utensils handicrafts construction
6 Ornamental plants
7 Exudates
FRA 2015 – Country Report, Timor-Leste
31
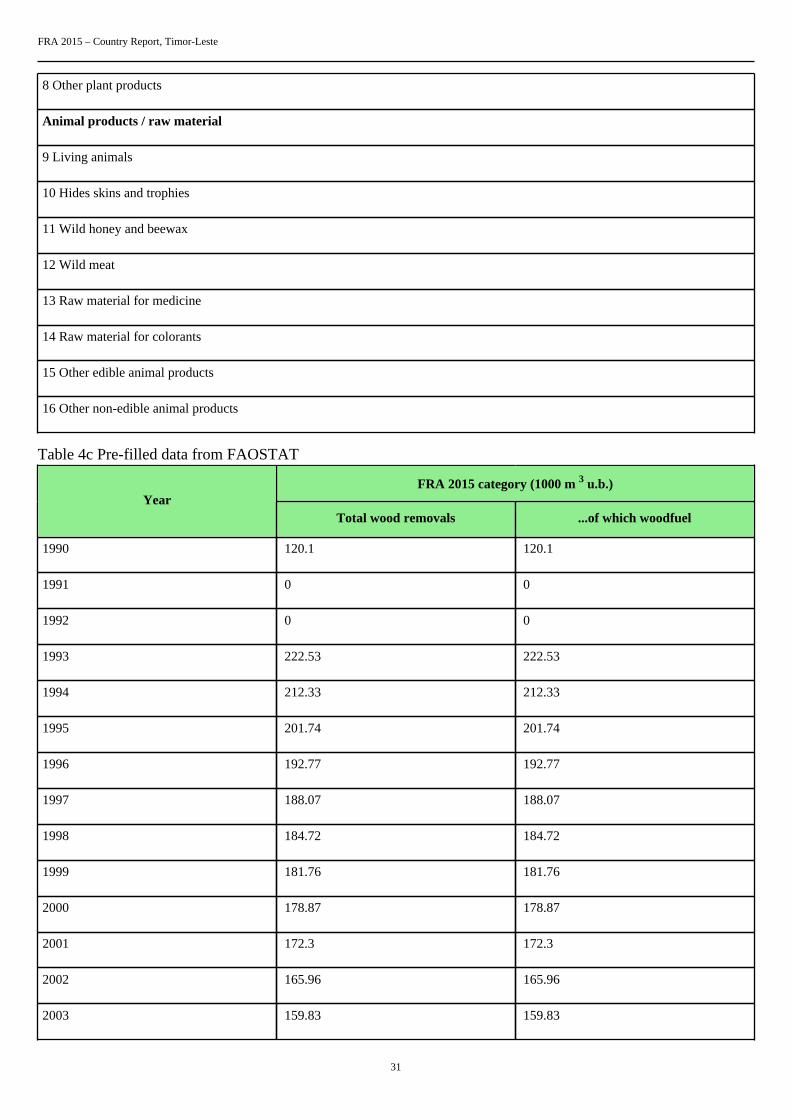
8 Other plant products
Animal products / raw material
9 Living animals
10 Hides skins and trophies
11 Wild honey and beewax
12 Wild meat
13 Raw material for medicine
14 Raw material for colorants
15 Other edible animal products
16 Other non-edible animal products
Table 4c Pre-filled data from FAOSTAT
FRA 2015 category (1000 m 3 u.b.)Year
Total wood removals ...of which woodfuel
1990 120.1 120.1
1991 0 0
1992 0 0
1993 222.53 222.53
1994 212.33 212.33
1995 201.74 201.74
1996 192.77 192.77
1997 188.07 188.07
1998 184.72 184.72
1999 181.76 181.76
2000 178.87 178.87
2001 172.3 172.3
2002 165.96 165.96
2003 159.83 159.83
FRA 2015 – Country Report, Timor-Leste
32
2004 153.91 153.91
2005 148.19 148.19
2006 142.16 142.16
2007 136.34 136.34
2008 130.73 130.73
2009 125.32 125.32
2010 120.1 120.1
2011 120.1 120.1
Tiers
Category Tier for status Tier for reported trend
Production forest Tier 1 Tier 1
Multiple use forest Tier 1 Tier 1
Tier Criteria
Category Tier for status Tier for reported trend
Production forest Multiple use forest Tier 3: Updated including fieldverifications national forest mapsincluding functions Tier 2: Forest mapsolder than 6 years including forestfunctions Tier 1: Other
Tier 3 : Estimate based on repeatedcompatible tiers 3 (tier for status) Tier 2 :Estimate based on repeated compatible tier2 or combination tier 3 and 2 or 1 (tier forstatus) Tier 1 : Other
4.5 Comments
CategoryComments related todata definitions etc
Comments on the reported trend
Production forest N/A N/A
Multiple use forest N/A N/A
Total wood removals N/A N/A
Commercial value of NWFP N/A N/A
Other general comments to the table
The lack of detailed land classification and financial resources hampers the government to designate forest areas into various uses.

FRA 2015 – Country Report, Timor-Leste
33
5. How much forest area is managed for protection of soil and water and ecosystemservices?Documents for this question:
• Guide for country reporting FRA 2015• FRA 2015 Terms and Definitions
5.1 Categories and definitions
Category Definition
Protection of soil andwater
Forest area designated or managed for protection of soil and water
...of which productionof clean water (sub-category)
Forest area primarily designated or managed for water production, where most human uses are excludedor heavily modified to protect water quality.
...of which coastalstabilization (sub-category)
Forest area primarily designated or managed for coastal stabilization.
...of which desertificationcontrol (sub-category)
Forest area primarily designated or managed for desertification control.
...of which avalanchecontrol (sub-category)
Forest area primarily designated or managed to prevent the development or impact of avalanches onhuman life assets or infrastructure.
...of which erosion, floodprotection or reducingflood risk (sub-category)
Forest area primarily designated or managed for protecting communities or assets from the impacts oferosion riparian floods and landslides or for providing flood plain services.
...of which other (sub-category)
Forest area primarily designated or managed for other protective functions.
Ecosystem services,cultural or spiritual values
Forest area primarily designated or managed for selected ecosystem services or cultural or spiritualvalues.
...of which publicrecreation (sub-category)
Forest area designated or managed for public recreation.
...of which carbon storageor sequestration (sub-category)
Forest area designated or managed for carbon storage or sequestration.
...of which spiritual orcultural services (sub-category)
Forest area designated or managed for spiritual or cultural services.
...of which other (sub-category)
Forest area designated or managed for other ecosystem services.
5.2 National data
5.2.1 Data sources
References to sourcesof information
Variables Years Additional comments
1 The study on IntegratedAgricultural Development inEast Timor by JICA
Designation 2002 N/A

FRA 2015 – Country Report, Timor-Leste
34
2 Bouma, George and HalinaKobrya. 2002. AssessingVegetation Change inEast Timor using LandsatThematic Mapper Data.Murdoch University,School of EnvironmentalScience. Technical ReportNo.01/02.March 2002.
Change in Land use 1989 and 1999 N/A
3 N/A N/A N/A N/A
4 N/A N/A N/A N/A
5.2.2 Classification and definitions
National class Definition
Forest Protection Steep, harvesting not allowed
Limited Production Forest Limited use, steep slopes, selective harvesting
N/A N/A
N/A N/A
5.2.3 Original data
A. 1997 and before
Area (in’000 ha) Percentage
National classification
1997 1997
Production forests 122 16.33
Limited Production 120 16.05
Converted Production Forests 7 0.91
Forest Protection 418 56.19
Conservation Forests 48 10.52
Total 745 100
FRA 2015 – Country Report, Timor-Leste
35
B. 2002 and after
Area (in’000 ha)
National classification 2005
Protected Areas (`15 No.) 187
5.3 Analysis and processing of national data
5.3.1 Adjustment
5.3.2 Estimation and forecasting
The percentage of production and protection areas as of 1997 is assumed the same for 1990, 2000, 2005, 2010and 2015.
The percentage of conservation areas to the total forest area in 1997 has been used to estimate area underconservation in 1990. This area has been kept constant for 2000. The figure of actual area under Protected AreaNetwork (PAN) in 2005 has been used for 2005 and 2010.
All remaining areas have been apportioned to the protection function.
5.3.3 Reclassification
5.4 DataTable 5a
Forest area (1000 hectares)Categories
1990 2000 2005 2010 2015
Protection of soiland water
542 468 345 308 271
... of whichproduction ofclean water
N/A N/A N/A N/A N/A
... of whichcoastalstabilization
N/A N/A N/A N/A N/A
FRA 2015 – Country Report, Timor-Leste
36
... of whichdesertificationcontrol
N/A N/A N/A N/A N/A
... of whichavalanchecontrol
N/A N/A N/A N/A N/A
... of whicherosion, floodprotection orreducing floodrisk
313 277 258 240 222
... of which other(please specifyin commentsbelow the table)
N/A N/A N/A N/A N/A
Other
N/A
Table 5b
Forest area (1000 hectares)Categories
1990 2000 2005 2010 2015
Ecosystem services,cultural or spiritualvalues
N/A N/A N/A N/A N/A
...of which publicrecreation
N/A N/A N/A N/A N/A
...of whichcarbon storage orsequestration
N/A N/A N/A N/A N/A
...of which spiritualor cultural services
N/A N/A N/A N/A N/A
...of which other(please specify incomments belowthe table)
N/A N/A N/A N/A N/A
Tiers
Category Tier for reported trend Tier for status
Protection of soil and water Tier 1 Tier 1
Ecosystem services, cultural or spiritualvalues
N/A N/A
Tier criteria
Category Tier for status Tier for reported trend
FRA 2015 – Country Report, Timor-Leste
37
Protection of soil and water Tier 3: High reliability data derived eitherfrom high intensity sample survey or dataobtained from national or state agenciesresponsible for regulations or legislationrelating to soil and water protection. Tier2: Approaches based on low intensityor incomplete sample-based surveys orstudies that provide data for specific areasthat is extrapolated through statisticalanalysis to national level estimates. Tier 1:Other
Tier 3 : Estimate based on repeatedcompatible tiers 3 (tier for status) Tier 2 :Estimate based on repeated compatible tier2 or combination tier 3 and 2 or 1 (tier forstatus) Tier 1 : Other
• Cultural or spiritual values• Public recreation• Spiritual or cultural services• Other
Tier 3: High reliability data derivedeither from high intensity sample surveyor data obtained from national or stateagencies responsible for regulations. Tier2: Approaches based on low intensityor incomplete sample-based surveys orstudies that provide data for specific areasthat is extrapolated through statisticalanalysis to national level estimates. Tier 1:Other
Tier 3 : Estimate based on repeatedcompatible tiers 3 (tier for status) Tier 2 :Estimate based on repeated compatible tier2 or combination tier 3 and 2 or 1 (tier forstatus) Tier 1 : Other
5.5 Comments
CategoryComments related todata definitions etc
Comments on the reported trend
Protection of soil and water N/A N/A
Production of clean water N/A N/A
Coastal stabilization N/A N/A
Desertification control N/A N/A
Avalanche control N/A N/A
Erosion, flood protection or reducing floodrisk
N/A N/A
Other protective functions N/A N/A
Ecosystem services, cultural or spiritualvalues
N/A N/A
Public recreation N/A N/A
Carbon storage or sequestration N/A N/A
Spiritual or cultural services N/A N/A
Other ecosystem services N/A N/A
Other general comments to the table
FRA 2015 – Country Report, Timor-Leste
38
N/A

FRA 2015 – Country Report, Timor-Leste
39
6. How much forest area is protected and designated for the conservation of biodiversityand how has it changed over time?Documents for this question:
• Guide for country reporting FRA 2015• FRA 2015 Terms and Definitions
6.1 Categories and definitions
Category Definition
Conservation ofbiodiversity
Forest area designated primarily for conservation of biological diversity. Includes but is not limited toareas designated for biodiversity conservation within the protected areas.
Forest area withinprotected areas
Forest area within formally established protected areas independently of the purpose for which theprotected areas were established.
6.2 National data
6.2.1 Data sources
References to sourcesof information
Variables Years Additional comments
1 The study on IntegratedAgricultural Development inEast Timor by JICA
Designation 2002 N/A
2 Bouma, George and HalinaKobrya. 2002. AssessingVegetation Change inEast Timor using LandsatThematic Mapper Data.Murdoch University,School of EnvironmentalScience. Technical ReportNo.01/02.March 2002.
Change in Land use 1989 and 1999 N/A
3 N/A N/A N/A N/A
4 N/A N/A N/A N/A
6.2.2 Classification and definitions
National class Definition
Conservation of Forest Conservation of biodiversity
N/A Currently, there are no land or vegetation classification systems.The current generally recognized forest uses are ProtectedNatural Areas, Watershed and Industrial Tree Plantationcategories:

FRA 2015 – Country Report, Timor-Leste
40
Protected Natural Areas UNTAET Regulation 2000/19 on Protected Places declares15 Protected Wild Areas (commonly known as ProtectedNatural Areas, PNAs). They cover an area of 187.6 (000 ha) andprovides protection to a range of threatened species. Sites wereselected on preliminary information on the basis of ecological,historical, cultural and religious significance.
Watershed Watershed areas are identified based on topographic conditions.
6.2.3 Original data
A. 1997 and before
Area (in’000 ha) Percentage
National classification
1997 1997
Production forests 122 16.33
Limited Production 120 16.05
Converted Production Forests 7 0.91
Forest Protection 418 56.19
Conservation Forests 48 10.52
Total 745 100
B. 2002 and after
Area (in’000 ha)
National classification 2005
Protected Areas (`15 No.) 187
6.3 Analysis and processing of national data
FRA 2015 – Country Report, Timor-Leste
41
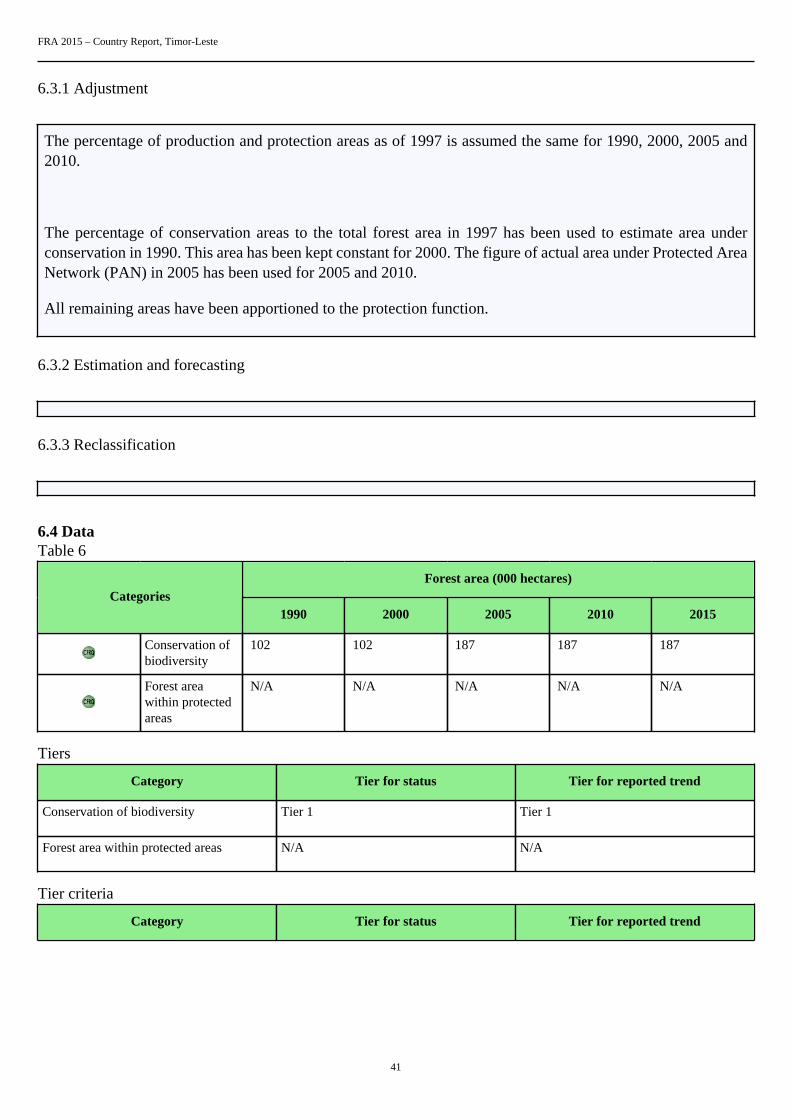
6.3.1 Adjustment
The percentage of production and protection areas as of 1997 is assumed the same for 1990, 2000, 2005 and2010.
The percentage of conservation areas to the total forest area in 1997 has been used to estimate area underconservation in 1990. This area has been kept constant for 2000. The figure of actual area under Protected AreaNetwork (PAN) in 2005 has been used for 2005 and 2010.
All remaining areas have been apportioned to the protection function.
6.3.2 Estimation and forecasting
6.3.3 Reclassification
6.4 DataTable 6
Forest area (000 hectares)Categories
1990 2000 2005 2010 2015
Conservation ofbiodiversity
102 102 187 187 187
Forest areawithin protectedareas
N/A N/A N/A N/A N/A
Tiers
Category Tier for status Tier for reported trend
Conservation of biodiversity Tier 1 Tier 1
Forest area within protected areas N/A N/A
Tier criteria
Category Tier for status Tier for reported trend
FRA 2015 – Country Report, Timor-Leste
42
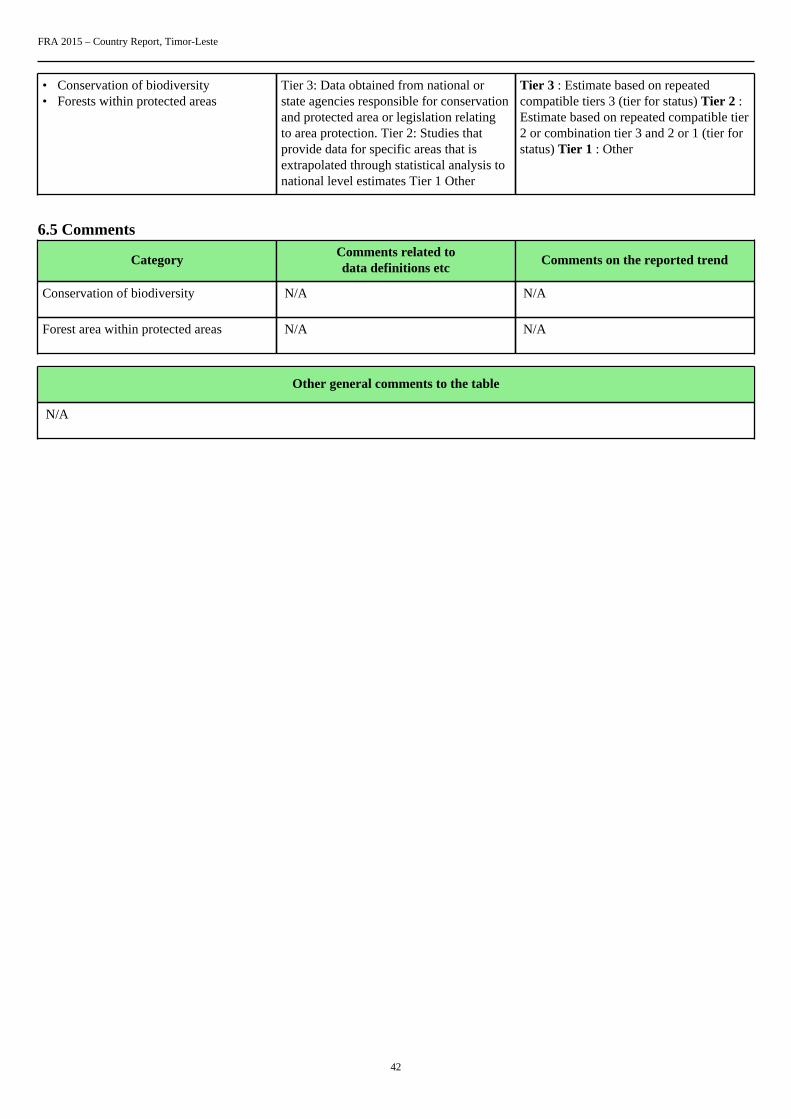
• Conservation of biodiversity• Forests within protected areas
Tier 3: Data obtained from national orstate agencies responsible for conservationand protected area or legislation relatingto area protection. Tier 2: Studies thatprovide data for specific areas that isextrapolated through statistical analysis tonational level estimates Tier 1 Other
Tier 3 : Estimate based on repeatedcompatible tiers 3 (tier for status) Tier 2 :Estimate based on repeated compatible tier2 or combination tier 3 and 2 or 1 (tier forstatus) Tier 1 : Other
6.5 Comments
CategoryComments related todata definitions etc
Comments on the reported trend
Conservation of biodiversity N/A N/A
Forest area within protected areas N/A N/A
Other general comments to the table
N/A

FRA 2015 – Country Report, Timor-Leste
43
7. What is the area of forest affected by woody invasive species?Documents for this question:
• Guide for country reporting FRA 2015• FRA 2015 Terms and Definitions
7.1 Categories and definitions
Category Definition
Invasive species Species that are non-native to a particular ecosystem and whose introduction and spread cause, or arelikely to cause, socio-cultural, economic or environmental harm or harm to human health.
7.2 National data
7.2.1 Data sources
References to sourcesof information
Variables Years Additional comments
1 N/A N/A N/A N/A
2 N/A N/A N/A N/A
3 N/A N/A N/A N/A
4 N/A N/A N/A N/A
7.2.2 Classification and definitions
National class Definition
N/A N/A
N/A N/A
N/A N/A
N/A N/A
7.2.3 Original data
7.3 Analysis and processing of national data
7.3.1 Adjustment

FRA 2015 – Country Report, Timor-Leste
44
7.3.2 Estimation and forecasting
7.3.3 Reclassification
7.4 DataTable 7
Forest area affected (000 ha)Scientific name of
woody invasive species2005 2010
N/A N/A N/A
N/A N/A N/A
N/A N/A N/A
N/A N/A N/A
N/A N/A N/A
N/A N/A N/A
N/A N/A N/A
N/A N/A N/A
N/A N/A N/A
N/A N/A N/A
Total N/A N/A
Tiers
Category Tier for status Tier for reported trend
Invasive species N/A N/A
Tier Criteria
Category Tier for status Tier for reported trend
FRA 2015 – Country Report, Timor-Leste
45
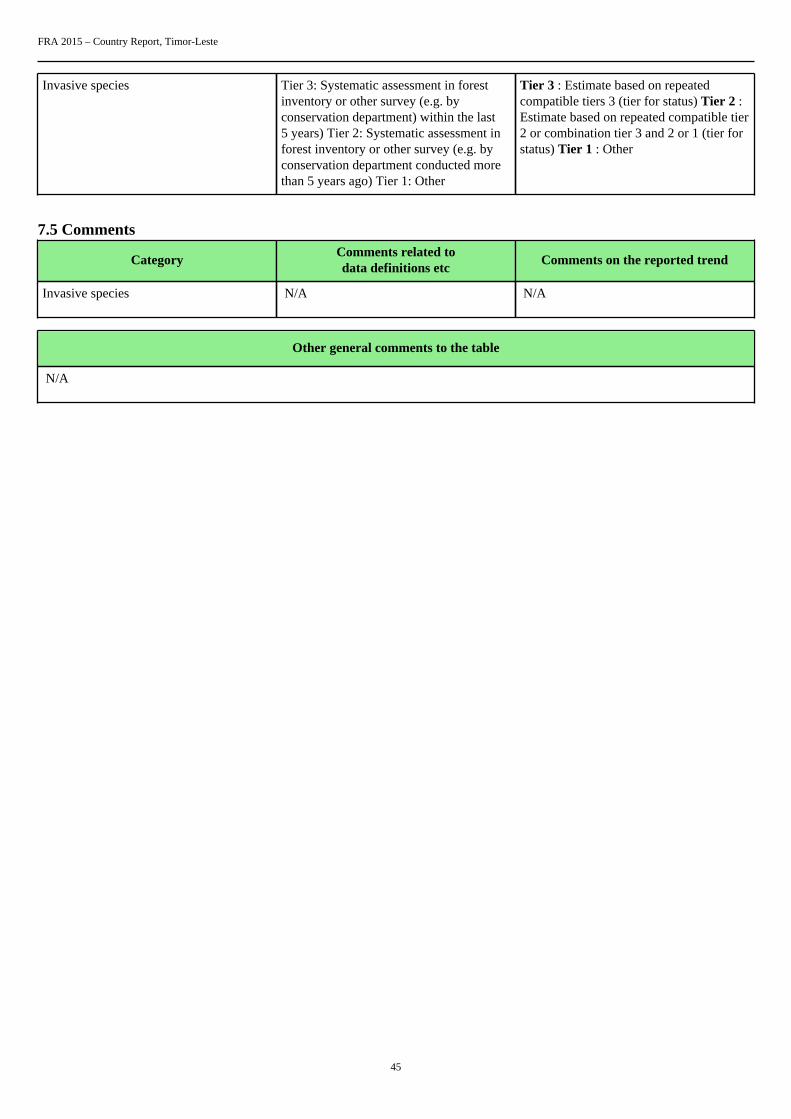
Invasive species Tier 3: Systematic assessment in forestinventory or other survey (e.g. byconservation department) within the last5 years) Tier 2: Systematic assessment inforest inventory or other survey (e.g. byconservation department conducted morethan 5 years ago) Tier 1: Other
Tier 3 : Estimate based on repeatedcompatible tiers 3 (tier for status) Tier 2 :Estimate based on repeated compatible tier2 or combination tier 3 and 2 or 1 (tier forstatus) Tier 1 : Other
7.5 Comments
CategoryComments related todata definitions etc
Comments on the reported trend
Invasive species N/A N/A
Other general comments to the table
N/A
FRA 2015 – Country Report, Timor-Leste
46
8. How much forest area is damaged each year?Documents for this question:
• Guide for country reporting FRA 2015• FRA 2015 Terms and Definitions
8.1 Categories and definitions
Category Definition
Number of fires Number of fires per year
Burned area Area burned per year
Outbreaks of insects A detectable reduction in forest health caused by a sudden increase in numbers of harmful insects.
Outbreaks of diseases A detectable reduction in forest health caused by a sudden increase in numbers of harmful pathogens,such as bacteria, fungi, phytoplasma or virus.
Severe weather events Damage caused severe weather events, such as snow, storm, drought, etc.
8.2 National data
8.2.1 Data sources
References to sourcesof information
Variables Years Additional comments
1 N/A N/A N/A N/A
2 N/A N/A N/A N/A
3 N/A N/A N/A N/A
4 N/A N/A N/A N/A
8.2.2 Classification and definitions
National class Definition
N/A N/A
N/A N/A
N/A N/A
N/A N/A
8.2.3 Original data

FRA 2015 – Country Report, Timor-Leste
47
8.3 Analysis and processing of national data
8.3.1 Adjustment
8.3.2 Estimation and forecasting
8.3.3 Reclassification
8.4 DataTable 8a
000 ha, number of fires
2003 2004 2005 2006 2007Category
000 ha # 000 ha # 000 ha # 000 ha # 000 ha #
Totalland areaburned
7.98 N/A 17.08 N/A 9.11 N/A 21.97 N/A 11.34 N/A
... ofwhichforestareaburned
1.4 N/A 4.95 N/A 1.55 N/A 8.4 N/A 4.43 N/A
2008 2009 2010 2011 2012Category
000 ha # 000 ha # 000 ha # 000 ha # 000 ha #
Totalland areaburned
9.86 N/A 11.57 N/A 0.42 N/A 2.99 N/A 4.84 N/A
... ofwhichforestareaburned
0.9 N/A 1.84 N/A 0.1 N/A 0.77 N/A 2.17 N/A
Table 8b
Outbreak category Description/name Year(s) of latest outbreak Area damaged (000 hectares)
N/A Santalus Albus 2005 0.003
N/A Tectona Grandis 2007 0.1

FRA 2015 – Country Report, Timor-Leste
48
N/A Ptherocarpos indicus 2007 0.1
N/A N/A N/A N/A
N/A N/A N/A N/A
N/A N/A N/A N/A
N/A N/A N/A N/A
N/A N/A N/A N/A
N/A N/A N/A N/A
N/A N/A N/A N/A
Outbreak category
1 Insects
2 Diseases
3 Severe weather events
Tiers
Category Tier for status Tier for trend
Area affected by fire N/A N/A
• Insects• Diseases• Severe weather events
N/A N/A
Tier criteria
Category Tier for status Tier for reported trend
Burned area Tier 3 : National fire monitoring routinesTier 2 : Remote sensing surveys Tier 1 :Other
Tier 3 : Estimate based on repeatedcompatible tiers 3 (tier for status) Tier 2 :Estimate based on repeated compatible tier2 or combination tier 3 and 2 or 1 (tier forstatus) Tier 1 : Other
• Insects• Diseases• Severe weather events
Tier 3 : Systematic survey (e.g. viainventory or aerial damage assessment)Tier 2 : Management records Tier 1 :Other
Tier 3 : Estimate based on repeatedcompatible tiers 3 (tier for status) Tier 2 :Estimate based on repeated compatible tier2 or combination tier 3 and 2 or 1 (tier forstatus) Tier 1 : Other
8.5 Comments
CategoryComments related todata definitions etc
Comments on the reported trend
FRA 2015 – Country Report, Timor-Leste
49
Burned area N/A N/A
Insects N/A N/A
Diseases N/A N/A
Severe weather events N/A N/A
Other general comments to the table
N/A
FRA 2015 – Country Report, Timor-Leste
50
9. What is the forest area with reduced canopy cover?Documents for this question:
• Guide for country reporting FRA 2015• FRA 2015 Terms and Definitions
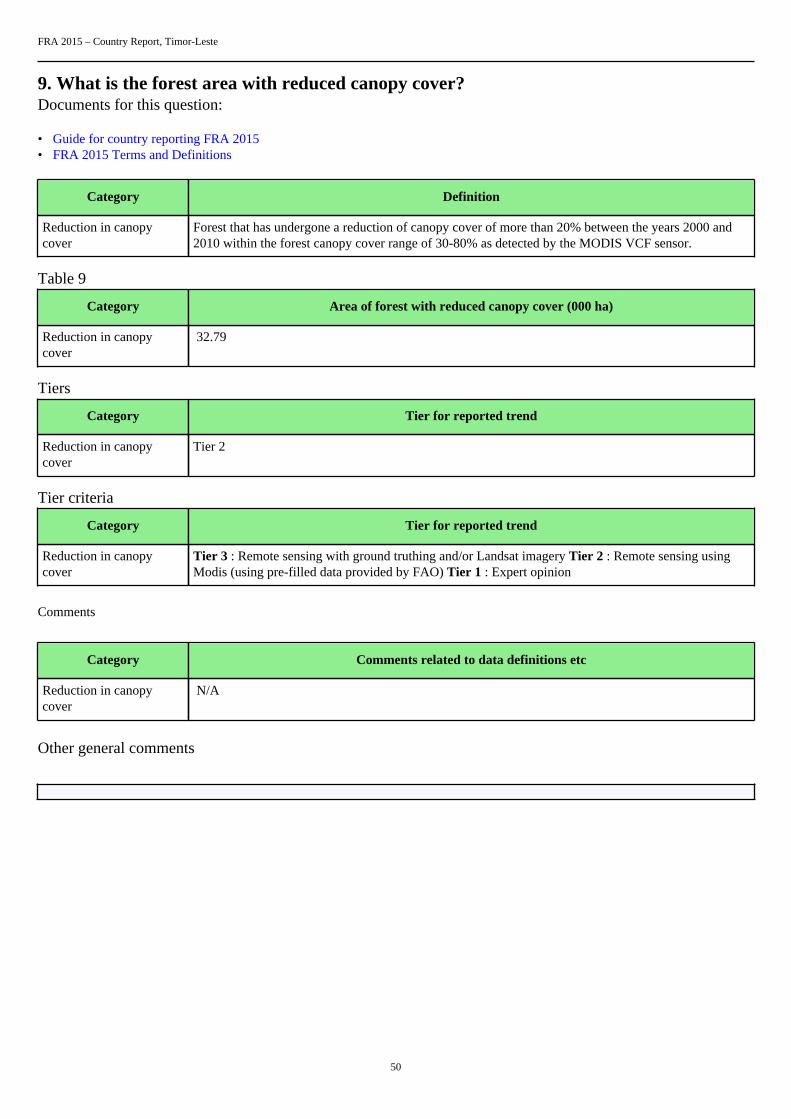
Category Definition
Reduction in canopycover
Forest that has undergone a reduction of canopy cover of more than 20% between the years 2000 and2010 within the forest canopy cover range of 30-80% as detected by the MODIS VCF sensor.
Table 9
Category Area of forest with reduced canopy cover (000 ha)
Reduction in canopycover
32.79
Tiers
Category Tier for reported trend
Reduction in canopycover
Tier 2
Tier criteria
Category Tier for reported trend
Reduction in canopycover
Tier 3 : Remote sensing with ground truthing and/or Landsat imagery Tier 2 : Remote sensing usingModis (using pre-filled data provided by FAO) Tier 1 : Expert opinion
Comments
Category Comments related to data definitions etc
Reduction in canopycover
N/A
Other general comments
FRA 2015 – Country Report, Timor-Leste
51
10. What forest policy and regulatory framework exists to support implementation ofsustainable forest management SFM?Documents for this question:
• Guide for country reporting FRA 2015• FRA 2015 Terms and Definitions
10.1 Categories and definitions
Category Definition
Policies supportingsustainable forestmanagement
Policies or strategies that explicitly encourage sustainable forest management.
Legislation andregulations supportingsustainable forestmanagement
Legislation and regulations that govern and guide sustainable forest management, operations and use.
10.2 National data
10.2.1 Data sources
References to sourcesof information
Variables Years Additional comments
1 N/A N/A N/A N/A
2 N/A N/A N/A N/A
3 N/A N/A N/A N/A
4 N/A N/A N/A N/A
10.2.2 Classification and definitions
National class Definition
N/A N/A
N/A N/A
N/A N/A
N/A N/A
10.2.3 Original data
10.3 Data

FRA 2015 – Country Report, Timor-Leste
52
Table 10
Sub-nationalCategoryNational
Regional Provincial/State Local
Policies supportingsustainable forestmanagement
... of which, in publiclyowned forests
... of which, in privatelyowned forests
Legislation andregulations supportingsustainable forestmanagement
... of which, in publiclyowned forests
... of which, in privatelyowned forests
10.4 Comments
Variable / category Comments related to data definitions etc
Policies supporting sustainable forest management N/A
Legislation and regulations supporting sustainable forestmanagement
N/A
Other general comments

FRA 2015 – Country Report, Timor-Leste
53
11. Is there a national platform that promotes stakeholder participation in forest policydevelopment?Documents for this question:
• Guide for country reporting FRA 2015• FRA 2015 Terms and Definitions
11.1 Categories and definitions
Category Definition
National stakeholderplatform
A recognized procedure that a broad range of stakeholders can use to provide opinions, suggestions,analysis, recommendations and other input into the development of national forest policy.
11.2 National data
11.2.1 Data sources
References to sources of information Years Additional comments
1 N/A N/A N/A
2 N/A N/A N/A
3 N/A N/A N/A
4 N/A N/A N/A
Table 11Is there a national platform that promotes or allows forstakeholder participation in forest policy development?
11.3 Comments
Category Comments related to data definitions etc
National stakeholder platform N/A
Other general comments
FRA 2015 – Country Report, Timor-Leste
54
12. What is the forest area intended to be in permanent forest land use and how has itchanged over time?Documents for this question:
• Guide for country reporting FRA 2015• FRA 2015 Terms and Definitions
12.1 Categories and definitions
Category Definition
Forest area intended to bein permanent forest landuse
Forest area that is designated or expected to be retained as forest and is highly unlikely to be convertedto other land use.
...of which permanentforest estate (sub-category)
Forest area that is designated by law or regulation to be retained as forest and may not be converted toother land use.
12.2 National data
12.2.1 Data sources
References to sourcesof information
Variables Years Additional comments
1 N/A N/A N/A N/A
2 N/A N/A N/A N/A
3 N/A N/A N/A N/A
4 N/A N/A N/A N/A
12.2.2 Classification and definitions
National class Definition
N/A N/A
N/A N/A
N/A N/A
N/A N/A
12.2.3 Original data
12.3 Analysis and processing of national data

FRA 2015 – Country Report, Timor-Leste
55
12.3.1 Adjustment
12.3.2 Estimation and forecasting
12.3.3 Reclassification
12.4 DataTable 12
Categories Forest area 2010 (000 ha)
Forest area intended to be in permanentforest land use
N/A
... of which permanent forest estate N/A
Tiers
Category Tier for status
Forest area intended to be in permanent forest land use N/A
Permanent forest estate N/A
Tier Criteria
Category Tier for status
Forest area intended to be in permanent forest land use Tier 3 : National or sub-national land use plans strategydocuments or other reports within the past 10 years Tier 2 :National or sub-national land use plans strategy documents orother reports within the past 20 years Tier 1 : Other
Permanent forest estate Tier 3 : National or sub-national land use plans strategydocuments or other reports within the past 10 years Tier 2 :National or sub-national land use plans strategy documents orother reports within the past 20 years Tier 1 : Other
12.5 Comments
Category Comments related to data definitions etc
Forest area intended to be in permanent forest land use N/A
Permanent forest estate N/A
FRA 2015 – Country Report, Timor-Leste
56
Other general comments
FRA 2015 – Country Report, Timor-Leste
57
13. How does your country measure and report progress towards SFM at the nationallevel?Documents for this question:
• Guide for country reporting FRA 2015• FRA 2015 Terms and Definitions
13.1 Categories and definitions
Category Definition
Forest area monitoredunder a national forestmonitoring framework
Forest area monitored by a national monitoring framework or systems that provide measurement basedperiodic monitoring of forest extent and quality.
Forest reporting atnational scale
National reporting of forest extent and characteristics that includes some measure of progress towardsustainable forest management.
13.2 National data
13.2.1 Data sources
References to sourcesof information
Variables Years Additional comments
1 N/A N/A N/A N/A
2 N/A N/A N/A N/A
3 N/A N/A N/A N/A
4 N/A N/A N/A N/A
13.2.2 Classification and definitions
National class Definition
N/A N/A
N/A N/A
N/A N/A
N/A N/A
13.3 DataTable 13a

FRA 2015 – Country Report, Timor-Leste
58
Check all boxes that apply
Category% of totalforest area
Mostrecent year
Continuous PeriodicPermanent
groundplots
Temporaryground
plots
Aerial/remotesensingsamplebased
Aerial/remote
sensing fullcoverage
Forestinventory
N/A N/A
Other fieldassessments
N/A N/A
Updatesto othersources
N/A N/A
Expertestimate
N/A N/A
Table 13b
Type of forest reporting used at national scale Check boxes that apply
1 Criteria and Indicators reporting
2 Periodic national state of the forest report
3 Other (please document)
4 None
Other type of forest reporting
N/A
13.4 Comments
Category Comments
N/A N/A
N/A N/A
N/A N/A
Other general comments
FRA 2015 – Country Report, Timor-Leste
59
14. What is the area of forest under a forest management plan and how is this monitored?Documents for this question:
• Guide for country reporting FRA 2015• FRA 2015 Terms and Definitions
14.1 Categories and definitions
Category Definition
Forest area withmanagement plan
Forest area that has a long-term documented management plan, aiming at defined management goalswhich is periodically revised
...of which for production(sub-category)
Forest management plan mainly focused on production
...of which forconservation (sub-category)
Forest management plan mainly focused on conservation
Monitoring of forestmanagement plans
Government monitoring of forest management plan implementation conducted through field visits oraudits of forest management plan performance
14.2 National data
14.2.1 Data sources
References to sourcesof information
Variables Years Additional comments
1 N/A N/A N/A N/A
2 N/A N/A N/A N/A
3 N/A N/A N/A N/A
4 N/A N/A N/A N/A
14.3 DataTable 14a
Forest plan type Forest area 2010 (000 ha)
Forest area with management plan N/A
... of which for production N/A
... of which for conservation N/A
Table 14b
Indicate which (if any) of the following are required in forest management plans in your country
1 Soil and water management
FRA 2015 – Country Report, Timor-Leste
60
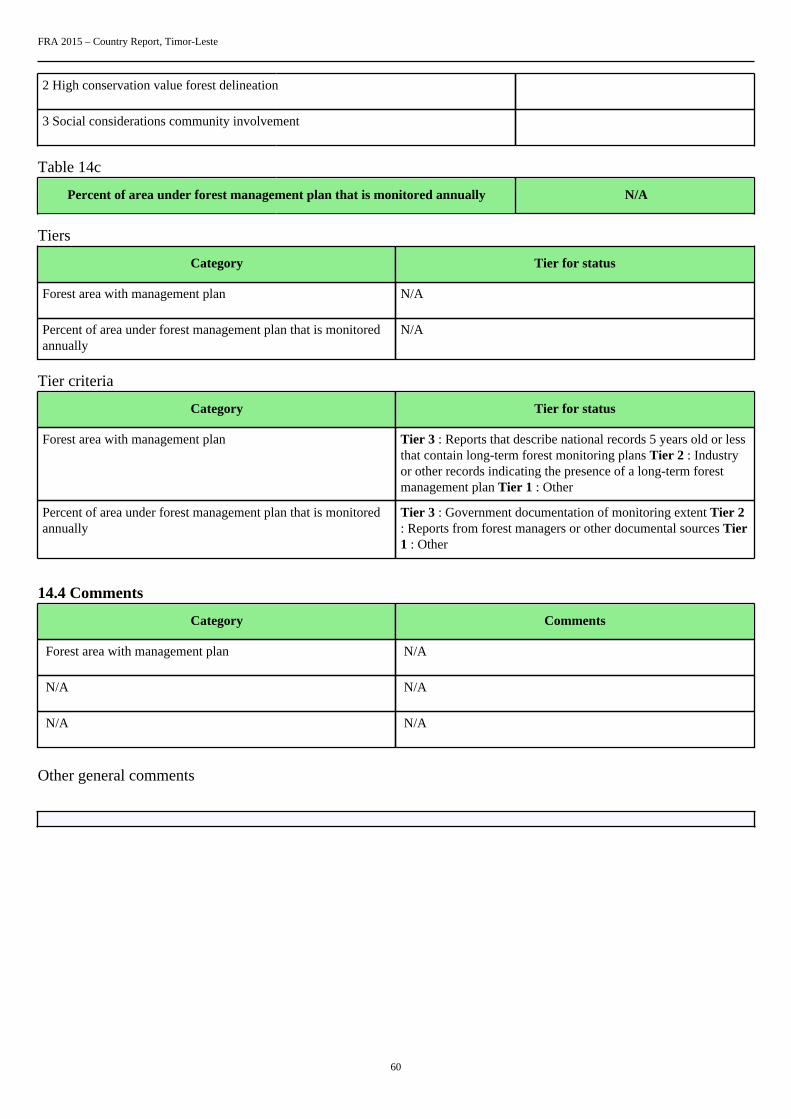
2 High conservation value forest delineation
3 Social considerations community involvement
Table 14c
Percent of area under forest management plan that is monitored annually N/A
Tiers
Category Tier for status
Forest area with management plan N/A
Percent of area under forest management plan that is monitoredannually
N/A
Tier criteria
Category Tier for status
Forest area with management plan Tier 3 : Reports that describe national records 5 years old or lessthat contain long-term forest monitoring plans Tier 2 : Industryor other records indicating the presence of a long-term forestmanagement plan Tier 1 : Other
Percent of area under forest management plan that is monitoredannually
Tier 3 : Government documentation of monitoring extent Tier 2: Reports from forest managers or other documental sources Tier1 : Other
14.4 Comments
Category Comments
Forest area with management plan N/A
N/A N/A
N/A N/A
Other general comments
FRA 2015 – Country Report, Timor-Leste
61
15. How are stakeholders involved in the management decision making for publiclyowned forests?Documents for this question:
• Guide for country reporting FRA 2015• FRA 2015 Terms and Definitions
15.1 Categories and definitions
Category Definition
Stakeholder involvement Stakeholder involvement is defined as significant inputs into at least one aspect of forest management atthe operational scale
Table 15
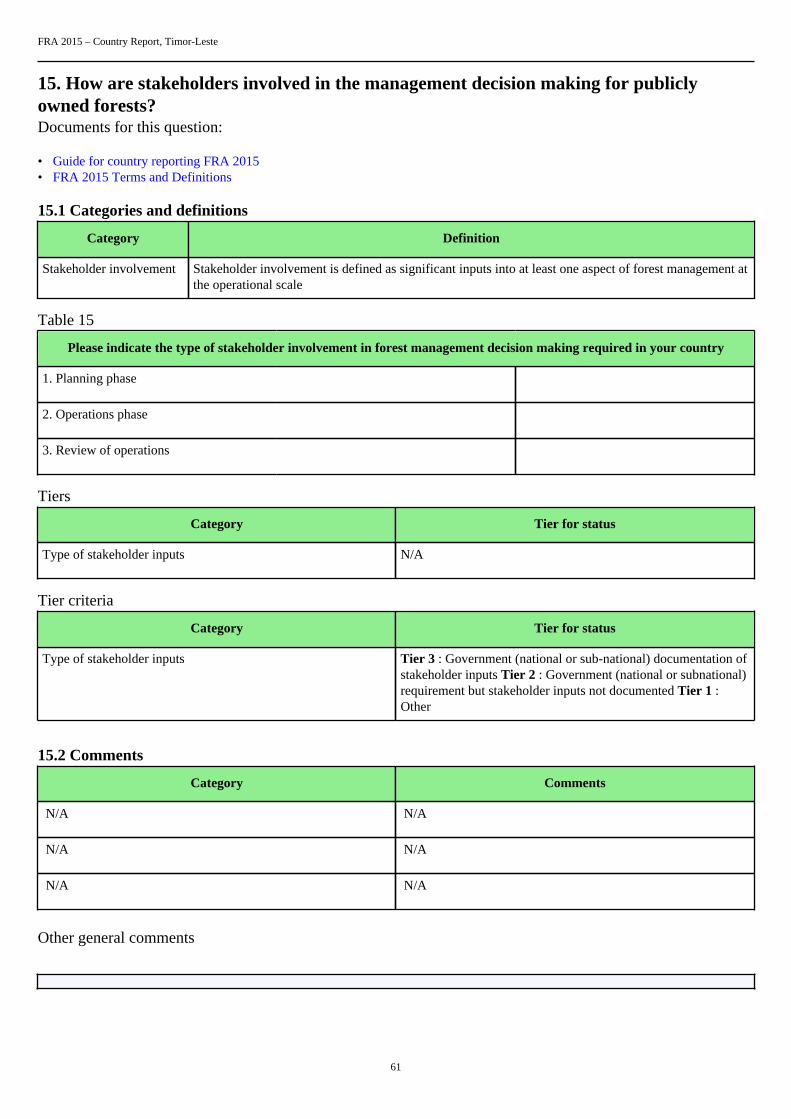
Please indicate the type of stakeholder involvement in forest management decision making required in your country
1. Planning phase
2. Operations phase
3. Review of operations
Tiers
Category Tier for status
Type of stakeholder inputs N/A
Tier criteria
Category Tier for status
Type of stakeholder inputs Tier 3 : Government (national or sub-national) documentation ofstakeholder inputs Tier 2 : Government (national or subnational)requirement but stakeholder inputs not documented Tier 1 :Other
15.2 Comments
Category Comments
N/A N/A
N/A N/A
N/A N/A
Other general comments

FRA 2015 – Country Report, Timor-Leste
62
16. What is the area of forest under an independently verified forest certification scheme?Documents for this question:
• Guide for country reporting FRA 2015• FRA 2015 Terms and Definitions
16.1 Categories and definitions
Category Definition
FSC certification Forest area certified under the Forest Stewardship Council certification scheme
PEFC certification Forest area certified under the Programme for the Endorsement of Forest Certification scheme
Other international forestmanagement certification
Forest area certified under an international forest management certification scheme with publishedstandards and is independently verified by a third-party, excluding FSC and PEFC certification.
Certified forest areausing a domestic forestmanagement certificationscheme
Area certified under a forest management certification scheme with published standards that arenationally recognized and independently verified by a thirdparty
16.2 DataTable 16a
Forest area (000 ha)International forest
management certification2000 2001 2002 2003 2004 2005 2006
FSC 0 0 0 0 0 0 0
PEFC 0 0 0 0 0 0 0
Other 0 0 0 0 0 0 0
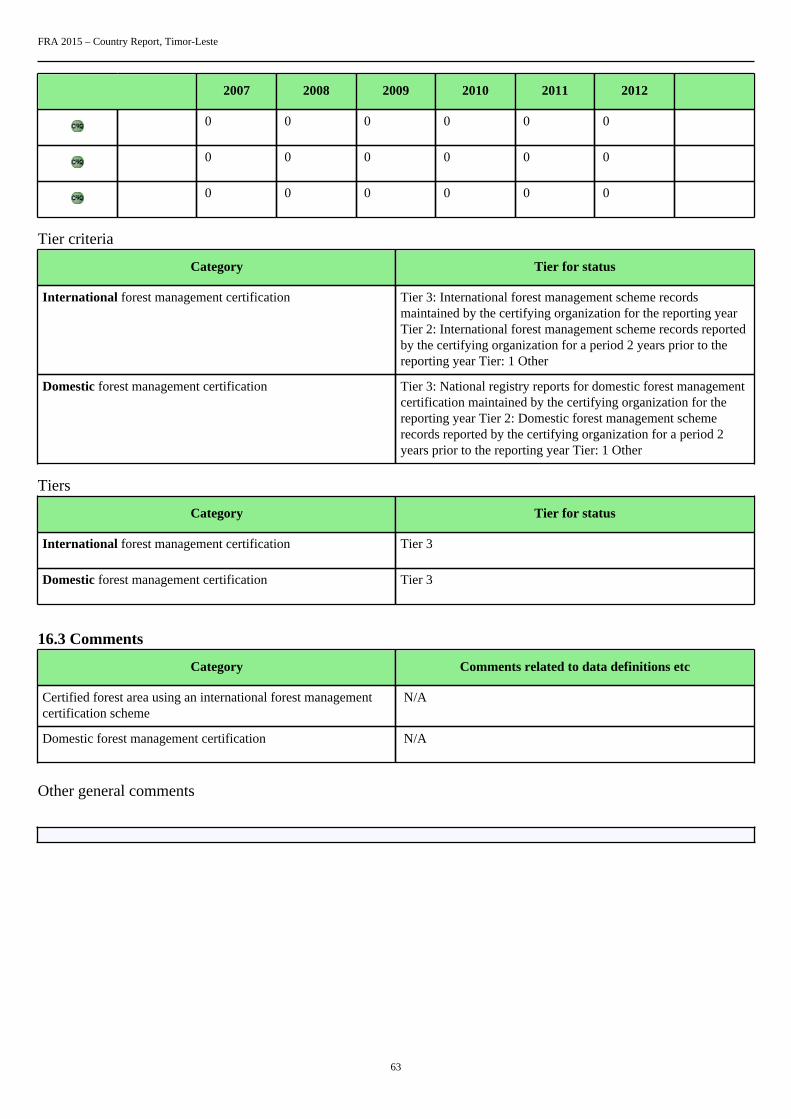
2007 2008 2009 2010 2011 2012
FSC 0 0 0 0 0 0
PEFC 0 0 0 0 0 0
Other 0 0 0 0 0 0
Table 16b
Forest area (000 ha)Domestic forest
management certification2000 2001 2002 2003 2004 2005 2006
N/A 0 0 0 0 0 0 0
N/A 0 0 0 0 0 0 0
N/A 0 0 0 0 0 0 0
FRA 2015 – Country Report, Timor-Leste
63
2007 2008 2009 2010 2011 2012
0 0 0 0 0 0
0 0 0 0 0 0
0 0 0 0 0 0
Tier criteria
Category Tier for status
International forest management certification Tier 3: International forest management scheme recordsmaintained by the certifying organization for the reporting yearTier 2: International forest management scheme records reportedby the certifying organization for a period 2 years prior to thereporting year Tier: 1 Other
Domestic forest management certification Tier 3: National registry reports for domestic forest managementcertification maintained by the certifying organization for thereporting year Tier 2: Domestic forest management schemerecords reported by the certifying organization for a period 2years prior to the reporting year Tier: 1 Other
Tiers
Category Tier for status
International forest management certification Tier 3
Domestic forest management certification Tier 3
16.3 Comments
Category Comments related to data definitions etc
Certified forest area using an international forest managementcertification scheme
N/A
Domestic forest management certification N/A
Other general comments
FRA 2015 – Country Report, Timor-Leste
64
17. How much money do governments collect from and spend on forests?Documents for this question:
• Guide for country reporting FRA 2015• FRA 2015 Terms and Definitions
17.1 Categories and definitions
Category Definition
Forest revenue All government revenue collected from the domestic production and trade of forest products andservices. For this purpose revenue include:• Goods : roundwood; sawnwood; biomass; woodbased panels; pulp and paper and non-wood forest
products.• Services : including concession fees and royalties, stumpage payments, public timber sales revenue
taxes and charges based on forest area or yield, taxes on domestic trade and export of forest products,special levies on forestry activities and payments into forest related funds, other miscellaneousinspection, licence and administrative fees levied by forest administrations, permit and licence feesfor recreation and other forest related activities.
Public expenditure onforestry
All government expenditure on forest related activities.
17.2 National data
17.2.1 Data sources
References to sourcesof information
Variables Years Additional comments
1 Forestry Annual Report -MAF
N/A 2008 N/A
2 N/A N/A N/A N/A
3 N/A N/A N/A N/A
4 N/A N/A N/A N/A
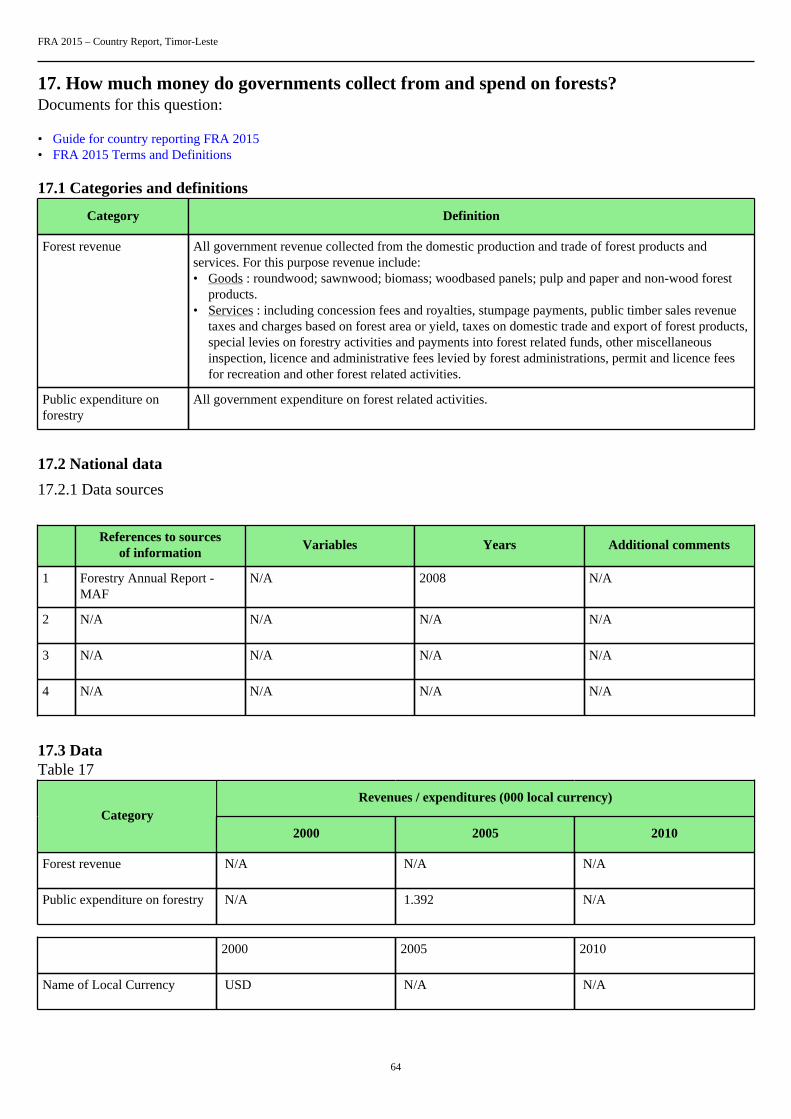
17.3 DataTable 17
Revenues / expenditures (000 local currency)Category
2000 2005 2010
Forest revenue N/A N/A N/A
Public expenditure on forestry N/A 1.392 N/A
2000 2005 2010
Name of Local Currency USD N/A N/A
FRA 2015 – Country Report, Timor-Leste
65
17.4 Comments
Category Comments related to data definitions etc
Forest revenue Regulation UNTAET.2000/17 prohibits extracting andexport wood from forest in Timor-Leste. Forest revenueis not significant due to insufficient law and regulation toregulate forest product circulation in nationwide. Most of forestplantations in Timor-Leste are privately owned by community,and there is no tax imposed to private forest plantation accordingto Tax and Revenue Department.
Public expenditure on forestry N/A
Other general comments N/A
Other general comments
FRA 2015 – Country Report, Timor-Leste
66
18. Who owns and manages the forests and how has this changed?Documents for this question:
• Guide for country reporting FRA 2015• FRA 2015 Terms and Definitions
18.1 Categories and definitions
Category Definition
Public ownership Forest owned by the State or administrative units of the public administration or by institutions orcorporations owned by the public administration.
...of which owned by thestate at national scale(sub-category)
Forest owned by the State at the national scale or administrative units of the public administration or byinstitutions or corporations owned by the public administration.
...of which owned by thestate at the sub-nationalgovernment scale (sub-category)
Forest owned by the State at the sub-national government scale or administrative units of the publicadministration or by institutions or corporations owned by the public administration.
Private ownership Forest owned by individuals, families, communities, private cooperatives corporations and otherbusiness entities, private, religious and educational institutions, pension or investment funds, NGOs,nature conservation associations and other private institutions.
...of which individuals(sub-category)
Forest owned by individuals and families.
...of which privatebusiness entities andinstitutions (sub-category)
Forest owned by private corporations cooperatives companies and other business entities as well asprivate nonprofit organizations such as NGOs nature conservation associations, and private religiousand educational institutions etc.
...of which local tribal andindigenous communities(sub-category)
Forest owned by a group of individuals belonging to the same community residing within or in thevicinity of a forest area or forest owned by communities of indigenous or tribal people The communitymembers are coowners that share exclusive rights and duties and benefits contribute to the communitydevelopment.
Unknown ownership Forest area where ownership is unknown includes areas where ownership is unclear or disputed.
Categories related tomanagement rights
of public forestsDefinition
Public Administration The Public Administration (or institutions or corporations owned by the Public Administration) retainsmanagement rights and responsibilities within the limits specified by the legislation.
Individuals households Forest management rights and responsibilities are transferred from the Public Administration toindividuals or households through long-term leases or management agreements.
Private companies Forest management rights and responsibilities are transferred from the Public Administration tocorporations, other business entities private cooperatives, private nonprofit institutions and associations,etc., through long-term leases or management agreements.
Communities Forest management rights and responsibilities are transferred from the Public Administration to localcommunities (including indigenous and tribal communities) through long-term leases or managementagreements.
Other form ofmanagement rights
Forests for which the transfer of management rights does not belong to any of the categories mentionedabove.
18.2 National data

FRA 2015 – Country Report, Timor-Leste
67
18.2.1 Data sources
References to sourcesof information
Variables Years Additional comments
1 Forest survey and orderingby Indonesian ForestryDepartment
All forest areas 1997 N/A
2 The study on integratedAgricultural Development inEast Timor by JICA
Inside Forest Areas 1997 This from Regional ForestryOffice
3 N/A N/A N/A N/A
4 N/A N/A N/A N/A
18.2.2 Classification and definitions
National class Definition
N/A N/A
N/A N/A
N/A N/A
N/A N/A
18.2.3 Original data
Area in 000 Ha Percentage
FRA Category 1997 1997
Private Ownership 745 67
Public Ownership 368 33
Other Ownership nda nda
Total 1113 100
18.3 Analysis and processing of national data
FRA 2015 – Country Report, Timor-Leste
68
18.3.1 Adjustment
18.3.2 Estimation and forecasting
The area under different ownership in 1990, 2000, 2005 and 2010 has been estimated using percentage ofdifferent ownership of forests in 1997.
18.3.3 Reclassification
18.4 DataTable 18a
Forest area (1000 hectares)Categories
1990 2000 2005 2010
Public ownership 319 282 263 226
... of which ownedby the state atnational scale
N/A N/A N/A N/A
... of which ownedby the state atthe sub-nationalgovernment scale
N/A N/A N/A N/A
Private ownership 647 572 535 461
... of which ownedby individuals
N/A N/A N/A N/A
... of which ownedby private businessentities andinstitutions
N/A N/A N/A N/A
... of which ownedby local, tribaland indigenouscommunities
N/A N/A N/A N/A
Unknownownership
0 0 0 0
TOTAL 966.00 854.00 798.00 687.00
Tiers
Category Tier for status Tier for reported trend
FRA 2015 – Country Report, Timor-Leste
69
Public ownership Tier 1 Tier 1
Private ownership Tier 1 Tier 1
Unknown ownership Tier 1 Tier 1
Tier criteria
Category Tier for status Tier for reported trend
Ownership Tier 3: National forestry statistics registersof land titles or maps on land ownershipor all forest area under one ownershipcategory that is five years old or less. Tier2:National forestry statistics registers ofland titles or maps on land ownership orquestionnaires that are more than fiveyears old. Tier 1: Other
Tier 3 : Estimate based on repeatedcompatible tiers 3 (tier for status) Tier 2 :Estimate based on repeated compatible tier2 or combination tier 3 and 2 or 1 (tier forstatus) Tier 1 : Other
Table 18b - Holder of management rights of public forests
Forest area (000 hectares)Categories
1990 2000 2005 2010
Public Administration 0 0 0 0
Individuals 0 0 0 0
Private companies 0 0 0 0
Communities 319 282 263 226
Other 0 0 0 0
TOTAL 319.00 282.00 263.00 226.00
Category Tier for reported trend Tier for status
Public Administration Tier 1 Tier 1
Individuals Tier 1 Tier 1
Private companies Tier 1 Tier 1
Communities Tier 1 Tier 1
Other Tier 1 Tier 1
18.5 Comments
CategoryComments related todata definitions etc
Comments on the reported trend
FRA 2015 – Country Report, Timor-Leste
70
Public ownership N/A N/A
Private ownership N/A N/A
Unknown ownership N/A N/A
Management rights According to the RDTL Constitution theGovernment maintains the major authorityto manage forest areas but in practice themajority is managed by communities.
N/A
Other general comments to the table
Timor-Leste has limitated data to update T2, due to poor documentation on changes in forest areas and there is no current nationalforest inventory.

FRA 2015 – Country Report, Timor-Leste
71
19. How many people are directly employed in forestry?Documents for this question:
• Guide for country reporting FRA 2015• FRA 2015 Terms and Definitions
19.1 Categories and definitions
Category Definition
Full-time equivalents(FTE)
A measurement equal to one person working full-time during a specified reference period.
Employment in forestry Employment in activities related to production of goods derived from forests. This category correspondsto the ISIC/NACE Rev. 4 activity A02 (Forestry and logging).
19.2 National data
19.2.1 Data sources
References to sourcesof information
Variables Years Additional comments
1 N/A N/A N/A N/A
2 N/A N/A N/A N/A
3 N/A N/A N/A N/A
4 N/A N/A N/A N/A
19.2.2 Classification and definitions
National class Definition
N/A N/A
N/A N/A
N/A N/A
N/A N/A
19.2.3 Original data
19.3 DataTable 19
Category Employment (000 years FTE)
FRA 2015 – Country Report, Timor-Leste
72
1990 2000 2005 2010
Employment inforestry
N/A N/A N/A N/A
... of which female N/A N/A N/A N/A
19.4 Comments
CategoryComments related todata definitions etc
Comments on the reported trend
Employment in forestry N/A N/A
Other general comments to the table
There are no quantitative data on the percentage of the population that obtains employment in forestry except in governmentservices, which at present employs 57 permanent staff. In rural areas however, forestry activities that provides cash income wherethe community members are mostly engaged includes fuel wood gathering, hunting, collection of palm wine, production of palmstem panel for house walling, collection of palm leaves for house roofing, harvesting of rattan, harvesting of bamboo, thinning,nursery and gathering of honey.
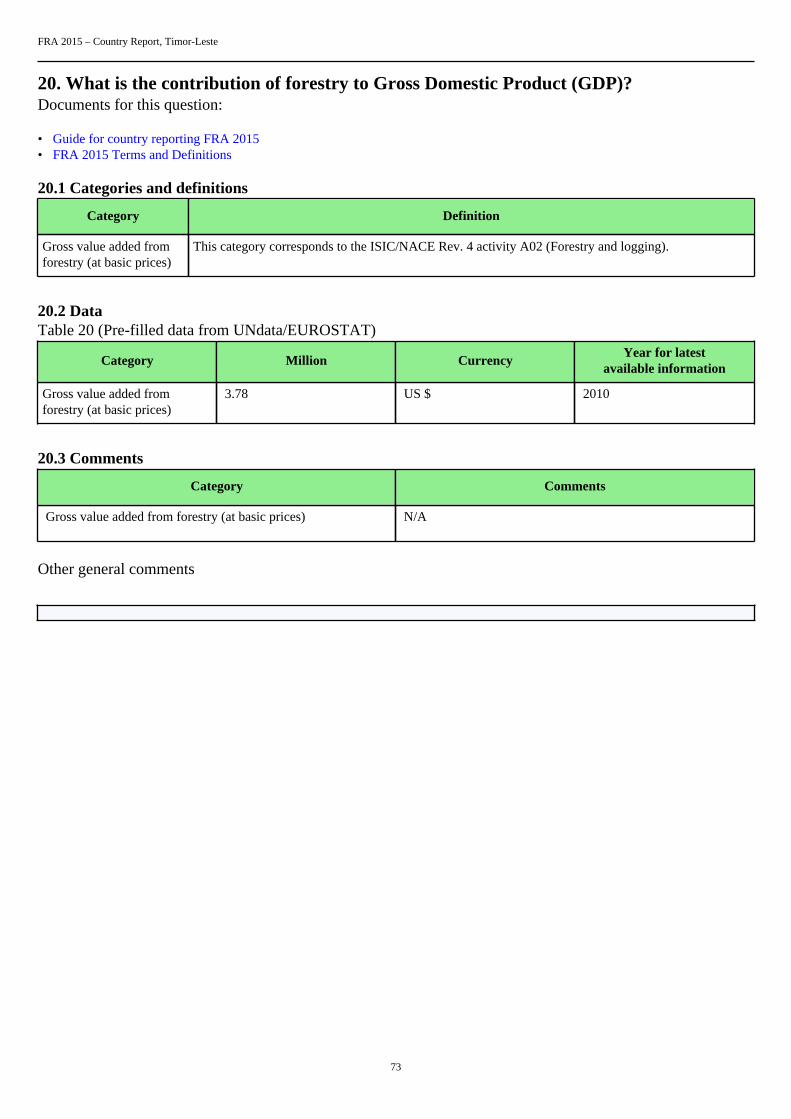
FRA 2015 – Country Report, Timor-Leste
73
20. What is the contribution of forestry to Gross Domestic Product (GDP)?Documents for this question:
• Guide for country reporting FRA 2015• FRA 2015 Terms and Definitions
20.1 Categories and definitions
Category Definition
Gross value added fromforestry (at basic prices)
This category corresponds to the ISIC/NACE Rev. 4 activity A02 (Forestry and logging).
20.2 DataTable 20 (Pre-filled data from UNdata/EUROSTAT)
Category Million CurrencyYear for latest
available information
Gross value added fromforestry (at basic prices)
3.78 US $ 2010
20.3 Comments
Category Comments
Gross value added from forestry (at basic prices) N/A
Other general comments

FRA 2015 – Country Report, Timor-Leste
74
21. What is forest area likely to be in the futureDocuments for this question:
• Guide for country reporting FRA 2015• FRA 2015 Terms and Definitions
21.1 Categories and definitions
Category Definition
Government target/aspiration for forest area
Government target/aspiration for forest area for a specific year.
Forests earmarked forconversion
Forest area that is allocated/classified or scheduled to be converted into non-forest uses.
21.2 National data
21.2.1 Data sources
References to sourcesof information
Variables Years Additional comments
1 N/A N/A N/A N/A
2 N/A N/A N/A N/A
3 N/A N/A N/A N/A
4 N/A N/A N/A N/A
21.3 DataTable 21a
Forest area (000 ha)Category
2020 2030
Government target/aspiration for forestarea
N/A N/A
Table 21b
Forest area (000 ha)Category
2013
Forests earmarked for conversion N/A
21.4 Comments
Category Comments
Government target/aspiration for forest area N/A

FRA 2015 – Country Report, Timor-Leste
75
Forests earmarked for conversion N/A
Other general comments