time series analysis of rainfall data and its geo
TRANSCRIPT

© 2019, IJSRMSS All Rights Reserved 272
International Journal of Scientific Research in ______________________________ Research Paper . Mathematical and Statistical Sciences
Vol.6, Issue.2, pp.272-283, April (2019) E-ISSN: 2348-4519
DOI: https://doi.org/10.26438/ijsrmss/v6i2.272283
Time series analysis of Rainfall data and its Geo-environmental inferences
on Girja Basin, Aurangabad District of Maharashtra, India
M.L. Dhumal1*
, K.R. Aher2
1Dept. of Mathematics, Deogiri College, Station road, Aurangabad-431001
2Groundwater Survey and Development Agency, Survey No.488, Ghati Road, Jalna-421303
*Corresponding Author: [email protected]
Available online at: www.isroset.org
Received: 21/Apr/2019, Accepted: 30/Apr/2019, Online: 30/Apr/2019 Abstract- An attempt has been made to find the outcomes of rainfall data analysisof groundwater system of Girja Basin,
Aurangabad district of Maharashtra, India, which is one of the most important hydrometerological parameter, and which also
directs the recharge event. Data analysis of rainfall records for a period of 29 years (1990 to 2018) of Girja basin and geo-
environmental inferences on groundwater system have been detailed and exhibited. Mathematical investigation of rainfall data
displays a variation range from 341.35 to 1362.6 mm with annual average of 649.28. The 341.35 mm rainfall occurred during
2012 and 1362.6mm rainfall occurred in 2000. Departures and Cumulative departure from the average annual rainfall have
been measured. Computed values of statistical parameters indicate a positive trend of rainfall. Estimation of Standard
Precipitation Index (SPI) indicates that out of last 29 years, one was extremely wet (SPI 2.0+); two were very wet (SPI 1.5 to
1.99); one moderately wet (SPI 1.0 to 1.49); 22 near normal (SPI 0.99 to -0.99); three moderately dry (SPI -1.0 to -1.49) years,
one severely dry (SPI -1.5 to -1.99); and two were extremely dry (SPI-2 and less), Estimations also indicates that post 1996,
both severity and occurrence of drought events has increased. Prediction of predictable rainfall trend for 5 years has been
envisaged. Geo-environmental inference of rainfall trends on the recharge of groundwater system erstwhile discussed. It is
suggested that the climb of rainfall on the precedence beginning need to determine the on-hand water problem by adopting
creating of various groundwater recharge structures in the study area.
Keywords: Rainfall Data analysis, Standard Precipitation Index, Geo-environmental inferences, Phulambri area, Aurangabad
District.
I. INTRODUCTION
India receives about 75–80% of its annual rainfall during the monsoon season (June–September). Butthe rainfall amount
received during monsoon season depicts large variability in time and space. This spatial and temporal variability of Indian
summer monsoon rainfall (ISMR) increases the complexity in its prediction on smaller space–time domain, with the aim to
achieve improved prediction skill of ISMR on smaller spatial scales, a large number of studies have been done to construct the
contiguous regions over Indian landmass. Nicholson [1] has shown that average over a homogeneous region reduces the data
volume and takes care of small-scale variability. Also, the averaging helps to enhance the signal variation at larger spatial
scales [2]. The climate change is too high for India compared to the global climatic variability. It has further led to the essence
of determining whether the trend is increasing or decreasing. The changes in the most important climatological parameter i.e.
rainfall, may be responsible for the natural calamities like drought and flood conditions [3], rainfall variability is of spatial and
temporal forms and within these variations if by time series analysis no significant trend is obtained then the rainfall is steady,
otherwise, it has changed, generally, the study of weather and climatic elements of a region is vital for sustainable development
of agriculture and planning. Particularly, rainfall and temperature temporal analyses for trends, fluctuations and periodicities
are deemed necessary as such can indirectly furnish with health status of an environment [4,5,6]. Monsoon is the important
season of Indian Agriculture; because of 70 percent total cultivated area of the country is under rain fed. The uncertainty of
rainfall as well as its uneven distribution during the crop growth period affects the agriculture production adversely. It is
described that all possible efforts be made to understand and predict the weather well in advance. So, the farmer can get

Int. J. Sci. Res. in Mathematical and Statistical Sciences Vol. 6(2), Apr 2019, ISSN: 2348-4519
© 2019, IJSRMSS All Rights Reserved 273
sufficient time to cope with prevailing situation. As the rainfall and its distribution plays important role in deciding thesuccess
or failure of a crop in a given season [7]. Change in climate is a long-term phenomenon and most alarming issues for the entire
world, therefore; quantification of climate changes has become preliminary. Identification of temporal trend of
hydrometerological variables is important to sustainable management and development of water resources infuture. Rainfall is
one of a most important events of the hydrological cycle [8,9]. The rainfall is most important hydrometerological factor that
plays a very significant role in their charge of groundwater system. Rainfall is a usually followed expression for the liquid form
of precipitation, which contributes in solving the problems related with water bodies [10]. Rainfall is not an accurate loss as
well as travel time for the vertical percolation in the permeable formation to several months or years for deep water tables
underlying sediments with low vertical permeability [11]. Rainfall infiltration provides most important resource of ground
water recharge. The rock formations encountered in upper layers of the earth are commonly measured as the basis for dividing
country into different regions for assuming the percentage of rainfall infiltration [12]. Rainfall is the meteorological
phenomenon that has the greatest impact on human activities and the most important environmental factor limiting the
development of the semi arid regions [13]. Understanding rainfall variability is essential to optimally manage the scarce water
resources that areunder continuous stress due to the increasing water demands, increase in population, and the economic
development [14]. Hence an attempt has been made to find out the trend of rainfall and its geo-environmental inferences on
Girja Basin of Phulambri block in Aurangabad district, Maharashtra.
II. CHARACTERISTICS OF STUDY AREA
This study focuses on the Phulambri block in the northeastern part of the Aurangabad district, the block investigated lies
between 75o19’ to 75
o39’ E and 20
o17’ to 20
o02’ N, covers an area of approximately 658.9 km
2 and is bounded by the
Lakenwara hills to the south and by the Mhaismal hills to the north. The Girja Basin is the central part of the study area. The
average annual rainfall in Phulambri taluka is 649.28 mm. About 83% of annual rainfall is received during June to September.
The intact area is enclosed and bounded mainly by basaltic lava flows of the Deccan volcanic province of upper Cretaceous to
Eocene age. The major geological units observed are the horizontally disposed basaltic lava flows having two units. This
basaltic lava flows are the merely water bearing formations. The weathered and fractured mantles of the traps are forming
water table aquifers in the area where ground water arises under phreatic conditions [15,16].
III. RAINFALL DATA ANALYSIS
The total rainfall received in a given period at a location is highly variable from one year to another. The variability depends on
the type of climate and the length of the considered period. In general, it can be stated that the drier the climate, the higher the
variability of rainfall in time. The same hold for the length of the period: the shorter the period the higher the annual variability
of rainfall in that period [17]. The rainfall data are analyzed by using arithmetic and statistical method. In the present work
rainfall data in respect of Girja basin area of Phulambri block of Aurangabad district, Maharashtra have been collected for the
period of 29-year (1990 to 2018) from the Agricultural Department (Maharain) [18], Maharashtra state and Indian metrological
department (IMD) GOI [19]. Rainfall data have been subjected to common procedure of hydrometerological data analysis. The
rainfall data of Girja basin area of 29 years (1990 to 2018) have been displayed (Table1, 2 and Figure 1). The Rainfall data
indicate a wide range of variation from 341.35 mm to 1362.6 mmwith mean (649.28), median(622.18) standard deviation
(217.79), Kurtosis (2.94), Skewness (1.45).
Table.2 Descriptive statistics of study area
Name of parameter Value
Mean 649.28
Median 622.18
Standard Deviation 217.79
Kurtosis 2.94
Skewness 1.45
Range 1021.25
Minimum 341.35
Maximum 1362.6
Sum 18829.18

Int. J. Sci. Res. in Mathematical and Statistical Sciences Vol. 6(2), Apr 2019, ISSN: 2348-4519
© 2019, IJSRMSS All Rights Reserved 274
Fig.1. Rainfall of Girja Basin of Phulambri block.
Table 1: Rainfall data of study area, showing departure and cumulative departure from average annual rainfall during
period of 1990-2018 and SPI value.
Sr.No. Year Rainfall
(mm) Departure from average(mm)
Cumulative departure from average
rainfall(mm)
SPI
1 1990 1043.9 -394.618 -394.618 3.3
2 1991 840.4 -191.118 -585.736 1.8
3 1992 769.9 -120.618 -706.354 1.5
4 1993 879.9 -230.618 -936.972 1.1
5 1994 647 2.2821 -934.69 0.9
6 1995 642.3 6.9821 -927.708 0.6
7 1996 735 -85.7179 -1013.43 0.6
8 1997 458 191.2821 -822.143 0.4
9 1998 972.3 -323.018 -1145.16 0.2
10 1999 514 135.2821 -1009.88 0.1
11 2000 1362.6 -713.318 -1723.2 0.0
12 2001 547 102.2821 -1620.91 0.0
13 2002 614 35.2821 -1585.63 0.0
14 2003 605.9 43.3821 -1542.25 0.0
15 2004 464.2 185.0821 -1357.17 -0.1
16 2005 497.3 151.9821 -1205.19 -0.2
17 2006 650.5 -1.2179 -1206.4 -0.2
18 2007 622.18 27.1021 -1179.3 -0.4
19 2008 520.96 128.3221 -1050.98 -0.5
20 2009 448.49 200.7921 -850.188 -0.6
21 2010 672.79 -23.5079 -873.696 -0.6
22 2011 454.65 194.6321 -679.064 -0.7
Int. J. Sci. Res. in Mathematical and Statistical Sciences Vol. 6(2), Apr 2019, ISSN: 2348-4519
© 2019, IJSRMSS All Rights Reserved 275
23 2012 341.35 307.9321 -371.132 -0.9
24 2013 689.25 -39.9679 -411.1 -0.9
25 2014 431.01 218.2721 -192.828 -0.9
26 2015 785.8 -136.518 -329.345 -0.9
27 2016 646.2 3.0821 -326.263 -1.0
28 2017 556.5 92.7821 -233.481 -1.1
29 2018 415.8 233.4821 0.0008 -1.4
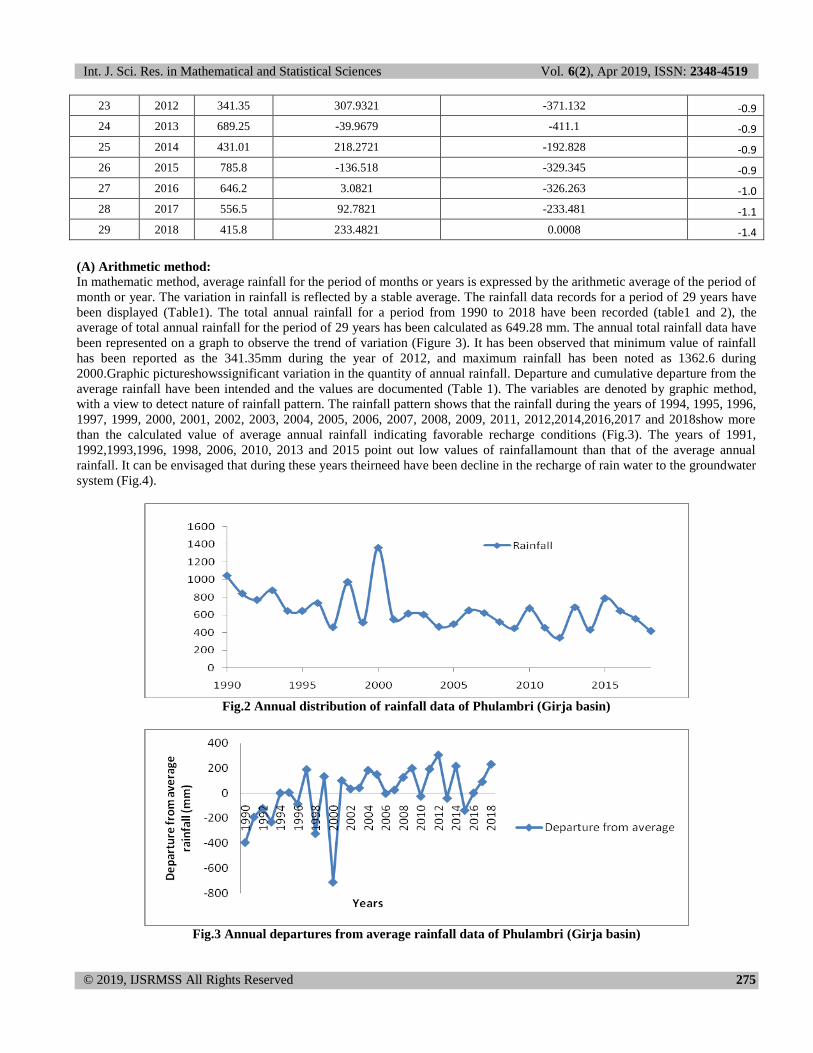
(A) Arithmetic method:
In mathematic method, average rainfall for the period of months or years is expressed by the arithmetic average of the period of
month or year. The variation in rainfall is reflected by a stable average. The rainfall data records for a period of 29 years have
been displayed (Table1). The total annual rainfall for a period from 1990 to 2018 have been recorded (table1 and 2), the
average of total annual rainfall for the period of 29 years has been calculated as 649.28 mm. The annual total rainfall data have
been represented on a graph to observe the trend of variation (Figure 3). It has been observed that minimum value of rainfall
has been reported as the 341.35mm during the year of 2012, and maximum rainfall has been noted as 1362.6 during
2000.Graphic pictureshowssignificant variation in the quantity of annual rainfall. Departure and cumulative departure from the
average rainfall have been intended and the values are documented (Table 1). The variables are denoted by graphic method,
with a view to detect nature of rainfall pattern. The rainfall pattern shows that the rainfall during the years of 1994, 1995, 1996,
1997, 1999, 2000, 2001, 2002, 2003, 2004, 2005, 2006, 2007, 2008, 2009, 2011, 2012,2014,2016,2017 and 2018show more
than the calculated value of average annual rainfall indicating favorable recharge conditions (Fig.3). The years of 1991,
1992,1993,1996, 1998, 2006, 2010, 2013 and 2015 point out low values of rainfallamount than that of the average annual
rainfall. It can be envisaged that during these years theirneed have been decline in the recharge of rain water to the groundwater
system (Fig.4).
Fig.2 Annual distribution of rainfall data of Phulambri (Girja basin)
Fig.3 Annual departures from average rainfall data of Phulambri (Girja basin)

Int. J. Sci. Res. in Mathematical and Statistical Sciences Vol. 6(2), Apr 2019, ISSN: 2348-4519
© 2019, IJSRMSS All Rights Reserved 276
Fig.4 Annual cumulative departures from average rainfall of Girja basin
(B) Relationship between rainfall-rainy events
It was found that almost all the rainfall is received during monsoon, i.e. from months of June to September. Regression analysis
between annual rainfall as dependable variable and rainy days as independent variable for Phulambri rain gauge station indicate
that quantum of rainfall depends on the number of rainy days (fig.5). The R square value is 0.012. This relationship suggests
that a greater number of rainy days usually result in high rainfall and vice-a- versa except year 2000, 1362.6mm rainfall occurs
in 12 days. Difference between the mean number of rainy days and amount of rainfall amongst the above normal and below
normal rainfall years is 36 (rainy days) and 649mm respectively. This suggest that even a non-occurrence of a single day
rainfall significantly affect the amount of the total annual precipitation. Hence it is important to analyze impact of reduction in
number of rainy days on rainfall magnitude and drought occurrence.
Fig. 5 Relationship between Rainfall and Rainy days (1990-2018)
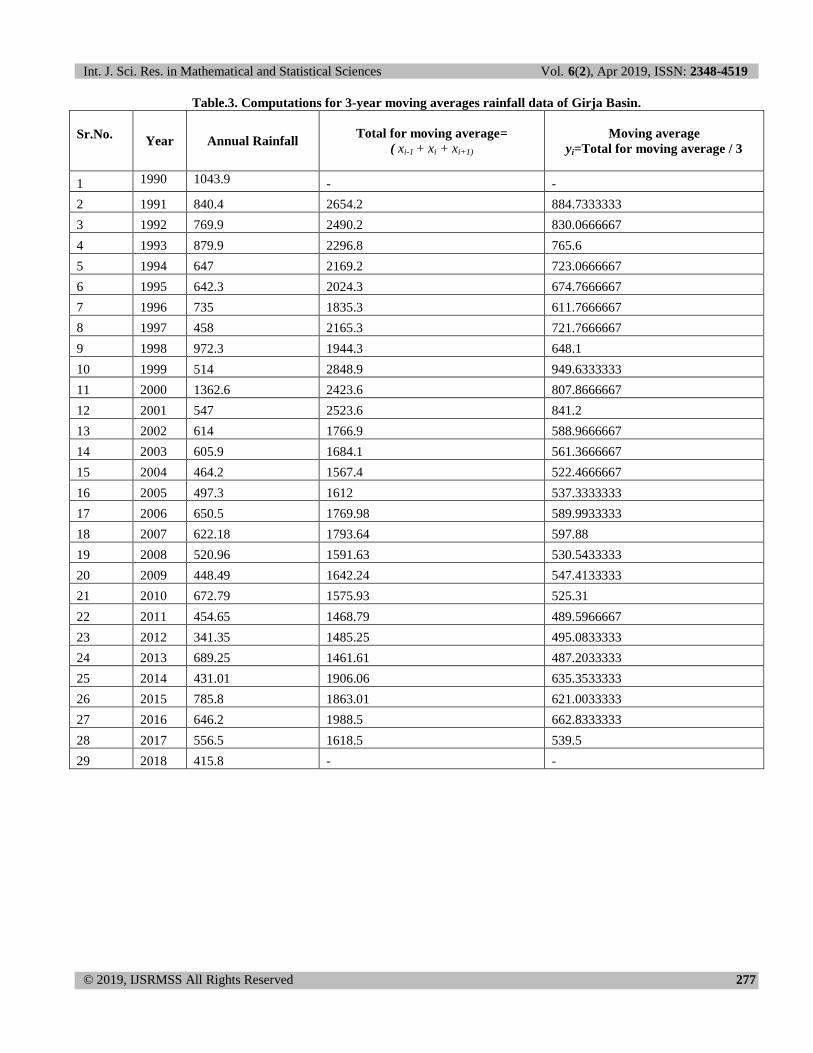
(C) Moving Average Curve (Cyclic Pattern)
The moving average curve smoothens out the extreme variations and indicate the trend or cyclic
pattern, if any, more clearly. It is also known as the moving mean curve. The procedure to construct the moving average curve
is as flows. The moving average curve is super imposed over the original rainfall series, though the variations in the original
data are smoothened out to some extent in the moving average curve, no apparent trend (Table 3 Figure 5). The moving
average curve is constructed with a moving period of m year, where m is generally taken to be 3 or 5 years. Let x1, x2, ……, xn
be the sequence of given annual rainfall in the chronological order. Let yi denote the ordinate of the moving average curve for
the ith
year. Then for m= 3, yis computed [11, 20].
yi= (xi-1 + xi + xi+1 ) / 3
Int. J. Sci. Res. in Mathematical and Statistical Sciences Vol. 6(2), Apr 2019, ISSN: 2348-4519
© 2019, IJSRMSS All Rights Reserved 277
Table.3. Computations for 3-year moving averages rainfall data of Girja Basin.
Sr.No. Year Annual Rainfall
Total for moving average=
( xi-1 + xi + xi+1)
Moving average
yi=Total for moving average / 3
1 1990 1043.9 - -
2 1991 840.4 2654.2 884.7333333
3 1992 769.9 2490.2 830.0666667
4 1993 879.9 2296.8 765.6
5 1994 647 2169.2 723.0666667
6 1995 642.3 2024.3 674.7666667
7 1996 735 1835.3 611.7666667
8 1997 458 2165.3 721.7666667
9 1998 972.3 1944.3 648.1
10 1999 514 2848.9 949.6333333
11 2000 1362.6 2423.6 807.8666667
12 2001 547 2523.6 841.2
13 2002 614 1766.9 588.9666667
14 2003 605.9 1684.1 561.3666667
15 2004 464.2 1567.4 522.4666667
16 2005 497.3 1612 537.3333333
17 2006 650.5 1769.98 589.9933333
18 2007 622.18 1793.64 597.88
19 2008 520.96 1591.63 530.5433333
20 2009 448.49 1642.24 547.4133333
21 2010 672.79 1575.93 525.31
22 2011 454.65 1468.79 489.5966667
23 2012 341.35 1485.25 495.0833333
24 2013 689.25 1461.61 487.2033333
25 2014 431.01 1906.06 635.3533333
26 2015 785.8 1863.01 621.0033333
27 2016 646.2 1988.5 662.8333333
28 2017 556.5 1618.5 539.5
29 2018 415.8 - -
Int. J. Sci. Res. in Mathematical and Statistical Sciences Vol. 6(2), Apr 2019, ISSN: 2348-4519
© 2019, IJSRMSS All Rights Reserved 278
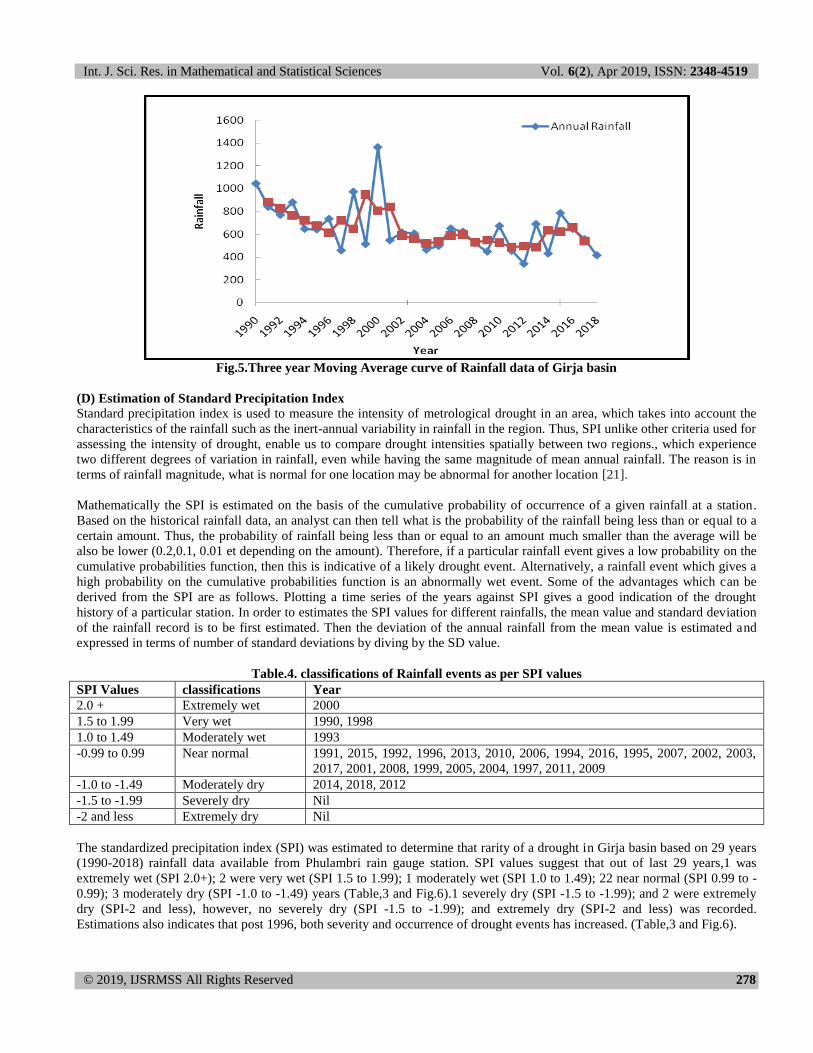
Fig.5.Three year Moving Average curve of Rainfall data of Girja basin
(D) Estimation of Standard Precipitation Index
Standard precipitation index is used to measure the intensity of metrological drought in an area, which takes into account the
characteristics of the rainfall such as the inert-annual variability in rainfall in the region. Thus, SPI unlike other criteria used for
assessing the intensity of drought, enable us to compare drought intensities spatially between two regions., which experience
two different degrees of variation in rainfall, even while having the same magnitude of mean annual rainfall. The reason is in
terms of rainfall magnitude, what is normal for one location may be abnormal for another location [21].
Mathematically the SPI is estimated on the basis of the cumulative probability of occurrence of a given rainfall at a station.
Based on the historical rainfall data, an analyst can then tell what is the probability of the rainfall being less than or equal to a
certain amount. Thus, the probability of rainfall being less than or equal to an amount much smaller than the average will be
also be lower (0.2,0.1, 0.01 et depending on the amount). Therefore, if a particular rainfall event gives a low probability on the
cumulative probabilities function, then this is indicative of a likely drought event. Alternatively, a rainfall event which gives a
high probability on the cumulative probabilities function is an abnormally wet event. Some of the advantages which can be
derived from the SPI are as follows. Plotting a time series of the years against SPI gives a good indication of the drought
history of a particular station. In order to estimates the SPI values for different rainfalls, the mean value and standard deviation
of the rainfall record is to be first estimated. Then the deviation of the annual rainfall from the mean value is estimated and
expressed in terms of number of standard deviations by diving by the SD value.
Table.4. classifications of Rainfall events as per SPI values
SPI Values classifications Year
2.0 + Extremely wet 2000
1.5 to 1.99 Very wet 1990, 1998
1.0 to 1.49 Moderately wet 1993
-0.99 to 0.99 Near normal 1991, 2015, 1992, 1996, 2013, 2010, 2006, 1994, 2016, 1995, 2007, 2002, 2003,
2017, 2001, 2008, 1999, 2005, 2004, 1997, 2011, 2009
-1.0 to -1.49 Moderately dry 2014, 2018, 2012
-1.5 to -1.99 Severely dry Nil
-2 and less Extremely dry Nil
The standardized precipitation index (SPI) was estimated to determine that rarity of a drought in Girja basin based on 29 years
(1990-2018) rainfall data available from Phulambri rain gauge station. SPI values suggest that out of last 29 years,1 was
extremely wet (SPI 2.0+); 2 were very wet (SPI 1.5 to 1.99); 1 moderately wet (SPI 1.0 to 1.49); 22 near normal (SPI 0.99 to -
0.99); 3 moderately dry (SPI -1.0 to -1.49) years (Table,3 and Fig.6).1 severely dry (SPI -1.5 to -1.99); and 2 were extremely
dry (SPI-2 and less), however, no severely dry (SPI -1.5 to -1.99); and extremely dry (SPI-2 and less) was recorded.
Estimations also indicates that post 1996, both severity and occurrence of drought events has increased. (Table,3 and Fig.6).
Int. J. Sci. Res. in Mathematical and Statistical Sciences Vol. 6(2), Apr 2019, ISSN: 2348-4519
© 2019, IJSRMSS All Rights Reserved 279
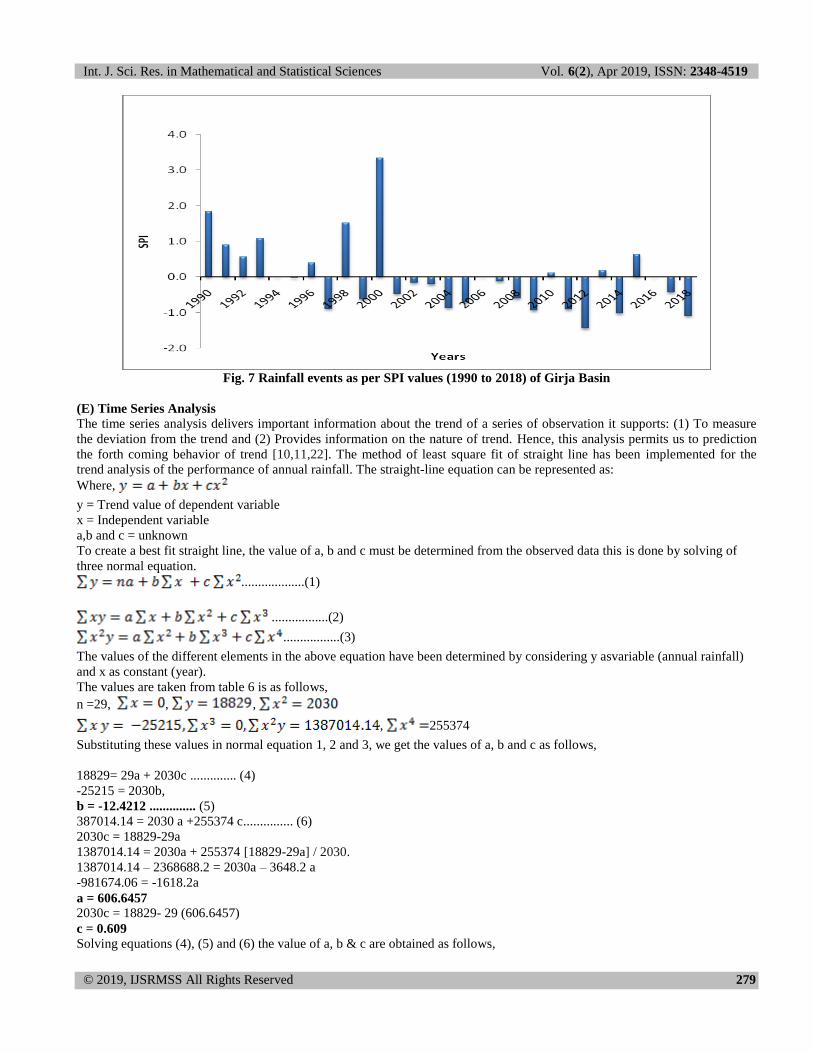
Fig. 7 Rainfall events as per SPI values (1990 to 2018) of Girja Basin
(E) Time Series Analysis
The time series analysis delivers important information about the trend of a series of observation it supports: (1) To measure
the deviation from the trend and (2) Provides information on the nature of trend. Hence, this analysis permits us to prediction
the forth coming behavior of trend [10,11,22]. The method of least square fit of straight line has been implemented for the
trend analysis of the performance of annual rainfall. The straight-line equation can be represented as:
Where,
y = Trend value of dependent variable
x = Independent variable
a,b and c = unknown
To create a best fit straight line, the value of a, b and c must be determined from the observed data this is done by solving of
three normal equation.
...................(1)
.................(2)
.................(3)
The values of the different elements in the above equation have been determined by considering y asvariable (annual rainfall)
and x as constant (year).
The values are taken from table 6 is as follows,
n =29, , ,
, 255374
Substituting these values in normal equation 1, 2 and 3, we get the values of a, b and c as follows,
18829= 29a + 2030c .............. (4)
-25215 = 2030b,
b = -12.4212 .............. (5)
387014.14 = 2030 a +255374 c............... (6)
2030c = 18829-29a
1387014.14 = 2030a + 255374 [18829-29a] / 2030.
1387014.14 – 2368688.2 = 2030a – 3648.2 a
-981674.06 = -1618.2a
a = 606.6457
2030c = 18829- 29 (606.6457)
c = 0.609
Solving equations (4), (5) and (6) the value of a, b & c are obtained as follows,
Int. J. Sci. Res. in Mathematical and Statistical Sciences Vol. 6(2), Apr 2019, ISSN: 2348-4519
© 2019, IJSRMSS All Rights Reserved 280
a =606.6457, b = -12.4212, c = 0.609
Hence, the equation for straight line is becomes
y = 606.6457 + (-12.4212) x + 0.609 (x
2) ...................... (7)
With the help of equation (7) the trend values have been calculated. The future forecast of rainfall amount for period of 5 years.
i.e. from 2019 to 2023 has been made. The calculation of expected rainfall for coming years is made as per the following
method. Forecasting of expected future trend of rainfall 2019 to 2013 is as follows,
Y =
Y2019= 606.6457+ (-12.4212) x 19+0.609 x (19)2 = 590.494
Y2020= 606.6457+ (-12.4212) x20+0.609 x (20)2 = 601.821
Y2021= 606.6457+ (-12.4212) x 21+0.609 x (21)2 = 614.369
Y2022= 606.6457+ (-12.4212) x 22+0.609 x (22)2 = 628.135
Y2023= 606.6457+ (-12.4212) x 23+0.609 x (23)2 = 643.119
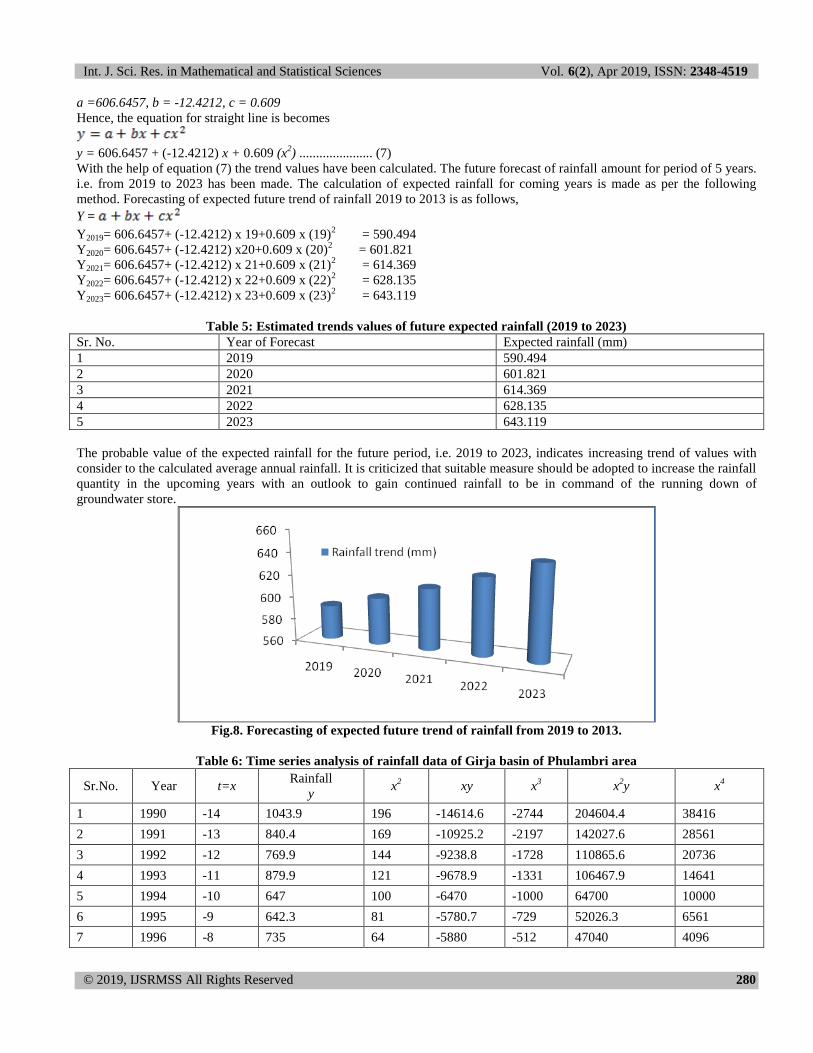
Table 5: Estimated trends values of future expected rainfall (2019 to 2023)
Sr. No. Year of Forecast Expected rainfall (mm)
1 2019 590.494
2 2020 601.821
3 2021 614.369
4 2022 628.135
5 2023 643.119
The probable value of the expected rainfall for the future period, i.e. 2019 to 2023, indicates increasing trend of values with
consider to the calculated average annual rainfall. It is criticized that suitable measure should be adopted to increase the rainfall
quantity in the upcoming years with an outlook to gain continued rainfall to be in command of the running down of
groundwater store.
Fig.8. Forecasting of expected future trend of rainfall from 2019 to 2013.
Table 6: Time series analysis of rainfall data of Girja basin of Phulambri area
Sr.No. Year t=x Rainfall
y x
2 xy x
3 x
2y x
4
1 1990 -14 1043.9 196 -14614.6 -2744 204604.4 38416
2 1991 -13 840.4 169 -10925.2 -2197 142027.6 28561
3 1992 -12 769.9 144 -9238.8 -1728 110865.6 20736
4 1993 -11 879.9 121 -9678.9 -1331 106467.9 14641
5 1994 -10 647 100 -6470 -1000 64700 10000
6 1995 -9 642.3 81 -5780.7 -729 52026.3 6561
7 1996 -8 735 64 -5880 -512 47040 4096

Int. J. Sci. Res. in Mathematical and Statistical Sciences Vol. 6(2), Apr 2019, ISSN: 2348-4519
© 2019, IJSRMSS All Rights Reserved 281
8 1997 -7 458 49 -3206 -343 22442 2401
9 1998 -6 972.3 36 -5833.8 -216 35002.8 1296
10 1999 -5 514 25 -2570 -125 12850 625
11 2000 -4 1362.6 16 -5450.4 -64 21801.6 256
12 2001 -3 547 9 -1641 -27 4923 81
13 2002 -2 614 4 -1228 -8 2456 16
14 2003 -1 605.9 1 -605.9 -1 605.9 1
15 2004 0 464.2 0 0 0 0 0
16 2005 1 497.3 1 497.3 1 497.3 1
17 2006 2 650.5 4 1301 8 2602 16
18 2007 3 622.18 9 1866.54 27 5599.62 81
19 2008 4 520.96 16 2083.84 64 8335.36 256
20 2009 5 448.49 25 2242.45 125 11212.25 625
21 2010 6 672.79 36 4036.74 216 24220.44 1296
22 2011 7 454.65 49 3182.55 343 22277.85 2401
23 2012 8 341.35 64 2730.8 512 21846.4 4096
24 2013 9 689.25 81 6203.25 729 55829.25 6561
25 2014 10 431.01 100 4310.1 1000 43101 10000
26 2015 11 785.8 121 8643.8 1331 95081.8 14641
27 2016 12 646.2 144 7754.4 1728 93052.8 20736
28 2017 13 556.5 169 7234.5 2197 94048.5 28561
29 2018 14 415.8 196 5821.2 2744 81496.8 38416
(Where n =29, , , , ,
255374)
IV. GEO-ENVIRONMENTAL INFERENCE OF RAINFALL
Rainfall is a major source for groundwater recharge. The response of groundwater level to rainfall is divided into quick and
slow parts; Rainfall effects on the groundwater-level variation include the relatively quick and slow responses [23].
Precipitated water that reaches at the surface ground may be partially discharge into streams as surface run off or partially
infiltrate into the ground. The latter further percolates into groundwater aquifers, eventually emerging in springs, seeping into
streams to form surface run off, or storing in subsurface. The soil stores infiltrated water to become soil moisture, and then it
recharges to groundwater level if the soil is saturated. Nevertheless, it releases slowly as subsurface flow to enter the stream as
baseflow during rain less period [24,25]. This may also result from deeper percolation, evapotranspiration, or artificial
discharge. The analysis of rainfall data of study area, draw attention to a somewhat fine vary of deviation representing mutually
the positive and negative trends that influence the recharge of the groundwater basin. The present leaning of over use and
inadequate rainfall is causing depletion in groundwater levels. Groundwater levels may demonstrate seasonal variation due to
rainfall. Drought extending over a period of several years, contribute to declining water levels. The rapid depletion of
groundwater levels causes scarcity and even resulting into drought situation in a particular area [10,26]. The occurrence of
drought and heavy precipitation are the most important climatic extremes having both short and long-term impacts on the
groundwater availability. These impacts include changes in groundwater recharge resulting from the erratic behavior of the
annual and seasonal distribution of precipitation and temperature; changes in evapotranspiration resulting from changes in
vegetation; and possible increased demands for groundwater as a backup source of water supply [27]. However, the link
between climate variability and the groundwater response is more complicated than that with the surface water regime. Its
dynamics is rather a stable system, and responds slowly with a time lag to climate variability. Further, the diverse aquifer
characteristics respond differently to the surface stresses [28,29]. The investigation of rainfall data shows a significant variation
in the quantity of rainfall and its circulation. On top of the intact, it can be present recap that the areas have observed several of
Int. J. Sci. Res. in Mathematical and Statistical Sciences Vol. 6(2), Apr 2019, ISSN: 2348-4519
© 2019, IJSRMSS All Rights Reserved 282
positive rainfall year’s causative to the increase of groundwater basin. The completion of suitable measure is probable to
endow with therapy in reduce the speedily budding situation of groundwater level depletion ensuing in the drought
circumstance in study area. The ever-increasing quantity and frequencies of rainfall episodes would augment recharge event
and assist in the pledge of the crisis of sustained water supply in the study area. The farmers and the people sitting on the
scarcity of heat and water are eagerly awaiting the rains.
If the monsoon rainfall is good, then there will be the positive result as follows,
The economic growth would be good
The farmers will get a great relief.
Water scarcity in rural areas will minimize.
If good rain occurs, the product will be good and farmers will benefit from small traders.
Possibility of reducing pandemic
If the rain is good, then the bank and the financial sector will also be benefited.
Expected to increase the demand for necessary equipment, goods and fertilizers from farmers.
V. CONCLUSION
The study has given an explanation of mathematical and statistical analyses of rainfall data for 29 years (1990 to 2018). Time
series has made possible in forecasting of projected rainfall data for 2023. The upcoming tendency or trends of rainfall is
positive and would confer to recharge the ground water system and trim down the problem of water supply for the duration of
non-rainy days especially in non-monsoon period. It is suggested that the basic step ladder have to be carry out on peak main
concern to agree to preparation for the intensification of rainfall sum and frequencies, and execution of proposal for ever-
increasing the persistent water make available by pleasing to the eye recharge condition of groundwater system that would
make available counteractive measures to conflict the wide spread water supply catastrophe in study area.
ACKNOWLEDGEMENT
The authors (MLD) thankful to Principal Deogiri College, Aurangabad and Head, Department of Mathematics, Deogiri
College, Aurangabad for providing research facilities and constant encouragement and author (KRA) thankful to Director,
Groundwater Survey and Development Agency, Pune, to providing necessary facility, as well as inspiration and
encouragement to conduct the research studies. Sincere thanks are extended to Yugandhar Aher, Shri Ajay Sing, Executive
Engineer, MJP, Jalna, Senior Geologist, GSDA, Jalna and others for their openhanded assistances.
REFERENCES
[1] Nicholson S E, “The spatial coherence of African rainfall anomalies: Interhemisphere telecommunications” J. Clim. Appl. Meteorol., Vol. 25,
pp. 1365–1379, 1986.
[2] Kakade, S. B., & Kulkarni, A., “Seasonal prediction of summer monsoon rainfall over cluster regions of India”. Journal of Earth System
Science, Vol.126, Issue 3, pp. 34, 2017.
[3] Swain, S., Verma, M., & Verma, M. K., “Statistical trend analysis of monthly rainfall for Raipur District, Chhattisgarh”, International Journal
of Advanced Engineering Research and Studies, Vol, 4, Issue 2, pp. 87-89, 2015.
[4] Janhabi M. and Ramakar J., ”Time Series Analysis of Monthly Rainfall Data for the Mahanadi River Basin, India”, Sciences in Cold and Arid
Regions,Vol. 5,Issue 1, pp.0073-0084, 2013.
[5] Afangideh, A. I., Francis E. O. and Eja E. I., ”A Preliminary Investigation into the Annual Rainfall Trend and Patterns for Selected Towns in
Parts of South-Eastern Nigeria”, Journal of Sustainable Development, Vol. 3, No. 3, 2010.
[6] Emmanuel Sambo Uba and Bakari H R, “An Application of Time Series Analysis in Modeling Monthly Rainfall Data for Maiduguri, North
Eastern Nigeria”, Mathematical Theory and Modeling,Vol. 5, Issue 11, pp. 24-33, 2015.
[7] Lokhande,D.C., Shinde, G.U., Karhale, M.B., and Shende, N.T.,“Study Of Talukawise Rainfall Pattern In Beed District Of Maharashtra Using
Long Term Weather Data”, Bulletin of Environment, Pharmacology and Life Sciences, Bull. Env. Pharmacol. Life Sci., Vol. 6, Issue 3, pp. 34-
39, 2017.
[8] Berryman, D., Bobée, B., Cluis, D., & Haemmerli, J., “Nonparametric tests for trend detection in water quality time series 1. Jawra” Journal of
the American Water Resources Association, Vol. 24, Issue 3, pp. 545-556, 1988.
[9] Verma, S., & Dhiwar, B. K., “Statistical Analysis of Rainfall Event in Seonath River Basin Chhattisgarh”, International Journal of Advanced
Engineering Research and Science, Vol.5, Issue 1,pp. 137-141, 2018.
[10] Dangi, K., Kulshreshtha, V., & Dev, P. (2018). “Variation trend analysis of rainfall hydrometerological parameter and environmental
implications on sitamau watershed, Mandsaur District, Madhya Pradesh, India”. Bulletin of Pure & Applied Sciences-Geology, Vol. 37, Issue
2, pp. 186-200, 2018
[11] Rizwan, M., Kulshreshtha, V., & Dev, P., “Effects of Rainfall Factor on Hydrogeological System Recharge in Bangar Environs: A Middle Part
of India”, Bulletin of Pure and Applied Sciences. Vol. 36 E (Geology), Vol. 36, Issue,1, pp. 27-43, 2017.
[12] Nagabhushaniah, H.S., “Groundwater in Hydrosphere”, C.B.S. Publishers and Distributors, New Delhi, pp.379, 2001.

Int. J. Sci. Res. in Mathematical and Statistical Sciences Vol. 6(2), Apr 2019, ISSN: 2348-4519
© 2019, IJSRMSS All Rights Reserved 283
[13] Kipkorir, E. C., “Analysis of rainfall climate on the Njemps Flats, Baringo District, Kenya”, Journal of Arid Environments, Vol.50, Issue 3, pp.
445–458, 2002.
[14] Herath, S and Ratnayake,U, “Monitoring rainfall trends to predict adverse impacts—a case study from Sri Lanka (1964–1993)”, Global
Environmental Change, vol. 14, pp. 71–79, 2004.
[15] CGWB, “Report on Groundwater information of Aurangabad district, Maharashtra” pp.1-15, 2010.
[16] Aher K. R, “Geochemistry of Groundwater in Basaltic aquifer of Phulambri taluka, District Aurangabad’, India. Res. J. Chem. Sci, Vol .1,
pp.1-124, 2014. [17] Raes, D., “Frequency analysis of rainfall data. KU Leuven Inter-University Programme in Water Resources Engineering” (IUPWARE):
Leuven, Belgium, pp, 42, 2004.
[18] Department of Agriculture, “Talukawise monthly rainfall data, Rainfall Recording and Analysis, Department of Agriculture Maharashtra State”
http://maharain.gov.in/?MenuID=1075. Assessed on 19 March 2019, 2018.
[19] Indian Meteorological Department, “The basic rainfall data”, National Data Centre, IMD, Pune, 2018.
[20] Reddy, P.J. Rami, “A Textbook of Hydrology”, University Science Press, New Delhi, pp.504, 2013..
[21] GSDA, “Capacity building of GSDA’s hydrogeologists on Real time monitoring of hydrological phenomena, groundwater assessment and
drought predictions in selected DPAP blocks of Marathwada and Vidarbha”, Groundwater Survey and development agency and Institute for
Resource analysis and Policy, Hyderabad, Training manual, pp. 37-38, 2015.
[22] Gupta, S.C. and Kapoor, V. K., “Fundamentales of Matheatical Statistics”, pp.874, 1977.
[23] Jan, C. D., Chen, T. H., & Huang, H. M., “Analysis of rainfall-induced quick groundwater-level response by using a Kernel functions”. Paddy
and Water Environment, Vol.1, Issue,1(1-4), pp. 135-144, 2013.
[24] Chow, V.T., Maidment, D.R., Mays, L.W., “Applied Hydrology”. McGraw-Hill, New York (International editions), 1988
[25] Jan, C. D., Chen, T. H., & Lo, W. C., “Effect of rainfall intensity and distribution on groundwater level fluctuations”. Journal of hydrology, Vol.
332 Issue (3-4), pp. 348-360, 2007.
[26] Todd, D. K., “ Groundwater Hydrology”. John Wiley and Sons, Inc., New York, pp,287, 1980.
[27] Alley, W.M., “Groundwater and climate. Ground Water” 39 (2), 161, 2001.
[28] Chen, Z., Grasby, S., Osadetz, K.G., “Relation between climate variability and groundwater levels in the upper carbonate aquifer, south
Manitoba, Canada”, J. Hydrol. 290, pp. 43–62, 2004.
[29] Environment Canada, “Threats to water availability in Canada. National Water Research Institute, Burlington”, Ont. NWRI Scientific
Assessment Report Series No. 3 and ACSD Scientific Assessment Series No.1, pp. 77–84, 2004.