timber trussed arch for long spanpublications.lib.chalmers.se/records/fulltext/10772.pdf · timber...
TRANSCRIPT

Timber trussed arch for long span
Master’s Thesis in the International Master’s Programme in Structural Engineering
AUDREY FARREYRE JEAN-BERNARD JOURNOT Department of Civil and Environmental Engineering Division of Structural Engineering Steel and Timber Structures CHALMERS UNIVERSITY OF TECHNOLOGY Göteborg, Sweden 2005 Master’s Thesis 2005:103
MASTER’S THESIS 2005:103
Timber trussed arch for long span
Master’s Thesis in the International Master’s Programme in Structural Engineering
AUDREY FARREYRE
JEAN-BERNARD JOURNOT
Department of Civil and Environmental Engineering Division of Structural Engineering
Steel and Timber Structures CHALMERS UNIVERSITY OF TECHNOLOGY
Göteborg, Sweden 2005
Timber trussed arch for long span Master’s Thesis in the International Master’s Programme in Structural Engineering AUDREY FARREYRE JEAN-BERNARD JOURNOT ©AUDREY FARREYRE & JEAN-BERNARD JOURNOT, 2005
Master’s Thesis 2005:103103 Department of Civil and Environmental Engineering Division of Structural Engineering Steel and Timber Structures Chalmers University of Technology SE-412 96 Göteborg Sweden Telephone: + 46 (0)31-772 1000 Cover: Elevation of Hamar Olympiahall, Niels Torp arkitekter FE model of the trussed arch in ABAQUS, Hamar Olympiahall during construction, Biong Arkitekter Hamar Olympiahall inside view, Niels Torp arkitekter. Department of Civil and Environmental Engineering Göteborg, Sweden 2005
Timber trussed arch for long span Master’s Thesis in the International Master’s Programme in Structural Engineering AUDREY FARREYRE JEAN-BERNARD JOURNOT Department of Civil and Environmental Engineering Division of Structural Engineering Steel and Timber Structures Chalmers University of Technology
ABSTRACT
Scandinavia has the largest timber reserves in western Europe and it is one of the largest manufacturers of timber products. Consequently, timber is commonly used as a building material in roof structures, for houses and larger buildings. The development of glued laminated timber (Glulam) technology at the beginning of the twentieth century has enlarged the possibilities of timber. All kind of geometries and spans are thereby feasible.
In the case of long span roof structures, timber arches are one of the best solutions from both structural and aesthetical point of view. Not only are arches slender structures and require no intermediate support to achieve long span, but they also use efficiently the compressive strength of timber. For spans over 100m, trussed arches are usually preferred since they are more convenient to manufacture and to assembly. For instance, several buildings own such roof structures in Scandinavia.
This master’s thesis deals with Glulam trussed arches for long span. It especially focuses on an arch of 100m span and 20m height. It introduces different technical solutions and explains the design of such a structure.
At first, a finite element model is performed with the ABAQUS software in order to study the influence of boundary conditions and geometrical parameters e.g. depth of the truss and number of diagonal elements. This analysis leads to an optimum static system, which is considered later on.
Furthermore, as the connections are the weakest point in timber structures, they have to be investigated from the preliminary design. Hence, different joints are examined and the best one is retained to be calculated.
Finally, the stiffness of the connections are introduced in the finite element model to make it more realistic. The design forces resulting from the new analysis are used to design the members and to study the stability of the structure, according to Eurocodes. At last, the partitioning of the trussed arch for transportation is overviewed. The arch is partitioned in six pieces and the location of the cuts is studied.
The recommendations made in this thesis are aimed to be used as references for the design of similar structures.
Key words: Timber arch, trussed arch, glulam, timber connections, multiple steel plates connection.
CHALMERS, Civil and Environmental Engineering, Master’s Thesis 2005:103 I

CHALMERS, Civil and Environmental Engineering, Master’s Thesis 2005:103 II
Arche triangulée de longue portée Thèse de fin d’étude du Master international « Structural Engineering » AUDREY FARREYRE JEAN-BERNARD JOURNOT Département de génie civil et environnement Division of Structural Engineering Steel and Timber Structures Chalmers University of Technology
RESUMÉ FRANÇAIS
Les vastes forêts recouvrant les pays scandinaves garantissent une production quasiment illimitée de bois de construction. Il est principalement employé dans les charpentes, pour les habitations et les bâtiments publics. L’apparition du lamellé-collé au début du vingtième siècle a largement accru les possibilités d’utilisation du bois. En effet, toutes les géométries et toutes les longueurs peuvent être produites. Ainsi pour la conception d’une charpente de longue portée, la réalisation d’une arche en lamellé-collé est incontournable, car d’une part elle utilise de façon optimale la capacité en compression du bois et d’autre part, elle présente des avantages esthétiques.
Ce mémoire traite des arches triangulées de longues portées en lamellé-collé. Il introduit les possibilités de réalisations et présente la conception et le dimensionnement d’une telle structure.
Ce projet repose plus particulièrement sur l’analyse d’une arche triangulée de 100m de portée entre les supports et 20m de haut. Les conditions d’appuis et les paramètres géométriques comme le nombre de diagonales et la hauteur du treillis sont déterminés selon une étude comparative entre différents modèles. L’analyse statique des différentes alternatives est réalisée grâce à la méthode des éléments finis avec le logiciel ABAQUS. Cette comparaison aboutit enfin à un système statique optimum d’un point de vue structurel.
De plus, les connections étant un point délicat dans la construction en bois, elles doivent être considérées dès la première phase de conception. Ainsi, différents types de connecteurs sont examinés avant de retenir le préférable. Le système BSB, formé de broches et de plaques d’acier noyées dans la section, est ici le plus adéquat. Le nombre de broches et de plaques est calculé de telle façon à obtenir une rupture plastique de la connexion.
Afin d’améliorer, la modélisation de l’arche, la raideur des connections est par la suite introduite dans le modèle en éléments finis. Les forces qui résultent de l’analyse statique de ce modèle, sont utilisées pour effectuer le dimensionnement de la charpente et d’en étudier sa stabilité suivant les critères donnés par l’Eurocode 5. Enfin, la découpe de l’arche en plusieurs parties pour le transport est abordée. L’arche est sectionnée en 6 parties. L’influence de l’emplacement des coupures est analysée grâce à la méthode des éléments finis.
Les recommandations faites dans cette thèse ont pour but de servir de support lors de la conception d’une structure similaire.
CHALMERS, Civil and Environmental Engineering, Master’s Thesis 2005:103 III

CHALMERS, Civil and Environmental Engineering, Master’s Thesis 2005:103 IV
Contents ABSTRACT I
CONTENTS V
PREFACE IX
NOTATIONS AND CONVENTIONS X
1 INTRODUCTION 1
1.1 Background 1
1.2 Aims of the thesis and limitations 2
1.3 Outlines 3
2 GLUED LAMINATED TIMBER- GLULAM 4
2.1 Production process 4 2.1.1 Manufacturing 4 2.1.2 Glue types 5 2.1.3 Standard shapes 5 2.1.4 Transportation 5
2.2 Material properties 6 2.2.1 Advantages of Glulam 6 2.2.2 Composed glulam GL32C 6
2.3 Example of current structures 7 2.3.1 Hamar Olympiahall, Norway 7 2.3.2 Håkons Hall, Norway 9 2.3.3 Sørlandshallen and Telemarkshallen, Norway 10 2.3.4 Conclusions 12
3 OPTIMUM STATIC SYSTEM 13
3.1 Theory of arches 13
3.2 Simple arch and trussed arch 15
3.3 Investigated model 16
3.4 Finite Element model 19 3.4.1 General modelling 19 3.4.2 Influence of 2nd order effects 20
3.5 Influence of the boundary conditions 21 3.5.1 Description of the models 21 3.5.2 Normal forces in case of triangular snow load 23 3.5.3 Buckling of the lower chord 29 3.5.4 Bending moment in case of triangular snow load 30 3.5.5 Case of uniform snow load 32
3.6 Influence of the number of diagonal elements 32 3.6.1 Model I1 34
CHALMERS, Civil and Environmental Engineering, Master’s Thesis 2005:103 V
3.6.2 Model I2 36 3.6.3 Comparison between models BC3, I1 and I2 38 3.6.4 Risk of local buckling 39
3.7 Influence of the depth of the truss 40 3.7.1 Model H1 41 3.7.2 Model H2 43 3.7.3 Comparison of models H1, I2 and H2 45
4 PRELIMINARY STRUCTURAL ANALYSIS 47
4.1 Design load 47 4.1.1 Permanent loads 47 4.1.2 Variable loads 47 4.1.3 Load combinations 49
4.2 Finite Element model 50 4.2.1 Geometry 50 4.2.2 Glulam properties 50 4.2.3 Loads 50 4.2.4 Initial imperfections of the geometry 51 4.2.5 FE Analysis 52
4.3 Results 53 4.3.1 Forces and moments 53 4.3.2 Comparison with hand calculations 56 4.3.3 Uplift of the trussed arch 58 4.3.4 Influence of initial imperfections 58
5 CONNECTIONS 60
5.1 Hinges at the abutments and at the crown 60 5.1.1 Hinges at the abutment 60 5.1.2 Hinge at the crown 61
5.2 Possible joining systems in the truss 62 5.2.1 Connection with glued-in rods 62 5.2.2 Tube joint 64 5.2.3 Multiple steel plates connection 65 5.2.4 Choice of the optimum connection 67
5.3 Theory of multiple shear steel-to-timber joints 67 5.3.1 Double shear planes connection 67 5.3.2 Multiple shear planes connection 68
5.4 Design of the connection 71 5.4.1 Optimum number of steel plates 71 5.4.2 Required number of dowels 74 5.4.3 Tension perpendicular to the grain 76 5.4.4 Design of the steel plates 78 5.4.5 Stiffness of the connections 82
CHALMERS, Civil and Environmental Engineering, Master’s Thesis 2005:103 VI
6 ANALYSIS OF THE STRUCTURE AND VERIFICATION 85
6.1 Finite Element analysis including connection stiffness 85 6.1.1 FE model 85 6.1.2 Results of the analysis 87
6.2 Verification of the members 90 6.2.1 Chord members 91 6.2.2 Diagonal members 93
6.3 Verification of the connections 94
6.4 Lateral bracing of the lower chord 97
6.5 Partitioning of the arches 98
7 CONCLUSION AND RECOMMENDATIONS 101
8 REFERENCES 103
APPENDIX A: COMPARISON BETWEEN ABAQUS RESULTS AND HAND CALCULATIONS 104
APPENDIX B: NUMBER OF DOWELS IN THE CONNECTIONS 107
APPENDIX C: CHECKING OF THE STEEL PLATE 112
APPENDIX D: VERIFICATION OF THE MEMBERS 116
CHALMERS, Civil and Environmental Engineering, Master’s Thesis 2005:103 VII

CHALMERS, Civil and Environmental Engineering, Master’s Thesis 2005:103 VIII

Preface This thesis is the culmination of the International Master’s Programme in Structural Engineering at Chalmers University of Technology, Sweden. It has been carried out between June and December 2005 at the Division of Structural Engineering, Department of Civil and Environmental Engineering.
The work was proposed and supervised by Dr. Eng. Roberto Crocetti, designer at MOELVEN Töreboda, Sweden. It was also overseen by Assistant Professor Marie Johansson at the department.
This master’s thesis was a great opportunity to learn more about timber structures. It was especially interesting to complete this thesis in Sweden where timber is a common building material.
We would like to take the opportunity to express our gratitude towards those involved in the project:
Roberto Crocetti for his advice and his guidance during the project,
Marie Johansson for her everyday support and all the literature borrowed from her,
Robert Kliger for his general advice,
Julia Meronk and Agnieszka Gilun, our opponent group, for their comments on the thesis.
This Master Program gave us the chance to get an international experience and to meet people from all over the world. We would like to thank all these people for the great time we had together.
Our gratefulness also goes to our parents and relatives for their support during all our stay in Sweden.
Göteborg December 2005
Audrey Farreyre Jean-Bernard Journot
CHALMERS, Civil and Environmental Engineering, Master’s Thesis 2005:103 IX
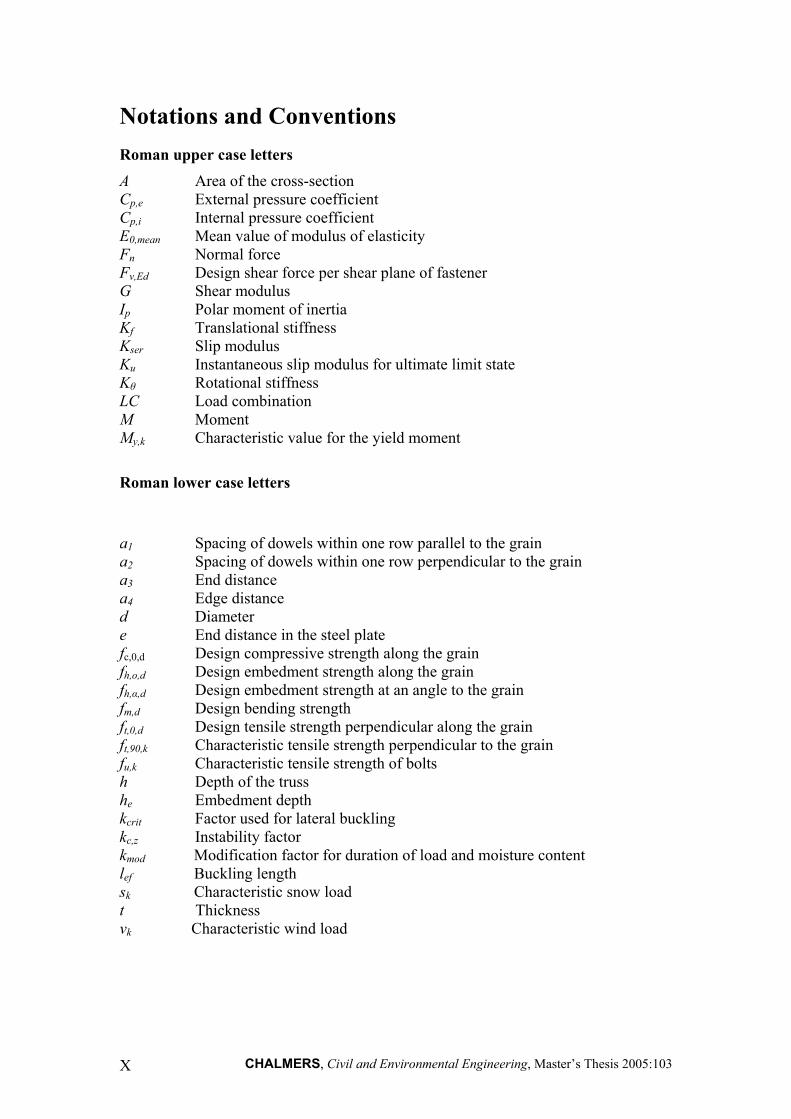
Notations and Conventions Roman upper case letters A Area of the cross-section Cp,e External pressure coefficient Cp,i Internal pressure coefficient E0,mean Mean value of modulus of elasticity Fn Normal force Fv,Ed Design shear force per shear plane of fastener G Shear modulus Ip Polar moment of inertia Kf Translational stiffness Kser Slip modulus Ku Instantaneous slip modulus for ultimate limit state Kθ Rotational stiffness LC Load combination M Moment My,k Characteristic value for the yield moment
Roman lower case letters
a1 Spacing of dowels within one row parallel to the grain a2 Spacing of dowels within one row perpendicular to the grain a3 End distance a4 Edge distance d Diameter e End distance in the steel plate fc,0,d Design compressive strength along the grain fh,o,d Design embedment strength along the grain fh,α,d Design embedment strength at an angle to the grain fm,d Design bending strength ft,0,d Design tensile strength perpendicular along the grain ft,90,k Characteristic tensile strength perpendicular to the grain fu,k Characteristic tensile strength of bolts h Depth of the truss he Embedment depth kcrit Factor used for lateral buckling kc,z Instability factor kmod Modification factor for duration of load and moisture content lef Buckling length sk Characteristic snow load t Thickness vk Characteristic wind load
CHALMERS, Civil and Environmental Engineering, Master’s Thesis 2005:103 X
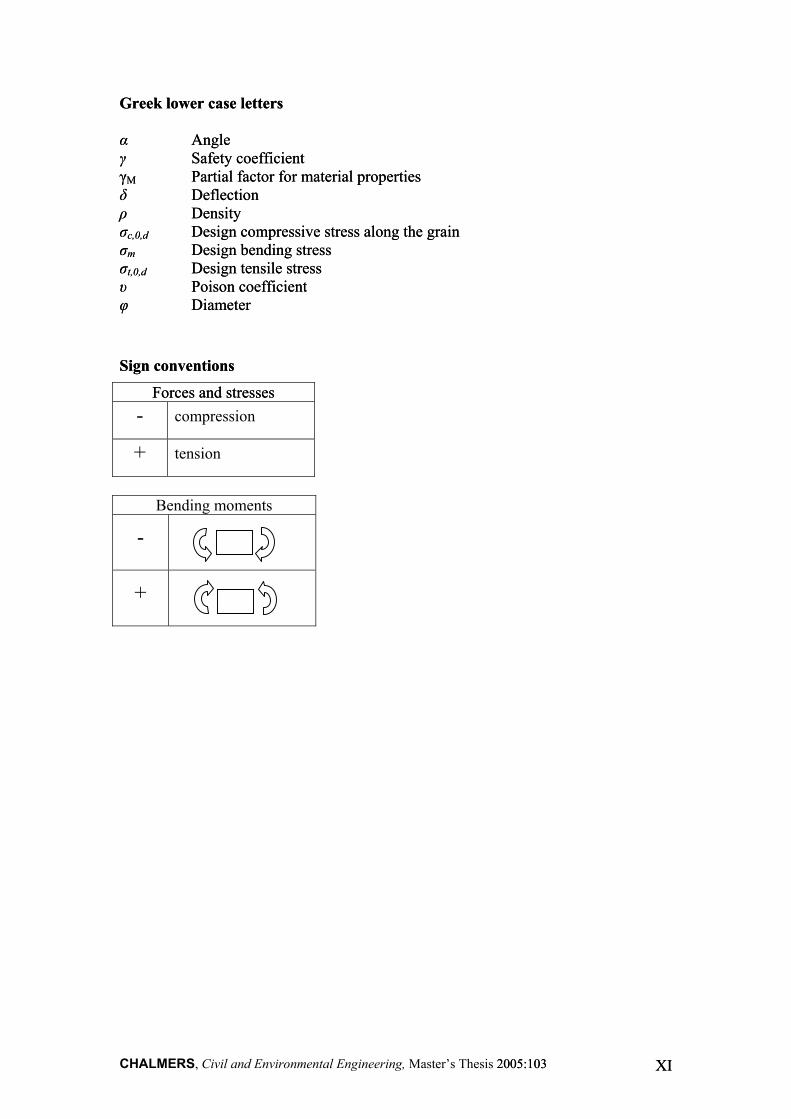
Greek lower case letters Greek lower case letters α Angle α Angle γ Safety coefficient γ Safety coefficient γM Partial factor for material properties γM Partial factor for material properties δ Deflection δ Deflection ρ Density ρ Density σc,0,d Design compressive stress along the grain σc,0,d Design compressive stress along the grain σm Design bending stress σm Design bending stress σt,0,d Design tensile stress σt,0,d Design tensile stress υ Poison coefficient υ Poison coefficient φ Diameter φ Diameter
Sign conventions Sign conventions
Forces and stresses Forces and stresses - compression
+ tension
Bending moments
-
+
CHALMERS, Civil and Environmental Engineering, Master’s Thesis 2005:103 2005:103 XIXI

CHALMERS, Civil and Environmental Engineering, Master’s Thesis 2005:103 XII

1 Introduction
1.1 Background
Arches have been built for centuries. This is mainly due to the fact that the only materials available in the Middle-Ages, apart from timber, were stones and bricks. As these materials are not able to withstand tensile stresses, it has resulted in a widespread use of masonry arches and vaults. Cathedrals and old stone bridges are the most relevant examples of this period.
Nowadays, concrete and steel are common building materials. All types of structures can be built with these materials. As a consequence, arches are less used. However, arches should not be underestimated because they are good alternatives to achieve very long span. Moreover, from an aesthetical point of view, arches are thin and slender structures.
With the development of the glued laminated timber (Glulam) technology at the beginning of the twentieth century, arches were again used as roof structure. A well-known example in Sweden is the central station in Stockholm, see Figure 1.1.
Figure 1.1 Hall of the central station in Stockholm, Carling, Svenskt limträ AB (2001)
This thesis deals with arches in Glulam. It especially focuses on 100m circular trussed arches. Such structures are often built to roof large buildings.
This subject was proposed by Roberto Crocetti, who is an engineer at Moelven Töreboda.
CHALMERS, Structural Engineering and Mechanics, Master’s Thesis 2005:103 1
1.2 Aims of the thesis and limitations 1.2 Aims of the thesis and limitations
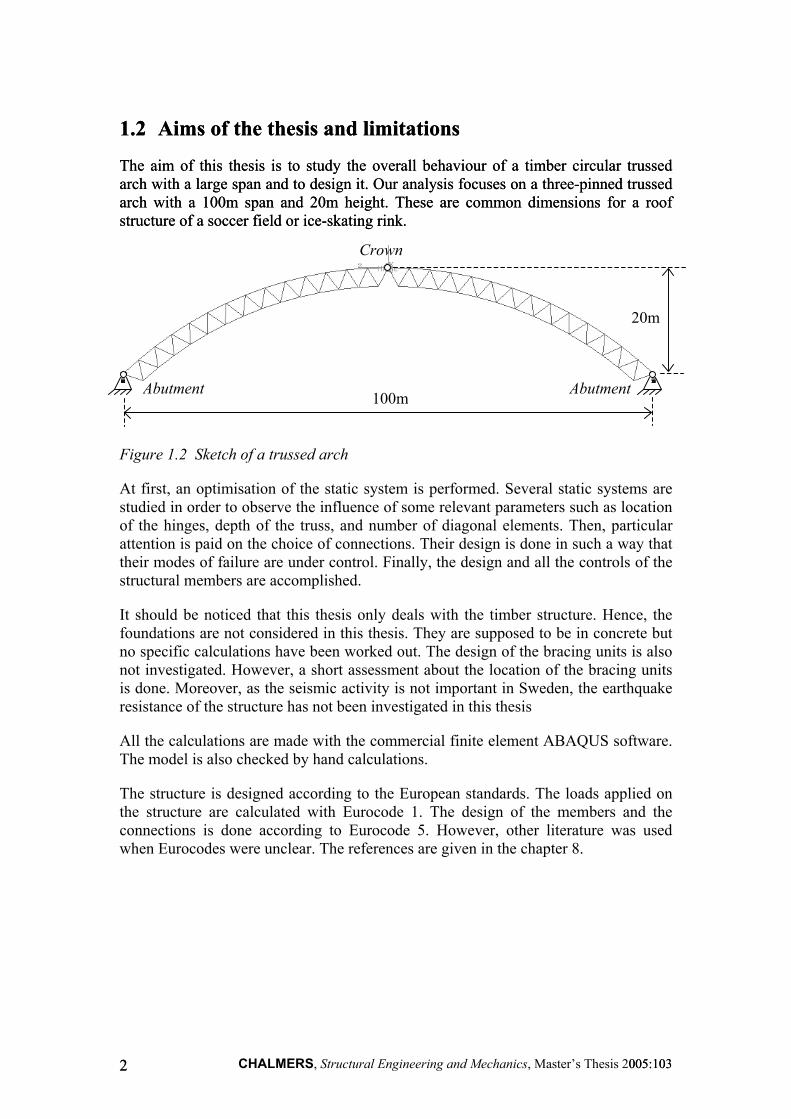
The aim of this thesis is to study the overall behaviour of a timber circular trussed arch with a large span and to design it. Our analysis focuses on a three-pinned trussed arch with a 100m span and 20m height. These are common dimensions for a roof structure of a soccer field or ice-skating rink.
The aim of this thesis is to study the overall behaviour of a timber circular trussed arch with a large span and to design it. Our analysis focuses on a three-pinned trussed arch with a 100m span and 20m height. These are common dimensions for a roof structure of a soccer field or ice-skating rink.
Crown
20m
Abutment Abutment 100m
Figure 1.2 Sketch of a trussed arch
At first, an optimisation of the static system is performed. Several static systems are studied in order to observe the influence of some relevant parameters such as location of the hinges, depth of the truss, and number of diagonal elements. Then, particular attention is paid on the choice of connections. Their design is done in such a way that their modes of failure are under control. Finally, the design and all the controls of the structural members are accomplished.
It should be noticed that this thesis only deals with the timber structure. Hence, the foundations are not considered in this thesis. They are supposed to be in concrete but no specific calculations have been worked out. The design of the bracing units is also not investigated. However, a short assessment about the location of the bracing units is done. Moreover, as the seismic activity is not important in Sweden, the earthquake resistance of the structure has not been investigated in this thesis
All the calculations are made with the commercial finite element ABAQUS software. The model is also checked by hand calculations.
The structure is designed according to the European standards. The loads applied on the structure are calculated with Eurocode 1. The design of the members and the connections is done according to Eurocode 5. However, other literature was used when Eurocodes were unclear. The references are given in the chapter 8.
CHALMERS, Structural Engineering and Mechanics, Master’s Thesis 2005:103 005:103 22
1.3 Outlines
This thesis is divided in five parts. Chapter 2 presents Glulam as a building material. The production process is briefly explained. The standards for Glulam elements are given and the material properties are introduced. Examples of current buildings owning trussed arches are thereafter described.
The main purpose of chapter 3 is to find an optimum static system. Different parameters, which can have an influence on the behaviour of the trussed arch, are studied. First, several boundary conditions are investigated. The hinges of the abutments and the crown are either located at the upper chord or the lower chord. The most efficient system regarding the force path is adopted. Then, the influence of the number of diagonal members and the effect of the depth of the truss are studied. An optimum static system results from these studies.
The next step presented in chapter 4 consists in performing a preliminary analysis of the structure. Several load combinations, calculated according to Eurocode 1, are applied on the static system from chapter 3. Imperfections are also included in this model, according to Eurocode 5. Hence, a brief explanation about the FE computation is given. Finally, forces and moments resulting from the different load combinations are presented. This study leads to the design forces, which will be used to calculate the connections.
The chapter 5 especially deals with the connections between the chord elements and the diagonals. After a presentation of different alternatives, multiple steel plates joints are adopted. The required number of plates and dowels are determined so that the failure of the connection is ductile. Then the stiffness of each connection is calculated.
In chapter 6, a more realistic finite element model including the stiffness of the connections is computed in ABAQUS. The results are presented and compared with the previous one. Thus, structural members, as well as the connections are verified according to Eurocode 5 under relevant loads. Finally, the problem of the buckling of the lower chord and the partitioning of the arch for transportation are investigated.
CHALMERS, Structural Engineering and Mechanics, Master’s Thesis 2005:103 3
2 Glued laminated timber- Glulam Glulam technology was developed in Germany around 1900. It was first used in Scandinavia around 1920. Among the first structures in Glulam built in Sweden are the central stations in Stockholm, Göteborg and Malmö.
2.1 Production process
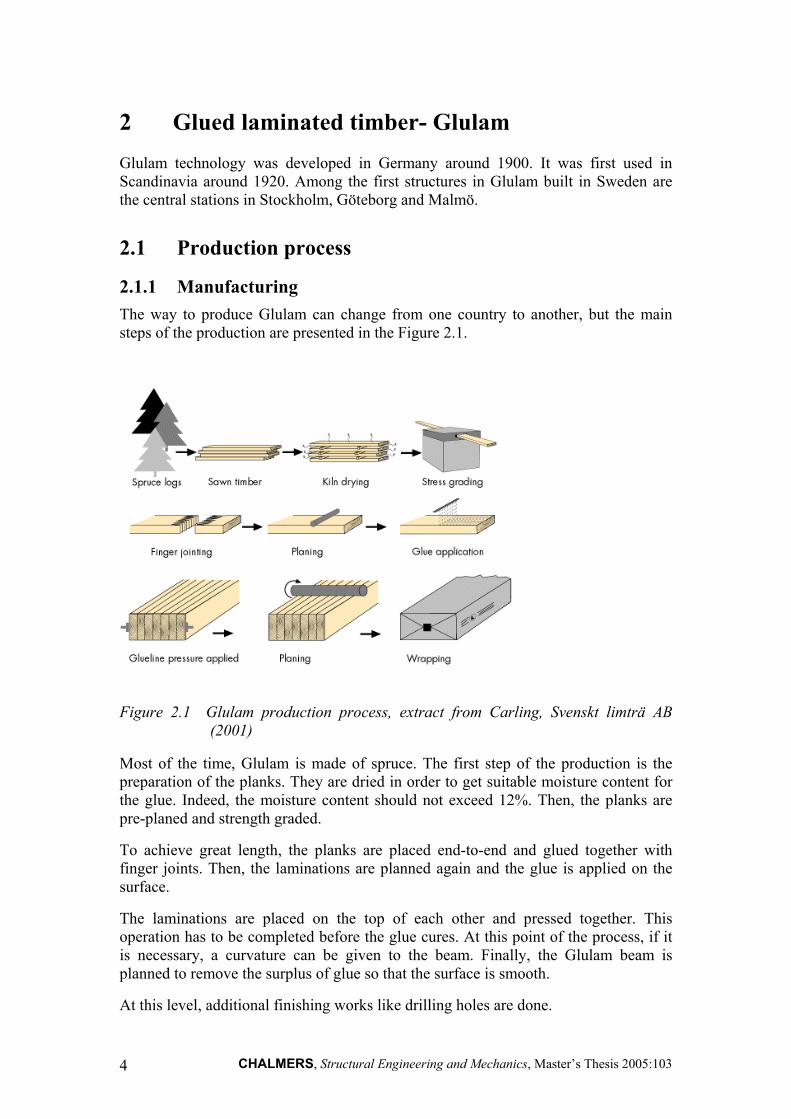
2.1.1 Manufacturing The way to produce Glulam can change from one country to another, but the main steps of the production are presented in the Figure 2.1.
Figure 2.1 Glulam production process, extract from Carling, Svenskt limträ AB (2001)
Most of the time, Glulam is made of spruce. The first step of the production is the preparation of the planks. They are dried in order to get suitable moisture content for the glue. Indeed, the moisture content should not exceed 12%. Then, the planks are pre-planed and strength graded.
To achieve great length, the planks are placed end-to-end and glued together with finger joints. Then, the laminations are planned again and the glue is applied on the surface.
The laminations are placed on the top of each other and pressed together. This operation has to be completed before the glue cures. At this point of the process, if it is necessary, a curvature can be given to the beam. Finally, the Glulam beam is planned to remove the surplus of glue so that the surface is smooth.
At this level, additional finishing works like drilling holes are done.
CHALMERS, Structural Engineering and Mechanics, Master’s Thesis 2005:103 4
2.1.2 Glue types
Nowadays, two types of glue are used at Moelven Töreboda. The common one is the melamine. This glue is white but may become darker later. It is increasingly used in Europe. However, to fulfil the requirements of the Japanese market, another glue is used at Moelven Töreboda: the phenol-resorcinol-formaldehyde. This glue is black; as a consequence, finger joints and laminations are visible.
2.1.3 Standard shapes
Different cross-sections are attainable. It mainly depends on the mechanical equipment of the manufacture. However, rectangular cross-sections are usually used.
The standard depth of a lamination is 45mm. The nominal width varies between a range of 90mm to 215mm. It is possible to achieve greater width by edge gluing.
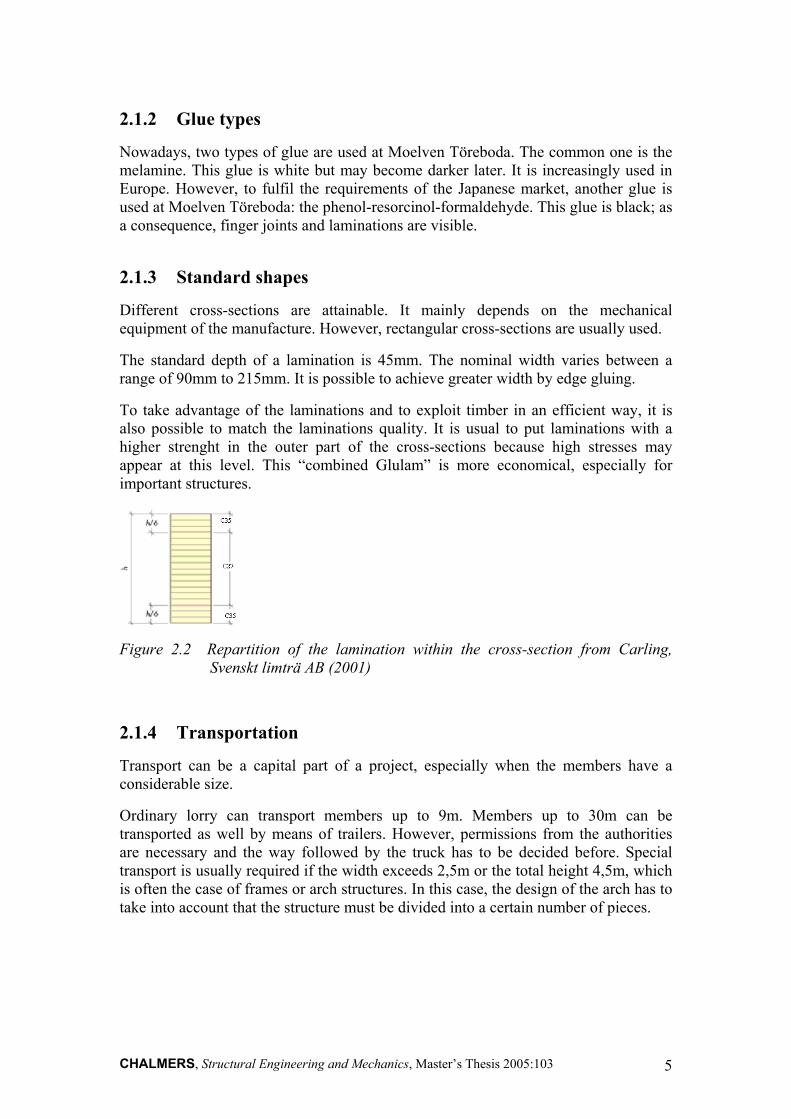
To take advantage of the laminations and to exploit timber in an efficient way, it is also possible to match the laminations quality. It is usual to put laminations with a higher strenght in the outer part of the cross-sections because high stresses may appear at this level. This “combined Glulam” is more economical, especially for important structures.
Figure 2.2 Repartition of the lamination within the cross-section from Carling, Svenskt limträ AB (2001)
2.1.4 Transportation
Transport can be a capital part of a project, especially when the members have a considerable size.
Ordinary lorry can transport members up to 9m. Members up to 30m can be transported as well by means of trailers. However, permissions from the authorities are necessary and the way followed by the truck has to be decided before. Special transport is usually required if the width exceeds 2,5m or the total height 4,5m, which is often the case of frames or arch structures. In this case, the design of the arch has to take into account that the structure must be divided into a certain number of pieces.
CHALMERS, Structural Engineering and Mechanics, Master’s Thesis 2005:103 5
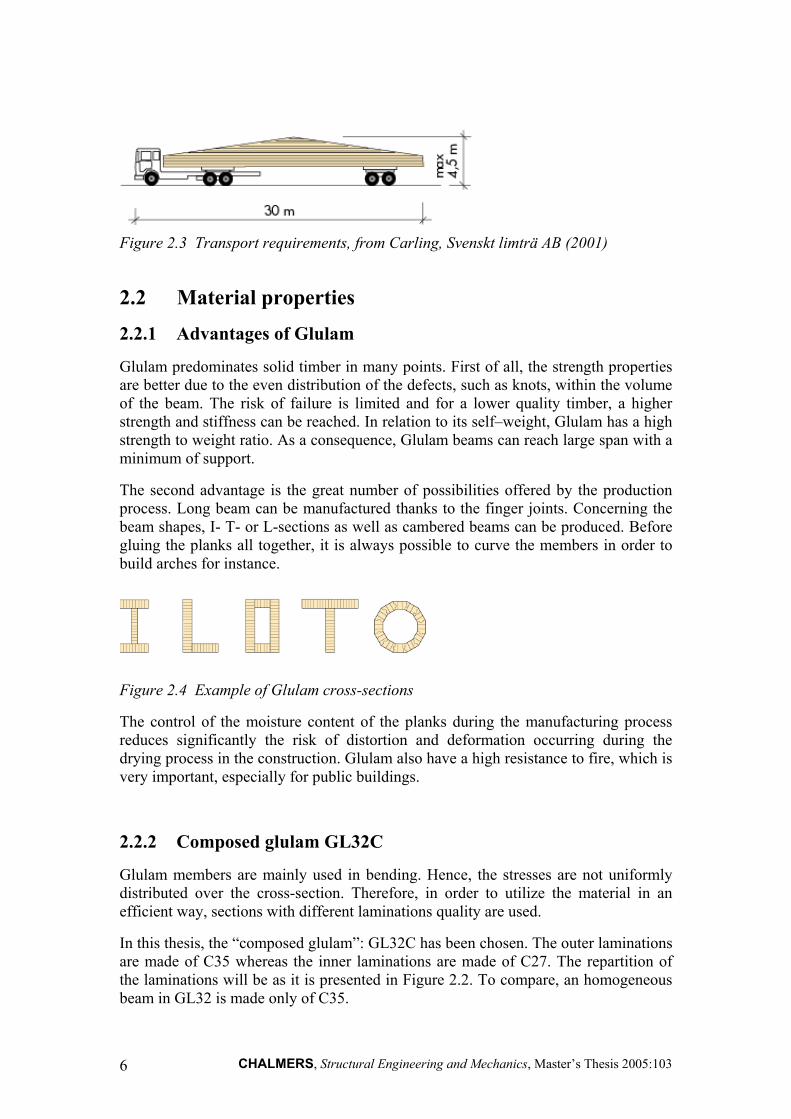
Figure 2.3 Transport requirements, from Carling, Svenskt limträ AB (2001)
2.2 Material properties
2.2.1 Advantages of Glulam
Glulam predominates solid timber in many points. First of all, the strength properties are better due to the even distribution of the defects, such as knots, within the volume of the beam. The risk of failure is limited and for a lower quality timber, a higher strength and stiffness can be reached. In relation to its self–weight, Glulam has a high strength to weight ratio. As a consequence, Glulam beams can reach large span with a minimum of support.
The second advantage is the great number of possibilities offered by the production process. Long beam can be manufactured thanks to the finger joints. Concerning the beam shapes, I- T- or L-sections as well as cambered beams can be produced. Before gluing the planks all together, it is always possible to curve the members in order to build arches for instance.
Figure 2.4 Example of Glulam cross-sections
The control of the moisture content of the planks during the manufacturing process reduces significantly the risk of distortion and deformation occurring during the drying process in the construction. Glulam also have a high resistance to fire, which is very important, especially for public buildings.
2.2.2 Composed glulam GL32C
Glulam members are mainly used in bending. Hence, the stresses are not uniformly distributed over the cross-section. Therefore, in order to utilize the material in an efficient way, sections with different laminations quality are used.
In this thesis, the “composed glulam”: GL32C has been chosen. The outer laminations are made of C35 whereas the inner laminations are made of C27. The repartition of the laminations will be as it is presented in Figure 2.2. To compare, an homogeneous beam in GL32 is made only of C35.
CHALMERS, Structural Engineering and Mechanics, Master’s Thesis 2005:103 6

2.3 Example of current structures Some structures similar to the one studied in this thesis already exist. The best examples of long span trussed arches have been found in Norway. It is probably due to the abundance of spruces in the Norwegian forest (see Figure 2.5) and the important number of timber factories. Moreover, two of the examples presented below were built for the special occasion of the Olympic Games in Lillehammer in 1994.
Figure 2.5 Norwegian forest
2.3.1 Hamar Olympiahall, Norway
This hall has been built for the Olympic games in Lillehammer in 1994. To shape the arena, the architects were inspired by the “Oselver”, a type of boat that has been built in Norway for a thousand years.
Figure 2.6 Hamar olympiahall
The roof consists of trussed Glulam arches with different spans. The largest span is 96,4m. In order to give the shape of the boat to the roof, a dorsal arch has been added. This arch has mainly an aesthetical purpose and is supported by the other arches.
CHALMERS, Structural Engineering and Mechanics, Master’s Thesis 2005:103 7
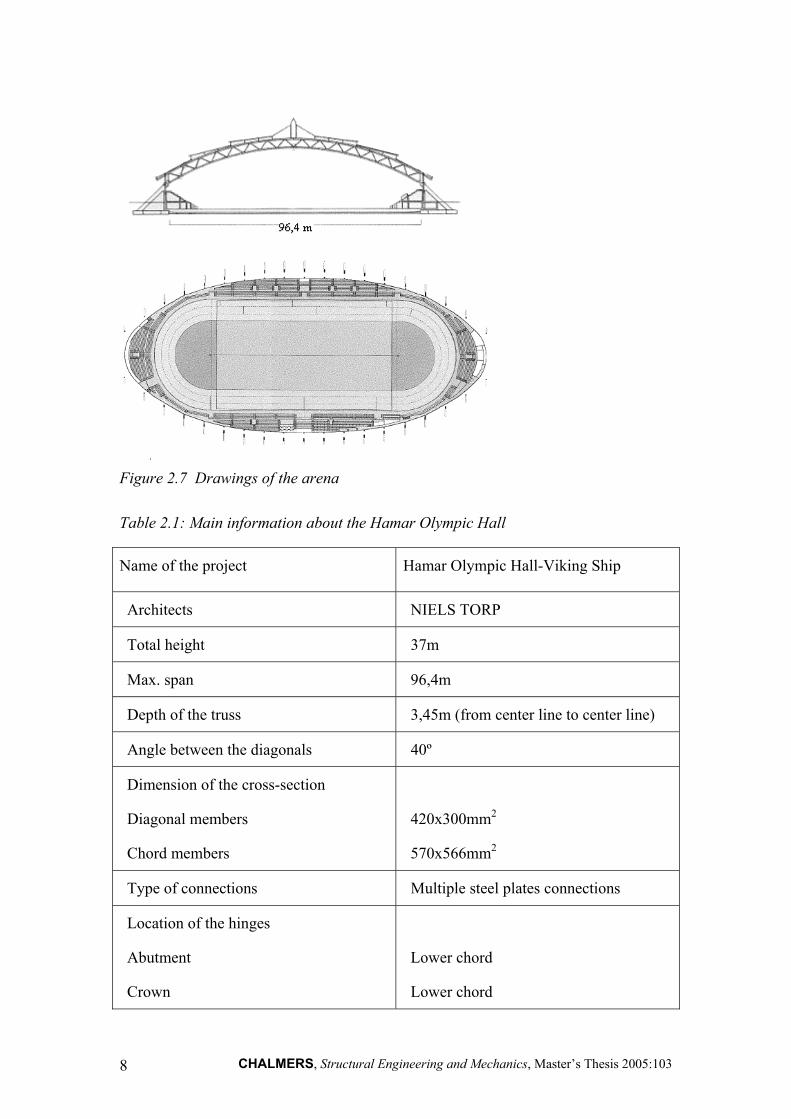
Figure 2.7 Drawings of the arena
Table 2.1: Main information about the Hamar Olympic Hall
Name of the project Hamar Olympic Hall-Viking Ship
Architects NIELS TORP
Total height 37m
Max. span 96,4m
Depth of the truss 3,45m (from center line to center line)
Angle between the diagonals 40º
Dimension of the cross-section
Diagonal members
Chord members
420x300mm2
570x566mm2
Type of connections Multiple steel plates connections
Location of the hinges
Abutment
Crown
Lower chord
Lower chord
CHALMERS, Structural Engineering and Mechanics, Master’s Thesis 2005:103 8
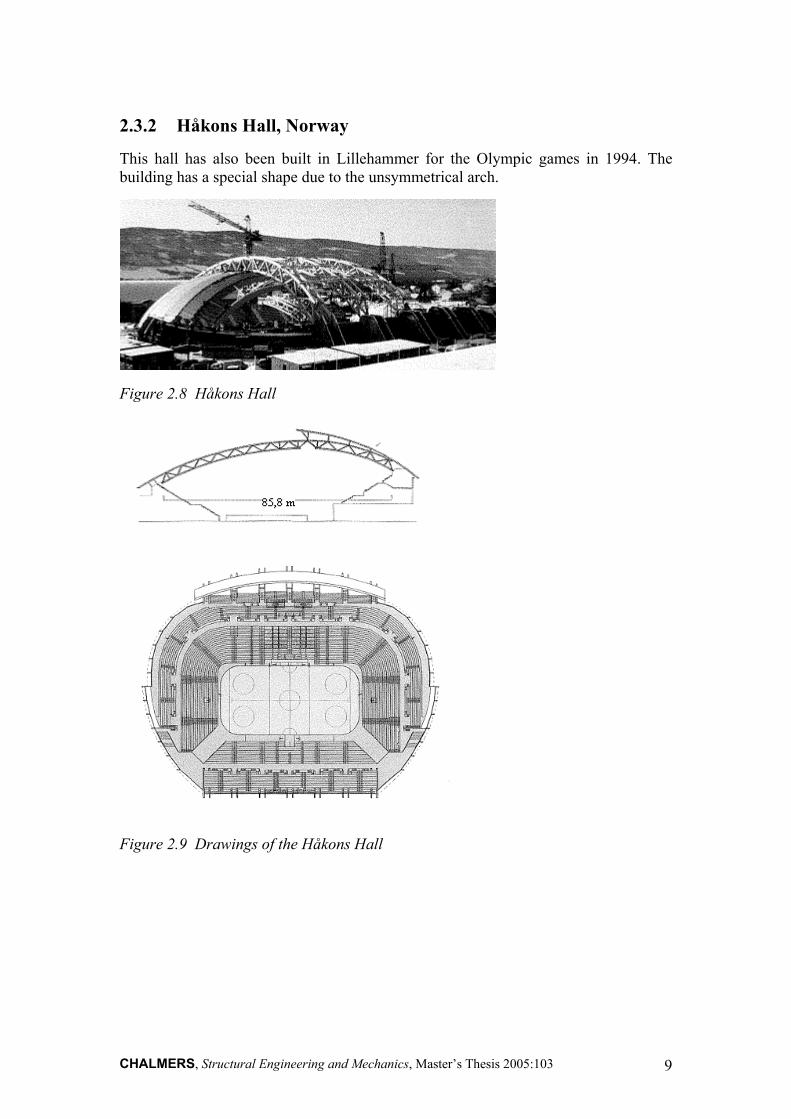
2.3.2 Håkons Hall, Norway
This hall has also been built in Lillehammer for the Olympic games in 1994. The building has a special shape due to the unsymmetrical arch.
Figure 2.8 Håkons Hall
Figure 2.9 Drawings of the Håkons Hall
CHALMERS, Structural Engineering and Mechanics, Master’s Thesis 2005:103 9
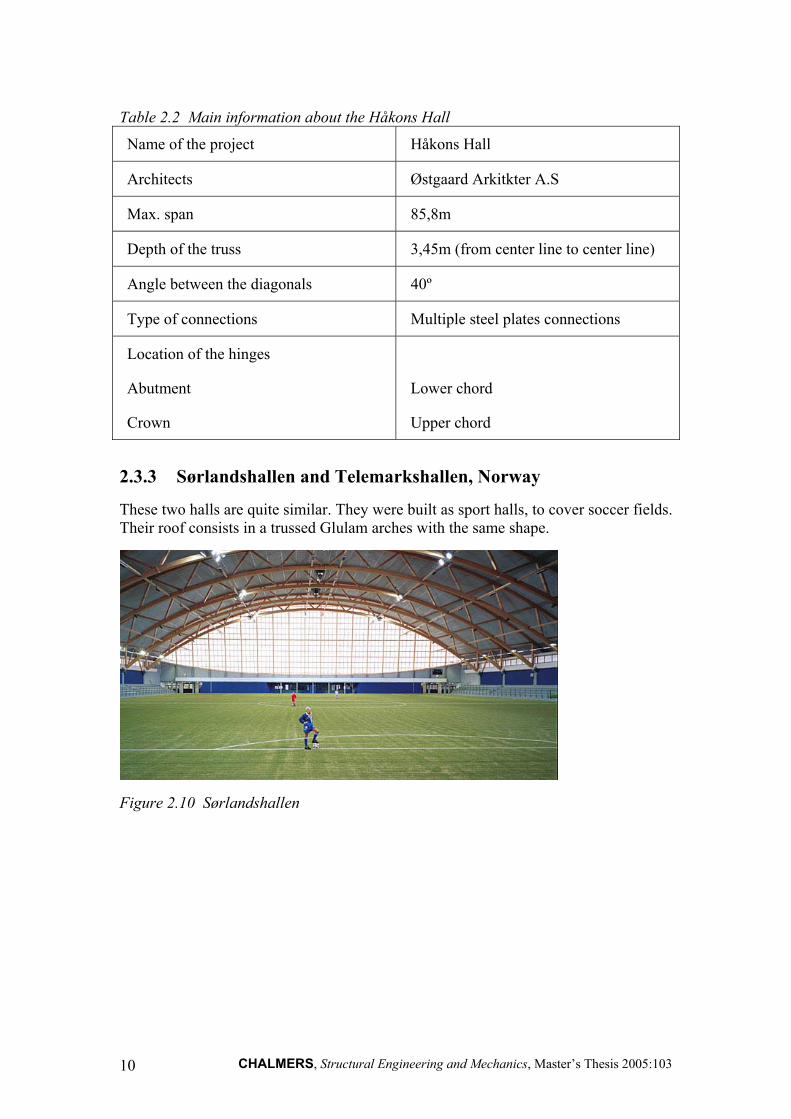
Table 2.2 Main information about the Håkons Hall
Name of the project Håkons Hall
Architects Østgaard Arkitkter A.S
Max. span 85,8m
Depth of the truss 3,45m (from center line to center line)
Angle between the diagonals 40º
Type of connections Multiple steel plates connections
Location of the hinges
Abutment
Crown
Lower chord
Upper chord
2.3.3 Sørlandshallen and Telemarkshallen, Norway
These two halls are quite similar. They were built as sport halls, to cover soccer fields. Their roof consists in a trussed Glulam arches with the same shape.
Figure 2.10 Sørlandshallen
CHALMERS, Structural Engineering and Mechanics, Master’s Thesis 2005:103 10
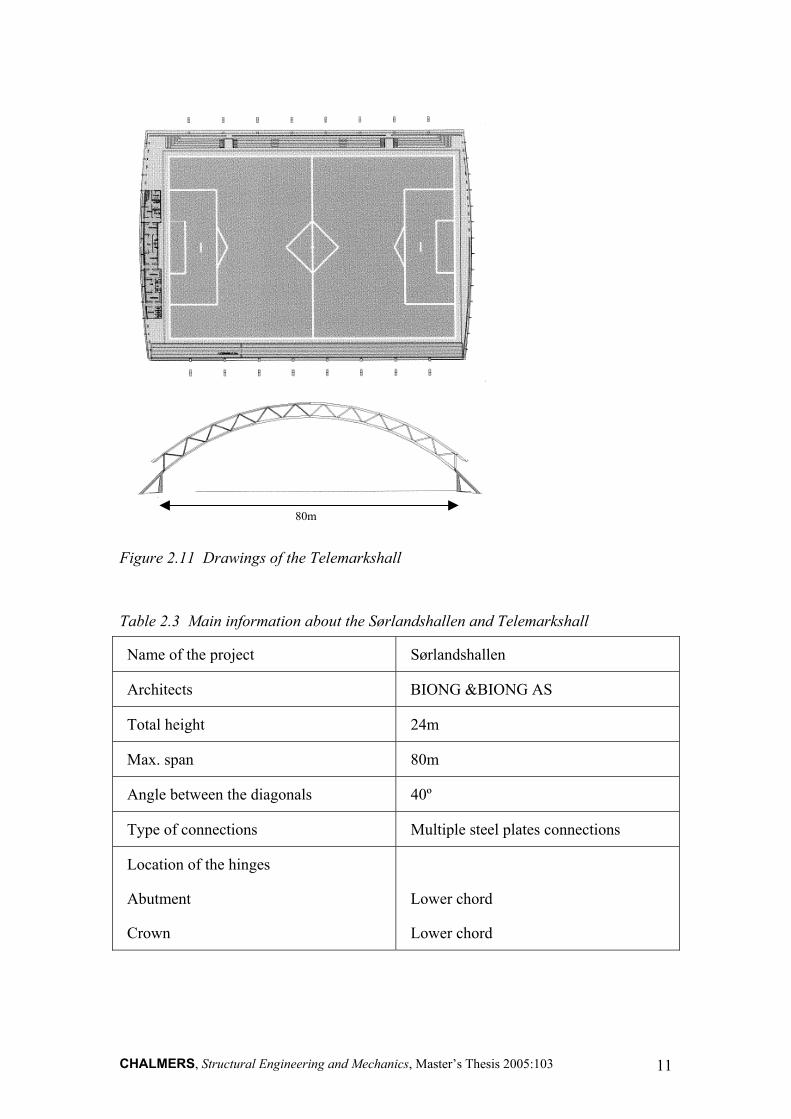
80m
Figure 2.11 Drawings of the Telemarkshall
Table 2.3 Main information about the Sørlandshallen and Telemarksh
Name of the project Sørlandshallen
Architects BIONG &BIONG AS
Total height 24m
Max. span 80m
Angle between the diagonals 40º
Type of connections Multiple steel plates con
Location of the hinges
Abutment
Crown
Lower chord
Lower chord
CHALMERS, Structural Engineering and Mechanics, Master’s Thesis 2005:103
all
nections
11
2.3.4 Conclusions
The four examples presented above give a good illustration of the utility of long span arch structures.
However, such structures are not spread in other countries due to the higher cost of timber compared to other building materials. The choice of timber should therefore be done in the architectural design stage.
From the different examples, it can be observed that many possibilities can be chosen for the location of the hinges in the structure, the depth of the truss and also the number of diagonal elements. The influence of these parameters will be studied later on.
CHALMERS, Structural Engineering and Mechanics, Master’s Thesis 2005:103 12
3 Optimum static system 3 Optimum static system 3.1 Theory of arches 3.1 Theory of arches When a cable is subjected to a load, it deforms following the funicular shape. The shape of the cable when it is submitted only to its self-weight is called catenary. It is often approximated by an ellipse or an arc of circle.
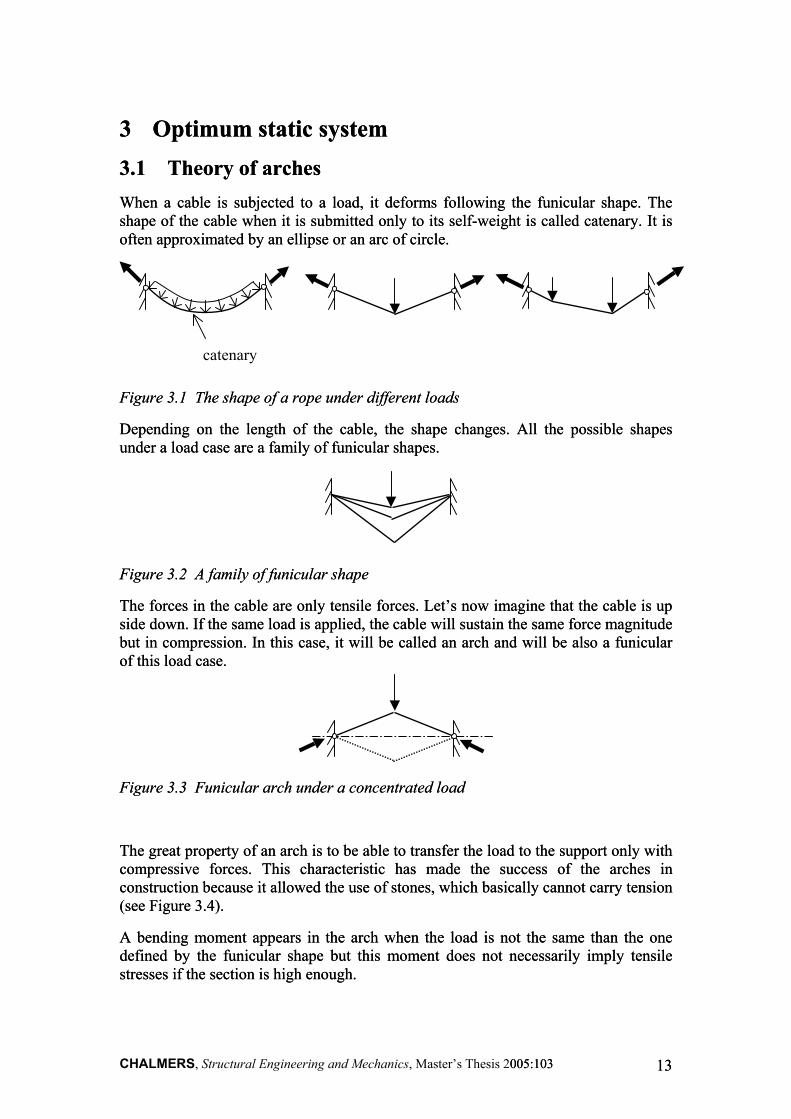
When a cable is subjected to a load, it deforms following the funicular shape. The shape of the cable when it is submitted only to its self-weight is called catenary. It is often approximated by an ellipse or an arc of circle.
catenary
Figure 3.1 The shape of a rope under different loads Figure 3.1 The shape of a rope under different loads
Depending on the length of the cable, the shape changes. All the possible shapes under a load case are a family of funicular shapes. Depending on the length of the cable, the shape changes. All the possible shapes under a load case are a family of funicular shapes.
Figure 3.2 A family of funicular shape Figure 3.2 A family of funicular shape
The forces in the cable are only tensile forces. Let’s now imagine that the cable is up side down. If the same load is applied, the cable will sustain the same force magnitude but in compression. In this case, it will be called an arch and will be also a funicular of this load case.
The forces in the cable are only tensile forces. Let’s now imagine that the cable is up side down. If the same load is applied, the cable will sustain the same force magnitude but in compression. In this case, it will be called an arch and will be also a funicular of this load case.
Figure 3.3 Funicular arch under a concentrated load Figure 3.3 Funicular arch under a concentrated load
The great property of an arch is to be able to transfer the load to the support only with compressive forces. This characteristic has made the success of the arches in construction because it allowed the use of stones, which basically cannot carry tension (see Figure 3.4).
The great property of an arch is to be able to transfer the load to the support only with compressive forces. This characteristic has made the success of the arches in construction because it allowed the use of stones, which basically cannot carry tension (see Figure 3.4).
A bending moment appears in the arch when the load is not the same than the one defined by the funicular shape but this moment does not necessarily imply tensile stresses if the section is high enough.
A bending moment appears in the arch when the load is not the same than the one defined by the funicular shape but this moment does not necessarily imply tensile stresses if the section is high enough.
CHALMERS, Structural Engineering and Mechanics, Master’s Thesis 2005:103 005:103 1313
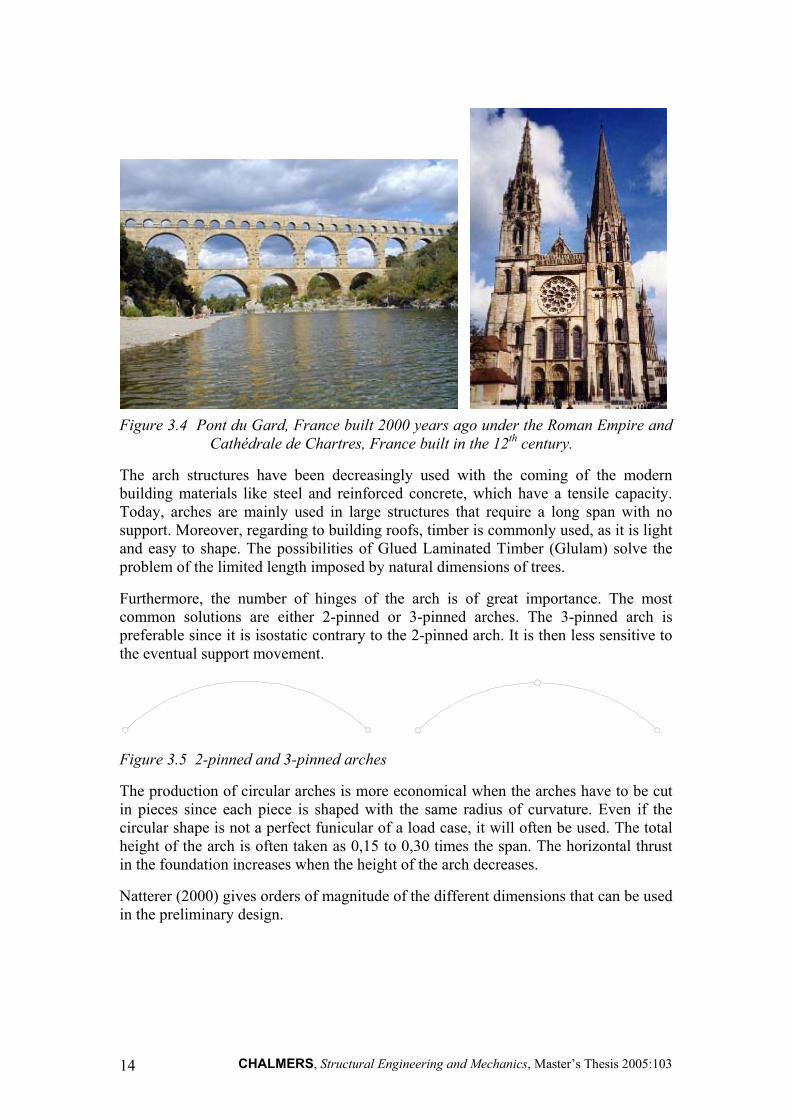
Figure 3.4 Pont du Gard, France built 2000 years ago under the Roman Empire and
Cathédrale de Chartres, France built in the 12th century.
The arch structures have been decreasingly used with the coming of the modern building materials like steel and reinforced concrete, which have a tensile capacity. Today, arches are mainly used in large structures that require a long span with no support. Moreover, regarding to building roofs, timber is commonly used, as it is light and easy to shape. The possibilities of Glued Laminated Timber (Glulam) solve the problem of the limited length imposed by natural dimensions of trees.
Furthermore, the number of hinges of the arch is of great importance. The most common solutions are either 2-pinned or 3-pinned arches. The 3-pinned arch is preferable since it is isostatic contrary to the 2-pinned arch. It is then less sensitive to the eventual support movement.
Figure 3.5 2-pinned and 3-pinned arches
The production of circular arches is more economical when the arches have to be cut in pieces since each piece is shaped with the same radius of curvature. Even if the circular shape is not a perfect funicular of a load case, it will often be used. The total height of the arch is often taken as 0,15 to 0,30 times the span. The horizontal thrust in the foundation increases when the height of the arch decreases.
Natterer (2000) gives orders of magnitude of the different dimensions that can be used in the preliminary design.
CHALMERS, Structural Engineering and Mechanics, Master’s Thesis 2005:103 14
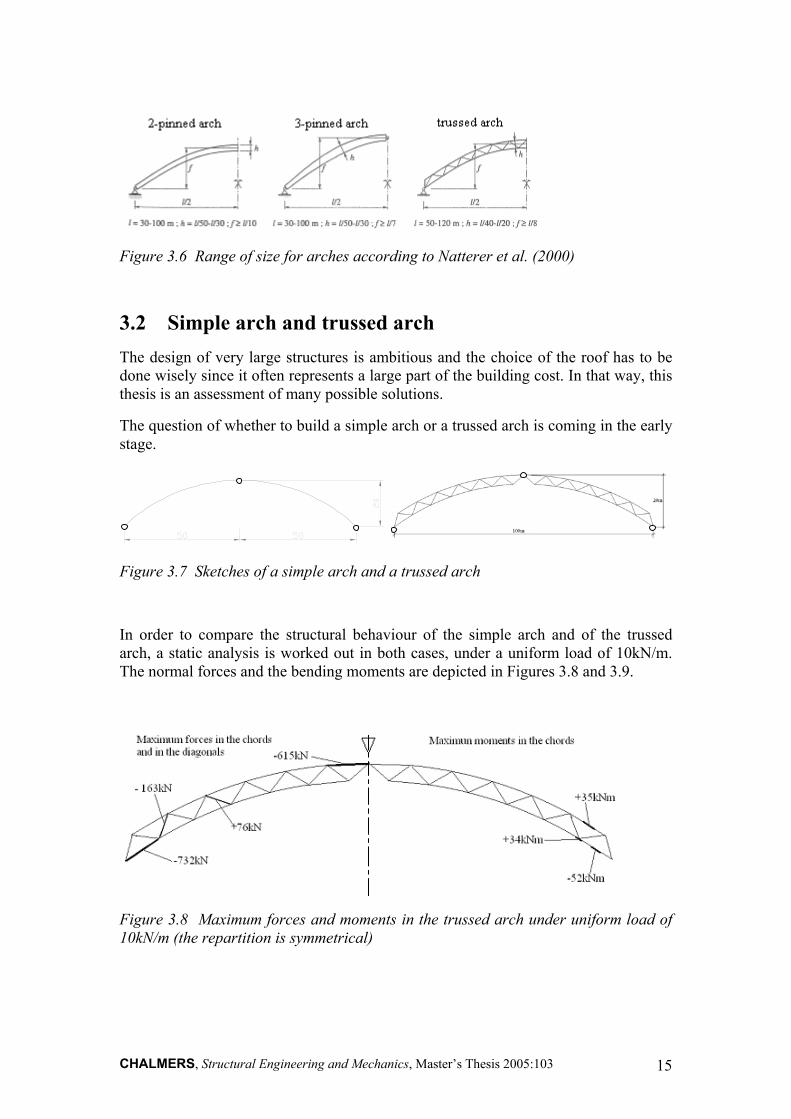
Figure 3.6 Range of size for arches according to Natterer et al. (2000)
3.2 Simple arch and trussed arch The design of very large structures is ambitious and the choice of the roof has to be done wisely since it often represents a large part of the building cost. In that way, this thesis is an assessment of many possible solutions.
The question of whether to build a simple arch or a trussed arch is coming in the early stage.
Figure 3.7 Sketches of a simple arch and a trussed arch
In order to compare the structural behaviour of the simple arch and of the trussed arch, a static analysis is worked out in both cases, under a uniform load of 10kN/m. The normal forces and the bending moments are depicted in Figures 3.8 and 3.9.
Figure 3.8 Maximum forces and moments in the trussed arch under uniform load of 10kN/m (the repartition is symmetrical)
CHALMERS, Structural Engineering and Mechanics, Master’s Thesis 2005:103 15

Figure 3.9 Forces and moments in the simple arch under uniform load of 10kN/m (the repartition is symmetrical)
This comparison highlights that the forces and especially the bending moments are larger in the simple arch than in the trussed one. This is not the only reason that makes the trussed arch more competitive. The construction and assembly process are very important when considering a 100m span arch. Indeed, it implies that the structure will be divided in several parts, then transported and finally assembled on the construction site. It is very hard to achieve a very stiff connection in timber that could ensure the continuous stiffness of the chord. This problem is less important when considering a trussed arch since it is not such a problem to have a semi-rigid connection.
3.3 Investigated model The purpose of this chapter is to study trussed arches and especially to investigate the influence of boundary conditions and some relevant geometrical parameters. In order to go further in details, the main shape of the arch and the cross-section of the members are decided.
Therefore, the main structure consists in a 100m-span and a 20m-height (see Figure 3.10). The arches are parallel to each other and the distance between them is set at 12m. The upper chord is assumed to be laterally stabilized by the roofing.
Figure 3.10 Illustration of the model studied in this thesis
100m
20m
CHALMERS, Structural Engineering and Mechanics, Master’s Thesis 2005:103 16
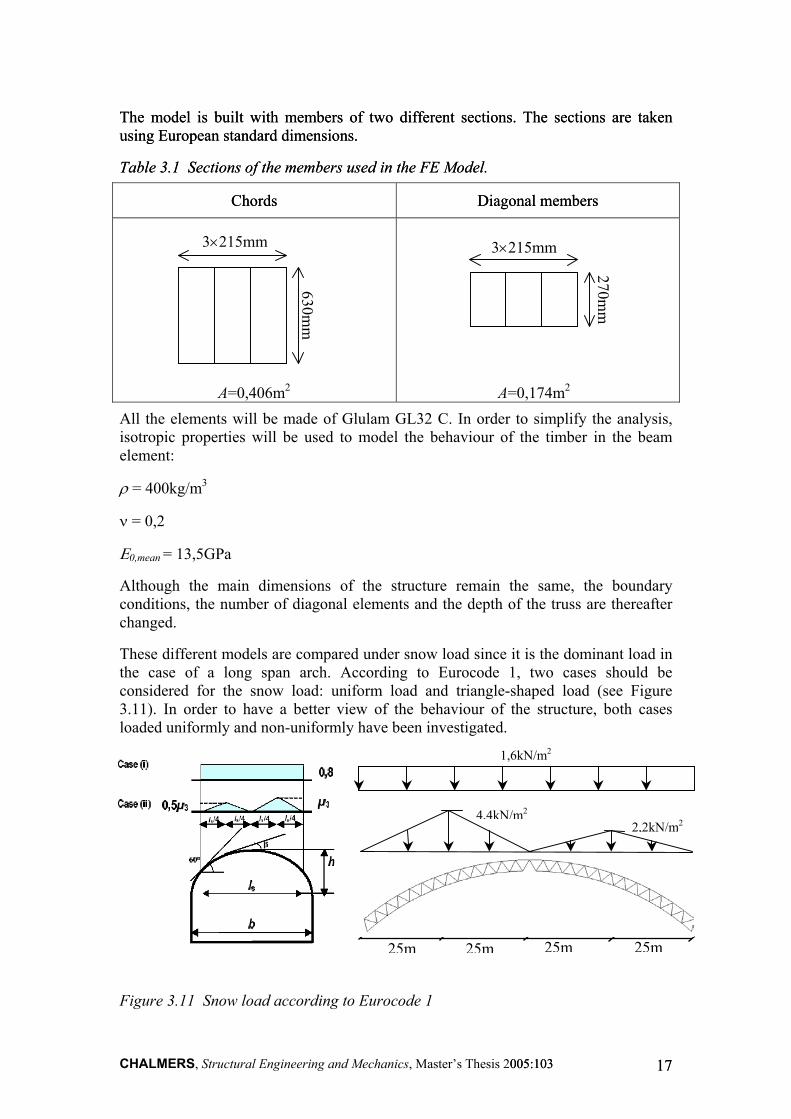
The model is built with members of two different sections. The sections are taken using European standard dimensions. The model is built with members of two different sections. The sections are taken using European standard dimensions.
Table 3.1 Sections of the members used in the FE Model. Table 3.1 Sections of the members used in the FE Model.
Chords Chords Diagonal members Diagonal members
A=0,406m2
A=0,174m2
3×215mm
630mm
3×215mm
270mm
All the elements will be made of Glulam GL32 C. In order to simplify the analysis, isotropic properties will be used to model the behaviour of the timber in the beam element:
ρ = 400kg/m3
ν = 0,2
Ε0,mean = 13,5GPa
Although the main dimensions of the structure remain the same, the boundary conditions, the number of diagonal elements and the depth of the truss are thereafter changed.
These different models are compared under snow load since it is the dominant load in the case of a long span arch. According to Eurocode 1, two cases should be considered for the snow load: uniform load and triangle-shaped load (see Figure 3.11). In order to have a better view of the behaviour of the structure, both cases loaded uniformly and non-uniformly have been investigated.
2005:103 005:103 1717
4,4kN/m2
2,2kN/m2
25m 25m 25m 25m
1,6kN/m2
Figure 3.11 Snow load according to Eurocode 1
CHALMERS, Structural Engineering and Mechanics, Master’s Thesis
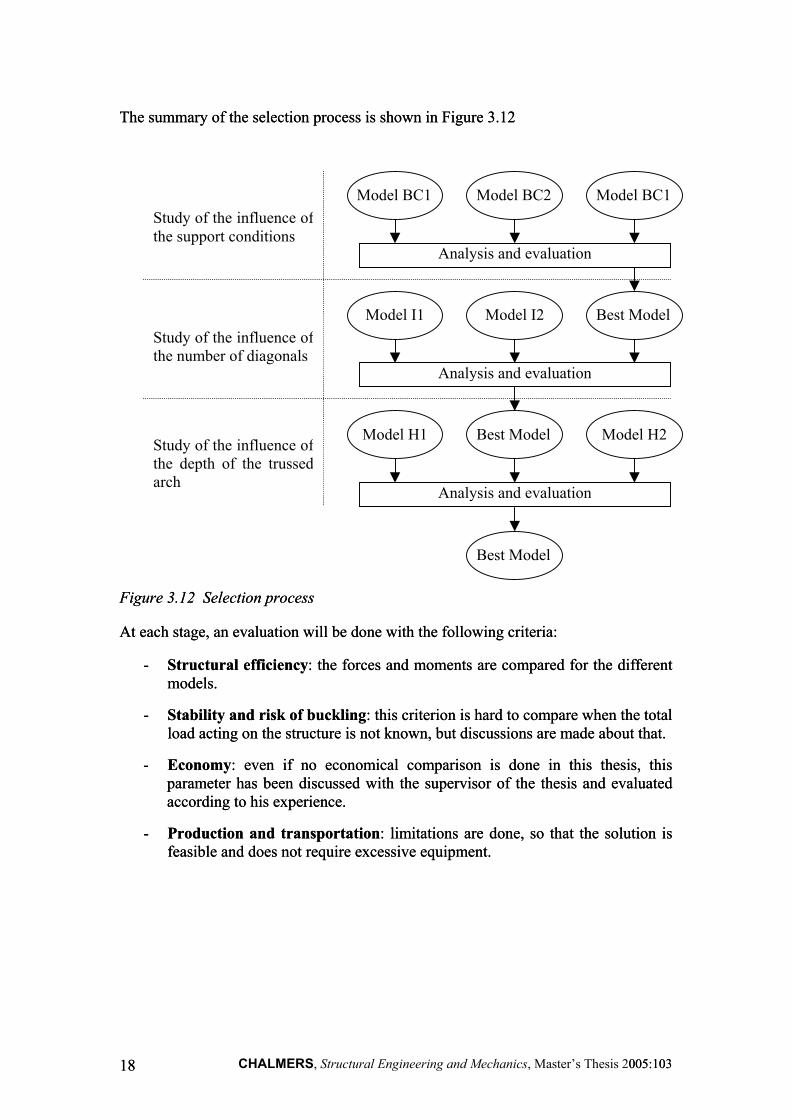
The summary of the selection process is shown in Figure 3.12 The summary of the selection process is shown in Figure 3.12
Model BC1 Model BC2 Model BC1
Analysis and evaluation
Best ModelModel I2 Model I1
Analysis and evaluation
Best Model Model H2Model H1
Analysis and evaluation
Study of the influence ofthe support conditions
Study of the influence ofthe number of diagonals
Study of the influence ofthe depth of the trussedarch
Best Model
Figure 3.12 Selection process Figure 3.12 Selection process
At each stage, an evaluation will be done with the following criteria: At each stage, an evaluation will be done with the following criteria:
- Structural efficiency: the forces and moments are compared for the different models.
- Structural efficiency: the forces and moments are compared for the different models.
- Stability and risk of buckling: this criterion is hard to compare when the total load acting on the structure is not known, but discussions are made about that.
- Stability and risk of buckling: this criterion is hard to compare when the total load acting on the structure is not known, but discussions are made about that.
- Economy: even if no economical comparison is done in this thesis, this parameter has been discussed with the supervisor of the thesis and evaluated according to his experience.
- Economy: even if no economical comparison is done in this thesis, this parameter has been discussed with the supervisor of the thesis and evaluated according to his experience.
- Production and transportation: limitations are done, so that the solution is feasible and does not require excessive equipment.
- Production and transportation: limitations are done, so that the solution is feasible and does not require excessive equipment.
CHALMERS, Structural Engineering and Mechanics, Master’s Thesis 2005:103 005:103 1818
3.4 Finite Element model 3.4 Finite Element model
3.4.1 General modelling 3.4.1 General modelling
In order to study the structural behaviour of the arch, a Finite Element (FE) model is created using the commercial ABAQUS software. After several tries, it has been decided to carry out the comparison with the model described below.
In order to study the structural behaviour of the arch, a Finite Element (FE) model is created using the commercial ABAQUS software. After several tries, it has been decided to carry out the comparison with the model described below.
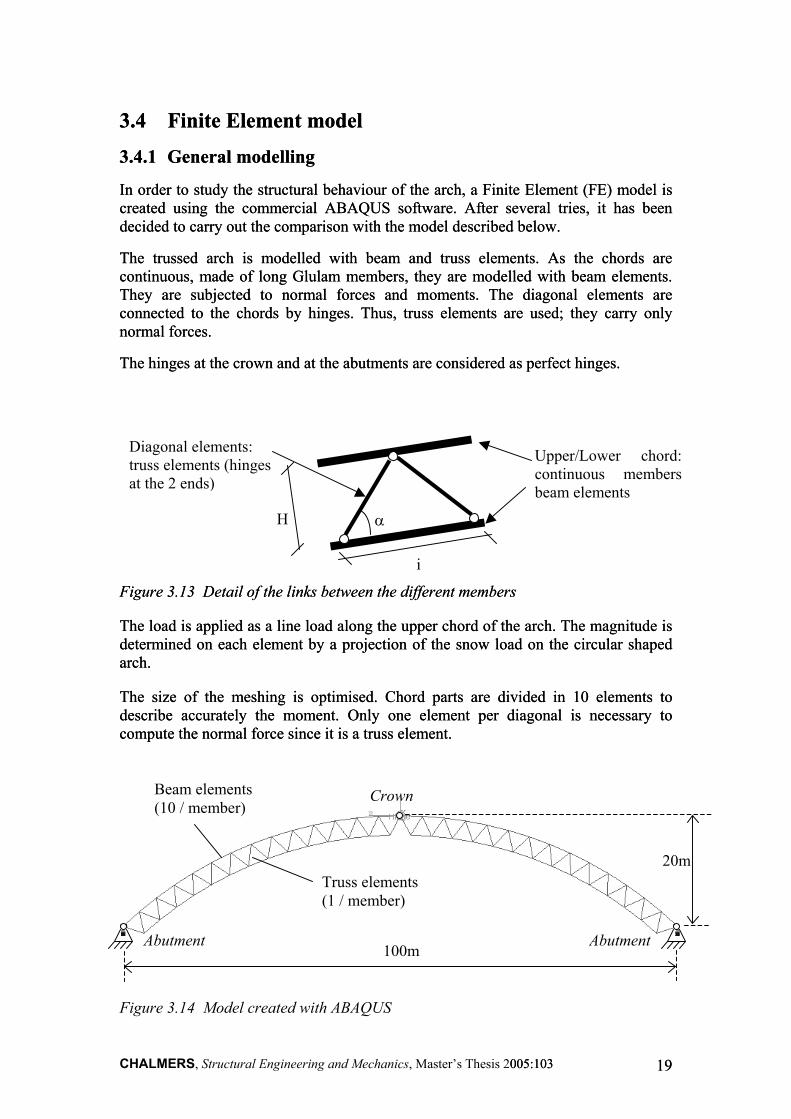
The trussed arch is modelled with beam and truss elements. As the chords are continuous, made of long Glulam members, they are modelled with beam elements. They are subjected to normal forces and moments. The diagonal elements are connected to the chords by hinges. Thus, truss elements are used; they carry only normal forces.
The trussed arch is modelled with beam and truss elements. As the chords are continuous, made of long Glulam members, they are modelled with beam elements. They are subjected to normal forces and moments. The diagonal elements are connected to the chords by hinges. Thus, truss elements are used; they carry only normal forces.
The hinges at the crown and at the abutments are considered as perfect hinges. The hinges at the crown and at the abutments are considered as perfect hinges.
i
α H
continuous membersbeam elements
truss elements (hinges at the 2 ends)
Diagonal elements: Upper/Lower chord:
Figure 3.13 Detail of the links between the different members Figure 3.13 Detail of the links between the different members
The load is applied as a line load along the upper chord of the arch. The magnitude is determined on each element by a projection of the snow load on the circular shaped arch.
The load is applied as a line load along the upper chord of the arch. The magnitude is determined on each element by a projection of the snow load on the circular shaped arch.
The size of the meshing is optimised. Chord parts are divided in 10 elements to describe accurately the moment. Only one element per diagonal is necessary to compute the normal force since it is a truss element.
The size of the meshing is optimised. Chord parts are divided in 10 elements to describe accurately the moment. Only one element per diagonal is necessary to compute the normal force since it is a truss element.
Beam elements (10 / member)
Truss elements (1 / member)
100m
20m
Crown
Abutment Abutment
Figure 3.14 Model created with ABAQUS
CHALMERS, Structural Engineering and Mechanics, Master’s Thesis 2005:103 005:103 1919
3.4.2 Influence of 2nd order effects
The linear elastic theory used to solve a static problem is based on the principle of superposition: If the displacement of, and stresses at, all points of a structure are proportional to the loads causing them, then the total displacements and stresses resulting from the application of several loads will be the sum of the displacements and stresses caused by these loads when applied separately, extract from Kinney (1957).
Two assumptions must be correct in order to make this principle valid. Firstly, a linear relationship between stresses and strains should exist in the range of working stresses. Secondly, the change of shape in the loaded structure is neglected and the variables are computed in the original shape.
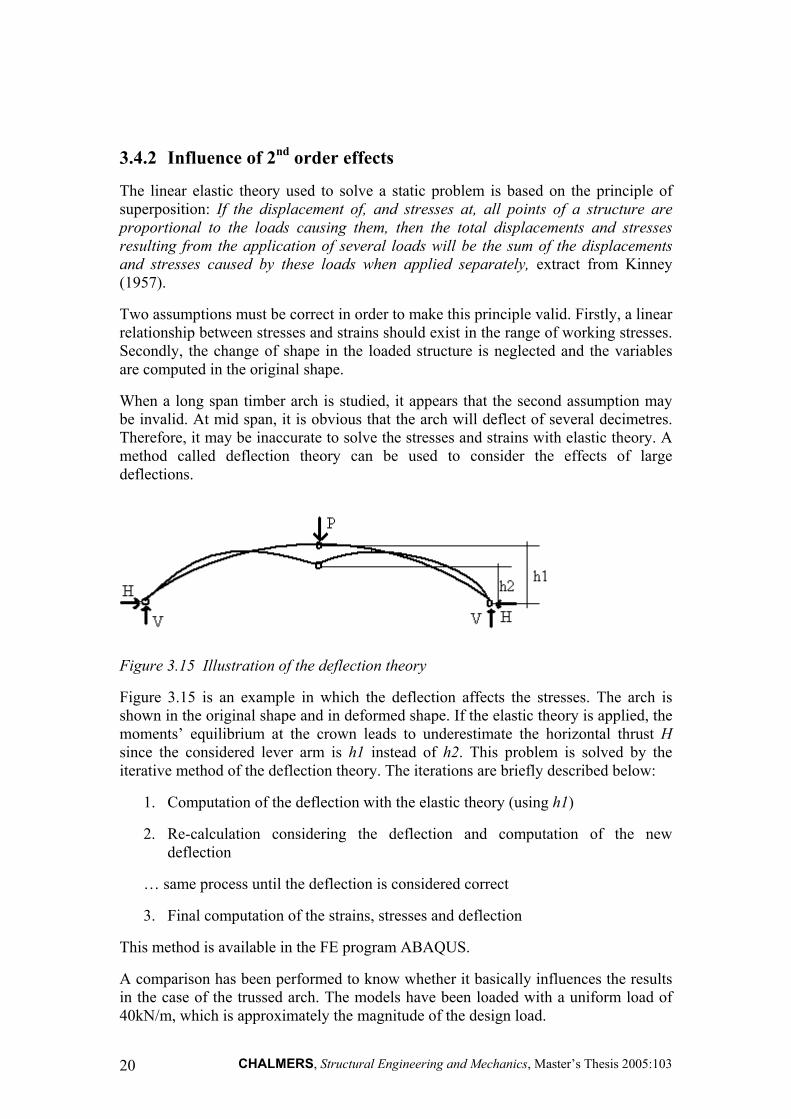
When a long span timber arch is studied, it appears that the second assumption may be invalid. At mid span, it is obvious that the arch will deflect of several decimetres. Therefore, it may be inaccurate to solve the stresses and strains with elastic theory. A method called deflection theory can be used to consider the effects of large deflections.
Figure 3.15 Illustration of the deflection theory
Figure 3.15 is an example in which the deflection affects the stresses. The arch is shown in the original shape and in deformed shape. If the elastic theory is applied, the moments’ equilibrium at the crown leads to underestimate the horizontal thrust H since the considered lever arm is h1 instead of h2. This problem is solved by the iterative method of the deflection theory. The iterations are briefly described below:
1. Computation of the deflection with the elastic theory (using h1)
2. Re-calculation considering the deflection and computation of the new deflection
… same process until the deflection is considered correct
3. Final computation of the strains, stresses and deflection
This method is available in the FE program ABAQUS.
A comparison has been performed to know whether it basically influences the results in the case of the trussed arch. The models have been loaded with a uniform load of 40kN/m, which is approximately the magnitude of the design load.
CHALMERS, Structural Engineering and Mechanics, Master’s Thesis 2005:103 20
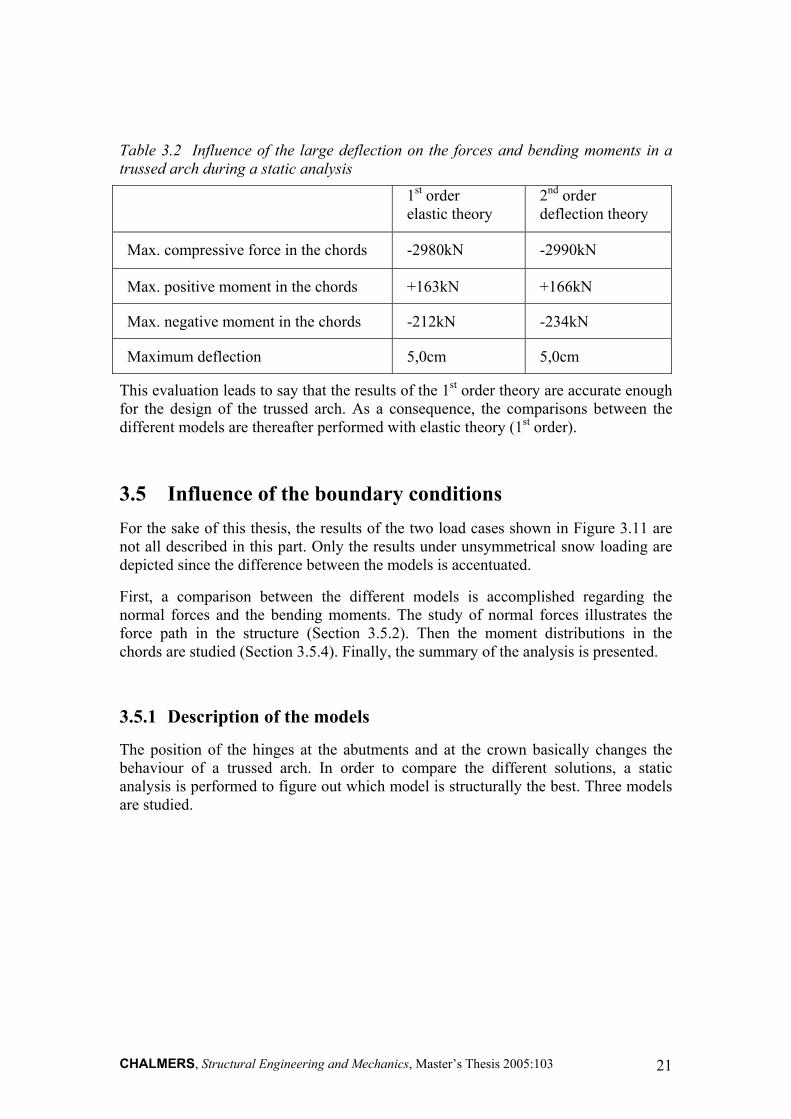
Table 3.2 Influence of the large deflection on the forces and bending moments in a trussed arch during a static analysis
1st order elastic theory
2nd order deflection theory
Max. compressive force in the chords -2980kN -2990kN
Max. positive moment in the chords +163kN +166kN
Max. negative moment in the chords -212kN -234kN
Maximum deflection 5,0cm 5,0cm
This evaluation leads to say that the results of the 1st order theory are accurate enough for the design of the trussed arch. As a consequence, the comparisons between the different models are thereafter performed with elastic theory (1st order).
3.5 Influence of the boundary conditions For the sake of this thesis, the results of the two load cases shown in Figure 3.11 are not all described in this part. Only the results under unsymmetrical snow loading are depicted since the difference between the models is accentuated.
First, a comparison between the different models is accomplished regarding the normal forces and the bending moments. The study of normal forces illustrates the force path in the structure (Section 3.5.2). Then the moment distributions in the chords are studied (Section 3.5.4). Finally, the summary of the analysis is presented.
3.5.1 Description of the models
The position of the hinges at the abutments and at the crown basically changes the behaviour of a trussed arch. In order to compare the different solutions, a static analysis is performed to figure out which model is structurally the best. Three models are studied.
CHALMERS, Structural Engineering and Mechanics, Master’s Thesis 2005:103 21
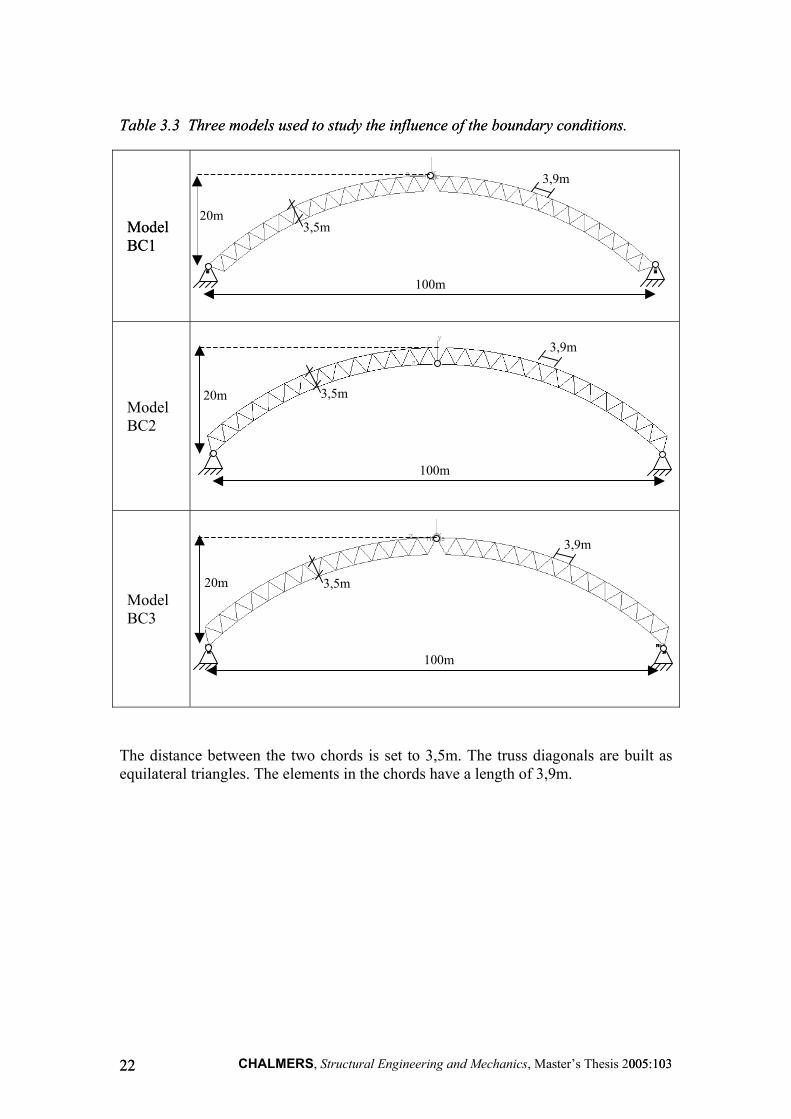
Table 3.3 Three models used to study the influence of the boundary conditions. Table 3.3 Three models used to study the influence of the boundary conditions.
Model BC1 Model BC1
Model BC2
Model BC3
100m
20m 3,5m
3,9m
100m
20m 3,5m
3,9m
100m
20m 3,5m
3,9m
The distance between the two chords is set to 3,5m. The truss diagonals are built as equilateral triangles. The elements in the chords have a length of 3,9m.
CHALMERS, Structural Engineering and Mechanics, Master’s Thesis 2005:103 005:103 2222
3.5.2 Normal forces in case of triangular snow load 3.5.2 Normal forces in case of triangular snow load
2005:103 005:103 23
•
23
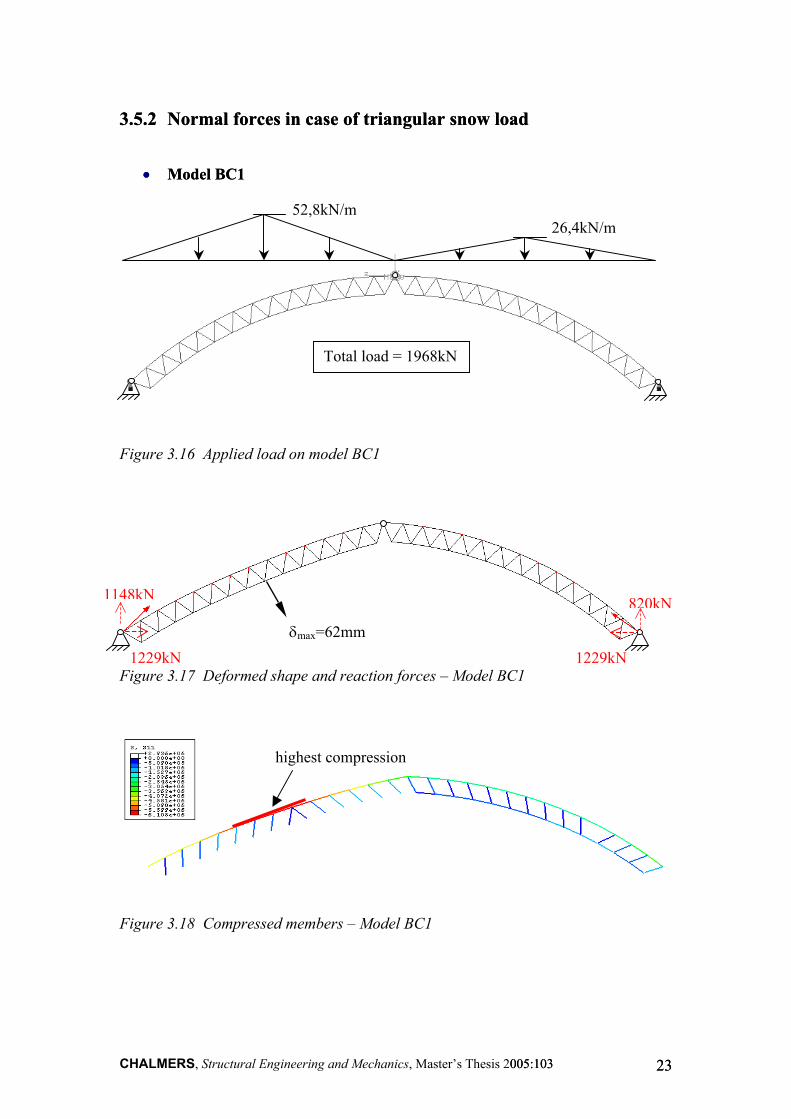
• Model BC1 Model BC1
52,8kN/m
26,4kN/m
Total load = 1968kN
Figure 3.16 Applied load on model BC1
1148kN 820kN
δmax=62mm
Figure 3.17 Deformed shape and reaction forces – Model BC1 1229kN 1229kN
highest compression
Figure 3.18 Compressed members – Model BC1
CHALMERS, Structural Engineering and Mechanics, Master’s Thesis
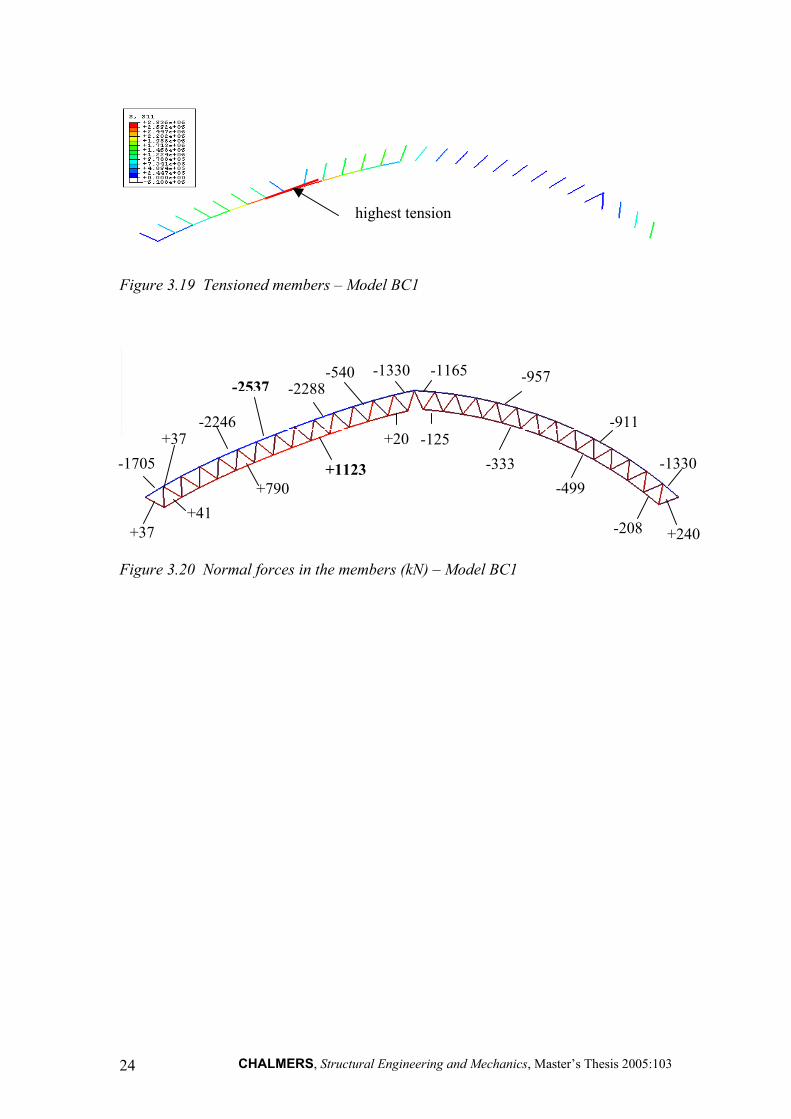
highest tension
Figure 3.19 Tensioned members – Model BC1
+41
+790 +1123
+20-1705
-2246
-2537 -2288 -1330 -1165 -957
-911
-1330
-208
-499
-125-333
+37
+37
+240
-540
Figure 3.20 Normal forces in the members (kN) – Model BC1
CHALMERS, Structural Engineering and Mechanics, Master’s Thesis 2005:103 24
2005:103 :103 25
•
25
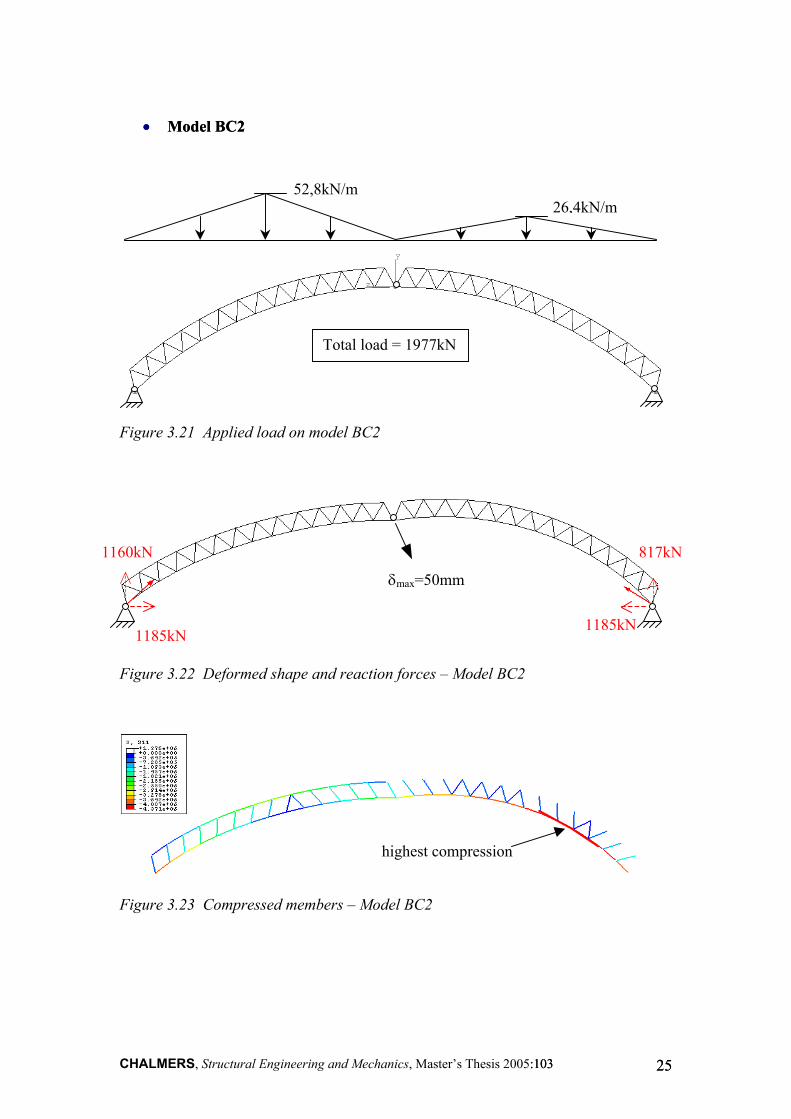
• Model BC2 Model BC2
52,8kN/m
Total load = 1977kN
26,4kN/m
Figure 3.21 Applied load on model BC2
δmax=50mm
1160kN
1185kN 1185kN
817kN
Figure 3.22 Deformed shape and reaction forces – Model BC2
highest compression
Figure 3.23 Compressed members – Model BC2
CHALMERS, Structural Engineering and Mechanics, Master’s Thesis
highest tension
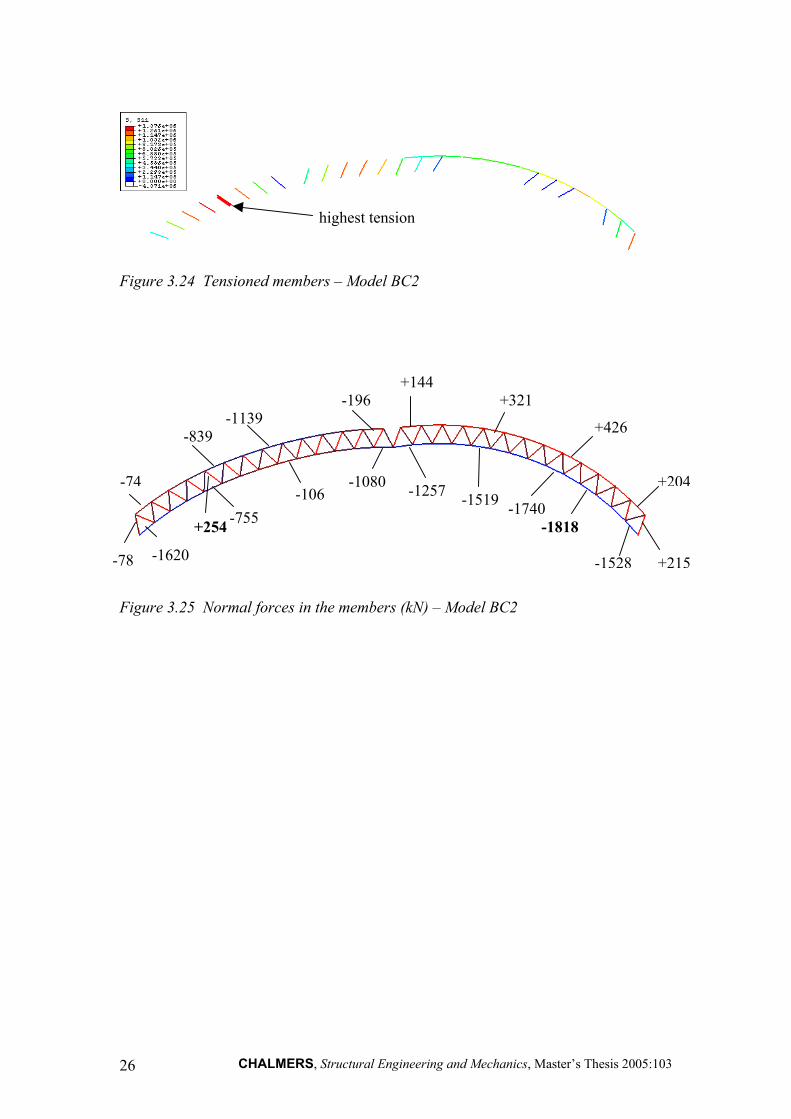
Figure 3.24 Tensioned members – Model BC2
-1620
-74 +204
+215-1528
-1740 -1818
+426
-1519
+321+144
-1257-1080
-196
-106
-1139
-755 +254
-839
-78
Figure 3.25 Normal forces in the members (kN) – Model BC2
CHALMERS, Structural Engineering and Mechanics, Master’s Thesis 2005:103 26

2005:103 :103 27
•
27
• Model BC3 Model BC3
52,8kN/m
Total load = 1968kN
26,4kN/m
Figure 3.26 Applied load on model BC3
δmax=44mm
1163kN
946kN 946kN
806kN
Figure 3.27 Deformed shape and reaction forces – Model BC3
highest compression
Figure 3.28 Compressed members – Model BC3
CHALMERS, Structural Engineering and Mechanics, Master’s Thesis
highest tension
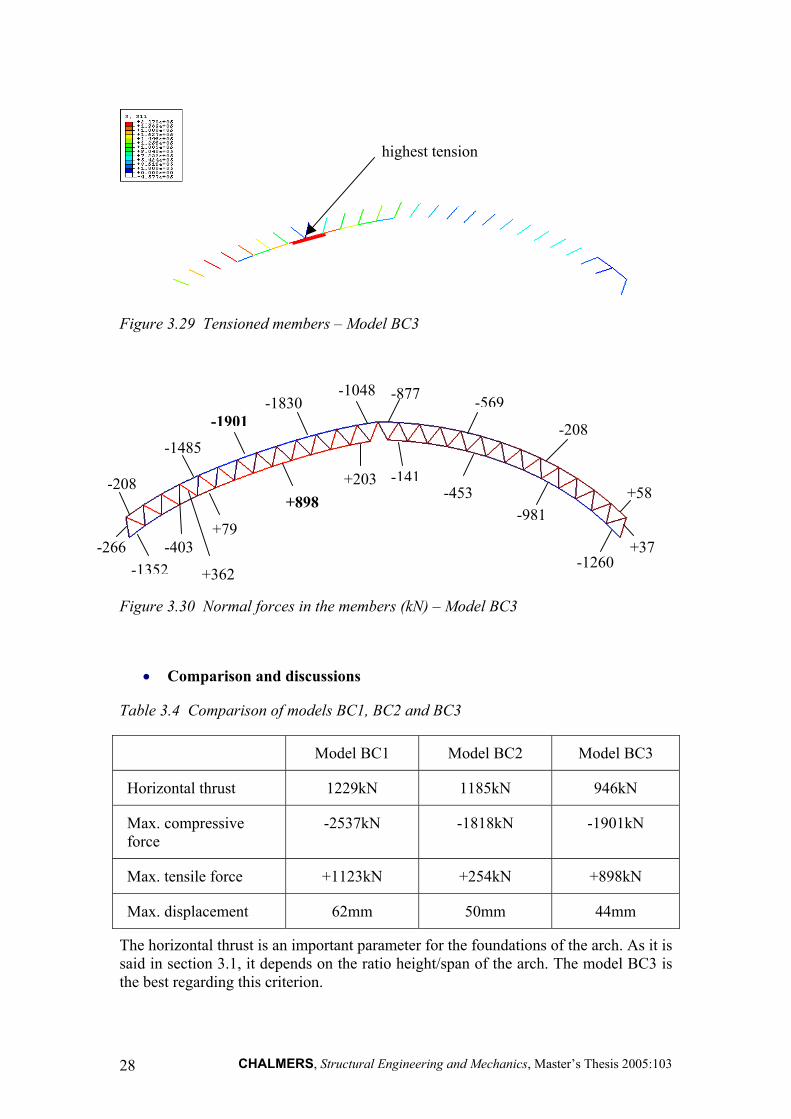
Figure 3.29 Tensioned members – Model BC3
-1352
+37
-141-453
-981
-1260
-208
+58
-569-877
+898
+362
-403 -266
-1485
-1901-1830
-1048
+203
+79
-208
Figure 3.30 Normal forces in the members (kN) – Model BC3
Comparison and discussions •
Table 3.4 Comparison of models BC1, BC2 and BC3
Model BC1 Model BC2 Model BC3
Horizontal thrust 1229kN 1185kN 946kN
Max. compressive force
-2537kN -1818kN -1901kN
Max. tensile force +1123kN +254kN +898kN
Max. displacement 62mm 50mm 44mm
The horizontal thrust is an important parameter for the foundations of the arch. As it is said in section 3.1, it depends on the ratio height/span of the arch. The model BC3 is the best regarding this criterion.
CHALMERS, Structural Engineering and Mechanics, Master’s Thesis 2005:103 28
In the different models, the force path through the trussed arch is very different from one model to another. In model BC1, the upper chord is highly compressed but the lower chord is not subjected to important forces. At the contrary, in model BC2, the lower chord is very compressed whereas the lower chord is moderately loaded. Model BC3 has a different load path and works like if the load is transferred from the upper chord to the lower chord. Therefore, the maximum force in compression is lower than in the other models.
In the different models, the force path through the trussed arch is very different from one model to another. In model BC1, the upper chord is highly compressed but the lower chord is not subjected to important forces. At the contrary, in model BC2, the lower chord is very compressed whereas the lower chord is moderately loaded. Model BC3 has a different load path and works like if the load is transferred from the upper chord to the lower chord. Therefore, the maximum force in compression is lower than in the other models.
3.5.3 Buckling of the lower chord 3.5.3 Buckling of the lower chord
This study is based on the assumption that the upper chord is laterally stabilized by the roof. In this way, the buckling of the upper chord is prevented but the problem of buckling remains important in the lower chord.
This study is based on the assumption that the upper chord is laterally stabilized by the roof. In this way, the buckling of the upper chord is prevented but the problem of buckling remains important in the lower chord.
Figure 3.31 Illustration of the buckling in the lower chord
Regarding this issue, models BC1 and BC3 are better. The risk of buckling in the lower chord is significantly reduced since the lower chord is partly tensioned. Moreover, it may be unnecessary to have bracing in such models. A striking example is the Håkons hall in Lillehammer, which does not have any lateral bracing in the lower chord.
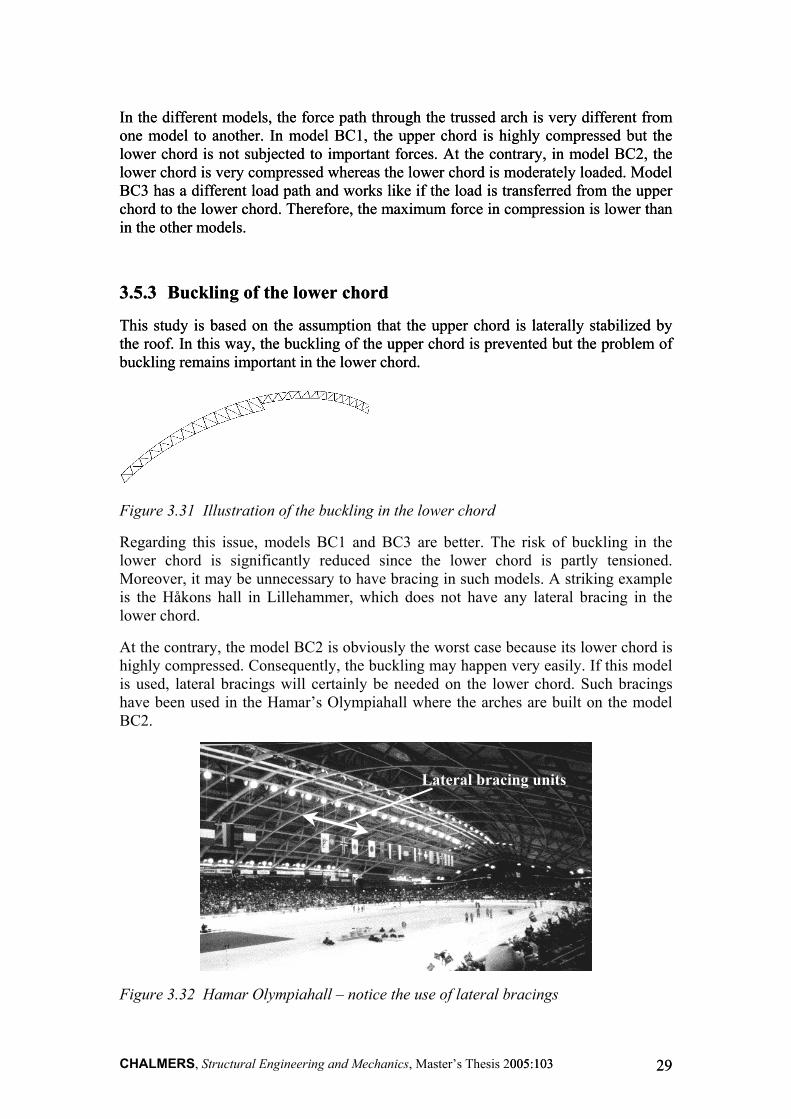
At the contrary, the model BC2 is obviously the worst case because its lower chord is highly compressed. Consequently, the buckling may happen very easily. If this model is used, lateral bracings will certainly be needed on the lower chord. Such bracings have been used in the Hamar’s Olympiahall where the arches are built on the model BC2.
Lateral bracing units
Figure 3.32 Hamar Olympiahall – notice the use of lateral bracings
CHALMERS, Structural Engineering and Mechanics, Master’s Thesis 2005:103 005:103 2929

Figure 3.33 Håkons hall, Lillehammer – Notice the absence of lateral bracing in the lower chord
Model BC2 will be skipped in the following comparison because of the buckling problem in the lower chord. The comparison is now accomplished between model BC1 and BC3 regarding the bending moment.
3.5.4 Bending moment in case of triangular snow load
Model BC1 •
Mmin= -13kNm Mmax= +70kNm
Figure 3.34 Bending moment in the upper chord – Model BC1
Mmax= +45kNm
Figure 3.35 Bending moment in the lower chord – Model BC1
CHALMERS, Structural Engineering and Mechanics, Master’s Thesis 2005:103 30
2005:103 :103 31
•
31
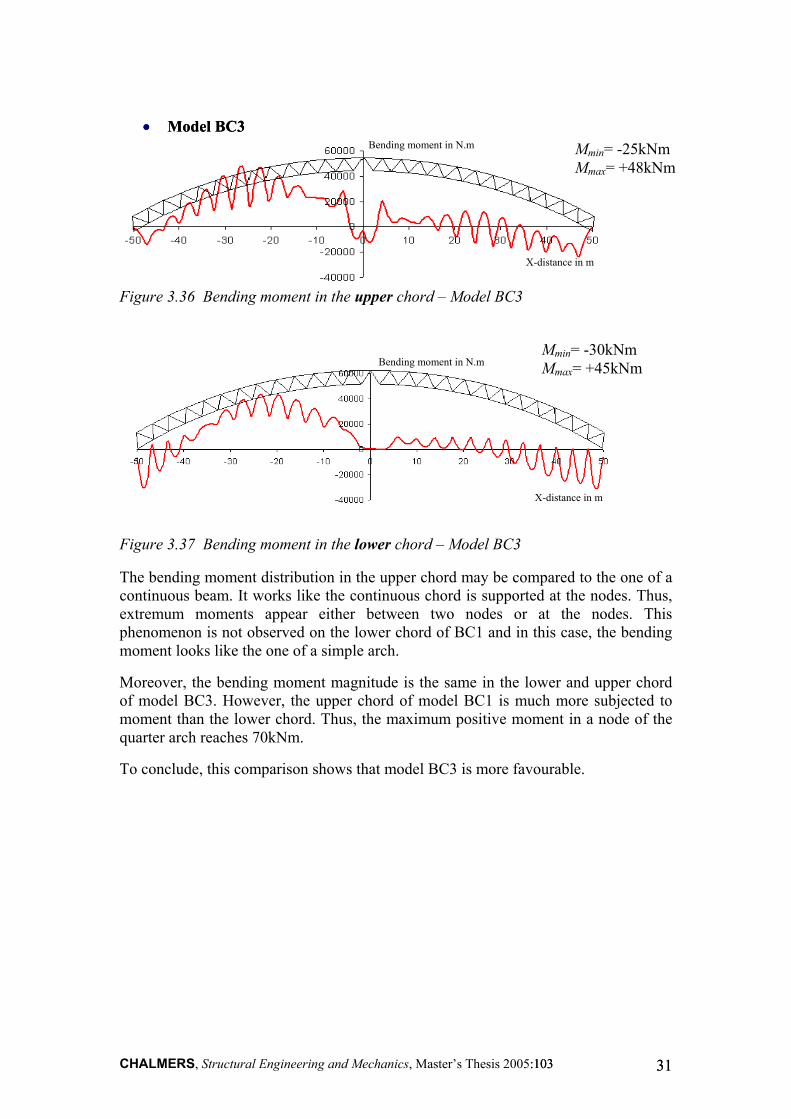
• Model BC3 Model BC3
Bending moment in N.m Mmin= -25kNm Mmax= +48kNm
Figure 3.36 Bending moment in the upper chord – Model BC3
Bending moment in N.m
X-distance in m
X-distance in m
Mmin= -30kNm Mmax= +45kNm
Figure 3.37 Bending moment in the lower chord – Model BC3
The bending moment distribution in the upper chord may be compared to the one of a continuous beam. It works like the continuous chord is supported at the nodes. Thus, extremum moments appear either between two nodes or at the nodes. This phenomenon is not observed on the lower chord of BC1 and in this case, the bending moment looks like the one of a simple arch.
Moreover, the bending moment magnitude is the same in the lower and upper chord of model BC3. However, the upper chord of model BC1 is much more subjected to moment than the lower chord. Thus, the maximum positive moment in a node of the quarter arch reaches 70kNm.
To conclude, this comparison shows that model BC3 is more favourable.
CHALMERS, Structural Engineering and Mechanics, Master’s Thesis
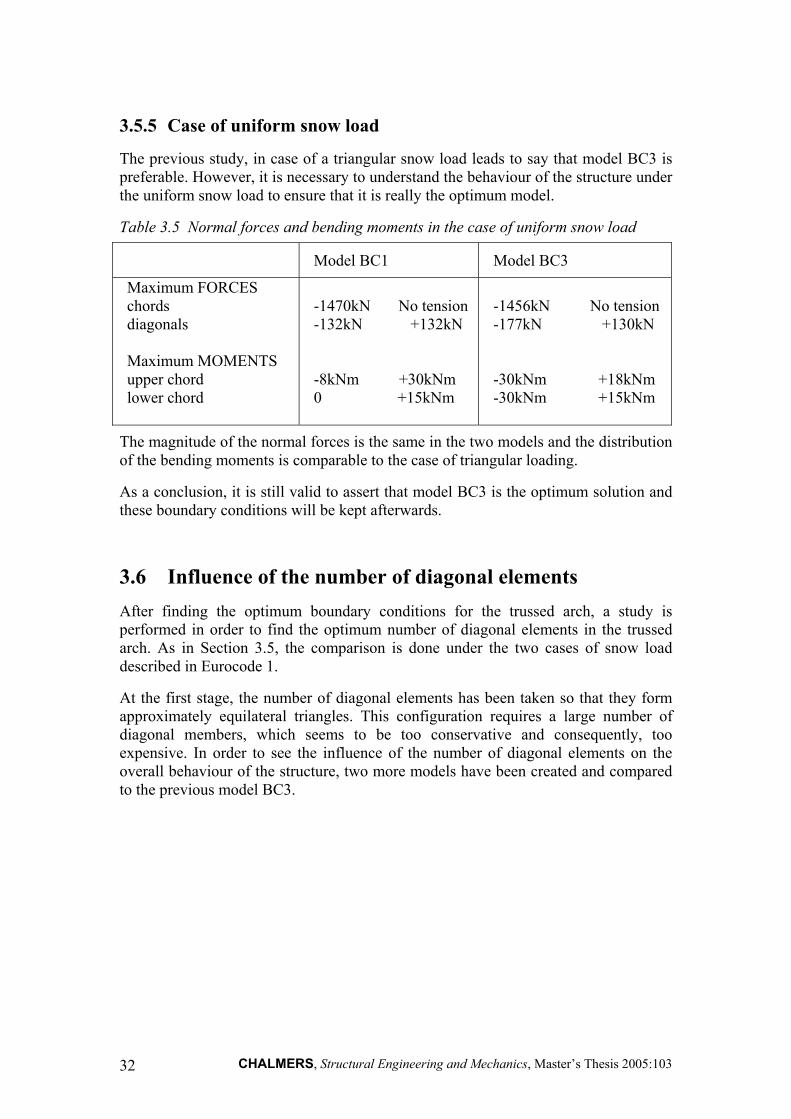
3.5.5 Case of uniform snow load
The previous study, in case of a triangular snow load leads to say that model BC3 is preferable. However, it is necessary to understand the behaviour of the structure under the uniform snow load to ensure that it is really the optimum model.
Table 3.5 Normal forces and bending moments in the case of uniform snow load
Model BC1 Model BC3
Maximum FORCES chords diagonals Maximum MOMENTS upper chord lower chord
-1470kN No tension -132kN +132kN -8kNm +30kNm 0 +15kNm
-1456kN No tension -177kN +130kN -30kNm +18kNm -30kNm +15kNm
The magnitude of the normal forces is the same in the two models and the distribution of the bending moments is comparable to the case of triangular loading.
As a conclusion, it is still valid to assert that model BC3 is the optimum solution and these boundary conditions will be kept afterwards.
3.6 Influence of the number of diagonal elements After finding the optimum boundary conditions for the trussed arch, a study is performed in order to find the optimum number of diagonal elements in the trussed arch. As in Section 3.5, the comparison is done under the two cases of snow load described in Eurocode 1.
At the first stage, the number of diagonal elements has been taken so that they form approximately equilateral triangles. This configuration requires a large number of diagonal members, which seems to be too conservative and consequently, too expensive. In order to see the influence of the number of diagonal elements on the overall behaviour of the structure, two more models have been created and compared to the previous model BC3.
CHALMERS, Structural Engineering and Mechanics, Master’s Thesis 2005:103 32

2005:103 005:103 3333
Figure 3.38 Geometry of the truss Figure 3.38 Geometry of the truss
H α
i
Table 3.6 Three models used to study the influence of the number of diagonal elements.
Table 3.6 Three models used to study the influence of the number of diagonal elements.
Model BC3 Model BC3 α~60° α~60°
27 diagonals/half-arch 27 diagonals/half-arch
i ~ 4m i ~ 4m
Model I1 α~45°
15 diagonals/half-arch
i ~ 7m
Model I2 α~40°
13 diagonals/half-arch
i ~ 8m
Only the results of the calculations about models I1 and I2 will be shown. The results of model BC3 can be found in the previous section 3.5.
CHALMERS, Structural Engineering and Mechanics, Master’s Thesis
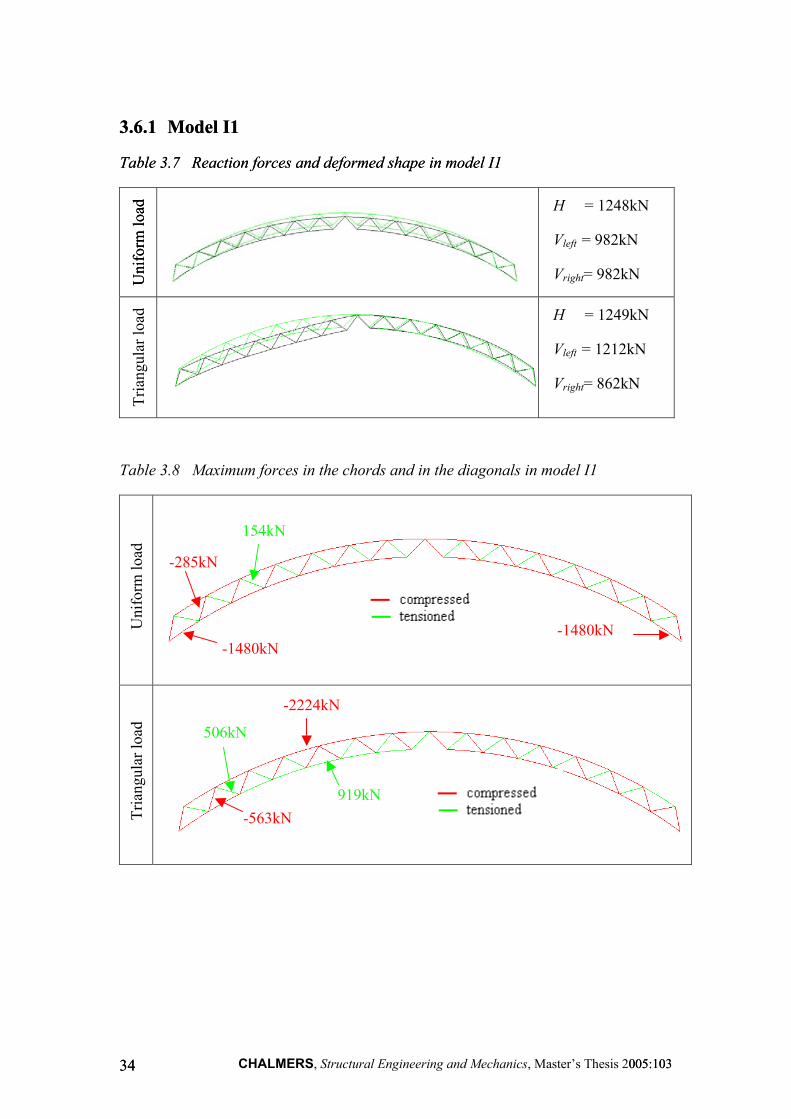
3.6.1 Model I1 3.6.1 Model I1
Table 3.7 Reaction forces and deformed shape in model I1 Table 3.7 Reaction forces and deformed shape in model I1 U
nifo
rm lo
ad
Uni
form
load
H = 1248kN
Vleft = 982kN
Vright= 982kN
Tria
ngul
ar lo
ad
H = 1249kN
Vleft = 1212kN
Vright= 862kN
Table 3.8 Maximum forces in the chords and in the diagonals in model I1
Uni
form
load
Tria
ngul
ar lo
ad
154kN
is 2005:103 005:103 3434
-1480kN
-285kN
-1480kN
-2224kN
506kN
919kN -563kN
CHALMERS, Structural Engineering and Mechanics, Master’s Thes
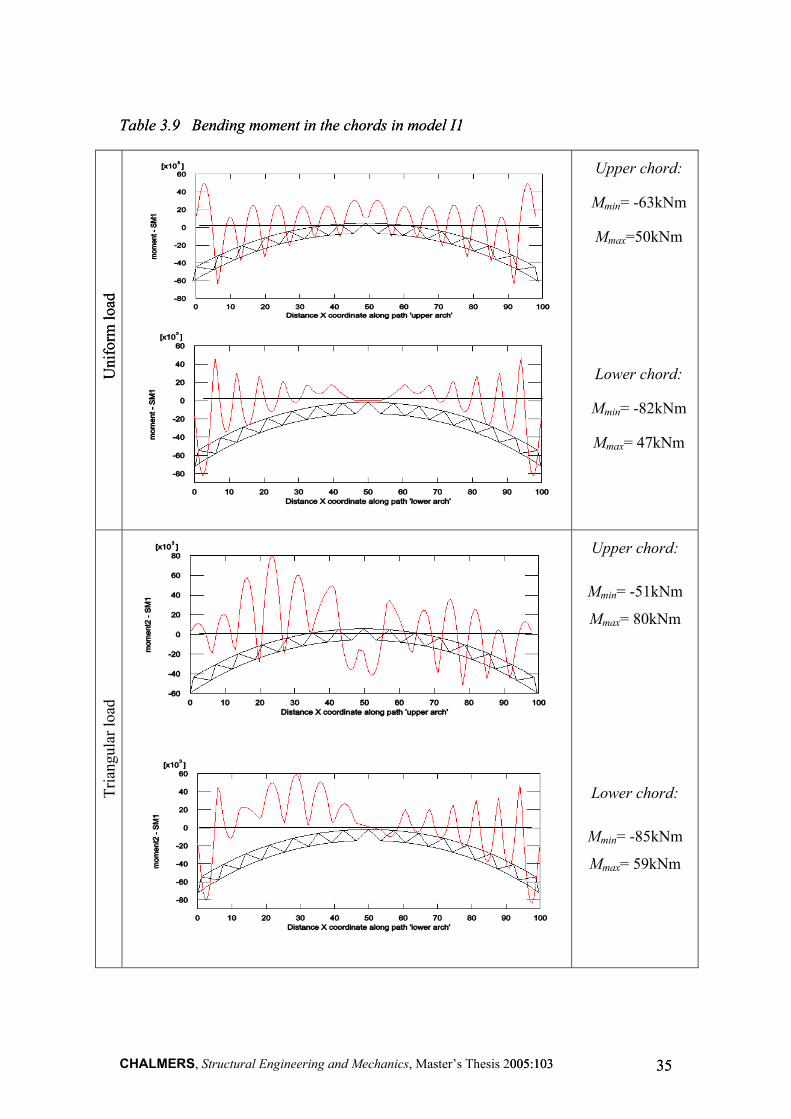
Table 3.9 Bending moment in the chords in model I1 Table 3.9 Bending moment in the chords in model I1 U
nifo
rm lo
ad
Uni
form
load
Upper chord:
Mmin= -63kNm
Mmax=50kNm
Lower chord:
Mmin= -82kNm
Mmax= 47kNm
Tria
ngul
ar lo
ad
Upper chord:
Mmin= -51kNm
Mmax= 80kNm
Lower chord:
Mmin= -85kNm
Mmax= 59kNm
CHALMERS, Structural Engineering and Mechanics, Master’s Thesis 2005:103 005:103 3535
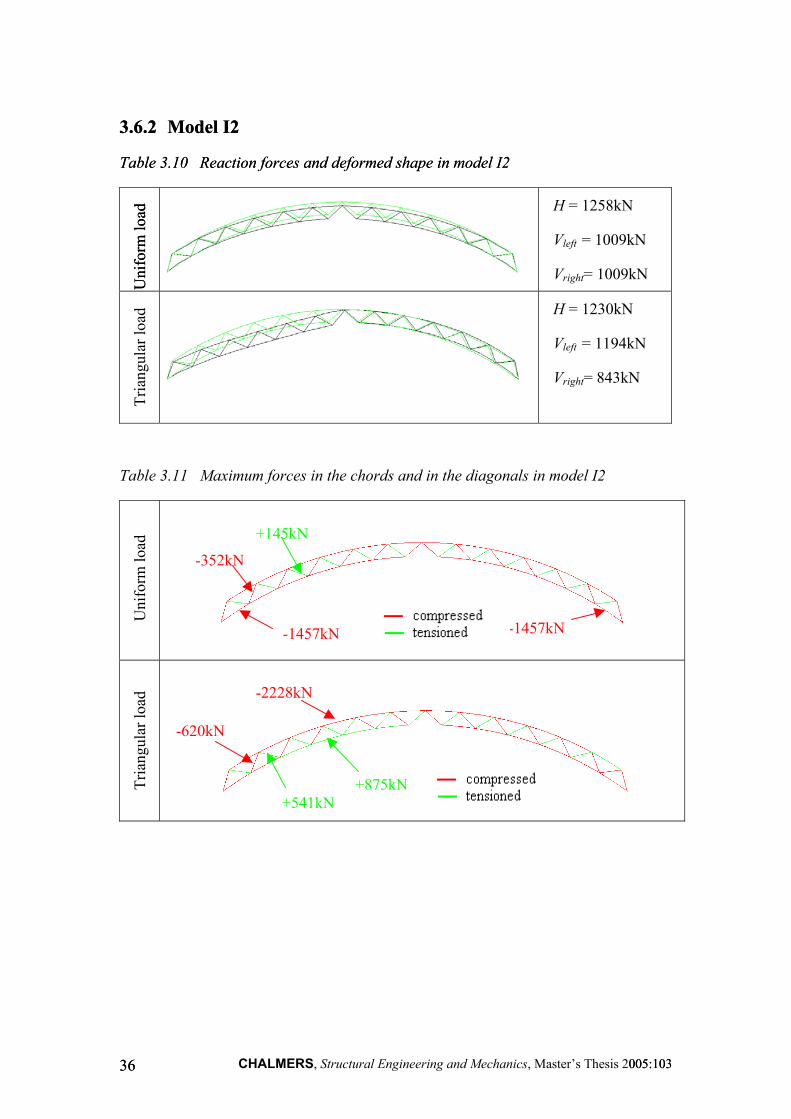
3.6.2 Model I2 3.6.2 Model I2
Table 3.10 Reaction forces and deformed shape in model I2 Table 3.10 Reaction forces and deformed shape in model I2 U
nifo
rm lo
ad
Uni
form
load
H
Vle
Vr
Tria
ngul
ar lo
ad
H
Vle
Vr
Table 3.11 Maximum forces in the chords and in the diagonals in mo
Uni
form
load
Tr
iang
ular
load
+145kN
-352kN
-1457kN -1457kN
-2228kN
-620kN
+541kN +875kN
CHALMERS, Structural Engineering and Mechanics, Maste3636
= 1258kN
ft = 1009kN
ight= 1009kN
= 1230kN
ft = 1194kN
ight= 843kN
del I2
r’s Thesis 2005:103 005:103
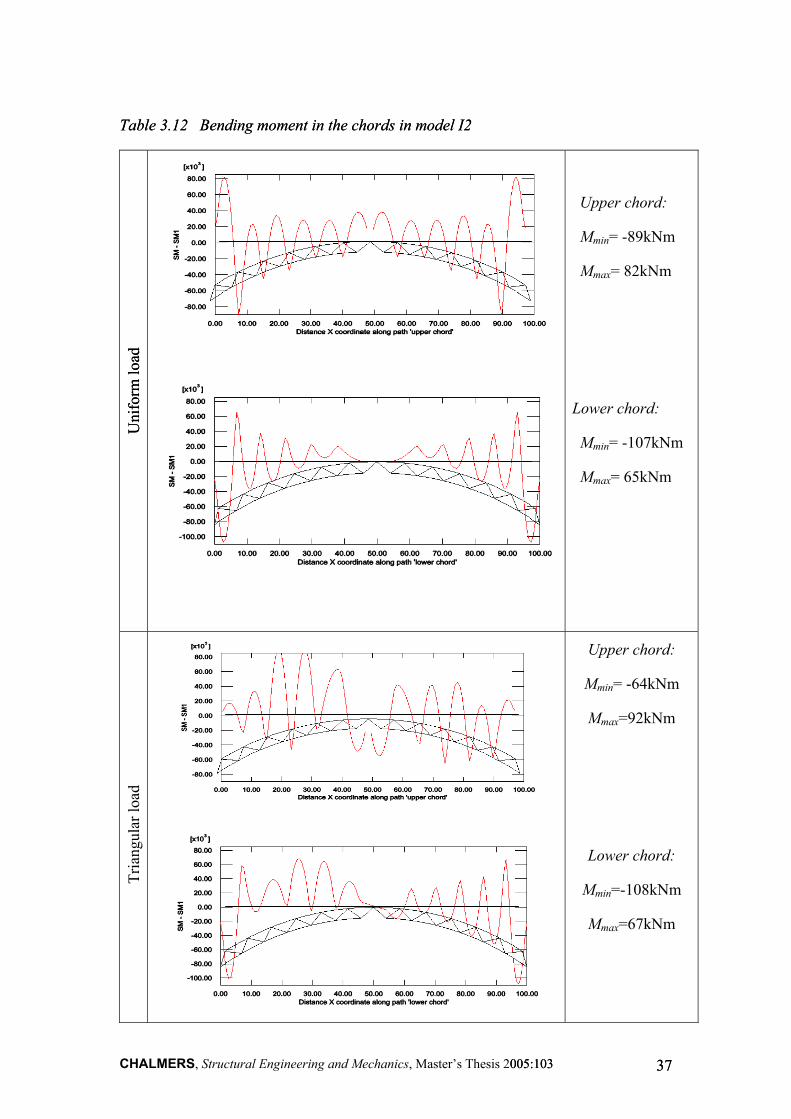
Table 3.12 Bending moment in the chords in model I2 Table 3.12 Bending moment in the chords in model I2 U
nifo
rm lo
ad
Uni
form
load
Upper chord:
Mmin= -89kNm
Mmax= 82kNm
Lower chord:
Mmin= -107kNm
Mmax= 65kNm
Tria
ngul
ar lo
ad
Upper chord:
Mmin= -64kNm
Mmax=92kNm
Lower chord:
Mmin=-108kNm
Mmax=67kNm
CHALMERS, Structural Engineering and Mechanics, Master’s Thesis 2005:103 005:103 3737
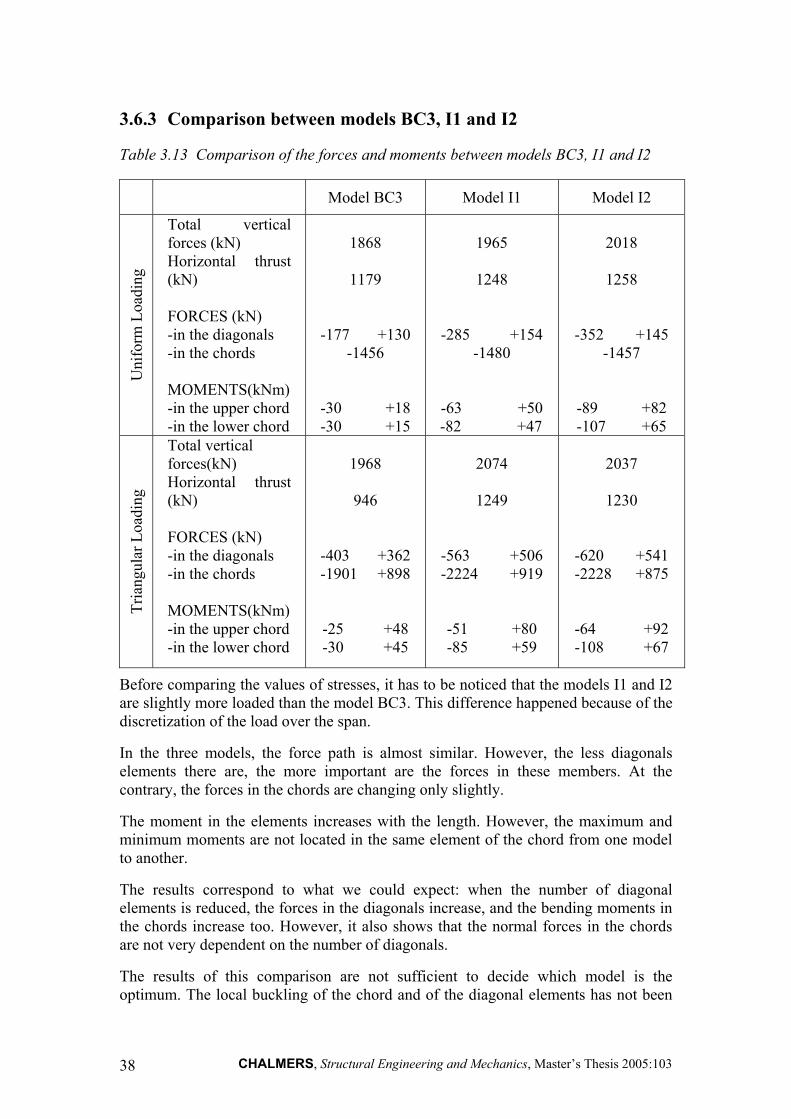
3.6.3 Comparison between models BC3, I1 and I2
Table 3.13 Comparison of the forces and moments between models BC3, I1 and I2
Model BC3 Model I1 Model I2
Uni
form
Loa
ding
Total vertical forces (kN) Horizontal thrust (kN) FORCES (kN) -in the diagonals -in the chords MOMENTS(kNm) -in the upper chord -in the lower chord
1868
1179
-177 +130 -1456
-30 +18 -30 +15
1965
1248
-285 +154 -1480
-63 +50 -82 +47
2018
1258
-352 +145 -1457
-89 +82 -107 +65
Tria
ngul
ar L
oadi
ng
Total vertical forces(kN) Horizontal thrust (kN) FORCES (kN) -in the diagonals -in the chords MOMENTS(kNm) -in the upper chord -in the lower chord
1968
946
-403 +362 -1901 +898
-25 +48 -30 +45
2074
1249
-563 +506 -2224 +919
-51 +80 -85 +59
2037
1230
-620 +541 -2228 +875
-64 +92 -108 +67
Before comparing the values of stresses, it has to be noticed that the models I1 and I2 are slightly more loaded than the model BC3. This difference happened because of the discretization of the load over the span.
In the three models, the force path is almost similar. However, the less diagonals elements there are, the more important are the forces in these members. At the contrary, the forces in the chords are changing only slightly.
The moment in the elements increases with the length. However, the maximum and minimum moments are not located in the same element of the chord from one model to another.
The results correspond to what we could expect: when the number of diagonal elements is reduced, the forces in the diagonals increase, and the bending moments in the chords increase too. However, it also shows that the normal forces in the chords are not very dependent on the number of diagonals.
The results of this comparison are not sufficient to decide which model is the optimum. The local buckling of the chord and of the diagonal elements has not been
CHALMERS, Structural Engineering and Mechanics, Master’s Thesis 2005:103 38
taken into account so far. It will be important to know if models I1 and I2 present a risk of buckling in order to make the final choice. taken into account so far. It will be important to know if models I1 and I2 present a risk of buckling in order to make the final choice.
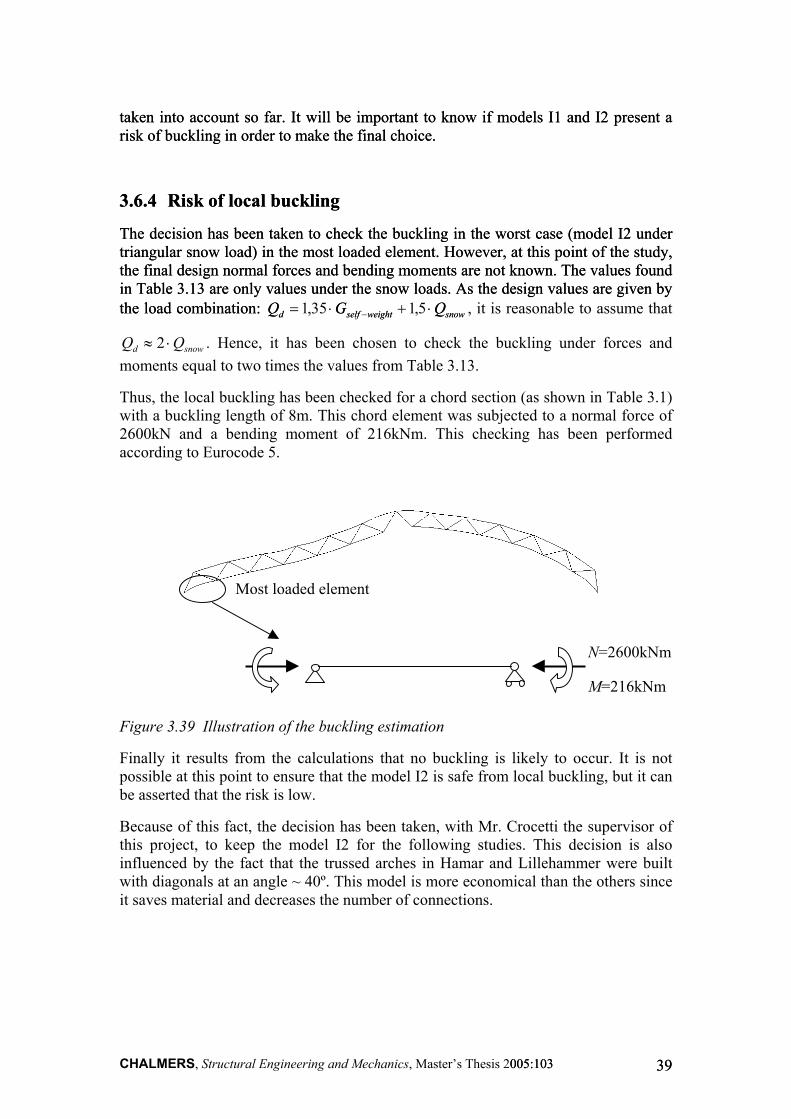
3.6.4 Risk of local buckling 3.6.4 Risk of local buckling
The decision has been taken to check the buckling in the worst case (model I2 under triangular snow load) in the most loaded element. However, at this point of the study, the final design normal forces and bending moments are not known. The values found in Table 3.13 are only values under the snow loads. As the design values are given by the load combination:
The decision has been taken to check the buckling in the worst case (model I2 under triangular snow load) in the most loaded element. However, at this point of the study, the final design normal forces and bending moments are not known. The values found in Table 3.13 are only values under the snow loads. As the design values are given by the load combination: snowweightselfd QGQ snowweightselfd QGQ ⋅+⋅= − 5,135,1 , it is reasonable to assume that
. Hence, it has been chosen to check the buckling under forces and moments equal to two times the values from Table 3.13.
snowd QQ ⋅≈ 2
Thus, the local buckling has been checked for a chord section (as shown in Table 3.1) with a buckling length of 8m. This chord element was subjected to a normal force of 2600kN and a bending moment of 216kNm. This checking has been performed according to Eurocode 5.
Most loaded element
N=2600kNm
M=216kNm
Figure 3.39 Illustration of the buckling estimation
Finally it results from the calculations that no buckling is likely to occur. It is not possible at this point to ensure that the model I2 is safe from local buckling, but it can be asserted that the risk is low.
Because of this fact, the decision has been taken, with Mr. Crocetti the supervisor of this project, to keep the model I2 for the following studies. This decision is also influenced by the fact that the trussed arches in Hamar and Lillehammer were built with diagonals at an angle ~ 40º. This model is more economical than the others since it saves material and decreases the number of connections.
CHALMERS, Structural Engineering and Mechanics, Master’s Thesis 2005:103 005:103 3939
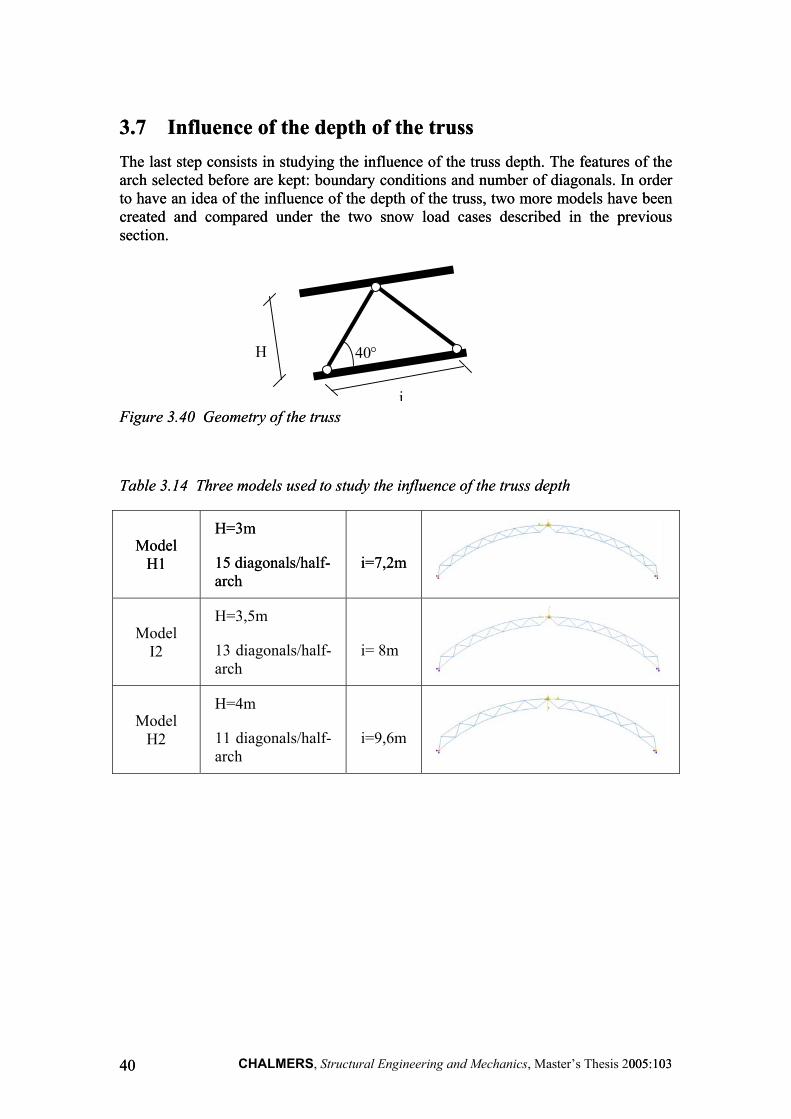
3.7 Influence of the depth of the truss 3.7 Influence of the depth of the truss The last step consists in studying the influence of the truss depth. The features of the arch selected before are kept: boundary conditions and number of diagonals. In order to have an idea of the influence of the depth of the truss, two more models have been created and compared under the two snow load cases described in the previous section.
The last step consists in studying the influence of the truss depth. The features of the arch selected before are kept: boundary conditions and number of diagonals. In order to have an idea of the influence of the depth of the truss, two more models have been created and compared under the two snow load cases described in the previous section.
is 2005:103 005:103 4040
Figure 3.40 Geometry of the truss Figure 3.40 Geometry of the truss
H 40°
i
Table 3.14 Three models used to study the influence of the truss depth Table 3.14 Three models used to study the influence of the truss depth
Model H1
Model H1
H=3m H=3m
15 diagonals/half-arch 15 diagonals/half-arch
i=7,2m i=7,2m
Model I2
H=3,5m
13 diagonals/half-arch
i= 8m
Model H2
H=4m
11 diagonals/half-arch
i=9,6m
CHALMERS, Structural Engineering and Mechanics, Master’s Thes
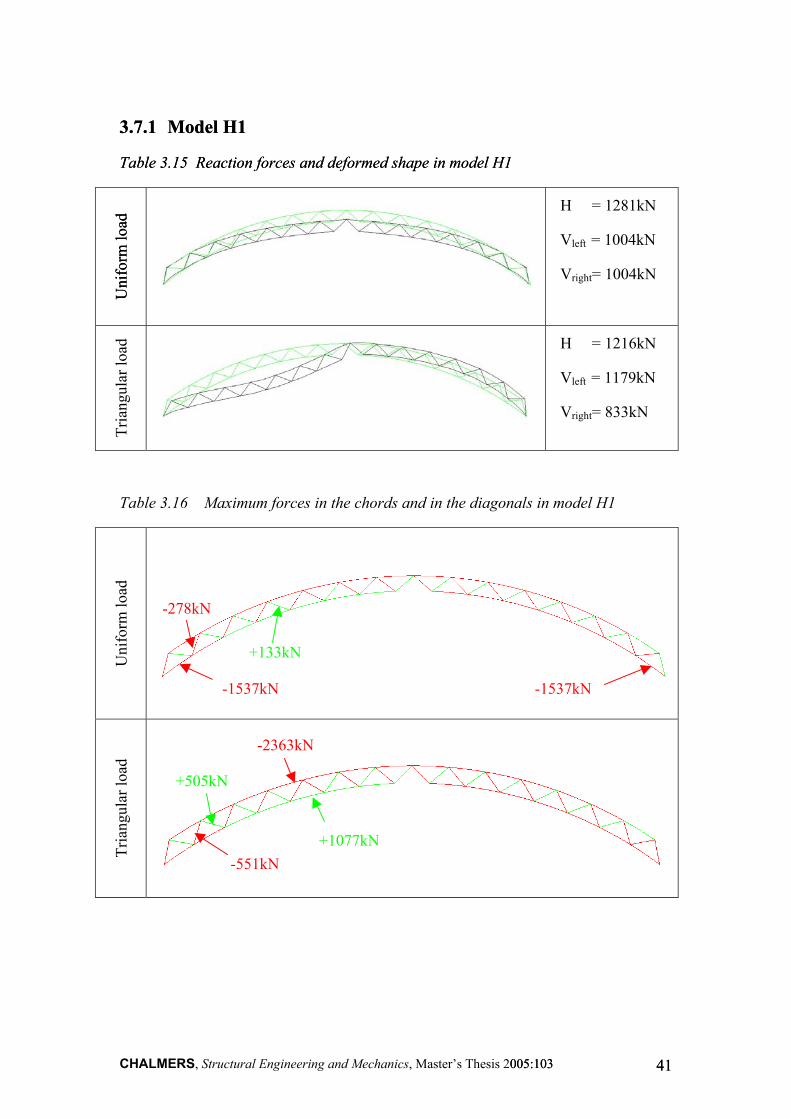
3.7.1 Model H1 3.7.1 Model H1
Table 3.15 Reaction forces and deformed shape in model H1 Table 3.15 Reaction forces and deformed shape in model H1
Uni
form
load
U
nifo
rm lo
ad
H = 1281kN
Vleft = 1004kN
Vright= 1004kN
Tria
ngul
ar lo
ad
H = 1216kN
Vleft = 1179kN
Vright= 833kN
Table 3.16 Maximum forces in the chords and in the diagonals in model H1
Uni
form
load
Tria
ngul
ar lo
ad
-1537kN -1537kN
+133kN
-278kN
-2363kN
+505kN
+1077kN -551kN
CHALMERS, Structural Engineering and Mechanics, Master’s Thesis 2005:103 005:103 4141

Table 3.17 Bending moment in the chords in model H1 Table 3.17 Bending moment in the chords in model H1 U
nifo
rm lo
ad
Uni
form
load
Upper chord:
Mmin=-71kNm
Mmax=52kNm
Lower chord:
Mmin=-86kNm
Mmax=45kNm
Tria
ngul
ar lo
ad
Upper chord:
Mmin=-54kNm
Mmax=80kNm
Lower chord:
Mmin=-84kNm
Mmax=70kNm
Ben
ding
mom
ent i
n N
.m
Ben
ding
mom
ent i
n N
.m
Ben
ding
mom
nt in
N.m
B
endi
ng m
omen
t in
N.m
e
CHALMERS, Structural Engineering and Mechanics, Master’s Thesis 2005:103 005:103 4242
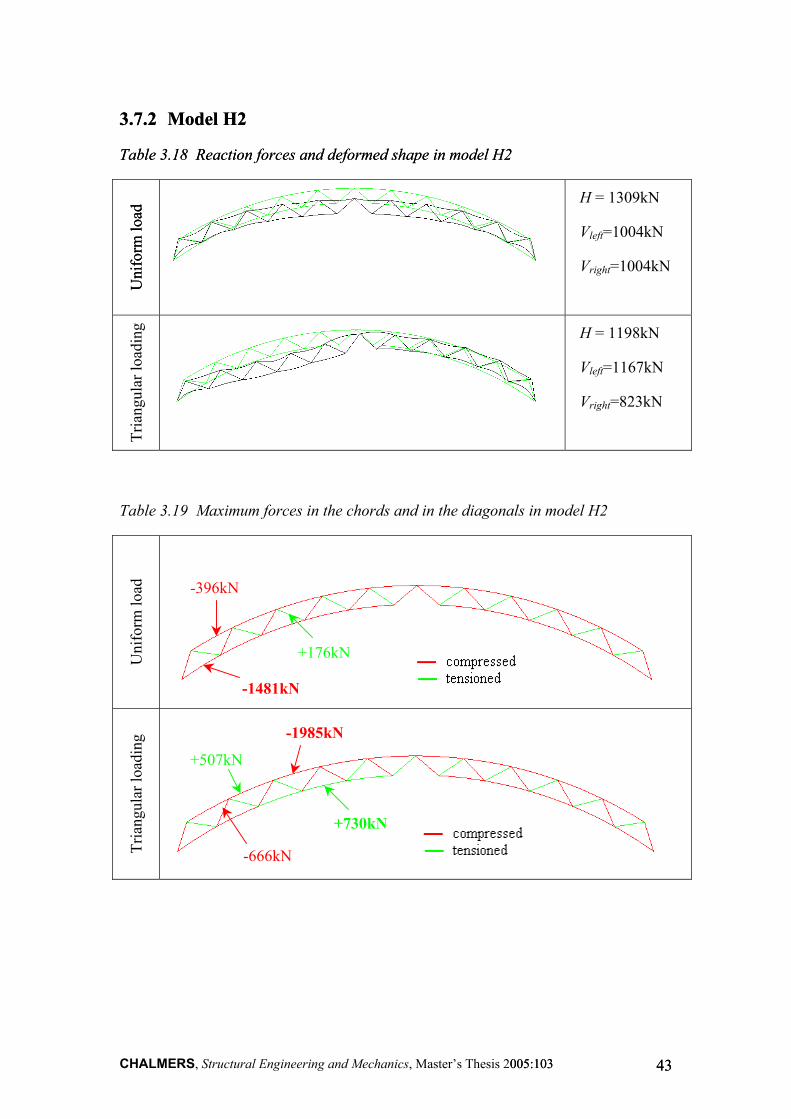
3.7.2 Model H2 3.7.2 Model H2
Table 3.18 Reaction forces and deformed shape in model H2 Table 3.18 Reaction forces and deformed shape in model H2 U
nifo
rm lo
ad
Uni
form
load
Tria
ngul
ar lo
adin
g
Table 3.19 Maximum forces in the chords and in the diagonals in mod
Uni
form
load
Tria
ngul
ar lo
adin
g
-396kN
+176kN
-1481kN
-1985kN
+507kN
+730kN
-666kN
CHALMERS, Structural Engineering and Mechanics, Master’s Thesis 2005:103 005:103
H = 1309kN
Vleft=1004kN
Vright=1004kN
H = 1198kN
Vleft=1167kN
Vright=823kN
el H2
4343
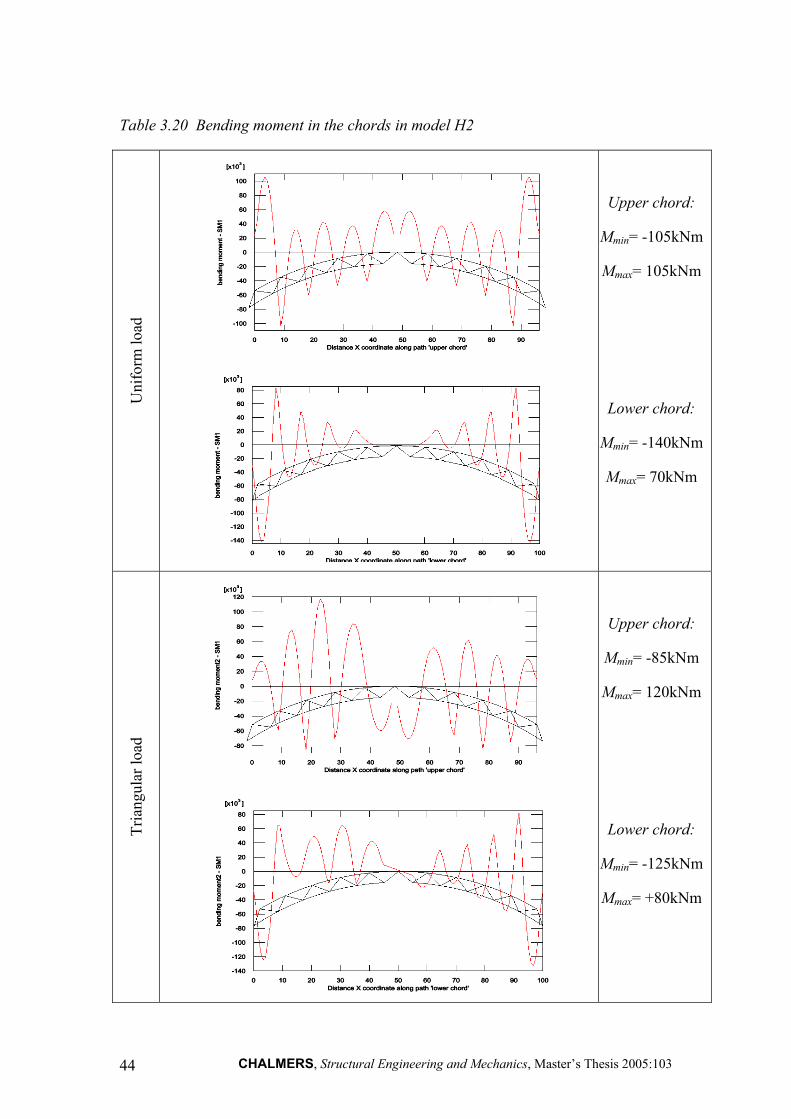
Table 3.20 Bending moment in the chords in model H2 U
nifo
rm lo
ad
Upper chord:
Mmin= -105kNm
Mmax= 105kNm
Lower chord:
Mmin= -140kNm
Mmax= 70kNm
Tria
ngul
ar lo
ad
Upper chord:
Mmin= -85kNm
Mmax= 120kNm
Lower chord:
Mmin= -125kNm
Mmax= +80kNm
CHALMERS, Structural Engineering and Mechanics, Master’s Thesis 2005:103 44

3.7.3 Comparison of models H1, I2 and H2
Table 3.21 Comparison of the models H1, I2 and H2
Model H1 – H=3m Model I2– H=3,5m Model H2– H=4m
Uni
form
Loa
ding
Total vertical forces (kN) Horizontal thrust (kN) FORCES (kN) -in the diagonals -in the chords MOMENTS (kNm) -in the upper chord -in the lower chord
2008
1281
-278 +133
-1537 -71 +52 -86 +45
2018
1258
-352 +145 -1457
-89 +82 -107 +65
2008
1309
-396 +176 -1481
-105 +105 -140 +70
Tria
ngul
ar L
oadi
ng
Total vertical forces (kN) Horizontal thrust (kN) FORCES (kN) -in the diagonals -in the chords MOMENTS (kNm) -in the upper chord -in the lower chord
2012
1216 -551 +505
-2363 +1077
-54 +80 -84 +70
2037
1230
-620 +541 -2228 +875
-64 +92 -108 +67
1990
1198
-666 +507 -1985 +730
-85 +120 -125 +80
Before comparing the models, it has to be noticed that the model I2 is slightly more loaded than model H1 and model H2.
As it was expected, the normal forces in the chords are reduced when the depth of the truss increases, but the difference is not so high. At the contrary, the bending moments in the chords increase since the length of the members is more important. As a result, the chord is subjected to smaller forces but larger moment. The reduction of the normal force is not so important and this fact leads to say that it is not relevant to have a very large depth like model H2. The problem of buckling is still kept in mind to make this choice. When the members are longer, this risk increases. The transportation requirements have to be considered as well.
Finally, I2 is chosen as the optimum system and kept for the rest of the thesis. This choice has been taken together with the experienced supervisor of this project.
As a conclusion of paragraph 3, Figure 3.41 summarizes the process followed to choose the best trussed arch system.
CHALMERS, Structural Engineering and Mechanics, Master’s Thesis 2005:103 45
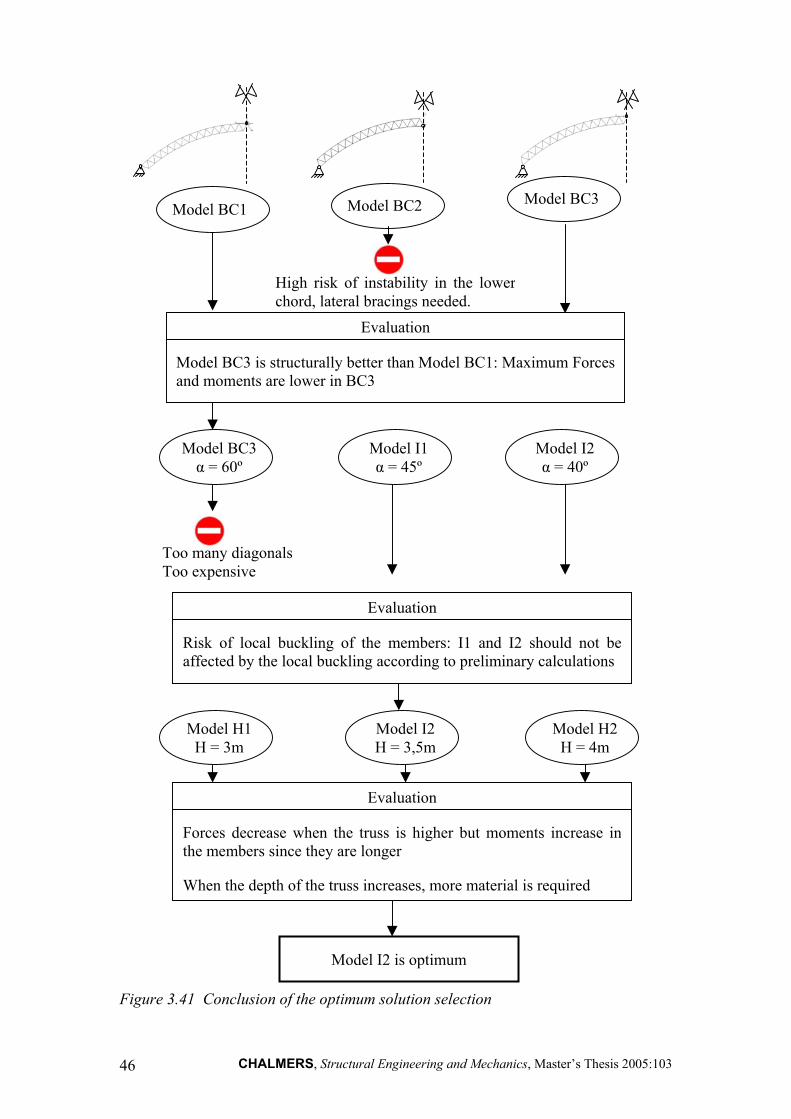
Model BC3 Model BC2 Model BC1
High risk of instability in the lowerchord, lateral bracings needed.
Evaluation Model BC3 is structurally better than Model BC1: Maximum Forcesand moments are lower in BC3
Model BC3 α = 60º
Model I1 α = 45º
Model I2 α = 40º
Too many diagonals Too expensive
Evaluation
Risk of local buckling of the members: I1 and I2 should not beaffected by the local buckling according to preliminary calculations
Model H1
H = 3m Model I2 H = 3,5m
Model H2 H = 4m
Evaluation
Forces decrease when the truss is higher but moments increase inthe members since they are longer
When the depth of the truss increases, more material is required
Model I2 is optimum
Figure 3.41 Conclusion of the optimum solution selection
CHALMERS, Structural Engineering and Mechanics, Master’s Thesis 2005:103 46
4 PRELIMINARY STRUCTURAL ANALYSIS In this chapter, a preliminary analysis of the model selected in chapter 3 is performed. Several load combinations will be studied and the resulting design forces will be worked out. These forces will be used in the next chapter 5 to design the connections between the chords and the diagonals.
4.1 Design load In order to design the structure, a survey of the actions that may be applied to the construction has to be done. The trussed arch will be subjected to two types of load: the permanent actions and the variable actions, which are calculated according to Eurocode 1.
4.1.1 Permanent loads
The permanent actions are due to the self-weight of the structural members and the roofing. According to Eurocode 1, the density of the Glulam GL32C is taken equal to 400kg/m3. The load due to the roofing is set to 0,8kN/m2.
4.1.2 Variable loads
4.1.2.1 Snow load
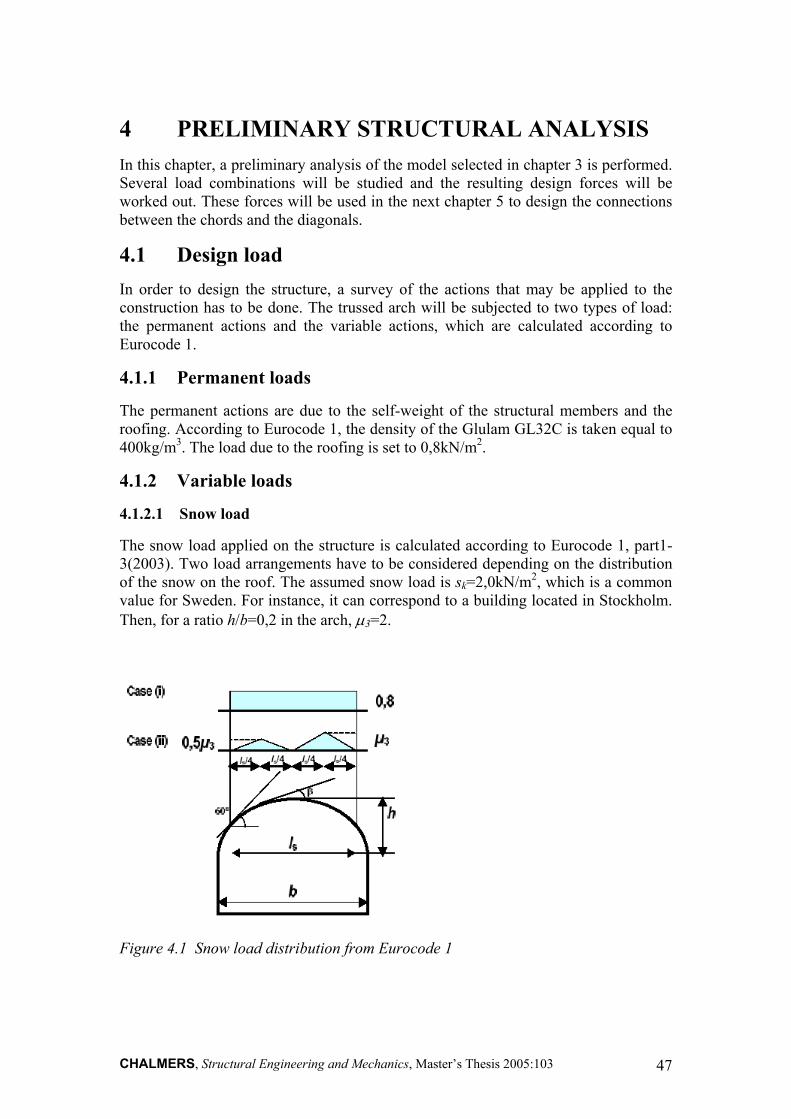
The snow load applied on the structure is calculated according to Eurocode 1, part1-3(2003). Two load arrangements have to be considered depending on the distribution of the snow on the roof. The assumed snow load is sk=2,0kN/m2, which is a common value for Sweden. For instance, it can correspond to a building located in Stockholm. Then, for a ratio h/b=0,2 in the arch, µ3=2.
Figure 4.1 Snow load distribution from Eurocode 1
CHALMERS, Structural Engineering and Mechanics, Master’s Thesis 2005:103 47
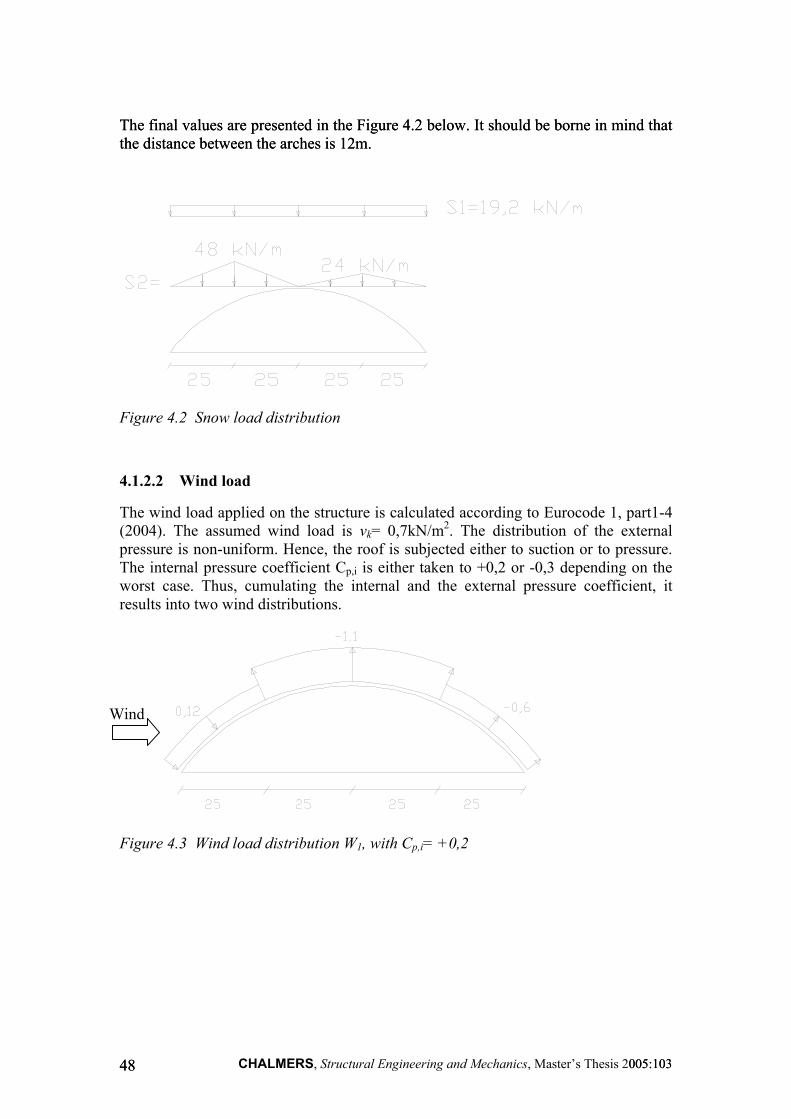
The final values are presented in the Figure 4.2 below. It should be borne in mind that the distance between the arches is 12m. The final values are presented in the Figure 4.2 below. It should be borne in mind that the distance between the arches is 12m.
Figure 4.2 Snow load distribution
4.1.2.2 Wind load
The wind load applied on the structure is calculated according to Eurocode 1, part1-4 (2004). The assumed wind load is vk= 0,7kN/m2. The distribution of the external pressure is non-uniform. Hence, the roof is subjected either to suction or to pressure. The internal pressure coefficient Cp,i is either taken to +0,2 or -0,3 depending on the worst case. Thus, cumulating the internal and the external pressure coefficient, it results into two wind distributions.
Wind
Figure 4.3 Wind load distribution W1, with Cp,i= +0,2
CHALMERS, Structural Engineering and Mechanics, Master’s Thesis 2005:103 005:103 4848
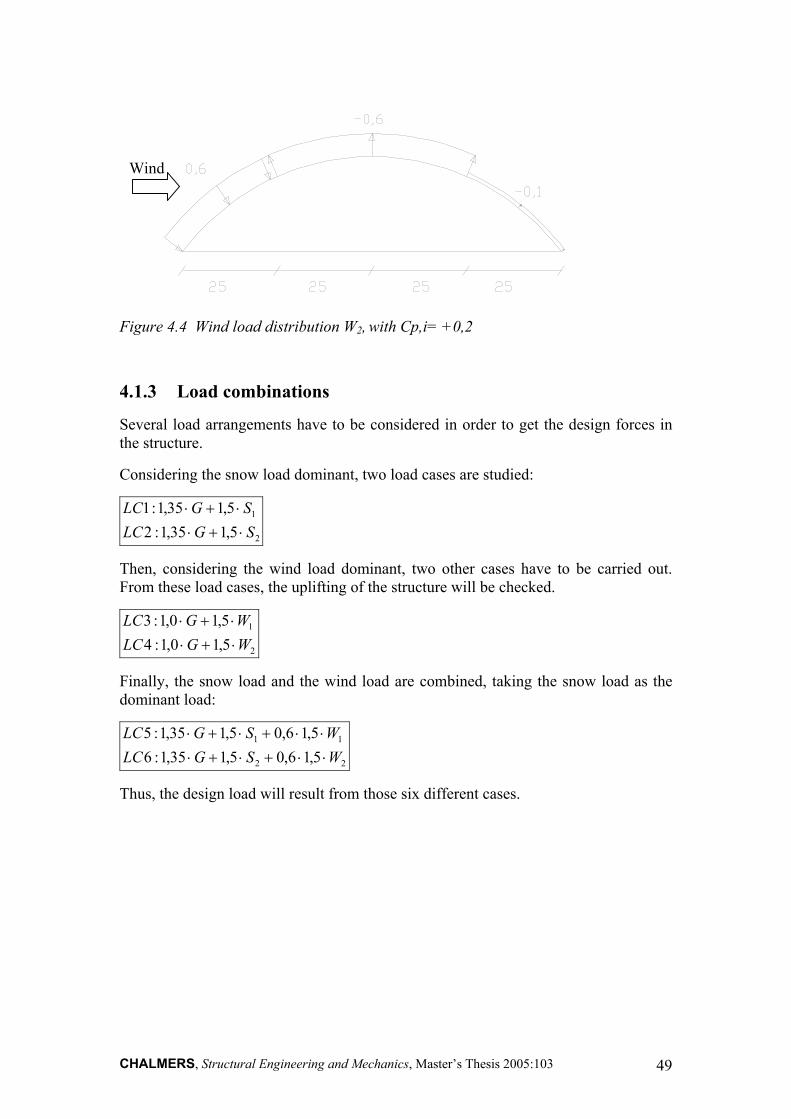
Wind
Figure 4.4 Wind load distribution W2, with Cp,i= +0,2
4.1.3 Load combinations
Several load arrangements have to be considered in order to get the design forces in the structure.
Considering the snow load dominant, two load cases are studied:
2
1
5,135,1:25,135,1:1
SGLCSGLC⋅+⋅⋅+⋅
Then, considering the wind load dominant, two other cases have to be carried out. From these load cases, the uplifting of the structure will be checked.
2
1
5,10,1:45,10,1:3
WGLCWGLC⋅+⋅⋅+⋅
Finally, the snow load and the wind load are combined, taking the snow load as the dominant load:
22
11
5,16,05,135,1:65,16,05,135,1:5
WSGLCWSGLC⋅⋅+⋅+⋅⋅⋅+⋅+⋅
Thus, the design load will result from those six different cases.
CHALMERS, Structural Engineering and Mechanics, Master’s Thesis 2005:103 49

4.2 Finite Element model 4.2 Finite Element model
4.2.1 Geometry 4.2.1 Geometry
The geometry of the trussed arch results from the choice made in chapter 3. The geometry of the trussed arch results from the choice made in chapter 3.
Crown
100m
20m
Abutment Abutment
Figure 4.5 Geometry of the trussed arch
26 diagonals are used and the depth of the truss is taken equal to 3,5m. The arches are spaced by 12m.
4.2.2 Glulam properties
The Glulam is assumed to be a homogeneous, isotropic, elastic material. Although the assumption is not realistic, this choice has been done in order to simplify the analysis. Thus, the characteristics for GL32C set in ABAQUS are:
ρ= 400kg/m3
E0,mean=13,5GPa
ν=0,2
4.2.3 Loads
The structure is studied under six different load cases. Each case is carried out in a file. The self-weight of the structure is modelled in ABAQUS by using the load type: gravity. The self-weight of the roof is applied on the top chord of the arch as a line load. The snow load and the wind load are modelled in ABAQUS by means of the line load type. The wind load is applied perpendicular to the members whereas the snow load remains vertical.
CHALMERS, Structural Engineering and Mechanics, Master’s Thesis 2005:103 005:103 5050
4.2.4 Initial imperfections of the geometry 4.2.4 Initial imperfections of the geometry
At the production stage, irregularities in the geometry of the members can appear. As the structure is slender, the internal extra forces and moments due to initial imperfections should be taken into account. The imperfect shape of the structure should be assumed to be similar to the deformed shape under a symmetric load or unsymmetrical load. Eurocode 5 proposes magnitudes for the imperfections, which should be implemented to the two-pinned arch, see Figure 4.6.
At the production stage, irregularities in the geometry of the members can appear. As the structure is slender, the internal extra forces and moments due to initial imperfections should be taken into account. The imperfect shape of the structure should be assumed to be similar to the deformed shape under a symmetric load or unsymmetrical load. Eurocode 5 proposes magnitudes for the imperfections, which should be implemented to the two-pinned arch, see Figure 4.6.
Figure 4.6 Assumed initial deviations in the geometry of a two-pinned arch corresponding to a symmetrical load and unsymmetrical. (Eurocode5)
In the studied case of the 3-pinned arch, the imperfect shape should be different from Figure 4.6. This imperfect shape is determined in the way described below.
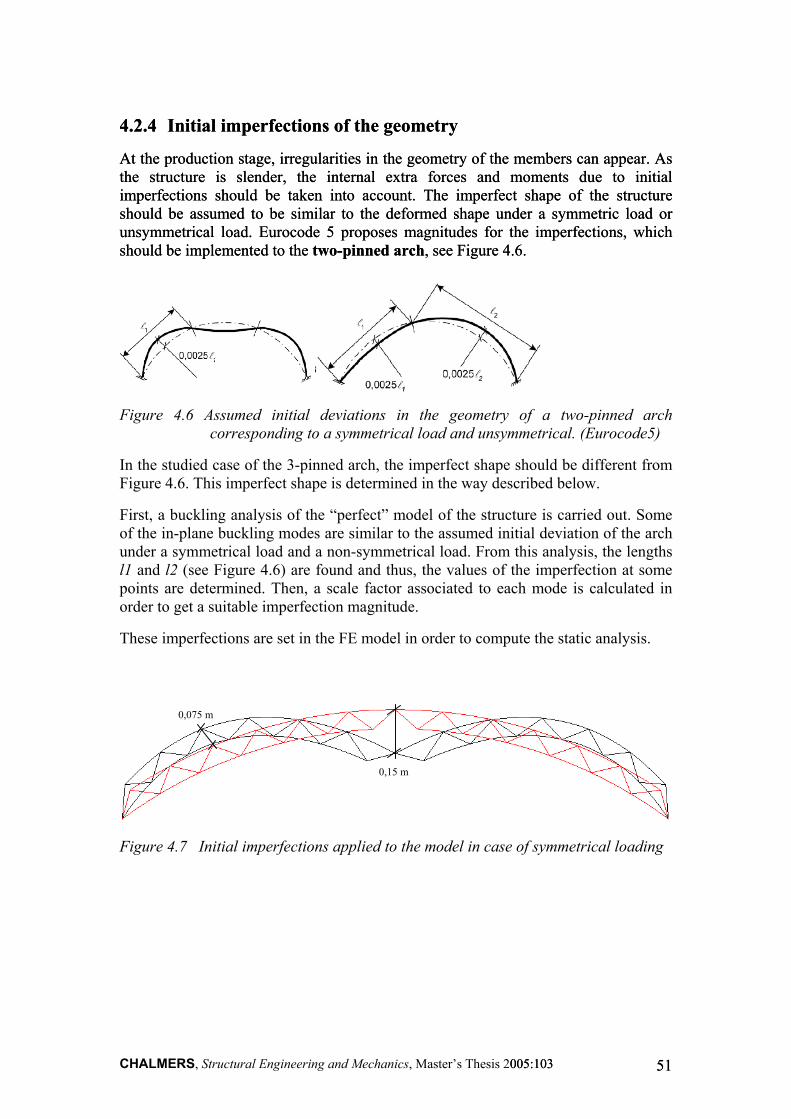
First, a buckling analysis of the “perfect” model of the structure is carried out. Some of the in-plane buckling modes are similar to the assumed initial deviation of the arch under a symmetrical load and a non-symmetrical load. From this analysis, the lengths l1 and l2 (see Figure 4.6) are found and thus, the values of the imperfection at some points are determined. Then, a scale factor associated to each mode is calculated in order to get a suitable imperfection magnitude.
These imperfections are set in the FE model in order to compute the static analysis.
0,15 m
0,075 m
Figure 4.7 Initial imperfections applied to the model in case of symmetrical loading
CHALMERS, Structural Engineering and Mechanics, Master’s Thesis 2005:103 005:103 5151
0,1 m
0,1 m
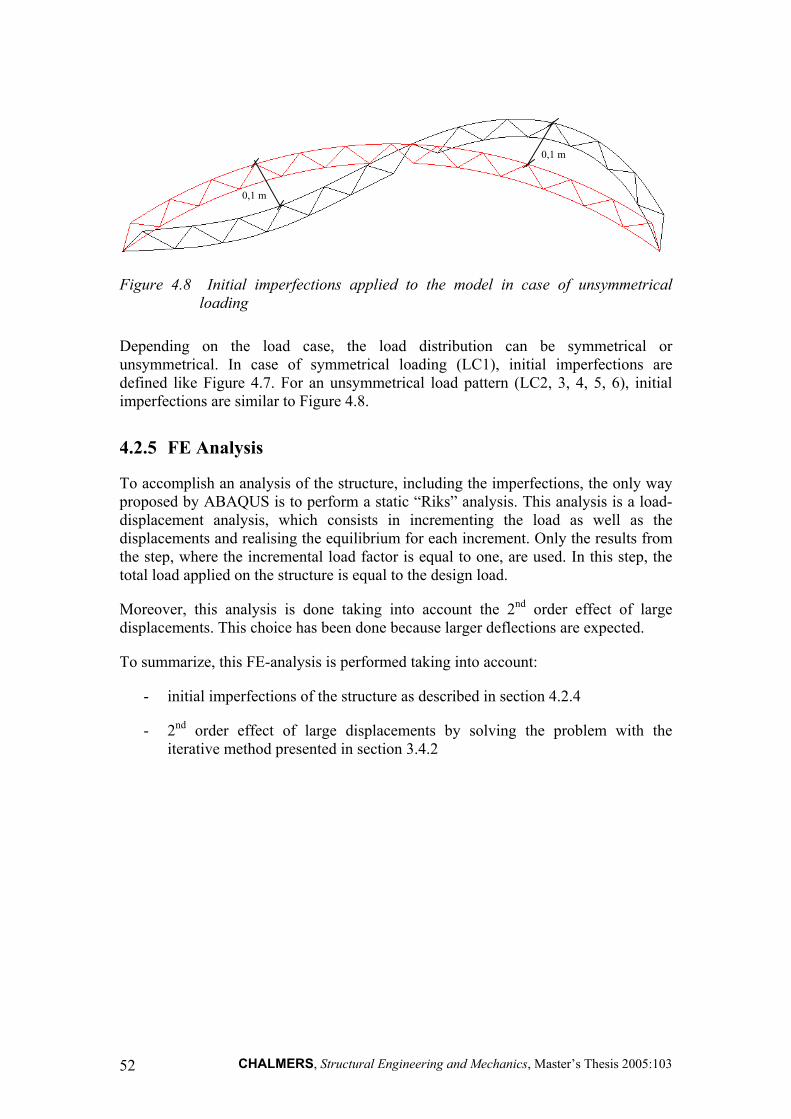
Figure 4.8 Initial imperfections applied to the model in case of unsymmetrical loading
Depending on the load case, the load distribution can be symmetrical or unsymmetrical. In case of symmetrical loading (LC1), initial imperfections are defined like Figure 4.7. For an unsymmetrical load pattern (LC2, 3, 4, 5, 6), initial imperfections are similar to Figure 4.8.
4.2.5 FE Analysis
To accomplish an analysis of the structure, including the imperfections, the only way proposed by ABAQUS is to perform a static “Riks” analysis. This analysis is a load-displacement analysis, which consists in incrementing the load as well as the displacements and realising the equilibrium for each increment. Only the results from the step, where the incremental load factor is equal to one, are used. In this step, the total load applied on the structure is equal to the design load.
Moreover, this analysis is done taking into account the 2nd order effect of large displacements. This choice has been done because larger deflections are expected.
To summarize, this FE-analysis is performed taking into account:
- initial imperfections of the structure as described in section 4.2.4
- 2nd order effect of large displacements by solving the problem with the iterative method presented in section 3.4.2
CHALMERS, Structural Engineering and Mechanics, Master’s Thesis 2005:103 52
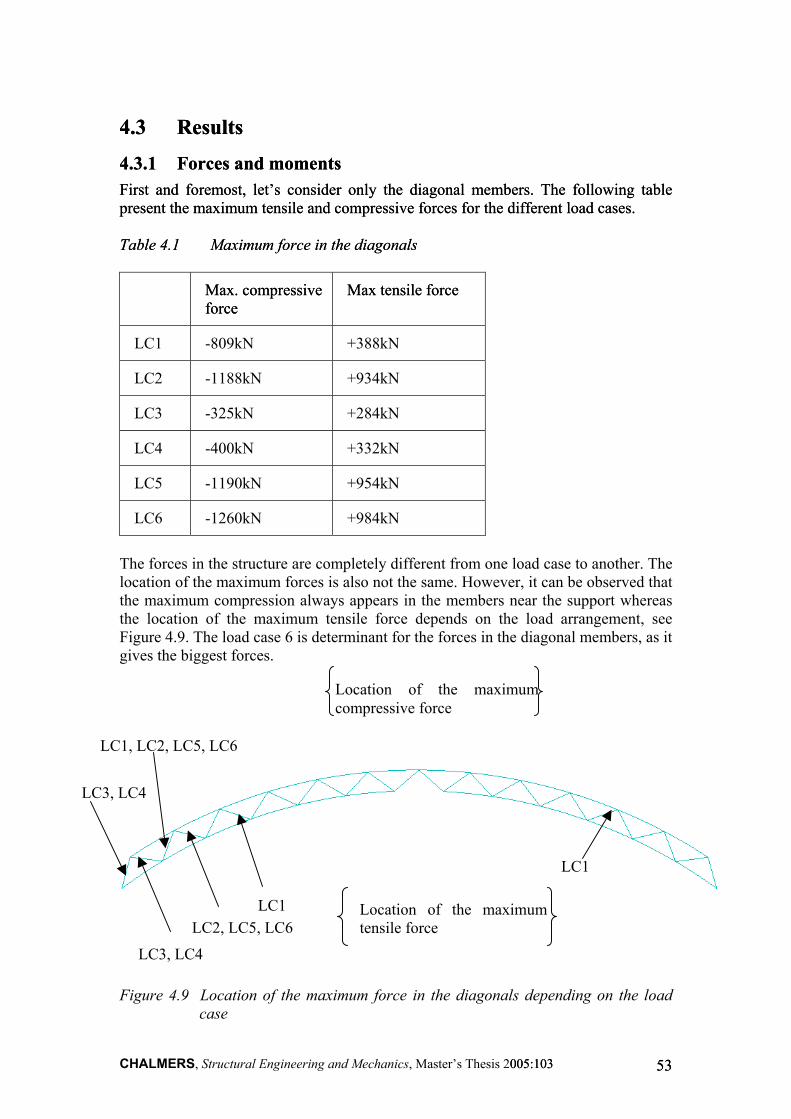
4.3 Results 4.3 Results
4.3.1 Forces and moments 4.3.1 Forces and moments First and foremost, let’s consider only the diagonal members. The present the maximum tensile and compressive forces for the different lFirst and foremost, let’s consider only the diagonal members. The present the maximum tensile and compressive forces for the different l Table 4.1 Maximum force in the diagonals Table 4.1 Maximum force in the diagonals
Max. compressive force Max. compressive force
Max tensile force Max tensile force
LC1 -809kN +388kN
LC2 -1188kN +934kN
LC3 -325kN +284kN
LC4 -400kN +332kN
LC5 -1190kN +954kN
LC6 -1260kN +984kN
The forces in the structure are completely different from one load caselocation of the maximum forces is also not the same. However, it can the maximum compression always appears in the members near the the location of the maximum tensile force depends on the load aFigure 4.9. The load case 6 is determinant for the forces in the diagonagives the biggest forces.
LC3, LC4
LC3, LC4
Location of the maximumcompressive force
Location of the maximumtensile force
LC1, LC2, LC5, LC6
L
LC1 LC2, LC5, LC6
Figure 4.9 Location of the maximum force in the diagonals dependcase
CHALMERS, Structural Engineering and Mechanics, Master’s Thesis 2005:103 005:103
following table oad cases. following table oad cases.
to another. The be observed that support whereas rrangement, see l members, as it
C1
ing on the load
5353
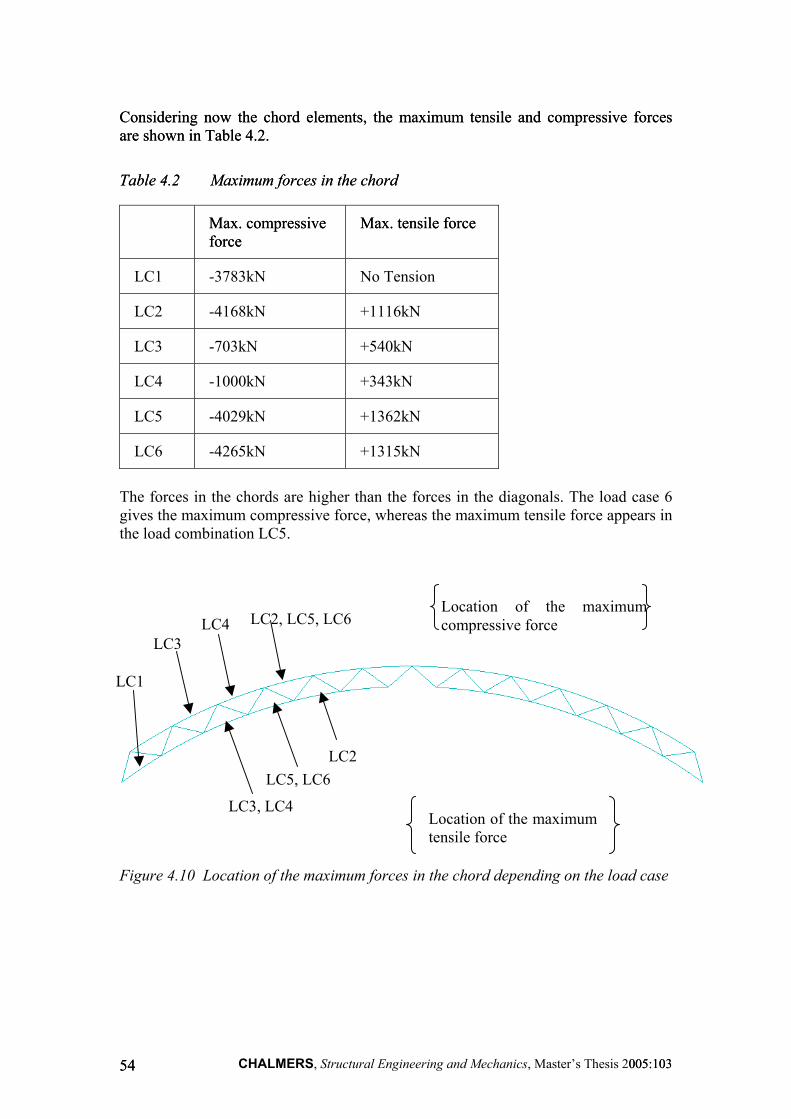
Considering now the chord elements, the maximum tensile and compressive forces are shown in Table 4.2. Considering now the chord elements, the maximum tensile and compressive forces are shown in Table 4.2.
Table 4.2 Maximum forces in the chord Table 4.2 Maximum forces in the chord
Max. compressive force Max. compressive force
Max. tensile force Max. tensile force
LC1 -3783kN No Tension
LC2 -4168kN +1116kN
LC3 -703kN +540kN
LC4 -1000kN +343kN
LC5 -4029kN +1362kN
LC6 -4265kN +1315kN
The forces in the chords are higher than the forces in the diagonals. The load case 6 gives the maximum compressive force, whereas the maximum tensile force appears in the load combination LC5.
LC2
LC3, LC4 Location of the maximumtensile force
Location of the maximum compressive force LC4
LC3
LC1
LC2, LC5, LC6
LC5, LC6
Figure 4.10 Location of the maximum forces in the chord depending on the load case
CHALMERS, Structural Engineering and Mechanics, Master’s Thesis 2005:103 005:103 5454
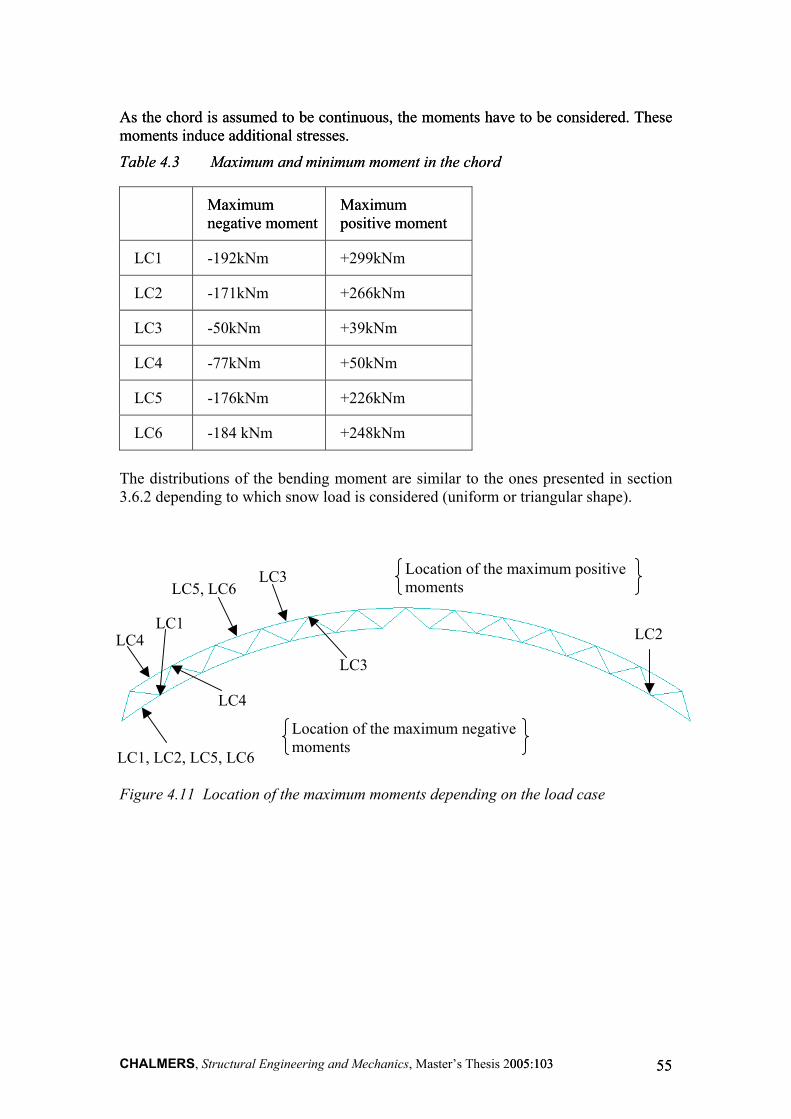
As the chord is assumed to be continuous, the moments have to be considered. These moments induce additional stresses. As the chord is assumed to be continuous, the moments have to be considered. These moments induce additional stresses.
Table 4.3 Maximum and minimum moment in the chord Table 4.3 Maximum and minimum moment in the chord
Maximum negative moment Maximum negative moment
Maximum positive moment Maximum positive moment
LC1 -192kNm +299kNm
LC2 -171kNm +266kNm
LC3 -50kNm +39kNm
LC4 -77kNm +50kNm
LC5 -176kNm +226kNm
LC6 -184 kNm +248kNm
The distributions of the bending moment are similar to the ones presented in section 3.6.2 depending to which snow load is considered (uniform or triangular shape).
LC1, LC2, LC5, LC6
LC4 LC2 LC1
LC3
Location of the maximum positive moments
Location of the maximum negative moments
LC4
LC3 LC5, LC6
Figure 4.11 Location of the maximum moments depending on the load case
CHALMERS, Structural Engineering and Mechanics, Master’s Thesis 2005:103 005:103 5555
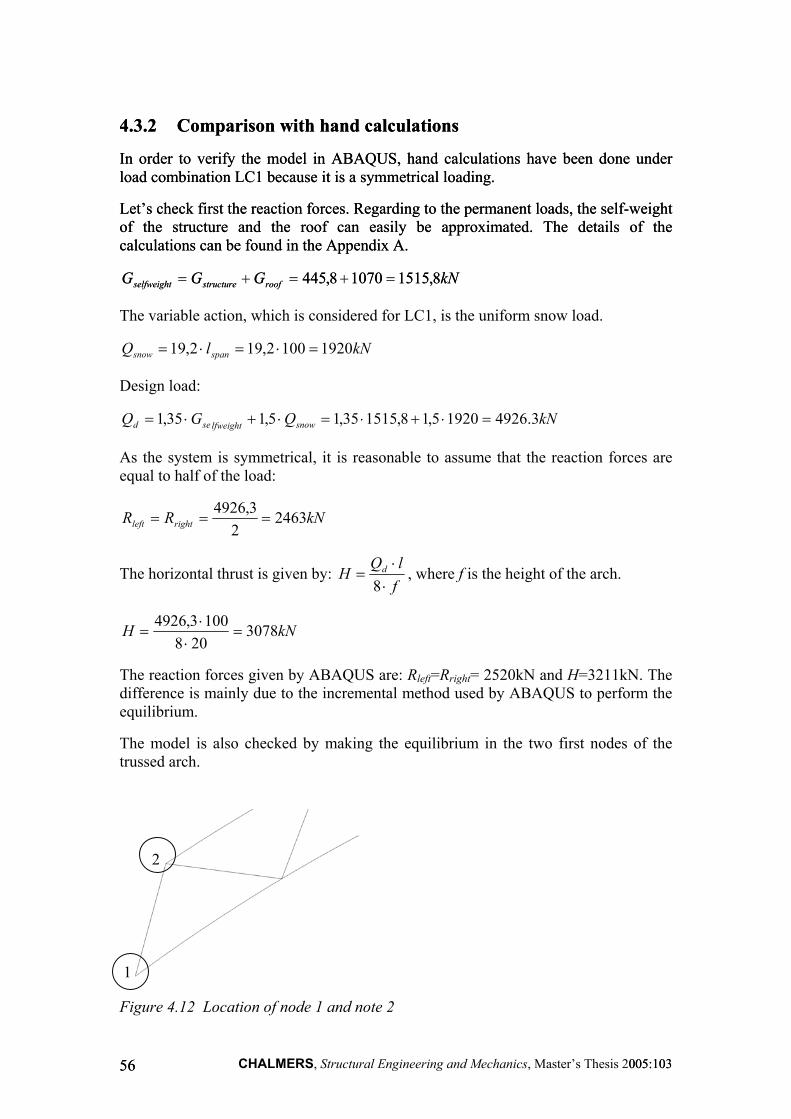
4.3.2 Comparison with hand calculations 4.3.2 Comparison with hand calculations
In order to verify the model in ABAQUS, hand calculations have been done under load combination LC1 because it is a symmetrical loading. In order to verify the model in ABAQUS, hand calculations have been done under load combination LC1 because it is a symmetrical loading.
Let’s check first the reaction forces. Regarding to the permanent loads, the self-weight of the structure and the roof can easily be approximated. The details of the calculations can be found in the Appendix A.
Let’s check first the reaction forces. Regarding to the permanent loads, the self-weight of the structure and the roof can easily be approximated. The details of the calculations can be found in the Appendix A.
kNGGG roofstructureselfweight 8,151510708,445 kNGGG roofstructureselfweight 8,151510708,445 =+=+=
The variable action, which is considered for LC1, is the uniform snow load.
kNlQ spansnow 19201002,192,19 =⋅=⋅=
Design load:
kNQGQ snowlfweightsed 3.492619205,18,151535,15,135,1 =⋅+⋅=⋅+⋅=
As the system is symmetrical, it is reasonable to assume that the reaction forces are equal to half of the load:
kNRR rightleft 24632
3,4926===
The horizontal thrust is given by: flQ
H d
⋅⋅
=8
, where f is the height of the arch.
kNH 3078208
1003,4926=
⋅⋅
=
The reaction forces given by ABAQUS are: Rleft=Rright= 2520kN and H=3211kN. The difference is mainly due to the incremental method used by ABAQUS to perform the equilibrium.
The model is also checked by making the equilibrium in the two first nodes of the trussed arch.
2
1
Figure 4.12 Location of node 1 and note 2
CHALMERS, Structural Engineering and Mechanics, Master’s Thesis 2005:103 005:103 5656
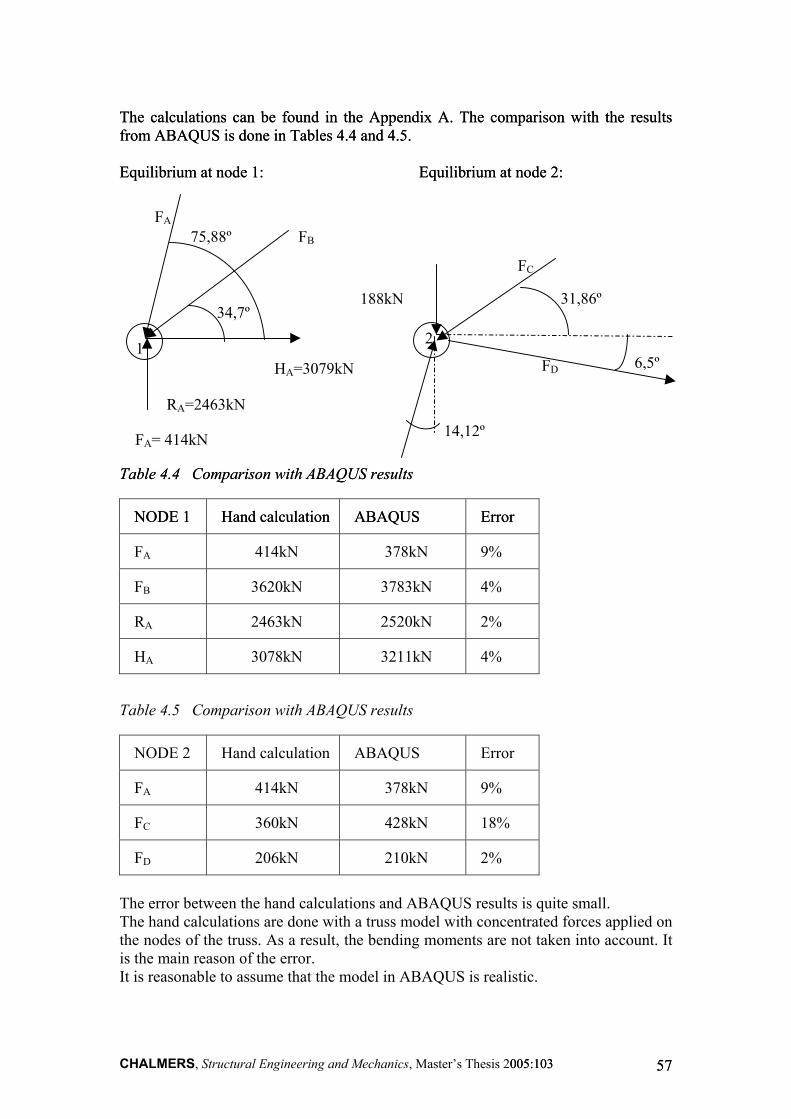
The calculations can be found in the Appendix A. The comparison with the results from ABAQUS is done in Tables 4.4 and 4.5. The calculations can be found in the Appendix A. The comparison with the results from ABAQUS is done in Tables 4.4 and 4.5. Equilibrium at node 1: Equilibrium at node 2: Equilibrium at node 1: Equilibrium at node 2:
2005:103 005:103
F
34,7º
1
RA=2463kN
A FB
188kN
75,88º
Table 4.4 Comparison with ABAQUS results Table 4.4 Comparison with ABAQUS results
NODE 1 NODE 1 Hand calculation Hand calculation ABAQUS ABAQUS Error Error
FA 414kN 378kN 9%
FB 3620kN 3783kN 4%
RA 2463kN 2520kN 2%
HA 3078kN 3211kN 4%
FC
FD
2
3
14,12º
HA=3079kN
FA= 414kN
Table 4.5 Comparison with ABAQUS results
NODE 2 Hand calculation ABAQUS Error
FA 414kN 378kN 9%
FC 360kN 428kN 18%
FD 206kN 210kN 2%
The error between the hand calculations and ABAQUS results is quiteThe hand calculations are done with a truss model with concentrated fthe nodes of the truss. As a result, the bending moments are not takenis the main reason of the error. It is reasonable to assume that the model in ABAQUS is realistic.
CHALMERS, Structural Engineering and Mechanics, Master’s Thesis
57576,5º
1,86º
small. orces applied on into account. It
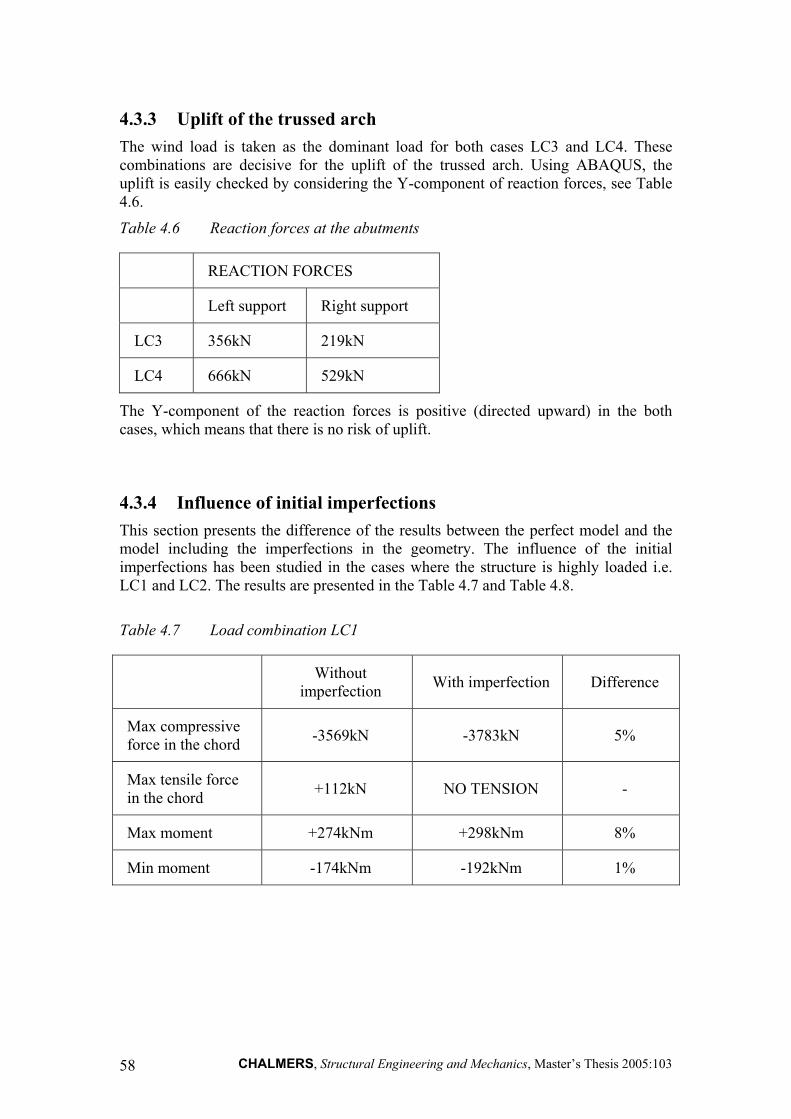
4.3.3 Uplift of the trussed arch The wind load is taken as the dominant load for both cases LC3 and LC4. These combinations are decisive for the uplift of the trussed arch. Using ABAQUS, the uplift is easily checked by considering the Y-component of reaction forces, see Table 4.6.
Table 4.6 Reaction forces at the abutments
REACTION FORCES
Left support Right support
LC3 356kN 219kN
LC4 666kN 529kN
The Y-component of the reaction forces is positive (directed upward) in the both cases, which means that there is no risk of uplift.
4.3.4 Influence of initial imperfections This section presents the difference of the results between the perfect model and the model including the imperfections in the geometry. The influence of the initial imperfections has been studied in the cases where the structure is highly loaded i.e. LC1 and LC2. The results are presented in the Table 4.7 and Table 4.8.
Table 4.7 Load combination LC1
Without imperfection With imperfection Difference
Max compressive force in the chord -3569kN -3783kN 5%
Max tensile force in the chord +112kN NO TENSION -
Max moment +274kNm +298kNm 8%
Min moment -174kNm -192kNm 1%
CHALMERS, Structural Engineering and Mechanics, Master’s Thesis 2005:103 58
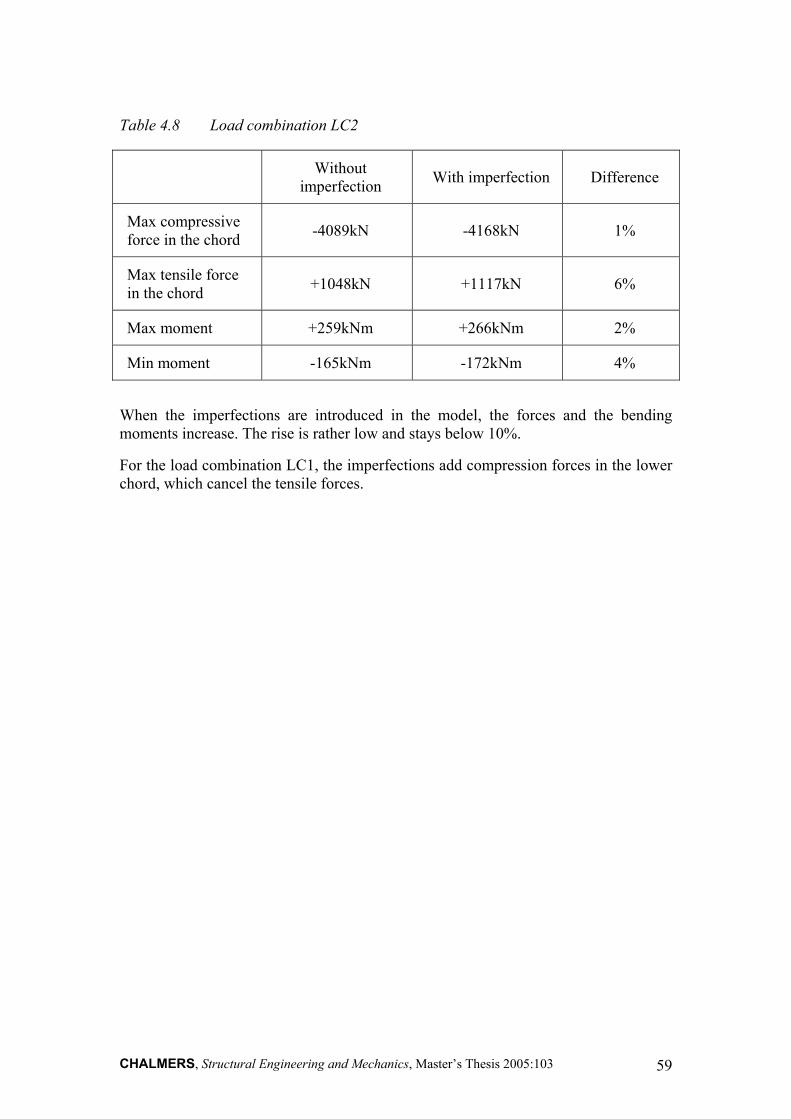
Table 4.8 Load combination LC2
Without imperfection With imperfection Difference
Max compressive force in the chord -4089kN -4168kN 1%
Max tensile force in the chord +1048kN +1117kN 6%
Max moment +259kNm +266kNm 2%
Min moment -165kNm -172kNm 4%
When the imperfections are introduced in the model, the forces and the bending moments increase. The rise is rather low and stays below 10%.
For the load combination LC1, the imperfections add compression forces in the lower chord, which cancel the tensile forces.
CHALMERS, Structural Engineering and Mechanics, Master’s Thesis 2005:103 59
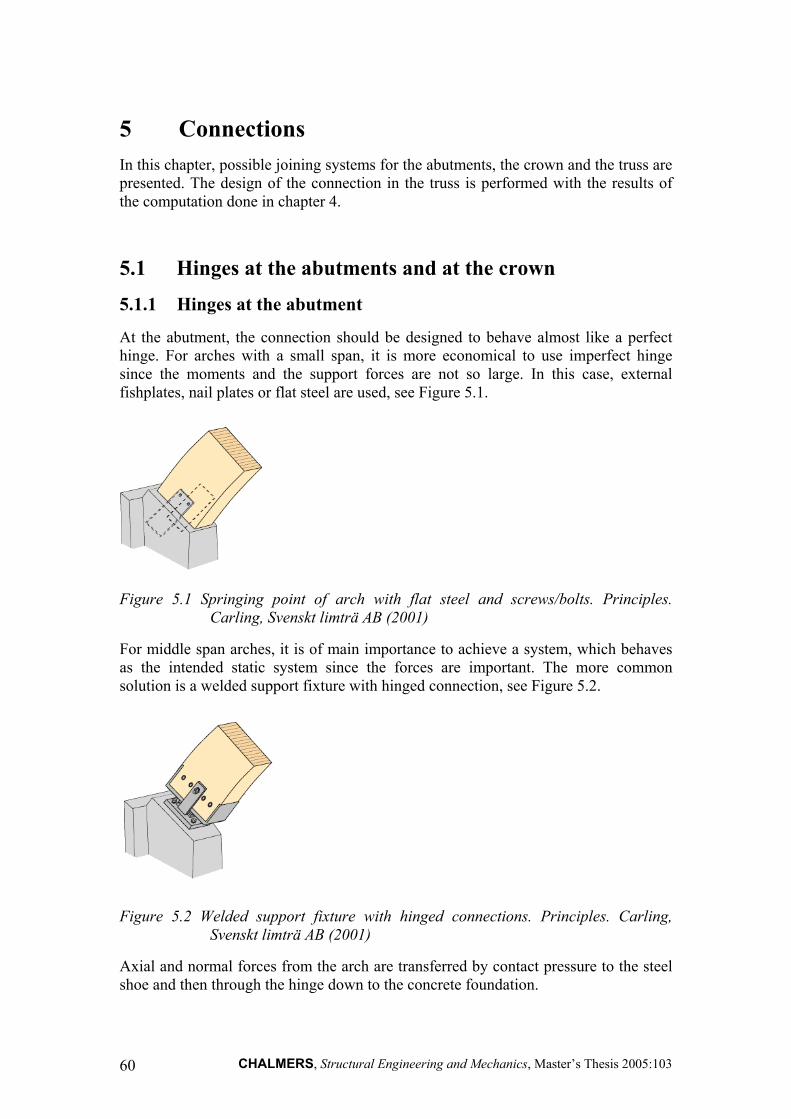
5 Connections In this chapter, possible joining systems for the abutments, the crown and the truss are presented. The design of the connection in the truss is performed with the results of the computation done in chapter 4.
5.1 Hinges at the abutments and at the crown
5.1.1 Hinges at the abutment
At the abutment, the connection should be designed to behave almost like a perfect hinge. For arches with a small span, it is more economical to use imperfect hinge since the moments and the support forces are not so large. In this case, external fishplates, nail plates or flat steel are used, see Figure 5.1.
Figure 5.1 Springing point of arch with flat steel and screws/bolts. Principles. Carling, Svenskt limträ AB (2001)
For middle span arches, it is of main importance to achieve a system, which behaves as the intended static system since the forces are important. The more common solution is a welded support fixture with hinged connection, see Figure 5.2.
Figure 5.2 Welded support fixture with hinged connections. Principles. Carling, Svenskt limträ AB (2001)
Axial and normal forces from the arch are transferred by contact pressure to the steel shoe and then through the hinge down to the concrete foundation.
CHALMERS, Structural Engineering and Mechanics, Master’s Thesis 2005:103 60
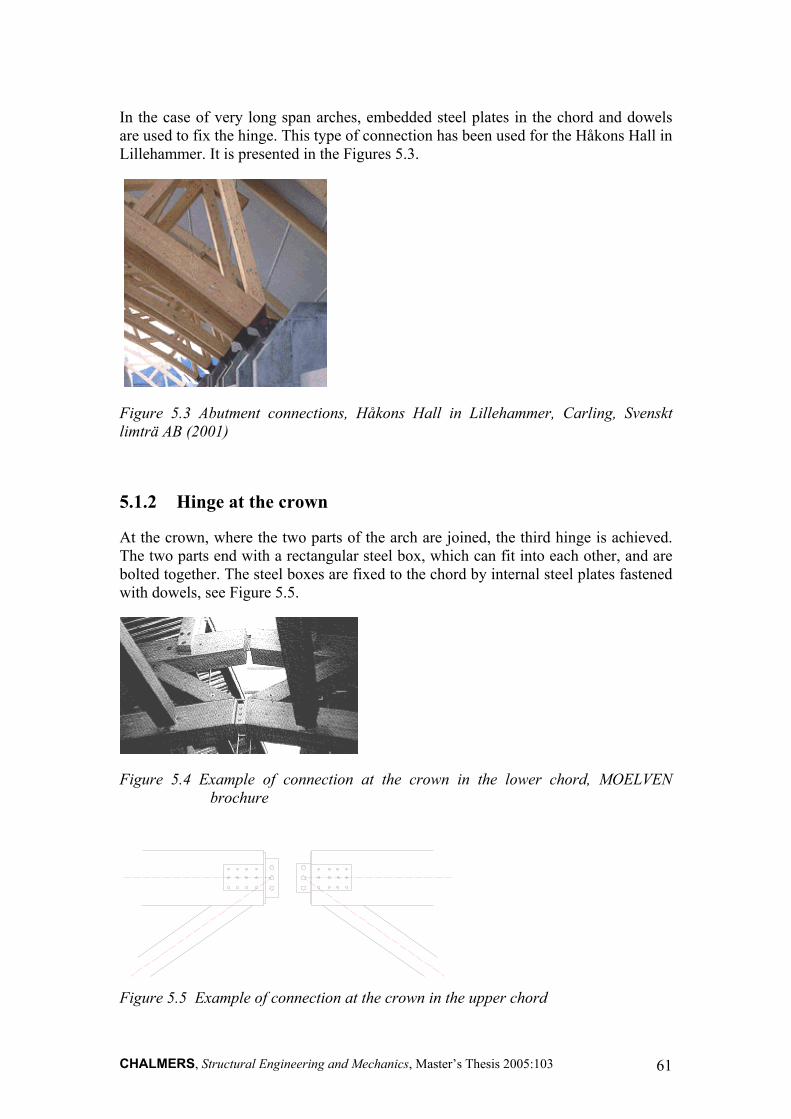
In the case of very long span arches, embedded steel plates in the chord and dowels are used to fix the hinge. This type of connection has been used for the Håkons Hall in Lillehammer. It is presented in the Figures 5.3.
Figure 5.3 Abutment connections, Håkons Hall in Lillehammer, Carling, Svenskt limträ AB (2001)
5.1.2 Hinge at the crown
At the crown, where the two parts of the arch are joined, the third hinge is achieved. The two parts end with a rectangular steel box, which can fit into each other, and are bolted together. The steel boxes are fixed to the chord by internal steel plates fastened with dowels, see Figure 5.5.
Figure 5.4 Example of connection at the crown in the lower chord, MOELVEN brochure
Figure 5.5 Example of connection at the crown in the upper chord
CHALMERS, Structural Engineering and Mechanics, Master’s Thesis 2005:103 61
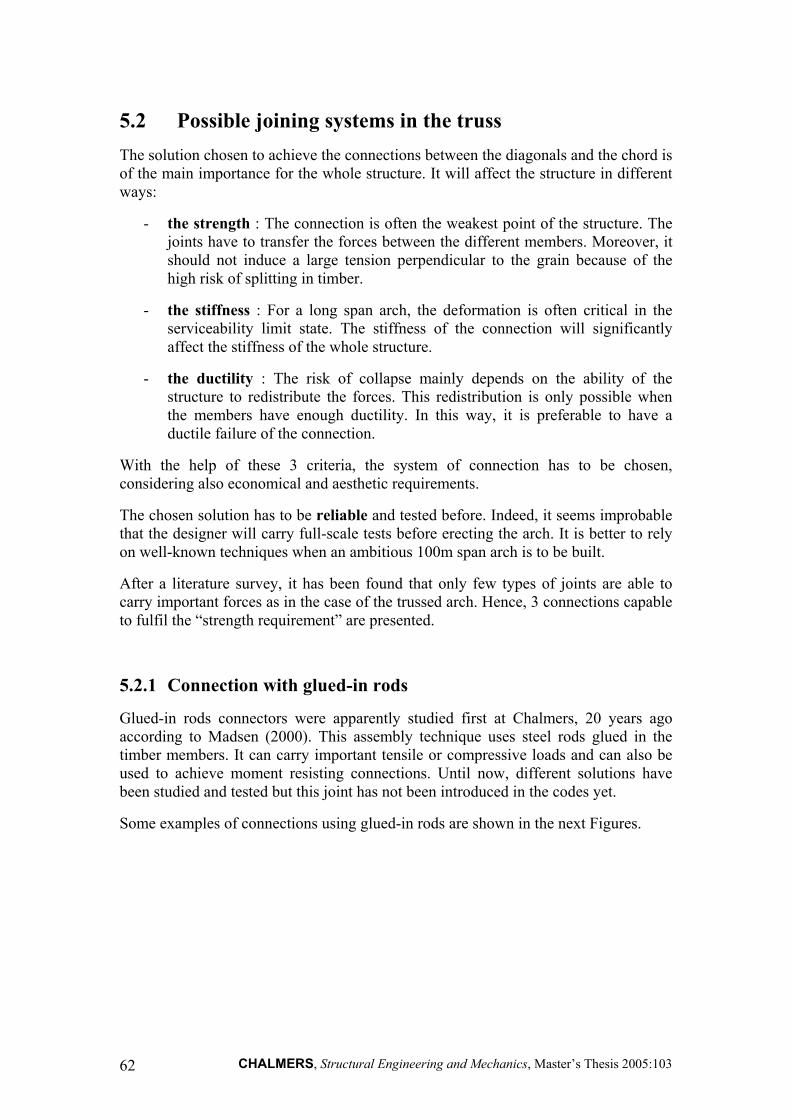
5.2 Possible joining systems in the truss The solution chosen to achieve the connections between the diagonals and the chord is of the main importance for the whole structure. It will affect the structure in different ways:
- the strength : The connection is often the weakest point of the structure. The joints have to transfer the forces between the different members. Moreover, it should not induce a large tension perpendicular to the grain because of the high risk of splitting in timber.
- the stiffness : For a long span arch, the deformation is often critical in the serviceability limit state. The stiffness of the connection will significantly affect the stiffness of the whole structure.
- the ductility : The risk of collapse mainly depends on the ability of the structure to redistribute the forces. This redistribution is only possible when the members have enough ductility. In this way, it is preferable to have a ductile failure of the connection.
With the help of these 3 criteria, the system of connection has to be chosen, considering also economical and aesthetic requirements.
The chosen solution has to be reliable and tested before. Indeed, it seems improbable that the designer will carry full-scale tests before erecting the arch. It is better to rely on well-known techniques when an ambitious 100m span arch is to be built.
After a literature survey, it has been found that only few types of joints are able to carry important forces as in the case of the trussed arch. Hence, 3 connections capable to fulfil the “strength requirement” are presented.
5.2.1 Connection with glued-in rods
Glued-in rods connectors were apparently studied first at Chalmers, 20 years ago according to Madsen (2000). This assembly technique uses steel rods glued in the timber members. It can carry important tensile or compressive loads and can also be used to achieve moment resisting connections. Until now, different solutions have been studied and tested but this joint has not been introduced in the codes yet.
Some examples of connections using glued-in rods are shown in the next Figures.
CHALMERS, Structural Engineering and Mechanics, Master’s Thesis 2005:103 62
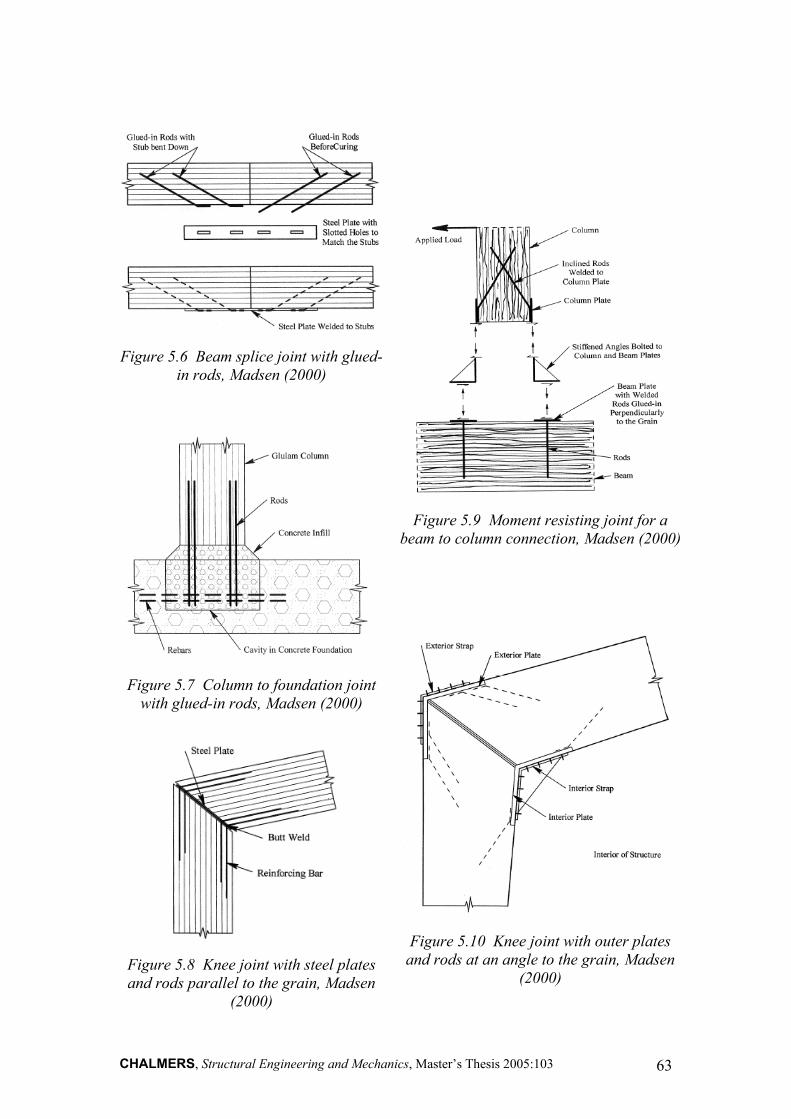
Figure 5.6 Beam splice joint with glued-in rods, Madsen (2000)
Figure 5.7 Column to foundation joint with glued-in rods, Madsen (2000)
Figure 5.8 Knee joint with steel plates and rods parallel to the grain, Madsen
(2000)
Figure 5.9 Moment resisting joint for a beam to column connection, Madsen (2000)
Figure 5.10 Knee joint with outer plates and rods at an angle to the grain, Madsen
(2000)
CHALMERS, Structural Engineering and Mechanics, Master’s Thesis 2005:103 63
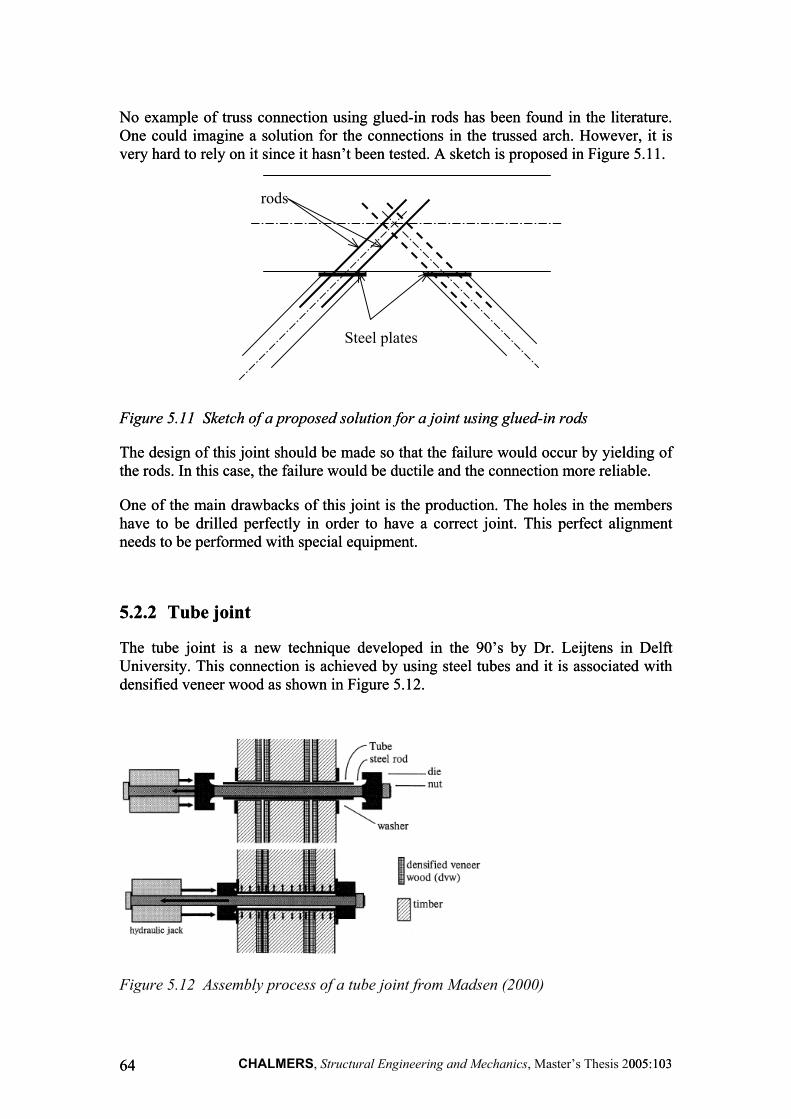
No example of truss connection using glued-in rods has been found in the literature. One could imagine a solution for the connections in the trussed arch. However, it is very hard to rely on it since it hasn’t been tested. A sketch is proposed in Figure 5.11.
No example of truss connection using glued-in rods has been found in the literature. One could imagine a solution for the connections in the trussed arch. However, it is very hard to rely on it since it hasn’t been tested. A sketch is proposed in Figure 5.11.
rods
Steel plates
Figure 5.11 Sketch of a proposed solution for a joint using glued-in rods Figure 5.11 Sketch of a proposed solution for a joint using glued-in rods
The design of this joint should be made so that the failure would occur by yielding of the rods. In this case, the failure would be ductile and the connection more reliable. The design of this joint should be made so that the failure would occur by yielding of the rods. In this case, the failure would be ductile and the connection more reliable.
One of the main drawbacks of this joint is the production. The holes in the members have to be drilled perfectly in order to have a correct joint. This perfect alignment needs to be performed with special equipment.
One of the main drawbacks of this joint is the production. The holes in the members have to be drilled perfectly in order to have a correct joint. This perfect alignment needs to be performed with special equipment.
5.2.2 Tube joint 5.2.2 Tube joint
The tube joint is a new technique developed in the 90’s by Dr. Leijtens in Delft University. This connection is achieved by using steel tubes and it is associated with densified veneer wood as shown in Figure 5.12.
The tube joint is a new technique developed in the 90’s by Dr. Leijtens in Delft University. This connection is achieved by using steel tubes and it is associated with densified veneer wood as shown in Figure 5.12.
Figure 5.12 Assembly process of a tube joint from Madsen (2000)
CHALMERS, Structural Engineering and Mechanics, Master’s Thesis 2005:103 005:103 6464
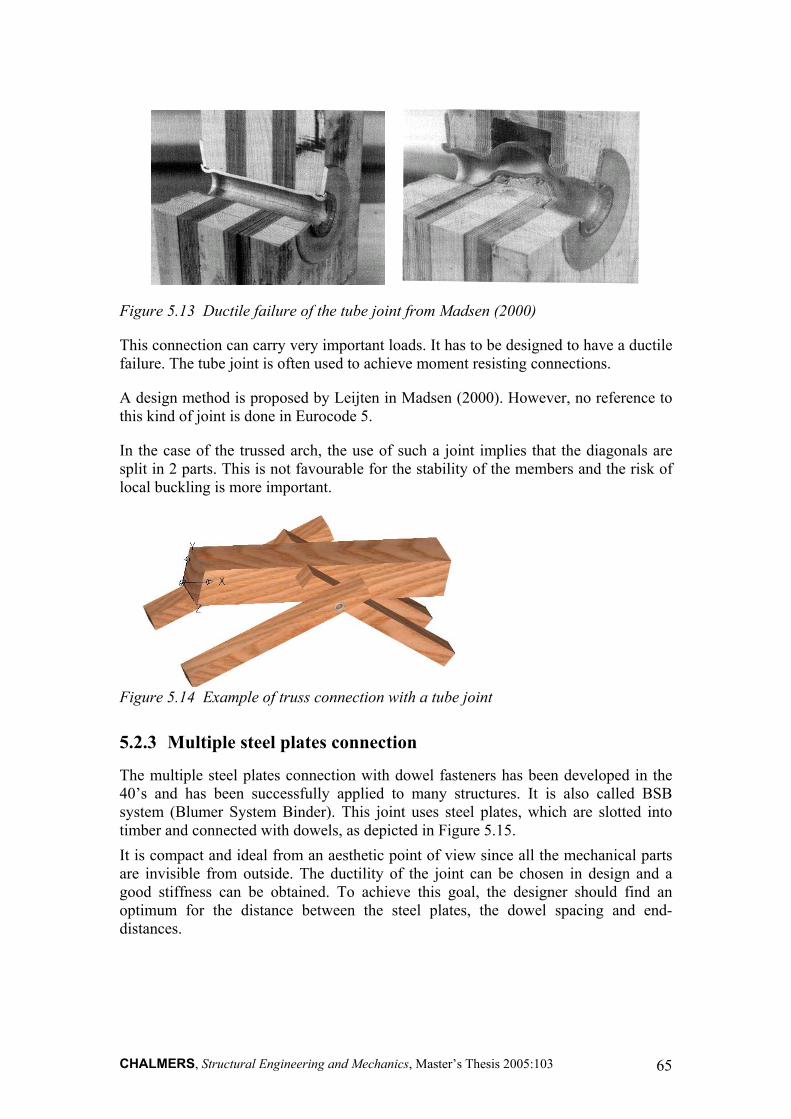
Figure 5.13 Ductile failure of the tube joint from Madsen (2000)
This connection can carry very important loads. It has to be designed to have a ductile failure. The tube joint is often used to achieve moment resisting connections.
A design method is proposed by Leijten in Madsen (2000). However, no reference to this kind of joint is done in Eurocode 5.
In the case of the trussed arch, the use of such a joint implies that the diagonals are split in 2 parts. This is not favourable for the stability of the members and the risk of local buckling is more important.
Figure 5.14 Example of truss connection with a tube joint
5.2.3 Multiple steel plates connection
The multiple steel plates connection with dowel fasteners has been developed in the 40’s and has been successfully applied to many structures. It is also called BSB system (Blumer System Binder). This joint uses steel plates, which are slotted into timber and connected with dowels, as depicted in Figure 5.15. It is compact and ideal from an aesthetic point of view since all the mechanical parts are invisible from outside. The ductility of the joint can be chosen in design and a good stiffness can be obtained. To achieve this goal, the designer should find an optimum for the distance between the steel plates, the dowel spacing and end-distances.
CHALMERS, Structural Engineering and Mechanics, Master’s Thesis 2005:103 65
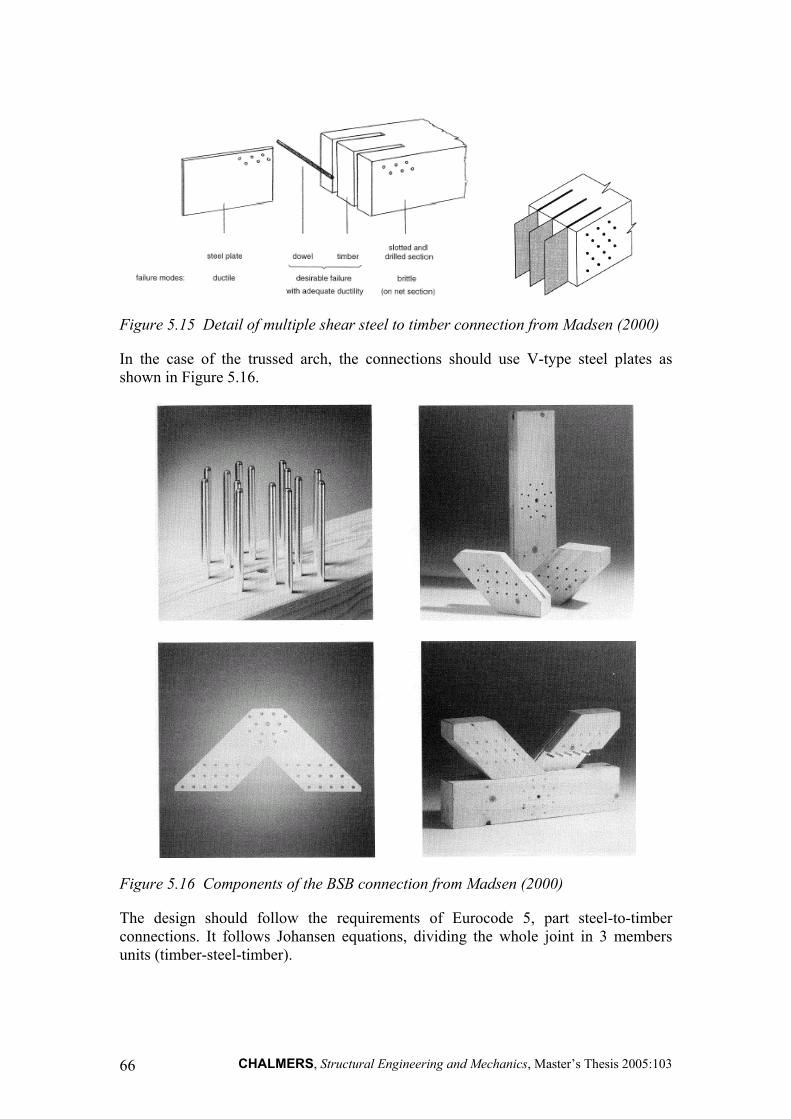
Figure 5.15 Detail of multiple shear steel to timber connection from Madsen (2000)
In the case of the trussed arch, the connections should use V-type steel plates as shown in Figure 5.16.
Figure 5.16 Components of the BSB connection from Madsen (2000)
The design should follow the requirements of Eurocode 5, part steel-to-timber connections. It follows Johansen equations, dividing the whole joint in 3 members units (timber-steel-timber).
CHALMERS, Structural Engineering and Mechanics, Master’s Thesis 2005:103 66
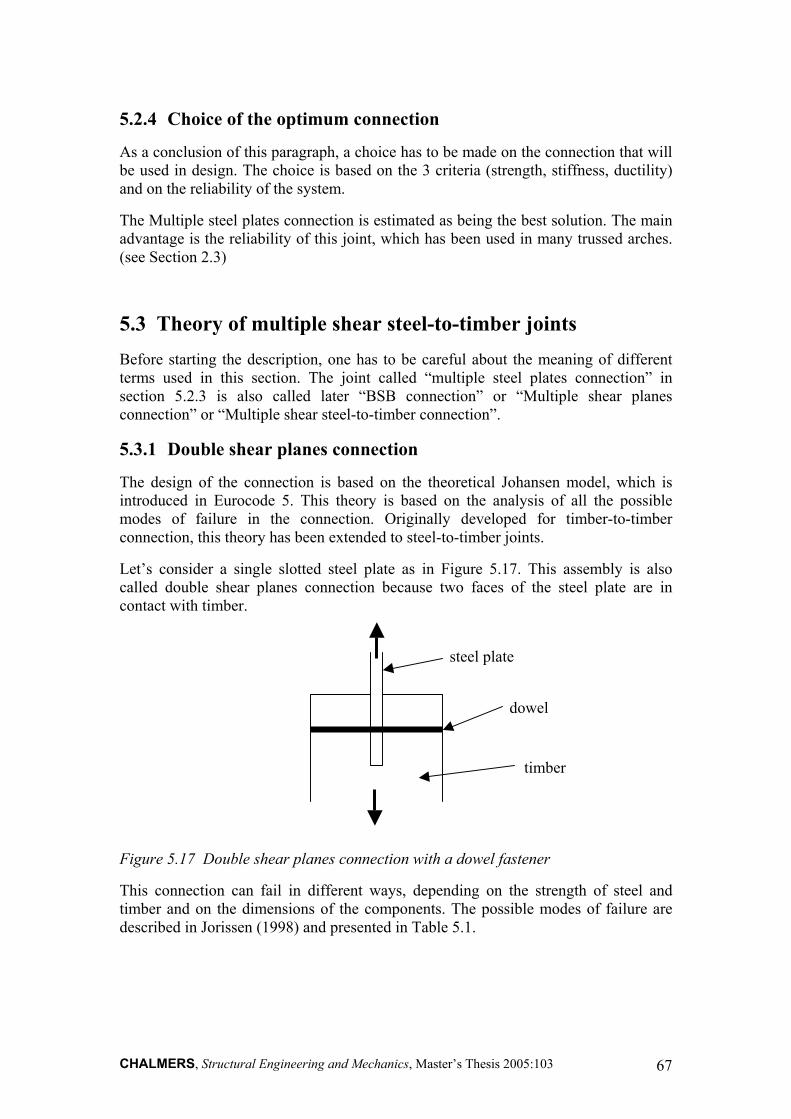
5.2.4 Choice of the optimum connection
As a conclusion of this paragraph, a choice has to be made on the conbe used in design. The choice is based on the 3 criteria (strength, stiand on the reliability of the system.
The Multiple steel plates connection is estimated as being the best soladvantage is the reliability of this joint, which has been used in many(see Section 2.3)
5.3 Theory of multiple shear steel-to-timber jointBefore starting the description, one has to be careful about the meanterms used in this section. The joint called “multiple steel platessection 5.2.3 is also called later “BSB connection” or “Multipconnection” or “Multiple shear steel-to-timber connection”.
5.3.1 Double shear planes connection
The design of the connection is based on the theoretical Johansen mintroduced in Eurocode 5. This theory is based on the analysis of modes of failure in the connection. Originally developed for tconnection, this theory has been extended to steel-to-timber joints.
Let’s consider a single slotted steel plate as in Figure 5.17. This acalled double shear planes connection because two faces of the stcontact with timber.
dowel
steel plate
timber
Figure 5.17 Double shear planes connection with a dowel fastener
This connection can fail in different ways, depending on the strengtimber and on the dimensions of the components. The possible moddescribed in Jorissen (1998) and presented in Table 5.1.
CHALMERS, Structural Engineering and Mechanics, Master’s Thesis 2005:103
nection that will ffness, ductility)
ution. The main trussed arches.
s ing of different
connection” in le shear planes
odel, which is all the possible imber-to-timber
ssembly is also eel plate are in
th of steel and es of failure are
67

Table 5.1 Basic failure modes and equations for a double shear planes connection with dowels, Figures from Jorissen (1998)
Failure mode 1 failure of timber
Failure mode 2 1 plastic hinge in the dowel
Failure mode 3 3 plastic hinges in the
dowel
Load carrying capacity per shear plane according to Jorissen (1998)
hftdF ⋅⋅= 11
−
⋅⋅
⋅+⋅⋅= 1
42 2
112 tfd
MtfdF
h
yh hy fdMF ⋅⋅⋅= 43
Load carrying capacity per shear plane according to Eurocode 5
hftdF ⋅⋅= 11
−
⋅⋅
⋅+⋅⋅= 1
42 2
112 tfd
MtfdF
h
yh hy fdMF ⋅⋅⋅= 3,23
It is visible that equation 3 in Eurocode 5 is different from the original model. The design of the connection is done following Eurocode’s equations.
The failure is brittle when mode 1 appears whereas it is ductile in mode 2 or 3.
5.3.2 Multiple shear planes connection
When the connection is made of several steel plates, it becomes a multiple shear planes connections. In this case, it is necessary to divide the joint in a number of double shear planes units, in order to calculate the load carrying capacity of the whole connection.
CHALMERS, Structural Engineering and Mechanics, Master’s Thesis 2005:103 68

Figure 5.18 Multiple shear planes connection, Jorissen (1998) at left, and illustration of the incompatibility of modes 1 and 2 in the inner parts at right.
A B C …
A difference has to be done between the outer units (A) and the inner ones (B and C), since the dimensions t1 and t2 are different (see Figure 5.18 left). Moreover, it is important to consider the compatibility between the modes, which satisfies the continuous deformation of the dowel. For instance, mode 1 is not compatible with mode 2 as shown in the inner parts in Figure 5.18 right. As a result, only mode 1 or mode 3 can happen.
According to Jorissen (1998), eight failure modes are compatible and have to be considered for this type of connections. Equations (5.1) to (5.4) represent the load carrying capacity per shear plane and per dowel for the different modes:
1/1 tfdF houter ⋅⋅= (5.1)
2/1 2/1 tfdF hinner ⋅⋅⋅= (5.2)
−
⋅⋅
⋅+⋅⋅⋅= 1
42 2
112 tfd
MtfdF
h
yh (5.3)
hy fdMF ⋅⋅⋅= 3,23 (5.4)
The load carrying capacity per steel plate and per dowel will be calculated as a combination of compatible modes, as described in the Table 5.2. Table 5.2 Combination of compatible failure modes
Outer units: Fouter= Inner units : Finner= Lowest value of:
F1/outer+F1/inner
F1/outer+F3
F2+F1/inner F3 +F1/inner F3+F2
F3+F3
Lowest value of: F1/inner+F1/inner
F3+F3
CHALMERS, Structural Engineering and Mechanics, Master’s Thesis 2005:103 69
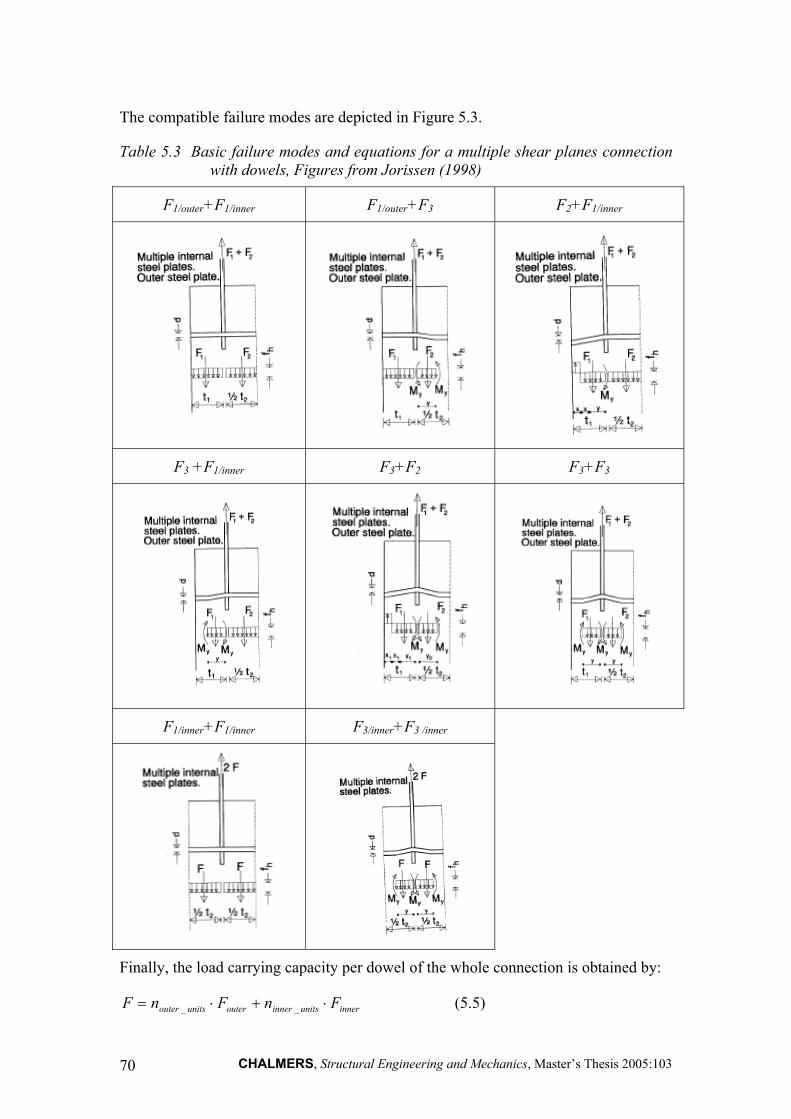
The compatible failure modes are depicted in Figure 5.3.
Table 5.3 Basic failure modes and equations for a multiple shear planes connection with dowels, Figures from Jorissen (1998)
F1/outer+F1/inner F1/outer+F3 F2+F1/inner
F3 +F1/inner F3+F2 F3+F3
F1/inner+F1/inner F3/inner+F3 /inner
Finally, the load carrying capacity per dowel of the whole connection is obtained by:
innerunitsinnerouterunitsouter FnFnF ⋅+⋅= __ (5.5)
CHALMERS, Structural Engineering and Mechanics, Master’s Thesis 2005:103 70
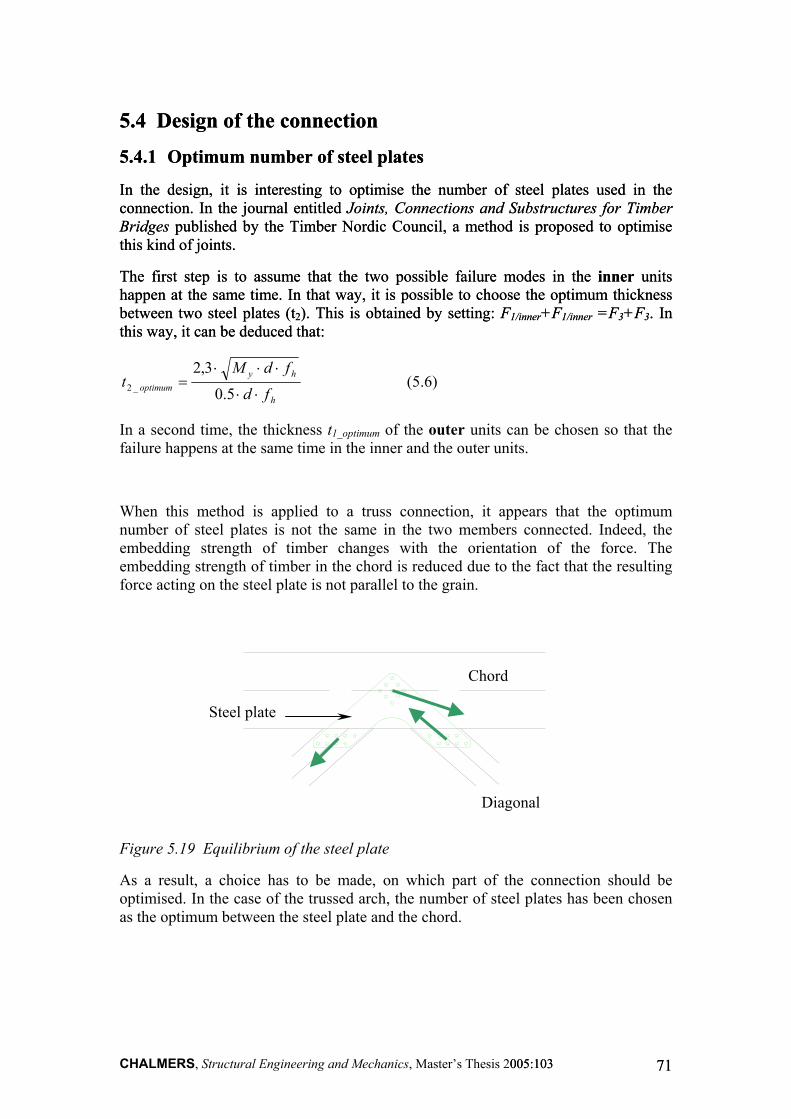
5.4 Design of the connection 5.4 Design of the connection
5.4.1 Optimum number of steel plates 5.4.1 Optimum number of steel plates
In the design, it is interesting to optimise the number of steel plates used in the connection. In the journal entitled Joints, Connections and Substructures for Timber Bridges published by the Timber Nordic Council, a method is proposed to optimise this kind of joints.
In the design, it is interesting to optimise the number of steel plates used in the connection. In the journal entitled Joints, Connections and Substructures for Timber Bridges published by the Timber Nordic Council, a method is proposed to optimise this kind of joints.
The first step is to assume that the two possible failure modes in the inner units happen at the same time. In that way, it is possible to choose the optimum thickness between two steel plates (t2). This is obtained by setting: F1/inner+F1/inner =F3+F3. In this way, it can be deduced that:
The first step is to assume that the two possible failure modes in the inner units happen at the same time. In that way, it is possible to choose the optimum thickness between two steel plates (t2). This is obtained by setting: F1/inner+F1/inner =F3+F3. In this way, it can be deduced that:
h
hyoptimum fd
fdMt
⋅⋅
⋅⋅⋅=
5.0
3,2_2 (5.6)
In a second time, the thickness t1_optimum of the outer units can be chosen so that the failure happens at the same time in the inner and the outer units.
When this method is applied to a truss connection, it appears that the optimum number of steel plates is not the same in the two members connected. Indeed, the embedding strength of timber changes with the orientation of the force. The embedding strength of timber in the chord is reduced due to the fact that the resulting force acting on the steel plate is not parallel to the grain.
2005:103 005:103 7171
Chord
Steel plate
Diagonal
Figure 5.19 Equilibrium of the steel plate
As a result, a choice has to be made, on which part of the connection should be optimised. In the case of the trussed arch, the number of steel plates has been chosen as the optimum between the steel plate and the chord.
CHALMERS, Structural Engineering and Mechanics, Master’s Thesis
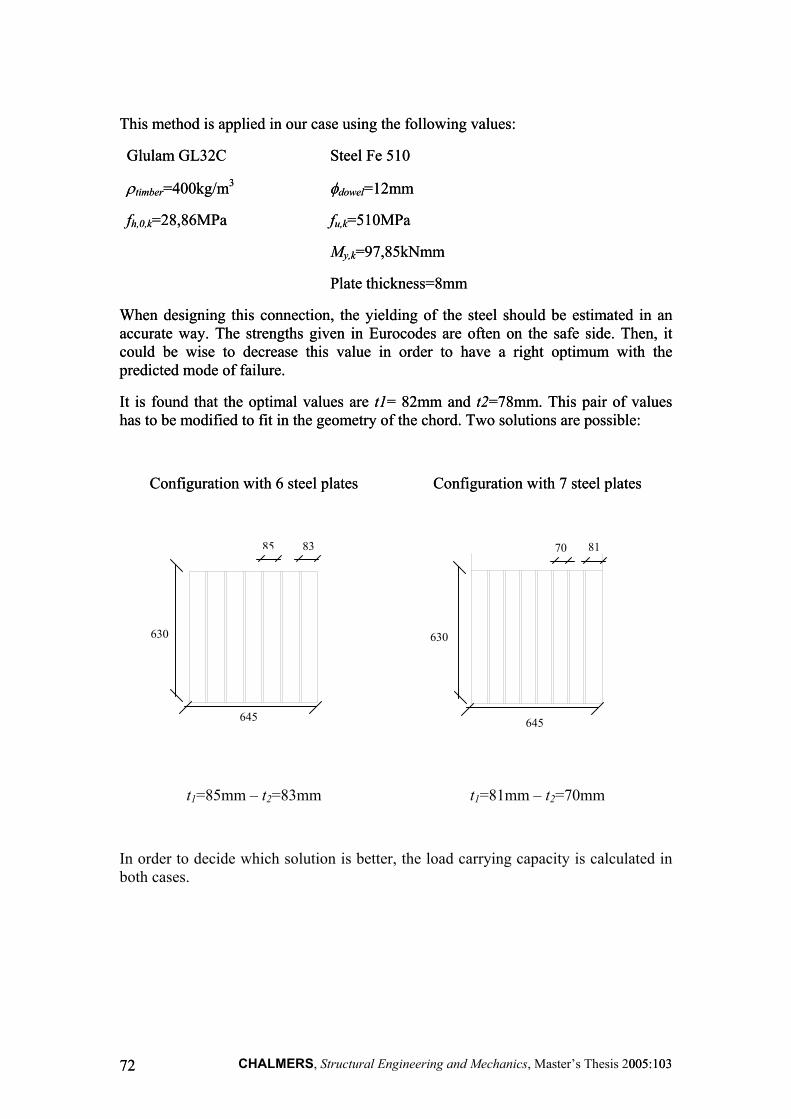
This method is applied in our case using the following values: This method is applied in our case using the following values:
Glulam GL32C Glulam GL32C Steel Fe 510 Steel Fe 510
ρtimber=400kg/m3 ρ
fh,0,k=28,86MPa fh,0,k=28,86MPa
φdowel=12mm φ
fu,k=510MPa f
My,k=97,85kNmm M
Plate thickness=8mm Plate thickness=8mm
timber=400kg/m3 dowel=12mm
u,k=510MPa
y,k=97,85kNmm
When designing this connection, the yielding of the steel should be estimated in an accurate way. The strengths given in Eurocodes are often on the safe side. Then, it could be wise to decrease this value in order to have a right optimum with the predicted mode of failure.
When designing this connection, the yielding of the steel should be estimated in an accurate way. The strengths given in Eurocodes are often on the safe side. Then, it could be wise to decrease this value in order to have a right optimum with the predicted mode of failure.
It is found that the optimal values are t1= 82mm and t2=78mm. This pair of values has to be modified to fit in the geometry of the chord. Two solutions are possible: It is found that the optimal values are t1= 82mm and t2=78mm. This pair of values has to be modified to fit in the geometry of the chord. Two solutions are possible:
Configuration with 6 steel plates Configuration with 6 steel plates Configuration with 7 steel plates Configuration with 7 steel plates
t1=85mm – t2=83mm
t1=81mm – t2=70mm
85 83
645
630
70 81
645
630
In order to decide which solution is better, the load carrying capacity is calculated in both cases.
CHALMERS, Structural Engineering and Mechanics, Master’s Thesis 2005:103 005:103 7272
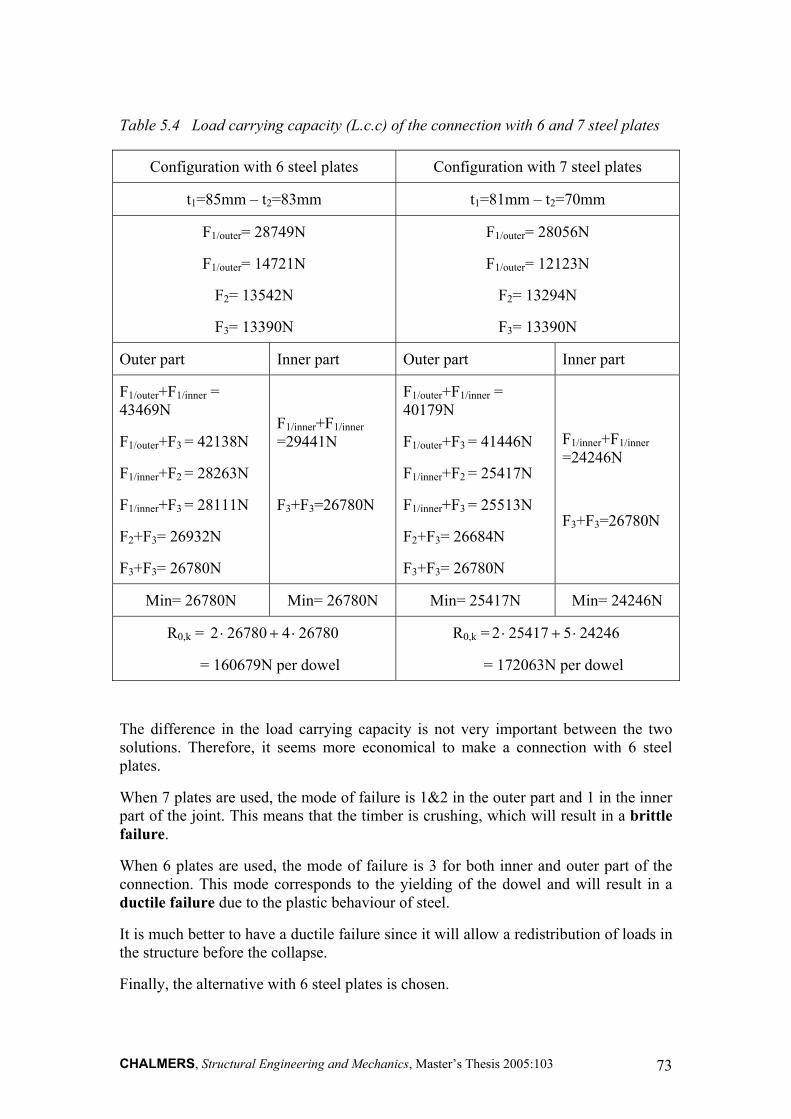
Table 5.4 Load carrying capacity (L.c.c) of the connection with 6 and 7 steel plates
Configuration with 6 steel plates Configuration with 7 steel plates
t1=85mm – t2=83mm t1=81mm – t2=70mm
F1/outer= 28749N
F1/outer= 14721N
F2= 13542N
F3= 13390N
F1/outer= 28056N
F1/outer= 12123N
F2= 13294N
F3= 13390N
Outer part Inner part Outer part Inner part
F1/outer+F1/inner = 43469N
F1/outer+F3 = 42138N
F1/inner+F2 = 28263N
F1/inner+F3 = 28111N
F2+F3= 26932N
F3+F3= 26780N
F1/inner+F1/inner =29441N
F3+F3=26780N
F1/outer+F1/inner = 40179N
F1/outer+F3 = 41446N
F1/inner+F2 = 25417N
F1/inner+F3 = 25513N
F2+F3= 26684N
F3+F3= 26780N
F1/inner+F1/inner =24246N
F3+F3=26780N
Min= 26780N Min= 26780N Min= 25417N Min= 24246N
R0,k = 267804267802 ⋅+⋅
= 160679N per dowel
R0,k = 2 24246525417 ⋅+⋅
= 172063N per dowel
The difference in the load carrying capacity is not very important between the two solutions. Therefore, it seems more economical to make a connection with 6 steel plates.
When 7 plates are used, the mode of failure is 1&2 in the outer part and 1 in the inner part of the joint. This means that the timber is crushing, which will result in a brittle failure.
When 6 plates are used, the mode of failure is 3 for both inner and outer part of the connection. This mode corresponds to the yielding of the dowel and will result in a ductile failure due to the plastic behaviour of steel.
It is much better to have a ductile failure since it will allow a redistribution of loads in the structure before the collapse.
Finally, the alternative with 6 steel plates is chosen.
CHALMERS, Structural Engineering and Mechanics, Master’s Thesis 2005:103 73
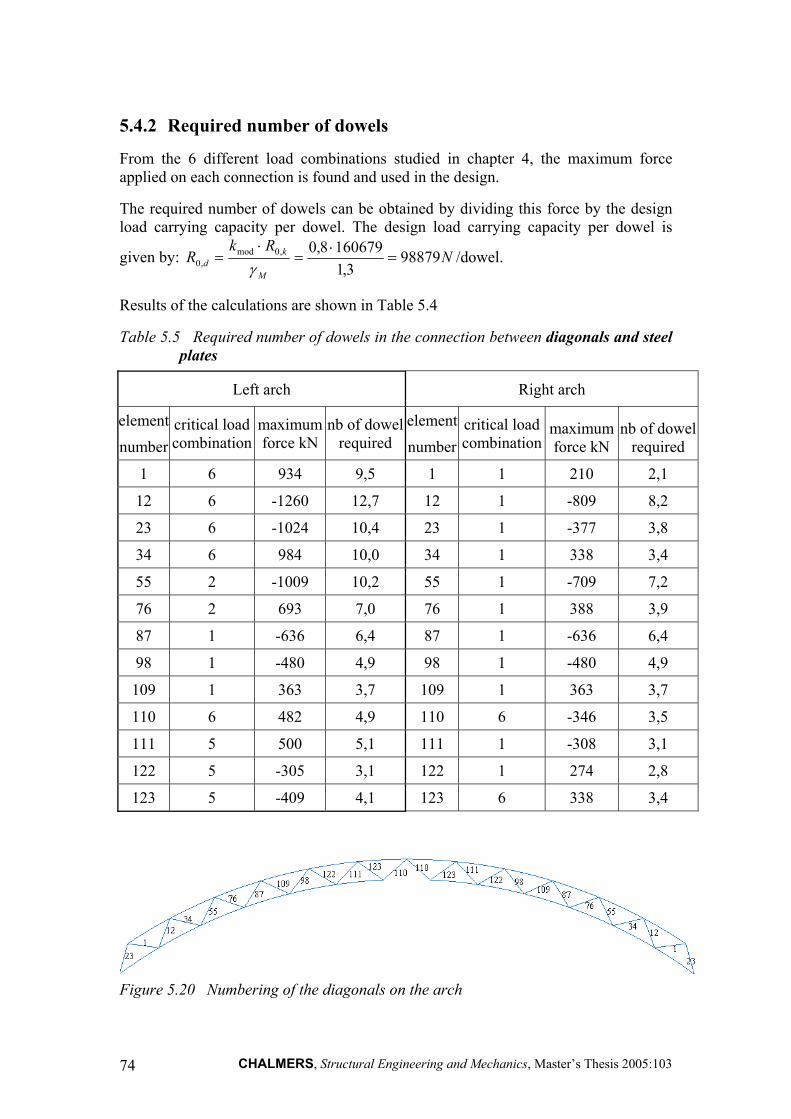
5.4.2 Required number of dowels
From the 6 different load combinations studied in chapter 4, the maximum force applied on each connection is found and used in the design.
The required number of dowels can be obtained by dividing this force by the design load carrying capacity per dowel. The design load carrying capacity per dowel is
given by: NRk
RM
kd 98879
3,11606798,0,0mod
,0 =⋅
=⋅
=γ
/dowel.
Results of the calculations are shown in Table 5.4
Table 5.5 Required number of dowels in the connection between diagonals and steel plates
is 2005:103
Left arch Right arch
element
number critical load combination
maximum force kN
nb of dowelrequired
element
numbercritical load combination
maximum force kN
nb of dowelrequired
1 6 934 9,5 1 1 210 2,1
12 6 -1260 12,7 12 1 -809 8,2
23 6 -1024 10,4 23 1 -377 3,8
34 6 984 10,0 34 1 338 3,4
55 2 -1009 10,2 55 1 -709 7,2
76 2 693 7,0 76 1 388 3,9
87 1 -636 6,4 87 1 -636 6,4
98 1 -480 4,9 98 1 -480 4,9
109 1 363 3,7 109 1 363 3,7
110 6 4,9 110 6 -346 3,5
111 5 500 5,1 111 1 -308 3,1
122 5 -305 3,1 122 1 274 2,8
123 5 -409 4,1 123 6 338 3,4
482
Figure 5.20 Numbering of the diagonals on the arch
CHALMERS, Structural Engineering and Mechanics, Master’s Thes74

In the upper and lower chords, the resulting force is calculated by making the static equilibrium of the steel plate. In the FE model the chords are continuous, which implies that the moment is not zero at the joints. As a result, when the static equilibrium is done in this point, the resulting force is not parallel to the chord.
In the upper and lower chords, the resulting force is calculated by making the static equilibrium of the steel plate. In the FE model the chords are continuous, which implies that the moment is not zero at the joints. As a result, when the static equilibrium is done in this point, the resulting force is not parallel to the chord.
Since this resulting force is applied at an angle to the grain α, the embedding strength of timber ( fα,h ) is modified taking into account that angle. Then, the design load carrying capacity per dowel can be calculated and used to define the minimum number of dowels.
Since this resulting force is applied at an angle to the grain α, the embedding strength of timber ( fα,h ) is modified taking into account that angle. Then, the design load carrying capacity per dowel can be calculated and used to define the minimum number of dowels.
R α
Figure 5.21 Equilibrium of the steel plate
The details of the calculations can be found in Appendix B. The results of the calculations are shown in Table 5.5 and Table 5.6. Some connections need to be checked in several load cases because from a load combination to another, the diagonals are tensioned or compressed.
Table 5.6 Required number of dowels in the connection between upper chord and steel plates
Left arch Right arch
node Critical
load comb.
Force magnitude
(kN) α (deg) f α,h
(MPa)
nb of dowels
required node
Critical load
comb.
Force magnitude
(kN) α (deg) f α,h
(MPa)
nb of dowels
required
1 6 1516 13,5 27,8 16,3 7 1 444 5,5 28,6 4,8
2 6 1751 15,3 27,5 18,9 8 1 864 2,3 28,8 9,3
3 2 1338 16,8 27,3 14,4 9 1 829 5,3 28,7 8,9
4 1 795 18,7 26,9 8,6 10 1 756 5,8 28,6 8,1
11 1 571 5,8 28,6 6,1 5
1
5
600
341
18,7
3,8
26,9
28,7
6,5
3,7
6 5 708 14,8 27,6 7,6 12
1
6
330
473
2,5
15,1
28,8
27,5
3,6
5,1
CHALMERS, Structural Engineering and Mechanics, Master’s Thesis 2005:103 005:103 7575
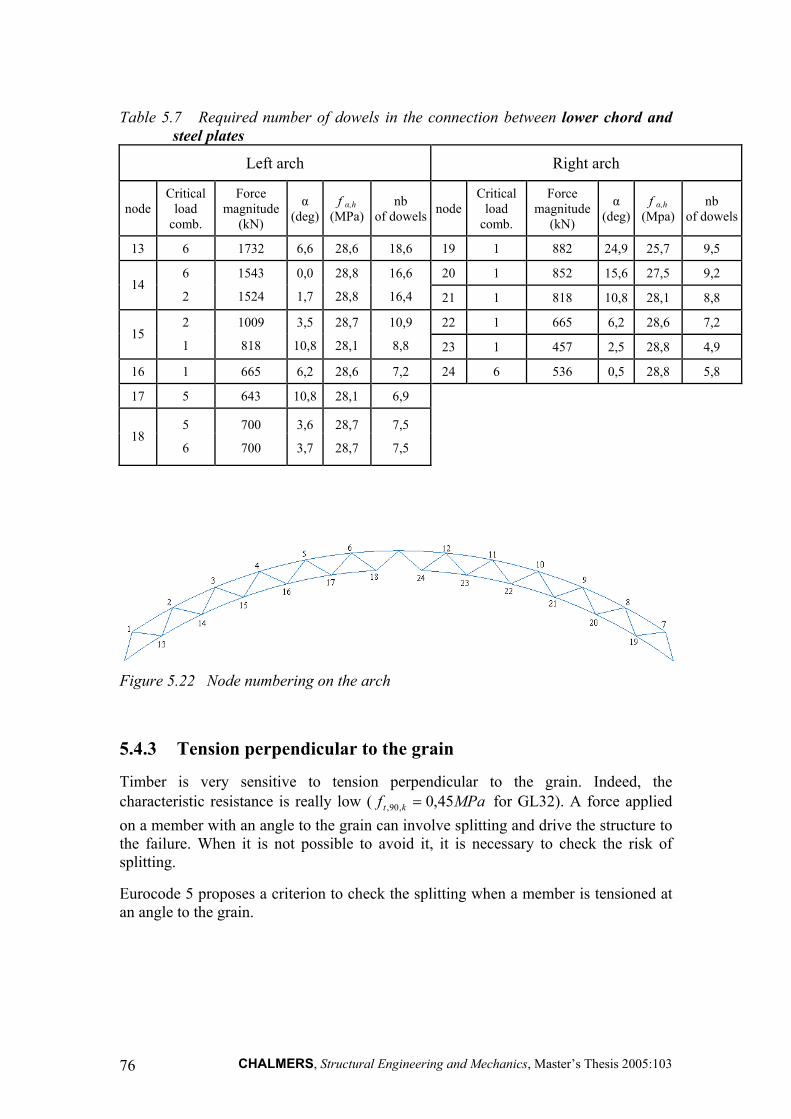
Table 5.7 Required number of dowels in the connection between lower chord and steel plates
Left arch Right arch
node Critical
load comb.
Force magnitude
(kN)
α (deg)
f α,h (MPa)
nb of dowels node
Critical load
comb.
Force magnitude
(kN)
α (deg)
f α,h (Mpa)
nb of dowels
13 6 1732 6,6 28,6 18,6 19 1 882 24,9 25,7 9,5
20 1 852 15,6 27,5 9,2 14
6
2
1543
1524
0,0
1,7
28,8
28,8
16,6
16,4 21 1 818 10,8 28,1 8,8
22 1 665 6,2 28,6 7,2 15
2
1
1009
818
3,5
10,8
28,7
28,1
10,9
8,8 23 1 457 2,5 28,8 4,9
16 1 665 6,2 28,6 7,2 24 6 536 0,5 28,8 5,8
17 5 643 10,8 28,1 6,9
18 5
6
700
700
3,6
3,7
28,7
28,7
7,5
7,5
Figure 5.22 Node numbering on the arch
5.4.3 Tension perpendicular to the grain
Timber is very sensitive to tension perpendicular to the grain. Indeed, the characteristic resistance is really low ( MPaf kt 45,0,90, = for GL32). A force applied on a member with an angle to the grain can involve splitting and drive the structure to the failure. When it is not possible to avoid it, it is necessary to check the risk of splitting.
Eurocode 5 proposes a criterion to check the splitting when a member is tensioned at an angle to the grain.
CHALMERS, Structural Engineering and Mechanics, Master’s Thesis 2005:103 76

2005:103 77
b
FV,ed1
α
he
Splitting
FV,ed2
Fed
Figure 5.23 Risk of splitting in a joint, Eurocode 5 Figure 5.23 Risk of splitting in a joint, Eurocode 5
The component The component αsin⋅edF produces splitting of the beam. It has to be checked that the depth he is sufficient to avoid splitting. That means that the distance between the loaded edge and the last fastener is determinant for the splitting.
The resistance is calculated as following:
)/1(14,,90 hh
hwbF
e
ekR −
⋅⋅⋅= with w = dowel type fastener (5.7)
M
kRdR
kFF
γmod,,90
,,90
.= (5.8)
The resistance has to be greater than:
2,
1,maxedV
edV
FF
In the case of the trussed arch, the splitting of the chords is checked for all load combinations. The shear forces in the chords FV,ed1 and FV,ed2 can easily be found in the results of the Finite Element computation. Table 5.7 shows the maximum shear forces for the different load cases.
Table 5.8 Maximum shear forces in the chords of the trussed arch
Load combination
FV,ed1
(kN) FV,ed2
(kN) At node
See Fig5.22 1 209 145 13 or 19 2 140 188 19 3 38 27 5 4 53 33 3 5 120 160 19 6 130 175 19
CHALMERS, Structural Engineering and Mechanics, Master’s Thesis
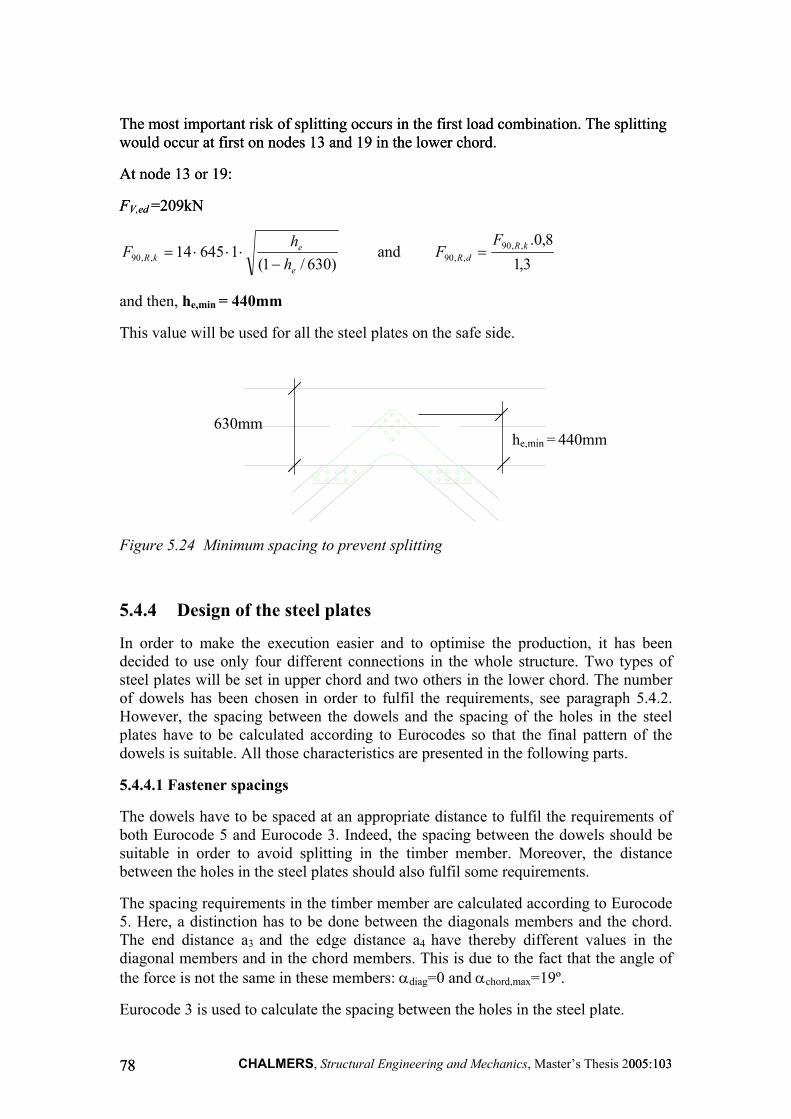
The most important risk of splitting occurs in the first load combination. The splitting would occur at first on nodes 13 and 19 in the lower chord. The most important risk of splitting occurs in the first load combination. The splitting would occur at first on nodes 13 and 19 in the lower chord.
At node 13 or 19: At node 13 or 19:
FV,ed =209kN FV,ed =209kN
)630/1(164514,,90
e
ekR h
hF
−⋅⋅⋅= and
3,18,0.,,90
,,90kR
dR
FF =
and then, he,min = 440mm
This value will be used for all the steel plates on the safe side.
is 2005:103 005:103 7878
630mm he,min = 440mm
Figure 5.24 Minimum spacing to prevent splitting
5.4.4 Design of the steel plates
In order to make the execution easier and to optimise the production, it has been decided to use only four different connections in the whole structure. Two types of steel plates will be set in upper chord and two others in the lower chord. The number of dowels has been chosen in order to fulfil the requirements, see paragraph 5.4.2. However, the spacing between the dowels and the spacing of the holes in the steel plates have to be calculated according to Eurocodes so that the final pattern of the dowels is suitable. All those characteristics are presented in the following parts.
5.4.4.1 Fastener spacings
The dowels have to be spaced at an appropriate distance to fulfil the requirements of both Eurocode 5 and Eurocode 3. Indeed, the spacing between the dowels should be suitable in order to avoid splitting in the timber member. Moreover, the distance between the holes in the steel plates should also fulfil some requirements.
The spacing requirements in the timber member are calculated according to Eurocode 5. Here, a distinction has to be done between the diagonals members and the chord. The end distance a3 and the edge distance a4 have thereby different values in the diagonal members and in the chord members. This is due to the fact that the angle of the force is not the same in these members: αdiag=0 and αchord,max=19º.
Eurocode 3 is used to calculate the spacing between the holes in the steel plate.
CHALMERS, Structural Engineering and Mechanics, Master’s Thes

Figure 5.25 Definition of the distance in the diagonals
Table 5.9 Minimum spacings and distances for dowels in the diagonals αdiag=0, according to Eurocode 5.
a1 Parallel to the grain (3+2.cosα).d 60mm a2 Perpendicular to
the grain 3.d 36mm
a3,t a3,c
αdiag=0 max(7.d ;80mm) max (a3,t.sinα.d ; 3.d)
84mm 36mm
a4,t a 4,c
αdiag=0 max ((2+2sinα).d ; 3.d) 3d
36mm 36mm
Figure 5.26 Definition of the distance in the chord
CHALMERS, Structural Engineering and Mechanics, Master’s Thesis 2005:103 005:103 7979

Table 5.10 Minimum spacings and distances for dowels in the chord αchord,max=19, according to EC5.
a1 Parallel to the grain (3+2.cosα).d 60mm a2 Perpendicular to the grain 3.d 36mm a4,t a 4,c
αchord,max=19 max ((2+2sinα).d ; 3.d) 3d
36mm 36mm
Compared to the spacing requirements between the holes in the plate, the values given in Table 5.8 are much higher. This is due to the higher strength of the steel.
However, the end distance and the edge distance in the steel plate still have to be determined:
Minimum end distance: mmemmted 726,154402,1 110 ≤≤⇒×+≤≤×
Minimum edge distance: mmemmted 1505,1944025,1 20 ≤≤⇒×+≤≤×
In the final design of the connection, the following distance were used:
a1 = 100mm - a3,t = 86mm - a4 = 50mm - = 50mm - = 50mm 1e 2e
The different connections and their location are presented in Table 5.11.
Table 5.11 Four connection types used in the arch.
UP1: 21 dowels in the chord 14 dowels in the diagonals
UP2: 9 dowels in the chord 8 dowels in the diagonals
LO1: 21 dowels in the chord 14 dowels in the diagonals
LO2: 13 dowels in the chord 8 dowels in the diagonals
CHALMERS, Structural Engineering and Mechanics, Master’s Thesis 2005:103 80
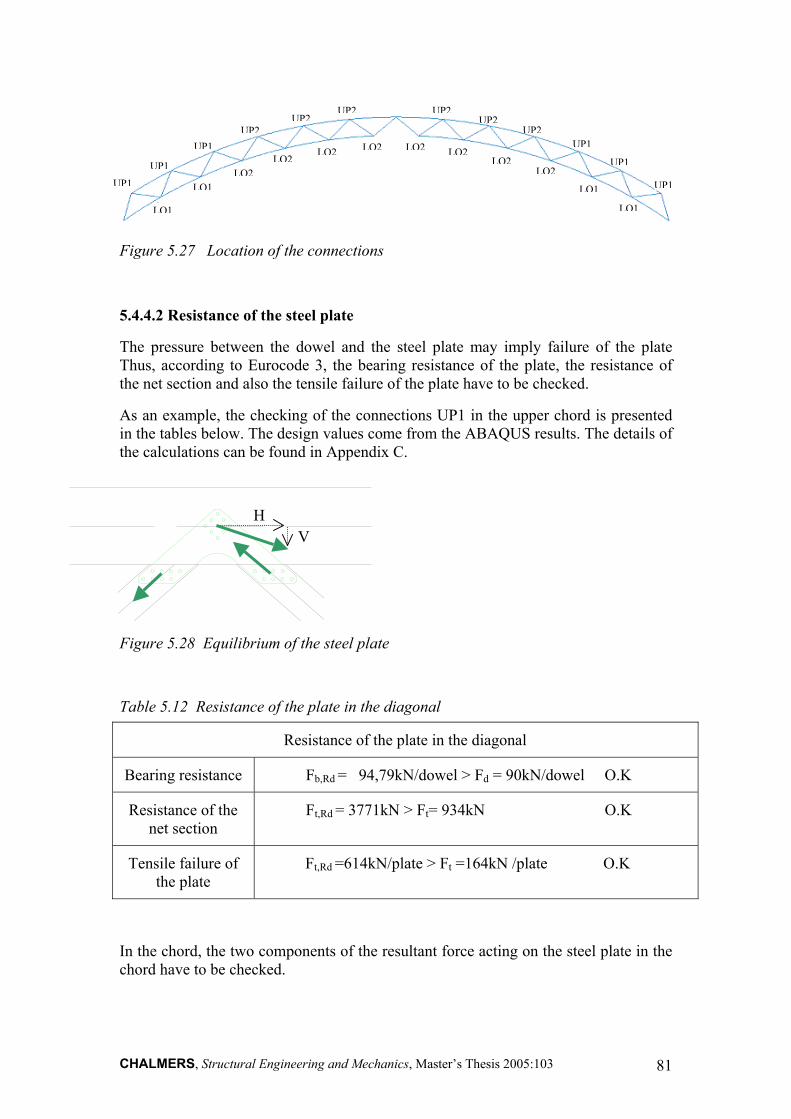
UP2 UP2UP2 UP2
UP2UP2UP1UP1 LO2 LO2LO2 LO2
LO2 LO2 UP1UP1 LO2LO2UP1 UP1LO1 LO1
LO1LO1
Figure 5.27 Location of the connections
5.4.4.2 Resistance of the steel plate
The pressure between the dowel and the steel plate may imply failure of the plate Thus, according to Eurocode 3, the bearing resistance of the plate, the resistance of the net section and also the tensile failure of the plate have to be checked.
As an example, the checking of the connections UP1 in the upper chord is presented in the tables below. The design values come from the ABAQUS results. The details of the calculations can be found in Appendix C.
2005:103 81
H V
Figure 5.28 Equilibrium of the steel plate
Table 5.12 Resistance of the plate in the diagonal
Resistance of the plate in the diagonal
Bearing resistance Fb,Rd = 94,79kN/dowel > Fd = 90kN/dowel O.K
Resistance of the net section
Ft,Rd = 3771kN > Ft= 934kN O.K
Tensile failure of the plate
Ft,Rd =614kN/plate > Ft =164kN /plate O.K
In the chord, the two components of the resultant force acting on the steel plate in the chord have to be checked.
CHALMERS, Structural Engineering and Mechanics, Master’s Thesis
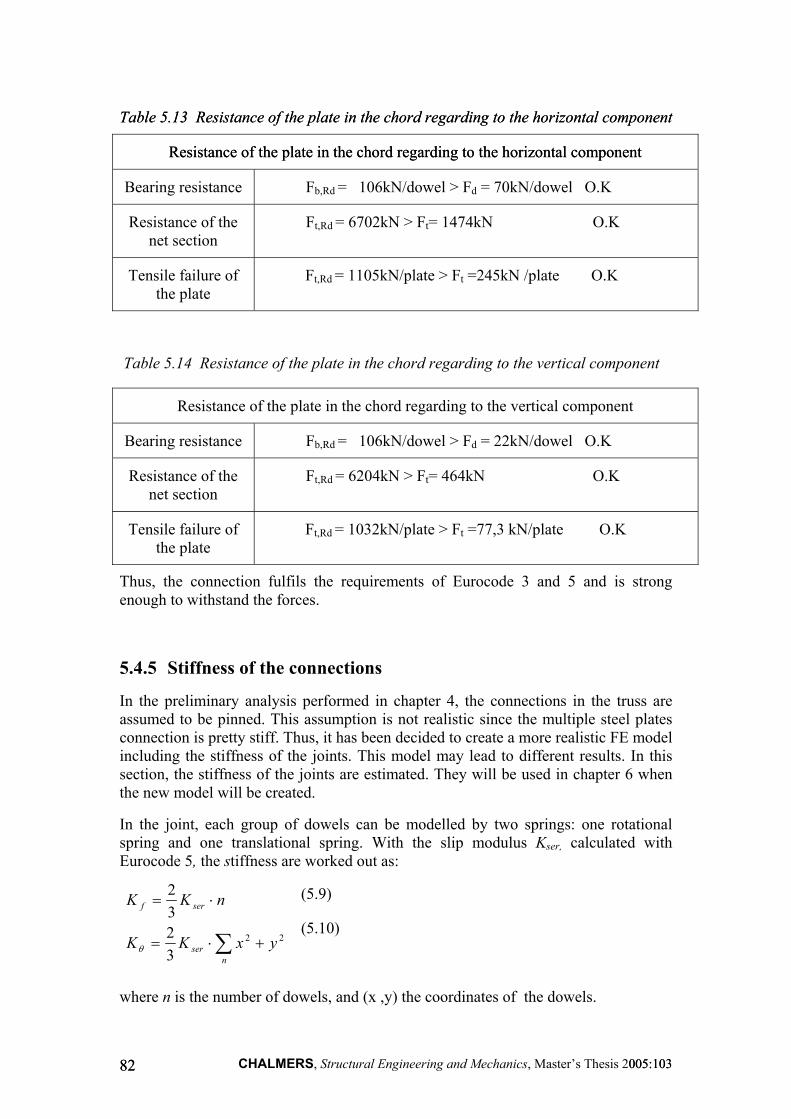
Table 5.13 Resistance of the plate in the chord regarding to the horizontal component Table 5.13 Resistance of the plate in the chord regarding to the horizontal component
Resistance of the plate in the chord regarding to the horizontal component Resistance of the plate in the chord regarding to the horizontal component
Bearing resistance Fb,Rd = 106kN/dowel > Fd = 70kN/dowel O.K
Resistance of the net section
Ft,Rd = 6702kN > Ft= 1474kN O.K
Tensile failure of the plate
Ft,Rd = 1105kN/plate > Ft =245kN /plate O.K
Table 5.14 Resistance of the plate in the chord regarding to the vertical component
Resistance of the plate in the chord regarding to the vertical component
Bearing resistance Fb,Rd = 106kN/dowel > Fd = 22kN/dowel O.K
Resistance of the net section
Ft,Rd = 6204kN > Ft= 464kN O.K
Tensile failure of the plate
Ft,Rd = 1032kN/plate > Ft =77,3 kN/plate O.K
Thus, the connection fulfils the requirements of Eurocode 3 and 5 and is strong enough to withstand the forces.
5.4.5 Stiffness of the connections
In the preliminary analysis performed in chapter 4, the connections in the truss are assumed to be pinned. This assumption is not realistic since the multiple steel plates connection is pretty stiff. Thus, it has been decided to create a more realistic FE model including the stiffness of the joints. This model may lead to different results. In this section, the stiffness of the joints are estimated. They will be used in chapter 6 when the new model will be created.
In the joint, each group of dowels can be modelled by two springs: one rotational spring and one translational spring. With the slip modulus Kser, calculated with Eurocode 5, the stiffness are worked out as:
∑ +⋅=
⋅=
nser
serf
yxKK
nKK
22
3232
θ
(5.9)
(5.10)
where n is the number of dowels, and (x ,y) the coordinates of the dowels.
CHALMERS, Structural Engineering and Mechanics, Master’s Thesis 2005:103 005:103 8282
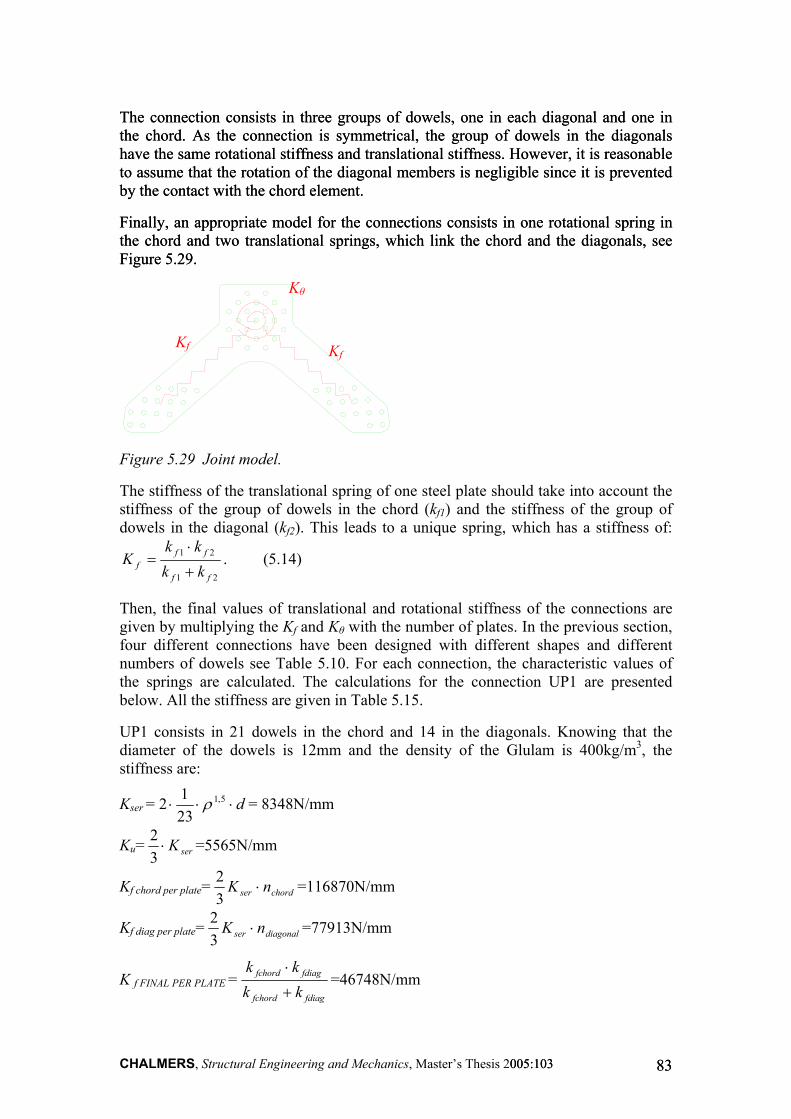
The connection consists in three groups of dowels, one in each diagonal and one in the chord. As the connection is symmetrical, the group of dowels in the diagonals have the same rotational stiffness and translational stiffness. However, it is reasonable to assume that the rotation of the diagonal members is negligible since it is prevented by the contact with the chord element.
The connection consists in three groups of dowels, one in each diagonal and one in the chord. As the connection is symmetrical, the group of dowels in the diagonals have the same rotational stiffness and translational stiffness. However, it is reasonable to assume that the rotation of the diagonal members is negligible since it is prevented by the contact with the chord element.
Finally, an appropriate model for the connections consists in one rotational spring in the chord and two translational springs, which link the chord and the diagonals, see Figure 5.29.
Finally, an appropriate model for the connections consists in one rotational spring in the chord and two translational springs, which link the chord and the diagonals, see Figure 5.29.
Kθ
Kf Kf
Figure 5.29 Joint model.
The stiffness of the translational spring of one steel plate should take into account the stiffness of the group of dowels in the chord (kf1) and the stiffness of the group of dowels in the diagonal (kf2). This leads to a unique spring, which has a stiffness of:
21
21
ff
fff kk
kkK
+
⋅= . (5.14)
Then, the final values of translational and rotational stiffness of the connections are given by multiplying the Kf and Kθ with the number of plates. In the previous section, four different connections have been designed with different shapes and different numbers of dowels see Table 5.10. For each connection, the characteristic values of the springs are calculated. The calculations for the connection UP1 are presented below. All the stiffness are given in Table 5.15.
UP1 consists in 21 dowels in the chord and 14 in the diagonals. Knowing that the diameter of the dowels is 12mm and the density of the Glulam is 400kg/m3, the stiffness are:
Kser = d⋅⋅⋅ 5,1
2312 ρ = 8348N/mm
Ku= serK⋅32 =5565N/mm
Kf chord per plate= chordser nK ⋅32 =116870N/mm
Kf diag per plate= diagonalser nK ⋅32 =77913N/mm
K f FINAL PER PLATE =fdiagfchord
fdiagfchord
kkkk
+
⋅=46748N/mm
CHALMERS, Structural Engineering and Mechanics, Master’s Thesis 2005:103 005:103 8383
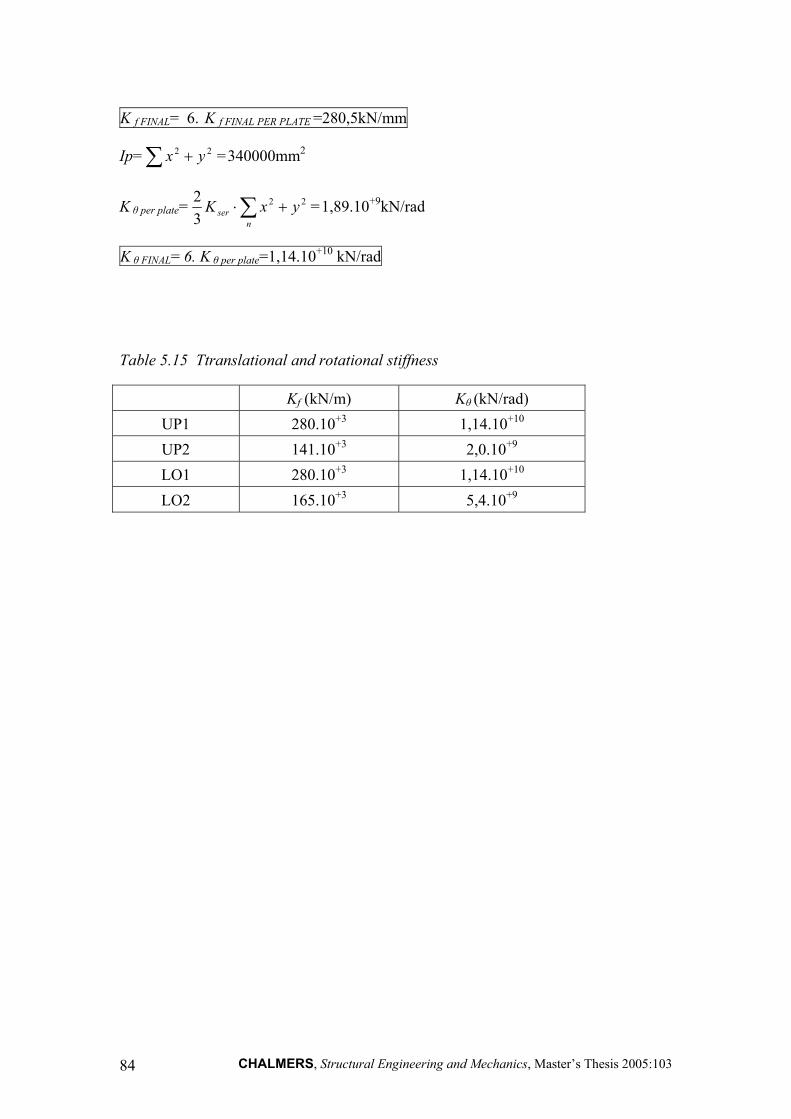
K f FINAL= K .6 f FINAL PER PLATE =280,5kN/mm
Ip=∑ =340000mm+ 22 yx 2
K θ per plate= ∑ +⋅n
ser yxK 22
32 =1,89.10+9kN/rad
K θ FINAL= 6. K θ per plate=1,14.10+10 kN/rad
Table 5.15 Ttranslational and rotational stiffness
Kf (kN/m) Kθ (kN/rad) UP1 280.10+3 1,14.10+10 UP2 141.10+3 2,0.10+9 LO1 280.10+3 1,14.10+10 LO2 165.10+3 5,4.10+9
CHALMERS, Structural Engineering and Mechanics, Master’s Thesis 2005:103 84
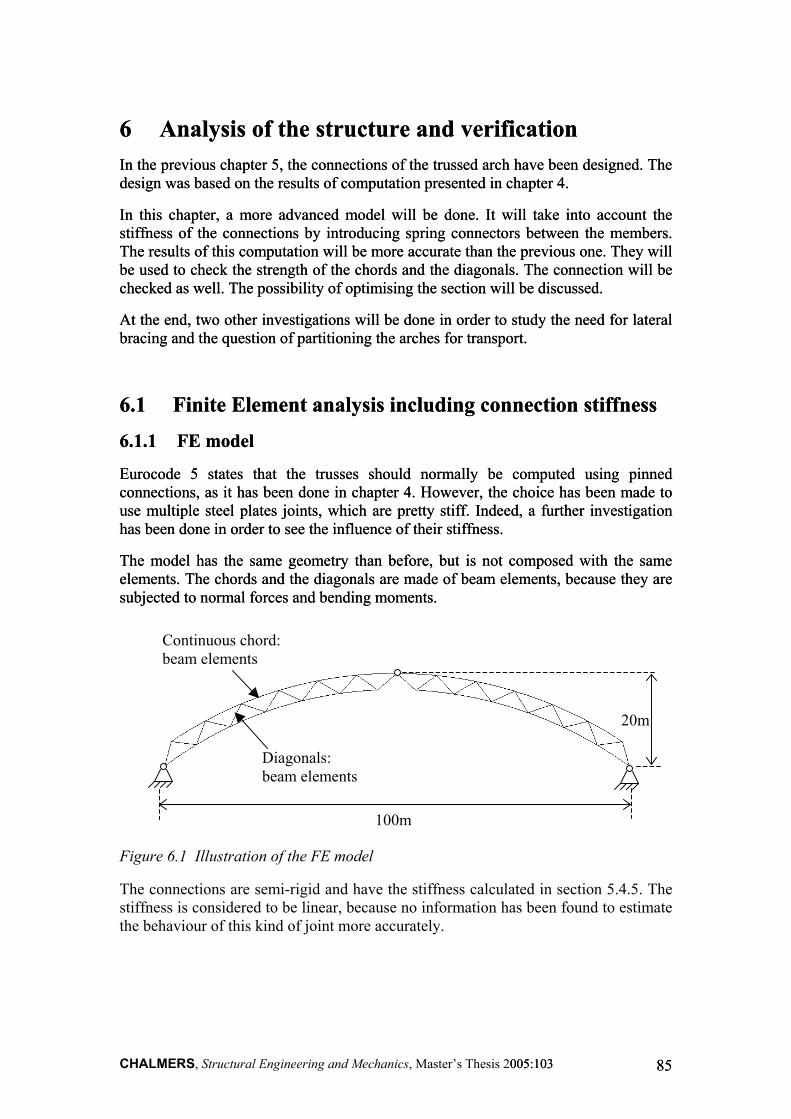
6 Analysis of the structure and verification 6 Analysis of the structure and verification In the previous chapter 5, the connections of the trussed arch have beedesign was based on the results of computation presented in chapter 4.In the previous chapter 5, the connections of the trussed arch have beedesign was based on the results of computation presented in chapter 4.
In this chapter, a more advanced model will be done. It will take istiffness of the connections by introducing spring connectors betweeThe results of this computation will be more accurate than the previoube used to check the strength of the chords and the diagonals. The cochecked as well. The possibility of optimising the section will be discu
In this chapter, a more advanced model will be done. It will take istiffness of the connections by introducing spring connectors betweeThe results of this computation will be more accurate than the previoube used to check the strength of the chords and the diagonals. The cochecked as well. The possibility of optimising the section will be discu
At the end, two other investigations will be done in order to study thebracing and the question of partitioning the arches for transport. At the end, two other investigations will be done in order to study thebracing and the question of partitioning the arches for transport.
6.1 Finite Element analysis including connection6.1 Finite Element analysis including connection
6.1.1 FE model 6.1.1 FE model
Eurocode 5 states that the trusses should normally be computeconnections, as it has been done in chapter 4. However, the choice huse multiple steel plates joints, which are pretty stiff. Indeed, a furthhas been done in order to see the influence of their stiffness.
Eurocode 5 states that the trusses should normally be computeconnections, as it has been done in chapter 4. However, the choice huse multiple steel plates joints, which are pretty stiff. Indeed, a furthhas been done in order to see the influence of their stiffness.
The model has the same geometry than before, but is not composedelements. The chords and the diagonals are made of beam elements, bsubjected to normal forces and bending moments.
The model has the same geometry than before, but is not composedelements. The chords and the diagonals are made of beam elements, bsubjected to normal forces and bending moments.
100m
Diagonals: beam elements
Continuous chord: beam elements
Figure 6.1 Illustration of the FE model
The connections are semi-rigid and have the stiffness calculated in sestiffness is considered to be linear, because no information has been fothe behaviour of this kind of joint more accurately.
CHALMERS, Structural Engineering and Mechanics, Master’s Thesis 2005:103 005:103
n designed. The n designed. The
nto account the n the members. s one. They will nnection will be ssed.
nto account the n the members. s one. They will nnection will be ssed.
need for lateral need for lateral
stiffness stiffness
d using pinned as been made to er investigation
d using pinned as been made to er investigation
with the same ecause they are with the same ecause they are
20m
ction 5.4.5. The und to estimate
8585
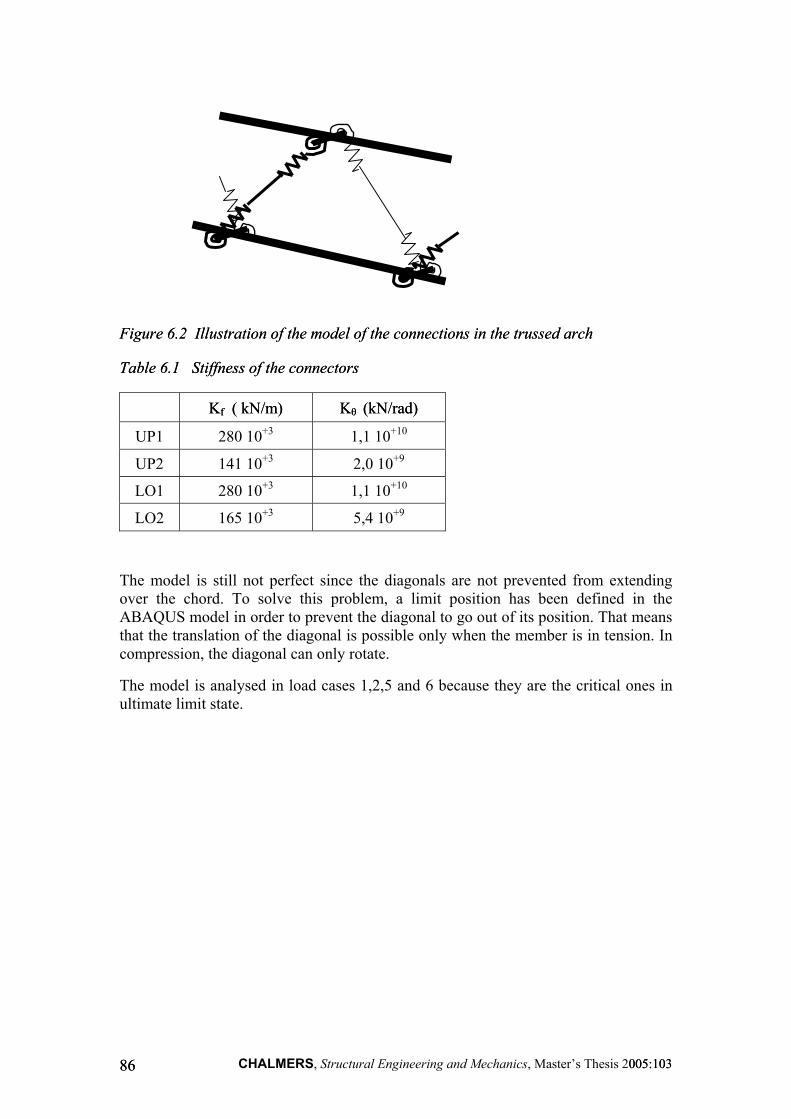
Figure 6.2 Illustration of the model of the connections in the trussed arch Figure 6.2 Illustration of the model of the connections in the trussed arch
Table 6.1 Stiffness of the connectors Table 6.1 Stiffness of the connectors
Kf ( kN/m) K Kθ (kN/rad) Kf ( kN/m) θ (kN/rad)
UP1 280 10+3 1,1 10+10
UP2 141 10+3 2,0 10+9
LO1 280 10+3 1,1 10+10
LO2 165 10+3 5,4 10+9
The model is still not perfect since the diagonals are not prevented from extending over the chord. To solve this problem, a limit position has been defined in the ABAQUS model in order to prevent the diagonal to go out of its position. That means that the translation of the diagonal is possible only when the member is in tension. In compression, the diagonal can only rotate.
The model is analysed in load cases 1,2,5 and 6 because they are the critical ones in ultimate limit state.
CHALMERS, Structural Engineering and Mechanics, Master’s Thesis 2005:103 005:103 8686
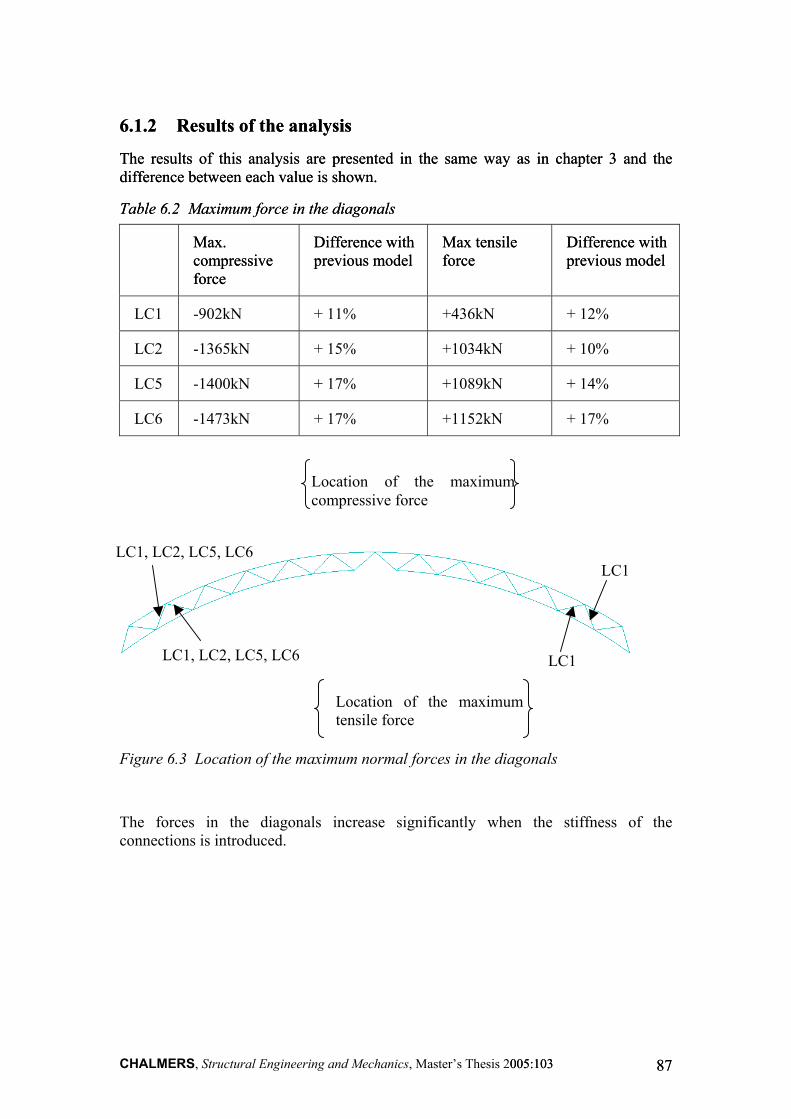
6.1.2 Results of the analysis 6.1.2 Results of the analysis
The results of this analysis are presented in the same way as in chdifference between each value is shown. The results of this analysis are presented in the same way as in chdifference between each value is shown.
Table 6.2 Maximum force in the diagonals Table 6.2 Maximum force in the diagonals
Max. compressive force
Max. compressive force
Difference with previous model Difference with previous model
Max tensile force Max tensile force
DpDp
LC1 -902kN + 11% +436kN +
LC2 -1365kN + 15% +1034kN +
LC5 -1400kN + 17% +1089kN +
LC6 -1473kN + 17% +1152kN +
2005:103 005:103
LC1, LC2, LC5, LC6
Location of the maximumcompressive force
Location of the maximum tensile force
LC1, LC2, LC5, LC6
LC
Figure 6.3 Location of the maximum normal forces in the diagonals
The forces in the diagonals increase significantly when the sconnections is introduced.
CHALMERS, Structural Engineering and Mechanics, Master’s Thesis
apter 3 and the apter 3 and the
ifference with revious model ifference with revious model
12%
10%
14%
17%
8787
LC1
1
tiffness of the
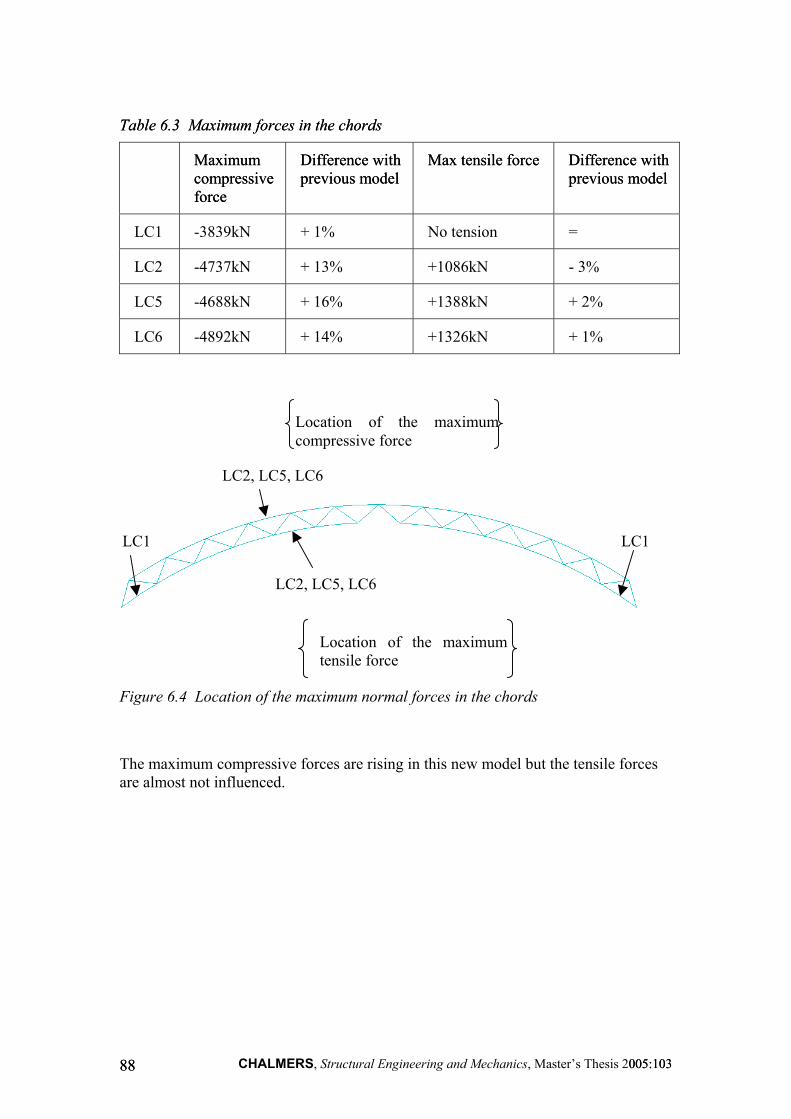
Table 6.3 Maximum forces in the chords Table 6.3 Maximum forces in the chords
Maximum compressive force
Maximum compressive force
Difference with previous model Difference with previous model
Max tensile force Max tensile force
LC1 -3839kN + 1% No tension
LC2 -4737kN + 13% +1086kN
LC5 -4688kN + 16% +1388kN
LC6 -4892kN + 14% +1326kN
8888
Location of the maximumcompressive force
LC2, LC5, LC6
LC2, LC5, LC6
Location of the maximumtensile force
LC1
Figure 6.4 Location of the maximum normal forces in the chords
The maximum compressive forces are rising in this new model but theare almost not influenced.
CHALMERS, Structural Engineering and Mechanics, Maste
Difference with previous model Difference with previous model
=
- 3%
+ 2%
+ 1%
is 2005:103 005:103
LC1
tensile forces
r’s Thes
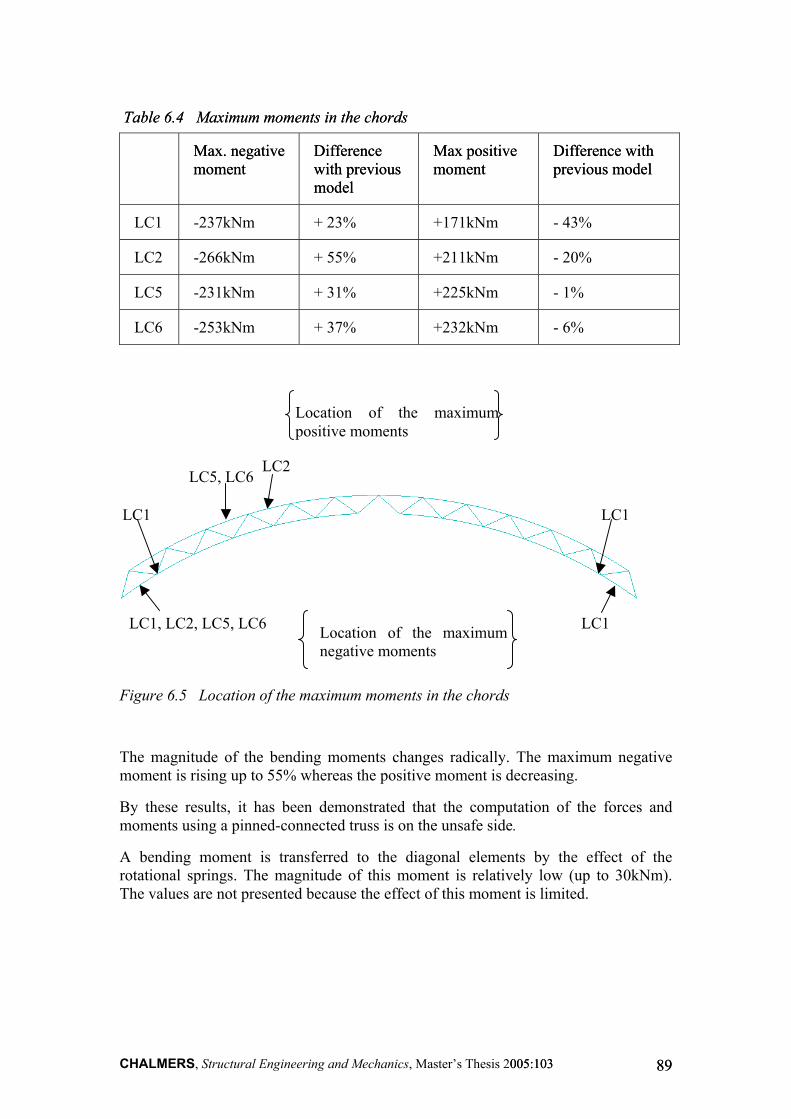
Table 6.4 Maximum moments in the chords Table 6.4 Maximum moments in the chords
Max. negative moment Max. negative moment
Difference with previous model
Difference with previous model
Max positive moment Max positive moment
DipreDipre
LC1 -237kNm + 23% +171kNm - 4
LC2 -266kNm + 55% +211kNm - 2
LC5 -231kNm + 31% +225kNm - 1
LC6 -253kNm + 37% +232kNm - 6
2005:103 005:103
LC1, LC2, LC5, LC6
Location of the maximumpositive moments
LC2
Location of the maximumnegative moments
LC1
LC5, LC6
Figure 6.5 Location of the maximum moments in the chords The magnitude of the bending moments changes radically. The mamoment is rising up to 55% whereas the positive moment is decreasing
By these results, it has been demonstrated that the computation ofmoments using a pinned-connected truss is on the unsafe side.
A bending moment is transferred to the diagonal elements by throtational springs. The magnitude of this moment is relatively low The values are not presented because the effect of this moment is limit
CHALMERS, Structural Engineering and Mechanics, Master’s Thesis
fference with vious model
fference with vious model
3%
0%
%
%
8989
LC1
LC1
ximum negative .
the forces and
e effect of the (up to 30kNm). ed.
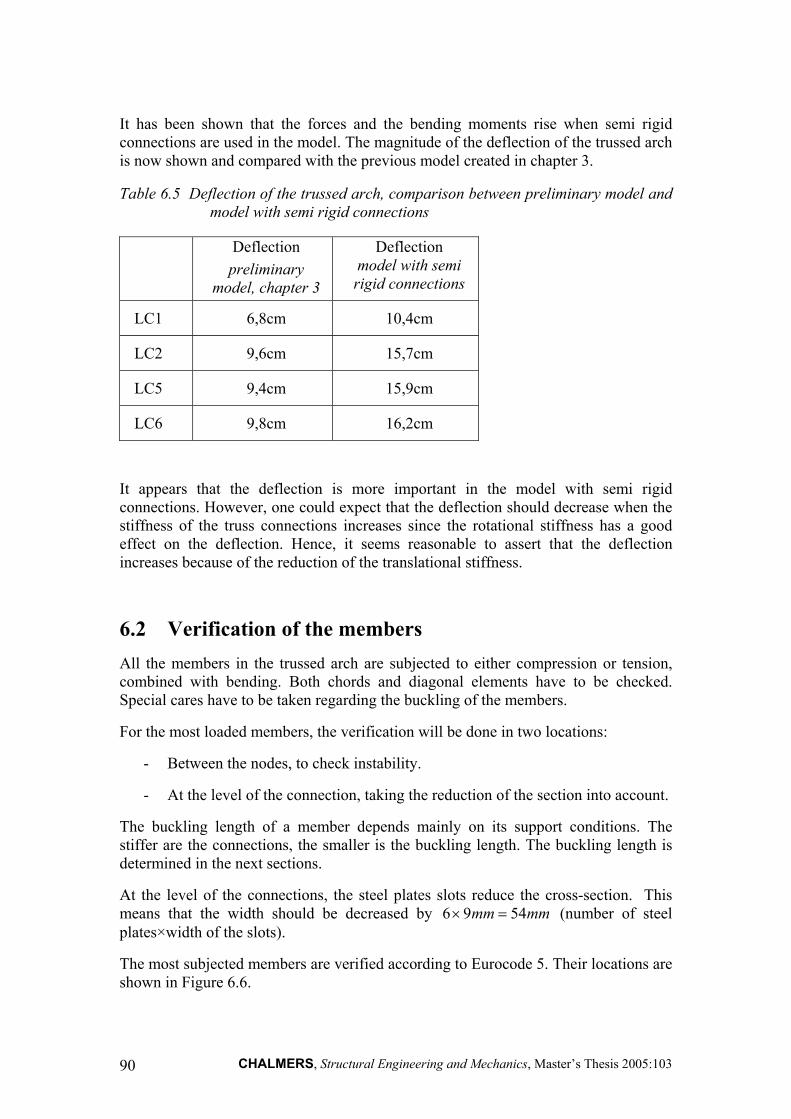
It has been shown that the forces and the bending moments rise when semi rigid connections are used in the model. The magnitude of the deflection of the trussed arch is now shown and compared with the previous model created in chapter 3.
Table 6.5 Deflection of the trussed arch, comparison between preliminary model and model with semi rigid connections
Deflection preliminary
model, chapter 3
Deflection model with semi rigid connections
LC1 6,8cm 10,4cm
LC2 9,6cm 15,7cm
LC5 9,4cm 15,9cm
LC6 9,8cm 16,2cm
It appears that the deflection is more important in the model with semi rigid connections. However, one could expect that the deflection should decrease when the stiffness of the truss connections increases since the rotational stiffness has a good effect on the deflection. Hence, it seems reasonable to assert that the deflection increases because of the reduction of the translational stiffness.
6.2 Verification of the members All the members in the trussed arch are subjected to either compression or tension, combined with bending. Both chords and diagonal elements have to be checked. Special cares have to be taken regarding the buckling of the members.
For the most loaded members, the verification will be done in two locations:
- Between the nodes, to check instability.
- At the level of the connection, taking the reduction of the section into account.
The buckling length of a member depends mainly on its support conditions. The stiffer are the connections, the smaller is the buckling length. The buckling length is determined in the next sections.
At the level of the connections, the steel plates slots reduce the cross-section. This means that the width should be decreased by 6 mmmm 549 =× (number of steel plates×width of the slots).
The most subjected members are verified according to Eurocode 5. Their locations are shown in Figure 6.6.
CHALMERS, Structural Engineering and Mechanics, Master’s Thesis 2005:103 90
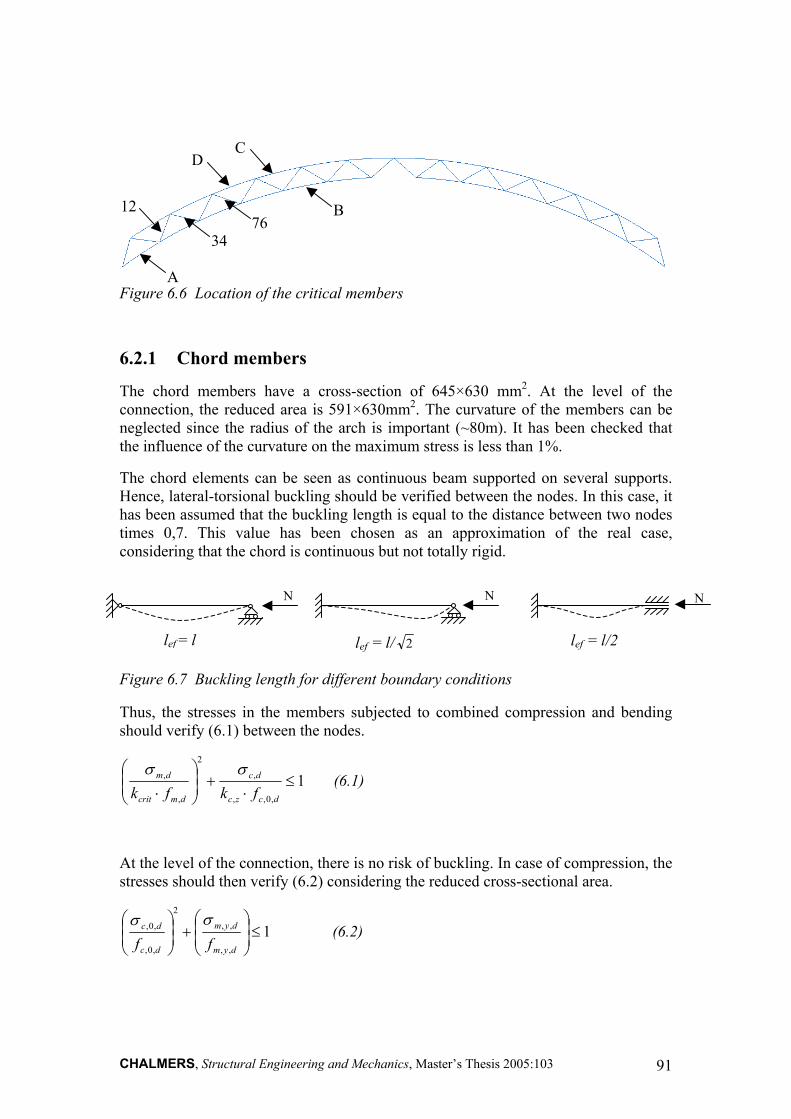
C
A
B
D
12 76
34
Figure 6.6 Location of the critical members
6.2.1 Chord members
The chord members have a cross-section of 645×630 mm2. At the level of the connection, the reduced area is 591×630mm2. The curvature of the members can be neglected since the radius of the arch is important (~80m). It has been checked that the influence of the curvature on the maximum stress is less than 1%.
The chord elements can be seen as continuous beam supported on several supports. Hence, lateral-torsional buckling should be verified between the nodes. In this case, it has been assumed that the buckling length is equal to the distance between two nodes times 0,7. This value has been chosen as an approximation of the real case, considering that the chord is continuous but not totally rigid.
N
lef = l
N N
lef = l/2 lef = l/ 2
Figure 6.7 Buckling length for different boundary conditions
Thus, the stresses in the members subjected to combined compression and bending should verify (6.1) between the nodes.
1,0,,
,
2
,
, ≤⋅
+
⋅ dczc
dc
dmcrit
dm
fkfkσσ
(6.1)
At the level of the connection, there is no risk of buckling. In case of compression, the stresses should then verify (6.2) considering the reduced cross-sectional area.
1,,
,,
2
,0,
,0, ≤
+
dym
dym
dc
dc
ffσσ
(6.2)
CHALMERS, Structural Engineering and Mechanics, Master’s Thesis 2005:103 91
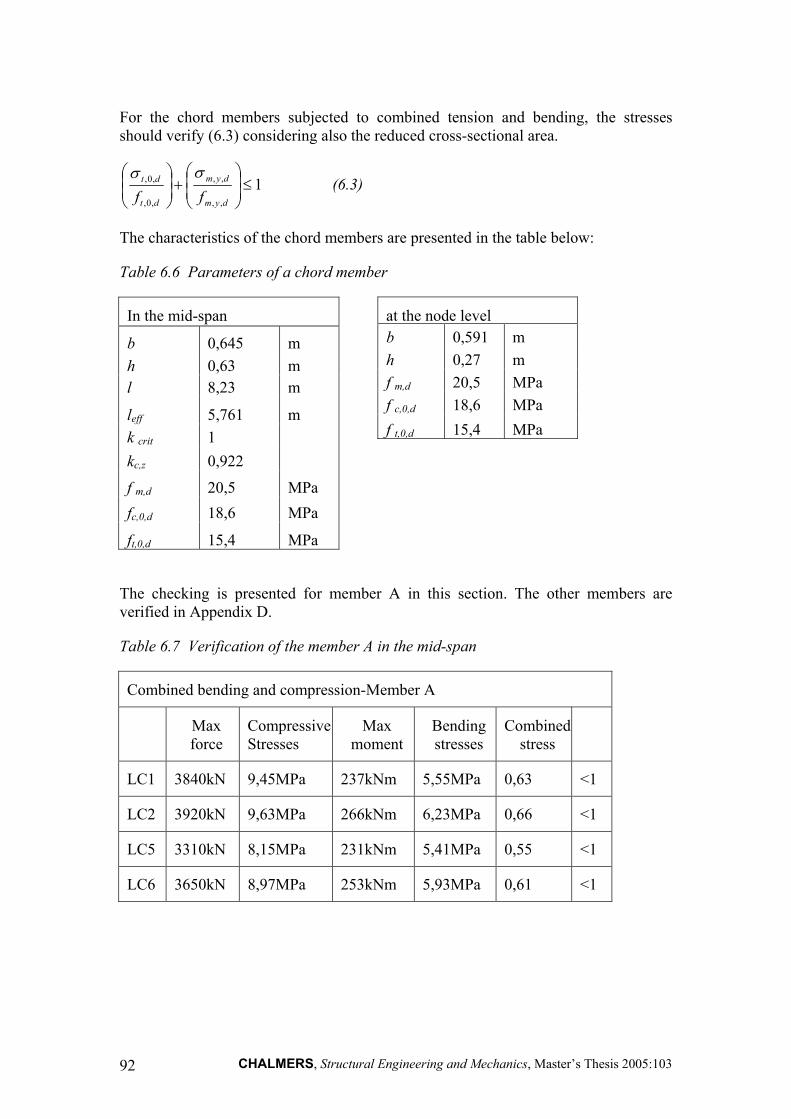
For the chord members subjected to combined tension and bending, the stresses should verify (6.3) considering also the reduced cross-sectional area.
1,,
,,
,0,
,0, ≤
+
dym
dym
dt
dt
ffσσ
(6.3)
The characteristics of the chord members are presented in the table below:
Table 6.6 Parameters of a chord member
at the node levelb 0,591 m h 0,27 m f m,d 20,5 MPa f c,0,d 18,6 MPa f t,0,d 15,4 MPa
is 2005:103 92
In the mid-span
b 0,645 m h 0,63 m l 8,23 m
leff 5,761 m k crit 1 kc,z 0,922
f m,d 20,5 MPa fc,0,d 18,6 MPa
ft,0,d 15,4 MPa
The checking is presented for member A in this section. The other members are verified in Appendix D.
Table 6.7 Verification of the member A in the mid-span
Combined bending and compression-Member A
Max force
Compressive Stresses
Max moment
Bending stresses
Combined stress
LC1 3840kN 9,45MPa 237kNm 5,55MPa 0,63 <1
LC2 3920kN 9,63MPa 266kNm 6,23MPa 0,66 <1
LC5 3310kN 8,15MPa 231kNm 5,41MPa 0,55 <1
LC6 3650kN 8,97MPa 253kNm 5,93MPa 0,61 <1
CHALMERS, Structural Engineering and Mechanics, Master’s Thes
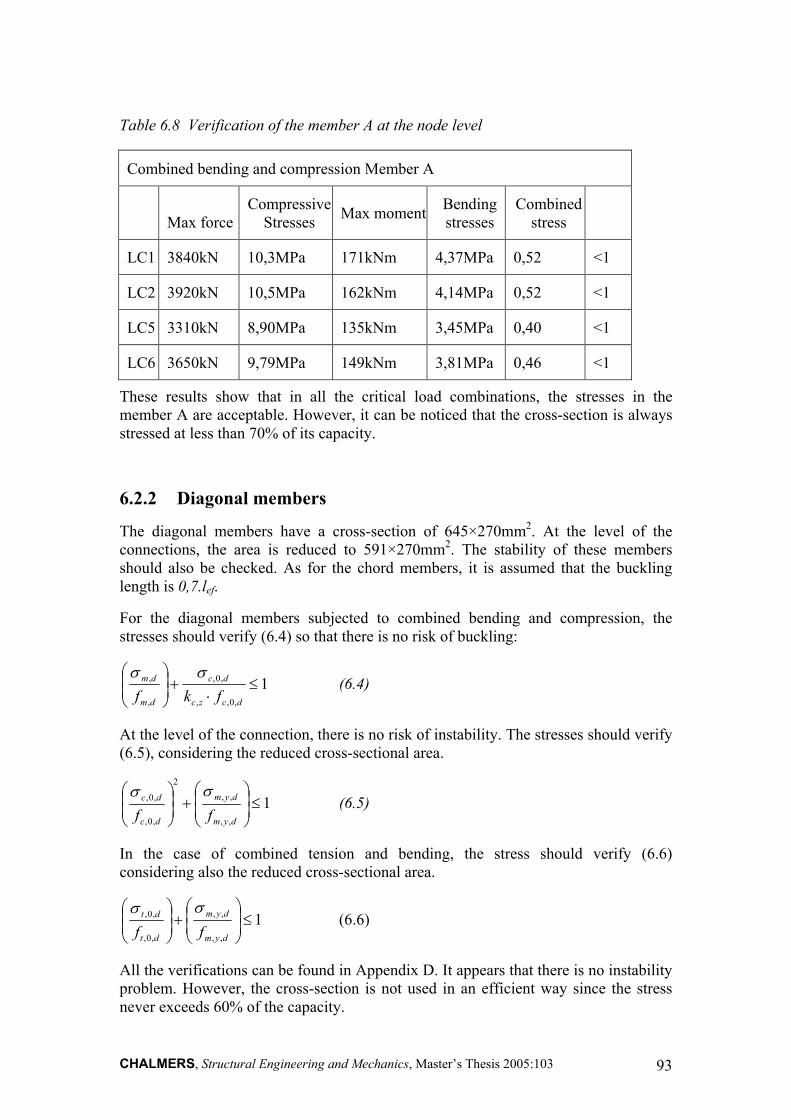
Table 6.8 Verification of the member A at the node level
Combined bending and compression Member A
Max forceCompressive
Stresses Max moment Bending stresses
Combined stress
LC1 3840kN 10,3MPa 171kNm 4,37MPa 0,52 <1
LC2 3920kN 10,5MPa 162kNm 4,14MPa 0,52 <1
LC5 3310kN 8,90MPa 135kNm 3,45MPa 0,40 <1
LC6 3650kN 9,79MPa 149kNm 3,81MPa 0,46 <1
These results show that in all the critical load combinations, the stresses in the member A are acceptable. However, it can be noticed that the cross-section is always stressed at less than 70% of its capacity.
6.2.2 Diagonal members
The diagonal members have a cross-section of 645×270mm2. At the level of the connections, the area is reduced to 591×270mm2. The stability of these members should also be checked. As for the chord members, it is assumed that the buckling length is 0,7.lef.
For the diagonal members subjected to combined bending and compression, the stresses should verify (6.4) so that there is no risk of buckling:
1,0,,
,0,
,
, ≤⋅
+
dczc
dc
dm
dm
fkfσσ
(6.4)
At the level of the connection, there is no risk of instability. The stresses should verify (6.5), considering the reduced cross-sectional area.
1,,
,,
2
,0,
,0, ≤
+
dym
dym
dc
dc
ffσσ
(6.5)
In the case of combined tension and bending, the stress should verify (6.6) considering also the reduced cross-sectional area.
1,,
,,
,0,
,0, ≤
+
dym
dym
dt
dt
ffσσ
(6.6)
All the verifications can be found in Appendix D. It appears that there is no instability problem. However, the cross-section is not used in an efficient way since the stress never exceeds 60% of the capacity.
CHALMERS, Structural Engineering and Mechanics, Master’s Thesis 2005:103 93

6.3 Verification of the connections The magnitude of the forces in the diagonals being more important, the connections have to be checked again taking into account this rise. The same method as in the chapter 5 is used to calculate the required number of dowels. The results are presented in the tables before, showing the differences with the previous stage.
Table 6.9 New estimation of the necessary number of dowels between the steel plates and the diagonal members
Required number of dowels
Node nb
With new model
Previous stage
Difference
1 10,4 9,5 +9 % 12 14,9 12,7 +17 % 23 11,8 10,4 +13 % 34 11,6 10,0 +16 % 55 12,1 10,2 +18 % 76 7,9 7,0 +12 % 87 7,3 6,4 +13 % 98 7,7 4,9 +57 % 109 3,7 3,7 0 % 110 4,9 4,9 0 % 111 5,3 5,1 +3 % 122 3,2 3,1 +3 % 123 4,3 4,1 +4 %
Figure 6.8 Numbering of the diagonals on the arch
CHALMERS, Structural Engineering and Mechanics, Master’s Thesis 2005:103 94
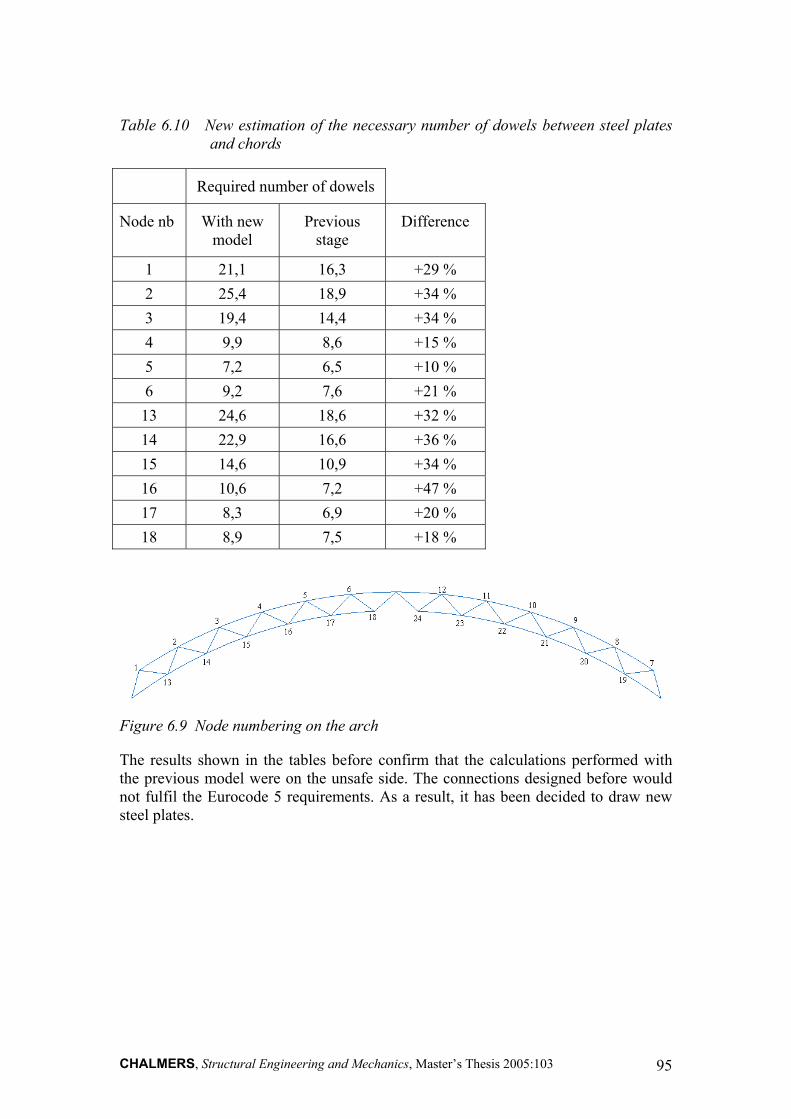
Table 6.10 New estimation of the necessary number of dowels between steel plates and chords
Required number of dowels
Node nb With new model
Previous stage
Difference
1 21,1 16,3 +29 % 2 25,4 18,9 +34 % 3 19,4 14,4 +34 % 4 9,9 8,6 +15 % 5 7,2 6,5 +10 % 6 9,2 7,6 +21 % 13 24,6 18,6 +32 % 14 22,9 16,6 +36 % 15 14,6 10,9 +34 % 16 10,6 7,2 +47 % 17 8,3 6,9 +20 % 18 8,9 7,5 +18 %
Figure 6.9 Node numbering on the arch
The results shown in the tables before confirm that the calculations performed with the previous model were on the unsafe side. The connections designed before would not fulfil the Eurocode 5 requirements. As a result, it has been decided to draw new steel plates.
CHALMERS, Structural Engineering and Mechanics, Master’s Thesis 2005:103 95
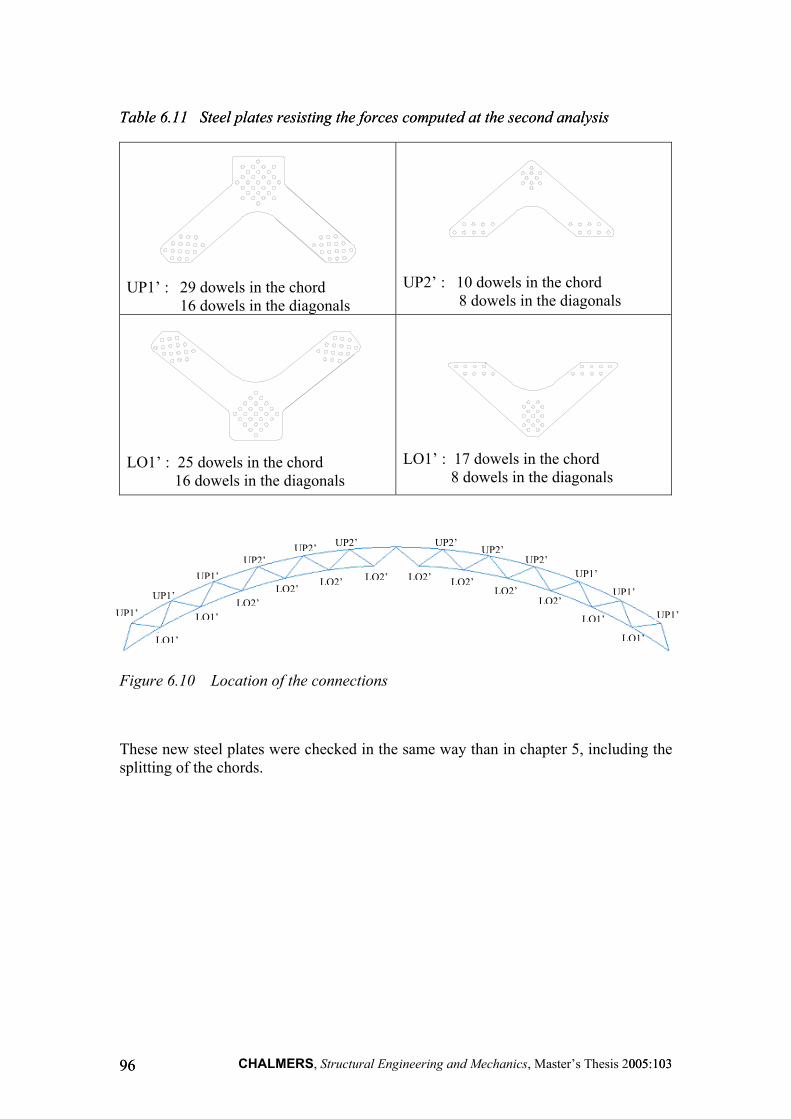
Table 6.11 Steel plates resisting the forces computed at the second analysis Table 6.11 Steel plates resisting the forces computed at the second analysis
UP1’ : 29 dowels in the chord 16 dowels in the diagonals
UP2’ : 10 dowels in the c 8 dowels in the d
LO1’ : 25 dowels in the chord 16 dowels in the diagonals
LO1’ : 17 dowels in the c 8 dowels in the dia
UP1’
UP1’
UP1’
UP2’UP2’ UP2’
UP2’UP2’ UP2’
LO2’LO2’
LO2’LO2’LO2’ LO2’LO2’
LO2’LO1’
LO1’
Figure 6.10 Location of the connections
These new steel plates were checked in the same way than in chaptersplitting of the chords.
CHALMERS, Structural Engineering and Mechanics, Maste9696
hord iagonals
hord gonals
UP1’
UP1’
UP1’LO1’
LO1’
5, including the
r’s Thesis 2005:103 005:103
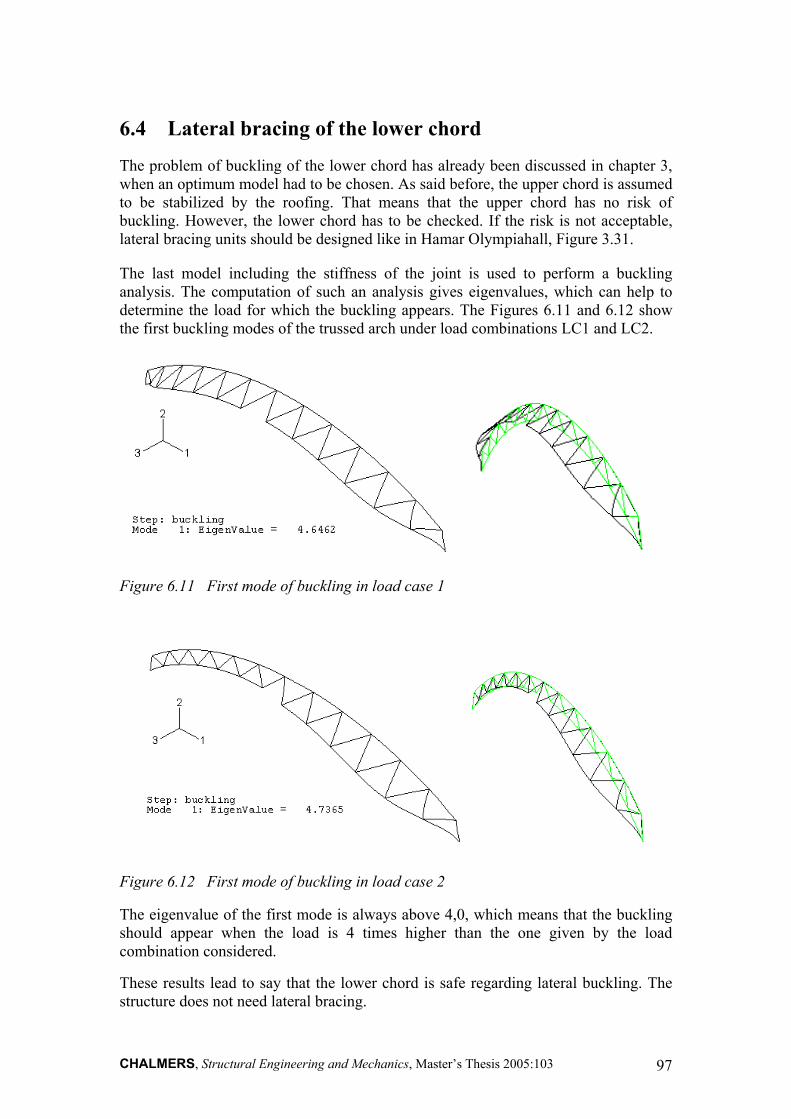
6.4 Lateral bracing of the lower chord
The problem of buckling of the lower chord has already been discussed in chapter 3, when an optimum model had to be chosen. As said before, the upper chord is assumed to be stabilized by the roofing. That means that the upper chord has no risk of buckling. However, the lower chord has to be checked. If the risk is not acceptable, lateral bracing units should be designed like in Hamar Olympiahall, Figure 3.31.
The last model including the stiffness of the joint is used to perform a buckling analysis. The computation of such an analysis gives eigenvalues, which can help to determine the load for which the buckling appears. The Figures 6.11 and 6.12 show the first buckling modes of the trussed arch under load combinations LC1 and LC2.
Figure 6.11 First mode of buckling in load case 1
Figure 6.12 First mode of buckling in load case 2
The eigenvalue of the first mode is always above 4,0, which means that the buckling should appear when the load is 4 times higher than the one given by the load combination considered.
These results lead to say that the lower chord is safe regarding lateral buckling. The structure does not need lateral bracing.
CHALMERS, Structural Engineering and Mechanics, Master’s Thesis 2005:103 97
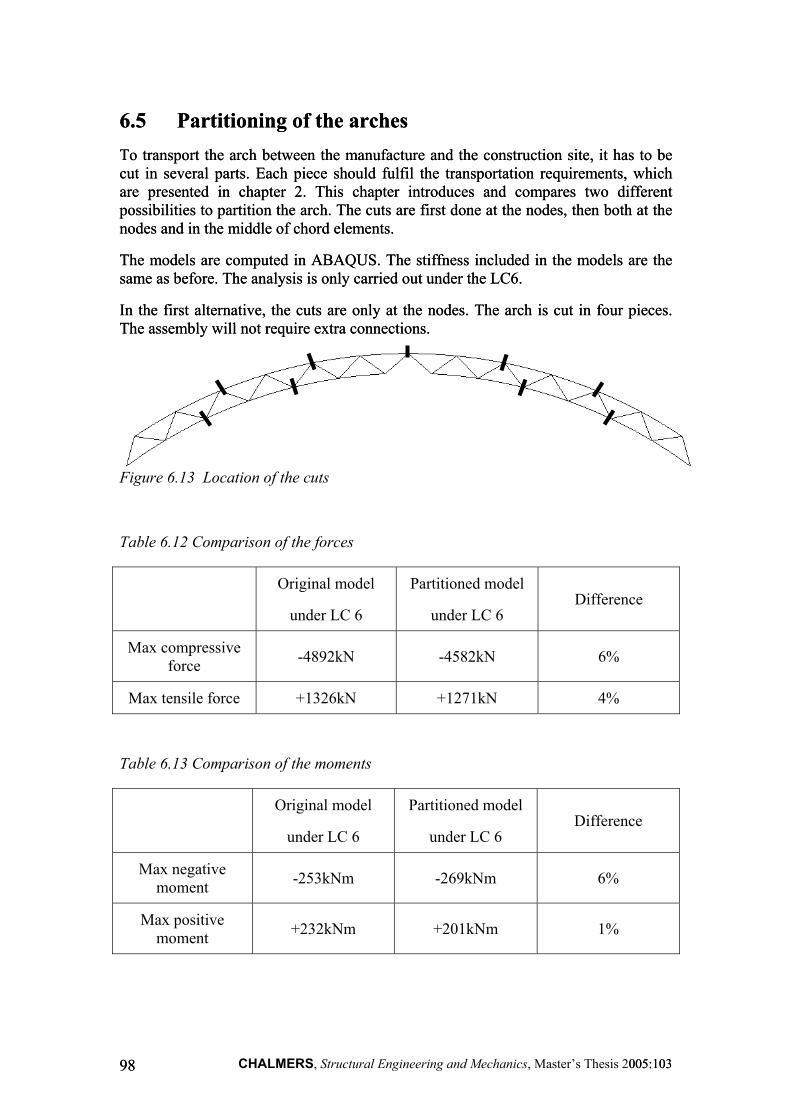
6.5 Partitioning of the arches 6.5 Partitioning of the arches To transport the arch between the manufacture and the construction site, it has to be cut in several parts. Each piece should fulfil the transportation requirements, which are presented in chapter 2. This chapter introduces and compares two different possibilities to partition the arch. The cuts are first done at the nodes, then both at the nodes and in the middle of chord elements.
To transport the arch between the manufacture and the construction site, it has to be cut in several parts. Each piece should fulfil the transportation requirements, which are presented in chapter 2. This chapter introduces and compares two different possibilities to partition the arch. The cuts are first done at the nodes, then both at the nodes and in the middle of chord elements.
The models are computed in ABAQUS. The stiffness included in the models are the same as before. The analysis is only carried out under the LC6. The models are computed in ABAQUS. The stiffness included in the models are the same as before. The analysis is only carried out under the LC6.
In the first alternative, the cuts are only at the nodes. The arch is cut in four pieces. The assembly will not require extra connections. In the first alternative, the cuts are only at the nodes. The arch is cut in four pieces. The assembly will not require extra connections.
Figure 6.13 Location of the cuts
Table 6.12 Comparison of the forces
Original model
under LC 6
Partitioned model
under LC 6 Difference
Max compressive force -4892kN -4582kN 6%
Max tensile force +1326kN +1271kN 4%
Table 6.13 Comparison of the moments
Original model
under LC 6
Partitioned model
under LC 6 Difference
Max negative moment -253kNm -269kNm 6%
Max positive moment +232kNm +201kNm 1%
CHALMERS, Structural Engineering and Mechanics, Master’s Thesis 2005:103 005:103 9898
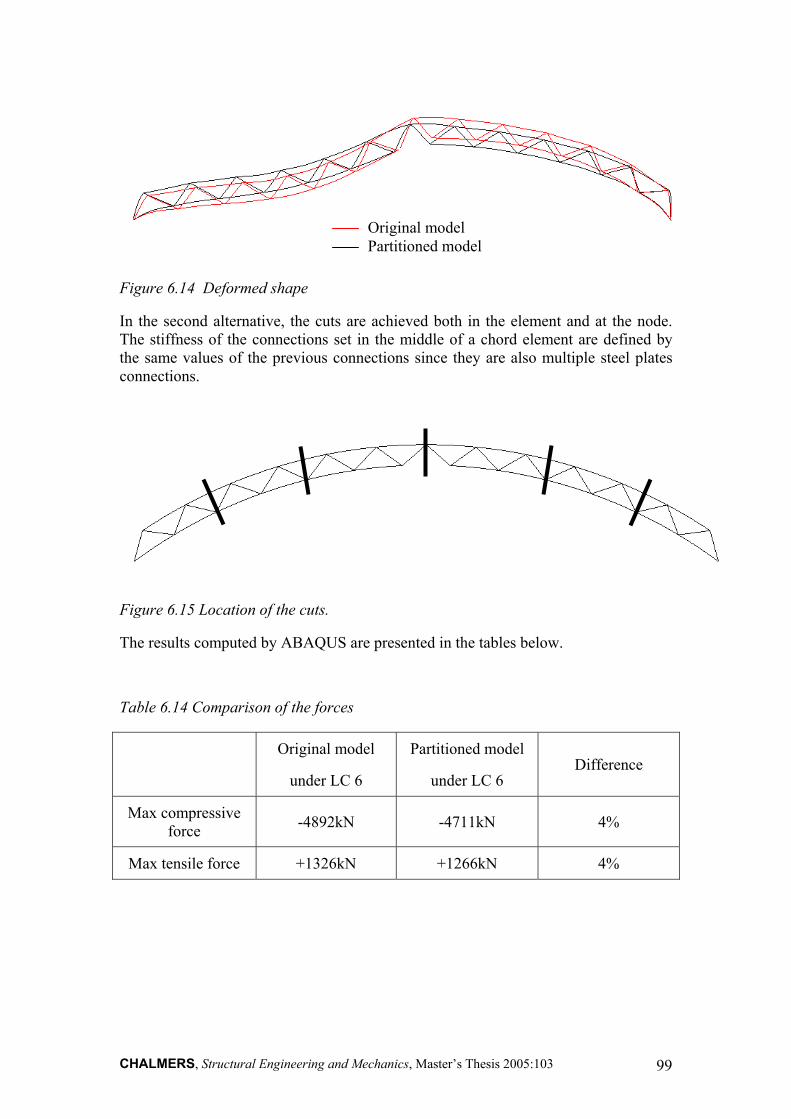
Original model Partitioned model
Figure 6.14 Deformed shape
In the second alternative, the cuts are achieved both in the element and at the node. The stiffness of the connections set in the middle of a chord element are defined by the same values of the previous connections since they are also multiple steel plates connections.
Figure 6.15 Location of the cuts.
The results computed by ABAQUS are presented in the tables below.
Table 6.14 Comparison of the forces
Original model
under LC 6
Partitioned model
under LC 6 Difference
Max compressive force -4892kN -4711kN 4%
Max tensile force +1326kN +1266kN 4%
CHALMERS, Structural Engineering and Mechanics, Master’s Thesis 2005:103 99
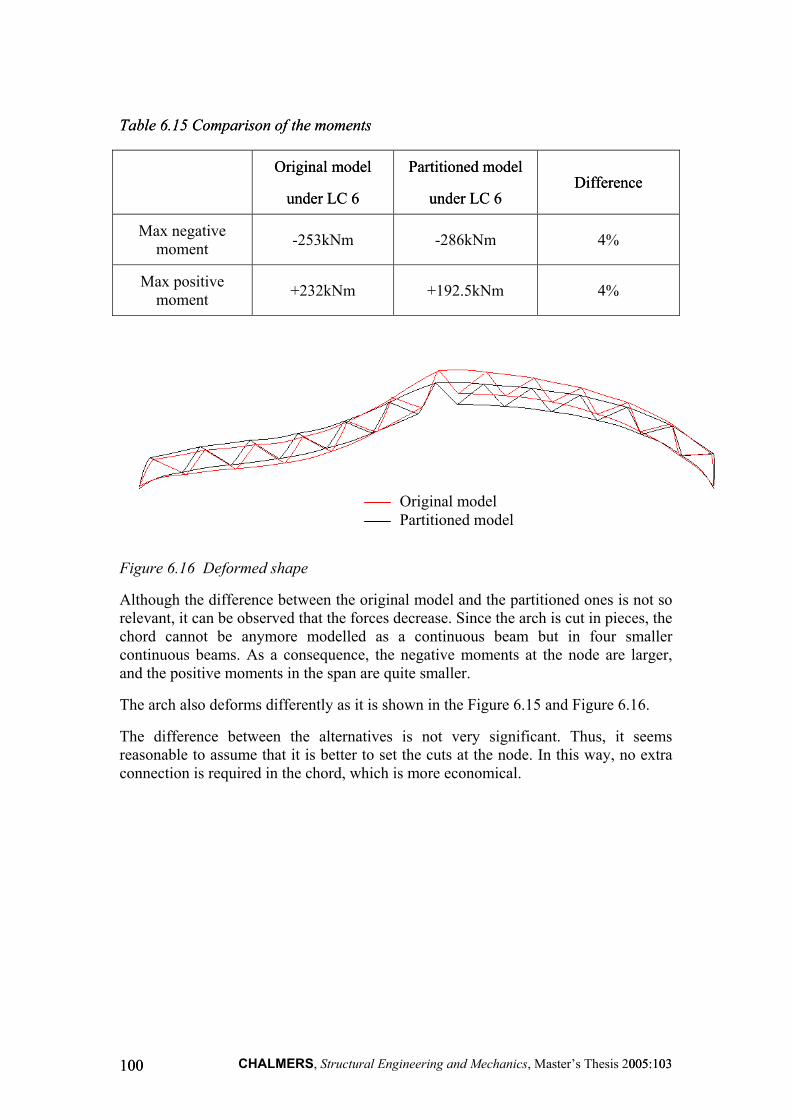
Table 6.15 Comparison of the moments Table 6.15 Comparison of the moments
Original model Original model
under LC 6 under LC 6
Partitioned model Partitioned model
under LC 6 under LC 6 Difference Difference
Max negative moment -253kNm -286kNm 4%
Max positive moment +232kNm +192.5kNm 4%
Figure 6.16 Deformed shape
Although the difference between the original model and the partitioned ones is not so relevant, it can be observed that the forces decrease. Since the arch is cut in pieces, the chord cannot be anymore modelled as a continuous beam but in four smaller continuous beams. As a consequence, the negative moments at the node are larger, and the positive moments in the span are quite smaller.
The arch also deforms differently as it is shown in the Figure 6.15 and Figure 6.16.
The difference between the alternatives is not very significant. Thus, it seems reasonable to assume that it is better to set the cuts at the node. In this way, no extra connection is required in the chord, which is more economical.
Original model Partitioned model
CHALMERS, Structural Engineering and Mechanics, Master’s Thesis 2005:103 005:103 100100
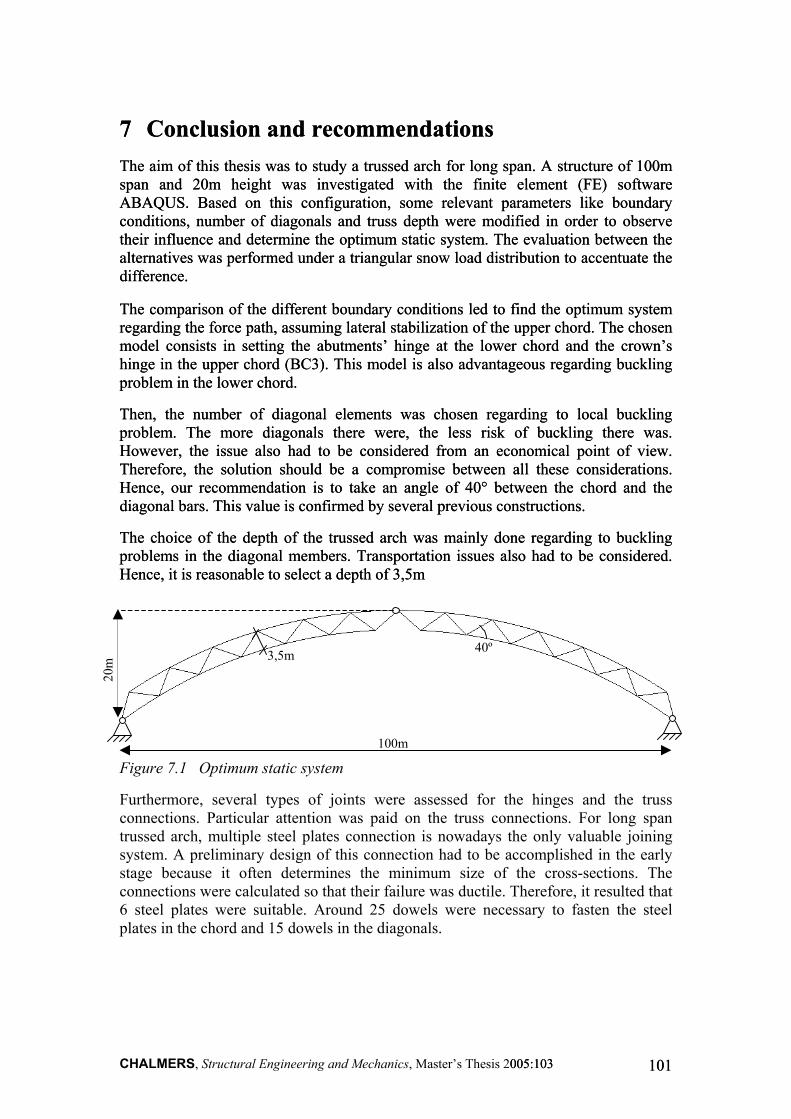
7 Conclusion and recommendations 7 Conclusion and recommendations The aim of this thesis was to study a trussed arch for long span. A structure of 100m span and 20m height was investigated with the finite element (FE) software ABAQUS. Based on this configuration, some relevant parameters like boundary conditions, number of diagonals and truss depth were modified in order to observe their influence and determine the optimum static system. The evaluation between the alternatives was performed under a triangular snow load distribution to accentuate the difference.
The aim of this thesis was to study a trussed arch for long span. A structure of 100m span and 20m height was investigated with the finite element (FE) software ABAQUS. Based on this configuration, some relevant parameters like boundary conditions, number of diagonals and truss depth were modified in order to observe their influence and determine the optimum static system. The evaluation between the alternatives was performed under a triangular snow load distribution to accentuate the difference.
The comparison of the different boundary conditions led to find the optimum system regarding the force path, assuming lateral stabilization of the upper chord. The chosen model consists in setting the abutments’ hinge at the lower chord and the crown’s hinge in the upper chord (BC3). This model is also advantageous regarding buckling problem in the lower chord.
The comparison of the different boundary conditions led to find the optimum system regarding the force path, assuming lateral stabilization of the upper chord. The chosen model consists in setting the abutments’ hinge at the lower chord and the crown’s hinge in the upper chord (BC3). This model is also advantageous regarding buckling problem in the lower chord.
Then, the number of diagonal elements was chosen regarding to local buckling problem. The more diagonals there were, the less risk of buckling there was. However, the issue also had to be considered from an economical point of view. Therefore, the solution should be a compromise between all these considerations. Hence, our recommendation is to take an angle of 40° between the chord and the diagonal bars. This value is confirmed by several previous constructions.
Then, the number of diagonal elements was chosen regarding to local buckling problem. The more diagonals there were, the less risk of buckling there was. However, the issue also had to be considered from an economical point of view. Therefore, the solution should be a compromise between all these considerations. Hence, our recommendation is to take an angle of 40° between the chord and the diagonal bars. This value is confirmed by several previous constructions.
The choice of the depth of the trussed arch was mainly done regarding to buckling problems in the diagonal members. Transportation issues also had to be considered. Hence, it is reasonable to select a depth of 3,5m
The choice of the depth of the trussed arch was mainly done regarding to buckling problems in the diagonal members. Transportation issues also had to be considered. Hence, it is reasonable to select a depth of 3,5m
100m
20m
3,5m 40º
Figure 7.1 Optimum static system
Furthermore, several types of joints were assessed for the hinges and the truss connections. Particular attention was paid on the truss connections. For long span trussed arch, multiple steel plates connection is nowadays the only valuable joining system. A preliminary design of this connection had to be accomplished in the early stage because it often determines the minimum size of the cross-sections. The connections were calculated so that their failure was ductile. Therefore, it resulted that 6 steel plates were suitable. Around 25 dowels were necessary to fasten the steel plates in the chord and 15 dowels in the diagonals.
CHALMERS, Structural Engineering and Mechanics, Master’s Thesis 2005:103 005:103 101101
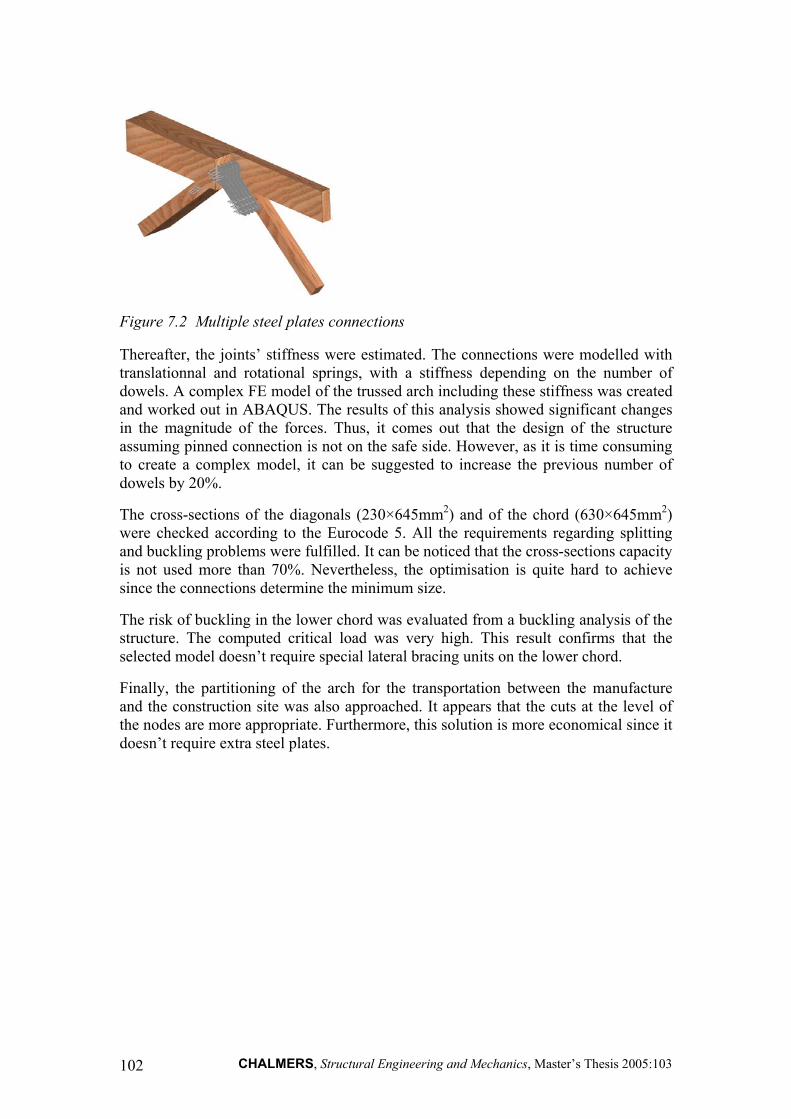
Figure 7.2 Multiple steel plates connections
Thereafter, the joints’ stiffness were estimated. The connections were modelled with translationnal and rotational springs, with a stiffness depending on the number of dowels. A complex FE model of the trussed arch including these stiffness was created and worked out in ABAQUS. The results of this analysis showed significant changes in the magnitude of the forces. Thus, it comes out that the design of the structure assuming pinned connection is not on the safe side. However, as it is time consuming to create a complex model, it can be suggested to increase the previous number of dowels by 20%.
The cross-sections of the diagonals (230×645mm ) and of the chord (630×645mm ) were checked according to the Eurocode 5. All the requirements regarding splitting and buckling problems were fulfilled. It can be noticed that the cross-sections capacity is not used more than 70%. Nevertheless, the optimisation is quite hard to achieve since the connections determine the minimum size.
2 2
The risk of buckling in the lower chord was evaluated from a buckling analysis of the structure. The computed critical load was very high. This result confirms that the selected model doesn’t require special lateral bracing units on the lower chord.
Finally, the partitioning of the arch for the transportation between the manufacture and the construction site was also approached. It appears that the cuts at the level of the nodes are more appropriate. Furthermore, this solution is more economical since it doesn’t require extra steel plates.
CHALMERS, Structural Engineering and Mechanics, Master’s Thesis 2005:103 102
8 References Eurocode 1: Basis of design and actions on structures (ENV 1991-2-1:1995).
Eurocode 1: Actions on the structures-General actions-Part 1-3:Snow actions (ENV 1991-2-3:1995).
Eurocode 1: Actions on the structures-General actions-Part 1-4:Wind actions (ENV 1991-2-4:1995).
Eurocode 5: Design of timber structures Part1-1: General-Common rules and rules for buildings (EN 1995-1-1:2004).
Carling O., Svenskt Limträ Ab (2001): Limträhandbok. Svenskt limträ AB, Stockholm.
Jorissen A. J. M. (1998): Double shear timber connections with dowel type fasteners. Delft University Press, Delft.
Kinney J. S. (1957): Indeterminate structural analysis, Addison-Wesley Publishing Company, Reading, Massachusetts, U.S.A.
Madsen B. (2000): Behaviour of timber connections. Timber Engineering Ltd., Vancouver.
Natterer J., Sandoz J.-L., Rey M., Fiaux M. (2000): Construction en bois : matériau, technologie et dimensionnement Presses polytechniques et universitaires romandes, Lausanne.
Other literature:
Johansson H. (2001): Systematic design of glulam trusses, Licentiate thesis, Luleå University of Technology.
Thelandersson S., Larsen H. J. (2003): Timber engineering, Wiley, Chichester.
CHALMERS, Structural Engineering and Mechanics, Master’s Thesis 2005:103 103
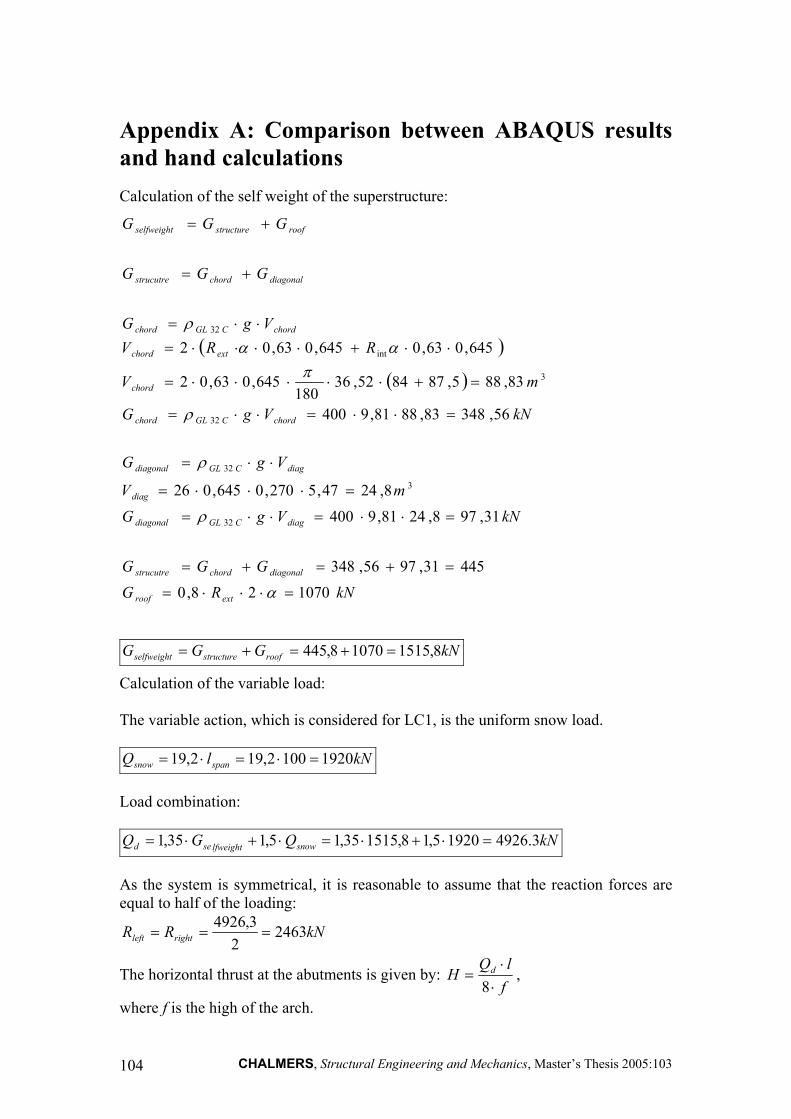
Appendix A: Comparison between ABAQUS results and hand calculations Calculation of the self weight of the superstructure:
Calculation of the variable load: The variable action, which is considered for LC1, is the uniform snow load.
Load combination:
As the system is symmetrical, it is reasonable to assume that the reaction forces are equal to half of the loading:
( )
( )
kNRG
GGG
kNVgG
mV
VgG
kNVgG
mV
RRVVgG
GGG
GGG
extroof
diagonalchordstrucutre
diagCGLdiagonal
diag
diagCGLdiagonal
chordCGLchord
chord
extchord
chordCGLchord
diagonalchordstrucutre
roofstructureselfweight
107028,0
44531,9756,348
31,978,2481,9400
8,2447,5270,0645,026
56,34883,8881,9400
83,885,878452,36180
645,063,02
645,063,0645,063,02
32
3
32
32
3
int
32
=⋅⋅⋅=
=+=+=
=⋅⋅=⋅⋅=
=⋅⋅⋅=
⋅⋅=
=⋅⋅=⋅⋅=
=+⋅⋅⋅⋅⋅=
⋅⋅+⋅⋅⋅⋅=⋅⋅=
+=
+=
α
ρ
ρ
ρ
παα
ρ
kNGGG roofstructureselfweight 8,151510708,445 =+=+=
kNlQ spansnow 19201002,192,19 =⋅=⋅=
kNQGQ snowlfweightsed 3.492619205,18,151535,15,135,1 =⋅+⋅=⋅+⋅=
kNRR rightleft 24632
3,4926===
The horizontal thrust at the abutments is given by: , flQ
H d
⋅⋅
=8
where f is the high of the arch.
CHALMERS, Structural Engineering and Mechanics, Master’s Thesis 2005:103 104
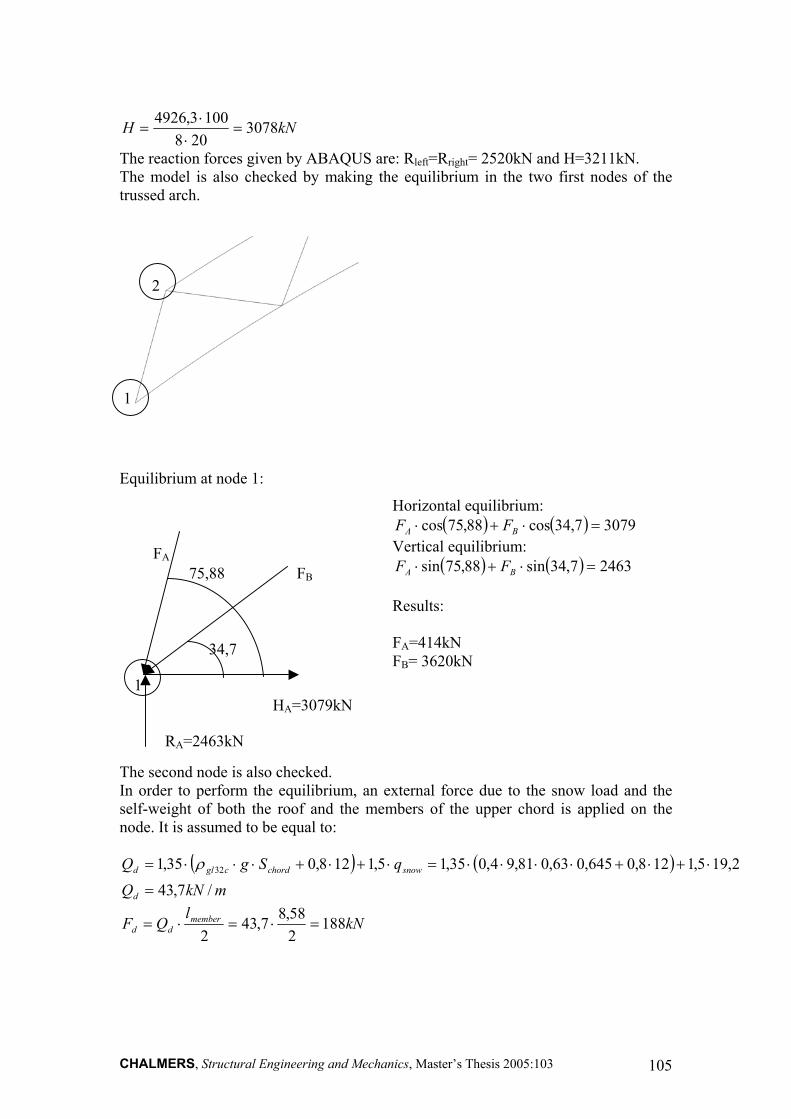
kNH 3078208
1003,4926=
⋅⋅
=
The reaction forces given by ABAQUS are: R =R = 2520kN and H=3211kN. left rightThe model is also checked by making the equilibrium in the two first nodes of the trussed arch.
Equilibrium at node 1:
1
2
Horizontal equilibrium: ( ) ( ) 30797,34cos88,75cos =⋅+⋅ BA FF
2005:103 105
The second node is also checked. In order to perform the equilibrium, an external force due to the snow load and the self-weight of both the roof and the members of the upper chord is applied on the node. It is assumed to be equal to:
HA=3079kN
75,88
34,7
1
RA=2463kN
FA FB
Vertical equilibrium: ( ) ( ) 24637,34sin88,75sin =⋅+⋅ BA FF
Results: FA=414kN FB= 3620kN
( ) ( )
mkNQ
qSgQ
d
snowchordcgld
/7,43
2,195,1128,0645,063,081,94,035,15,1128,035,1 32
=
⋅+⋅+⋅⋅⋅⋅=⋅+⋅+⋅⋅⋅= ρ
kNl
QF memberdd 188
258,87,43
2=⋅=⋅=
CHALMERS, Structural Engineering and Mechanics, Master’s Thesis
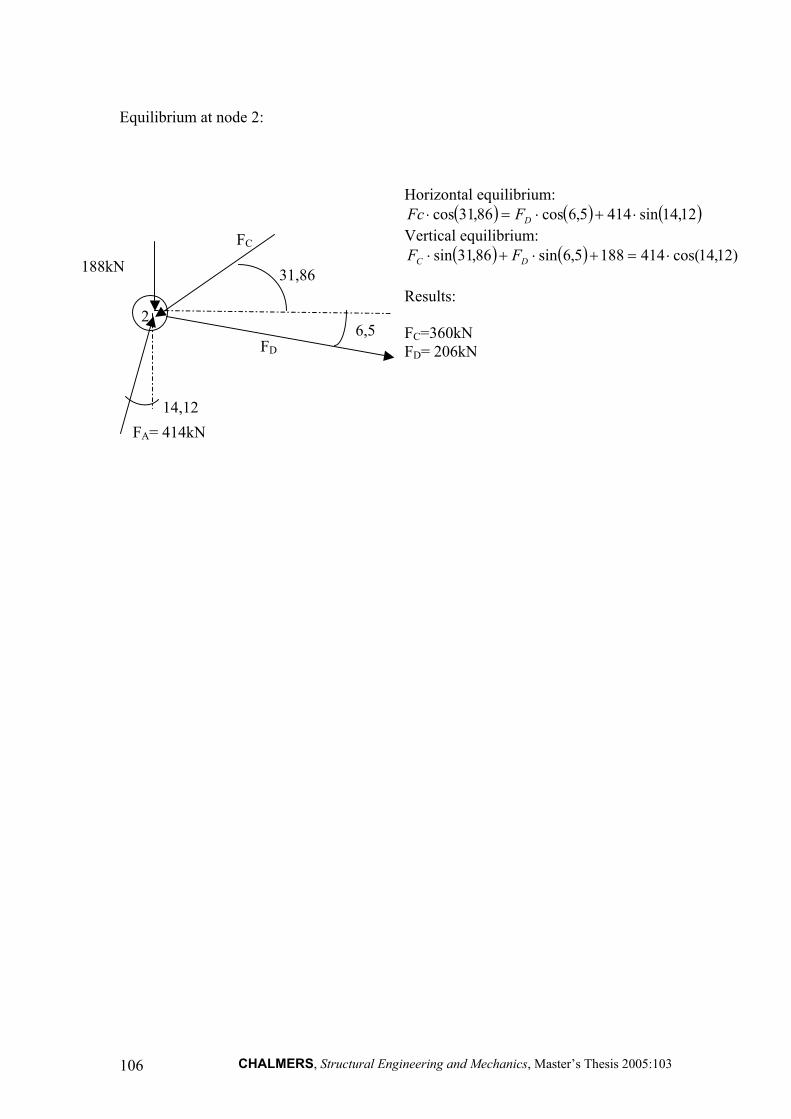
Equilibrium at node 2:
Horizontal equilibrium:
( ) ( ) ( )12,14sin4145,6cos86,31cos ⋅+⋅=⋅ DFFc
FF
188kN
Vertical equilibrium: FC ( ) ( ) )12,14cos(4141885,6sin86,31sin ⋅=+⋅+⋅ DC FF
31,86 Results:
2 6,5 C=360kN
D= 206kN FD
14,12 FA= 414kN
CHALMERS, Structural Engineering and Mechanics, Master’s Thesis 2005:103 106
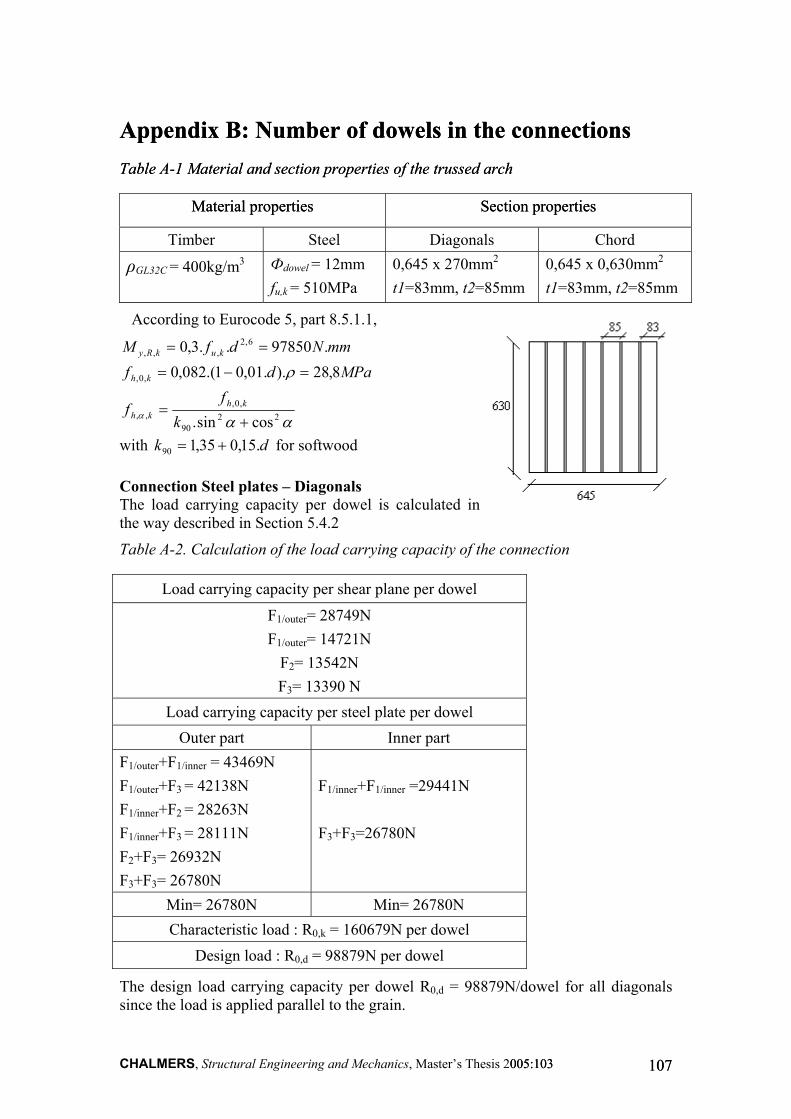
Appendix B: Number of dowels in the connections Appendix B: Number of dowels in the connections Table A-1 Material and section properties of the trussed arch Table A-1 Material and section properties of the trussed arch
Material properties Material properties Section properties Section properties
Timber Steel Diagonals Chord
ρ = 400kg/m GL32C 3
Ф = 12mm fu,k = 510MPa
0,645 x 270mm2
t1=83mm, t2=85mm 0,645 x 0,630mm2
dowel
t1=83mm, t2=85mm
According to Eurocode 5, part 8.5.1.1,
mmNdfM kukRy .97850..3,0 6,2,,, ==
Connection Steel plates – Diagonals The load carrying capacity per dowel is calculated in the way described in Section 5.4.2
MPadf kh 8,28)..01,01.(082,0,0, =−= ρ
ααα 2290
,0,,, cossin. +
=k
ff kh
kh
with for softwood dk .15,035,190 +=
Table A-2. Calculation of the load carrying capacity of the connection
Load carrying capacity per shear plane per dowel
F = 28749N 1/outer
F = 14721N 1/outer
F = 13542N 2
F3= 13390 N Load carrying capacity per steel plate per dowel
Outer part Inner part F1/outer+F = 43469N 1/inner
1/outer 3
F +F = 28263N 1/inner 2
F1/inner+F = 28111N 3
F +F = 26932N 2 3
F3+F3= 26780N
F +F =29441N 1/inner 1/inner
F +F = 42138N
F +F =26780N 3 3
Min= 26780N Min= 26780N
0,k
Design load : R = 98879N per dowel 0,d
The design load carrying capacity per dowel R = 98879N/dowel for all diagonals since the load is applied parallel to the grain.
0,d
Characteristic load : R = 160679N per dowel
CHALMERS, Structural Engineering and Mechanics, Master’s Thesis 2005:103 005:103 107107
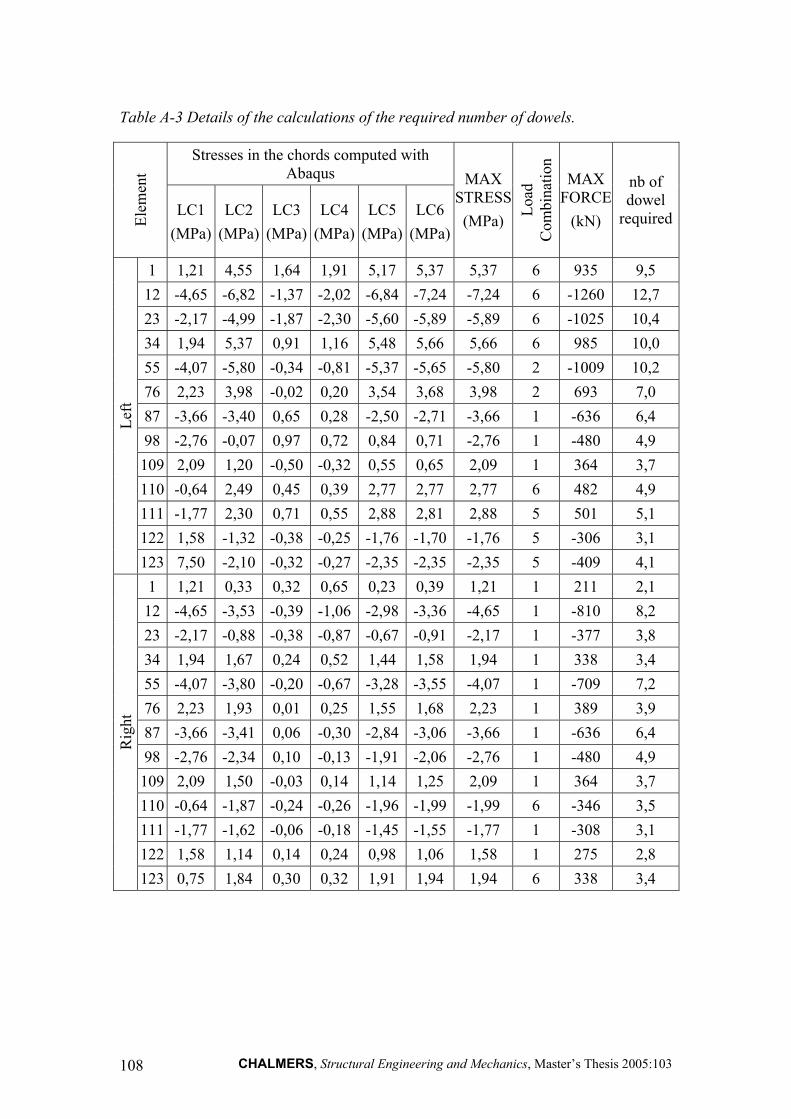
Table A-3 Details of the calculations of the required number of dowels.
Stresses in the chords computed with Abaqus
Elem
ent
LC1 (MPa)
LC2 (MPa)
LC3 (MPa)
LC4 (MPa)
LC5 (MPa)
LC6 (MPa)
MAX STRESS(MPa) Lo
ad
Com
bina
tion
MAX FORCE
(kN)
nb of dowel
required
1 1,21 4,55 1,64 1,91 5,17 5,37 5,37 6 935 9,5 12 -4,65 -6,82 -1,37 -2,02 -6,84 -7,24 -7,24 6 -1260 12,7 23 -2,17 -4,99 -1,87 -2,30 -5,60 -5,89 -5,89 6 -1025 10,4 34 1,94 5,37 0,91 1,16 5,48 5,66 5,66 6 985 10,0 55 -4,07 -5,80 -0,34 -0,81 -5,37 -5,65 -5,80 2 -1009 10,2
Left
76 2,23 3,98 -0,02 0,20 3,54 3,68 3,98 2 693 7,0 87 -3,66 -3,40 0,65 0,28 -2,50 -2,71 -3,66 1 -636 6,4 98 -2,76 -0,07 0,97 0,72 0,84 0,71 -2,76 1 -480 4,9 109 2,09 1,20 -0,50 -0,32 0,55 0,65 2,09 1 364 3,7 110 -0,64 2,49 0,45 0,39 2,77 2,77 2,77 6 482 4,9 111 -1,77 2,30 0,71 0,55 2,88 2,81 2,88 5 501 5,1 122 1,58 -1,32 -0,38 -0,25 -1,76 -1,70 -1,76 5 -306 3,1 123 7,50 -2,10 -0,32 -0,27 -2,35 -2,35 -2,35 5 -409 4,1 1 1,21 0,33 0,32 0,65 0,23 0,39 1,21 1 211 2,1 12 -4,65 -3,53 -0,39 -1,06 -2,98 -4,65 1 -810 23 -0,88 -0,38 -0,87 -0,91 -2,17 1 3,8
1,94 1,67 0,24
-3,36 8,2 -2,17 -0,67 -377
34 0,52 1,44 1,58 1,94 1 338 3,4 55 -4,07 -3,80 -0,20 -0,67 -3,28 -3,55 -4,07 1 7,2
2,23 1,93 0,01 1,55 1,68 2,23 389 3,9 87 -3,66 -3,41 -0,30 -2,84 -3,06
-709 76 0,25 1
is 2005:103 108
0,06 -3,66 1 -636 6,4 98 -2,76 -2,34 0,10 -0,13 -1,91 -2,06 -2,76 1 -480 4,9
Rig
ht
109 1,50 -0,03 0,14 1,25 2,09 1 3,7 -0,64 -1,87 -0,24 -1,96 -1,99 -1,99 -346 3,5 2,09 1,14 364
110 -0,26 6 111 -1,77 -1,62 -0,06 -0,18 -1,45 -1,55 -1,77 1 -308 3,1 122 1,58 1,14 0,14 0,24 0,98 1,06 1,58 1 275 2,8 123 0,75 1,84 0,30 0,32 1,91 1,94 1,94 6 338 3,4
CHALMERS, Structural Engineering and Mechanics, Master’s Thes
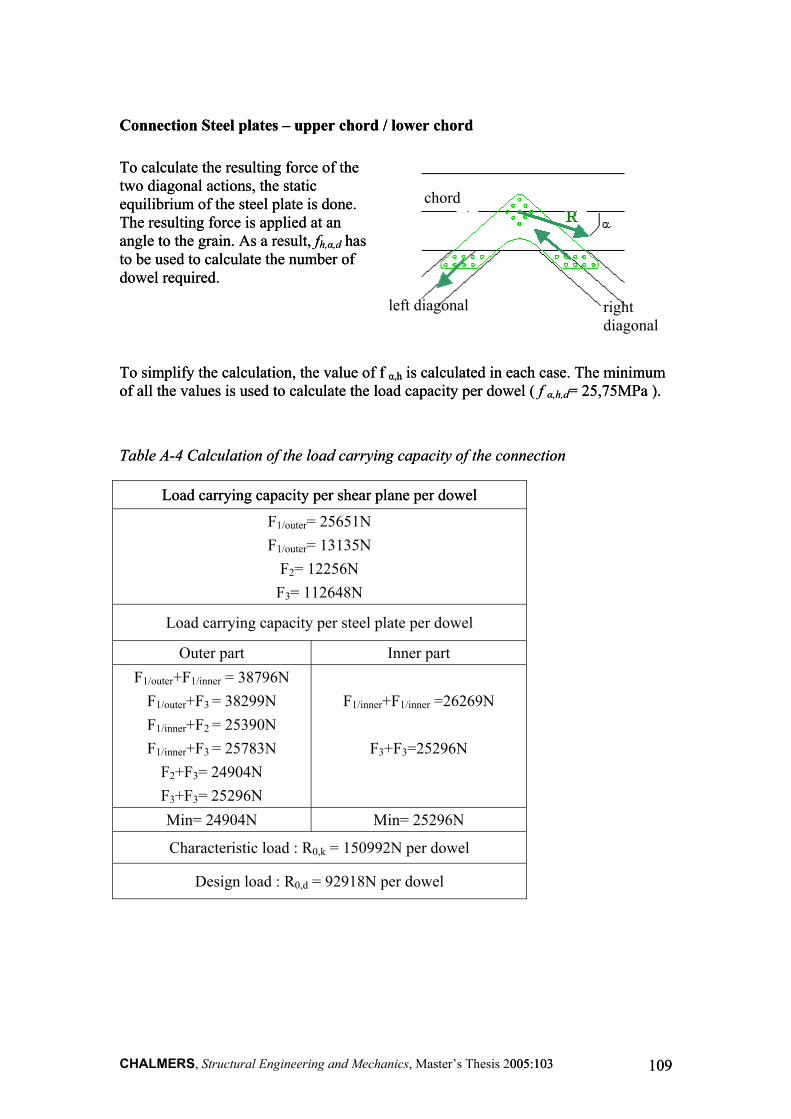
Connection Steel plates – upper chord / lower chord Connection Steel plates – upper chord / lower chord
chord
right diagonal
left diagonal
To calculate the resulting force of the two diagonal actions, the static equilibrium of the steel plate is done. The resulting force is applied at an angle to the grain. As a result, f has to be used to calculate the number of dowel required.
To calculate the resulting force of the two diagonal actions, the static equilibrium of the steel plate is done. The resulting force is applied at an angle to the grain. As a result, f has to be used to calculate the number of dowel required.
h,α,dh,α,d
To simplify the calculation, the value of f is calculated in each case. The minimum of all the values is used to calculate the load capacity per dowel ( f = 25,75MPa ). To simplify the calculation, the value of f is calculated in each case. The minimum of all the values is used to calculate the load capacity per dowel ( f = 25,75MPa ).
α,hα,h
α,h,dα,h,d
Table A-4 Calculation of the load carrying capacity of the connection Table A-4 Calculation of the load carrying capacity of the connection
Load carrying capacity per shear plane per dowel Load carrying capacity per shear plane per dowel
F = 25651N 1/outer
1/outer
F = 12256N 2
F3= 112648N
Outer part Inner part F +F = 38796N 1/inner
F +F = 38299N 1/outer 3
F +F = 25390N 2
F +F = 25783N 1/inner 3
F +F = 24904N
F = 13135N
Load carrying capacity per steel plate per dowel
1/outer
1/inner
2005:103 005:103 109109
2 3
F3+F3= 25296N
F +F =26269N 1/inner 1/inner
3 3
Min= 24904N
Characteristic load : R = 150992N per dowel 0,k
Design load : R = 92918N per dowel
F +F =25296N
Min= 25296N
0,d
CHALMERS, Structural Engineering and Mechanics, Master’s Thesis
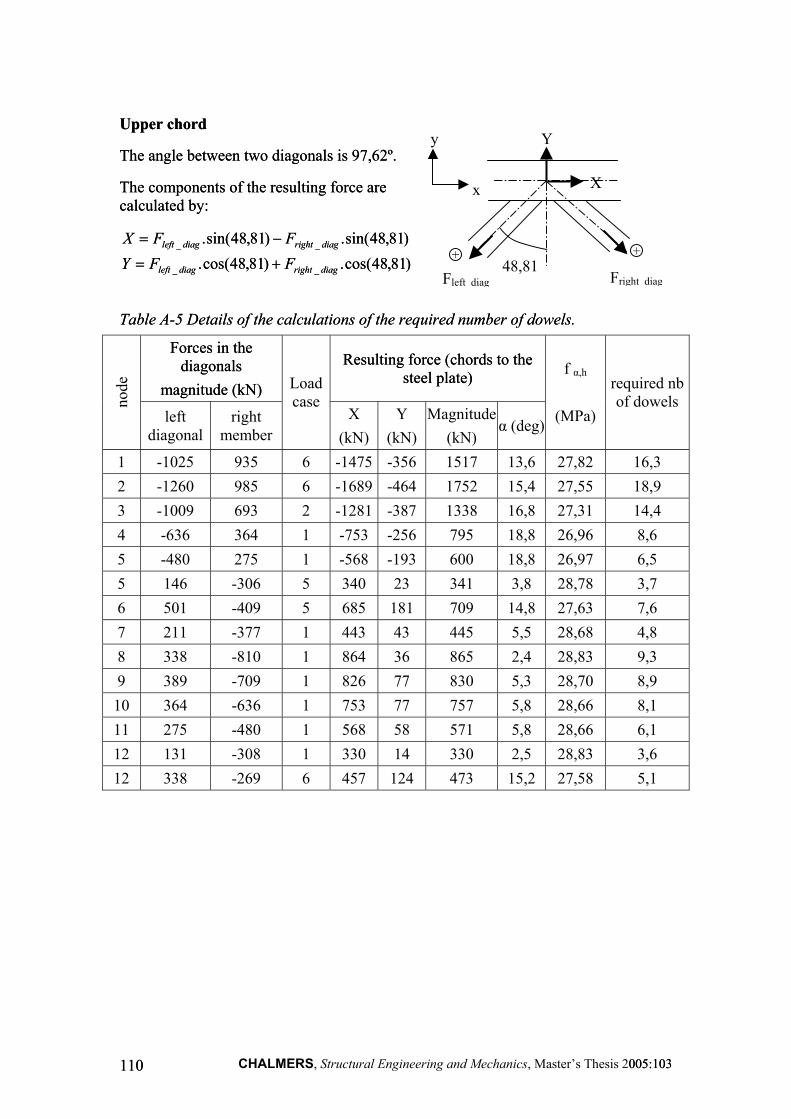
Upper chord Upper chord
The angle between two diagonals is 97,62º. The angle between two diagonals is 97,62º.
The components of the resulting force are calculated by: The components of the resulting force are calculated by:
+
Fright diagFleft diag48,81
y
x X
Y
)81,48sin(.)81,48sin(. __ diagrightdiagleft FFX −=
)81,48cos(.)81,48cos(. __ diagrightdiagleft FFY +=
)81,48sin(.)81,48sin(. __ diagrightdiagleft FFX −=
)81,48cos(.)81,48cos(. __ diagrightdiagleft FFY += +
Table A-5 Details of the calculations of the required number of dowels. Table A-5 Details of the calculations of the required number of dowels.
Forces in the diagonals
Forces in the diagonals Resulting force (chords to the
steel plate) Resulting force (chords to the
steel plate)
is 2005:103 005:103 110110
magnitude (kN) magnitude (kN) f α,h
node
left diagonal
X (kN) (kN)
Magnitude(kN)
(MPa)
Load case
required nbof dowels
Y right member α (deg)
1 -1025 935 6 -1475 -356 1517 27,82 16,3 2 985 6 -1689 -464 15,4 27,55 18,9
-1009 693 2 -1281
13,6 -1260 1752
3 -387 1338 16,8 27,31 14,4 4 364 1 -753 -256 18,8 26,96 8,6
-480 275 1 -568 600 18,8 26,97 6,5 -636 795
5 -193 5 146 -306 5 340 23 341 3,8 28,78 3,7 6 501 -409 5 685 181 709 14,8 27,63 7,6 7 211 -377 1 443 43 445 5,5 28,68 4,8 8 338 -810 1 864 36 865 2,4 28,83 9,3 9 389 -709 1 826 77 830 5,3 28,70 8,9 10 364 -636 1 753 77 757 5,8 28,66 8,1 11 275 -480 1 568 58 571 5,8 28,66 6,1 12 131 -308 1 330 14 330 2,5 28,83 3,6 12 338 -269 6 457 124 473 15,2 27,58 5,1
CHALMERS, Structural Engineering and Mechanics, Master’s Thes

Lower chord Lower chord
The angle between two diagonals is 103,2º. The angle between two diagonals is 103,2º.
+
+ Fright diagFleft diag
X
Y y
x
51,63The components of the resulting force are calculated by: The components of the resulting force are calculated by:
)81,48sin(.)81,48sin(. __ diagrightdiagleft FFX −=
81,48cos(.)81,48cos(. __ diagrightdiagleft FFY −−=
)81,48sin(.)81,48sin(. __ diagrightdiagleft FFX −=
81,48cos(.)81,48cos(. __ diagrightdiagleft FFY −−= ))
Table A-6 Details of the calculations of the required number of dowels. Table A-6 Details of the calculations of the required number of dowels.
Forces in the diagonals
Forces in the diagonals
2005:103 005:103 111111
magnitude (kN) magnitude (kN)
Resulting force (chords to the steel plate)
Resulting force (chords to the steel plate)
left diagonal
Loadcase
(kN) Y
(kN) (kN)
f α,h
(MPa)
required nbof dowels no
de
X Magnituderight member α (deg)
13 935 -1260 6 -1721 202 1733 6,7 28,60 18,6 14 985 -984 6 -1543 -1 1543 0,0 28,86 16,6 14 -1009 2 -1524 47 1525 1,7 28,85 16,4 15 693 -591 2 -1007 -63 1009 3,6 28,79 10,9
934
15 389 -636 1 -804 154 818 10,8 28,19 8,8 16 -480 1 -662 666 6,2 28,64 7,2 17 -306 501 5 -121 644 10,8 6,9 18 -409 482 5 -45 700
364 72 632 28,19 699 3,7 28,78 7,5
18 482 -409 6 -699 -45 701 3,7 28,78 7,5 19 -810 211 1 800 372 882 24,9 25,75 9,5 20 -709 338 1 821 230 853 15,7 27,50 9,2 21 -636 389 1 804 154 10,8 28,19 8,8 22 -480 364 1 662 72 666 6,2 28,64 7,2 23
818
-308 275 1 457 21 458 28,82 4,9
2,6
CHALMERS, Structural Engineering and Mechanics, Master’s Thesis
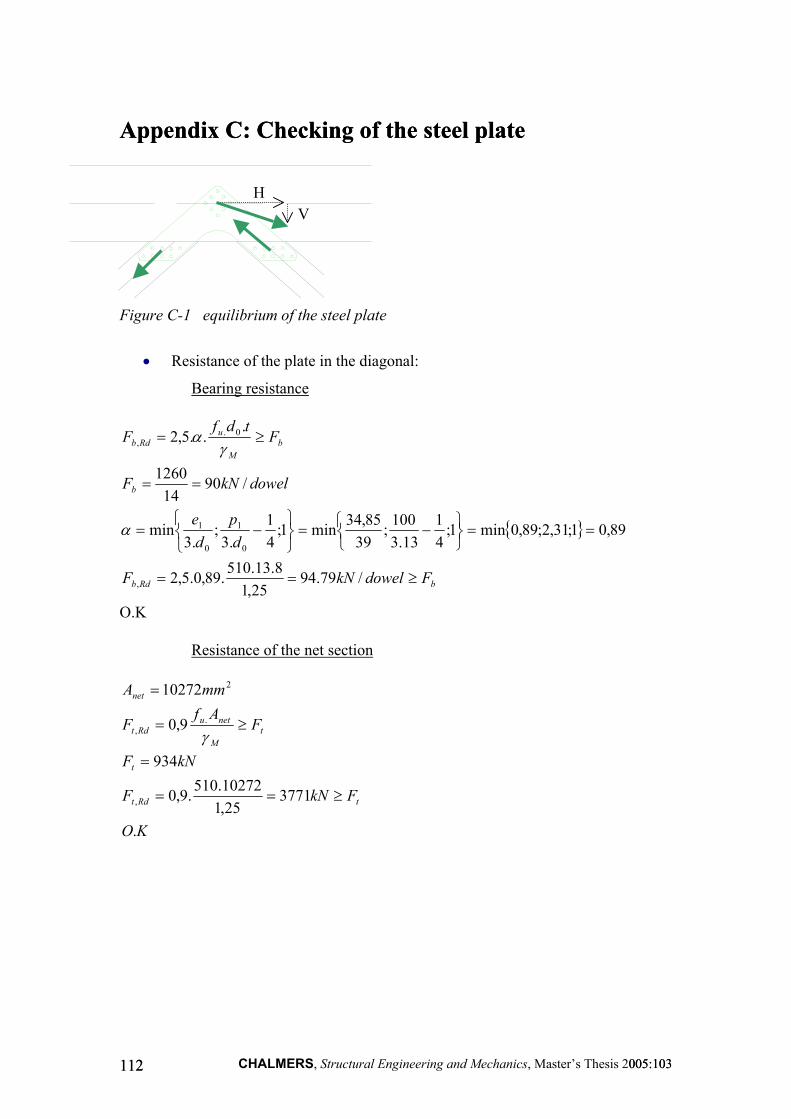
Appendix C: Checking of the steel plate Appendix C: Checking of the steel plate
H V
Figure C-1 equilibrium of the steel plate
• Resistance of the plate in the diagonal:
Bearing resistance
O.K Resistance of the net section
{ }
bRdb
b
bM
uRdb
FdowelkNF
dp
de
dowelkNF
Ftdf
F
≥==
==
−=
−=
==
≥=
/79.9425,1
8.13.510.89,0.5,2
89,01;31,2;89,0min1;41
13.3100;
3985,34min1;
41
.3;
.3min
/9014
1260
...5,2
,
0
1
0
1
0.,
α
γα
KO
FkNF
kNF
FAf
F
mmA
tRdt
t
tM
netuRdt
net
.
377125,110272.510.9,0
934
9,0
10272
,
.,
2
≥==
=
≥=
=
γ
CHALMERS, Structural Engineering and Mechanics, Master’s Thesis 2005:103 005:103 112112
Tensile failure of the plate
• Resistance of the plate in the chord:
The two components of the resultant force acting on the steel plate in the chord have to be checked.
Verification of the horizontal component H=1474kN.
Bearing resistance
Resistance of the net section
( )
KO
FplatekNF
platekNF
FAf
F
tRdt
t
tM
yRdt
.
/6141,1
8.238.355
/1646
984
,
.,
≥==
==
≥=γ
{ }
KO
FdowelkNF
dp
de
dowelkNF
Ftdf
F
bRdb
b
bM
uRdb
.
/10625,1
8.13.510.1.5,2
89,01;31,2;28,1min1;41
13.3100;
3950min1;
41
.3;
.3min
/7021
1474
...5,2
,
0
1
0
1
0.,
≥==
==
−=
−=
==
≥=
α
γα
KO
FkNF
kNF
FAf
F
mmA
tRdt
t
tM
netuRdt
net
.
670225,118254.510.9,0
1474
9,0
18254
,
.,
2
≥==
=
≥=
=
γ
CHALMERS, Structural Engineering and Mechanics, Master’s Thesis 2005:103 113
Tensile failure of the plateTensile failure of the plate
Verification of the vertical component V=464kN.
Bearing resistance
Resistance of the net section
( )
KO
FplatekNF
platekNF
FAf
F
tRdt
t
tM
yRdt
.
/11051,1
8.3,428.355
/2456
1474
,
.,
≥==
==
≥=γ
{ }
KO
FdowelkNF
dp
de
dowelkNF
FtdfF
bRdb
b
bM
uRdb
.
/10625,1
8.13.510.1.5,2
89,01;31,2;28,1min1;41
13.3100;
3950min1;
41
.3;
.3min
/2221
464
...5,2
,
0
1
0
1
0.,
≥==
==
−=
−=
==
≥=
α
γα
KO
FkNF
kNF
FAf
F
mmA
tRdt
t
tM
netuRdt
net
.
2,620425,116896.510.9,0
464
9,0
16896
,
.,
2
≥==
=
≥=
=
γ
CHALMERS, Structural Engineering and Mechanics, Master’s Thesis 2005:103 005:103 114114

Tensile failure of the plate
( )
KO
FplatekNF
platekNF
FAf
F
tRdt
t
tM
yRdt
.
/10321,1
8.400.355
/3,776
464
,
.,
≥==
==
≥=γ
CHALMERS, Structural Engineering and Mechanics, Master’s Thesis 2005:103 115
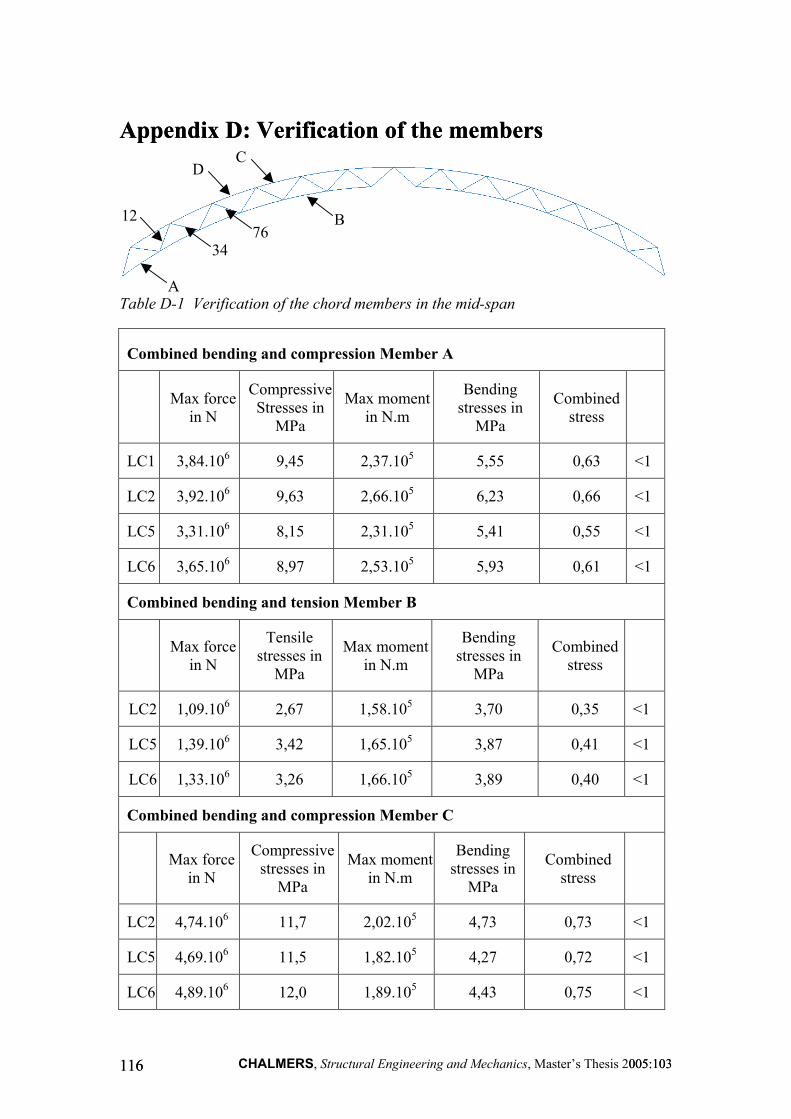
Appendix D: Verification of the members Appendix D: Verification of the members
Table D-1 Verification of the chord members in the mid-span
C
A
B
D
12 76
34
is 2005:103 005:103
Combined bending and compression Member A
Max force in N
Compressive Stresses in
MPa
Max moment in N.m
Bending stresses in
MPa
Combined stress
LC1 3,84.106 9,45 2,37.105 5,55 0,63 <1
LC2 3,92.106 9,63 2,66.105 6,23 0,66 <1
LC5 3,31.106 8,15 2,31.105 5,41 0,55 <1
LC6 3,65.106 8,97 2,53.105 5,93 0,61 <1
Combined bending and tension Member B
Max force in N
Tensile stresses in
MPa
Max moment in N.m
Bending stresses in
MPa
Combined stress
LC2 1,09.106 2,67 1,58.105 3,70 0,35 <1
LC5 1,39.106 3,42 1,65.105 3,87 0,41 <1
LC6 1,33.106 3,26 1,66.105 3,89 0,40 <1
Combined bending and compression Member C
Max force in N
Compressive stresses in
MPa
Max moment in N.m
Bending stresses in
MPa
Combined stress
LC2 4,74.106 11,7 2,02.105 4,73 0,73 <1
LC5 4,69.106 11,5 5 4,27 0,72 <1
LC6 4,89.106 12,0 1,89.105 4,43 0,75 <1
1,82.10
CHALMERS, Structural Engineering and Mechanics, Master’s Thes116116
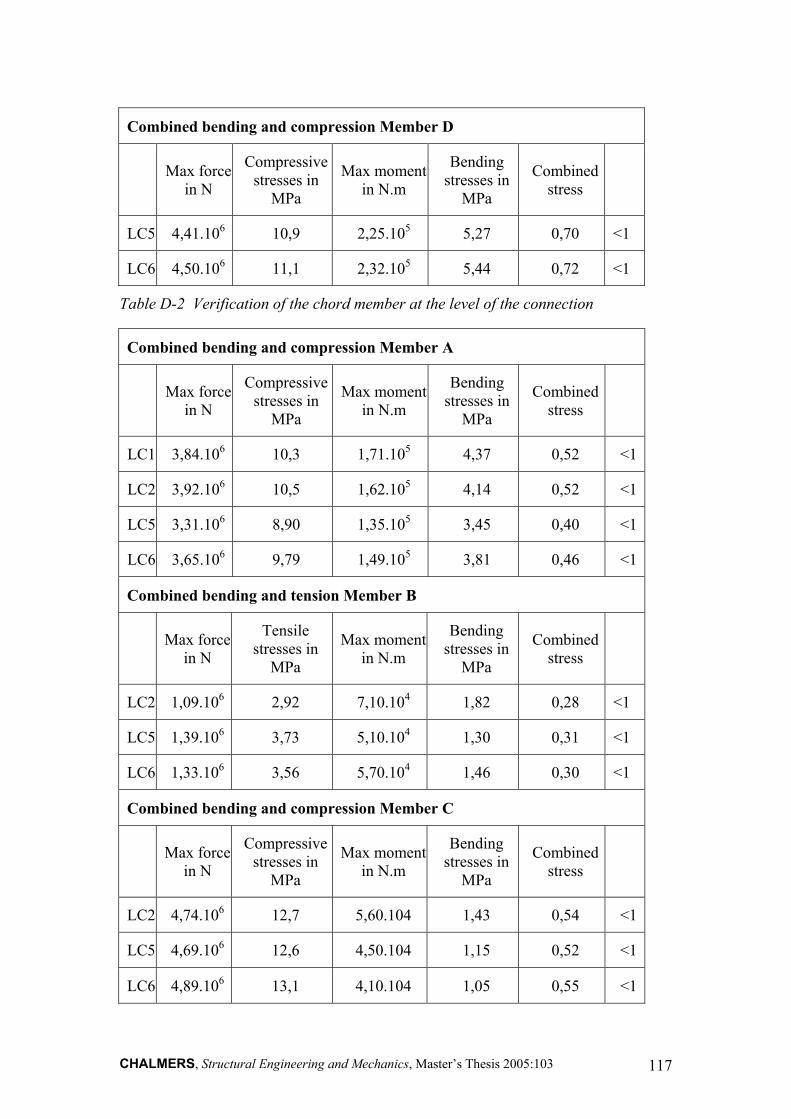
2005:103 117
Combined bending and compression Member D
Max force in N
Compressive stresses in
MPa
Max moment in N.m
Bending stresses in
MPa
Combined stress
LC5 4,41.106 10,9 2,25.105 5,27 0,70 <1
LC6 4,50.106 11,1 2,32.105 5,44 0,72 <1
Table D-2 Verification of the chord member at the level of the connection
Combined bending and compression Member A
Max force in N
Compressive stresses in
MPa
Max moment in N.m
Bending stresses in
MPa
Combined stress
LC1 3,84.106 10,3 1,71.105 4,37 0,52 <1
LC2 3,92.106 10,5 1,62.105 4,14 0,52 <1
LC5 3,31.106 8,90 1,35.105 3,45 0,40 <1
LC6 3,65.106 9,79 1,49.105 3,81 0,46 <1
Combined bending and tension Member B
Max force in N
Tensile stresses in
MPa
Max moment in N.m
Bending stresses in
MPa
Combined stress
LC2 1,09.106 2,92 7,10.104 1,82 0,28 <1
LC5 1,39.106 3,73 5,10.104 1,30 0,31 <1
LC6 1,33.106 3,56 5,70.104 1,46 0,30 <1
Combined bending and compression Member C
Max force in N
Compressive stresses in
MPa
Max moment in N.m
Bending stresses in
MPa
Combined stress
LC2 4,74.106 12,7 5,60.104 1,43 0,54 <1
LC5 4,69.106 12,6 4,50.104 1,15 0,52 <1
LC6 4,89.106 13,1 4,10.104 1,05 0,55 <1
CHALMERS, Structural Engineering and Mechanics, Master’s Thesis
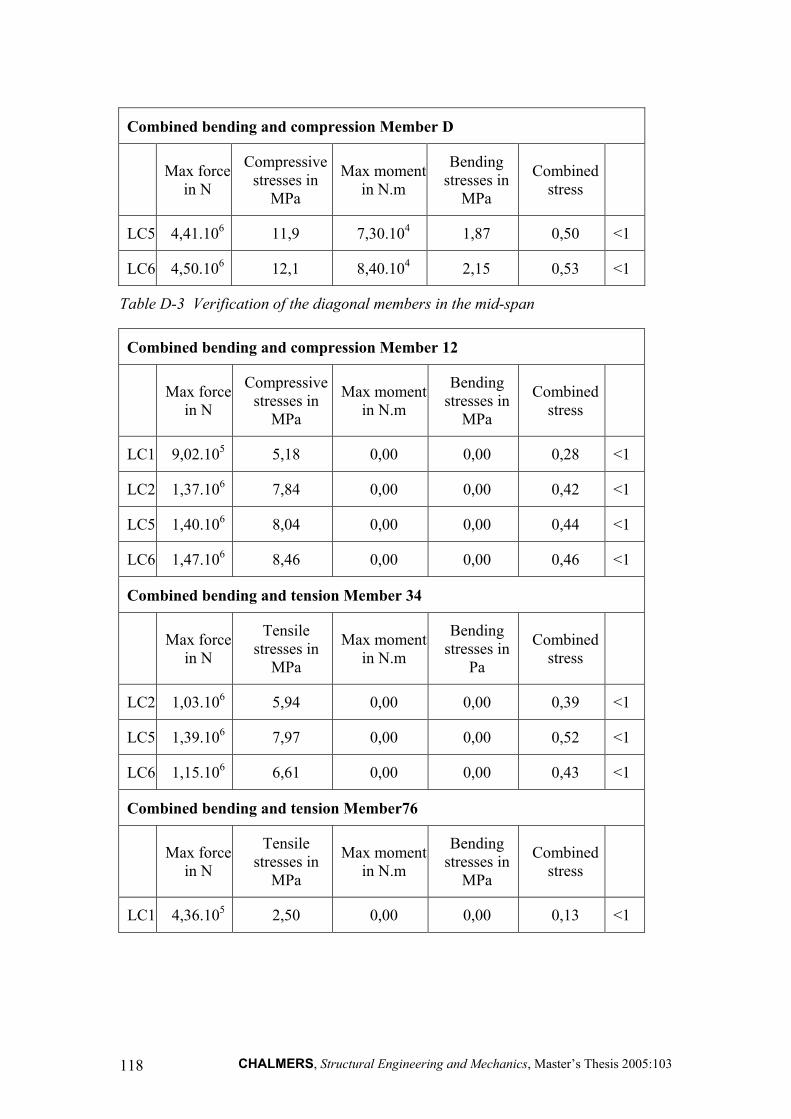
Combined bending and compression Member D
Max force in N
Compressive stresses in
MPa
Max moment in N.m
Bending stresses in
MPa
Combined stress
LC5 4,41.106 11,9 7,30.104 1,87 0,50 <1
LC6 4,50.106 12,1 8,40.104 2,15 0,53 <1
Table D-3 Verification of the diagonal members in the mid-span
Combined bending and compression Member 12
Max force in N
Compressive stresses in
MPa
Max moment in N.m
Bending stresses in
MPa
Combined stress
LC1 9,02.105 5,18 0,00 0,00 0,28 <1
LC2 1,37.106 7,84 0,00 0,00 0,42 <1
LC5 1,40.106 8,04 0,00 0,00 0,44 <1
LC6 1,47.106 8,46 0,00 0,00 0,46 <1
Combined bending and tension Member 34
Max force in N
Tensile stresses in
MPa
Max moment in N.m
Bending stresses in
Pa
Combined stress
LC2 1,03.106 5,94 0,00 0,00 0,39 <1
LC5 1,39.106 7,97 0,00 0,00 0,52 <1
LC6 1,15.106 6,61 0,00 0,00 0,43 <1
Combined bending and tension Member76
Max force in N
Tensile stresses in
MPa
Max moment in N.m
Bending stresses in
MPa
Combined stress
LC1 4,36.105 2,50 0,00 0,00 0,13 <1
CHALMERS, Structural Engineering and Mechanics, Master’s Thesis 2005:103 118
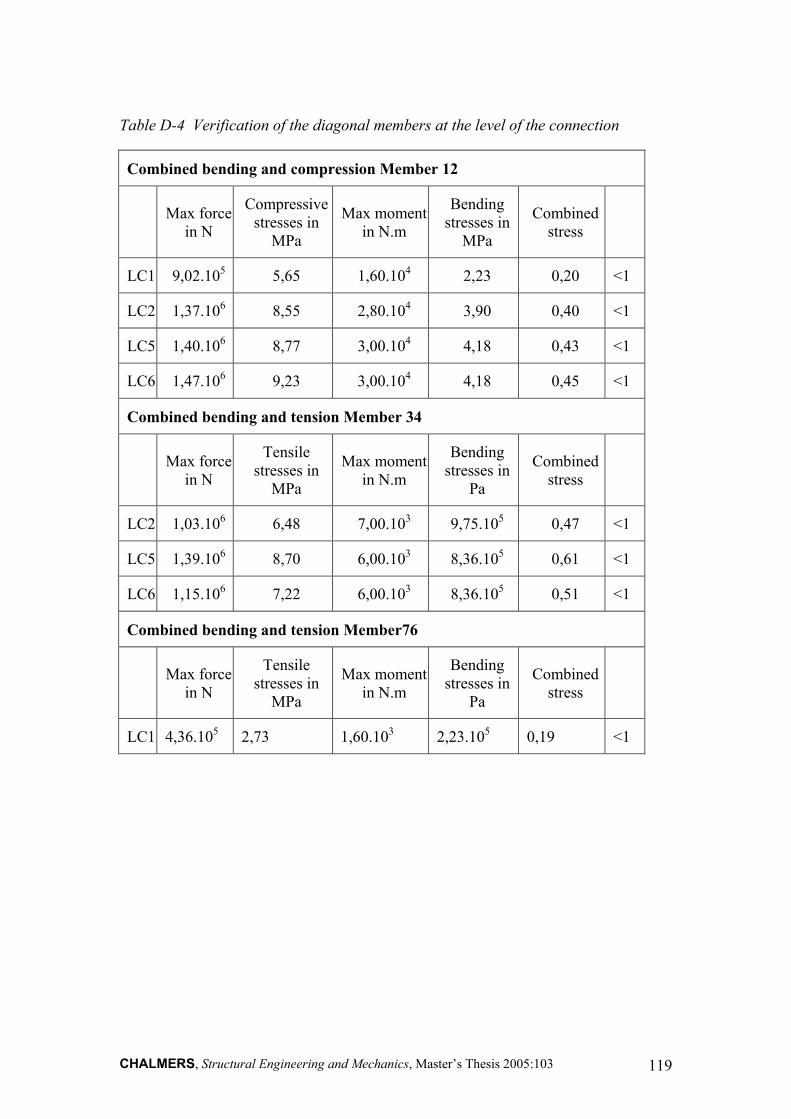
Table D-4 Verification of the diagonal members at the level of the connection
Combined bending and compression Member 12
Max force in N
Compressive stresses in
MPa
Max moment in N.m
Bending stresses in
MPa
Combined stress
LC1 9,02.105 5,65 1,60.104 2,23 0,20 <1
LC2 1,37.106 8,55 2,80.104 3,90 0,40 <1
LC5 1,40.106 8,77 3,00.104 4,18 0,43 <1
LC6 1,47.106 9,23 3,00.104 4,18 0,45 <1
Combined bending and tension Member 34
Max force in N
Tensile stresses in
MPa
Max moment in N.m
Bending stresses in
Pa
Combined stress
LC2 1,03.106 6,48 7,00.103 9,75.105 0,47 <1
LC5 1,39.106 8,70 6,00.103 8,36.105 0,61 <1
LC6 1,15.106 7,22 6,00.103 8,36.105 0,51 <1
Combined bending and tension Member76
Max force in N
Tensile stresses in
MPa
Max moment in N.m
Bending stresses in
Pa
Combined stress
LC1 4,36.105 2,73 1,60.103 2,23.105 0,19 <1
CHALMERS, Structural Engineering and Mechanics, Master’s Thesis 2005:103 119