timber mapping for site- specific forest management · timber mapping for site-specific forest...
TRANSCRIPT

Auburn University
Biosystems Engineering , Auburn UniversityChristian Brodbeck
John Fulton, Joey Shaw, Tim McDonald, Donn Rodekohr
Timber Mapping for Site-Specific Forest Management

Value Map
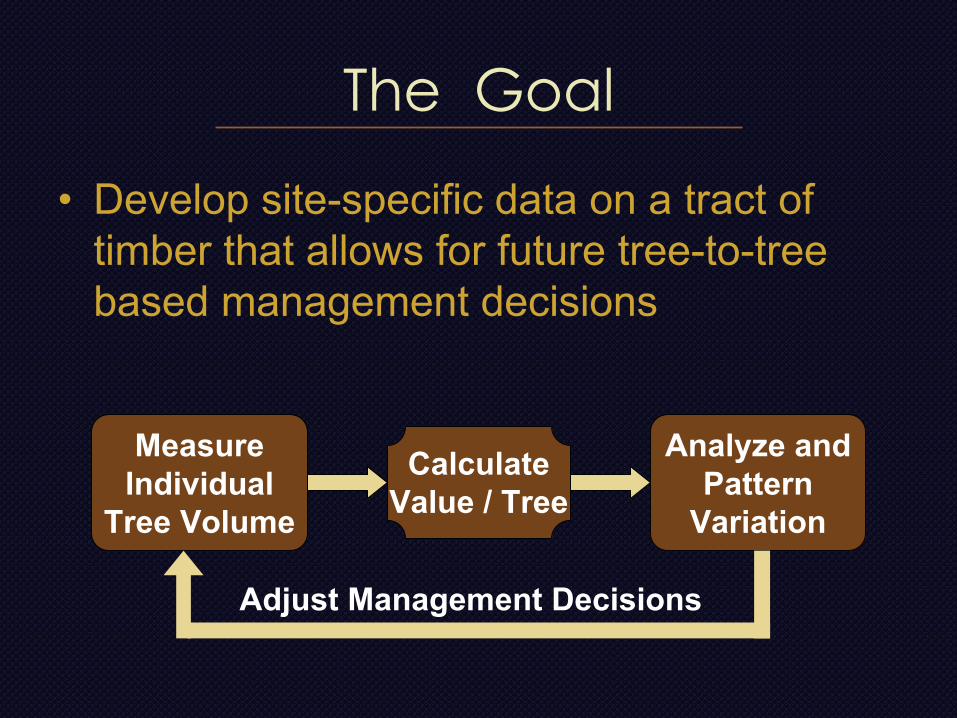
The Goal
• Develop site-specific data on a tract of timber that allows for future tree-to-tree based management decisions
Measure Individual
Tree Volume
Calculate Value / Tree
Analyze and Pattern
Variation
Adjust Management Decisions

Achieving the Goal• Ground Measurements
– Tree Location (X,Y,Z)– Tree Diameter (DBH) and Height– Soil Properties– Elevation
• LIDAR / GIS Analysis – Individual tree height determination– Bare Earth model– Volume / Value calculations
• Feasibility / Future Research

Ground Measurements• Order 1 soil survey
conducted• Tree location (x, y, and z)
using RTK GPS and a Total Station
• Tree diameter at breast height using calipers
• 20% of total tree heights using a laser range finder and clinometers

Traditional Volume Estimations• Conduct a timber cruise
– Statistical sample of plots distributed on a grid
– Measure all merchantable timber within plot
• Volume of trees on the plot are calculated using timber volume equations
• Volume is then extrapolated to entire tract– Tract is harvested and yield
data is not collected

Individual Tree Parameters
• To develop value maps, tree volume must first be determined.– Volume (cu. ft.) = A * DBH2 * Height
• For Pulpwood, A = 0.002323
• For Sawtimber, A = 0.002052
• Determination of individual tree height– Linear Regression Height Model
– LiDAR

Regression Height Model• Linear Regression Height
Model– Plotted known Heights vs.
DBH– Linear regression utilized to
correlate height and DBH– Heights, y, calculated based
on DBH, x, utilizing regression equation, y = 0.253x + 12.689
• Model reliability checked by plotting known heights vs. predicted heights and calculating individual R2
• Calculated individual stem volume
Class > 12y = 0.253x + 12.689
R2 = 0.3971
5
10
15
20
25
10 15 20 25 30 35 40 45
DBH (cm)
Mea
sure
d H
eigh
t (m
)
Class > 12
Class > 12
y = 0.3971x + 11.164R2 = 0.3971
10
15
20
25
5 10 15 20 25 30
Actual Height (m)
Reg
ress
ion
Pred
icte
d H
eigh
t (m
)

LIDAR• Light Detection and Ranging
(LIDAR) used to remotely measure– Distance, Speed, Rotation, and
Chemical composition and concentration
• Commercially purchased LIDAR typically contains two large datasets– Bare Earth
• Surfaces and Digital Elevation Models
– First Return• Vegetative Cover / Canopy• Buildings in urban areas
How do you filter out the useful data?

LIDARHow do you filter out the data?
• Two methods utilized
– LiDAR assigned height based on proximity
– LiDAR assigned height based on Canopy Surface
Models (CSM)

LIDAR Analysis by Proximity
220.17210.09200.39190.25
21210.26266
Ave Hgt
(LDR) (m)
LDR Hgt (m)
LDRDist (m)
Tree Num
1.5m
True Tree Position with
known heights

LIDAR Analysis by CSM• DEM created from Bare Earth data • It was assumed all trees were taller than 9m,
so all LiDAR First Return points less than 9m above the DEM were deleted– Remaining First Return dataset utilized to create
the three CSM.• Three Canopy Surface Models compared
– Kriging– Inverse Distance Weighted– Natural Neighbor

Results• The three proximity
approaches and three CSM were compared
• Predicted Height vs. Known height was plotted and R2
calculated to determine and compare reliability
y = 0.5892x + 8.955R2 = 0.5729
10
15
20
25
30
5 10 15 20 25 30
Actual Height (m)
LiD
AR
Hei
ght (
m)
y = 0.5621x + 9.3306R2 = 0.5349
10.00
15.00
20.00
25.00
30.00
5.00 10.00 15.00 20.00 25.00 30.00
Acutal Height (m)
Lida
r Hei
ght (
m)
Proximity Average
CSM Natural
Neighbor
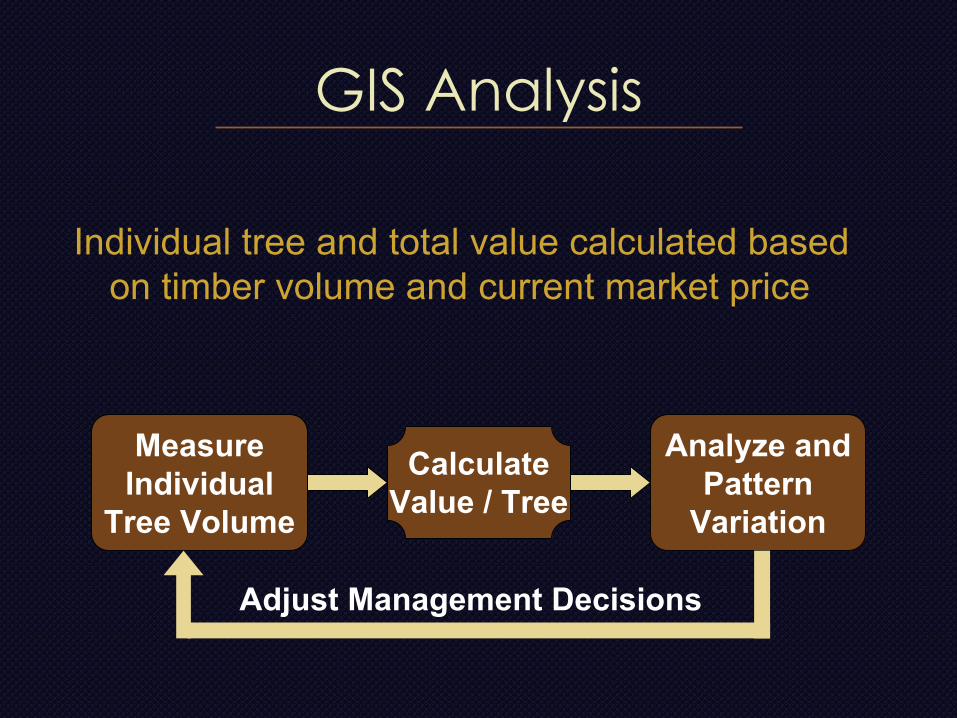
GIS Analysis
Individual tree and total value calculated based on timber volume and current market price
Measure Individual
Tree Volume
Calculate Value / Tree
Analyze and Pattern
Variation
Adjust Management Decisions

GIS Analysis
Too much hardwood
competition (increase herbicide)
Too much within-pine competition (conduct more
aggressive thinning)
Poor productivity (plant lower
value seedlings)
Optimal growth

Feasibility / Future Research• Is this feasible?
– Commercially purchase the LIDAR data
• Input Bare Earth and First Return data into onboard computer
– Utilize Feller Buncher outfitted with GPS and diameter sensor to acquire an X, Y, and DBH

Onboard computer has bare earth surface and tract boundary loaded
Future Research
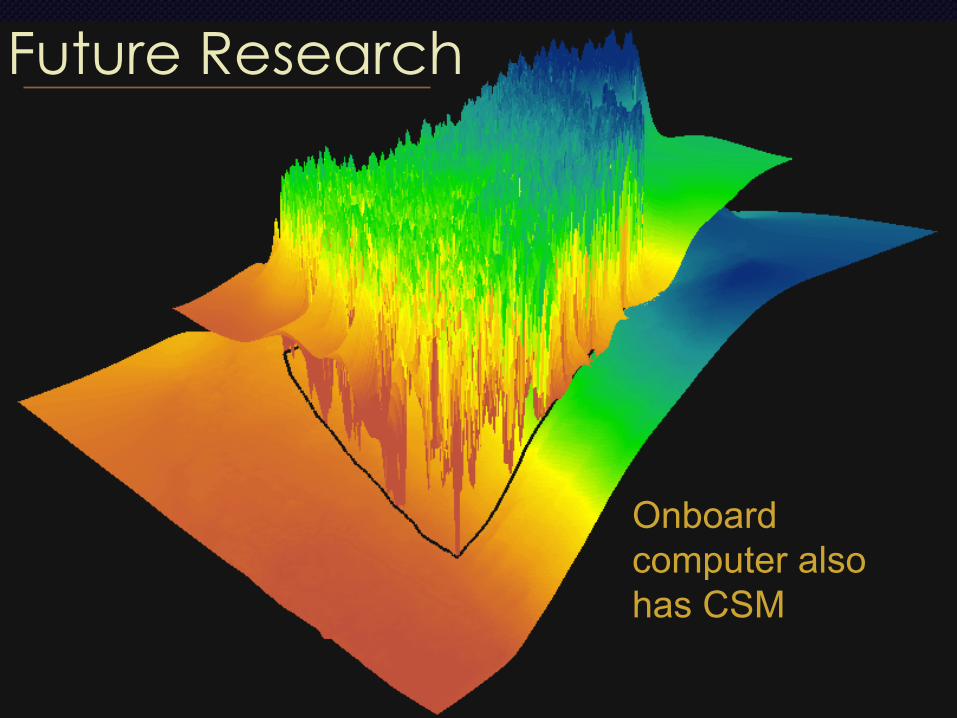
Onboard computer also has CSM
Future Research

Tree Height
Calculate Volume
Calculate Value
Future Research

Value Map

Thank You
Christian [email protected]
Biosystems EngineeringAuburn University
http://www.auprecisionforestry.org/