till pontus & alicia - diva-portal.org511112/fulltext01.pdf · till pontus & alicia . ......
TRANSCRIPT


Till Pontus & Alicia


List of Papers
This thesis is based on the following papers, which are referred to in the text by their Roman numerals.
I Hansson E.K., Wallin E.J., Lindman H., Sandström M., Karlsson
M.O., Friberg L.E. Limited inter-occasion variability in relation to inter-individual variability in chemotherapy-induced myelosuppression. Cancer Chemother Pharmacol.(2010) 65:839–848
II Hansson E.K., and Friberg L.E. The shape of the myelosuppression time profile is related to the probability of developing neutropenic fever in patients with docetaxel-induced grade IV neutropenia. Cancer Chemother Phamcol.(2011) Nov 5, [Epub ahead of print],
III Hansson E.K., Amantea M., Westwood P., Milligan P.A., Houk
B.E., French J., Karlsson M.O., Friberg L.E. Pharmacokinetic-pharmacodynamic modeling of VEGF, sVEGFR-2, -3 and sKIT as predictors of tumor dynamics and overall survival following sunitinib treatment in GIST. In manuscript
IV Hansson E.K., Ma G., Amantea M., French J., Milligan P.A.,
Friberg L.E., Karlsson M.O. PKPD modeling of predictors for side effects and overall survival in sunitinib treated patients with gastro intestinal stromal tumor. In manuscript
Reprints were made with permission from Springer Science and Business Media.

Contents
Introduction ................................................................................................... 11 Pharmacometrics ...................................................................................... 11
Mixed Effects Modeling ...................................................................... 12 Myelosuppression in Anticancer Treatment ............................................. 13
Febrile Neutropenia ............................................................................. 13 Models for Myelosuppression ............................................................. 14 Dose Individualization based on Myelosuppression ........................... 16
Sunitinib ................................................................................................... 16 Biomarkers ............................................................................................... 17
Biomarkers in Anti-angiogenic Treatment .......................................... 18 PKPD Modeling of Biomarkers in Oncology ...................................... 19
Aims .............................................................................................................. 20
Patients and Methods .................................................................................... 21 Description of Data .................................................................................. 21
Hematological Toxicity Data ............................................................... 21 GIST Data ............................................................................................ 23
Model Building ........................................................................................ 25 Analysis of Hematological Toxicity Data ........................................... 25 Integrated Modeling Framework ......................................................... 26 Data Analysis ....................................................................................... 29
Results ........................................................................................................... 31 Variability in Myelosuppression Model Parameters ................................ 31 Relationship between Neutropenia and FN .............................................. 33 Integrated Modeling Framework .............................................................. 35
Discussion ..................................................................................................... 43 Hematological Toxicity ............................................................................ 43 Integrated Modeling Framework .............................................................. 45
Conclusions ................................................................................................... 47
Acknowledgements ....................................................................................... 49
References ..................................................................................................... 51


Abbreviations
ANC Absolute neutrophil count ANC0 Baseline neutrophil count AUC Area under the curve BM Biomarker BSA Body surface area CL Clearance CTCAE Common terminology criteria for adverse events CV Coefficient of variation CWRES Conditional weighted residuals dBP Diastolic blood pressure EC50 Drug concentration producing 50% of Emax Emax Maximum effect ET The epirubicin-docetaxel regimen FEC The 5-fluorouracil-epirubicin- cyclophosphamide regimen FN Febrile neutropenia FOCEI First order conditional estimation with interaction G-CSF Granulocyte colony stimulating factor GIST Gastrointestinal stromal tumor HFS Hand-foot syndrome Hill Sigmoidicity factor characterizing the steepness of the concentration-
effect relationship i.v. Intravenous IIV Inter-individual variability IOV Inter-occasion variability Kin Formation rate constant Kout Degradation rate constant MBDD Model based drug development MRT Mean residence time MTT Mean transit time n Number NA Not available OFV Objective function value OS Overall survival PD Pharmacodynamics PK Pharmacokinetics PsN Pearl speaks NONMEM
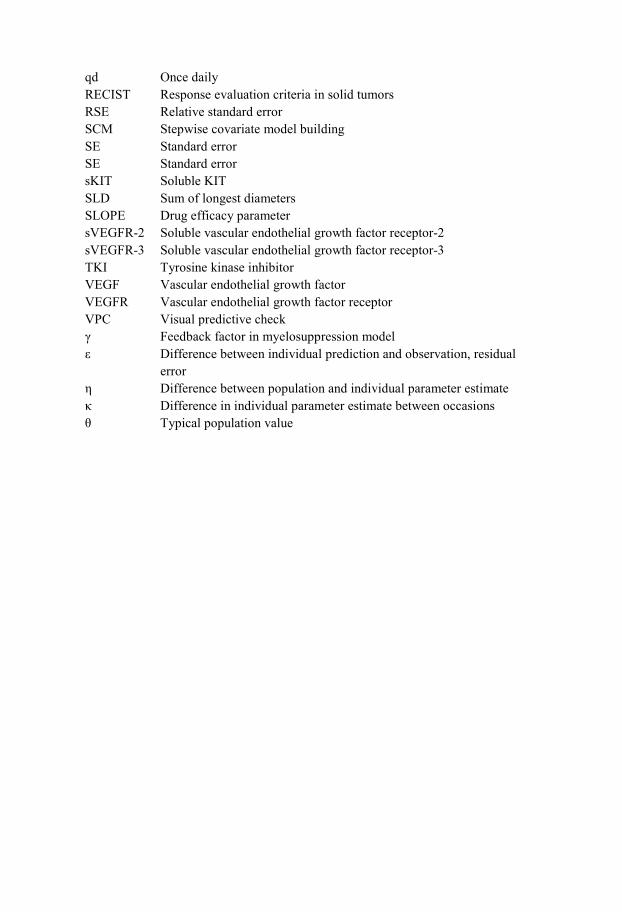
qd Once daily RECIST Response evaluation criteria in solid tumors RSE Relative standard error SCM Stepwise covariate model building SE Standard error SE Standard error sKIT Soluble KIT SLD Sum of longest diameters SLOPE Drug efficacy parameter sVEGFR-2 Soluble vascular endothelial growth factor receptor-2 sVEGFR-3 Soluble vascular endothelial growth factor receptor-3 TKI Tyrosine kinase inhibitor VEGF Vascular endothelial growth factor VEGFR Vascular endothelial growth factor receptor VPC Visual predictive check γ Feedback factor in myelosuppression model ε Difference between individual prediction and observation, residual
error η Difference between population and individual parameter estimate κ Difference in individual parameter estimate between occasions θ Typical population value

11
Introduction
Drug development in oncology is a great challenge because of the large heterogeneity and complexity of the disease. The research area has been struggling with a large proportion of drugs failing in late phases of development due to unacceptable toxicity or lack of efficacy. Only 5% of drugs proceed from first in human to marketing approval [1] and a change in the drug development process is needed.
One initiative is the application of model based drug development (MBDD), recognized by the FDA as a methodology to increase the productivity [2]. The approach involves the development of mathematical and statistical models to quantify the pharmacokinetic (PK) and pharmacodynamic (PD) properties of a drug.
Until now, the main focus in oncology MBDD has been building models for prediction and prevention of side effects [3] e.g. hematological toxicity [4]. New approaches to characterize and quantify the effect of treatment would also be of value. If valid biomarkers are identified prediction of safety and overall survival, based on data in early phases of development is enabled [5]. Applied in a model-based framework, biomarkers may increase trial efficiency, allowing more accurate dose selection and treatment individualization [6].
Besides their application in drug development, model-based techniques could be used to optimize treatment of already approved anticancer drugs. For many drugs in oncology, large variability between individuals with regard to toxicity and treatment outcome are observed. Traditionally most attempts to account for the differences between individuals have been to adjust the individual dose level based on body surface area (BSA), this despite being shown to be of limited value in reducing the variability in PK [7]. Alternatively, if the individual dose was determined by taking into account differences in PK and PD, efficacy and safety may be optimized.

12
Pharmacometrics Pharmacometrics has been defined as “the science of developing and applying mathematical and statistical methods to characterize, understand, and predict a drug’s PK, PD, and biomarker-outcome behavior” [8]. Pharmacometrics is applied with the goal of a more efficient drug development and drug usage and includes a large variety of applications. The developed models may e.g. be used for prediction of untested conditions, evaluation of dosing strategies, designing studies and performing simulations of (pre-) clinical trials. Pharmacometrics may also be utilized to find strategies for treatment individualization, both in drug development and for existing therapies.
Mixed Effects Modeling Non-linear mixed effects modeling (population modeling) is often applied in pharmacometrics. The approach involves simultaneous characterization of the typical individual (the mean) as well as the variability components of the data in the studied population [9]. Separation of different types of variability is possible, which usually is quantified in terms of the difference between individuals (inter-individual variability) and the difference between observations and individual predictions (residual variability). Additionally, the variability within an individual between occasions may be characterized [10].
The general structure of the mixed effects model is expressed in Eq. 1 where observation j in individual i is described by a linear or nonlinear function f(…) with independent variables xij (time, dose) and parameter vector Θi.
ij
2ij i ij ijy f ( x ,Θ ) ε ε ~ N(0,σ )= + (1)
εij is the random effect variable describing residual variability, the difference between the individual prediction and the measurement. Quantification of the residual variability is often referred to as the error model, which commonly is described as additive, proportional (to the individual prediction), or a combination of the two [11]. The parameter value in individual i (Pi) is often assumed to be log-normally distributed around the typical parameter value (θ) (Eq. 2).
iη 2i iP θ e η ~ N(0,ω )= ⋅ (2)
The difference between the individual and typical parameter estimate is described by the random effect ηi. Some of the variability between individuals can often be explained by individual characteristics, covariates (e.g. kidney function, weight)

13
Myelosuppression in Anticancer Treatment Classical cytotoxic anticancer agents act by non-specifically killing rapidly dividing cells. Both malignant and healthy somatic cells, e.g. in the bone marrow, are affected. Treatment with cytotoxic agents thereby results in a temporarily suppressed hematopoietic system with decreased production and lower levels of circulating blood cells.
Neutropenia, defined as low neutrophil counts in blood, is the most common and often dose limiting side effect in cytotoxic treatment [12]. In oncology, the severity of side effects are classified according to the common terminology criteria for adverse events (CTCAE), constituting five different grades [13]. Grade 5 represents death related to the adverse event and grade 4 an event with potentially life-threatening consequences. For neutropenia, grade 4 corresponds to an absolute neutrophil count (ANC) < 0.5∙109 cells/L.
To allow recovery of the hematopoietic system in patients that develop grade 4 neutropenia during chemotherapy, the next dose is often reduced and/or delayed. The reduction in dose intensity [dose delivered per time (mg/m2 per week)] may however compromise the long-term clinical outcome [12]. Several studies in e.g. breast cancer have reported a correlation between the maintenance of high dose intensity and improved treatment outcome in terms of overall survival [14-15].
Treatment with the more specifically acting anticancer agents, such as the vascular endothelial growth factor (VEGF) inhibitor and VEGF receptor (VEGFR) tyrosine kinase inhibitors (TKIs), also results in a suppressed bone marrow, but to a lesser extent [16]. Neutropenia has especially been reported in treatment with the TKIs sorafenib and sunitinib which act on multiple targets, including the stem cell factor c-kit, and inhibits processes involved both in angiogenesis and tumor proliferation. Whether neutropenia is caused by the inhibition of VEGF or some other factor is not known [16].
Febrile Neutropenia Neutrophils serve as the first line of defense against infections in the body. Consequently neutropenia increases the patient's susceptibility to the development of infections, with the extent and duration of neutropenia determining the risk [17]. Fever during neutropenia, i.e. febrile neutropenia (FN), is often the first and only sign of infection and may indicate a life-threatening condition, requiring hospitalization and treatment with i.v. antibiotics [12]. In this work, FN was defined according to the classification used by e.g. the Infectious Disease Society America (IDSA) and the European Organization for Research and Treatment of Cancer (EORTC), as grade 4 neutropenia concurrent with fever (body temperature > 38.5 °C) [18-19].
The risk of developing FN can be reduced by prophylactic treatment with granulocyte stimulating factors (G-CSF) and antibiotics [20-21]. Their use in

14
routine clinical practice has however been questioned due to the emergence of antibiotic resistance, the high cost of G-CSF treatment and its associated risk of acute myeloid leukemia [22]. Guidelines for the use of prophylactic treatment have been developed to help identifying patients at high risk of FN [18-19, 23]. These risk factors include cancer type, chemotherapy regimen and patient specific risk factors such as age (> 65 years), female gender, advanced disease, previous episodes of FN, poor performance status, hemoglobin level (< 12 g/dL) and liver, renal or cardiovascular disease. Also, numerous risk models for FN have been proposed [24-25].
Even though an increased knowledge about the risk factors for FN has emerged over the past years, FN remains a common side effect. For docetaxel treated patients (100 mg/m2) up to 85% develop grade 4 neutropenia (which may be necessary for a good treatment effect) and 12% experience FN [26]. A better understanding of why some individuals develop FN is of importance to improve dosing strategies and to avoid unnecessary treatment interruptions/dose reductions, thereby increasing the probability of a successful treatment.
One aspect that has not yet been fully elucidated is the relationship between the myelosuppression response and FN. The duration and extent of myelosuppression are already known to be important predictors of FN [17] but the shape of the neutrophil time-course may also be informative for the risk of FN [27]. Using PKPD modeling, the full time-course of myelosuppression can be described and thereby provide insight into what role the shape of the profile plays. Patient specific risk factors can also be identified. As grade 4 neutropenia is a criterion in the diagnosis of FN, an investigation of risk factors for FN would need to focus on a population of patients suffering from grade 4 neutropenia.
Models for Myelosuppression Numerous models, ranging from empirical to more mechanism based, have been proposed for the prediction of hematological toxicity in anticancer treatment [28-29]. Myelosuppression has in the past often been described in terms of summary variables such as nadir, grade 4 neutropenia, relative change in cell count and time to nadir. However, with the use of summary variables for neutropenia, important information is often lost as the risk of infections depends on both the extent and duration of neutropenia. A more accurate description of myelosuppression is utilizing information from the whole neutrophil time-profile of hematological toxicity [17, 28-29].
Both empirical [30] and semi-mechanistic models have been developed to describe the full time course of myelosuppression [31-34]. Generally, mechanism-based models are preferred since they allow extrapolation outside the studied conditions [4, 35]. In a mechanism based model the underlying hematological system is considered when characterizing the onset, duration

15
and severity of myelosuppression. These models can also serve as a modeling platform, to which other components may be added to improve the knowledge of the system e.g. incorporation of G-CSF treatment effects on myelosuppression [36].
Semi-mechanistic myelosuppression model The currently most widely used semi-mechanistic model for the prediction of chemotherapy induced hematological toxicity was proposed by Friberg et al. in 2002 [34]. The model has been applied in various settings; to describe and predict myelosuppression following combination treatment [36-37]; to identify patients at a higher risk of neutropenia [38-41]; to optimize doses [42]; and to support drug development [43-45]. The model has also been proven useful for interspecies scaling of drug-induced myelosuppression from rat to human [46].
The model is composed of one compartment representing drug sensitive proliferating progenitor cells in the bone marrow, three transit compartments mimicking the non-mitotic maturation of cells, and one compartment of circulating cells in the blood (Figure 1). A feedback mechanism is also incorporated in the model representing the effect of endogenous growth factors such as G-CSF which increase the proliferation rate when neutrophil levels in the blood are low. In the model the drug is assumed to act by reducing the proliferation rate/induce cell kill.
The model consists of system- and drug-related parameters and is semi-mechanistic in the sense that it describes the main physiological processes determining the number of neutrophils in the circulation. The estimated parameters associated with the hematopoietic system are the baseline neutrophil count (ANC0), the mean transit time through the maturation chain (MTT) and the feedback factor gamma (γ). MTT is defined as n + 1/ktr, in which rate constants (ktr) between the n transit compartments are assumed equal. The model parameter SLOPE, or alternatively Emax and EC50, are drug dependent and describe the drug effect.
Figure 1. Schematic illustration of the semi-mechanistic myelosuppression model

16
Dose Individualization based on Myelosuppression Traditionally, most attempts to account for differences between individuals in treatment with antineoplastic agents have been to adjust the individual dose level based on body surface area. However, the BSA based dosing strategy has been shown to be of limited value in reducing the large variability in exposure and drug sensitivity [7]. For most cytotoxic drugs, new alternatives would be of value.
Several studies have reported a favorable treatment outcome in terms of overall survival in patients experiencing grade 2-3 neutropenia compared to patients with less toxicity [47-50]. Some patients may thus benefit from an increased dose. Dose escalations are however seldom performed outside clinical trials. One approach to identify underexposed patients is to utilize neutrophil counts as a biological marker to guide dose adjustments and thereby ensure sufficient exposure in every individual [51]. Moreover may neutrophil counts be applied to guide dose reductions indicated due to hematological toxicity. Not all patients will benefit from the same relative dose reduction, but today the same decrease is often applied to all individuals.
A model based tool for feedback dose individualization using neutrophil counts as a guide has been proposed [52]. The tool is based on the semi-mechanistic myelosuppression model and uses a maximum a posteriori (Bayesian) approach to calculate a suitable dose (lower or higher) for the next cycle aiming at a pre-specified treatment target:
To judge the value of the dose individualization tool more information is needed about the variability in myelosuppression. A high inter-occasion variability (IOV) may limit the usefulness of the approach, as the next treatment course is less predictable based on information from the previous cycle [10]. Consistency in system-related model estimates and in the magnitude of IIV across drugs has been observed in myelosuppression model parameters [34, 38], whereas the information about IOV is limited.
Sunitinib Sunitinib malate (Sutent®, Pfizer Inc) is an oral multitargeted tyrosine kinase inhibitor approved for the treatment of advanced renal cell carcinoma (RCC), imatinib resistant gastrointestinal stromal tumor (GIST), and pancreatic neuroendocrine tumor (pNET). Sunitinib acts by inhibition of e.g. vascular endothelial growth receptors (VEGFR-1, -2 and -3), platelet-derived growth factor receptors (PDGFR-α and -β) and the stem cell factor receptor (c-KIT) [53-54]. Inhibition of VEGFR and PDGFR is believed to mediate the anti-angiogenic effect, whereas inhibition of c-KIT (relevant in

17
GIST where a gain in function is acquired in c-KIT) results in decreased tumor proliferation [55].
Sunitinib is metabolized primarily by CYP3A4 to the equipotent metabolite SU12662 with a 21% conversion fraction (preclinical data). Sunitinib and SU12662 have similar PK properties with an estimated terminal half-life of 69 and 80 hours, respectively [56].
A recommended starting dose of sunitinib in RCC and GIST is 50 mg qd for 4 weeks followed by a 2-week rest period to give a complete cycle of 6 weeks while in pNET the recommended dose is 37.5 mg daily in a continuous treatment regimen. Doses are adjusted in steps of 12.5 mg when required due to safety and tolerability. Most frequently observed side effects are fatigue, hypertension, diarrhea, neutropenia, elevated lipase levels and hand-foot syndrome [57].
Biomarkers According to the Biomarkers Definitions Working Group (BDWG), a biomarker is defined as “a characteristic that is objectively measured and evaluated as an indicator of normal biological processes, pathogenic processes, or pharmacological responses to a therapeutic intervention” [5].
A valid biomarker should have biological plausibility and correlate with and accurately capture changes in the response parameter [5]. Additionally, assays for the biomarker should also meet acknowledged analytical standards in terms of sensitivity, specificity, precision and reproducibility [8].
Identification of valid biomarkers provide possibilities of getting safe and effective drugs to the market faster and can aid in the drug development process in a variety of ways. For example, biomarkers can contribute knowledge about clinical pharmacology, serve as proof-of-concept (POC) in early phases of drug development, and be used to guide dose selection. Biomarkers may also act as an indicator of safety issues and ultimately improve efficiency of clinical trials if the biomarker is validated as a surrogate endpoint. Furthermore, biomarkers may be helpful in clinical practice as a diagnostic tool, to assess the disease process, monitor response to treatment and for dose individualization [5].
Biomarkers are often distinguished into being prognostic or predictive. Prognostic biomarkers correlate with treatment outcome independent of treatment whereas predictive biomarkers reflect the impact of the treatment [58]. Biomarkers can also be divided into biomolecular (soluble proteins, blood glucose) or clinical biomarkers (blood pressure, tumor size) [59].

18
Biomarkers in Anti-angiogenic Treatment Today, the newly developed targeted anticancer therapies call for the use of biomarker based strategies in drug development as well as in clinical use. One of the applications is to improve dose selection. The dose level for cytotoxic drugs is usually set by the concept of maximum tolerated dose (MTD), since it is believed that maximum exposure is associated with maximum clinical benefit. For the target-specific anticancer agents such as angiogenesis inhibitors, it is unclear whether the MTD is the most effective dose level [60]. Maximum target inhibition may be reached before toxicity arises and a well defined rather than empirically selected dose may avoid unnecessary toxicity.
Another application of biomarkers is the establishment of objective measures of response to treatment. Tumor response is often evaluated based on tumor shrinkage and response rate according to the standard Response Evaluation Criteria in Solid Tumors (RECIST) [61]. Anti-angiogenic drugs are however typically cytostatic in their mechanism of action and stabilize the tumor rather than reduce the size. Consequently tumor shrinkage will be an insensitive estimate of efficacy [60].
Also, biomarkers for treatment individualization would be of value in anti-angiogenic treatment, both to identify patients that will benefit from treatment (personalized medicine) and/or to guide dosing within each individual. One class of drugs that may benefit from dose individualization is the tyrosine kinase inhibitors (TKIs). They are currently administered at fixed dosing across patients, which may result in suboptimal therapy and toxicity, considering the high variability in PK [62].
Biomarkers in sunitinib treatment When trying to identify valid biomarkers in anti-angiogenic therapy the focus has been on circulating proteins reflecting the angiogenesis, circulating endothelial cells and vascular imaging [60, 63]. In sunitinib treatment the vascular endothelial growth factor (VEGF) and soluble fragments of the VEGF receptors-2 and -3 (sVEGFR-2, -3) have been identified as biomarker candidates. Several reports have been published on their consistent change in response to treatment. The levels of VEGF were reported to increase with treatment whereas sVEGFR-2 and sVEGFR-3 decrease, all in a cyclic manner returning to near baseline levels during off-treatment periods [64-67]. Also, a soluble form of the c-Kit receptor (sKIT) has been identified as a possible predictor of survival in sunitinib treated GIST. Decreasing levels with treatment were observed in responding patients [64, 68].
The mechanisms behind the treatment induced biomarker modulations are however not well known. The increased levels of VEGF may result from treatment induced hypoxia, alterations in VEGF clearance from blood or release of VEGF from existing pools [69]. The reduced levels of circulating

19
soluble receptor VEGFR-2 has been indicated to result from VEGF mediated down regulation of VEGFR-2 [70] and the decreased sKIT levels may reflect the reduced number of viable tumor cells in GIST treated patient, which dominantly are c-Kit positive [64].
Easily measured clinical biomarker candidates have also been evaluated in sunitinib treatment with the potential to be used for treatment individualization. Increased blood pressure (hypertension) is a frequent side-effect for anti-angiogenic drugs [16] and the degree of hypertension has been shown to correlate with improved clinical outcome in sunitinib treatment [71-72]. The hypertension is hypothesized to result from a decreased production of nitric oxide and vascular rarefaction due to VEGF blockade, both inducing vasoconstriction and hypertension [16]. Also the degree of neutropenia has been reported to correlate with improved survival in sunitinib treatment and may be a valid biomarker [73].
PKPD Modeling of Biomarkers in Oncology The use of PKPD modeling may increase the information gained from biomarkers by enabling a quantitative characterization of the link between exposure, biomarker concentrations and outcome (e.g. survival or adverse events) by taking the complete time-course of biomarker changes into account. An established relationship may be used for prediction of changes in biomarker concentration and the resulting outcome under a variety of conditions to evaluate e.g. new study designs, dose levels and strategies [8].
Several examples are available on how model based analyses of biomarker data can support the drug development process of anti-cancer drugs [6]. One concept that has proved useful is the prediction of phase III survival data based on the model predicted change in tumor size in phase II [74-76]. The concept is built on a drug specific tumor growth inhibition model coupled with a survival model using baseline tumor size and the relative change in tumor size at week 7 as predictors. The change in tumor size at a specific time point could be seen as a biomarker of drug effect which may be useful when comparing expected clinical response to reference compounds and support end of phase II decisions.
A similar approach was proposed by Wang et al. [77] who developed a disease specific outcome model for non small cell lung cancer (NSCLC) using tumor and survival data from nine different treatment regimens. Observed relative change in tumor size at week 8, performance status and baseline tumor size were predictors of survival. This model may also be used for early estimation of expected treatment outcome, but not to perform dose-response simulations as drug effects not were incorporated in the model.

20
Aims
The general aim of the thesis was to develop pharmacometric models for characterization and quantification of relationships between drug exposure, biomarkers, side effects and efficacy in order to identify predictors of clinical response in anti-cancer drug therapy. Relationships considered:

21
Patients and Methods
Description of Data The data included in this work derive from previously performed prospective clinical trials for the treatment of various types of cancer. All trials were conducted according to the Declaration of Helsinki and approved by local ethics committees. Signed informed consent was obtained from all patients before enrollment.
Hematological Toxicity Data To characterize the variability in myelosuppression (paper I), neutrophil counts and dosing history were available following therapy with docetaxel, paclitaxel, epirubicin-docetaxel, 5-fluorouracil-epirubicin-cyclophosphamide, topotecan and etoposide. The relationship between the shape of the myelosuppression time-course and the probability of FN (paper II) was characterized in the docetaxel treated patients.
Data from treatment cycles in which patients were known to have received G-CSF therapy were excluded.
Docetaxel Data from 244 patients treated with docetaxel for metastatic breast cancer (2262 observations, median 4 treatment cycles) were analyzed [78]. The patients were part of the active control group in a phase III trial studying the effect and tolerability of combined capecitabine/docetaxel therapy. Initial dose level was 100 or 75 mg/m2 (if mild hepatic impairment) of docetaxel infused intravenously over 1-hour every third week. Dose reductions were based on hematological and non-hematological toxicity and resulted in a final dose range of 50-100 mg/m2.
Neutrophil counts (n=820) from patients with observed grade 4 neutropenia (n =140, 57%) during the first course of docetaxel treatment were included in the development of the FN model. Twenty-six of the patients with grade 4 neutropenia (19%) experienced FN. Median (range) time to FN was 7 (6-9) days after treatment and the duration 7 (3-11) days. The neutrophil data for all patients in the first treatment cycle was also characterized for comparison.

22
Paclitaxel The paclitaxel data included neutrophil counts (523 observations, median 3 treatment cycles) from 45 patients with different types of cancer [79]. The initial dose was 175 mg/m2administered as a 3-h infusion every third week. Doses were adjusted based on hematological and non-hematological toxicity resulting in a final dose range of 110-232 mg/m2.
Epirubicin-docetaxel (ET) Neutrophil counts (659 observations, median 4 cycles) sampled from 41 patients with advanced breast cancer treated with the ET regimen were available [37]. The treatment was administered every third week as a 1-hour i.v. infusion of epirubicin followed by a 1-hour free interval and then a 1-hour infusion of docetaxel. Initial doses were 75/70 mg/m2 for epirubicin and docetaxel, respectively, followed by escalated/reduced doses in subsequent cycles based on the resulting leukocyte and platelet counts according to a predefined dosing scheme.
5-Fluoriuracil-epirubicin-cyclophosphamide (FEC) Sixty breast cancer patients treated with either standard or tailored FEC were included in the analysis (1196 neutrophil observations, median 7 cycles) [36]. The treatment was administered every third week as a 15 minute i.v. infusion of cyclophosphamide followed by an i.v. bolus dose of 5- fluorouracil and a bolus or 1-hour infusion of epirubicin. The initial doses of 5-fluorouracil, epirubicin and cyclophosphamide were in the first treatment cycle for standard FEC 600/60/600 mg/m2, respectively, and for the tailored therapy 600/75/900 mg/m2, respectively. Doses in the tailored therapy were stepwise escalated or decreased based on the observed nadir and the dosing day leukocyte/platelet count according to a dose escalation/reduction protocol.
Topotecan The topotecan dataset included neutrophil counts (501 observations, median 2 cycles) from single agent topotecan treatment in 26 patients with various types of solid tumors [80]. The initial dose level was 6 mg/m2 administered as 24-h intravenous infusion every third week.
Etoposide Neutrophil counts (583 observations) from 44 patients with solid tumors and hematological malignancies who received two treatment courses of a 3-day continuous infusion of etoposide were analyzed [81-82]. The patients were randomized to receive either the standard dose (total dose of 375 mg/m2) or concentration guided dosing (total delivered dose 225-789 mg/m2) in a 28 day cycle.

23
GIST Data To develop an integrated modeling framework identifying predictors of clinical response (paper III and IV), data was pooled and analyzed from four phase I-III clinical trials of single agent sunitinib in imatinib resistant GIST [83-86]. Data on soluble biomarkers (VEGF, sVEGFR-2, sVEGFR-3 and sKIT), tumor size, treatment-related side effects (i.e. fatigue, hand-foot syndrome, neutropenia and hypertension) and overall survival were available. Only patients with biomarker, tumor and survival data reported were included in the analysis, in total 303 patients (Table 1).
Sunitinib was administered in one of four different treatment schedules including the 4/2, 2/2, 2/1 (weeks on/weeks off treatment) schedule and continuous treatment, with doses ranging from 0 to 75 mg orally once daily. Patients randomized to receive placebo treatment (n=47) in the placebo-controlled trial were offered sunitinib upon disease progression as defined by the response evaluation criteria in solid tumors (RECIST) [87].
When available, empirical Bayes estimates of PK parameters were used to describe the PK of sunitinib. In patients with missing PK data (n=57) population estimates of PK parameters from a previously developed model [56] were utilized.

Tab
le 1
. Sum
mar
y of
GIS
T da
ta in
clud
ed in
the
deve
lopm
ent o
f the
inte
grat
ed m
odel
ing
fram
ewor
k
Para
met
er (u
nit)
Stud
y 10
04
Stud
y 10
47
Stud
y 10
45
Stud
y 01
3
Ref
eren
ce
Dem
etri
et a
l. [8
3]
Geo
rge
et a
l. [8
4]
Shia
ro e
t al.
[85]
M
aki e
t al.
[86]
n 20
2 ac
tive
Initi
ally
47
plac
ebo
13
36
52
Bio
mar
kers
mea
sure
d V
EGF,
sVEG
FR-2
, sV
EGFR
-3, s
KIT
V
EGF,
sVEG
FR-2
, sV
EGFR
-3, s
KIT
V
EGF,
sVEG
FR-2
, sK
IT
VEG
F, sV
EGFR
-2,
sKIT
Tum
or si
ze a
t bas
elin
e (m
m)a
194
(35-
822)
10
8 (2
9-19
1)
166
(31-
644)
25
5 (5
5-68
7)
Han
d-Fo
ot S
yndr
ome
(%)b
0: 8
3 1:
4.9
2:
6.9
3:
5.4
4:
0
0: 1
00
1: 0
2:
0
3: 0
4:
0
0: 1
4 1:
20
2: 3
4
3: 3
2 4:
0
0: N
.A
1: N
.A
2: N
.A
3: N
.A
4: N
.A
Fatig
ue (%
)b
0: 3
0 1:
33
2: 2
5 3:
11
4: 1
.0
0: 5
4 1:
23
2: 2
3 3:
0
4: 0
0: 3
1 1:
39
2: 1
9 3:
8.3
4:
2.7
0: 1
2 1:
48
2: 3
3 3:
5.7
4:
1.9
Abs
olut
e ne
utro
phil
coun
ts (∙
109 c
ells
/L)c
3.1
(0.0
80-2
0)
1.8
(0.0
10-7
.5)
2.1
(0.2
8-12
) 2.
6 (0
.16-
15)
Dia
stol
ic b
lood
pre
ssur
e (m
mH
g)c
80 (2
0-12
0)
78 (4
0-12
0)
79 (4
0-12
0)
80 (5
0-13
0)
Surv
ival
(wee
ks)a
61 (4
-226
) 31
(81-
15)
37 (2
7-48
) 39
(4-9
6)
N.A
: Not
ava
ilabl
e, a M
edia
n (r
ange
), b H
ighe
st o
bser
ved
seve
rity
with
in a
n in
divi
dual
, cM
edia
n (r
ange
) res
pons
e du
ring
treat
men
t

25
Model Building Analysis of Hematological Toxicity Data The time-course of hematological toxicity following anticancer drug therapy was described using a semi-mechanistic myelosuppression model [34]. The original model structure was modified by fixing the half-life of circulating neutrophils to the literature value of 7 hours [88] instead of modeling the half-life as dependent on the MTT estimate. The neutrophil data was also Box-Cox transformed with λ=0.2 (Eq. 3) prior to the analysis as this has been shown to result in approximately normally distributed residuals [33, 89].
λ
transformedANC 1ANC
λ−
= (3)
The drug effect was originally described as being a linear or Emax function of the drug concentration. For the characterization of the variability, a linear model was assumed and in the development of the FN model linear, Emax and sigmoidal Emax drug-effect relationships were evaluated. Characterization of variability in myelosuppression model parameters The significance and magnitude of variability in myelosuppression model parameters were evaluated and compared across six different treatments including docetaxel, paclitaxel, ET, FEC, topotecan and etoposide.
For consistency, IIV was included for the model parameters ANC0, MTT and SLOPE in all datasets and IOV was evaluated for statistical significance (P < 0.001) for these parameters, using OFV in the likelihood ratio test. One occasion was defined as one treatment course with the nominal cycle length of 21 or 28 (etoposide) days. To exclude the possibility of time-dependent and non-random variability between occasions, linear changes in model parameters with time were evaluated and CWRES [90] was graphically assessed for time dependent changes.
The contribution of IOV to the variability in myelosuppression in relation to total IIV was evaluated by simulations of 1000 time-courses of hematological toxicity for each of the six datasets including IIV only, IOV only and both IOV and IIV.
26
Relationship between the time-course of neutropenia and FN The relationship between the shape of the myelosuppression time-course and the probability of FN was characterized by the development of a logistic regression model. The time-course of hematological toxicity following the first cycle of docetaxel treatment was described for individuals with grade 4 neutropenia (scenario b), by applying the myelosuppression model, and linked to the probability of FN using a sequential [91] modeling approach. Only patients with grade 4 neutropenia were included in the analysis in an attempt to distinguish risk factors for FN from risk factors for grade 4 neutropenia. The neutrophil data in all patients (scenario a) were also characterized for comparison.
The myelosuppression model parameters (ANC0, MTT, SLOPE and γ) and myelosuppression descriptors (nadir and duration of grade IV neutropenia) were assessed as predictors of FN in the logistic regression model. Linear, Emax, sigmoidal Emax and power functions were evaluated to link the predictors to the probability of FN. Also, earlier proposed risk factors [19, 23] (age > 65 years, performance status, haemoglobin level <12 g/dL, and liver function) were explored as potentially being related to the probability of FN using the automated stepwise covariate model building method (SCM) in PsN (p < 0.05 forward inclusion, p < 0.01 backward exclusion).
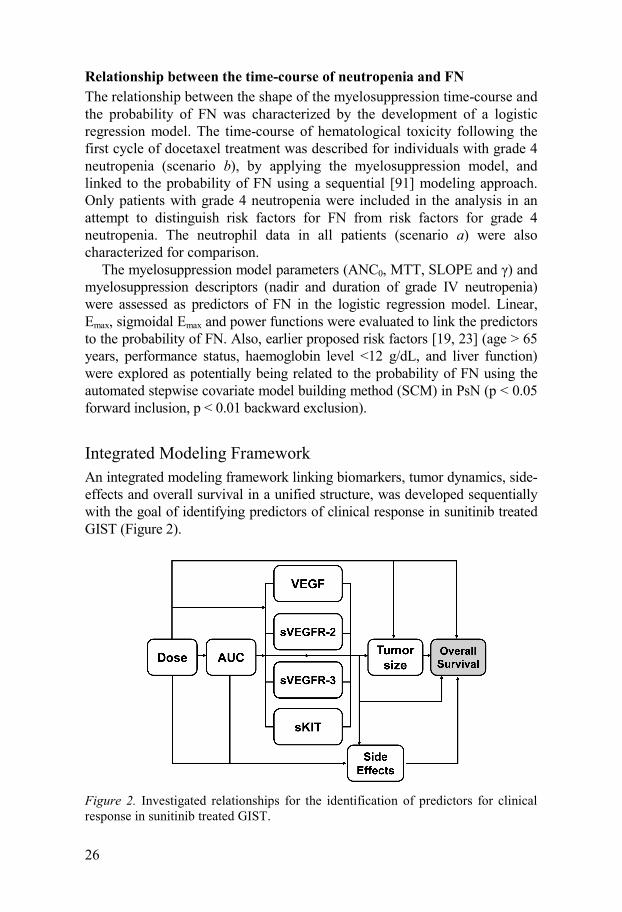
Integrated Modeling Framework An integrated modeling framework linking biomarkers, tumor dynamics, side-effects and overall survival in a unified structure, was developed sequentially with the goal of identifying predictors of clinical response in sunitinib treated GIST (Figure 2).
Figure 2. Investigated relationships for the identification of predictors for clinical response in sunitinib treated GIST.

27
Biomarker models The changes in biomarker concentrations over time were related to sunitinib exposure (dose or AUC calculated as dose/CL/F) using indirect response models with linear, inhibitory Emax (Imax) and sigmoid Imax drug effect relationships [92]. Biomarker modulations in placebo patients due to the natural history of the disease were characterized using linear or non-linear disease progression models. Modeling was performed on log transformed biomarker data. Models for each of the biomarkers were initially developed separately and combined into a joint model to explore correlations between the biomarkers and to reduce the model structure.
The relationships between sunitinib exposure, the biomarkers, tumor size and side effects were assessed by investigating how well measures of the model predicted biomarker concentrations, alone or in addition to drug exposure, could describe the longitudinal data. Baseline concentrations and absolute and relative change in biomarker levels over time were linked to tumor size and side effects in a similar fashion as drug exposure. Competing models were discriminated by using OFV in the likelihood ratio test.
Tumor model The change in tumor size, i.e. the sum of longest diameters (SLD) of target lesions according to RECIST [87], as a function of time, was described by applying a longitudinal model for tumor growth inhibition [74]. The model accounts for the underlying tumor growth dynamics (KG), exposure driven drug effect (KDrug) and resistance development/tumor regrowth [R(t)] (Eq. 4). In the current analysis the observed tumor size at baseline (y0) was incorporated as a covariate acknowledging residual error (ε) in the measurement [93]. The time-course of the different biomarkers [BM(t)] were evaluated to describe the tumor response with KBM representing the tumor size reduction rate constant related to biomarker response (Eq.4).
( ) ( ( ) ) ( ) ( )G BM DRUGdy K y t K BM t K AUC R t y tdt
= ⋅ − ⋅ + ⋅ ⋅ ⋅
( ) λ tR t e− ⋅= (4)
( ) oy 0 y ε= +
To accurately depict simulation results, the frequency and time-course of patient dropout from tumor measurements had to be taken into account. A logistic regression model for the probability of dropout over time was developed and applied in the simulations. AUC, time, progressive disease, SLD at dropout, baseline SLD and relative change in SLD since start of treatment were evaluated as factors affecting dropout.

28
Models for side effects Hematological toxicity The time-course of sunitinib induced neutropenia was described by a semi-mechanistic model for myelosuppression [34]. The original model was applied with the earlier described modifications (see analysis of hematological toxicity data). Linear, Emax, and sigmoid Emax models were evaluated to link drug exposure (dose and AUC) and biomarkers to decreased proliferation/induce cell kill.
Hypertension Changes in diastolic blood pressure (dBP) following sunitinib and placebo treatment were described with an indirect response model with stimulation of the zero-order production rate (Kin) [94]. Also the alternative model with inhibition of the first-order elimination rate constant (Kout) was assessed. Baseline (dBP0) and Kout (reported as MRT = 1/Kout) were estimated (Eq. 5). Linear, Emax and sigmoid Emax-models were evaluated to describe the drug/biomarker effect relationships.
( ) ( )in Drug effect outddBP K 1 dBP AUC K dBP t
dt= ⋅ + ⋅ − ⋅
in 0 outK dBP K= ⋅ (5)
( ) 0dBP 0 dBP=
Fatigue and hand-foot syndrome The severity of fatigue and hand-foot syndrome (HFS) were assessed on a daily basis throughout the studies and reported according to the National Cancer Institute (NCI) common toxicity criteria (CTCAE) [13] as different grades (i.e. 0 = no adverse event, 4 =life-threatening). Grade 4 was only reported in a few patients (for fatigue 1% and for HFS 0%) and was consequently grouped with grade 3 into one category.
A first order Markov model was used to describe the probability and severity of fatigue and HFS over time [95-96]. The Markov model conditions the probability of a transition between different severities on the preceding one, accounting for that the scores are not independent. Here, transitions between all the different grades were considered, in total 16 transitions. The probability of a transition from grade a to grade b for the ith
individual at the jth observation was described according to Eq. 6. fb|a was a function of baseline transition probabilities (Bb|a) and covariate effects g(xi). Inter-individual random effect around parameter Bb|a for subject i (ηi) was assumed to be normally distributed. Three probabilities for each grade were
29
directly estimated and the fourth probability (P0|0, P0|1, P0|2 and P0|3) was expressed as one minus the sum of the associated probabilities.
Time, drug exposure and absolute/relative changes in biomarker concentrations over time were assessed to describe the probability and severity of fatigue and HFS. Linear and non-linear relationships were evaluated. The addition of an effect compartment to account for a delay in the drug distribution was also assessed [97].
|| |
|( ) ln ijb a
ijb a b a iijb a
PLogit P f n
1 P= = +
− (6)
| | ( )b a b a if B g x= +
Overall survival model The relationships between the four biomarkers, tumor size, side effects and overall survival (OS) were explored by a parametric survival (time-to-event) model. The underlying survival distribution was assessed by comparing exponential, Weibull, log-logistic, extreme value and Gompertz probability density functions. Drug exposure (dose and AUC), model predicted (using AUC as predictor), baseline values and absolute and relative changes over time in biomarkers, tumor size, neutropenia and hypertension were evaluated as predictors of OS. The predictors were extrapolated based on developed models until time of death/censoring assuming dosing and schedule according to protocol. For fatigue and HFS the observed severity scores (last observation carried forward) were evaluated as predictors of OS by including each observed score as a predictor. Also, point estimates of the relative change in tumor size and biomarkers at treatment week 6 or 12 were assessed for the relationship to OS.
Data Analysis
Software Modeling and simulations were performed using the non-linear mixed effects modeling approach implemented in NONMEM (version VI and 7) [98]. The first-order conditional estimation method with interaction (FOCEI) was used for parameter estimation of continuous data, and the Laplacian estimation method with the likelihood option for categorical type data.
The R-based software Xpose (version 4) [99] was applied to create graphical diagnostics and the PsN toolkit (version 3) [100-101] was utilized for execution of models, covariate model building (SCM), non-parametric bootstraps, log-likelihood profiling, and simulations and calculations for visual predictive checks (VPCs).

30
Models for random effects Random inter-individual variability (IIV) in model parameters was assumed to be log-normally distributed around the population mean and modelled in terms of eta (η) variables. A normal distribution (on the logit scale) of the IIV was assumed for the fatigue and HFS-models (paper IV). IOV (evaluated in paper I) was described by the kappa (κ) parameter and included in the same manner as IIV assuming constant variances across all occasions as previously described [10]. The ηs and κs were assumed to be normally distributed parameters with mean zero and estimated variances ω2 and π2, respectively.
Random residual variability was explored using additive, proportional and combined (additive + proportional) error models. For the hematological toxicity data, an additive (on Box-Cox scale) residual error was applied.
Model selection Model selection was based on graphical assessment of goodness of fit plots, comparison of the objective function value (OFV) provided by NONMEM in the likelihood ratio test, plausibility, and precision in parameter estimates. Simulation properties were also considered.
Model evaluation The final models were evaluated by internal validation procedures. Model robustness was judged by relative standard errors (RSE) of the model parameter estimates obtained by non-parametric bootstrapping with 200 samples (n=100 in paper II). For the models developed for the evaluation of IOV in myelosuppression (paper I), standard errors were obtained from the S matrix (R matrix for topotecan) in NONMEM because of long run times.
The predictive performance of the final models was assessed by simulation based diagnostics. Models for continuous data were evaluated by standard visual predictive checks (VPCs) [102] and prediction-corrected visual predictive checks (pcVPCs) [103]. Prediction intervals with 95% confidence intervals were derived from 500 simulated datasets and graphically compared with the corresponding percentiles for the observed data (normalized to the typical population prediction for the pcVPCs).
Models for categorical type data were assessed by an adapted version of the VPC [104]. The observed data and 95% prediction interval for the simulated fraction of observations for each category were plotted versus an independent variable and compared. Also, summary statistics such as the observed and median number of simulated events and transitions between different severity scores were compared for consistency.
Drop-out and time-to-event type data was evaluated by creation of Kaplan-Meier plots of observed data overlaid with a 95% confidence interval calculated from 200 simulations.

31
Results
Variability in Myelosuppression Model Parameters A semi-mechanistic model for myelosuppression adequately characterized the neutrophil-time course following single-agent and combination therapy for all the investigated datasets. The system-related parameters and IIV estimates were in agreement with previously reported results [34, 38].
For all the investigated treatments, except topotecan, IOV in the myelosuppression model parameter MTT was significant and of similar magnitude. For docetaxel and etoposide IOV in SLOPE was in addition also significant. Only IOV in SLOPE was significant for topotecan (Table 2). Inclusion of IOV decreased the residual errors by an average of 21% with the highest decrease observed for the paclitaxel and etoposide datasets (Table 2). No significant time-dependent trends were identified in the parameters with IOV included, indicating that the estimated variability was random.
In all the six analyzed data sets, the contribution of IOV to the variability in nadir was clearly lower than IIV as shown in Figure 3. This is also illustrated by the relative impact of total IIV and IOV on the variability in the myelosuppression time-course for 20 simulated individuals (Figure 4).
Table 2. Estimated IIV and IOV (relative SE %) for the six analyzed datasets. IIV CV% IOV CV%
ANC0 MTT SLOPE ANC0 MTT SLOPE Δ Residual Error %
Docetaxel 33 (5.9) 9.0 (19) 37 (7.0) - 16 (4.8) 19 (12) -17 Paclitaxel 36 (13) 17 (22) 39 (20) - 16 (8.5) - -41 ET 37 (15 12 (21) a22 (23) - 8.0 (20) - -17 FEC 28 (15) 16 (13) a23 (14) - 7.5 (11) - -7.0 Topotecan 32 (27) 15 (34) 62 (45) - - 28 (39) -3.3 Etoposide 47 (15) 23 (24) 28 (42) - 12 (39) 39 (24) -38 CV: Coefficient of variation Δ Residual Error; relative change in residual error after inclusion of IOV aCommon IIV parameter for the component drugs

32
Figure 3. Box-plots of nadir distributions from 1000 simulated patients using the final models including IOV and IIV, only IIV or only IOV. The solid circle corresponds to the median, the top and bottom of the box the 25th and 75th percentiles and the whiskers to the maximum and minimum of the simulated nadir counts.
Figure 4. Twenty individual time-courses of myelosuppression simulated using the final models including IIV only, IOV only or both IIV and IOV for all the six investigated datasets.

33
Relationship between Neutropenia and FN The neutrophil time-course following the first cycle of docetaxel treatment in all patients (a) and in the subpopulation that developed grade 4 neutropenia (b) was well characterized by a semi-mechanistic myelosuppression model (Table 3). The drug effect was described by a sigmoidal Emax-function which significantly improved the model fit, especially around nadir. The myelosuppression model parameter estimates were as expected somewhat different for the cohort of patients with grade 4 neutropenia (b). The parameter MTT was shorter, EC50 was lower and Emax was higher in grade 4 neutropenia individuals, compared to when data for the full population was described (Table 3).
Evaluating the model by simulating 500 replicates of the data, using parameter estimates from scenario a, showed that the model accurately predicted the number of patients with grade 4 neutropenia. The median simulated number of individuals (n=136) were well in agreement with the observed (n=140). Also, the predictive performance of the final myelosuppression models was adequate as illustrated by VPCs (Figure 5).
Table 3. Final model parameter estimates (relative SE %) for the myelosuppression model and the logistic regression model.
Myelosuppresion model FN model (a) All patients (b) Grade 4 patients
Parameter (unit) Estimate IIV CV% Estimate IIV CV% Parameter Estimate
ANC0 (∙109cells/L) 4.65 (3.4) 32 (8.6) 4.65 (1.7) 32 (5.3) θ1 -0.360 (32) MTT (hours) 86.5 (3.6) 19 (9.2) 78.3 (2.1) 12 (5.5) θEC50 -0.160 (21) γ 0.159 (3.7) 20 (12) 0.155 (3.2) 24 (8.1) HillEC50 7.76 (11) Emax 91.3 (6.6) - 95.1 (4.9) - θMTT -0.122 (43) EC50 (mg/L) 1.50 (8.4) 68 (7.4) 1.39 (10) 36 (9.4) HillMTT 25.4 (8.3) Hill 1.64 (9.9) - 1.45 (10) - Residual errora 0.497 (5.5) - 0.468 (5.1) -
aadditive error on Box-Cox scale
EC50
50
Hill50
50 EC50
ECf ( EC ) θTVEC
=
MTTHill
MTTMTTf ( MTT ) θ
TVMTT =
(7)
[ ][ ]1 50
1 50
exp θ f ( EC ) f ( MTT )P
1 exp θ f ( EC ) f ( MTT )+ +
=+ + +

34
Figure 5. VPC of the final myelosuppression models including all patients (a, left) and only patients with grade 4 neutropenia (b, right). Observed neutrophil data (o), median (—) and the 5th and 95th percentiles (---) of the observed data. Shaded area is the 95% confidence intervals based on the simulated data (n=500) for the corresponding percentiles.
The drug potency parameter (EC50) and mean transit time (MTT) were both significantly related to the probability of FN via a power function in a logistic regression model. The power function included the constant parameters (θEC50, θMTT, and HillEC50, HillMTT) and the individual parameter estimates were normalised to the typical value in the population (TVEC50 and TVMTT) (Eq. 7, Table 3).
The results indicate that patients with high drug sensitivity (low EC50) and a fast decline of neutrophils (short MTT) are more likely to develop FN. None of the evaluated risk factors such as age, performance status and liver function were significantly related to the probability of FN when EC50 and MTT had been included in the model. Neither was predicted nadir or duration of grade IV neutropenia.
The evaluation of the logistic regression model shows a satisfactory predictive performance as depicted by a categorical VPC (Figure 6). The model also accurately simulates number of FN events as the observed number (n=26) were within the 90th prediction interval of the simulated number of FN events (median n=21).

35
Figure 6. VPC of the final FN model. The solid line represents the predicted fraction and the shaded area the 95% confidence interval for the simulated fraction of MTT and EC50 estimates for individuals with and without an episode of FN.
Integrated Modeling Framework
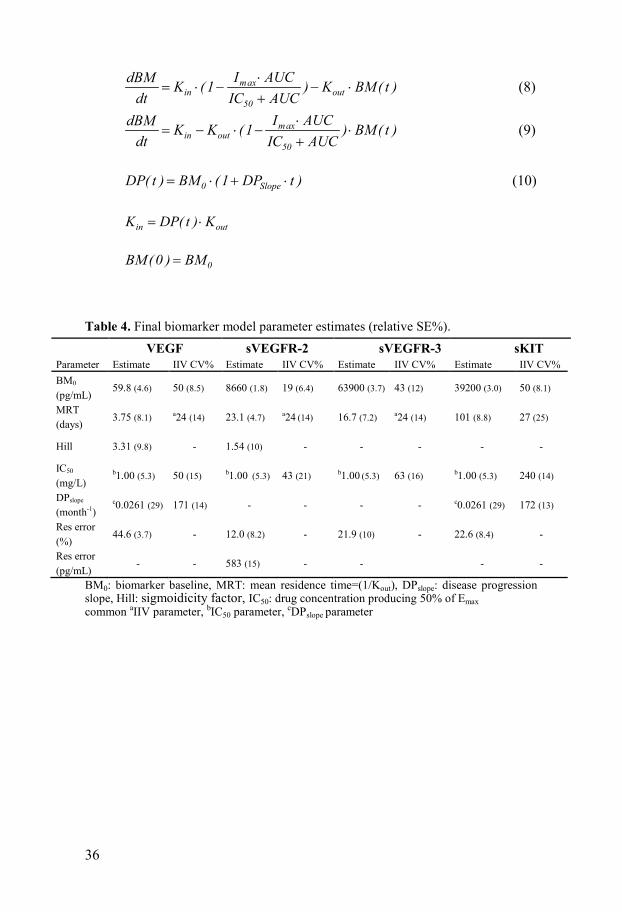
Biomarker models The changes in biomarker levels with time [BM(t)] were described using indirect response models with inhibitory sigmoid Imax (VEGF, sVEGFR-2) or Imax (sKIT, sVEGFR-3) drug effect relationships with Imax fixed to 1. Changes in sVEGFR-2, -3 and sKIT due to sunitinib treatment were described with models with a decreased zero-order production rate (Kin) (Eq. 8) and VEGF with an inhibited degradation rate (Kout) (Eq. 9). A linear disease progression model characterized the increase of VEGF and sKIT over time (Eq. 10). The final models were reduced to include a common drug effect parameter (IC50) for the four biomarkers and a common disease progression parameter (DPSlope) for sKIT and VEGF. IC50 was highly correlated (75-92%) for VEGF, sVEGFR-2 and -3 and the magnitude of IIV in mean residence time (MRT=1/Kout) for VEGF, sVEGFR-2 and -3 was quantified using a common variability term (Table 4).
Data on sVEGFR-3 was not available for two of the studies, in total 69 patients. sVEGFR-2 and -3 were however highly correlated in IC50 (92%) and 100% correlated in MRT which contributed to the information about the sVEGFR-3 response in individuals with missing data. The predictive performance of the final biomarker models as illustrated by VPCs (Figure 7) shows an adequate description of the biomarker data.
36
maxin out
50
I AUCdBM K (1 ) K BM( t )dt IC AUC
⋅= ⋅ − − ⋅
+ (8)
maxin out
50
I AUCdBM K K (1 ) BM( t )dt IC AUC
⋅= − ⋅ − ⋅
+ (9)
0 SlopeDP( t ) BM (1 DP t )= ⋅ + ⋅ (10)
in outK DP( t ) K= ⋅
0BM(0 ) BM=
Table 4. Final biomarker model parameter estimates (relative SE%). VEGF sVEGFR-2 sVEGFR-3 sKIT Parameter Estimate IIV CV% Estimate IIV CV% Estimate IIV CV% Estimate IIV CV% BM0 (pg/mL)
59.8 (4.6) 50 (8.5) 8660 (1.8) 19 (6.4) 63900 (3.7) 43 (12) 39200 (3.0) 50 (8.1)
MRT (days)
3.75 (8.1) a24 (14) 23.1 (4.7) a24 (14) 16.7 (7.2) a24 (14) 101 (8.8) 27 (25)
Hill 3.31 (9.8) - 1.54 (10) - - - - -
IC50 (mg/L)
b1.00 (5.3) 50 (15) b1.00 (5.3) 43 (21) b1.00 (5.3) 63 (16) b1.00 (5.3) 240 (14)
DPslope
(month-1) c0.0261 (29) 171 (14) - - - - c0.0261 (29) 172 (13)
Res error (%)
44.6 (3.7) - 12.0 (8.2) - 21.9 (10) - 22.6 (8.4) -
Res error (pg/mL)
- - 583 (15) - - - -
BM0: biomarker baseline, MRT: mean residence time=(1/Kout), DPslope: disease progression slope, Hill: sigmoidicity factor, IC50: drug concentration producing 50% of Emax common aIIV parameter, bIC50 parameter, cDPslope parameter

37
Figure 7. Visual predictive checks of final biomarker models based on 500 simulations. Circles represent observed BM data, solid lines the median of the observed data and dashed lines the 5th and 95th percentiles of the observed data. Shaded areas are the 95% confidence intervals for the simulated data corresponding percentiles.
Tumor growth inhibition model The change in SLD over time following placebo and sunitinib treatment was well characterized by a tumor growth inhibition model [74]. The model predicted relative change in sKIT over time was identified as the statistically best predictor of the longitudinal tumor size data. In addition to sKIT, AUC and the predicted relative change in sVEGFR-3 over time were also identified as significant predictors of change in tumor size (Table 5).
The developed logistic regression model for the probability of dropout included time since start of study (θTime), observed SLD at drop-out (θSLD) and progressive disease (> 20% increase in tumor size since nadir, yes/no) (θPD) as significant predictors (Table 5).
Models for side effects Hematological toxicity A semi-physiological myelosuppression model, with an Emax drug-effect relationship, adequately characterized the extent and time-course of neutropenia following sunitinib treatment (Figure 8). No systematic change in ANC levels were observed for placebo patients. A lower baseline parameter (ANC0-japanese) was estimated for the Japanese patients included in one of the studies (Table 5).

38
All of the investigated biomarkers were significantly correlated to the changes in ANC levels when assessed separately. The statistically best descriptor (∆OFV -170 compared with AUC) was the relative change in sVEGFR-3 over time (sVEGFR-3REL). No additional significant descriptors (AUC or biomarkers) were identified when the sVEGFR-3 relationship was included.
Diastolic blood pressure The increase in dBP following sunitinib treatment was described by an indirect response model with stimulation of the production rate (Kin) and a linear drug-effect relationship (dBPslope). No increase in blood pressure could be characterized for the placebo treated patients but a significantly higher baseline (dBP0) was quantified (Table 5). None of the evaluated biomarkers were found to be significantly related to the changes in dBP following sunitinib treatment.
The developed model predicts a drug-induced increase in dBP by 10 mmHg for the typical patient treated with 50 mg sunitinib in the 4/2 schedule. The predictive performance is illustrated by a pcVPC (Figure 8).
Figure 8. pcVPCs for the final myelosuppression (left) and dBP-model (right) in actively treated patients. Observed data (o), median (—) and the 5th and 95th percentiles (---) of the observed data. Shaded area is the 95% confidence interval based on simulated data (n=500) for the corresponding percentiles.

Tabl
e 5.
Par
amet
er e
stim
ates
for t
he fi
nal t
umor
, dro
pout
, mye
losu
ppre
ssio
n an
d dB
P m
odel
s (re
lativ
e SE
%)
Tum
or m
odel
Mye
losu
ppre
ssio
n m
odel
Pa
ram
eter
(uni
t) Es
timat
e II
V C
V%
Para
met
er (u
nit)
Estim
ate
IIV
CV
%
KG (w
eek-1
) 0.
0118
(23)
54
(27)
AN
C0
(∙109
cells
/L)
4.94
(2.8
) 42
(5.6
) K
DR
UG (w
eek-1
∙AU
C-1
) 0.
0050
(47)
11
9 (6
1)
A
NC
0 -J
apan
ese (
∙109 c
ells
/L)
3.69
(6.9
) 42
(5.6
) K
sKIT
(wee
k-1)
-0.0
0282
(89)
24
3 (3
8)
M
TT (h
ours
) 24
8 (3
.6)
17 (1
9)
KsV
EGFR
-3 (w
eek-1
) -0
.037
1 (3
0)
-
AN
C E
max
0.
520
(9.1
) 13
(36)
λ
(wee
k-1)
0.02
17 (3
2)
-
AN
C E
C50
(pg∙
h/m
L)
0.55
2 (1
7.2)
46
(16)
R
esid
ual e
rror
(%)
12.5
(20)
-
γ
0.36
2 (7
.4)
-
R
esid
ual e
rror
* 0.
406
(4.3
) -
D
ropo
ut m
odel
Blo
od p
ress
ure
mod
el
Para
met
er (u
nit)
Estim
ate
Para
met
er (u
nit)
Estim
ate
IIV
CV
%
Inte
rcep
t -3
.49
(5.0
)
dB
P 0 (m
mH
g)
71.8
(1.0
) 12
(6.7
) θ P
D
1.12
(12)
dB
P 0 P
lace
bo (m
mH
g)
77.6
(1.6
) 12
(6.7
) θ S
LD (m
m-1
) 0.
0010
5 (5
0)
MR
T (=
1/K
out)
(hou
rs)
361
(17)
83
(12)
θ T
ime (
wee
k-1)
0.00
707
(54)
dB
P slo
pe (L
/mg∙
h)
0.11
9 (9
.4)
65 (1
1)
Res
idua
l err
or (m
mH
g)
6.24
(16)
-
Res
idua
l err
or (%
) 6.
97 (2
4)
K
G: t
umor
gro
wth
rate
con
stan
t, K
DR
UG: t
umor
size
redu
ctio
n ra
te c
onst
ant,
KsK
IT: t
umor
size
redu
ctio
n ra
te c
onst
ant,
KsV
EGFR
-3: t
umor
size
redu
ctio
n ra
te
cons
tant
, λ: r
esis
tanc
e ap
pear
ance
rate
con
stan
t, θ S
LD: p
aram
eter
rela
ted
to tu
mor
size
at d
ropo
ut, θ
PD: p
aram
eter
rela
ted
to o
ccur
renc
e of
dis
ease
pro
gres
sion
, θ T
ime:
para
met
er re
late
d to
tim
e si
nce
star
t of s
tudy
, AN
C0:
base
line
AN
C, M
TT: m
ean
trans
it tim
e, *
resi
dual
err
or o
n B
ox-C
ox tr
ansf
orm
ed sc
ale,
dB
P 0: b
asel
ine
dBP,
MR
T: m
ean r
esid
ence
tim
e

40
Fatigue and Hand-foot syndrome A first order Markov model accurately described the incidence and severity of fatigue and HFS over time as being linearly dependent on AUC in the effect compartment or biomarkers [g(xi)=Slopeb|a∙AUCe or BM(t)] (Figure 9). No significant time trend was identified in addition to the drug/biomarker effect.
The relative change from baseline over time for all the four biomarkers was significantly related to the probability and severity of fatigue and HFS. sVEGFR-3 (sVEGFR-3REL) was however the statistically best descriptor, where a larger decrease in sVEGFR-3REL was associated with increased probability and severity of fatigue and HFS. Addition of AUC or any of the other biomarkers did not result in a statistically significant improvement.
Figure 9. VPC of the final model for the probability and severity of fatigue (left) and HFS (right) in actively treated patients stratified by severity grade. (—) represent the observed time-course of each severity grade and the shaded areas are the 95% confidence interval generated from simulations (n=500).
Overall survival model The four investigated soluble biomarkers, tumor size, ANC and dBP were all statistically significant predictors of OS, whereas fatigue and HFS were not. Two alternative survival models were identified. The first model used the biomarker candidates as predictors and the second used clinical markers in terms of sunitinib induced side-effects. A Weibull model (λ, hazard coefficient, α; shape factor) characterized the underlying baseline hazard (Eq. 11-12).
The most significant predictor of the four evaluated biomarkers was the model predicted relative change in sVEGFR-3 concentrations over time (sVEGFR-3REL). Also, the observed tumor size at the start of the study (Tumor base) was identified as a predictor (Table 6, Eq. 11). None of the other biomarkers or tumor size measures were significant after inclusion of sVEGFR-3 and tumor size at baseline. A clear improvement in the model fit, in terms of OFV, was observed when using the predicted time course instead

41
of a point estimate of change in biomarker levels or tumor size at 6 or 12 weeks. The model predicted an increased risk of death for patients with less decrease in sVEGFR-3 levels and larger tumor lesions at the start of treatment.
( ) 1 REL 2β sVEGFR 3 β Tumorbaseα 1h t λ α t e ⋅ − + ⋅−= ⋅ ⋅ ⋅ (11)
The other model based on clinical predictors, included the time-course of neutropenia [ANC(t)], the relative change in dBP (dBPREL) over time and tumor baseline as predictors (Table 6, Eq. 12). A more pronounced neutropenia over time and a larger relative increase in dBP was associated with a decreased risk of death. The model improved further (∆ OFV -14.3) by the inclusion of sVEGFR-3REL, but the biomarker was not included since the model then would be less practical to use clinically. The two models were statistically equal good descriptors of OS. A difference in OFV by -4.7 was obtained for the model including side effects, but with one extra parameter.
( ( ) )/( ) 1 2 3 RELβ ANC t 5 5 β Tumorbase β dBPα 1h t λ α t e ⋅ − + ⋅ + ⋅−= ⋅ ⋅ ⋅ (12)
The survival models were also evaluated on how well they predicted survival using only data from the first 6 weeks of treatment. A similar fit was obtained (∆OFV ≤ 9.5) which indicated that only a few sVEGFR-3, ANC or dBP measurements are needed to evaluate the treatment response and to predict the probability of survival given the model.
The two survival models showed good predictive properties as illustrated by KM-plots (Figure 10). The observed survival data was well within the 95% confidence intervals calculated from simulations of 200 datasets using the final models.
Table 6. Final parameter estimates (relative SE%) for the two alternative OS models sVEGFR-3, Tumor base ANC, dBP, Tumor base
Parameter (unit) Estimate Parameter (unit) Estimate
λ (week-1) 0.00596 (49) λ (week-1) 0.00787 (55)
α 1.23 (6.9) α 1.15 (9.1) β1 sVEGFR-3REL 3.77 (16) β1 ANC (L/109 cells) 4.76 (31) β2 Tumor base (mm-1) 0.00237 (28) β2 Tumor base (mm-1) 0.00172 (46) β3 dBPREL -1.29 (27) λ and α: scale and shape factor in the Weibull probability density function, β1 sVEGFR-3: parameter relating sVEGFR-3 to the hazard, β2 Tumor base: parameter relating observed baseline tumor size to the hazard, β1 ANC: parameter relating ANC scaled to a typical value of 5 to the hazard, β3 dBPREL: parameter relating relative change in blood pressure to the hazard.

42
Figure 10. KM-plots of the observed survival data (solid line) and the 95% confidence interval (shaded area) based on the simulated data (n=200) for the final survival models. A Weibull model (λ=0.0019 week-1, α=1.3) was applied in the simulations to describe censoring. The left panels illustrate the predictive properties of the sVEGFR-3 model stratified by above and below median baseline tumor size (upper panel) and sVEGFR-3 (lower panel). The right panel depicts the predictive performance of the OS model using ANC, dBP and baseline tumor size as predictors.

43
Discussion
Hematological Toxicity The variability is an important factor to consider when determining the value of feedback dose individualization. If IOV is considerably greater than IIV there is little benefit in such an approach [10]. A measurement, e.g. neutrophil count, from one occasion may then not contain enough information about the response in the next occasion and trying to reduce the variability between individuals would be to chasing noise.
The variability magnitude was investigated for six different anti-cancer treatments. IIV was shown to be in agreement with previous results [34, 38] and IOV in MTT was found to be significant, limited and of the same magnitude for all the investigated datasets, except topotecan. The significant IOV in MTT may indicate that MTT is a parameter which influences most of the neutrophil observations and therefore the inclusion results in improvement of the fit. Variability in baseline neutrophil count and drug sensitivity within an individual were however of lower importance.
When comparing the contribution of IIV and IOV to the variability in nadir counts the conclusion was drawn that the estimated impact of IOV in myelosuppression parameters was relatively lower than the IIV. Myelosuppression in cytotoxic treatment may thereby be predictable from one treatment course to another.
A simulation study assessing the influence of the variability magnitude in reaching a target neutrophil count by model based dose individualization confirmed that IOV in myelosuppression was the limiting factor for success, rather than IIV [105]. A large IOV, especially in the myelosuppression model parameter SLOPE, limits the potential of dose adaptation based on neutrophil measurements. The usefulness of a model-based dose individualization approach [52] was further illustrated by the simulation study [105]. It was shown that the use of the tool allowed increase in dose, up to twice the initial amount, in patients with sub-toxic levels without increasing the occurrence of grade 4 neutropenia. Also, the number of patients within a target range increased 27% compared with using the traditional (in etoposide) one-sided 25% dose adjustment approach in patients that required dose reductions. The results from the simulation study and the characterized IOV in myelosuppression indicate that model-guided

44
dose individualization using ANC as a biomarker may be a valid approach for improved dosing in cytotoxic treatment.
Furthermore, has the relative change in ANC been proposed as a predictor of change in tumor size in metastatic breast cancer patients treated with docetaxel [106], confirming the use of ANC as biomarker to improve treatment outcome.
A better understanding of why some individuals develop FN, the potentially life threatening side effect, is of importance to improve dosing strategies in treatment with cytotoxic agents. Through the use of a semi-mechanistic myelosuppression model [34], the entire individual time-course of changes in ANC could be characterized and taken into account in defining the relationship to the probability of FN. A logistic regression model was developed with the drug effect parameter (EC50) and the mean transit time through the non-mitotic maturation chain (MTT) as significant predictors of the risk of FN. Patients with high drug sensitivity (low EC50) and fast decline of neutrophils (short MTT) were more likely to develop FN.
It was early recognized that the risk of an infection was dependent on the degree and duration of neutropenia [17]. The developed model indicates however that the probability of FN in metastatic breast cancer patients treated with docetaxel is not only dependent on the duration and extent of neutropenia but also the onset. The whole shape of the myelosuppression time-course is thereby important. Patients developing FN were predicted to have an earlier and lower nadir than patients that have a small risk. This is in agreement with the earlier, lower nadir [26] and relatively high incidence of FN in docetaxel treatment compared with other cytotoxic agents [19, 23].
As grade 4 neutropenia is a criterion in the diagnosis of FN we made an attempt to distinguish predictors for FN occurrence from predictors of grade 4 neutropenia. Only the subpopulation with grade 4 neutropenia was thereby included in the development of the model. In earlier published models of logistic regression for risk factors associated with FN [107-108], it is unclear if the identified predictors are solely FN predictors or also predictors for grade 4, since the analyses were based on the total study population. The same concern is raised for earlier proposed risk factors [19, 23], which may explain why none of the evaluated factors were found significant when MTT and EC50 were included in the model.
The usefulness of the developed model will increase if factors predictive of EC50 and MTT, in addition to those reported by Kloft et al. [38], could be established. Identification of patients at high risk before treatment is then possible which is of importance since FN often occurs in the first treatment cycle [109-110]. Another approach is to evaluate the clinical utility of using limited information on ANC for Bayesian estimation of individual model parameters. Patients at higher risk could thereby be identified early during the treatment cycle and prophylactic treatment initiated.

45
The continuation of this work includes evaluation of how general the developed model is, i.e. if the relationship between the shape of the myelosuppression time-profile and FN also is valid in treatment with other cytotoxic agents.
Integrated Modeling Framework To identify robust predictors of clinical response in GIST an overarching modeling framework was developed linking drug exposure, soluble biomarkers, tumor size dynamics, side effects and OS in a unified structure.
Two alternative OS models were developed to increase the clinical utility of the identified predictors. One model included the biomolecular marker sVEGFR-3 together with tumor size at baseline as predictors and the other one, the relative change in diastolic blood pressure, the time course of ANC and tumor size at baseline. The side effects are routinely measured in the clinic and are suitable for dose individualization whereas the soluble biomarkers require specific analyses to be quantified. Furthermore, sVEGFR-3 was found to be predictive of changes in ANC, fatigue and HFS, and sVEGFR-3 together with sKIT and AUC were predictive of tumor dynamics.
Early changes in tumor size, e.g. the relative change at week 7, have previously been proposed as a biomarker of OS. This biomarker was identified in a model based analysis evaluating early changes in tumor size in phase II as predictor of treatment outcome in phase III. The approach has later been shown useful in several indications [74-76]. Also, here the change in tumor size was found to be a significant predictor of OS but the studied biomarker candidates and evaluated side effects provided a statistically better description of the survival data. When the relationship to sVEGFR-3 or ANC and dBP had been included in the survival models, there was no additional improvement in the description of the data by tumor size. This result was not surprising since sunitinib primarily exhibits a cytostatic rather than a cytotoxic effect [111] and consequently change in tumor size may be a less informative predictor of OS. This may also be an explanation to why sKIT was identified as the most significant descriptor of tumor size but was less predictive of OS.
In a previous publication sKIT has been reported as a biomarker of time-to progression in sunitinib treated GIST [68], a result that differs from our conclusion. The proposal was however based on a traditional statistical analysis evaluating the relationship using discrete time points. The time course of sVEGFR-2, sVEGFR-3 and VEGF is schedule dependent and the predictor identified is thereby highly dependent on the time point chosen to study the relationship. Here a modeling framework was proposed that allows integration of the whole biomarker time course and the response, thereby enabling identification of other biomarker relationships. The use of a

46
parametric time-to-event model allowed simulations of the clinical outcome. The importance of how one evaluates the significance of biomarkers was also illustrated by the clear improvement in the model fit, in terms of OFV, when using the predicted time course instead of a point estimate to predict OS.
Our results indicated that individuals with a larger relative increase in dBP, more pronounced neutropenia and a smaller tumor size at baseline have longer OS, which confirmed earlier proposals of dBP and ANC as biomarkers of OS in sunitinib treatment [71-73]. Cut-off values for ANC (< 1.5∙109 cells/L) or dBP (> 90 mmHg) at any time during treatment were then associated with longer OS. dBP has also been identified as a marker of pharmacological response to sunitinib treatment in healthy volunteers [112]. The two survival models were shown to adequately predict treatment response using sVEGFR-3 or ANC and dBP data from only the first treatment cycle, i.e. 6 weeks. This indicated that only a few measurements are needed to predict the probability of survival given the model, enabling monitoring of early response to treatment. The developed framework may be used to increase the knowledge about dosing of sunitinib in GIST by prediction of survival for different doses and schedule. The risk of side effects may simultaneously be taken into account.
As the identified predictors, blood pressure and absolute neutrophil counts are easily measured, they may be suitable to use for dose individualization in clinical practice. An individualized dose will minimize the occurrence of side effects and ensure sufficient drug exposure. This is of importance since a larger sunitinib exposure has previously been reported to be associated with longer OS and time-to progression [113]. A simulation study has been planned to develop and evaluate a dose individualization approach based on the model, in order to optimize the use of sunitinib in GIST. The magnitude and significance of inter-occasion variability will also be evaluated.
The identified predictors require evaluation in larger prospective trials to determine their utility. Also, their predictive capacity in other sunitinib indications, such as renal cell carcinoma, and anti-angiogenic treatments should be evaluated. If the predictors are found to be general, the developed models have a potential to be used in drug development to guide dose-selection for the same class of drugs.

47
Conclusions
In this thesis, relationships between drug exposure, biomarkers, side effects and efficacy were characterized in order to identify predictors of clinical response in anti-cancer drug therapy (Figure 11).
Several PKPD models were developed that may serve as examples on how pharmacometrics can be used to assess exposure-biomarker-side-effects-and clinical outcome relationships in an integrated manner. The identified predictors enable new strategies to quantify the effect of treatment and may be used as a basis for more efficient drug development and drug usage. The developed models also illustrate how longitudinal biomarker data may be linked to treatment response taking into account the complete time-course of changes.
Figure 11. Identified biomarker-response relationships
The variability in myelosuppression model parameters was characterized in six different cytotoxic anticancer treatments. The estimated impact of IOV in relation to IIV was relatively low, indicating that myelosuppression is predictable from one treatment course to another. Model-based dose individualization using ANC as biomarker may thereby be useful for dose optimization in cytotoxic treatment.
48
A link between the shape of the myelosuppression time-course and the probability of developing FN was characterized for docetaxel treatment. Patients with a rapid neutrophil decline and high drug sensitivity were identified to have a higher probability of developing FN compared with other patients who experience grade 4 neutropenia. The relationship between drug exposure, biomarkers, tumor dynamics, side effects and overall survival in sunitinib treated GIST were characterized and quantified by the development of an overarching modeling framework. The soluble biomarker, sVEGFR-3 and tumor size at start of treatment were found to be promising predictors of overall survival, with decreased sVEGFR-3 levels and smaller baseline tumor size being predictive of longer OS. Also, diastolic blood pressure and ANC were identified as predictors of survival. Lastly, sVEGFR-3 was identified as a predictor of change in tumor size and the side effects, myelosuppression, fatigue and hand-foot syndrome.

49
Acknowledgements
The work presented in this thesis was carried out at the Department of Pharmaceutical Biosciences, Faculty of Pharmacy, Uppsala University. I would like to express my sincere gratitude to all who have contributed to this thesis and especially to: My supervisor Lena Friberg, for accepting me as a PhD student, all your kindness and support and for always taking the time to answer questions or read a manuscript. I have really enjoyed working with you! My co-supervisor Mats Karlsson, for sharing your immense knowledge and enthusiasm about research. For always having a brilliant solution to every problem and making everything seem so easy. Everyone involved in the biomarker modeling project: Michael Amantea, Jonathan French, Peter Milligan and Brett Houk; thank you for all your valuable input and efforts. Guangli Ma, for your work with the adverse events models and Paul Westwood, for struggling so hard with the SUV and dropout models. Paul, thanks also for proof-reading the thesis. My other co-authors, Johan Wallin, for your excellent work with the IOV project and Marie Sandström and Henrik Lindman, for your input. Fransizka Schaedeli Stark, for valuable comments on the IOV and FN manuscript. Margareta Hammarlund-Udenaes and Sven Björkman for contributing to a nice working environment at the department. Ron and Brendan for proof-reading the thesis. Magnus for all help with computer related questions and the layout of the manuscripts.

50
Carl Kirkpatrick and Stephen Duffull, supervisors of my MSc project. Thanks for welcoming me to Brisbane and inspiring me to continue within the area of PKPD modeling. All past and present colleagues at the department, for making it such a great place to work, and for all the fun. Angelica, för alla roliga resor, intressanta diskussioner om allt och inget och för din exellenta check-lista med saker att göra inför disputationen. Jörgen, för dina roliga upptåg och för att du fortsätter fråga om jag ska med till gymmet - nu ska det bli bättring. Jocke, för att du har koll, men på andra saker än mig. Klas, den perfekta rummisen när man skriver avhandling. 100% fokus på att jobba. Du är näste man på tur. Lycka till! Bettan, för alla pratiska tips och peppning inför disputationen. Tack alla vänner, för att ni får mig att tänka på annat.
Familjen Olson; Anki & Tommy, Christer & Anne, Rasmus & Cathrine, tack för härliga dagar i Breviksnäs, all god mat och hjälp med barnpassing. Cathrine, tiden går fortare än man tror och snart är det din tur. Lycka till! Jonas, Kristina, Albin & Malte, för att det alltid är så roligt att träffa er.
Mamma & Pappa, för att ni alltid uppmuntrat mig (även om det inneburit en flytt till ”norrland”).
Alicia, för att du gör mig så glad.
Pontus, för att du är du, och för allt tålamod och stöd. ♥
Emma

51
References
1. Kola I, Landis J. Can the pharmaceutical industry reduce attrition rates? Nature Reviews Drug Discovery. 2004 Aug;3(8):711-15.
2. FDA. Challange and Opportunity on the Critical Path to New Medical Products.: Food and Drug Administration; 2004 [cited 2012 March 8]; Available from: http://www.fda.gov/ScienceResearch/SpecialTopics /CriticalPathInitiative/CriticalPathOpportunitiesReports/ucm077262.htm.
3. Pasqua OED. PKPD and Disease Modeling: Concepts and Applications to Oncology In: Kimko HHC, Peck CC, editors.: Springer New York; 2011. p. 277-306.
4. Karlsson MO, Anehall T, Friberg LE, Henningsson A, Kloft C, Sandstrom M et al. Pharmacokinetic/pharmacodynamic modelling in oncological drug development. Basic & Clinical Pharmacology & Toxicology. 2005;96(3):206-11.
5. Atkinson AJ, Colburn WA, DeGruttola VG, DeMets DL, Downing GJ, Hoth DF et al. Biomarkers and surrogate endpoints: Preferred definitions and conceptual framework. Clinical Pharmacology & Therapeutics. 2001 Mar;69(3):89-95.
6. Keizer RJ, Schellens JH, Beijnen JH, Huitema AD. Pharmacodynamic biomarkers in model-based drug development in oncology. Curr Clin Pharmacol. 2011 Feb;6(1):30-40.
7. Mathijssen RHJ, De Jong FA, Loos WJ, van der Bol JM, Verweij J, Sparreboom A. Flat-fixed dosing versus body surface area-based dosing of anticancer drugs in adults: Does it make a difference? Oncologist. 2007;12(8):913-23.
8. Ette EI, Williams PJ. Pharmacometrics: The science of quantitative pharmacology Hoboken, New Jersey, USA: John Wiley & Sons Inc; 2007.
9. Davidian M, Giltinan DM. Nonlinear Models for Repeated Measurement Data Chapman and Hall /CRC; 1995.
10. Karlsson MO, Sheiner LB. The Importance of Modeling Interoccasion Variability in Population Pharmacokinetic Analyses. Journal of Pharmacokinetics and Biopharmaceutics. 1993;21(6):735-50.
11. Karlsson MO, Beal SL, Sheiner LB. Three new residual error models for population PK/PD analyses. Journal of Pharmacokinetics and Biopharmaceutics. 1995 Dec;23(6):651-72.
12. Crawford J, Dale DC, Lyman GH. Chemotherapy-induced neutropenia - Risks, consequences, and new directions for its management. Cancer. 2004 Jan;100(2):228-37.
13. Institute NC. Common Terminology Criteria for Adverse Events V 4.0 (CTCAE). 2012 [cited 2012 March 17]; Available from: http://evs.nci.nih.gov/ftp1/CTCAE/CTCAE_4.03_2010-06-14_QuickReference_5x7.pdf.

52
14. Bonadonna G, Valagussa P, Moliterni A, Zambetti M, Brambilla C. Cyclophosphamide, Methotrexate, and Fluorouracil in Node-Positive Breast-Cancer - the Results of 20 Years of Follow-Up. New England Journal of Medicine. 1995 Apr;332(14):901-06.
15. Budman DR, Berry DA, Cirrincione CT, Henderson IC, Wood WC, Weiss RB et al. Dose and dose intensity as determinants of outcome in the adjuvant treatment of breast cancer. J Natl Cancer Inst. 1998 Aug;90(16):1205-11.
16. Eskens F, Verweij J. The clinical toxicity profile of vascular endothelial growth factor (VEGF) and vascular endothelial growth factor receptor (VEGFR) targeting angiogenesis inhibitors; A review. European Journal of Cancer. 2006 Dec;42(18):3127-39.
17. Bodey GP, Buckley M, Sathe YS, Freireic.Ej. Quantitative Relationships between Circulating Leukocytes and Infection in Patients with Acute Leukemia. Ann Intern Med. 1966;64(2):328-40.
18. Freifeld AG, Bow EJ, Sepkowitz KA, Boeckh MJ, Ito JI, Mullen CA et al. Clinical Practice Guideline for the Use of Antimicrobial Agents in Neutropenic Patients with Cancer: 2010 Update by the Infectious Diseases Society of America. Clin Infect Dis. 2011 Feb;52(4):E56-E93.
19. Aapro MS, Bohlius J, Cameron DA, Dal Lago L, Donnelly JP, Kearney N et al. 2010 update of EORTC guidelines for the use of granulocyte-colony stimulating factor to reduce the incidence of chemotherapy-induced febrile neutropenia in adult patients with lymphoproliferative disorders and solid tumours. European Journal of Cancer. 2011 Jan;47(1):8-32.
20. Pascoe J, Cullen M. The prevention of febrile neutropenia. Curr Opin Oncol. 2006;18(4):325-29.
21. Timmer-Bonte JNH, Tjan-Heijnen VCG. Febrile neutropenia: highlighting the role of prophylactic antibiotics and granulocyte colony-stimulating factor during standard dose chemotherapy for solid tumors. Anticancer Drugs. 2006;17(8):881-89.
22. Lyman H, Dale DC, Wolff AC, Culakova E, Poniewierski MS, Kuderer NM et al. Acute myeloid leukemia or myelodysplastic syndrome in randomized controlled clinical trials of cancer chemotherapy with granulocyte colony-stimulating factor: A systematic review. J Clin Oncol. 2010;28(17):2914-24.
23. Smith TJ, Khatcheressian J, Lyman GH, Ozer H, Armitage JO, Balducci L et al. 2006 update of recommendations for the use of white blood cell growth factors: An evidence-based clinical practice guideline. J Clin Oncol. 2006 Jul;24(19):3187-205.
24. Lyman GH, Lyman CH, Agboola O. Risk models for predicting chemotherapy-induced neutropenia. Oncologist. 2005 Jun-Jul;10(6):427-37.
25. Lyman GH, Kuderer NM, Crawford J, Wolff DA, Culakova E, Poniewierski MS et al. Predicting Individual Risk of Neutropenic Complications in Patients Receiving Cancer Chemotherapy. Cancer. 2011 May;117(9):1917-27.
26. Taxotere. [Cited 2012 February 23]; Available from: www.taxotere.com. 27. Minami H. A point, a line, or an area? Which is the most important in the
pharmacological analysis of cancer chemotherapy? J Clin Oncol. 2005;23(3):405-06.
28. Testart-Paillet D, Girard P, You B, Freyer G, Pobel C, Tranchand B. Contribution of modelling chemotherapy-induced hematological toxicity for clinical practice. Critical Reviews in Oncology Hematology. 2007 Jul;63(1):1-11.
29. Friberg LE, Karlsson MO. Mechanistic models for myelosuppression. Investigational New Drugs. 2003 May;21(2):183-94.

53
30. Karlsson MO, Port RE, Ratain MJ, Sheiner LB. A population model for the leukopenic effect of etoposide Clinical Pharmacology & Therapeutics. 1995 Mar;57(3):325-34.
31. Minami H, Sasaki Y, Saijo N, Ohtsu T, Fujii H, Igarashi T et al. Indirect-response model for the time course of leukopenia with anticancer drugs. Clinical Pharmacology & Therapeutics. 1998 Nov;64(5):511-21.
32. Zamboni WC, D'Argenio DZ, Stewart CF, MacVittie T, Delauter BJ, Farese AM et al. Pharmacodynamic model of topotecan-induced time course of neutropenia. Clinical Cancer Research. 2001 Aug;7(8):2301-08.
33. Friberg LE, Brindley CJ, Karlsson MO, Devlin AJ. Models of schedule dependent haematological toxicity of 2 '-deoxy-2 '-methylidenecytidine (DMDC). European Journal of Clinical Pharmacology. 2000;56(8):567-74.
34. Friberg LE, Henningsson A, Maas H, Nguyen L, Karlsson MO. Model of chemotherapy-induced myelosuppression with parameter consistency across drugs. J Clin Oncol. 2002 Dec;20(24):4713-21.
35. Sheiner LB, Steimer JL. Pharmacokinetic/pharmacodynamic modeling in drug development. Annu Rev Pharmacol Toxicol. 2000;40:67-95.
36. Sandström M, Lindman H, Nygren P, Johansson M, Bergh J, Karlsson MO. Population analysis of the pharmacokinetics and the haematological toxicity of the fluorouracil-epirubicin-cyclophosphamide regimen in breast cancer patients. Cancer Chemother Pharmacol. 2006 Aug;58(2):143-56.
37. Sandström M, Lindman H, Nygren P, Lidbrink E, Bergh J, Karlsson MO. Model describing the relationship between pharmacokinetics and hematologic toxicity of the epirubicin-docetaxel regimen in breast cancer patients. J Clin Oncol. 2005;23(3):413-21.
38. Kloft C, Wallin J, Henningsson A, Chatelut E, Karlsson MO. Population pharmacokinetic-pharmacodynamic model for neutropenia with patient subgroup identification: Comparison across anticancer drugs. Clinical Cancer Research. 2006 Sep;12(18):5481-90.
39. Leger F, Loos WJ, Bugat R, Mathijssen RH, Goffinet M, Verweij J et al. Mechanism-based models for topotecan-induced neutropenia. Clin Pharmacol Ther. 2004 Dec;76(6):567-78.
40. Puisset F, Alexandre J, Treluyer JM, Raoul V, Roche H, Goldwasser F et al. Clinical pharmacodynamic factors in docetaxel toxicity. British Journal of Cancer. 2007 Jul;97(3):290-96.
41. Latz JE, Schneck KL, Nakagawa K, Miller MA, Moto CHT. Population Pharmacokinetic/Pharmacodynamic Analyses of Pemetrexed and Neutropenia: Effect of Vitamin Supplementation and Differences between Japanese and Western Patients. Clinical Cancer Research. 2009 Jan;15(1):346-54.
42. Zandvliet AS, Schellens JHM, Copalu W, Beijnen JH, Huitema ADR. Covariate-based dose individualization of the cytotoxic drug indisulam to reduce the risk of severe myelosuppression. Journal of Pharmacokinetics and Pharmacodynamics. 2009 Feb;36(1):39-62.
43. Soto E, Staab A, Tillmann C, Trommeshauser D, Fritsch H, Munzert G et al. Semi-mechanistic population pharmacokinetic/pharmacodynamic model for neutropenia following therapy with the Plk-1 inhibitor BI 2536 and its application in clinical development. Cancer Chemother Pharmacol. 2010 Sep;66(4):785-95.
44. Zandvliet AS, Karlsson MO, Schellens JHM, Copalu W, Beijnen JH, Huitema ADR. Two-stage model-based clinical trial design to optimize phase

54
I development of novel anticancer agents. Investigational New Drugs. 2010 Feb;28(1):61-75.
45. Latz JE, Rusthoven JJ, Karlsson MO, Ghosh A, Johnson RD. Clinical application of a semimechanistic-physiologic population PK/PD model for neutropenia following pemetrexed therapy. Cancer Chemother Pharmacol. 2006 Apr;57(4):427-35.
46. Friberg LE, Sandstrom M, Karlsson MO. Scaling the time-course of myelosuppression from rats to patients with a semi-physiological model. Investigational New Drugs. 2010 Dec;28(6):744-53.
47. Cameron DA, Massie C, Kerr G, Leonard RCF. Moderate neutropenia with adjuvant CMF confers improved survival in early breast cancer. British Journal of Cancer. 2003 Nov;89(10):1837-42.
48. Mayers C, Panzarella T, Tannock IF. Analysis of the prognostic effects of inclusion in a clinical trial and of myelosuppression on survival after adjuvant chemotherapy for breast carcinoma. Cancer. 2001;91(12):2246-57.
49. Poikonen P, Saarto T, Lundin J, Joensuu H, Blomqvist C. Leucocyte nadir as a marker for chemotherapy efficacy in node-positive breast cancer treated with adjuvant CMF. British Journal of Cancer. 1999;80(11):1763-66.
50. Saarto T, Blomqvist C, Rissanen P, Auvinen A, Elomaa I. Haematological toxicity: A marker of adjuvant chemotherapy efficacy in stage II and III breast cancer. British Journal of Cancer. 1997;75(2):301-05.
51. Edlund P, Ahlgren J, Bjerre K, Andersson M, Bergh J, Mouridsen H et al. Dose-tailoring of FEC adjuvant chemotherapy based on leukopenia is feasible and well tolerated. Toxicity and dose intensity in the Scandinavian Breast Group phase 3 adjuvant Trial SBG 2000-1. Acta Oncol. 2011 Apr;50(3):329-37.
52. Wallin J, Friberg LE, Karlsson MO. A tool for neutrophil guided dose adaptation in chemotherapy. Comp Meth Prog Biomed. 2009;93(13):283-91.
53. Abrams TJ, Lee LB, Murray LJ, Pryer NK, Cherrington JM. SU11248 inhibits KIT and platelet-derived growth factor receptor beta in preclinical models of human small cell lung cancer. Molecular Cancer Therapeutics. 2003 May;2(5):471-78.
54. Mendel DB, Laird AD, Xin XH, Louie SG, Christensen JG, Li GM et al. In vivo antitumor activity of SU11248, a novel tyrosine kinase inhibitor targeting vascular endothelial growth factor and platelet-derived growth factor receptors: Determination of a pharmacokinetic/pharmacodynamic relationship. Clinical Cancer Research. 2003 Jan;9(1):327-37.
55. Rini BI. Sunitinib. Expert Opinion Pharmacotherapy. 2007;8(14):2359-69. 56. Houk BE, Bello CL, Kang DW, Amantea M. A Population Pharmacokinetic
Meta-analysis of Sunitinib Malate (SU11248) and Its Primary Metabolite (SU12662) in Healthy Volunteers and Oncology Patients. Clinical Cancer Research. 2009 Apr;15(7):2497-506.
57. Sutent. [Cited 2012 February 23]; Available from: http://www.pfizerpro.com/hcp/sutent.
58. Danhof M, Alvan G, Dahl SG, Kuhlmann J, Paintaud G. Mechanism-based pharmacokinetic-pharmacodynamic modeling - A new classification of biomarkers. Pharm Res. 2005 Sep;22(9):1432-37.
59. Colburn WA, Lee JW. Biomarkers, validation and pharmacokinetic-pharmacodynamic modelling. Clinical Pharmacokinetics. 2003;42(12):997-1022.
60. Jubb AM, Oates AJ, Holden S, Koeppen H. Predicting benefit from anti-angiogenic agents in malignancy. Nature Reviews Cancer. 2006 Aug;6(8):626-35.

55
61. Eisenhauer EA, Verweij J. New response evaluation criteria in solid tumors: RECIST Guideline Version 1.1. Ejc Supplements. 2009 Sep;7(2):5-5.
62. Klumpen HJ, Samer CF, Mathijssen RHJ, Schellens JHM, Gurney H. Moving towards dose individualization of tyrosine kinase inhibitors. Cancer Treat Rev. 2011 Jun;37(4):251-60.
63. Jain RK, Duda DG, Willett CG, Sahani DV, Zhu AX, Loeffler JS et al. Biomarkers of response and resistance to antiangiogenic therapy. Nature Reviews Clinical Oncology. 2009 Jun;6(6):327-38.
64. Deprimo SE, Bello C. Surrogate biomarkers in evaluating response to anti-angiogenic agents: focus on sunitinib. Annals of Oncology. 2007;18:11-19.
65. Norden-Zfoni A, Desai J, Manola J, Beaudry P, Force J, Maki R et al. Blood-based biomarkers of SU11248 activity and clinical outcome in patients with metastatic imatinib-resistant gastrointestinal stromal tumor. Clinical Cancer Research. 2007 May;13(9):2643-50.
66. Kontovinis LF, Papazisis KT, Touplikioti P, Andreadis C, Mouratidou D, Kortsaris AH. Sunitinib treatment for patients with clear-cell metastatic renal cell carcinoma: clinical outcomes and plasma angiogenesis markers. Bmc Cancer. 2009;9(82).
67. Motzer RJ, Michaelson MD, Redman BG, Hudes GR, Wilding G, Figlin RA et al. Activity of SU11248, a multitargeted inhibitor of vascular endothelial growth factor receptor and platelet-derived growth factor receptor, in patients with metastatic renal cell carcinoma. J Clin Oncol. 2006 Jan;24(1):16-24.
68. DePrimo SE, Huang X, Blackstein ME, Garrett CR, Harmon CS, Schoffski P et al. Circulating Levels of Soluble KIT Serve as a Biomarker for Clinical Outcome in Gastrointestinal Stromal Tumor Patients Receiving Sunitinib following Imatinib Failure. Clinical Cancer Research. 2009;15(18):5869-77.
69. Bocci G, Man S, Green SK, Francia G, Ebos JML, du Manoir JM et al. Increased plasma vascular endothelial growth factor (VEGF) as a surrogate marker for optimal therapeutic dosing of VEGF receptor-2 monoclonal antibodies. Cancer Research. 2004 Sep;64(18):6616-25.
70. Ebos JML, Lee CR, Bogdanovic E, Alami J, Van Slyke P, Francia G et al. Vascular endothelial growth factor-mediated decrease in plasma soluble vascular endothelial growth, factor receptor-2 levels as a surrogate biomarker for tumor growth. Cancer Research. 2008 Jan;68(2):521-29.
71. Rixe O, Billemont B, Izzedine H. Hypertension as a predictive factor of Sunitinib activity. Annals of Oncology. 2007 Jun;18(6):1117-17.
72. Rini BI, Cohen DP, Lu DR, Chen I, Hariharan S, Gore ME et al. Hypertension as a Biomarker of Efficacy in Patients With Metastatic Renal Cell Carcinoma Treated With Sunitinib. Journal of National Cancer Institute. 2011;103:763-73.
73. Donskov F, von Mehren M, Carus A, George S, Casali PG, Li S et al. Neutropenia as a Biomarker of Sunitinib Efficacy in Patients (Pts) With Gastrointestinal Stromal Tumour (GIST). European Journal of Cancer. 2011 Sep;47:S135-S35.
74. Claret L, Girard P, Hoff PM, Van Cutsem E, Zuideveld KP, Jorga K et al. Model-Based Prediction of Phase III Overall Survival in Colorectal Cancer on the Basis of Phase II Tumor Dynamics. J Clin Oncol. 2009 Sep;27(25):4103-08.
75. Bruno R, Lu J-F, Sun Y-N, Claret L. A Modeling and Simulation Framework to Support Early Clinical Drug Development Decisions in Oncology. The Journal of Clinical Pharmacology. 2011;51(1):6-8.

56
76. Claret L, Lu J-F, Sun Y-N, Bruno R. Development of a modeling framework to simulate efficacy endpoints for motesanib in patients with thyroid cancer. Cancer Chemother Pharmacol. 2010;66(6):1141-49.
77. Wang Y, Sung C, Dartois C, Ramchandani R, Booth BP, Rock E et al. Elucidation of Relationship Between Tumor Size and Survival in Non-Small-Cell Lung Cancer Patients Can Aid Early Decision Making in Clinical Drug Development. Clinical Pharmacology & Therapeutics. 2009 Aug;86(2):167-74.
78. O'Shaughnessy J, Miles D, Vukelja S, Moiseyenko V, Ayoub JP, Cervantes G et al. Superior survival with capecitabine plus docetaxel combination therapy in anthracycline-pretreated patients with advanced breast cancer: Phase III trial results. J Clin Oncol. 2002 Jun;20(12):2812-23.
79. Henningsson A, Sparreboom A, Sandstrom M, Freijs A, Larsson R, Bergh J et al. Population pharmacokinetic modelling of unbound and total plasma concentrations of paclitaxel in cancer patients. European Journal of Cancer. 2003;39(8):1105-14.
80. Vanwarmerdam LJC, Huinink WWB, Rodenhuis S, Koier I, Davies BE, Rosing H et al. Phase-I Clinical and Pharmacokinetic Study of Topotecan Administered by a 24-Hour Continuous-Infusion. J Clin Oncol. 1995;13(7):1768-76.
81. Ratain MJ, Mick R, Schilsky RL, Vogelzang NJ, Berezin F. Pharmacologically Based Dosing of Etoposide - a Means of Safely Increasing Dose Intensity. J Clin Oncol. 1991 Aug;9(8):1480-86.
82. Ratain MJ, Schilsky RL, Choi KE, Guarnieri C, Grimmer D, Vogelzang NJ et al. Adaptive-Control of Etoposide Administration - Impact of Interpatient Pharmacodynamic Variability. Clinical Pharmacology & Therapeutics. 1989;45(3):226-33.
83. Demetri GD, van Oosterom AT, Garrett CR, Blackstein ME, Shah MH, Verweij J et al. Efficacy and safety of sunitinib in patients with advanced gastrointestinal stromal tumour after failure of imatinib: a randomised controlled trial. Lancet. 2006 Oct;368(9544):1329-38.
84. George S, Blay JY, Casali PG, Le Cesne A, Stephenson P, DePrimo SE et al. Clinical evaluation of continuous daily dosing of sunitinib malate in patients with advanced gastrointestinal stromal tumour after imatinib failure. European Journal of Cancer. 2009;45(11):1959-68.
85. Shirao K, Nishida T, Doi T, Komatsu Y, Muro K, Li YH et al. Phase I/II study of sunitinib malate in Japanese patients with gastrointestinal stromal tumor after failure of prior treatment with imatinib mesylate. Investigational New Drugs. 2010;28(6):866-75.
86. Maki RG, Fletcher JA, Heinrich MC, Morgan A, George S, Desai J et al. Results from a continuation trial of SU11248 in patients (pts) with imatinib (IM)-resistant gastrointestinal stromal tumor (GIST). 41 st Annual meeting of the american society of Clinical oncology; 13-17 may 2005; Orlando. http://www.asco.org2005.
87. Therasse P, Arbuck SG, Eisenhauer EA, Wanders J, Kaplan RS, Rubinstein L et al. New guidelines to evaluate the response to treatment in solid tumors. European Organization for Research and Treatment of Cancer, National Cancer Institute of the United States, National Cancer Institute of Canada. J Natl Cancer Inst. 2000 Feb 2;92(3):205-16.
88. Cartwright GE, Athens JW, Wintrobe MM. The Kinetics of Granulopoiesis in Normal Man. Blood. 1964;24(6):780-803.

57
89. Karlsson MO, Port RE, Ratain MJ, Sheiner LB. A Population-Model for the Leukopenic Effect of Etoposide. Clinical Pharmacology & Therapeutics. 1995;55(2):325-34.
90. Hooker AC, Staatz CE, Karlsson MO. Conditional weighted residuals (CWRES): A model diagnostic for the FOCE method. Pharm Res. 2007 Dec;24(12):2187-97.
91. Zhang L, Beal SL, Sheiner LB. Simultaneous vs. sequential analysis for population PK/PD data I: best-case performance. J Pharmacokinet Pharmacodyn. 2003 Dec;30(6):387-404.
92. Dayneka NL, Garg V, Jusko WJ. Comparison of 4 basic models of Indirect Pharmacodynamic responses. Journal of Pharmacokinetics and Biopharmaceutics. 1993 Aug;21(4):457-78.
93. Dansirikul C, Silber HE, Karlsson MO. Approaches to handling pharmacodynamic baseline responses. Journal of Pharmacokinetics and Pharmacodynamics. 2008 Jun;35(3):269-83.
94. Keizer R, Gupta A, Mac Gillavry M, Jansen M, Wanders J, Beijnen J et al. A model of hypertension and proteinuria in cancer patients treated with the anti-angiogenic drug E7080. Journal of Pharmacokinetics and Pharmacodynamics. 2010;37(4):347-63.
95. Henin E, You B, VanCutsem E, Hoff PM, Cassidy J, Twelves C et al. A Dynamic Model of Hand-and-Foot Syndrome in Patients Receiving Capecitabine. Clinical Pharmacology & Therapeutics. 2009 Apr;85(4):418-25.
96. Zingmark PH, Kagedal M, Karlsson MO. Modelling a spontaneously reported side effect by use of a Markov mixed-effects model. Journal of Pharmacokinetics and Pharmacodynamics. 2005 Apr;32(2):261-81.
97. Sheiner LB, Stanski DR, Vozeh S, Miller RD, Ham J. Simultaneous modeling of pharmacokinetics and pharmacodynamics -application to D-Tubocurarine. Clinical Pharmacology & Therapeutics. 1979;25(3):358-71.
98. Beal S, Sheiner LB, Boekmann A, Bauer RJ. NONMEM User's Guides (1989-2006). Ellicott City, MD, USA Icon Development Solutions; 2009.
99. Jonsson EN, Karlsson MO. Xpose:an Splus based population Pharmacokinetic/pharmacodynamic model bulding aid for NONMEM. Comput Methods Programs Biomed 1999;58:51-64.
100. Lindbom L, Pihlgren P, Jonsson EN. PsN-toolkit - A collection of computer intensive statistical methods for non-linear mixed effect modeling using NONMEM Comput Methods Programs Biomed. 2005 Dec;80(3):241-57.
101. Lindbom L, Ribbing J, Jonsson EN. Perls-speaks-NONMEM (PsN) - a Perl module for NONMEM related programming. Comput Methods Programs Biomed. 2004 Aug;75(2):85-94.
102. Karlsson MO, Holford N, H, G. A Tutorial on Visual Predictive Checks. PAGE 17 (2008) Abstr 1434 [www.page-meetingorg/?abstract=1434].
103. Bergstrand M, Hooker AC, Wallin JE, Karlsson MO. Prediction-Corrected Visual Predictive Checks for Diagnosing Nonlinear Mixed-Effects Models. Aaps Journal. 2011;13(2):143-51.
104. Bergstrand M, Hooker AC, Karlsson M, O. Visual Predictive Checks for Censored and Categorical data. PAGE 18 (2009) Abstr 1604 [www.page-meetingorg/?abstract=1604].
105. Wallin JE, Friberg LE, Karlsson MO. Model-Based Neutrophil-Guided Dose Adaptation in Chemotherapy: Evaluation of Predicted Outcome with Different Types and Amounts of Information. Basic & Clinical Pharmacology & Toxicology. 2010 Mar;106(3):234-42.

58
106. Hansson EK, Friberg LE. Myelosuppression as a Biomarker of Tumor Response in Docetaxel Treated Metastatic Breast Cancer Patients. PAGE 21 (2012).
107. Ozawa K, Minami H, Sato H. Logistic regression analysis for febrile neutropenia (FN) induced by docetaxel in Japanese cancer patients. Cancer Chemother Pharmacol. 2008 Aug;62(3):551-57.
108. Bruno R, Hille D, Riva A, Vivier N, Huinnink W, van Oosterom AT et al. Population phacrmacokinetics/pharmacodynamics of docetaxel in phase II studies in patients with cancer. J Clin Oncol. 1998 Jan;16(1):187-96.
109. Crawford J, Dale DC, Kuderer NM, Culakova E, Poniewierski MS, Wolff D et al. Risk and timing of neutropenic events in adult cancer patients receiving chemotherapy: the results of a prospective nationwide study of oncology practice. J Natl Compr Canc Netw. 2008 Feb;6(2):109-18.
110. Lyman GH, Delgado DJ. Risk and timing of hospitalization for febrile neutropenia in patients receiving CHOP, CHOP-R, or CNOP chemotherapy for intermediate-grade non-Hodgkin lymphoma. Cancer. 2003 Dec;98(11):2402-09.
111. Rock EP, Goodman V, Jiang JX, Mahjoob K, Verbois SL, Morse D et al. Food and drug administration drug approval summary: Sunitinib malate for the treatment of gastrointestinal stromal tumor and advanced renal cell carcinoma. Oncologist. 2007;12(1):107-13.
112. Lindauer A, Di Gion P, Kanefendt F, Tomalik-Scharte D, Kinzig M, Rodamer M et al. Pharmacokinetic/Pharmacodynamic Modeling of Biomarker Response to Sunitinib in Healthy Volunteers. Clinical Pharmacology & Therapeutics. 2010 May;87(5):601-08.
113. Houk BE, Bello CL, Poland B, Rosen LS, Demetri GD, Motzer RJ. Relationship between exposure to sunitinib and efficacy and tolerability endpoints in patients with cancer: results of a pharmacokinetic/pharmacodynamic meta-analysis. Cancer Chemother Pharmacol. 2010 Jul;66(2):357-71.

