tilapia trade (global and regional trends)
TRANSCRIPT

Tilapia TradeGlobal and Regional Trends
FAO/ASTF GCP/RAF/510/MUL: Enhancing capacity/risk reduction of emerging Tilapia Lake Virus (TiLV) to African tilapia aquaculture
Blessing MapfumoFisheries & Aquaculture Advisor
Secretariat: World Aquaculture Society African Chapter

Facts and Figures….
Tilapia now almost everywhere around the world (140+ countries farming it)Bulk of tilapia production now comes from aquaculture• Aquaculture ~ 6.5 million metric tonnes (2017)• Capture fisheries <1 million tonnes (2017)
2018 sales to reach > $12,000,000,000China being world’s largest producer, consumer and exporterEgypt being the largest producer of tilapia in Africa (wild and farmed)Several large scale commercial farms in Africa mostly Nile tilapia
• Very difficult to get data on wild catches of tilapia from Africa as most of it listed as “freshwater fishes nei” in FAO fishstat

Global trends

SUPPLIES: Global Tilapia Production

Tilapia Aquaculture
Tilapia aquaculture production continues to spread to many additional countries
Tilapia production in 140+ countries.
China is world’s largest aquaculture producer, consumer and exporter.
Indonesia, Egypt, Philippines, Thailand, Bangladesh, Brazil, Vietnam, Myanmar, Mexico, Ecuador, Costa Rica, Honduras, Uganda, Ghana, Kenya, Nigeria are significant producers

Aquaculture of Tilapia
Egypt – cage and pond farming, rice-tilapia, polyculture in brackish and freshwater
Indonesia – cage culture, polycultures, rice culture
Bangladesh – government support and private sector investment
Brazil – lots of available water, labor, land, feed
Thailand – better reporting
Mexico – continued intensification, some govtsupport, large and small private investments
Sub-Saharan Africa – commercialization, small farms

7
Tilapia Global Aquaculture Production
0
1
2
3
4
5
6
7
8
0
1000
2000
3000
4000
5000
6000
7000
19
90
19
91
19
92
19
93
19
94
19
95
19
96
19
97
19
98
19
99
20
00
20
01
20
02
20
03
20
04
20
05
20
06
20
07
20
08
20
09
20
10
2011
20
12
20
13
20
14
2015 E
2016 E
REAL PRICE (USD/KG)
1000 METRIC TONNES
Sources: 1990-2012: FAO and Kevin Fitzsimmons; 2010-2014: Average of Helga Josupeit and Kevin Fitzsimmons estimates; 2014-16: Kevin Fitzsimmons; Prices US import frozen tilapia Jan- Dec: NMFS

World Tilapia Aquaculture Production
0
200,000
400,000
600,000
800,000
1,000,000
1,200,000
1,400,000
1,600,000
1,800,000
2,000,000
World Tilapia Production of 6,510,700 mt in 2017

Tilapia has become big business!!

Demand

Global Aquaculture Tilapia Sales
For year 2000 =US $ 1,615,321,000 (FAO FishStat 2007)
2005 sales = $ 2,457,312,000(FAO FishStat 2007)
2010 sales = $ 5,680,410,000(FAO FishStat 2012)
2012 sales = $ 7,656,257,000(FAO FishStat 2014)
2018 sales > $ 12,000,000,000
2028 sales > $ 25,000,000,000

Global Tilapia Market Trends to 2028Prices have been constant, only fresh fillets have increased
significantly
0
1
2
3
4
5
6
7
819
92
1993
1994
1995
1996
1997
1998
1999
2000
2001
2002
2003
2004
2005
2006
2007
2008
2009
2010
2011
2012
2013
2014
2015
2016
2017
2018
2019
2020
2021
2022
2023
2024
2025
2026
2027
Fresh fillet Frozen fillet
Whole Frozen Live
$/k
g

Price (Frozen whole tilapia)

The US market

US Tilapia consumption (imports and domestic)513,361 mt of live weight equivalent – 2011
613,406 mt of live weight equivalent – 2012
660,762 mt of live weight equivalent – 2013
633,759 mt of live weight equivalent – 2014
568,488 mt of live weight equivalent – 2015
528,667 mt of live weight equivalent – 2016
0
100,000
200,000
300,000
400,000
500,000
600,000
700,000
1986
1988
1990
1992
1994
1996
1998
2000
2002
2004
2006
2008
2010
2012
2014
2016
Met
ric
tons

Tilapia demand in US and Europe has been falling
Imports are down, even in cases of lower prices and improved quality
More value added products, better packaging and better traceability
But still willingness to pay is down
Primarily due to inflammatory statements made on websites

GLOBAL OUTLOOK: 2028 tilapia aquaculture
0
1,000
2,000
3,000
4,000
5,000
6,000
7,000
8,000
9,000
2002
2003
2004
2005
2006
2007
2008
2009
2010
2011
2012
2013
2014
2015
2016
2017
(est
)20
18 (e
st)
2019
(est
)20
2020
2120
2220
2320
2420
2520
2620
2720
28
Met
ric to
ns (0
00)

Africa

Tilapia production – Africa (capture vs. aquaculture)
-
200,000
400,000
600,000
800,000
1,000,000
1,200,000
1,400,000
1,600,000
1,800,000
2007 2008 2009 2010 2011 2012 2013 2014 2015 2016 2017
Capture Aquaculture
Africa aquaculture production of 1,2 million metric tonnes (2017)
MTEgypt 940,000 (80%)
Rest of Africa 237,000 (20%)

African Champion (Aquaculture): Egypt
0
200,000
400,000
600,000
800,000
1,000,000
1,200,000
2008 2009 2010 2011 2012 2013 2014 2015 2016 2017estimate
Metric tons – largely for domestic consumption

• Still high and important but havegenerally stagnated >400,000MT
• Still support livelihoods of manycommunities along water bodies.
• Issues eg fish bans, closed seasons,illegal fishing, quotas etc
Capture fisheries of tilapia
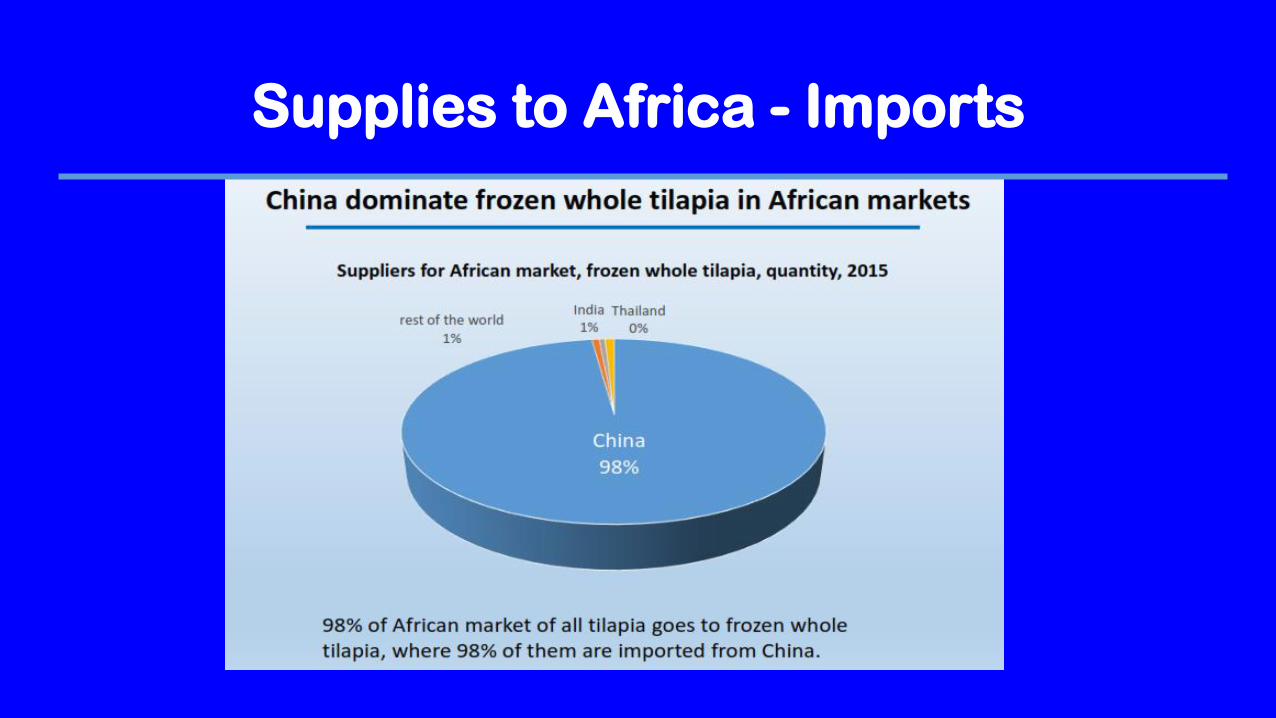
Supplies to Africa - Imports

Commercial aquaculture producers of Tilapia in Africa
• Lake Harvest Aquaculture (Zimbabwe)
• Kariba Harvest Aquaculture (Zambia)
• Source of Nile (Uganda)
• Yalelo (Zambia)
• Tropo (Ghana)
• Triton (Nigeria/Ghana)
• Victory Farms (Kenya)
• Maldeco (Malawi)
• Several other small to medium commercial farms (eg Egyptian farms)
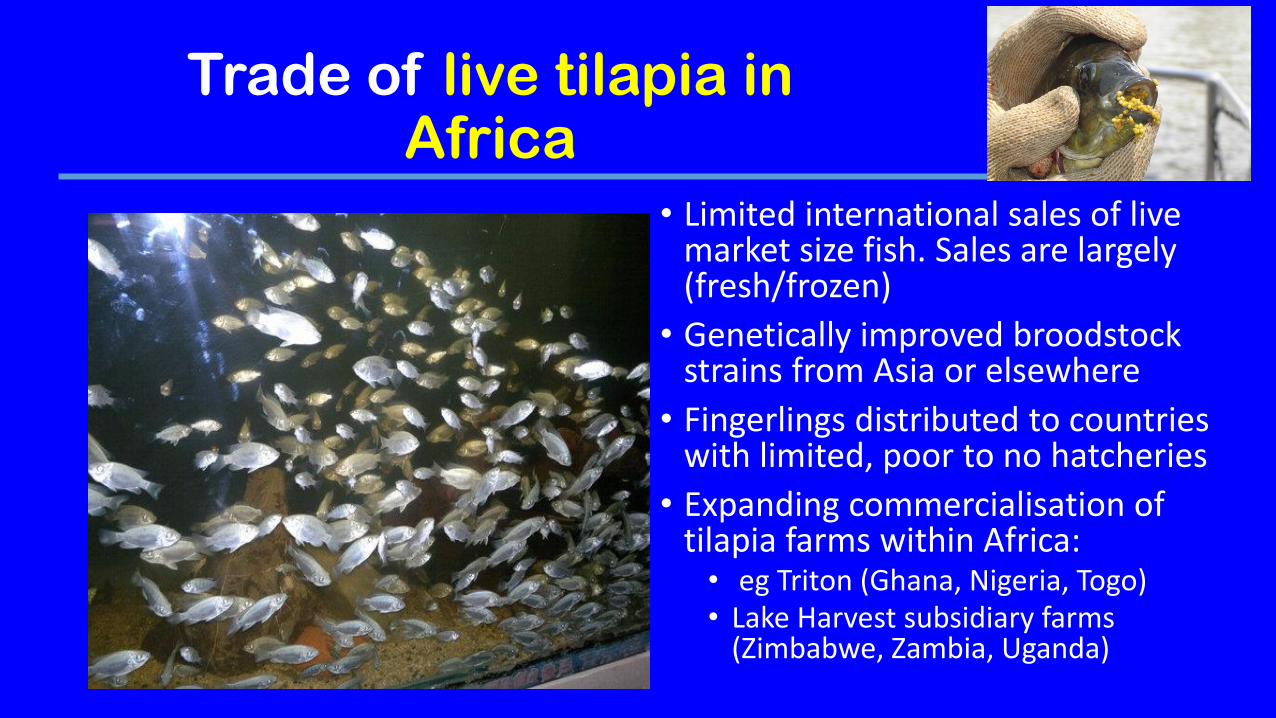
Trade of live tilapia in Africa
• Limited international sales of live market size fish. Sales are largely (fresh/frozen)
• Genetically improved broodstock strains from Asia or elsewhere
• Fingerlings distributed to countries with limited, poor to no hatcheries
• Expanding commercialisation of tilapia farms within Africa:• eg Triton (Ghana, Nigeria, Togo)• Lake Harvest subsidiary farms
(Zimbabwe, Zambia, Uganda)

• Increase in commercial farms (especially medium sized farms)
• Increase in fish distribution businesses of tilapia
• Import tariffs/restrictions/controls for frozen tilapia
• Genetics work, monosex tilapia - Distribution of improved tilapia strains in many countries around Africa continue
• Fish standards development (especially for tilapia) EAC now SADC
• Fish feed companies for tilapia in Africa are growing
• National policy and plans, enablers, etc – continue to apply
• Improved public understanding of tilapia, particularly as a farmed fish
• Improved market information as producers promote their products
• Disease – wake up call – biosecurity measures on farms
Recent developments in Tilapia value chains in Africa

Outlook (Africa tilapia)
Tilapia widely expected to play a substantial role as a food fish to meet the needs of the poor for animal protein in many developing countries
Aquaculture of tilapia will continue to grow (currently average 10%)
Capture fisheries will continue to be important, but remain stagnant
Imports of frozen tilapia (mainly from China) will continue especially in less producer countries but will face lots of barriers
Increase in vertically integrated commercial farms
Many originally subsistence farms graduating to become SME commercial farms
Demand will remain firm (largely fresh and frozen whole product), limited production of value added products
Value prices might go down as farmed product become widely available – increasing supplies
African tilapia for Africans – limited global exports (competition on global markets, cost of shipping to international markets etc)
Improved biosecurity measures on farms for fear of growing disease outbreaks

Acknowledgements
Dr Kevin Fitzsimmons (International Tilapia Expert)
FAO Globefish, FAO Fishstat and other FAO Experts – (Assessment & Monitoring of Global Tilapia Markets posted here

Lets walk the journey together…..Thank you!
Contact: [email protected]
Subscribe: www.aquaafricamag.comVisit: www.was.org
Contact: [email protected]