tiger brands limi e d an nua l re por t 2010 · our vision, mission and values 2 our strategy 3 ......
TRANSCRIPT

Tig
er
Br
an
ds
LimiT
ed
an
nu
aL r
ep
or
T 2
01
0Telephone: 011 840 4000
Facsimile: 011 514 0477
physical address: Tiger Brands Limited, 3010 William Nicol Drive, Bryanston
postal address: PO Box 78056, Sandton, 2146, South Africa
Website: www.tigerbrands.com
A n n u A l R e p o R t 2 0 1 0

www.tigerbrands.com
Listed on the JSE Limited, Tiger Brands Limited is a branded fast-moving consumer packaged goods company that operates mainly in South Africa and selected emerging markets.

01Tiger Brands Annual Report 2010
Group at a glanceOur vision, mission and values 2
Our strategy 3
Group highlights 5
Group structure 6
Five-year review 8
Definitions 9
Summary of ratios and statistics 10
Value added statement 11
Segment report 12
Group reviewChairman’s letter to shareholders 14
Directorate 18
Executive management committee 21
Chief Executive Officer’s review 22
Group financial review 28
Divisional reviews Domestic Food 34
Home and Personal Care (HPC) 38
Exports and International 42
Governance and sustainabilityCorporate governance 46
Remuneration report 56
Management reporting 73
Sustainability report 74
Annual financial statementsResponsibility for annual financial statements 96
Independent auditors’ report 97
Directors’ approval 98
Certificate by company secretary 98
Statutory information 99
Effects of changing prices 101
Income statements 102
Statements of other comprehensive income 103
Statements of financial position 104
Cash flow statements 105
Notes to the cash flow statements 106
Statements of changes in equity 108
Notes to the financial statements 111
Accounting policies 111
Annexure A 184
Annexure B 185
Annexure C 185
Analysis of ordinary shareholders 186
Shareholders’ diary 191
Administration 192
• Notice of annual general meeting, see separate document enclosed with this report
02 Tiger Brands Annual Report 2010
Group at a glance Group review
▲
Our vision, mission and values
Vision
To be the most admired branded FMCG company in emerging markets
Mission
To deliver revenue growth that is 3% greater than South Africa’s GDP growth plus inflation; and achieve an operating margin of 15%, thereby generating real earnings growth and a return on investment which exceeds the company’s cost of capital.
What our vision means to us
Tiger Brands is a branded Fast Moving Consumer Goods (FMCG) company with a broad portfolio of leading food, beverage, personal care and home care brands that add value to consumers’, shoppers’ and customers’ lives and to the broader communities in which we operate. The successful performance of the business also enhances the lives of our other important stakeholders – i.e. our staff, our business partners, our investors and the countries in which we operate.
Underpinning our vision, we strive to meet the performance delivery criteria we have identified in the following areas:
• Financial performance
• Customer delivery
• Leading brands
• Sustainability
• People retention and development
• Transformation
We have a track record of developing, acquiring and growing iconic brands through brand building and innovation, and so satisfying a range of consumer, shopper and customer needs. We have traditionally focused on the South African market and provided consistently superior returns for our investors.
We are making progress in expanding the footprint of the business and becoming a recognised ‘multi-country, local player’ in selected emerging markets, through our strategy of selective acquisition and growing our FMCG brands that are desired by the majority of consumers.
Values
We live by the values we have defined and which guide our every-day behaviour:• Our consumers are our business
• We act with integrity in everything we do
• We have a passion for excellence
• We value our people and treat them with dignity
• We continue to reinvest in our society

Divisional reviews Annual financial statements
03Tiger Brands Annual Report 2010
Governance and sustainability
Our strategy
Key strategic thrusts
• Drive South African volume growth to maintain and grow market shares and expand into adjacent markets
• Step change expansion in emerging markets to accelerate growth
• Brand building and innovation in core categories to protect number one and two category positions
• Transform “go to market” model for increased market penetration
• Deliver efficiency gains to enable reinvestment in volume growth
Tiger Brands priority zonesIt is our aim to expand existing geographic and category platforms to leverage our competencies and drive merger and acquisitive growth in Africa and continue to evaluate opportunities with our partners in Latin America.
South Africa
African zones of priority
South Africa
Angola Mozambique
Botswana
Tanzania
Kenya
Zambia
Gabon
Ivory Coast
Ethiopia Nigeria Benin
Ghana
Cameroon
Democratic Republic of Congo
Uganda
Zimbabwe
Swaziland
Lesotho
Namibia
International zones of priority
Peru
Chile
Argentina

04 Tiger Brands Annual Report 2010
Group at a glance Group review
▲
Our strategy continued
Key strategic thrusts expandedDrive South African volume growth to maintain and grow market shares and expand into adjacent markets• Identify step-change volume opportunities• Prioritise FMCG business portfolio• Invest in differentiated brands• Balance volume growth, profitability and investment returns in core
categories• Drive an appropriate South African mergers and acquisition agenda• Innovate into adjacent markets• Leverage “full value price propositions” with “value-conscious consumers”
and grow sales realisations
Step-change expansion in emerging markets to accelerate growth• Prioritise investments• Expand existing geographic and category platforms to leverage
Tiger Brands’ competencies• Drive mergers and acquisition growth in Africa and continue to
evaluate opportunities with our partners in Latin America• Apply appropriate business models to unlock growth, including
brownfield acquisitions, joint ventures and greenfield opportunities.
Brand building and innovation in core categories to protect number one and two category positions• Define our innovation and brand building objectives and actions• Identify and drive research and development capability and support• Define marketing, trade and commercialisation post-launch support• Balance selling prices and EBIT margins with reinvestment in brand equity
and volume growth • Drive and apply consumer and shopper insights
Transform “go to market” model for increased market penetration• Grow in key channels by improving availability and rate of sale of
core product lines • Collaborate with key customers around specific category opportunities
and shopper insights• Commercialise branded propositions with superior activation
Deliver efficiency gains to enable reinvestment in volume growth• Drive horizontal efficiency gains to reduce costs• Leverage and adapt existing business models• Collaborate beneficially with suppliers
In order to underpin performance delivery, the corporate strategy has been cascaded into functional strategies for human resources, marketing, supply chain, customer and sustainability. The vision, mission and strategic thrusts of these functional areas have been aligned to ensure seamless execution of the corporate strategy.

Divisional reviews Governance and sustainability Annual financial statements
05Tiger Brands Annual Report 2010
Group highlights
Domestic Food • The Grains, Beverages and Value Added Meat Products categories achieved pleasing
performances
• The Groceries and Snacks & Treats categories were challenged in a difficult trading environment
Home and Personal Care• Soft market conditions, a poor pest season and business integration challenges in
Personal Care led to a decline in operating profit
Exports and International• Deciduous fruit exports reflected a R203 million reversal in operating profit from 2009
• Export performance into Africa exceeded expectations
Associates • Oceana headline earnings per share increased by 13%
• Good earnings growth achieved by Carozzi was partially offset by Rand strength
R19,3 billionTurnover from FMCG continuing operations (excluding Oceana fishing) down 2%
2009: R19,7 billion
746 cents per shareTotal dividend and capital distributions for the year up 6% per share
2009: 704 cents per share
R3,0 billionOperating income from continuing operations (excluding Oceana fishing) down 1%
2009: R3,1 billion
Headline earnings per share excluding once-off empowerment costs
up 6%
R2,6 billionCash available from operations up 35%
2009: R1,9 billion

06 Tiger Brands Annual Report 2010
Group at a glance Group review
▲
Group structure
Brand offering
The Domestic Food division is a leading manufacturer, distributor and marketer of food and beverage brands.
Grains: Ace, Albany, Aunt Caroline, Golden Cloud, Jungle, King Korn, Morvite, Tastic
Groceries: All Gold, Black Cat, Colmans, Crosse & Blackwell, Fatti’s & Moni’s, KOO
Snacks & Treats: Anytime, Beacon, Black Cat, Inside Story, Jelly Tots, Maynards, Smoothies, Wilsons, Wonderbar
Beverages: Energade, Hall’s, Oros, Rose’s
Value Added Meat Products: Bokkie, Enterprise, Like-it-Lean, Renown
Out of Home: Includes Tiger’s branded products sold to food service and quick service restaurants
The HPC division is a leading manufacturer, distributor and marketer of personal care, babycare and homecare brands.
Personal Care: Gill, Ingram’s Camphor Cream, Dolly Varden, Kair, Lemon Lite, Perfect Touch, Protein Feed
Babycare: Elizabeth Anne’s, Purity
Homecare: Airoma, Bio-Classic, Doom, FastKill, ICU, Jeyes, Peaceful Sleep, Rattex
Business description
Contribution
2010Rm
TurnoverOperating incomeOperating margin (%)
15 715,02 681,1
17,1
2010Rm
TurnoverOperating incomeOperating margin (%)
1 786,7459,325,7
Home and personal care (Hpc)domestic food

Divisional reviews Governance and sustainability Annual financial statements
07Tiger Brands Annual Report 2010
Tiger Brands has direct interests in international food businesses in Kenya and Cameroon and exports branded food and HPC products from South Africa.
Tiger Brands International: Exports Tiger’s branded products primarily to countries within SADC, East Africa, Central Africa and West Africa
Langeberg & Ashton Foods (Pty) Limited (South Africa): Gold Leaf, Silver Leaf – 66,7% held
Haco Industries Kenya Limited (Kenya): Ace, Bic, Jeyes, Miadi, Motions, Palmers, TCB – 51,0% held
Chocolaterie Confiserie Camerounaise (“Chococam”) (Cameroon): Arina, Big Gum, Kola, Mambo, Martinal, Tartina, Tutoux, Start – 74,7% held
2010Rm
TurnoverOperating incomeOperating margin (%)
1 960,525,71,3
exports and international operations
42%
17%
9%
6%
7%1%
9%
10% -1%
45%
14%
9%
5%
7%
1%
10%
10% -1%
Contribution to turnover (excluding Oceana Fishing)
2010
Grains
2009
GroceriesSnacks & Treats Beverages VAMP Out of Home HPCExports & InternationalIntergroup sales
Contribution to operating income(excluding Oceana Fishing)
2010
55%
Grains
15%
8%
4%
5%2%
15% 1% -5%
2009
46%
15%
9%
3%4%2%
16%
7% -1%
GroceriesSnacks & Treats Beverages VAMP Out of Home HPCExports & InternationalOther

Group at a glance Group review
▲
08 Tiger Brands Annual Report 2010
Five-year review
(Rands in millions) 2010 20094 20082,4 20083,5 20072,5 20073,5 20063,5
Consolidated income statementsRevenue 19 555 20 643 19 170 20 126 16 477 19 980 16 706
Profit before taxation and abnormal items 2 952 2 909 2 449 2 575 2 207 3 090 2 583Income from associates 252 204 72 72 57 57 4Abnormal items (188) 344 4 13 204 151 466
3 016 3 457 2 525 2 660 2 468 3 298 3 053Income tax expense (840) (978) (792) (826) (741) (1 006) (730)
Profit for the year 2 176 2 479 1 733 1 834 1 727 2 292 2 323Attributable to:Shareholders of the parent 2 192 2 444 1 696 1 770 1 685 2 243 2 303Non-controlling interests (17) 35 37 64 42 49 20
Consolidated statements of financial positionProperty, plant and equipment, goodwill, intangible assets and investments 6 289 5 382 5 562 5 562 4 414 4 937 4 257Deferred taxation asset — — 89 89 114 132 145Current assets 6 695 6 237 7 026 7 026 5 767 6 951 5 873
Total assets 12 984 11 619 12 677 12 677 10 295 12 020 10 275
Issued capital and reserves before share- based payment reserve 8 064 6 850 5 639 5 639 5 352 5 665 4 393Share-based payment reserve 252 134 122 122 120 120 78Non-controlling interests 285 301 458 458 193 214 182Deferred taxation liability 123 98 316 316 272 280 231Provision for post-retirement medical aid 351 326 328 328 322 335 354Long-term borrowings 404 483 498 498 365 772 912Sea Harvest put option6 — — — — — — 108Current liabilities 3 505 3 427 5 316 5 316 3 671 4 634 4 017
Total equity and liabilities 12 984 11 619 12 677 12 677 10 295 12 020 10 275
Consolidated cash flow statementsCash operating profit after interest and taxation 2 608 2 233 1 858 1 858 2 655 2 655 2 043Working capital changes (113) (471) (548) (548) (807) (807) (333)Dividends received 131 79 50 50 58 58 74
Cash available from operations 2 626 1 841 1 360 1 360 1 906 1 906 1 784Dividends paid1 (1 180) (1 259) (1 121) (1 121) (1 000) (1 000) (865)
Net cash inflow from operating activities 1 446 582 239 239 906 906 919Net cash (outflow)/inflow from investing activities (1 100) 172 (811) (811) (784) (784) (1 302)
Net cash inflow/(outflow) before financing activities 346 754 (572) (572) 122 122 (383)Net cash inflow/(outflow) from financing activities 1 100 (854) (854) (142) (142) (287)Net cash inflow from discontinued operation — 290 225 225 — — —
Net increase/(decrease) in cash and cash equivalents 347 1 144 (1 201) (1 201) (20) (20) (670)Notes1 Includes capital distribution of R1 155,4 million in 2010, R457,8 million in 2008 and R336,1 million in 2007.2 Excluding Adcock Ingram Holdings Limited, which was unbundled on 25 August 2008.3 Not adjusted for the unbundling of Adcock Ingram Holdings Limited on 25 August 2008.4 Excluding Sea Harvest, which was sold on 28 May 2009.5 Not adjusted for Sea Harvest, which was sold on 28 May 2009.6 2007 has been reclassified from long-term to current liabilities.

09Tiger Brands Annual Report 2010
Divisional reviews Governance and sustainability Annual financial statements
Headline earnings per share Headline earnings divided by the weighted average number of ordinary shares in issue during the year (net of treasury and empowerment shares).
Dividend cover Headline earnings per share divided by the total ordinary dividend per share for the year, comprising the interim dividend paid and final dividend declared post year-end. Where applicable the denominator includes a capital distribution payable out of share premium in July 2007, January 2008, January 2010, July 2010 and January 2011. For 2010 the dividend cover includes once-off empowerment transaction costs in headline earnings.
Net worth per ordinary share Interest of ordinary shareholders after deducting the cost of treasury and empowerment shares divided by the number of ordinary shares in issue at the year-end, excluding treasury and empowerment shares.
Asset turnover Turnover divided by the average of net assets, excluding cash resources, short-term and long-term borrowings, taxation, shareholders for dividends and the carrying value of investments, at the beginning and end of the financial year.
Working capital per R1 000 revenue
The average of inventory and receivables less payables, excluding shareholders for dividends and taxation, at the beginning and end of the financial year divided by turnover (R’000).
Operating margin Operating profit as a percentage of turnover.
Abnormal items Items of income and expenditure which are not directly attributable to normal operations or where their size or nature are such that additional disclosure is considered appropriate.
Effective taxation rate Taxation charge in the income statement as a percentage of profit before taxation.
Return on equity Profit attributable to ordinary shareholders excluding abnormal items divided by issued capital and reserves.
Return on average net assets employed
Operating profit as a percentage of the average of net assets, excluding cash resources, short-term and long-term borrowings, taxation, shareholders for dividends and the carrying value of investments, at the beginning and end of the financial year.
Current ratio Ratio of current assets to current liabilities.
Net interest cover Operating profit plus dividend income divided by net interest paid.
Net funding Capital and reserves, non-controlling interests and long- and short-term borrowings net of cash.
Net debt/net cash Cash and cash equivalents less long-term borrowings and short-term borrowings.
Total liabilities Long-term borrowings and current liabilities.
Total equity Total equity includes ordinary share capital and share premium, less treasury shares and shares held by empowerment entities, plus reserves and non-controlling interests.
Cash flow to net liabilities Cash generated from operations after interest and taxation as a percentage of total liabilities less cash resources.
Dividend yield Dividend per share (in 2007, 2008, 2009 and 2010 including capital distributions per share) as a percentage of year-end market price per share.
Earnings yield Headline earnings per share as a percentage of year-end market price per share (from 2008 based on headline earnings per share from continuing operations only).
Price : earnings ratio Year-end market price per share as a multiple of headline earnings per share (from 2008 based on headline earnings per share from continuing operations only).
Definitions

10 Tiger Brands Annual Report 2010
Group at a glance Group review
▲
2010 20095 20083,8 20083,7 20073,7 20074,7 20064,7
ORDINARy SHARE PERFORMANCENumber of ordinary shares upon which headline earnings per share is based (000)2 158 193 157 012 157 893 157 893 157 311 157 311 156 071Headline earnings per ordinary share (cents)9 1 393 1 382 1 150 1 195 878 1 283 1 207Dividends per ordinary share (cents)1 746 704 786 786 660 660 603Dividend cover (times)1 1,9 2,0 1,9 1,9 1,9 1,9 2,0Net worth per ordinary share (cents) 5 247 4 439 3 673 3 673 3 453 3 665 2 855
PROFITABILITy AND ASSET MANAGEMENTAsset turnover (times) 2,9 3,2 3,3 3,5 3,2 3,4 3,9Working capital per R1 000 turnover (R) 144,0 130 115 110 118 115 111Operating margin (%) 15,6 15,3 13,3 13,2 13,9 16,4 16,1Effective taxation rate (%) 28 28 31 31 30 30 24Return on equity (%) 28,2 30,6 30,1 31,2 27,9 37,0 41,3Return on average net assets (%) 45,2 49,7 43,9 45,7 43,8 53,5 62,7
FINANCINGCurrent ratio 1,9 1,8 1,3 1,3 1,6 1,5 1,5Net interest cover (times) 37 12 31 37 29 18 22Net debt/(cash) to net funding (%) (1) 5 17 17 (1) 11 17Total liabilities to total shareholders’ funds (%) 45 54 93 93 71 89 106Cash flow to net liabilities (%) 87 66 35 35 75 40 41
EMPLOyEE STATISTICSNumber of employees at year-end 11 348 11 443 11 987 11 987 13 302 16 270 17 678– permanent 9 022 8 901 8 601 8 601 8 688 10 949 13 421– seasonal 2 326 2 542 3 386 3 386 4 614 5 321 4 257Revenue per employee (R) 1 723 185 1 803 941 1 599 207 1 678 977 1 238 650 1 211 125 945 016Value added per employee (R)6 486 196 398 380 450 743 450 743 372 768 372 768 299 429Operating profit per employee (R) 265 694 273 827 210 445 219 229 168 824 199 078 150 792
ECONOMIC INDICATORSConsumer price index (Sept on Sept, 2008 base year) 3,2% 6,1% 12,4% 12,4% 7,2% 7,2% 5,3%Key closing exchange rates at 30 September vs ZAR– USD 6,98 7,56 8,32 8,32 6,86 6,86 7,78– GBP 11,01 12,07 14,98 14,98 13,97 13,97 14,50– EUR 9,52 11,03 11,79 11,79 9,75 9,75 9,84
STOCK EXCHANGE STATISTICSMarket price per share (cents)– year-end 18 960 15 050 13 740 13 740 18 185 18 185 14 150– highest 19 199 16 400 19 259 19 259 20 279 20 279 17 800– lowest 14 501 11 267 12 849 12 849 13 700 13 700 12 900Number of transactions 349 411 245 699 172 932 172 932 127 625 127 625 104 848Number of shares traded (000) 183 599 213 904 154 503 154 503 169 488 169 488 141 800Value of shares traded (Rm) 31 661 29 926 23 560 23 560 29 701 29 701 23 185Number of shares traded as a percentage of total issued shares 96,5 123,2 89,4 89,4 98,3 98,3 82,9Dividend yield at year-end (%) 3,9 4,7 5,7 5,7 3,6 3,6 4,3Earnings yield at year-end (%) 7,4 9,1 8,7 8,7 7,1 7,1 8,5Price : earnings ratio at year-end 14 11 12 12 14 14 12Market capitalisation at year-end (Rm) (net of treasury and empowerment shares) 30 050 23 939 21 547 21 547 28 707 28 707 22 157Market capitalisation to shareholders’ equity at year-end (times) 3,6 3,4 3,7 3,7 5,0 5,0 5,0
Notes1 Based on the sum of the interim dividend paid in the current year and the final dividend declared post year-end. Also includes capital distributions paid out of share premium in July 2007, January 2008, January 2010, July 2010 and a capital distribution declared out of share premium in November 2010.
2 Net of treasury and empowerment shares.3 Excluding Adcock Ingram Holdings Limited, which was unbundled on 25 August 2008.4 Not adjusted for the unbundling of Adcock Ingram Holdings Limited on 25 August 2008.5 Excluding Sea Harvest, which was sold on 28 May 2009.6 Includes Sea Harvest and Adcock Ingram Holdings Limited (to 2008).7 Not adjusted for Sea Harvest, which was sold on 28 May 2009.8 In terms of IFRS 5, the statement of financial position was not restated for the sale of Sea Harvest whereas the income statement was restated. Accordingly, ratios which contain references to the income statement have been adjusted for the sale of Sea Harvest.
9 Headline earnings per share for 2009 including discontinued operations amounted to 1 407,4 cents per ordinary share.
Summary of ratios and statistics
11Tiger Brands Annual Report 2010
Divisional reviews Governance and sustainability Annual financial statements
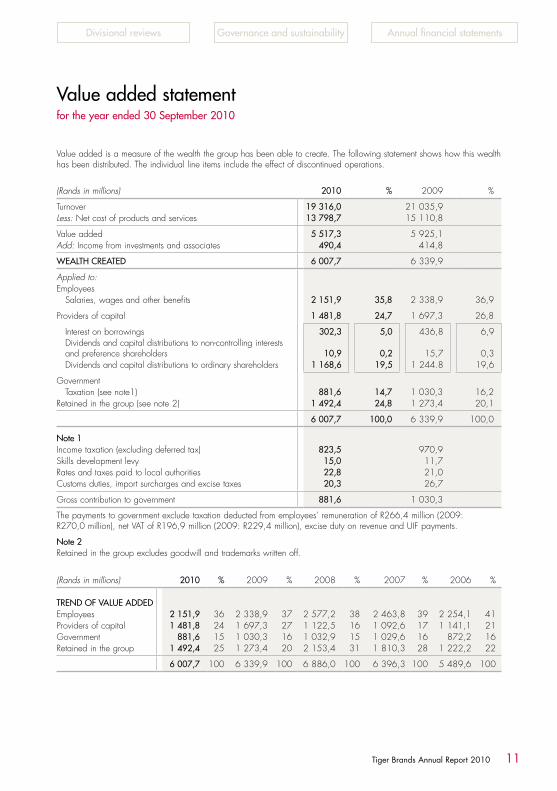
Value added statementfor the year ended 30 September 2010
Value added is a measure of the wealth the group has been able to create. The following statement shows how this wealth has been distributed. The individual line items include the effect of discontinued operations.
(Rands in millions) 2010 % 2009 %
Turnover 19 316,0 21 035,9Less: Net cost of products and services 13 798,7 15 110,8
Value added 5 517,3 5 925,1Add: Income from investments and associates 490,4 414,8
WEALTH CREATED 6 007,7 6 339,9
Applied to:Employees Salaries, wages and other benefits 2 151,9 35,8 2 338,9 36,9
Providers of capital 1 481,8 24,7 1 697,3 26,8
Interest on borrowings 302,3 5,0 436,8 6,9 Dividends and capital distributions to non-controlling interests
and preference shareholders 10,9 0,2 15,7 0,3 Dividends and capital distributions to ordinary shareholders 1 168,6 19,5 1 244.8 19,6
Government Taxation (see note1) 881,6 14,7 1 030,3 16,2Retained in the group (see note 2) 1 492,4 24,8 1 273,4 20,1
6 007,7 100,0 6 339,9 100,0
Note 1Income taxation (excluding deferred tax) 823,5 970,9Skills development levy 15,0 11,7Rates and taxes paid to local authorities 22,8 21,0Customs duties, import surcharges and excise taxes 20,3 26,7
Gross contribution to government 881,6 1 030,3
The payments to government exclude taxation deducted from employees’ remuneration of R266,4 million (2009: R270,0 million), net VAT of R196,9 million (2009: R229,4 million), excise duty on revenue and UIF payments.
Note 2Retained in the group excludes goodwill and trademarks written off.
(Rands in millions) 2010 % 2009 % 2008 % 2007 % 2006 %
TREND OF VALUE ADDEDEmployees 2 151,9 36 2 338,9 37 2 577,2 38 2 463,8 39 2 254,1 41Providers of capital 1 481,8 24 1 697,3 27 1 122,5 16 1 092,6 17 1 141,1 21Government 881,6 15 1 030,3 16 1 032,9 15 1 029,6 16 872,2 16Retained in the group 1 492,4 25 1 273,4 20 2 153,4 31 1 810,3 28 1 222,2 22
6 007,7 100 6 339,9 100 6 886,0 100 6 396,3 100 5 489,6 100

12 Tiger Brands Annual Report 2010
Group at a glance Group review
▲
Turnover Operating income1
Depreciation and amortisation
Impairment losses
(Rands in millions) 2010 2009 2010 2009 2010 2009 2010 2009
FMCG – CONTINUING OPERATIONS 19 316,0 19 699,8 3 015,1 3 054,9 315,4 253,6 — 11,6
Domestic Food 15 715,0 15 922,3 2 681,1 2 408,3 229,6 179,1 — 11,6
Grains 8 085,5 8 793,4 1 677,4 1 414,1 76,3 68,1 — —
Milling and Baking2 5 849,1 6 266,8 1 363,7 1 157,7 67,7 59,6 — — Other Grains3 2 236,4 2 526,6 313,7 256,4 8,6 8,5 — —
Groceries 3 166,5 2 651,6 445,9 471,7 71,4 41,3 — —Snacks & Treats 1 726,0 1 746,9 235,1 282,4 35,5 26,0 — —Beverages 1 083,5 1 056,3 112,3 89,5 17,4 19,0 — —Value Added Meat Products 1 384,8 1 413,2 147,0 113,1 29,0 23,4 — —Out of Home 268,7 260,9 63,4 37,5 — 1,3 — 11,6
HPC 1 786,7 1 883,7 459,3 485,0 14,2 12,5 — —
Personal Care 596,7 681,2 169,9 197,9 9,2 7,6 — —Babycare 591,3 560,8 167,9 166,0 1,0 0,9 — —Homecare 598,7 641,7 121,5 121,1 4,0 4,0 — —
Exports and International 1 960,5 2 030,6 25,7 214,0 27,0 34,3 — —Intergroup sales – FMCG (146,2) (136,8) — — — — — —Other – FMCG4 — — (151,0) (52,4) 44,6 27,7 — —
Fishing – Oceana5 — 730,6 — 78,5 — 13,8 — —
TOTAL CONTINUING OPERATIONS 19 316,0 20 430,4 3 015,1 3 133,4 315,4 267,4 — 11,6DISCONTINUED OPERATIONS – Sea Harvest — 605,5 — 56,8 — 36,6 — —
Total 19 316,0 21 035,9 3 015,1 3 190,2 315,4 304,0 — 11,6
Notes1Operating income is stated after amortisation of intangible assets.2Comprises maize milling, wheat milling and baking, sorghum beverages and malt-based breakfast cereals.3Comprises rice and oat-based breakfast cereals.4 Includes the corporate office and management expenses relating to international investments. Also included are IFRS 2 charges relating to the Phase I and II Black Economic Empowerment transactions of R56,1 million (2009: R30,4 million) and the cash settled options of R62,6 million (2009: R18,0 million).
5 With effect from 1 April 2009, Oceana was reclassified from a joint venture to an associate. All segments operate on an arm’s length basis in relation to intersegment pricing. No geographical segments are reported as the company operates mainly in South Africa and the international operations do not meet the thresholds for reportable segments in terms of IFRS 8.
Segment report

13Tiger Brands Annual Report 2010
Divisional reviews Governance and sustainability Annual financial statements
Total assets
Accounts payable, provisions and accruals and
taxation Capital
expenditure
(Rands in millions) 2010 2009 2010 2009 2010 2009
FMCG – CONTINUING OPERATIONS 12 983,9 11 618,9 3 028,5 3 026,3 634,2 543,6
Domestic Food 10 001,4 8 438,7 2 111,8 2 192,5 548,6 399,0
Grains 4 062,2 3 507,7 918,7 1 072,1 305,1 85,0
Milling and Baking1 3 058,4 2 394,7 700,4 796,3 296,8 76,8 Other Grains2 1 003,8 1 113,0 218,3 275,8 8,3 8,2
Groceries 2 654,9 1 913,3 502,5 453,2 161,8 201,0Snacks & Treats 1 198,8 1 049,4 284,5 287,4 40,6 62,3Beverages 1 391,5 1 293,5 150,7 153,6 9,0 19,1Value Added Meat Products 688,1 669,9 254,6 221,0 32,1 30,6Out of Home 5,9 4,9 0,8 5,2 — 1,0
HPC 1 169,5 1 225,5 271,2 286,5 15,3 12,4Exports and International 1 185,1 1 209,5 255,1 240,9 33,3 39,6Other – FMCG3 627,9 745,2 390,4 306,4 37,0 92,6
Fishing – Oceana4 — — — — — 17,5
TOTAL CONTINUING OPERATIONS 12 983,9 11 618,9 3 028,5 3 026,3 634,2 561,1DISCONTINUED OPERATIONS – Sea Harvest — — — — — 42,8
Total 12 983,9 11 618,9 3 028,5 3 026,3 634,2 603,9
Notes1 Comprises maize milling, wheat milling and baking, sorghum beverages and malt-based breakfast cereals.2 Comprises rice and oat-based breakfast cereals.3 Includes the corporate office.4 With effect from 1 April 2009, Oceana was reclassified from a joint venture to an associate. No geographical segments are reported as the company operates mainly in South Africa and the international operations do not meet the thresholds for reportable segments in terms of IFRS 8.The above disclosures have been restated where necessary due to the adoption of IFRS 8.

14 Tiger Brands Annual Report 2010
Group at a glance
▲
Group review
Key growth strategy
• Continuing expansion of African footprint to consolidate solid platform in Cameroon and Kenya
• Agreement to acquire 51% of East Africa Holdings Group in Ethiopia was finalised subsequent to the year end
• Agreement to acquire 100% of biscuit manufacturer, Deli Foods of Nigeria, was finalised subsequent to the year end
• Agreement in principle reached with UAC of Nigeria Plc to acquire a 49% interest in their Nigerian food and beverage businesses
Lex van VughtChairman
The year under review has been characterised by the company consolidating its position as a focussed, branded consumer goods company whilst also concentrating on its strategic objective of expanding, particularly into other parts of Africa.
Dear Shareholders
I am pleased to report to shareholders on the performance of Tiger Brands for the year ended 30 September 2010.
The year under review has been characterised by the company consolidating its position as a focussed, branded consumer goods company whilst also concentrating on its strategic objective of expanding, particularly into other parts of Africa. The prevailing economic circumstances have been difficult and although South Africa has not been as badly affected by the global economic slowdown as many other countries, there has no doubt been significant evidence of a slowdown in consumer spending. This inevitably would result in pressure on a branded consumer goods company.
The wide basket of leading brands has greatly assisted the company throughout this period. Executive management has been required to focus on the difficult task of balancing the need to ensure margins are maintained so as to secure an adequate return on shareholders’ investment whilst at
Chairman’s letter to shareholders
Divisional reviews Governance and sustainability Annual financial statements
15Tiger Brands Annual Report 2010
business incurring a loss of R84,6 million. This represented a R203 million reversal from the profit of the previous year.
Where performance has been below our expectations, remedial action has been taken in order to restore performance and to ensure the delivery of our strategic objectives.
The balance sheet of the company is particularly strong with the company ending the year with net cash on hand.
Investing for growth
Whilst addressing the short-term difficulties placed upon the group by the economic environment, it is important that this should not serve as a detraction from the need to invest for future growth. The company’s facilities are constantly reviewed to ensure that growth is not impacted by capacity constraints. Over the past three years the group has invested in excess of R1,8 billion in capacity expansion and upgrading of its facilities.
During this year the significant expansion of the Hennenman flour mill, at a cost of R561 million, has commenced and is progressing well towards its expected commissioning in 2012. The company during the course of the year has also authorised the expansion and upgrade of the bakery in Durban at a cost of R109 million. The upgrade of the Pietermaritzburg bakery to a world-class facility, at a cost of R187 million, was successfully completed and commissioned during September 2010. The bakery is performing very well and in line with expectations.
Over the next five-year period, the company believes it will be necessary to invest domestically in excess of a further R2,5 billion in building capacity so as to be able to meet demand.
the same time maintaining volumes and not losing market share. This is a delicate balance to achieve in a constrained trading environment and the results of the company are reflective of this difficulty. Given the high performance culture of Tiger Brands and its historical performance, the achievement of the results for this year is somewhat disappointing.
The competitive set in South Africa has been exacerbated by the strong Rand that has enabled the inflow into South Africa of imports at competitive prices. Notwithstanding this highly competitive activity, KOO was voted second and Tastic fifth in the Sunday Times Top Brands 2010 survey in the category “South Africa’s Favourite Brands”. The other brands which did well in their various categories were All Gold, Enterprise, Albany, Ace, Hugo’s, Beacon, Hall’s, Oros, Jeyes, Bio-Classic and Ingram’s.
Financial results
The group achieved headline earnings per share (HEPS) of 1 393,0 cents for the year ended 30 September 2010, representing a decline of 1% compared to that achieved in the prior year. However, the implementation of the Tiger Brands BEE Phase II transaction in October 2009 gave rise to a once-off charge amounting to R152,7 million after tax, which is included in reported HEPS but disclosed separately as an abnormal item in the income statement. Excluding this amount, HEPS reflected an increase of 6% compared to that achieved in the previous financial year.
The performance of Langeberg and Ashton Foods which is predominantly export driven, was particularly disappointing. This was largely due to the strength of the Rand, which resulted in this

16 Tiger Brands Annual Report 2010
Chairman’s letter to shareholders continued
Group at a glance
▲
Strategic expansion
Significant time and effort in seeking appropriate avenues for expansion has taken place this year, particularly in the rest of Africa. Subsequent to the year end, agreements were signed in terms of which the company will acquire 51% of the existing consumer branded products businesses of East Africa Holdings Group of Ethiopia and 100% of the biscuit manufacturing operations of Deli Foods of Nigeria. These acquisitions, although not transformational in nature, are regarded as important steps in order to expand and consolidate the company’s African footprint. Deli Foods of Nigeria holds approximately 6% of the biscuit market of that country, and the size and strength of the Nigerian economy is well known. Whilst it is accepted that doing business in Nigeria is complex, it is regarded as an essential strategic area of focus for Tiger Brands. The acquisition of this company provides a useful introduction to operating in that highly competitive environment.
Ethiopia, being the second most populated country in Africa, will also provide exciting challenges and opportunities. The business being acquired is a well-established personal care, home and food products company, holding significant market shares in Ethiopia. We have a strong and well-respected fellow shareholder in that company, whose confidence in the growth of the business is reflected by the fact that the entire purchase consideration for the 51% shareholding has been invested directly back into the company.
Also subsequent to the year-end, an agreement in principle has been reached between UAC of Nigeria Plc and Tiger Brands in terms of which Tiger Brands will acquire a 49% interest in the
Nigerian food and beverage interests of UAC. UAC is listed on the Nigerian stock exchange and is a well-established and leading private enterprise champion in the economic advancement of Nigeria. We are particularly pleased to have such a respected and reputable partner. The agreement that has been reached does, however, require the approval of UAC shareholders and will be subject to the necessary Nigerian and South African regulatory approvals.
We are pleased to be able to expand our African continental footprint and believe that these strategic investments will provide Tiger Brands with a solid platform to supplement the existing interests in Cameroon and Kenya.
We look forward to assuming the challenges of managing these entities and in integrating them as part of the greater Tiger Brands family.
The company continues to look at other opportunities in Africa and elsewhere that can provide a meaningful basis for further profitable growth.
Transformation
The second phase of the company’s transformation of its shareholder profile was completed in October 2009. The company is committed to ensuring that its shareholder and employee profiles are more reflective of the country’s demographic profile and much progress has been made in this regard. Three years ago the company was considered a Level 7 contributor in terms of the BEE Codes of Good Practice. We are particularly proud of the achievement of a Level 3 contributor status in 2010, which is reflective of the hard work that has been done in this important area of focus.
Group review

Divisional reviews Governance and sustainability Annual financial statements
17Tiger Brands Annual Report 2010
Sustainability
The company is committed to ensuring that its operations are such that they provide for and protect the generations that follow. We are sensitive to the issues of climate change and the company has made good progress with regard to the implementation of an effective climate change strategy. The company has fully endorsed the objective of monitoring and addressing the key issues of water and electricity consumption as well as ensuring that sound waste management practices are applied. These are dealt with in more detail under the corporate governance section which covers sustainability.
The company is committed to spending 1% of profit after tax on those who are less privileged. In the year under review, over R17 million has been committed to important social investment projects. Tiger Brands assists in feeding over 100 000 underprivileged children each day of the year. More details of this important work are outlined later in the annual report.
Directorate
During the course of the year, Ursula Johnson retired as a non-executive director. Ursula was appointed to the Tiger Brands board in 2002 and we are greatly appreciative of the important contribution made by Ursula during her time as a director. Also during the course of the year, Phil Roux resigned as a non-executive director.
Subsequent to the year-end, Michael Fleming, the Chief Financial Officer, gave notice of his intention to resign with effect from 31 December 2010. Michael has made a
very positive contribution in his role as Chief Financial Officer and in his investor relations responsibilities. We wish Michael well for the future.
The board acknowledged the need for it to be strengthened by the appointment of three new non-executive directors. After a careful and well-considered process, Maya Makanjee, Rob Nisbet and Makhup Nyama were appointed to the board with effect from 1 August 2010. We look forward to the contributions from these new directors.
Appreciation
I would like to record my grateful thanks to Peter Matlare and his management team and all the Tiger Brands employees for their contributions and efforts during what has been a difficult year.
Outlook
There has been a steady increase in the company’s sales volumes in recent months. Tiger Brands, however, remains cautious and expects trading conditions to continue to be challenging, particularly in the first half of the new financial year.
Lex van Vught
Chairman

18 Tiger Brands Annual Report 2010
Group at a glance Group review
▲
1. Lex van Vught (67)
BSc (Hons), BComm, independent non-executive director, chairman. Member of the remuneration and nomination committee
Lex joined Tiger Brands in March 2003 as a non-executive director, and was appointed chairman in 2006.
2. Bheki Sibiya (53)
BAdmin, MBA, deputy chairman, independent non-executive director, chairman of the transformation committee and member of the remuneration and nomination committee
Bheki is chief executive officer of the Chamber of Mines. He is a director of Famous Brands Limited, chairman of Brait South Africa Limited, CapAfrica and Pretoria Portland Cement Company Limited and executive chairman of Smartvest Investments. Bheki was appointed to the Tiger Brands board in March 2003.
3. Susan (Santie) Botha (46)
BEcon (Hons), independent non-executive director, chairman of the remuneration and nomination committee
Santie is executive director of MTN Group Management Services. She is chancellor of Nelson Mandela Metropolitan University. She was appointed to the Tiger Brands board in August 2004.
4. Richard Dunne (62)
CA(SA), independent non-executive director, chairman of the audit committee and of the risk/sustainability committee
Richard joined the Tiger Brands board in June 2006. He is a director of Anglo Platinum Limited, AECI Limited and Standard Bank Group Limited.
5. Khotso Mokhele (55)
BSc Agriculture, MSc Food Science, PhD Microbiology, independent non-executive director, member of the audit committee
Khotso joined the Tiger Brands board in August 2007. He serves as chairman of Adcock Ingram Holdings Limited and Impala Platinum Holdings
Directorate
21
76
Non-executive directors

Divisional reviews Governance and sustainability Annual financial statements
19Tiger Brands Annual Report 2010
Limited and is a non-executive director of African Oxygen Limited and Zimplats Holdings Limited. He is also a trustee of the Hans Merensky Foundation. Khotso is chancellor of the University of the Free State.
6. André Parker (59)
MComm, independent non-executive director, member of the audit committee
André is a director of Distell Limited and chairman of TSB Sugar Holdings. He was appointed to the Tiger Brands board in August 2007.
7. Makhup Nyama (53)
BComm, MBA, Diploma in Marketing Management, independent non-executive director
Makhup joined the Tiger Brands board in August 2010. He was former chief executive officer of Saab Grintek and deputy chief executive of CS Holdings. He serves as chairman of Issachar Investment Holdings and director of Makhup Business Services and Coaching and Makhup Properties.
8. Rob Nisbet (54)
BComm, BAcc, CA(SA), independent non-executive director
Rob was group financial director of MTN Group for 14 years, until his retirement. Prior to joining MTN Group he was a director of other private and public companies. Rob was appointed to the Tiger Brands board in August 2010.
9. Maya Makanjee (48)
BA Fine Arts, BComm, MBL (cum laude), independent non-executive director
Maya is chief executive officer of FinMark Trust. She is a director of Cenfri, FinMark Trust Zambia and World Wide Fund for Nature. Maya was appointed to the Tiger Brands board in August 2010.
3
8
4 5
9

20 Tiger Brands Annual Report 2010
Directorate continued
Group at a glance Group review
▲
10. Peter Matlare (51)
BSc (Hons) Political Science, MA (Southern African Studies), Chief Executive Officer, member of the transformation committee
Peter was appointed to the group in April 2008 and is a non-executive director of Oceana Group Limited and Kumba Iron Ore Limited.
11. Neil Brimacombe (46)
BComm (Hons), MBL, executive director – responsible for Consumer Food Brands, member of the risk/sustainability committee
11 years’ service with the group.
12. Michael Fleming (43)
CA(SA), financial director, member of the risk/sustainability committee 11 years’ service with the group. Michael is a non-executive director of
Oceana Group Limited and serves as chairman of Langeberg & Ashton Foods (Pty) Limited.
13. Bongiwe Njobe (48)
MSc (Agriculture), executive director sustainability, member of the transformation committee and of the risk/sustainability committee
Appointed to the group in August 2008.
14. Clive Vaux (59)
CA(SA), corporate finance director, member of the risk/sustainability committee
26 years’ service with the group.
11 (C)10 (A)
14 (H)13 (D)
12 (B)
Executive directors

Divisional reviews Governance and sustainability Annual financial statements
21Tiger Brands Annual Report 2010
Executive management committee*
A. Peter Matlare (51) Chief Executive Officer
Refer to Peter’s CV on page 20
B. Michael Fleming (43)Financial directorRefer to Michael’s CV on page 20
C. Neil Brimacombe (46)Executive directorRefer to Neil’s CV on page 20
D. Bongiwe Njobe (48)Executive directorRefer to Bongiwe’s CV on page 20
E. Sebastian Musendo (44)BSc (Hons), MSc (Brewing), MSc (Marketing), MBA, MCIPS, Group services executiveAppointed in September 2010. Sebastian holds responsibility for Supply Chain, Customer Management, Marketing and IT.
F. Boniface Ngarachu Ngugi (50)Certified Accountant and Certified Corporate Secretary, MBA, Executive responsible for International Operations, member of the risk/sustainability committeeAppointed in November 2009.
G. Thabi Segoale (38)MSc, Managing Executive: Grains division, member of the risk/sustainability committee Three years’ service with the group.
H. Clive Vaux (59)Refer to Clive’s CV on page 20.
I. Brenda Koornneef (57)BComm, Managing Executive: HPC Business and Acting Group marketing executive, member of the risk/sustainability committeeNine years’ service with the group.
J. Matsie Matooane (45)MIS, MBA, Group executive: Human resources,member of the transformation committee.Five years’ service with the group.
K. Ian Isdale (60)BA, LLB, E.D.P, Group company secretary/Legal adviser, member of the risk/sustainability committee27 years’ service with the group.
*As at 30 September 2010.
I
E F
J K
G

22 Tiger Brands Annual Report 2010
Group at a glance Group review
▲
It is again a pleasure for me to report to shareholders on the performance of the company over the past 12 months. The performance of the company, although satisfactory given the difficult trading conditions, has been below the standards that have been set in previous years. Important steps have been taken, however, in order to ensure that we meet our South African growth objectives and the strategic objective of expanding into other African countries.
Financial performance
South Africa was impacted in the year under review by the effect on consumers of the global recession. Clearly South African consumers have been tightening their belts in this period which has also seen the group affected by the impact of a stronger Rand. The significant slowdown noted in the second half of the previous year, where turnover reflected a marginal
South Africa was impacted in the year under review by the effect on consumers of the global recession. Clearly South African consumers have been tightening their belts in this period which has also seen the company affected by the impact of a stronger Rand.
Outlook for 2011
• Trading environment likely to remain challenging
• Continuing to invest in brands, people and facilities
• A focus on organic growth
• Establishing new business ventures with UAC of Nigeria Plc and East Africa Group (Eth) Plc of Ethiopia
• Implementing the acquisition of Deli Foods of Nigeria Limited
• Continuing to prospect for further business opportunities
Peter MatlareChief Executive Officer
Chief Executive Officer’s review

Divisional reviews Governance and sustainability Annual financial statements
23Tiger Brands Annual Report 2010
There has been continued focus on ensuring that our branded products are available to the rest of Africa. Pleasing progress has been made, notwithstanding the strength of the Rand, in driving exports of our branded products into other African countries. We have continued to invest in strengthening and growing our position in Kenya (Haco Industries Kenya Limited) and Cameroon (Chococam) and anticipate that these businesses will benefit from improving regional growth prospects in the ensuing years.
Strategy implementation
It is a fundamental principle of our strategy that growth is achieved organically in South Africa and by strategic acquisitions both within and outside South Africa. We are very pleased to report that after continued focus on African opportunities, we have, subsequent to 30 September 2010, reached agreement to acquire 51% of a new company to be formed in Ethiopia which will primarily be involved in food, home and personal care products. The existing businesses which are to be transferred to the new company, hold leading market shares in Ethiopia.
We will also acquire a 100% interest in Deli Foods of Nigeria Limited subsequent to year end. Deli Foods is a biscuit company that holds a 6% market share in Nigeria. These are considered to be important acquisitions in strategically relevant countries for achieving our growth objectives.
increase of 1%, continued into the year under review with FMCG turnover declining by 2%, driven largely by food deflation.
Operating income
Operating income from FMCG operations decreased by 1% with the operating margin lifting to 15,6% from 15,5% achieved in the previous year.
As will be noted from the detailed review of operations that follows, the Grains, Value Added Meat Products and Beverages divisions performed well given the difficult circumstances. The Groceries, Snacks & Treats and Personal Care results were disappointing. The performance of the Groceries division was disappointing notwithstanding the strong contribution made by the acquisition, with effect from 1 October 2009, of the Crosse & Blackwell mayonnaise business. The acquisition of the mayonnaise business has met all investment targets and the integration process has been seamless.
Langeberg and Ashton Foods, in which the company holds 66,7% of the shares, has had an extremely challenging year. This was primarily due to the strength of the Rand relative to its major trading currencies as this business is predominantly export based. The company is giving careful consideration to its various options with regard to this investment as the business as currently structured is unsustainable if the current strength of the Rand continues.

24 Tiger Brands Annual Report 2010
Chief Executive Officer’s review continued
▲
Group at a glance Group review
Subsequent to the year end, an agreement in principle was reached with UAC of Nigeria Plc, a highly respected listed Nigerian company, in terms of which it has been agreed that the food and beverage interests of UAC will be housed in a new company in which Tiger Brands will hold a 49% interest. This is considered to be an important strategic initiative which will supplement the Deli Foods acquisition referred to above.
We are particularly pleased to have reached this agreement with one of the oldest and most respected companies in Nigeria. The extensive and well-established distribution infrastructure will provide a solid platform from which Tiger Brands can expand its Nigerian interests including, where appropriate, the distribution of well-known Tiger Brands products.
It is an important principle for sustainability of the business that the company continues to invest for future growth. The agreements reached with regard to the investments in Ethiopia and Nigeria are important strategic decisions taken to ensure that the company’s growth objectives are met. Discussions with regard to other potential acquisitions on the continent continue.
It is essential, however, that the group’s manufacturing facilities are reviewed as part of its strategic growth assessment to ensure that future capacity constraints are minimised. In this regard work has commenced on the significant expansion
at Hennenman wheat mill at an estimated cost of R561 million. The new mill is expected to be commissioned in 2012. The expansion of the bakery at Pietermaritzburg was recently commissioned at a cost of R187 million. This is a world class facility. As part of the overall strategy of upgrading the bakeries in KwaZulu-Natal, a capacity upgrade at the Durban bakery has been approved at an approximate cost of R109 million. This is planned for completion during 2011.
Transformation
As is well known, Tiger Brands is committed to transformation and it is particularly pleasing to report that Tiger Brands is now certified as a Level 3 contributor in terms of the Black Economic Empowerment legislation. When one considers that three years ago Tiger Brands was a Level 7 contributor, one can appreciate that significant steps have been taken in order to achieve this level of improvement. As part of that strategy, Phase II of the Black Economic Empowerment shareholder realignment took place in October 2009. We were particularly pleased that shareholders approved the additional allocation to all our employees of 100 shares per employee. Altogether 5% of the company’s issued share capital is now held by the Tiger Brands Foundation which will be able to utilise the funds in the areas of
Divisional reviews Governance and sustainability Annual financial statements
25Tiger Brands Annual Report 2010
particular focus being food, nutrition and education. I look forward to reporting on the decisions taken by the trustees of the Foundation as the funds in the trust build up, resulting from the dividends paid by the company.
Sustainable development
Tiger Brands is very conscious of the need to ensure that whilst financial success is an essential component of stakeholder confidence, we are equally concerned that the group’s operations and activities are such so as to provide a sustainable basis for future growth. At the same time we will endeavour to ensure that the environment is not adversely impacted upon by our operations and that future generations will not be adversely affected by today’s operations. As the global momentum on the climate change debate adjusts to the implications of the outcomes of the Conference of Parties to the UN Framework Convention on Climate Change (COP 15) held in Copenhagen in December 2009, we note that in South Africa the significant increases in electricity tariffs, the introduction of energy efficiency incentives and the growing concerns about climate change, will all have an impact on water availability and food security.
In order to address the sustainability objectives, it has become necessary for us to carefully assess the important impacts on the environment. In this regard Tiger Brands
has focused primarily on the provision of services and the use of electricity. In addition, a particular focus has been placed on the quality and reliability of water used in our operations. The company has been included in the 2010 JSE Social Responsibility Index (SRI) as well as the Carbon Disclosure Project Leadership Index.
Effluent and packaging are further areas of specific focus. There is little point in focusing on these areas without measurement and, in this regard, it will be noted in the sustainability report later in this document, that important steps are being taken in order to ensure that we are in a position to effectively monitor, measure and compare our respective operations both with each other and on a globally competitive basis. It is also important to point out that the focus on these elements of sustainability are equally as applicable to our operations in other parts of Africa as they are to our base business in South Africa.
Review of operations
In the year under review, mixed performances were evident within the FMCG categories as consumer demand remained weak.
Domestic Food increased operating income by 11%, while turnover declined by 1% primarily due to food deflation.
Within the Grains segment, the strong growth in operating income compared to the deflationary decrease in turnover was

26 Tiger Brands Annual Report 2010
Chief Executive Officer’s review continued
▲
Group at a glance Group review
primarily as a result of low soft commodity prices which benefited the Milling and Baking and Rice businesses in particular.
Despite the difficult trading environment, the Albany brand ended the year with a marginal growth in volumes, assisted by the launch of its Smooth Wholegrain Loaf. Tastic and Aunt Caroline rice volumes responded positively to lower selling prices which resulted from the lower cost of imported rice due to the stronger Rand. The Jungle Oats, Morvite and Ace Instant brands performed well, growing volumes and market share in the ready-to-eat porridge segment.
The newly acquired Crosse & Blackwell mayonnaise business was successfully integrated into the Groceries division and produced an excellent result for the year. The core Groceries business saw some recovery in volumes during the second half of the year as a consequence of lower selling prices in an effort to defend market shares in key categories. The sustained high cost of cans and glass packaging containers continued to place pressure on margins in the Groceries category.
The performance of the Snacks & Treats business was disappointing with operating income declining by 17%, primarily due to pressure on consumer discretionary spending. In addition, a fire at the Gums and Jellies manufacturing unit adversely impacted sales and service levels during the second half of the year. The Beverages category achieved
volume growth on its core product offerings which, combined with factory and logistics efficiencies, lifted operating income by 25% to R112,3 million.
The Value Added Meat Products business benefited from increased marketing support as well as a reduction in raw material prices. The group’s Out of Home business managed to improve operating income, which was assisted by the contribution of the Crosse & Blackwell brand as well as the decision to close the loss-making pre-prepared meals business in the prior year.
Home and Personal Care (HPC) produced a disappointing result, with both turnover and operating income declining by 5%.
A number of unexpected challenges were experienced with the integration of the Designer Group into Tiger Brands’ Personal Care business. This contributed significantly to Personal Care’s decline in turnover and operating income for the year. The rationalisation benefits of the integration have subsequently started to materialise and these should have a positive impact in the 2011 financial year.
Purity – the Babycare motherbrand – continued to meet the needs of both mothers and babies with an expanded product range. The Homecare category did well to maintain operating income in line with the prior year after being adversely affected by a poor pest season during the first six months of the year.

Divisional reviews Governance and sustainability Annual financial statements
27Tiger Brands Annual Report 2010
30 September 2010. Oceana’s results have been separately published.
The equity accounted earnings of Oceana for the year ended 30 September 2010 amounted to R132,1 million after tax. The group’s share of Oceana’s turnover and operating income for the six months to 31 March 2009, which was proportionately consolidated for that period, amounted to R730,6 million and R78,5 million respectively. In addition, the equity accounted earnings of Oceana for the second six months ended 30 September 2009 amounted to R76,5 million.
Appreciation
It has not been an easy year for all of us at Tiger and accordingly it is with grateful thanks that I convey my appreciation to all employees for their commitment during a difficult period as well as to the board of directors of the company for their continued and invaluable support.
I would also like to take this opportunity to thank our Chief Financial Officer, Michael Fleming, for his unstinting support. Michael will be leaving us at the end of December and I wish him everything of the best in his new career.
Peter Matlare
Chief Executive Officer
Exports and International recorded a decline in operating income of 88% compared to the prior year.The Deciduous Fruit business, Langeberg & Ashton Foods (66,7% held), incurred a significant operating loss of R84,6 million (2009: R118,8 million operating profit) for the year primarily due to the strong Rand exchange rate and the impact of significant price increases on cans in 2010. The Tiger Brands Export division delivered an outstanding result as the Group’s expansion programme into Africa continued its momentum. The results of the African subsidiaries, Haco and Chococam, were negatively affected, on translation into Rand, as a result of the strengthening of the Rand exchange rate throughout the year. Haco performed well during the year under review and continued to benefit from the expansion of its distribution of Tiger Brands’ products in the East African region. The overall performance of Chococam was satisfactory, with good progress being made on the strengthening of the brand propositions and in the improvement of operational efficiencies.
Fishing
Following the disposal of Sea Harvest in the prior year, the company’s remaining fishing interest comprises its investment in Oceana Group Limited (45% held). Oceana is separately listed on the JSE Limited and reported a 13% increase in headline earnings per share for the year ended
28 Tiger Brands Annual Report 2010
Group at a glance Group review
▲
Highlights
• Tiger Brands is well positioned for future growth
• Balancing volumes, margins and market shares have been key areas of focus
• A strong Rand negatively impacted deciduous fruit exports
• Investment in Capex programme is on track
• The group has a strong balance sheet and continues to generate healthy cash flows
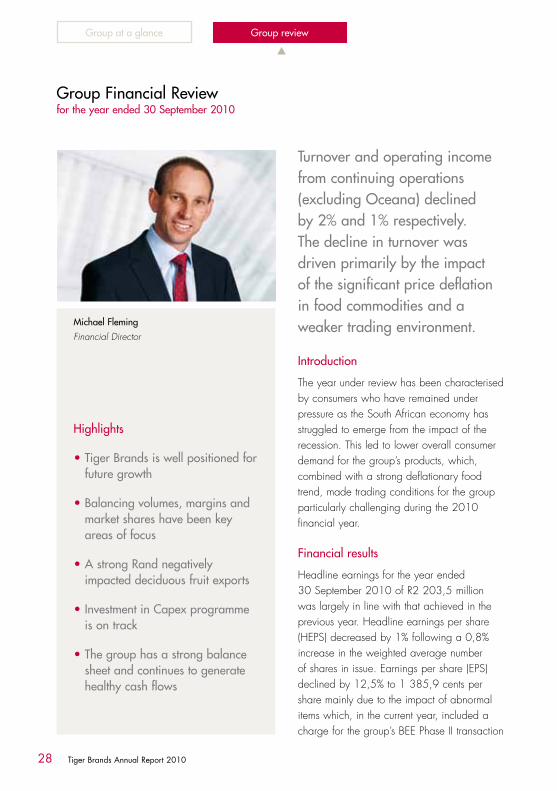
Group Financial Reviewfor the year ended 30 September 2010
Introduction
The year under review has been characterised by consumers who have remained under pressure as the South African economy has struggled to emerge from the impact of the recession. This led to lower overall consumer demand for the group’s products, which, combined with a strong deflationary food trend, made trading conditions for the group particularly challenging during the 2010 financial year.
Financial results
Headline earnings for the year ended 30 September 2010 of R2 203,5 million was largely in line with that achieved in the previous year. Headline earnings per share (HEPS) decreased by 1% following a 0,8% increase in the weighted average number of shares in issue. Earnings per share (EPS) declined by 12,5% to 1 385,9 cents per share mainly due to the impact of abnormal items which, in the current year, included a charge for the group’s BEE Phase II transaction
Turnover and operating income from continuing operations (excluding Oceana) declined by 2% and 1% respectively. The decline in turnover was driven primarily by the impact of the significant price deflation in food commodities and a weaker trading environment.Michael Fleming
Financial Director

Divisional reviews Governance and sustainability Annual financial statements
29Tiger Brands Annual Report 2010
Oceana’s results are included as Income from Associates for the financial year ended 30 September 2010, whereas in the comparative period, Oceana’s results were proportionately consolidated for the first six months and reflected as Income from Associates in the second six months. The group’s share of Oceana’s results is consequently included in HEPS and EPS in both years for the full 12-month periods. This change in the basis of accounting for Oceana makes meaningful comparison of the group’s results at both a revenue and operating income level difficult. To assist shareholders in comparing the performance of the group with the previous year, comparative information in the commentary excludes Oceana’s results. Also see note 16 of the accompanying financial statements for further information in this regard. The commentary below, as well as in the Chairman’s and Chief Executive Officer’s reports, therefore relates only to the group’s continuing FMCG business operations.
Turnover and operating income from continuing operations (excluding Oceana) declined by 2% and 1% respectively. The decline in turnover was driven primarily by the impact of the significant price deflation in food commodities and a weaker trading environment.
The group operating margin from continuing operations improved from 15,5% last year to 15,6%, benefiting from lower soft commodity prices during 2010. The Milling and Baking, Other Grains, Beverages, Out of Home and Value Added Meat Products businesses produced good operating performances while Groceries, Snacks & Treats and Personal Care recorded disappointing declines in operating income. Within Exports and International, the
referred to below versus a significant abnormal profit included in the prior year earnings.
Tiger Brands implemented its BEE Phase II transaction in October 2009. This transaction gave rise to a once-off charge amounting to R188,4 million (R152,7 million after tax), which is disclosed as an abnormal item in the income statement for the year ended 30 September 2010. Excluding this amount, HEPS reflected an increase of 6% compared to that achieved in the previous financial year.
In total, there were 190,2 million shares (2009: 173,6 million shares) in issue as at 30 September 2010. This includes 10,3 million shares (2009: 10,3 million shares) held as treasury shares and a further 21,4 million shares (2009: 5,9 million shares) held, in aggregate, by the various Black Empowerment entities in terms of the group’s Phase I and Phase II BEE transactions, details of which are outlined in note 27. The weighted average number of ordinary shares (158,2 million) on which headline earnings per share and basic earnings per share are based, excludes both the treasury and the empowerment shares. The treasury shares and empowerment shares, together, account for 16,7% (2009: 9,3%) of the company’s total issued share capital.
Although total group turnover and operating income decreased by 5% and 4% respectively, this decrease was exacerbated as the prior year’s results included six months of Oceana’s turnover and operating income while the current year reflects no turnover or operating income from Oceana as outlined in the explanatory note below.

30 Tiger Brands Annual Report 2010
Group Financial Review continuedfor the year ended 30 September 2010
▲
Group at a glance Group review
sustained strength of the Rand negatively impacted the performance of the Deciduous Fruit business, as well as the translation of the results of Haco (Kenya) and Chococam (Cameroon) into Rands. The positive momentum of the Tiger Brands Export division continued, resulting in a pleasing performance for the year.
Abnormal items reflect a net abnormal charge of R187,6 million before tax in 2010. The current year composition of abnormal items primarily comprises the IFRS 2 empowerment transaction costs associated with the company’s BEE Phase II transaction implemented in October 2009.
Net financing costs (excluding Oceana) of R82,2 million (2009: R256,5 million) fell sharply from the prior year, reflecting the benefits of a lower interest rate environment combined with reduced debt levels in the current year.
Income from associates reflects a significant increase compared to the prior year due to the inclusion in 2010 of the full 12 months of the company’s share of the after-tax earnings of Oceana (whereas the prior year only included six months as noted above). A strong trading performance by Empresas Carozzi was partially offset by the effect of the strengthening of the Rand against the Chilean Peso. In addition, the prior year results included a capital profit of R16,6 million arising on the part disposal of a subsidiary by Empresas Carozzi.
The average tax rate, before abnormal items, decreased to 29,7% (2009: 32,3%). This was primarily due to a reduced STC charge in 2010 as a result of distributions to shareholders
being made during the year by way of a reduction of capital out of share premium, in lieu of the 2009 final dividend and the 2010 interim dividend.
The prior year discontinued operation comprised the profit after tax attributable to the Sea Harvest fishing business, determined from the commencement of the 2009 financial year to the date of its disposal on 28 May 2009.
The net loss attributable to non-controlling interests (minority shareholders in subsidiaries) is largely due to the loss incurred in the group’s Deciduous Fruit business, partially offset by the minorities’ share of current year income in respect of the two African subsidiaries, Haco and Chococam.
Statement of financial position and cash utilisation
Over the past five years the group has continued to increase its capital investment programme. Management has sought, where possible, to ensure new technology is incorporated in both expansionary and replacement capital expenditure and thereby achieve greater efficiencies and improved paybacks on such investments for which returns are typically targeted to exceed an internal hurdle rate of 20%.
During the current year, capital expenditure increased to R634,2 million. This included R271,1 million in respect of expansionary projects, the largest being the new Pietermaritzburg bakery which was completed at a cost of R187 million.
In line with Tiger Brands’ strategy of expanding into adjacent categories with well-established brands, the group acquired the Crosse & Blackwell mayonnaise business on 1 October

Divisional reviews Governance and sustainability Annual financial statements
31Tiger Brands Annual Report 2010
2009. The business has since been successfully integrated into the Groceries, Out of Home and Tiger Brands International Exports divisions. The acquisition has been earnings accretive to the group by contributing R56,3 million to earnings after accounting for tax and acquisition financing costs. Further detail regarding the acquisition is contained in note 1 to the annual financial statements.
Cash generated from operations increased by 7,6% from R3 141,4 million in the prior year to R3 380,0 million. This was due to a reduced level of investment in working capital during the year of R112,6 million compared to R424,7 million in 2009. Cash available from operations of R2 625,5 million reflected an increase of 34,8% compared to the previous year due to the benefits of lower financing and taxation charges as well as an increase in dividends received from investments in associate companies.
After taking into account distributions to shareholders, there was a net cash inflow from operating activities of R1 446,0 million compared to a net cash inflow of R680,1 million in the previous year. Investment cash outflows during 2010 amounted to R1 100,4 million and included capital expenditure of R634,2 million as well as the investment of R474,5 million in respect of the Crosse & Blackwell acquisition. In the prior year the group reflected a net investment cash inflow of R132,4 million, largely attributable to the disposal of the Sea Harvest business and the proceeds received from the disposal of the group’s residual investment in Adcock Ingram, net of capital expenditure of R603,9 million.
The group ended the year with net cash of R41,5 million (2009: net debt of R377,4 million) which was particularly pleasing given the strong cash flow generated during the second half of the year after the group had been in a net debt position of R888,6 million at 31 March 2010.
Key financial ratios
The key ratios for the group are outlined on page 10 of the annual report.
Over the past three years the group has moved from a period of high food inflation in 2008 into a period of deflation during the year under review. This recent deflationary trend, together with the increase in capital investment, has resulted in a reduction in the group net asset turn to 2,9 times for 2010. The reduction in the return on average net assets (RONA) to 45,2% in 2010 is reflective of the decline in the group’s operating profit and the continued investment in capital expenditure and acquisitions as indicated above. Over the medium term the group expects the RONA to remain within a range of 35% – 40%. Similarly the group targets a return on equity (ROE) of between 25% – 28% over the medium term, which has been achieved during the current year. These targeted ranges take into account the group’s future growth strategy.
Notwithstanding continued investment in capital expenditure and the acquisition of the Crosse & Blackwell business, net interest cover remained at a healthy level of 37 times (2009: 12 times). As indicated in the Chairman’s and Chief Executive Officer’s reports the group has entered into agreements to acquire various
32 Tiger Brands Annual Report 2010
Group Financial Review continuedfor the year ended 30 September 2010
▲
Group reviewGroup at a glance
businesses on the African continent which will be comfortably funded off the group’s balance sheet during 2011.
The reduction in the percentage of total liabilities to total shareholders’ funds reflects the increase in the underlying equity base in 2010.
Final shareholder distribution incorporating a capital reduction out of share premium and an ordinary dividend out of distributable reserves
The board has decided to declare a final distribution of 476 cents per share for the year ended 30 September 2010, which will comprise a capital reduction out of share premium of 235 cents per share and an ordinary dividend of 241 cents per share. The general authority to make payments to shareholders out of the company’s share premium account was granted by shareholders on 21 June 2010. These two payments, together with the interim capital reduction of 270 cents per share, will therefore amount, in aggregate, to a total payment to shareholders of 746 cents per share (2009: 704 cents per share). The total payment of 746 cents per share represents an increase of 6% on the total payment of 704 cents per share declared in respect of the previous year.
The company’s stated policy of paying an annual dividend/distribution, based on a headline earnings cover of 2 times, remains in place. During the current financial year, the 2 times headline earnings cover was applied after adjusting for the once-off charge related to the group’s BEE Phase II transaction referred to above.
Financial risk management
The group is exposed to a range of financial risks through its business activities, including market risk (currency risk, interest rate risk, soft commodity price risk), credit risk and liquidity risk. The group’s exposure to these risks and the policies for managing the risks are detailed in note 37 of the annual financial statements. Further detail on the group’s financial risks are included in the risk and sustainability report on pages 49 to 53.
Inflation
Details of the group’s performance after adjusting for the cumulative effects of inflation are outlined on page 101. The effect of inflation is constantly monitored and built into future plans in order to meet the group’s long-term objective of creating shareholder wealth in real terms.
Plans for 2011
Capital expenditure amounting to R817,0 million has been committed for 2011. This amount includes R546,7 million already contracted by the group as well as approved plans for R270,3 million. The bulk of the contracted and approved spend relates to the new Hennenman wheat mill and the Albany Durban bakery upgrade referred to in both the Chairman’s and Chief Executive Officer’s reports.
Barring any unforeseen shocks, particularly with regard to the Rand exchange rate and soft commodity prices, general food price inflation is expected to remain within the Reserve Bank’s targeted inflation range during the new financial year.

Divisional reviews Governance and sustainability Annual financial statements
33Tiger Brands Annual Report 2010
Appreciation
Thank you to our shareholders and the broader investment community for your support and involvement with the Tiger Brands group over the past year.
On a personal note, I would like to thank the Tiger Brands board, my fellow executives and many work colleagues throughout the group for the privilege of having worked with each one of you. I have thoroughly enjoyed being a part of Tiger Brands over the past 11 years.
Lastly, I would like to express my appreciation to the various fund managers and analysts, both local and international, with whom I have had the privilege of interacting during the past few years, for their constructive engagement with the group.
Michael Fleming
Financial Director

34 Tiger Brands Annual Report 2010
Group at a glance Group review
Domestic FoodHighlights
• The Grains, Beverages and Value Added Meat Products categories achieved pleasing performances
• The Groceries and Snacks & Treats categories were challenged in a difficult trading environment
Salient features 2010Rm
2009 Rm
%change
TurnoverOperating incomeOperating margin (%)
15 715,02 681,1
17,1
15 922,32 408,3
15,1
(1,3)11,3
Grains
The Grains division performed well and in line with expectations in a constrained macro-economic environment which resulted in shifts in consumer buying patterns.
Milling and Baking volumes contracted, driven mainly by a generally stagnant maize category and the increased inflow of lower grade wheat flour products across the market. Albany bread volumes increased marginally notwithstanding stagnation in the overall bread category volumes. A notable recovery was evident in the rice category as a result of a stronger rand exchange rate and lower international prices of rice. The breakfast business continued on a strong growth trajectory and our brands gained further market share.
During the second half of the financial year the global outlook for supply and demand of wheat was reported as tighter than initial projections. Consequently, there was an increase in the upward volatility of both international and local wheat prices. The rise in the international prices of wheat also contributed to the beginning of an upward trend in the international prices of both maize and rice during the second half of the year. Conversion costs increased as a consequence of significantly higher electricity tariffs and labour costs that were above inflation. Investment in energy- saving initiatives to counter rapid increases in energy costs and to reduce our carbon footprint is taking place as part of the group’s sustainability objectives.

Governance and sustainability Annual financial statements
35Tiger Brands Annual Report 2010
Divisional reviews
▲
The challenges of the trading environment dictated a tactical shift towards stabilisation of operating margins and the preservation of market shares. Operating margins were maintained ahead of the Grains business’ long-term objective of 15% – 16%. The Grains business continues to drive innovation and efficiencies in the business operating model in order to sustain financial performance over the medium term.
The strategic intent of investing in our manufacturing facilities to enable further improvements in efficiencies and increase capacity to support future growth, remains on track. The new Albany Pietermaritzburg bakery was successfully commissioned during the year under review. Good progress has been made on the construction of the new Hennenman wheat flour mill which is expected to be fully commissioned by the end of 2012. Further capital investment was approved by the board towards refreshing the manufacturing equipment
at the Albany Durban bakery during 2011, which will complete the major capital investment phase for Albany in the KwaZulu-Natal region. Continued investment behind our manufacturing platform has seen an increase in the number of the Grains facilities achieving HACCP and ISO22000 manufacturing process accreditations.
Sustained investment behind core brands remains a key competitive edge. For the year under review, three of our brands featured in the top five of the annual Sunday Times Top Brands Awards with Tastic being voted the number one essential food brand for the 11th consecutive year of the survey. Tiger’s Albany bread brand was awarded third place in the same survey. Overall brand equity and energy scores for all our key brands remain well above competitor benchmarks.
Training and development investments, combined with employee welfare initiatives, have seen the level of engagement of our staff
Tastic – No 1 brandwithin essential foods category.

36 Tiger Brands Annual Report 2010
Group at a glance Group review
tracking ahead of international benchmarks. This remains a complement to our group initiatives towards the retention of key personnel and attraction of new talent.
The underlying demand for grain product categories is expected to grow as the macro-economic environment improves. Volume growth remains a key strategic priority. The Grains division has targeted to improve its competitive base and pursue expansive opportunities in order to benefit from both current and newly identified market opportunities. Recovery in consumer confidence and spending remains a key uncertainty as the cycle of inflation returns to the soft agricultural raw materials commodities. In the absence of any further deterioration in the outlook for the supply of key raw materials, limited price inflation would support better growth prospects for our categories and brands. Further analysis in regard to the sensitivity to fluctuations in soft commodity prices is contained in note 37 to the annual financial statements.
Groceries
The Groceries business experienced a difficult trading year with both volumes and margins coming under pressure.
The unprecedented prime cost pushes experienced in mid-2009 and associated attempts to recover these in the market, led
to several key product price premiums being pushed beyond acceptable limits, leading to volume and shorter term market share losses particularly within canned vegetables and condiments. This was exacerbated by heightened competitor activity, in the form of Housebrands and lower-cost imports, as consumers down traded under trying economic conditions which resulted in market volume declines in most of the Grocery categories in which Tiger Brands competes.
The acquisition of the Crosse & Blackwell brand was successfully integrated into the Groceries business with effect from 1 October 2009 with all acquisition targets being met. It is anticipated that this iconic brand will in future continue to make a substantial contribution to the Groceries business.
The business adopted a market share protection strategy in the second half of the year, which has assisted in arresting the rate of decline in the markets and recovering market share in certain key categories. In addition, a number of continuous improvement programmes were initiated during the year to systematically address key margin pressure points for the business and consequently enable our brands to remain competitive in the market place.
Beverages
During 2010, the Beverages business continued to make good progress and, its efforts to enhance the competitiveness of its cost base, improved our ability to compete in the market.
The core brands, namely Oros, Energade, Rose’s and Hall’s, experienced strong volume growth as a consequence of a variety of brand-building activities including value added
Domestic Food continued

Governance and sustainability Annual financial statements
37Tiger Brands Annual Report 2010
Divisional reviews
▲
consumer promotions, advertising and relevant sponsorships.
Energade saw substantial volume growth and share gains on the back of increasing levels of brand awareness and focus by the customer teams on distribution and availability of fridge space. These results have strengthened Energade’s number one position in the Sports drink category.
The reported period saw a number of exciting innovations going to market which included Energade Champs, Oros Ice Tea and a dairy fruit blend range extension under the Super 7 brand. All these innovations are proving to be successful and value adding to the Beverages business.
During the year ahead, the business will continue with its focus on cost reduction and efficiencies. In addition, efforts will be intensified in driving the growth of our core brands as well as launching innovation that responds to key consumer trends in Convenience, Life-style, Health and Well-being.
Snacks & Treats
The Snacks & Treats business experienced tough trading conditions in 2010. With confectionery being a classic discretionary category, significant market volume declines were seen across most product sectors and in the second half of the year in particular. This was exacerbated by some highly competitive pricing from key competitors, an increase in the levels of cheap imported alternatives enabled by a strong Rand, as well as a mid-year debilitating fire in the Gums and Jellies manufacturing unit, which temporarily impacted our service levels.
The key focus in 2010 has been on driving value and affordability, with several compelling consumer innovations being taken to market,
particularly from the Jungle brand, as well as a number of reduced pack sizes across both the sugar and chocolate confectionery offerings.
Value Added Meat Products
The Enterprise Foods business has continued to perform well despite volume contraction of the chilled processed meat category during the first half of the year. The business managed to improve margins due to less volatility in the prices of raw materials and the Rand’s strength against the Dollar in comparison to the prior year.
Increased investment behind the Enterprise brand paid dividends in the recovery of market share lost in previous years. The value brands in the portfolio have, however, been less successful due to very aggressive competitive pricing, particularly in the polony product segment.
The highly focused brand and product strategies assisted in delivering improved margins and overall reduction in complexities throughout the supply chain. Product innovation and packaging changes are starting to gain momentum to ensure clear points of differentiation in the market.
Despite no major capital projects during the year, the benefits of prior year projects have delivered to their full potential during 2010. This ensures ongoing realisation of the continuous improvement benefits reaped year after year as a result of investment in world-class technologies.
The chilled processed meat category has started to show stronger growth in the last quarter of 2010, with polonies and viennas being the key drivers. This, together with a stable raw material outlook, augurs well for strong growth in 2011.

38 Tiger Brands Annual Report 2010
Group at a glance Group review
Home and Personal Care (HPC)Highlights
• Soft market conditions, a poor pest season and business integration challenges in Personal Care, led to a decline in operating income
Salient features 2010Rm
2009 Rm
%change
TurnoverOperating incomeOperating margin (%)
1 786,7459,3
25,7
1 883,7485,025,7
(5,1)(5,3)
At the commencement of the 2010 financial year, the HPC business was segregated into a separate division, comprising Home Care, Personal Care, Baby Nutrition and Wellbeing products.
The 2010 year has been particularly challenging for the HPC division as the discretionary nature of the product category during the recessionary period resulted in market volume declines which negatively impacted performance.
The HPC market nevertheless remains a key focus area of growth for Tiger Brands, given the strategic considerations of the underlying growth potential in these
markets as well as the good profitability of the sector. The strategy is to drive growth in the HPC market through organic brand building and expansion into adjacent market sectors through innovation and/or acquisitions.
The importance of cost competitiveness drives our focus on continuous improvement through the streamlining of the value chain and the extraction of synergies across the HPC businesses.
Home Care
Tiger Brands participates in the Home Care market in the following categories:

Governance and sustainability Annual financial statements
39Tiger Brands Annual Report 2010
Divisional reviews
▲
• Pest (insecticides being the largest contributor to the Home Care portfolio);
• Air care;
• Sanitary products;
• Surface cleaners;
• Laundry; and
• Dishwash markets.
The category was severely impacted by a poor pest season in the 2009/2010 summer season as a result of unfavourable weather conditions. Following a poor pest season in the prior year, the market contracted by a further 5% over the summer months, compared to the 2008/2009 season. Given the strong reliance on the pest category, this impacted negatively on the performance of the Tiger Brands Home Care business.
The Home Care market was further characterised by aggressive competition
in the form of value added and banded special offer packs and price discounting to unprecedented levels. The laundry market continued to see strong price competition. These activities placed pressure on the profitability of the categories in which Tiger Brands participates.
The Tiger Brands pest portfolio remains entrenched as the market leader within the household insecticides category. Aggressive multinational competition and the entry of dealer own brands in sanitary and surface cleaners resulted in Tiger Brands losing market share in these categories.
Tiger continues to focus its market support and innovation programme behind a master brand strategy for Jeyes in the sanitary and surface cleaning markets, Doom in the pest market and Airoma in
5% increase in net sales of Baby Care products.

40 Tiger Brands Annual Report 2010
Group at a glance Group review
Home and Personal Care (HPC) continued
the home enhancement market. The year saw several innovations under these master brand names.
Personal Care
Typically, Personal Care categories are seriously impacted by recessionary conditions and the 2010 year showed strong volume declines in the market categories in which Tiger Brands participates, impacting the performance of this business during the year.
At the commencement of the financial year, the Designer Group and Tiger Brands Personal Care businesses were consolidated into one business entity, resulting in the Designer Group factory being closed down and incorporated into the Isando manufacturing facility in March 2010. This has resulted in significant cost savings which allowed the maintenance of strong gross margin percentage levels, and will allow the business to compete more effectively against both low cost and multinational competitors.
The transition to a new ERP system at the Designer Group facility prior to closure did, however, result in operational difficulties which led to product supply challenges and low customer service scores during the year, negatively impacting the top-line performance of the Personal Care business.
Strong innovation initiatives included the relaunch of Ingram’s Camphor Cream and the addition of a range of non-camphor creams, which boosted market shares in the Hand & Body category. Dolly Varden remains the brand leader in the glycerine market. Lemon Lite was relaunched in the latter part of 2010 with new variants and this should see the brand regain market share. Exciting new variants were added to the Designer Notes and Designer Collection fragrance ranges as this sector becomes one of the areas for focused growth.
During 2010, Tiger Brands entered into a licence agreement for the Imperial Leather brand which is the leading UK bath care brand. Imperial Leather was launched into the South African market during September 2010. Further acquisition and distribution licence opportunities will be pursued to grow our participation in the Personal Care markets.

Governance and sustainability Annual financial statements
41Tiger Brands Annual Report 2010
Divisional reviews
▲
Baby category
Both the Nutrition and Wellbeing Baby markets were negatively impacted by the recession. Consumers converted to non-specialist skincare products and replaced certain baby jarred foods with home cooked products.
The Tiger Brands Baby business performed satisfactorily during 2010 to deliver an increase in sales over 2009 in a constrained market environment. Gross margins were maintained despite price competitive pressures.
The Baby nutrition business continued to perform well, with Purity cereals continuing to make market share inroads, and Purity jars holding onto its leading market position. This performance was further strengthened through innovation initiatives including African flavoured jar variants which have performed well. Purity has also extended its product usage into the pre-natal stage with its successful launch of the Purity Mama product range.
A masterbrand strategy has been implemented during 2010 in the Baby Wellbeing sector, with Elizabeth Anne’s brought under the Purity name, which has been well received by consumers.
Profitable growth has been achieved in the Baby medicinals segment with Muthi Wenyoni and other baby medicinals performing well. This profitable segment will be a further focus area for growth with the launch of the Purity Pedia Kids range in the latter part of 2010.
We are confident that the Purity masterbrand strategy, supported by strong innovation and brand communication, will continue to support growth.
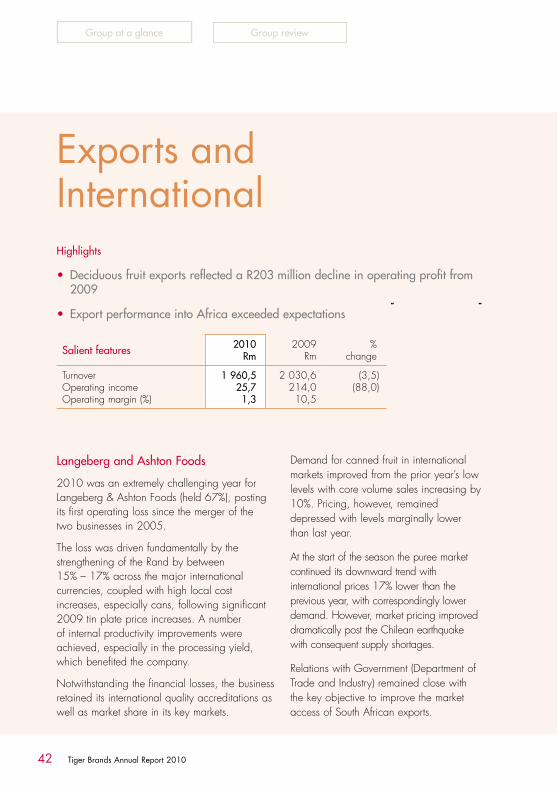
42 Tiger Brands Annual Report 2010
Group at a glance Group review
Exports and InternationalHighlights
• Deciduous fruit exports reflected a R203 million decline in operating profit from 2009
• Export performance into Africa exceeded expectations
Salient features 2010Rm
2009 Rm
%change
TurnoverOperating incomeOperating margin (%)
1 960,525,7
1,3
2 030,6214,010,5
(3,5)(88,0)
Langeberg and Ashton Foods
2010 was an extremely challenging year for Langeberg & Ashton Foods (held 67%), posting its first operating loss since the merger of the two businesses in 2005.
The loss was driven fundamentally by the strengthening of the Rand by between 15% – 17% across the major international currencies, coupled with high local cost increases, especially cans, following significant 2009 tin plate price increases. A number of internal productivity improvements were achieved, especially in the processing yield, which benefited the company.
Notwithstanding the financial losses, the business retained its international quality accreditations as well as market share in its key markets.
Demand for canned fruit in international markets improved from the prior year’s low levels with core volume sales increasing by 10%. Pricing, however, remained depressed with levels marginally lower than last year.
At the start of the season the puree market continued its downward trend with international prices 17% lower than the previous year, with correspondingly lower demand. However, market pricing improved dramatically post the Chilean earthquake with consequent supply shortages.
Relations with Government (Department of Trade and Industry) remained close with the key objective to improve the market access of South African exports.

Governance and sustainability Annual financial statements
43Tiger Brands Annual Report 2010
Divisional reviews
▲
Tiger Brands International: Exports
The Export division of Tiger Brands International achieved exceptional revenue and profit growth ahead of expectations despite the negative impact of a strong Rand. Strong demand for Tiger Brands products from SADC countries, especially those adjacent to South Africa, continues to be consistent in spite of the currency challenges.
Significant brand strength derived from ongoing marketing activities and supply into markets such as Zambia, Malawi, Mozambique and Zimbabwe has resulted in the increased demand which has been met. As African economies improve, demand for Tiger Brands products is expected to increase. Although the demand is largely for food products, there is good demand for pesticide products in Malawi and personal care products in Mozambique and Zimbabwe.
A feature of the result has been the strong performance of the Crosse & Blackwell
mayonnaise brand in Mozambique. The brand has a heritage in Mozambique and advantage has been taken of this with a resultant strong sales performance. Fatti’s & Moni’s pasta has performed extremely well in Zambia and Zimbabwe while confectionery enjoys a strong footprint in the Indian Ocean Islands.
Process re-engineering has created key improvements in the supply chain resulting in reduced lead times, improved order fill and reduced cost. This standardisation has ensured consistency of supply and on-shelf presence for our products. Increasingly, product is being delivered directly from factories and this improves the shelf life that product has in the market as well as lowers handling costs.
There has been good progress made in East Africa, particularly Kenya and Uganda, driven by HACO Industries. Tanzania, however, remains an area of significant opportunity to establish and deepen distribution. Activities in Angola have remained intermittent but our
As African economies improve, demand for Tiger Brands products is expected to increase.
44 Tiger Brands Annual Report 2010
Group at a glance Group review
Exports and International continued
recent approach of utilising category specialist distributors is gaining momentum, the benefits of which are expected to materialise in the year ahead.
Operational leverage has been achieved through a management team focused on driving top line growth supported by appropriate brand investment and stringent cost control. Further progress is anticipated for 2011.
Haco Industries (held 51% – Kenya)
Haco Industries in Kenya was acquired effective 1 June 2008 as part of Tiger Brands Africa expansion plans. The performance of the company has been good and original targets have been exceeded. This has been achieved despite the impact of drought in 2009, post-election violence in 2008 and the impact of a fluctuating currency on the cost of packaging and raw materials.
The personal and homecare footprint of Haco has improved significantly and solid progress has been made with the sales and distribution of Tiger Brands products throughout the region. BIC stationery, comprising the larger part of the business, has exceeded targets for the year with added value range enhancements making good progress.
The performance of the Kenya business in 2010 has been particularly strong on the back of a resurgent Kenyan economy. Exports to Uganda and Ethiopia have been consistently good, but Tanzania remains a challenge. The response to the inauguration of the EAC (East Africa Community) on 1 July 2010 has been lukewarm, but should have a positive impact on business performance in the future.
Factory efficiencies and capacity utilisation have improved, driven by an increased capital expenditure investment.
The people and culture integration process has been largely completed with positive results. Tiger Brands has been warmly embraced by management, customers and staff. In addition, considerable investment has been put into staff training and development, with positive results.
Opportunity exists for Haco to capitalise on the East Africa Common Market and to innovate and diversify its product portfolio in the future in tandem with rapid urbanisation and a positive macro-environment emergent after promulgation of a new constitution in Kenya. The overall performance of Haco and the ease with which change has been embraced by management and staff, point towards a significant success story after two years of Tiger Brands involvement.
Chococam (held 74,7% – Cameroon)
The Chococam business recorded a satisfactory performance notwithstanding significant cost increases in key raw materials such as cocoa and sugar. Due to the competitive environment, marginal price increases were implemented in an attempt to ensure that price points remained relevant. Management accelerated the continuous improvement programme to mitigate the cost increases and consequently made significant progress in generating additional savings that translated into gross margin expansion, when compared to the prior year.
The strength of the South Africa Rand against the Central African Franc (FCFA) negatively

Governance and sustainability Annual financial statements
45Tiger Brands Annual Report 2010
Divisional reviews
▲
impacted the Rand profit performance on translation.
Senior appointments were made in the areas of marketing and supply chain to further enhance capability, ensuring best practice in the create- and-meet-demand functions.
During the year under review, much of the brand renovation activities have been completed and all key brands/product segments will be relaunched during the course of the new financial year. Capital expenditure investment has been deployed in chocolate refining and packing automation within the sugar confectionery category. Additional investment has been made in terms of improving site health and safety standards.
The new ERP system was implemented in April 2010 and has contributed towards improved operational efficiencies and more robust data and information.
A select range of brands from the Tiger Brands Snacks & Treats portfolio was introduced during the second quarter of the year and has been well received by customers and consumers alike.
The key drivers of growth targeted for 2011 will be underpinned by:
• expanded distribution of Chococam core products into new export markets (Angola and Indian Ocean Islands);
• increased portfolio and distribution of the Tiger Brands range of products into Cameroon, Gabon and Congo;
• improved route to market and service methodology;
• product innovation;
• increased capital investment on strategic manufacturing streams; and
• people development.
Carozzi
Empresas Carozzi is a leading branded food business in South America, based in Chile. Although the bulk of its sales and profit emanate from Chile, it also has operations in Peru and Argentina.
The trading year 2010 has been another challenging year with after tax contribution (excluding capital profits) growing by 8% in Rand terms, however, in Pesos, Carozzi has shown a 14% growth.
The performance was characterised by strong profit growth in its core business, namely grains, confectionery, biscuits and powdered juices. The grains contribution is most noteworthy with growth primarily as a consequence of margin expansion due to declining input costs. The balance of the food portfolio saw margin recovery following significant prime cost pushes in 2009.
In addition, the positive turnaround in the Peruvian operations (Molitalia) has been exceptional, underpinned by both margin expansion and appropriate cost extraction.
Market shares have held constant in the reported period, with the noticeable exception of the breakfast cereals and rice categories, both reporting excellent progress.
The devastating earthquake experienced in Chile in February had a minimal impact on the Carozzi business. The operations impacted by the earthquake were the rice mill, which required silo replacement and also Agrozzi which experienced significant fruit puree inventory damage. Both are subsequently fully operational.
The 2009 sale of 50% of the Argentinean operations (CALA) to Molinos Del Plata, has settled down well, and the new increased distribution footprint and capabilities are expected to begin to bear fruit in the forthcoming year.
Prospects for Empresas Carozzi remain positive for 2011.

46 Tiger Brands Annual Report 2010
Group at a glance Group review
The board of directors and management of Tiger Brands are committed to the highest standards of corporate governance and ethical and moral business behaviour.
The group is committed to sound and transparent business practices and to complying in all material respects with the principles contained in the King Report on Governance for South Africa 2009 (King III). In terms of the JSE Listings Requirements, compliance with King III is required in respect of the financial year commencing 1 October 2010. The group is also committed to compliance with the principles, policies and practical application of corporate governance as outlined by the Public Investment Corporation.
A group compliance executive was appointed to assist in ensuring that appropriate processes and systems are in place to enable the group to be compliant with legislation and group policies.
The group compliance officer has direct access to the chairman of the risk committee.
As previously reported, the group has a formal compliance function to assist in ensuring all our businesses comply with all statutory, regulatory and supervisory requirements and group policies. As part of this process, the group undertook an exercise earlier this year to formally establish and document our compliance requirements in order to more effectively manage the compliance function. This exercise has been finalised. In response to the identified compliance requirements, an appropriate compliance governance model, including a compliance manual, policy and mandate, has been developed. In addition, through the risk management framework, appropriate plans to manage identified risks are being developed. At the conclusion of this process, appropriate awareness and monitoring tools will be implemented to give effect to the governance principles adopted by the group.
The boardThe board of Tiger Brands currently consists of nine non-executive directors and five executive directors.
The board is governed by a charter as are each of the subcommittees that have been established by the board. Copies of the board and committee charters are available on request from the company secretary and are accessible on the website (www.tigerbrands.com).
The primary powers and responsibilities of the board include:• responsibility for approving the strategic
direction of the group and the budgets necessary for the implementation thereof;
• being the guardian of the values and ethics of the group;
• responsibility for appointing the chief executive officer;
• retaining full and effective control of the group;• monitoring the management and the
implementation of the corporate vision; and• communicating with shareholders openly and
timeously throughout the year.
It may delegate responsibility to an executive committee or board subcommittees.
The charter outlines certain key responsibilities that may not be delegated.
The subcommittees of the board are the remuneration/nominations committee, the audit committee, the transformation committee and the risk/sustainability committee, which is a subcommittee of the audit committee. Each of the committees is chaired by an independent non-executive director. Details in respect of each committee are reflected on pages 48 to 53. An independent director is as defined in King III.
Performance of individual board members is assessed when board members are required, in terms of the articles of association, to retire from the board and offer themselves for re-election. External evaluation of the effectiveness of the board and its members takes place from time to time.
Corporate governance

47Tiger Brands Annual Report 2010
▲
Governance and sustainabilityDivisional reviews Annual financial statements
The board meets at least six times a year to monitor the performance of the group, to approve the budget for the forthcoming year and to approve the strategic plan of the group.
Directors’ attendance at board meetingsDirector 23/11/09 16/02/10 17/05/10 14/07/10 05/08/10 15/09/10
L C Van Vught (Chairman) ✓ ✓ ✓ ✓ ✓ ✓
S L Botha ✓ ✓ ✓ ✓ ✓ ✓
R M W Dunne ✓ ✓ ✓ ✓ ✓ ✓
U P T Johnson1 ✓ n/a n/a n/a n/a n/aM Makanjee3 n/a n/a n/a n/a ✓ ✓
K D K Mokhele A A ✓ ✓ ✓ AR D Nisbet3 n/a n/a n/a n/a ✓ ✓
M P Nyama3 n/a n/a n/a n/a ✓ ✓
A C Parker ✓ ✓ ✓ ✓ ✓ ✓
P M Roux2 ✓ ✓ A n/a n/a n/aB L Sibiya (Deputy Chairman) ✓ ✓ ✓ A ✓ AP B Matlare (Chief Executive Officer) ✓ ✓ ✓ ✓ ✓ ✓
N G Brimacombe ✓ ✓ ✓ ✓ ✓ ✓
M Fleming ✓ ✓ ✓ ✓ ✓ ✓
B N Njobe ✓ A ✓ ✓ ✓ ✓
C F H Vaux ✓ ✓ ✓ ✓ ✓ ✓
1Resigned 31 December 2009.2Resigned 30 June 2010.3Appointed 1 August 2010.✓Indicates attendance.AApologies tendered.n/aNot applicable.

48 Tiger Brands Annual Report 2010
Corporate governance continued
Group at a glance Group review
Remuneration and nominations committeeA comprehensive remuneration report is contained on pages 56 to 72 of the annual report.
Attendance at remuneration/nominations committee meetingsMember 16/11/09 03/02/10 17/05/10 17/09/10
S L Botha(Committee chairman) ✓ ✓ ✓ ✓
L C van Vught ✓ ✓ ✓ ✓
B L Sibiya ✓ A A A ✓Indicates attendance.AApologies tendered.
Audit committeeThe company has an audit committee which operates under an approved charter, the members of which are all independent non-executive directors. The audit committee has satisfied its responsibilities in terms of the charter in the year under review. As at 30 September 2010 the composition of the committee was R M W Dunne (Chairman), K D K Mokhele and A C Parker. The Chief Executive Officer, the Chief Financial Officer and at least one representative of the external auditors and the internal auditors are required to attend the meetings of the audit committee.
The objectives of the audit committee are to:• determine that management has created and
maintained an effective control environment and that management demonstrates and stimulates the necessary respect of the internal control structure among all parties;
• review the scope and outcome of audits. The review will include an assessment of the effectiveness of the annual audit, ensuring emphasis is placed on areas where the committee, management or the auditors believe special attention is necessary;
• ensure that the board of directors makes informed decisions and is aware of the implications of such decisions regarding accounting policies, practices and disclosures;
• provide a safeguard for directors’ liabilities by informing the board of directors on issues of importance to the business and the status of the financial reporting; and
• enquire into the process of risk identification and monitoring.
Operational audit committees are also in place which are responsible to the audit committee of the company. These operational audit committees focus largely on divisional issues. The audit committee reviews the effectiveness of internal control in the group with reference to the findings of both the internal and external auditors, as well as the findings of the company’s commercial audit department, which reports to the Chief Financial Officer. In addition, the audit committee reviews the work of the risk/sustainability committee which has been established as a subcommittee of the audit committee.
The external and internal auditors have unrestricted access to the audit committee. The internal audit function has the respect and cooperation of the board of directors and management. The audit committee has adopted a policy limiting the consulting work of the auditors, apart from their work as external auditors, and prior approval of any such work is required. The audit committee is satisfied with the independence of the external auditors.

49Tiger Brands Annual Report 2010
▲
Governance and sustainabilityDivisional reviews Annual financial statements
Evaluation of Chief Financial Officer and finance function
The audit committee is satisfied that the expertise and experience of the Chief Financial Officer is appropriate to meet the responsibilities of the position. This is based on the qualifications, levels of experience, continuing professional education and the board’s assessment of the financial knowledge of the Chief Financial Officer.
The committee is also satisfied as to the appropriateness, expertise and adequacy of resources of the finance function and the experience of senior members of management responsible for the finance function.
Attendance at audit committee meetings
Member 17/11/09 09/02/10 11/05/10 15/09/10
R M W Dunne (Committee chairman) ✓ ✓ ✓ ✓
K D K Mokhele ✓ ✓ ✓ A L C van Vught1 ✓ ✓ n/a n/aA C Parker A ✓ ✓ ✓
1Resigned 1 March 2010.✓Indicates attendance.AApologies tendered.n/aNot applicable.
Risk/sustainability committee The risk/sustainability committee is constituted as a committee of the board of directors of the company. Duties and responsibilities of the members of the committee who are directors of the company are in addition to the responsibilities held by them as members of the board. The committee is a subcommittee of the audit committee. The committee has an independent role operating as an overseer and a maker of recommendations to the board for its consideration and final approval. The committee does not assume the function of management which remains the responsibility of the executive directors, officers and other members of senior management. Alexander Forbes undertakes annual risk and environmental reviews at all operations which are considered by the committee.
During the year under review the committee’s responsibilities were expanded to cover sustainability issues and the committee was accordingly renamed the risk/sustainability committee.
The risk/sustainability committee is chaired by an independent non-executive director, R M W Dunne, who is also the chairman of the audit committee. K D K Mokhele, a non-executive director, has been appointed to the committee with effect from 1 October 2010. The other members of the risk/sustainability committee comprise members of the group’s senior management. The senior management representatives on the committee include representatives of the sustainability, financial, legal/secretarial and operational management and supply chain functions of the group. These members report to the group executive committee on risk and sustainability issues. The group compliance officer attends meetings of the committee and has direct access to the chairman of the committee. Specialists are invited to attend meetings of the committee when appropriate so as to provide advice on matters of risk and sustainability being addressed by the committee.

50 Tiger Brands Annual Report 2010
Corporate governance continued
Group at a glance Group review
Attendance at risk/sustainability committee meetings
Member 05/11/09 09/02/10 07/05/10 05/08/10
R M W Dunne (Committee chairman) ✓ ✓ ✓ ✓
M Fleming ✓ ✓ ✓ ✓ C F H Vaux ✓ ✓ ✓ ✓
B N Njobe ✓ A ✓ ✓
N G Brimacombe1 n/a n/a n/a ✓
1Appointed 5 August 2010. ✓Indicates attendance.AApologies tendered.n/aNot applicable.
Reports on the proceedings of the committee and the minutes of the meetings are submitted to the audit committee. In addition, major risks are considered by the board on a regular basis.
The risk/sustainability committee is governed by a charter which outlines its primary purposes as being:• to establish and maintain a common
understanding of the risk universe and sustainability issues, which need to be addressed in order to align with the group’s strategy and ensure sustainability of the group;
• to ensure that a proper business risk assessment is carried out and that a risk profile is compiled by management;
• to identify on an ongoing basis the most significant commercial, financial and sustainability risks;
• to satisfy the corporate governance reporting requirements of the committee;
• to monitor the group’s risk management and assurance efforts;
• to monitor the group’s strategy in respect of sustainability issues and to report to the audit committee on the independent assurance on sustainability issues; and
• to report to the board through the audit committee, on the risk management work undertaken and the extent of any action
taken by management to address areas identified for improvement.
The risk management process, which is assessed by the committee, involves a formalised system to identify and assess risk, both at a strategic and at an operational level. The process includes the evaluation of the mitigating controls and other assurances in identifying and assessing the risks.
Risk categories that have been assessed by the committee include, inter alia reputation risk, raw material procurement risk, brand risk, product risk, legislative issues, people risks, competitive forces, information technology issues, insurable perils, sustainability risks, investor risks and financial risks.
The safety of the group’s employees is considered to be of paramount importance. To this end the committee has during the past year focused its attention on the process of determining the disabling injury frequency rate (DIFR) occurrences and degree of seriousness of such injuries on a regular basis. Particular management attention will be given in the forthcoming years to reporting on and improving the level of the disabling injury frequency rate. No work-related deaths or serious disabling injuries occurred in the year under review.
Major risks are reviewed quarterly and updated on an ongoing basis.

51Tiger Brands Annual Report 2010
▲
Governance and sustainabilityDivisional reviews Annual financial statements
relating to key production facilities and assets throughout the group. Although the impact of a catastrophic loss of a manufacturing facility is likely to have a high impact on the short-term supply of a specific range of products within a specific business unit, the likelihood of such an event occurring is considered to be low risk due to the group’s preventative maintenance approach and regular risk audits conducted by a reputable expert service provider. The group maintains appropriate insurance cover in the event of such business interruptions arising.
Global financial crisis
The group continues to monitor and assess the impact of the global economic crisis on customers, suppliers, funding requirements and the business environment in general. Other than the negative impact the global financial crisis has had on consumer demand, the group has continued to effectively sustain operations and generate positive returns and cash flow for shareholders.
Information technology
The risks surrounding the security, back-up and conversion and update risks relating to the group’s information technology systems are continually assessed. Disaster recovery plans and conversion of enterprise resource planning (ERP) systems are reviewed regularly as disruptions to critical management information and application systems could have a material impact on the group’s continuing operations. During the past two years the group invested R105 million in successfully migrating end-of- life hardware, upgrading Oracle database versions and moving to a state-of-the-art, high-availability, disaster recovery solution covering approximately 60% of the group’s turnover. Plans are in place to systematically upgrade and migrate remaining Tiger business legacy systems onto the Oracle platform over the next four years.
The group’s strategic risks are identified, documented and monitored by management and reviewed by the risk/sustainability committee.
The significant and potentially high impact risks identified include the following areas:
Legislative issues
The group participates in both industry and corporate responses to proposed government legislation affecting the group. In addition, the group also engages directly with the relevant government departments where appropriate. Fair trade, product safety and tariff enforcement are areas relevant to the group, where interaction at appropriate governmental level is required. Preparations for compliance to the new Companies Act and Consumer Protection Act by 1 April 2011 and 24 April 2010 respectively, are on track.
Transformation
The group recognises that participation in the successful transformation of South African society is critical for the sustainability of the current macroeconomic environment. Significant progress has been made in this regard as outlined on pages 87 to 88 whereby the company has achieved a Level 3 rating in terms of the BEE transformation scorecard during 2010.
Products
The group continually monitors, reviews and approves quality control procedures and consequent consumer assurance in the respective supply chains throughout the business. The majority of the group’s manufacturing facilities are HACCP compliant or in the process of seeking HACCP or ISO 22000 accreditation. The residual risk is considered low.
Production facilities
The group formally reviews both preventative and mitigating controls on a regular basis

52 Tiger Brands Annual Report 2010
Corporate governance continued
Group at a glance Group review
supply and possible alternative sources of energy. Where practical, the group has installed standby generators at sites where business continuity risks are critical in the event of power supply disruptions. The company assesses savings opportunities in respect of electrical consumption. The company is also required to regularly assess the quality of water used at its facilities and the sustainability of supply. At certain manufacturing sites it has become necessary to instal water treatment plants to maintain a low level of risk with regard to incoming water quality.
The responsibility for each of the strategic risks that have been identified has been assigned to an appropriate member of the group’s senior management team who is required to report to the executive committee on the identified risks assigned to them and outline the steps being taken to manage or mitigate such risks.
The group also runs a number of specific risk control initiatives addressing health and safety management, security, fire defence, food safety, environmental management and quality management and has adopted a system of incident reporting at operational level which allows for reporting to management by exception.
The group has also implemented a control risk assessment process at all operations.
These risk management activities are complemented by the enforcement of the group’s code of ethics, the confidential ethics hotline and the use of an internal commercial audit department to assist in addressing potential fraud or criminal activity.
The commercial audit department carries out compliance-based audits focusing on the control environment. The commercial audit department also responds to issues arising from the ethics hotline as well as any reports of defalcation or other issues requiring investigation. The company has a zero-tolerance approach to compliance with all laws.
Foreign exchange
The foreign exchange environment is monitored on an ongoing basis and any transactions involving foreign currency are managed through a clear foreign exchange policy where open positions are limited. The residual risk to the group is considered low. Further detail to the group’s risk in respect of foreign currency can be found in note 37 to the financial statements.
Reputation risk
The group constantly monitors and addresses issues that can adversely impact the group’s reputation and the reputation of its brands as well as all other facets of the business that can have an impact on reputation.
Human resources
The group continues to develop its internal talent pool and to seek innovative ways to find and retain skilled staff. Succession planning is in place and specific skills shortages are being addressed. Further detail in this regard can be found on pages 85 to 95.
Resources and procurement
The group continually monitors and reviews the changes in climatic conditions, which is being expanded to assess the agricultural arena in view of the increasing focus on climate change and its implications for our supply chain.
Exposures and strategy relating to procurement of key raw materials required by the group are reviewed on an ongoing basis. Further detail with regard to soft commodity price risk is articulated in note 37 to the financial statements.
Electricity and water supply
As a consequence of the increase in demand for electricity in South Africa, the company is required to assess its current exposure and back-up position with regard to electricity

53Tiger Brands Annual Report 2010
▲
Governance and sustainabilityDivisional reviews Annual financial statements
The company is focusing on the requirements relating to risk and sustainability in terms of King III and compliance therewith.
Transformation committeeThe transformation committee is a subcommittee of the board and acts in terms of a charter. Its primary purposes include:• changing and developing a new way of
doing business within Tiger Brands that represents and celebrates diversity;
• fostering and encouraging broader economic participation in the industries in which the company participates;
• developing an employee profile that is more inclusive and representative of the demographic spectrum of South Africa and subsequently developing a reputation of being an “employer of choice”;
• ensuring that actual organisational culture change occurs, and business benefits are achieved; and
• reporting to the board on the transformation work undertaken, and the extent of any action taken by management to address areas identified for improvement.
The transformation committee comprises independent non-executive directors as well as representatives of management. The committee is chaired by B L Sibiya and the other independent non-executive directors are M Makanjee and A C Parker. Executive management include P B Matlare and B N Njobe.
The company’s overall BBBEE score has improved in the year under review. The latest verification report undertaken by EmpowerLogic reflects that the company is a Level 3 BBBEE contributor. This progress is in line with the strategy and targets approved by the committee in 2007 and reviewed annually. With the BBBEE transformation firmly on track, the committee is turning its focus to cultural transformation as measured by employee satisfaction results.
Attendance at transformation committee meetings
Member 20/11/09 12/02/10 14/05/10 30/07/10
B L Sibiya(Committee chairman) ✓ ✓ ✓ ✓
U P T Johnson1 ✓ n/a n/a n/aP B Matlare ✓ ✓ ✓ A B N Njobe ✓ A ✓ ✓
N G Brimacombe2 ✓ ✓ n/a n/a 1Resigned on 31 December 2009.2No longer a member with effect from 12 February 2010.✓Indicates attendance.AApologies tendered.n/aNot applicable.M Makanjee and A C Parker were appointed in September 2010.

54 Tiger Brands Annual Report 2010
Corporate governance continued
Group at a glance Group review
unintentional contravention of the insider trading laws and stock exchange regulations.
Any investment in or disinvestment from a group company must be referred to the chairman of the company concerned to obtain consent before any instruction is given to a stockbroker. The consent required may be delayed or withheld according to judgement of the circumstances prevailing at the time. Short-term or speculative positions may not be taken by directors or executives of the company in any of the securities of the group companies. Participants in the group’s share incentive schemes are subject to the rules of the scheme and the provisions of the Listings Requirements of the JSE Limited.
Unless extraordinary circumstances exist, and are approved by the chairman, no investment or disinvestment may take place during the closed periods, which are between 31 March and the release of the interim results in May, and between 30 September and the release of the final results in November and any other closed period as may be outlined in terms of the JSE Listings Requirements.
Party political supportThe group does not support, financially or otherwise, any individual political party.
Accountability – financial statementsThe directors of Tiger Brands are responsible for preparing financial statements and other information presented in the annual report in a manner that fairly presents the state of affairs and results of the operations of the company and the group. The external auditors are responsible for carrying out an independent examination of the financial statements in accordance with International Standards of Auditing (ISA) and reporting their findings thereon.
EthicsThe group has adopted a code of ethics which applies to executive directors, non-executive directors, managers and all other employees of the group. The purpose and scope of the code is:• to promote and enforce ethical business
practices and standards in the group; and • to reflect the group’s policy on ethics and
accordingly should be carefully studied as it forms part of the expectations the company has of all its managers and employees. An acceptance of employment with the company is deemed to be an acceptance of the principles set out in this code.
The company subscribes to the principles of the King Code (King III) on Corporate Governance, which principles are embodied in the group’s code of ethics. The code is intended for use to raise ethical awareness, and as a guide in day-to-day decisions. It can also be used in training programmes, and to help assure customers, suppliers and competitors of the integrity of the group companies with which they deal.
The group is a founder member of the Ethics Institute of South Africa.
A confidential ethics hotline has been established and all reports received are investigated by the commercial audit department. The commercial audit department has been successful in investigating and assisting in prosecutions as and when fraud or defalcations have been reported and identified.
Dealing in company sharesThe code of ethics makes provision for the procedure for dealing in Tiger Brands shares. The code outlines procedures that are to be implemented throughout the group to protect directors and executives against possible and

55Tiger Brands Annual Report 2010
▲
Governance and sustainabilityDivisional reviews Annual financial statements
New appointees to the board are appropriately familiarised with the company through an induction programme.
The board of the company meets regularly and monitors the performance of executive management.
It addresses a range of key issues and ensures that debate on matters of policy, strategy and performance is critical, informed and constructive.
All directors of Tiger Brands have access to the advice and services of the company secretary and, in appropriate circumstances, may, at the group’s expense, seek independent professional advice concerning its affairs.
Sustainability
A comprehensive sustainability report is contained on pages 74 to 95 of the annual report.
The annual financial statements have been prepared in accordance with International Financial Reporting Standards (IFRS) and the Companies Act in South Africa. They are based on appropriate accounting policies and are supported by reasonable and prudent judgements and estimates.
The directors have no reason to believe that the group’s operations will not continue as going concerns in the year ahead, other than where closures or discontinuations are anticipated, in which case provision is made to reduce the carrying cost of the relevant assets to net realisable value.
Directorate and executive managementThe board of directors of Tiger Brands includes independent non-executive directors who are chosen for their business acumen and skills. The chairman of Tiger Brands acts in a non-executive capacity and is independent.

56 Tiger Brands Annual Report 2010
Group at a glance Group review
Remuneration report
far as the remuneration section of the Code is concerned. Whereas the company was already largely compliant in this regard with the recommendations contained in King III, a number of areas were identified where changes should be considered. Where the recommended changes have not been adopted, the reasons therefore are explained in the relevant sections of this report.
The chairperson reports to the board on the committee’s deliberations and decisions. The committee met four times during 2010. Attendance is reported on page 48 in the corporate governance section of the annual report.
Remuneration policyThe company’s remuneration policy has been updated to reflect the recommendations of King III.
The Tiger Brands group remuneration policy aims to ensure that the group attracts and retains key and critical people required to deliver group business goals and results.
The policy, in conjunction with the remuneration philosophy and strategy is predicated on the following key principles:• Remuneration should support the vision to be
the most admired branded FMCG company in emerging markets by attracting and retaining the right talent;
• Remuneration should have a direct correlation with the growth plans and financial performance of the businesses and the group;
• Remuneration should be reviewed and benchmarked annually through professional in-country service providers to ensure the group remains competitive in the diverse markets in which it operates, i.e. both locally and internationally, never applying percentiles rigidly but taking into account industry type, skills scarcity, performance and legislative structures and requirements;
• Remuneration must support the group’s strategy, and be consistent with the organisation’s culture of fairness and equity;
This remuneration report primarily covers the remuneration of the company’s executive and non-executive directors, as well as that of senior management.
Remuneration committeeThe primary function of the remuneration committee (“the committee”) is to determine the company’s general policy on executive and senior management remuneration. It has also been delegated by the board with the responsibility for determining the remuneration of the executive directors and other senior management members of the company, including cash salaries, performance-based short-term incentives, pensions, medical aid and other benefits, as well as approving all grants of options under the Tiger Brands Phantom Cash Option Scheme. The committee is also responsible for making recommendations to the board on the various fees paid to the company’s non-executive directors. The full terms of reference of the committee, which have been updated to reflect the recommendations of the King Code of Governance Principles for South Africa 2009 (King III), can be found on the Tiger Brands website (www.tigerbrands.com).
The committee comprises three independent non-executive directors which at 30 September 2010, were S L Botha (Chairperson), L C van Vught and B L Sibiya. The company’s chief executive officer attends the committee meetings by invitation and assists the committee in its deliberations, except when issues relating to his own compensation are discussed. No directors are involved in deciding their own remuneration. In 2010, the committee was also advised by the company’s human resources and finance functions. It also took external advice from PricewaterhouseCoopers relating to the extent to which the company’s remunerations policies and practices, in respect of its directors and senior executives, comply with King III.
At the meeting of the committee on 17 September 2010, a decision was taken to adopt the principles and recommendations contained in King III as
57Tiger Brands Annual Report 2010
▲
Governance and sustainabilityDivisional reviews Annual financial statements
plan and in the Tiger Brands Phantom Cash Option Scheme (and historically the Tiger Brands (1985) Share Option Scheme). Two executive directors and two other members of the Tiger Brands executive committee, are also participants in the Tiger Brands Black Managers Trust.
The short-term incentive bonus plan, Phantom Cash Option Scheme, Black Managers Trust, retirement and other benefits are commented on in more detail below:
Incentive bonus planThe executive directors and senior management participate in an annual incentive bonus plan, which is based on the achievement of short-term performance targets. These targets comprise a financial as well as a number of strategic components. In 2010, the short-term incentive scheme in respect of members of the Tiger Brands executive committee (including the chief executive officer and the four other executive directors), carried an 80% weighting in respect of the financial component and a 20% weighting for the strategic component.
The strategic element of the bonus consisted of a number of components, focusing on the following areas:• BEE transformation as measured by the
company’s externally verified transformation scorecard;
• Organisational and cultural transformation of the company;
• Advancement of the company’s growth strategy in the rest of the continent;
• Sustainable development, including the implementation of an environmental policy framework;
• Relative share price performance – the market performance of the company’s ordinary shares compared against the performance of the FINDI 30 index.
Each of the above elements carried an appropriate weighting. The financial performance component is based on growth in profits, as measured by headline earnings per share, and the return on net assets
• Remuneration should motivate and allow for differentiation in rewarding high performers;
• Individual contribution based on the role and responsibilities should have a direct bearing on the levels of remuneration;
• Total incentive-based rewards are earned through the attainment of demanding targets consistent with shareholders’ growth expectations.
Composition of executive remunerationThe remuneration of executive directors and senior management is determined on a total cost-to-company basis (i.e. total remuneration package). The total remuneration packages comprise an annual cash amount, various benefits including retirement provision, group life, health and disability insurance, funeral benefits and a travel allowance scheme where applicable.
The total remuneration packages of the executive directors and senior management are subject to annual review and benchmarked against external market data taking into account the size of the company, its market sector and business complexity. Individual performance, as reflected by formal performance ratings, value-add to the business and organisation as a whole, and overall responsibility are also taken into consideration. In respect of scarce skills, where scarcity is as a consequence of a unique combination of skills and experience an individual has, steps are taken to build a talent pool around the relevant individual to de-risk the organisation. The remuneration packages of this category of persons are adjusted to reflect market conditions.
Total remuneration packages are reviewed annually in October of each year. For consistently high performers, it is the intention to set guaranteed (non-variable) pay at above median levels of remuneration as reflected by an appropriate external executive remuneration survey.
Outside of the total remuneration package structure, executive directors and senior management participate in an incentive bonus

58 Tiger Brands Annual Report 2010
Group at a glance Group review
Remuneration report continued
• Further progress in the company’s growth strategy in the rest of Africa and the successful integration of businesses acquired;
• Environmental policy – setting of appropriate targets and tracking of individual business unit performance against target;
• Relative share price performance versus the performance of the Financial and Industrial 30 Index (FINDI 30).
In addition, the incentive scheme will be targeted at 100% of the total annual remuneration package, with participants on the scheme able to earn an incentive of up to 150% of total remuneration package (i.e. the scheme will be capped at 150%). The maximum short-term incentive is paid only when the company achieves stretch business performance targets and all the strategic targets are achieved. In setting the payout percentages for 2011, these have been determined on a progressive basis (as opposed to a straight-line basis) to give greater recognition to superior earnings performance in real terms.
Phantom Cash Settled Option SchemeThe committee gives consideration to granting options to executive directors and senior management on an annual basis.
On 23 February 2006, shareholders approved the adoption of a Phantom Cash Option Scheme to replace the Tiger Brands (1985) Share Option Scheme. In terms of the Phantom Cash Option Scheme, cash options have been granted to the executive directors and senior managers on an annual basis since 2006.
The rules of the Phantom Cash Option Scheme are based on the 1985 share option scheme. Apart from the fact that the options in the new scheme are “cash settled” rather than “equity settled”, the major difference between the two schemes is that the maturity period of the cash settled options is six years as opposed to 10 years. The cash options awarded in 2006 and 2007 are subject to purely time-based vesting conditions, which is consistent with the previous scheme (i.e. one-third becoming vested on each of the third, fourth and fifth
employed, with the greater emphasis on growth in headline earnings per share. Measures and targets are set and reviewed annually by the remuneration committee. Performance against individual targets and objectives is also taken into account in the final bonus determination.
Incentive bonuses payable to executive directors in respect of 2010 are outlined in the table of directors’ emoluments. In addition, incentive bonuses payable to members of the executive committee, excluding the executive directors, are disclosed in aggregate on page 70.
The incentive scheme for 2010 was targeted at 80% of total annual remuneration package, with 80% of the incentive bonus being based on the group’s financial performance (headline earnings per share and return on net assets) and the remaining 20% (subject to minimum financial performance criteria being achieved) based on the level of achievement and progress made against the various strategic targets referred to above. All participants on this scheme are able to earn an annual short term incentive of up to 100% of total remuneration package. The bonuses accruing to executive directors in respect of 2010 equated to, in aggregate, 12,09% (2009: 83,82%) of their combined total remuneration packages. In addition, the bonuses accruing to the remaining members of the executive committee for 2010 equated to, in aggregate, 14,64% (2009: 85,48%) of their combined total remuneration packages.
The profit incentive scheme for 2011 is similar to the 2010 scheme, with 80% of the bonus being based on financial performance criteria (headline earnings per share and return on net assets), and the remaining 20% based on strategic criteria. The strategic element of the bonus for 2011 will focus on the following areas:
• BEE transformation, with specific emphasis on employment equity, skills development and enterprise development;
• Organisational and cultural development of the company;

59Tiger Brands Annual Report 2010
▲
Governance and sustainabilityDivisional reviews Annual financial statements
of the original grant date of the options, in respect of each one-third tranche respectively. In addition, from 2011 onwards, the method of determination of the grant prices at which options are awarded has been changed from the 30-day average closing share price prior to the date of the option grant to the 10-day volume-weighted average price (VWAP) prior to the grant date. The use of a 10-day VWAP price is considered by the committee to be appropriate as it smoothes out any volatility in the share price in the period immediately leading up to the grant date.
For future option grants under the Phantom Cash Option Scheme, 50% of the awards granted will continue to be subject to performance vesting conditions with the remaining 50% being purely time-based. This split is considered appropriate as part of the award is intended to act as a retention tool rather than an incentive mechanism.
The value of the underlying Phantom shares over which the cash options are granted is determined by reference to a predetermined multiple of annual total remuneration package. The individual multiples applied to the executive directors and other members of the executive committee in respect of the 2010 allocations, ranged between 1,0 and 1,4 times. The values so arrived at are divided by the option grant price to determine the total number of options to be awarded to an individual.
Vesting of share options in the event of termination of employmentIn the event that an individual’s employment is terminated, vesting of any outstanding (unvested) share options under the Phantom Cash Option Scheme is dependent upon the reasons for termination. These termination rules were reviewed by the committee at its meeting held on 17 September 2010, and certain changes were approved in order to align the scheme with the recommendations contained in King III. A comparison of the old and new rules is set out in the table below. The new rules will only apply to options awarded from 2011.
anniversary dates of the date of original grant). With effect from January 2008, and in line with global best practice and emerging South African practice, the company introduced performance vesting conditions to govern the vesting of a portion of the options granted under the Phantom Cash Option Scheme.
With regard to the options granted in 2008, 2009 and 2010, a total of 50% of the options are not subject to performance vesting conditions. The vesting of these options will remain time-based. The right to exercise the remaining 50% is, however, subject to the requirement that the company’s headline earnings per share increase by a minimum of 3% per annum above inflation, on a rolling cumulative basis, over the relevant three,- four- and five-year performance periods. Annual retesting of the performance condition is permitted up to the sixth anniversary of the date of original grant of these options.
The grant price of the cash-settled options awarded between 2006 and 2010 is equal to the average closing market price of a Tiger Brands share on the JSE for the 30 trading days immediately prior to the grant date of the option. The cash settlement amount of the option is equal to the difference between the closing market price of a Tiger Brands share on the date on which the option is exercised and the grant price. The participants therefore receive the same net proceeds as under the previous equity-settled option scheme, apart from broking fees and associated costs which are not payable under the Phantom Cash Option Scheme.
The structure and design of the company’s cash-settled option scheme was reviewed by the committee at its meeting on 17 September 2010. For options issued from 2011 onwards, and in line with the principles of King III, annual retesting of the performance condition will no longer be permitted. In order to avoid an all-or-nothing approach, a sliding vesting scale will replace annual retesting. In terms of this approach, a sliding vesting scale (based on varying levels of real growth in headline earnings per share) will be applied on the third, fourth and fifth anniversary dates

60 Tiger Brands Annual Report 2010
Group at a glance Group review
Remuneration report continued
Vesting of unvested options on termination of employment
Termination event Old rule New rule
(a) Resignation and dismissal for good cause
Options lapse No change
(b) Normal retirement Options vest post retirement subject to normal vesting criteria
No change
(c) Employee – initiated early retirement
For options granted post 1 January 2009, options vest after date of early retirement subject to normal vesting criteria, but prorated based on the period of service at the date of early retirement relative to the full vesting period of the unvested options
No change, but subject to sliding scale as indicated above (i.e. retesting not permitted)
(d) Retrenchment For options granted post 1 January 2009, options will be allowed to vest early (and performance conditions waived), based on the extent to which the retrenched employee has served at the date of retrenchment relative to the full vesting period of the unvested options
Prorated for time (as per old rule) and test the extent to which performance conditions are met, applying the sliding scale to all available tranches (i.e. retesting not permitted)
(e) Disposal of a subsidiary or business
Performance conditions are waived and all unvested options are deemed to vest on the date of the disposal
Prorated for time and test the extent to which performance conditions are met, applying the sliding scale to all available tranches at the date of exit
(f) Deaths Performance conditions waived and accelerated vesting applied to all available tranches
No change – although not in line with King III, a pragmatic approach has been taken in view of the small number of incidents
Details of equity-settled options issued in terms of the Tiger Brands (1985) Share Option Scheme held by directors as at 30 September 2010, together with options exercised during the year, are set out in note 24 to the notes of the annual financial statements. These options, all of which have vested as at 30 September 2010, are summarised in the following table:
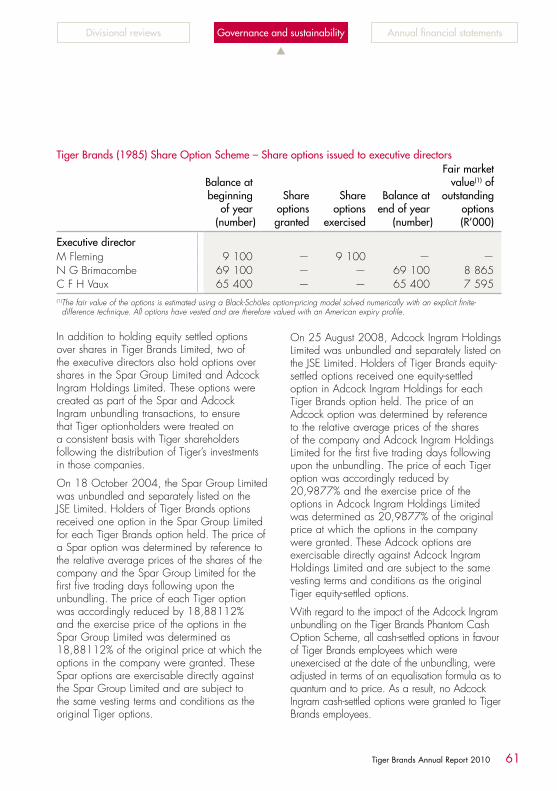
61Tiger Brands Annual Report 2010
▲
Governance and sustainabilityDivisional reviews Annual financial statements
Tiger Brands (1985) Share Option Scheme – Share options issued to executive directors
Balance at beginning
of year (number)
Share options granted
Share options
exercised
Balance at end of year
(number)
Fair market value(1) of
outstanding options(R’000)
Executive directorM Fleming 9 100 — 9 100 — —N G Brimacombe 69 100 — — 69 100 8 865C F H Vaux 65 400 — — 65 400 7 595(1) The fair value of the options is estimated using a Black-Schöles option-pricing model solved numerically with an explicit finite-
difference technique. All options have vested and are therefore valued with an American expiry profile.
In addition to holding equity settled options over shares in Tiger Brands Limited, two of the executive directors also hold options over shares in the Spar Group Limited and Adcock Ingram Holdings Limited. These options were created as part of the Spar and Adcock Ingram unbundling transactions, to ensure that Tiger optionholders were treated on a consistent basis with Tiger shareholders following the distribution of Tiger’s investments in those companies.
On 18 October 2004, the Spar Group Limited was unbundled and separately listed on the JSE Limited. Holders of Tiger Brands options received one option in the Spar Group Limited for each Tiger Brands option held. The price of a Spar option was determined by reference to the relative average prices of the shares of the company and the Spar Group Limited for the first five trading days following upon the unbundling. The price of each Tiger option was accordingly reduced by 18,88112% and the exercise price of the options in the Spar Group Limited was determined as 18,88112% of the original price at which the options in the company were granted. These Spar options are exercisable directly against the Spar Group Limited and are subject to the same vesting terms and conditions as the original Tiger options.
On 25 August 2008, Adcock Ingram Holdings Limited was unbundled and separately listed on the JSE Limited. Holders of Tiger Brands equity- settled options received one equity-settled option in Adcock Ingram Holdings for each Tiger Brands option held. The price of an Adcock option was determined by reference to the relative average prices of the shares of the company and Adcock Ingram Holdings Limited for the first five trading days following upon the unbundling. The price of each Tiger option was accordingly reduced by 20,9877% and the exercise price of the options in Adcock Ingram Holdings Limited was determined as 20,9877% of the original price at which the options in the company were granted. These Adcock options are exercisable directly against Adcock Ingram Holdings Limited and are subject to the same vesting terms and conditions as the original Tiger equity-settled options.
With regard to the impact of the Adcock Ingram unbundling on the Tiger Brands Phantom Cash Option Scheme, all cash-settled options in favour of Tiger Brands employees which were unexercised at the date of the unbundling, were adjusted in terms of an equalisation formula as to quantum and to price. As a result, no Adcock Ingram cash-settled options were granted to Tiger Brands employees.

62 Tiger Brands Annual Report 2010
Group at a glance Group review
Remuneration report continued
Phantom Cash Option SchemeDetails of Phantom Cash Options held by executive directors under the Tiger Brands Phantom Cash Option Scheme as at 30 September 2010, are set out hereunder:
NameDate of
grant
Holding at1 October
2009Granted
2010Exercised
2010
Holding at30 September
2010
Number ofoptions
subject toretention
Number ofoptions
subject toperformance
targets
Grantprice
(Rand)
Number ofoptions
vested at 30 September
2010
Fair marketvalue of
vested options at
30 September2010
(R’000)
P B Matlare Feb 2010 — 73 200 — 73 200 36 600 36 600 172,07 — —Feb 2009 40 400 — — 40 400 20 200 20 200 141,91 — —Apr 2008 126 563 — — 126 563 63 281 63 282 106,44 — —
Total 166 963 73 200 — 240 163 120 081 120 082 — —
N G Brimacombe Feb 2010 — 45 400 — 45 400 22 700 22 700 172,07 — —Feb 2009 25 400 — — 25 400 12 700 12 700 141,91 — —Apr 2008 29 363 — — 29 363 14 681 14 682 106,44 — —Jan 2008 23 920 — — 23 920 11 960 11 960 130,59 — —Jan 2007 21 642 — — 21 642 21 642 — 133,39 7 214 414Jan 2006 17 592 — — 17 592 17 592 — 118,13 11 728 808
Total 117 917 45 400 — 163 317 101 275 62 042 18 942 1 222
M Fleming Feb 2010 — 31 800 — 31 800 15 900 15 900 172,07 — —Feb 2009 14 800 — — 14 800 7 400 7 400 141,91 — —Apr 2008 16 959 — — 16 959 8 479 8 480 106,44 — —Jan 2008 6 834 — — 6 834 3 417 3 417 130,59 — —Jan 2007 6 581 — — 6 581 6 581 — 133,39 2 194 126Jan 2006 6 708 — — 6 708 6 708 — 118,13 4 472 308
Total 51 882 31 800 — 83 682 48 485 35 197 6 666 434
B N Njobe Feb 2010 — 30 200 — 30 200 15 100 15 100 172,07 — —Feb 2009 20 300 — — 20 300 10 150 10 150 141,91 — —
Total 20 300 30 200 — 50 500 25 250 25 250 — —
C F H Vaux Feb 2010 — 45 400 — 45 400 22 700 22 700 172,07 — —Feb 2009 25 400 — — 25 400 12 700 12 700 141,91 — —Apr 2008 29 363 — — 29 363 14 681 14 682 106,44 — —Jan 2008 23 920 — — 23 920 11 960 11 960 130,59 — —Jan 2007 22 022 — — 22 022 22 022 — 133,39 7 341 421Jan 2006 15 188 — — 15 188 15 188 — 118,13 10 126 697
Total 115 893 45 400 — 161 293 99 251 62 042 17 467 1 118
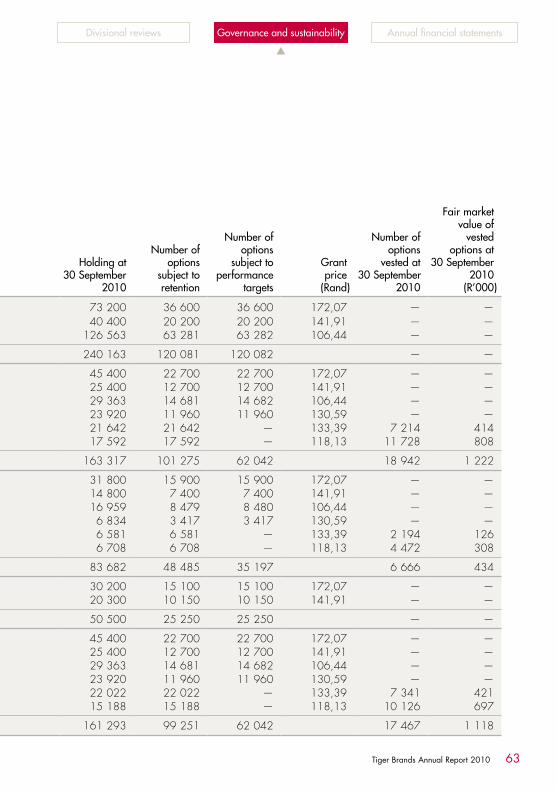
63Tiger Brands Annual Report 2010
▲
Governance and sustainabilityDivisional reviews Annual financial statements
Phantom Cash Option SchemeDetails of Phantom Cash Options held by executive directors under the Tiger Brands Phantom Cash Option Scheme as at 30 September 2010, are set out hereunder:
NameDate of
grant
Holding at1 October
2009Granted
2010Exercised
2010
Holding at30 September
2010
Number ofoptions
subject toretention
Number ofoptions
subject toperformance
targets
Grantprice
(Rand)
Number ofoptions
vested at 30 September
2010
Fair marketvalue of
vested options at
30 September2010
(R’000)
P B Matlare Feb 2010 — 73 200 — 73 200 36 600 36 600 172,07 — —Feb 2009 40 400 — — 40 400 20 200 20 200 141,91 — —Apr 2008 126 563 — — 126 563 63 281 63 282 106,44 — —
Total 166 963 73 200 — 240 163 120 081 120 082 — —
N G Brimacombe Feb 2010 — 45 400 — 45 400 22 700 22 700 172,07 — —Feb 2009 25 400 — — 25 400 12 700 12 700 141,91 — —Apr 2008 29 363 — — 29 363 14 681 14 682 106,44 — —Jan 2008 23 920 — — 23 920 11 960 11 960 130,59 — —Jan 2007 21 642 — — 21 642 21 642 — 133,39 7 214 414Jan 2006 17 592 — — 17 592 17 592 — 118,13 11 728 808
Total 117 917 45 400 — 163 317 101 275 62 042 18 942 1 222
M Fleming Feb 2010 — 31 800 — 31 800 15 900 15 900 172,07 — —Feb 2009 14 800 — — 14 800 7 400 7 400 141,91 — —Apr 2008 16 959 — — 16 959 8 479 8 480 106,44 — —Jan 2008 6 834 — — 6 834 3 417 3 417 130,59 — —Jan 2007 6 581 — — 6 581 6 581 — 133,39 2 194 126Jan 2006 6 708 — — 6 708 6 708 — 118,13 4 472 308
Total 51 882 31 800 — 83 682 48 485 35 197 6 666 434
B N Njobe Feb 2010 — 30 200 — 30 200 15 100 15 100 172,07 — —Feb 2009 20 300 — — 20 300 10 150 10 150 141,91 — —
Total 20 300 30 200 — 50 500 25 250 25 250 — —
C F H Vaux Feb 2010 — 45 400 — 45 400 22 700 22 700 172,07 — —Feb 2009 25 400 — — 25 400 12 700 12 700 141,91 — —Apr 2008 29 363 — — 29 363 14 681 14 682 106,44 — —Jan 2008 23 920 — — 23 920 11 960 11 960 130,59 — —Jan 2007 22 022 — — 22 022 22 022 — 133,39 7 341 421Jan 2006 15 188 — — 15 188 15 188 — 118,13 10 126 697
Total 115 893 45 400 — 161 293 99 251 62 042 17 467 1 118

64 Tiger Brands Annual Report 2010
Group at a glance Group review
Remuneration report continued
initial combined notional price of R117,67 for a Tiger and an Adcock share.
In addition, on 31 December 2009, a top-up allocation of rights to 2 763 Tiger shares (and 2 763 Adcock Ingram shares) was awarded by the BMT I to each of P B Matlare and B N Njobe at an initial combined notional price of R122,39 for a Tiger and an Adcock share.
The Tiger Brands Black Managers Trust No. II (BMT II) was established as part of Tiger Brands’ BEE Phase II transaction that was implemented on 20 October 2009. In terms of this scheme, the above two executive directors, P B Matlare and B N Njobe, each received an allocation of rights to 16 300 Tiger shares on 31 January 2010 at a notional price of R147,59 per Tiger share. After the lock-in period for this scheme (i.e. after 31 December 2017), a certain number of the allocated shares will be distributed to the executive directors once Tiger Brands has exercised its right to repurchase a portion of the original allocation from the BMT II, in terms of a Repurchase Formula.
Aggregated details of Phantom Cash Options held by members of the Executive Committee, other than the executive directors above, as at 30 September 2010, are set out hereunder:
NameDate of
grant
Holding at1 October
2009Granted
2010Exercised
2010
Holding at30 September
2010
Number ofoptions
subject toretention
Number ofoptions
subject toperformance
targets
Grantprice
(Rand)
Number ofoptions
vested at 30 September
2010
Fair marketvalue of
vested options at
30 September2010
(R’000)
Total Various 214 714 133 800 — 348 514 198 809 149 705 Various 24 471 1 590
Black Managers TrustsThe Tiger Brands Black Managers Trust (BMT I) was established in 2005 as part of the company’s Phase I staff empowerment transaction, implemented in October 2005. In terms of the BEE Phase I staff empowerment transaction, the allocation of participation rights to Black Managers will entitle beneficiaries to receive the underlying Tiger shares (and shares in Adcock Ingram on a one-for-one basis) – after making the required capital contributions to the BMT I – at any time after the specified lock-in period, i.e. from 1 January 2015.
Two executive directors have received allocations from the BMT I. P B Matlare was allocated the rights to 13 500 Tiger shares in July 2008 at an initial notional price of R117,91 per Tiger underlying share. This notional cost will vary over time in terms of a Formula and, when these participation rights are taken up, this will result in the participant being entitled to receive 13 500 Tiger shares as well as 13 500 Adcock Ingram shares. On the same basis, B N Njobe was allocated the rights to 13 500 Tiger shares (and 13 500 Adcock Ingram shares) in January 2009 at an

65Tiger Brands Annual Report 2010
▲
Governance and sustainabilityDivisional reviews Annual financial statements
Aggregated details of Phantom Cash Options held by members of the Executive Committee, other than the executive directors above, as at 30 September 2010, are set out hereunder:
NameDate of
grant
Holding at1 October
2009Granted
2010Exercised
2010
Holding at30 September
2010
Number ofoptions
subject toretention
Number ofoptions
subject toperformance
targets
Grantprice
(Rand)
Number ofoptions
vested at 30 September
2010
Fair marketvalue of
vested options at
30 September2010
(R’000)
Total Various 214 714 133 800 — 348 514 198 809 149 705 Various 24 471 1 590
Black Managers TrustsThe Tiger Brands Black Managers Trust (BMT I) was established in 2005 as part of the company’s Phase I staff empowerment transaction, implemented in October 2005. In terms of the BEE Phase I staff empowerment transaction, the allocation of participation rights to Black Managers will entitle beneficiaries to receive the underlying Tiger shares (and shares in Adcock Ingram on a one-for-one basis) – after making the required capital contributions to the BMT I – at any time after the specified lock-in period, i.e. from 1 January 2015.
Two executive directors have received allocations from the BMT I. P B Matlare was allocated the rights to 13 500 Tiger shares in July 2008 at an initial notional price of R117,91 per Tiger underlying share. This notional cost will vary over time in terms of a Formula and, when these participation rights are taken up, this will result in the participant being entitled to receive 13 500 Tiger shares as well as 13 500 Adcock Ingram shares. On the same basis, B N Njobe was allocated the rights to 13 500 Tiger shares (and 13 500 Adcock Ingram shares) in January 2009 at an
abovementioned umbrella retirement scheme, whilst the remaining members belong to the Tiger Brands Management Provident Fund, which is a defined contribution plan. The company contributes 15,9% of gross pensionable remuneration to this fund for retirement funding purposes.
Details of contributions made in the year ended 30 September 2010 on behalf of executive directors and other members of the executive committee are set out on pages 69 and 70.
Other benefits
The executive directors and other members of the executive committee enjoy various other benefits including medical aid cover, permanent health insurance, death in service and funeral cover, as well as the entitlement to a travel allowance where applicable. Post-retirement death benefits are also provided in respect of the company secretary, Mr I W M Isdale. A post-retirement death benefit amounting to R4 249 971 was paid to the former chief executive officer, Mr N Dennis, in December 2009 following the fulfilment of certain conditions.
Share dilution limitIn terms of the rules of the Tiger Brands Phantom Cash Option Scheme, at any point in time the aggregate of the number of Phantom Shares relating to all unexercised options in terms of the Scheme, together with all unexercised options in terms of the Tiger Brands (1985) Share Option Scheme, is limited to 10% of the total issued share capital of the company. As at 30 September 2010, the aggregate number of all outstanding options represented 2,58% of the company’s total issued share capital.
Retirement benefitsDuring the year, the group made contributions on behalf of the executive directors to an umbrella retirement scheme operated by Investment Solutions. The scheme is a defined contribution retirement plan, with the company contributing 15,4% of gross pensionable remuneration for retirement funding purposes. The cost of these contributions forms a component of the directors’ total remuneration packages. With regard to members of the executive committee (other than the executive directors), one member participates in the

66 Tiger Brands Annual Report 2010
Group at a glance Group review
Remuneration report continued
retained (with original vesting dates), if the reason for termination is for good cause, with vesting periods not being accelerated. This, however, does not apply to resignations and dismissals, where all unvested options at the date of exit automatically lapse.
On 15 June 1999, Mr I W M Isdale entered into an employment agreement with the company in respect of his services as company secretary. The employment agreement is subject to a notice period of not less than three months to be given by either party. The company may elect to make the payment of a cash sum in lieu of notice of termination.
In the event of such termination of employment creating an obligation on the employer to pay severance pay to the individual concerned in terms of the Labour Relations Act, 1995, or the Basic Conditions of Employment Act, 1997, then the severance package shall be equal to a multiple of monthly remuneration. The multiple applicable to Mr I W M Isdale equates to 20 months’ remuneration. However, the multiple is limited to the number of months that remain from the termination date to the date on which the employee would have reached his normal retirement age. The payment is based on pensionable remuneration plus the value of medical aid, group life and permanent health insurance benefits. In addition, a fixed amount will be payable by the company as compensation for the loss of benefits arising in terms of the company’s post-retirement death benefit scheme.
Succession planningDevelopment of a formal succession plan for senior and executive management takes place in March of each year. The plan is discussed and approved by the executive committee. The objective is to ensure that immediate succession is in place and also to develop
The total value of other benefits paid in respect of the executive directors and other members of the executive committee is set out on pages 69 to 72.
Deemed interestOne director enjoyed the benefit of a low interest loan from the Tiger Brands Share Trust in order to finance the purchase of ordinary shares in the company in terms of the Tiger Brands (1985) Share Purchase Scheme. Details of the deemed interest benefit in respect of this loan, are set out in the table of directors’ emoluments on page 69.
Executive service contractsExecutive directors and other members of the executive committee are not employed on fixed-term contracts and have standard employment agreements with current notice periods of either one or three months. The current retirement age is 63 although a retirement age of 65 applies to certain individuals.
Contractual entitlements on termination of employment include, for employees who leave for reasons of retirement or retrenchment, a pro rata short-term incentive payment, subject to the extent of achievement of the relevant financial and strategic performance targets at the end of the financial year and the necessary individual performance agreement being in place for the individual concerned at the date of his or her exit. No pro rata bonus is paid for employees who leave other than for reasons of retirement or retrenchment.
The termination rules relating to options issued under the Tiger Brands Phantom Cash Option Scheme are set out in the table on page 60. Options previously issued under the Tiger Brands (1985) Share Option Scheme are
67Tiger Brands Annual Report 2010
▲
Governance and sustainabilityDivisional reviews Annual financial statements
Non-executive directors are expected to provide the organisation with leadership, expertise and knowledge on strategy, enterprise, innovative ideas and to contribute to the business planning of the company.
Non-executive directors are compensated based on their overall contribution and input to the company, and not just for attendance at meetings. Consistent non-attendance at meetings, if applicable, will be appropriately handled as part of the annual board evaluation process. On this basis, non-executive directors receive an annual fee for their services on the board and board committees, rather than a base fee and meeting attendance fee which is contemplated by King III.
There are no contractual arrangements for compensation for the loss of office. Non-executive directors do not receive short-term incentives nor do they participate in the company’s long-term incentive scheme. The annual fees payable to non-executive directors for the period commencing 1 October 2009 were approved by shareholders on 16 February 2010.
Fees payable to non-executive directors are approved by the shareholders in terms of the company’s articles of association. In terms of the company’s articles of association, non-executive directors who perform services outside the scope of the ordinary duties of a director may be paid additional remuneration, the reasonable maximum of which is fixed by a disinterested quorum of directors.
The board recommends the fees payable to the non-executive directors for approval by the shareholders at the annual general meeting of the company. Proposals for fees are first prepared by the executive committee for consideration by the remuneration committee.
a pool of persons with potential for development and future placement. This includes managers at lower levels.
Board evaluation processThe chairman of the company conducted an internal performance evaluation of the board during 2010. Overall, the board was considered to be balanced and effective. However, a number of areas were identified for improvement. External evaluations of the board are planned to take place in 2011.
External company board appointmentsTiger Brands encourages members of the executive committee to consider accepting appropriate opportunities to serve as non-executive directors on the main board or board subcommittees of external companies. Tiger Brands believes this policy encourages members of the executive to broaden their skills base and experience. A formal policy has been adopted in this regard and, in terms thereof, an executive member will be limited to one substantive outside directorship. Directors’ fees paid to executive members by outside companies in terms of the policy may be retained by the individual concerned.
Non-executive directorsNon-executive directors are expected to carry out all the tasks and duties normally associated with the position of a non-executive director as defined by the Companies Act of 1973 (as amended) and the Companies Act of 2008 (when effective), King III and the articles of association of the company. The board and each of its committees has a charter which sets out the responsibilities of the board and its respective committees.

68 Tiger Brands Annual Report 2010
Group at a glance Group review
Remuneration report continued
Following approval by the remuneration committee, a final recommendation is then made to the board for its consideration and approval prior to being put to the shareholders.
Consideration is given to the increasing levels of responsibility being placed upon directors, as well as to market benchmarks for similar sized companies and projected inflation over the period. The table below sets out the current fees:
Levels of fees for non-executive directors
(Rands)
From1 October
2009
Base fee 250 000
Committee chairAudit committee 190 000Remuneration committee 130 000Risk/sustainability committee 108 000Transformation committee 108 000
Committee membershipAudit committee 94 000Remuneration committee 65 000Risk/sustainability committee 54 000Transformation committee 54 000
Chairman’s remuneration 1 161 000
Deputy chairman’s remuneration 600 000
The chairman and deputy chairman do not receive any additional remuneration for their participation in the subcommittees of the board.
In addition to the above fees, non-executive directors are paid an amount of R13 500 per meeting in respect of special meetings of the board and an amount of R2 700 per hour in respect of any additional work undertaken by them, provided that payment in respect of any such additional work is approved by the remuneration committee and the chief executive officer.
Fees paid to individual non-executive directors for the year ended 30 September 2010 are set out in the table of directors’ emoluments on page 69.
The board, based on the recommendation of the remuneration committee, has determined that shareholders be requested to approve that, the various fees payable to non-executive directors, as reflected in the table above, be increased by 8,5% with effect from 1 March 2011. In order to comply with the recommendations of King III, increases in the remuneration of non-executive directors are no longer approved by shareholders with retrospect effect. Accordingly, this increase includes an additional adjustment of 2,5% to take into account a five-month lag effect, on the basis that the fees were last reviewed with effect from 1 October 2009.
Approval of shareholders will also be sought for increasing the fees paid for attendance at special board meetings from R13 500 to R14 310 per meeting and for additional work undertaken from R2 700 per hour to R2 862 per hour. These adjustments represent an increase of 6%.
It is the company practice to conduct a benchmarking exercise on the fees payable to non-executive directors every two years. The next market review will be conducted in 2011.

69Tiger Brands Annual Report 2010
▲
Governance and sustainabilityDivisional reviews Annual financial statements
(a) Table of directors’ emoluments for the year ended 30 September 2010
(R’000) FeesCash
salary BonusOther
benefits
Retire-ment fund
contribu-tions
Deemedinterest
Gains onoptions
exercisedTotal
2010
Executive directors N G Brimacombe (note 1) 2 684 — 200 538 — — 3 422M Fleming 1 952 473 128 409 10 934 3 906P B Matlare (CEO) 3 622 855 248 634 — — 5 359B N Njobe 1 969 — 273 367 — — 2 609C F H Vaux (note 2) 2 684 3 223 28 543 — — 6 478Total A — 12 911 4 551 877 2 491 10 934 21 774Non-executive directors EFsL C van Vught (Chairman) 1 161 1 161S L Botha (note 3) 385 385R M W Dunne 610 62 610U P T Johnson (to 31 December 2009) 76 76M Makanjee (from 1 August 2010) 42 42K D K Mokhele 352 8 352R D Nisbet (from 1 August 2010) 109 68 109M P Nyama (from 1 August 2010) 42 42A C Parker 352 8 352P M Roux (to 30 June 2010) 188 188B L Sibiya (Deputy chairman) 600 600Total B 3 917 3 917Total A + B 3 917 12 911 4 551 877 2 491 10 934 25 691Note 1 Includes a once-off gratuity payment of R100 000 reflected under Other benefits.Note 2 Includes a retention bonus of R2 600 000 paid to C.F.H .Vaux in April 2010. In April 2008, a retention bonus comprising a
cash lump sum of one times total remuneration package and a special allocation of share options, was awarded to C.F.H. Vaux. The payment of the cash lump sum of R2 600 000 was subject to the recipient still being in the employ of the company on 1 April 2010.
Note 3 Director’s fees paid to MTN Group Management Services. EFs: Extra fees paid for additional work undertaken. These extra fees are included in the column under fees and are also shown separately for information purposes.

70 Tiger Brands Annual Report 2010
Group at a glance Group review
Remuneration report continued
Aggregated details of remuneration paid to members of the executive committee, other than the executive directors above (but including the top three earners who are not executive directors), is set out hereunder:
(R’000) FeesCash
salary BonusOther
benefits
Retire-ment fund
contribu-tions
Deemedinterest
Gains onoptions
exercisedTotal
2010
Total — 7 361 1 402 933 1 485 — 503 11 684
Number of members (excluding executive directors) – 2010 6
(b) Table of directors’ emoluments for the year ended 30 September 2009
(R’000) FeesCash
salary BonusOther
benefits
Retire-ment fund
contribu-tions
Deemedinterest
Gains onoptions
exercisedTotal
2009
Executive directors N G Brimacombe — 2 412 2 516 92 496 — — 5 516M Fleming (note 1) (from 18 May 2009) — 608 1 764 45 126 10 — 2 553P B Matlare (CEO) — 3 283 3 437 240 578 — — 7 538B N Njobe — 1 798 2 014 223 338 — — 4 373P M Roux (note 2) (to 13 March 2009) — 1 153 — 152 251 — 1 626 3 182C F H Vaux — 2 476 2 519 24 500 — — 5 519
Total A — 11 730 12 250 776 2 289 10 1 626 28 681

71Tiger Brands Annual Report 2010
▲
Governance and sustainabilityDivisional reviews Annual financial statements
(b) Table of directors’ emoluments for the year ended 30 September 2009 (continued)
(R’000) FeesCash
salary BonusOther
benefits
Retire-ment fund
contribu-tions
Deemedinterest
Gains onoptions
exercisedTotal
2009
Non-executive directors EFsL C van Vught (Chairman) 1 238 163 1 238D D B Band (to 6 October 2008) 5 5S L Botha (note 3) 263 263R M W Dunne 500 25 500U P T Johnson 250 250K D K Mokhele 288 288A C Nissen (to 16 February 2009) 114 114A C Parker 288 288P M Roux (from 16 March 2009) 109 109B L Sibiya (Deputy Chairman) 380 25 380
Total B 3 435 3 435
Total A + B 3 435 11 730 12 250 776 2 289 10 1 626 32 116Note 1 On 5 May 2009, M Fleming was paid a retention bonus amounting to R1 800 000 which was originally approved in April 2008. Note 2 Included in other benefits in respect of P M Roux is a farewell gift valued at R10 500.Note 3 Director’s fees paid to MTN Group Management Services. EFs: Extra fees paid for additional work undertaken. These extra fees are included in the column under fees and are also shown separately for information purposes.

72 Tiger Brands Annual Report 2010
Group at a glance Group review
Remuneration report continued
Aggregated details of remuneration paid to members of the executive committee, other than the executive directors above (but including the top three earners who are not executive directors), are set out hereunder:
(All figures are stated in Rand thousands)
(R’000) FeesCash
salary BonusOther
benefits
Retire-ment fund
contribu-tions
Deemedinterest
Gains onoptions
exercisedTotal
2009
Total — 6 043 6 886 956 1 190 — — 15 075
Number of members (excluding executive directors) – 2009 4

73Tiger Brands Annual Report 2010
▲
Governance and sustainabilityDivisional reviews Annual financial statements
Management reporting
Management reportingThere are comprehensive management reporting disciplines in place, which include the preparation of annual budgets by all operating units and categories. Individual operational, functional and category budgets are approved by the relevant company executives, while the group budget is reviewed by the directors of the company. Monthly results and the financial status of operating units are reported against approved budgets and compared to the prior year. Profit projections and cash flow forecasts are updated regularly, while working capital and cash/borrowing levels are monitored on an ongoing basis.
As part of the strategic planning process, category growth and brand plans are compiled at the appropriate level, incorporating detailed action plans and allocated responsibilities. Progress against the action plans is reviewed on a regular basis.

74 Tiger Brands Annual Report 2010
Group at a glance Group review
Sustainability report
Tiger Brands is committed to adopting business practices that integrate environmental, social and ethical principles that can progress the transformation and sustainability agenda into the future.
As one of the top 100 JSE-listed companies in South Africa, our vision is to drive business growth sustainably, which implies striving to minimise the direct and indirect negative impacts of our business to the environment, economy and societies in the areas where we operate. Tiger Brands is pleased to report that the company has been included on the JSE SRI Index for 2010. This index focuses on various core governance, social and environmental measures which are in line with the more generally accepted principles in the UN Global Compact and consistent with the Global Reporting Initiative.
Consequently, sustainability remains a critical enabler in the company’s business strategy. Our approach to sustainability is based on a group-wide six-pillar framework, namely – Growth, Governance, Economy, Environment, Society and Partnerships and includes guidance on objectives, goals and targets for sustainability, minimum requirements and standards as well as enables the group to identify where Tiger Brands wants to innovate and develop leading practices.
In the year under review, Tiger Brands made significant progress in the implementation of its sustainability framework which was guided by a 2008 review and recommendations for the company on sustainability. Certain corporate and group-wide actions were implemented, however, the strategic focus is on embedding the strategy at business unit level. Understandably this will evolve overtime.
Enterprise development initiatives achieve an incremental impact on the economy
In emerging markets, our primary objective is to run the business profitably and in so doing contribute to economic growth, trade, taxes and jobs. In the South African context this is augmented by a commitment to contribute to the transformation of the economy. In the year under review, we made substantial progress on all the elements of the Broad-Based Black Economic Empowerment Scorecard. Of particular significance to the economy are the codes relating to procurement and enterprise development.
In the year under review, progress has been made on the implementation and rollout of the strategic Enterprise Development initiatives reported on last year.
Ithemba Pesticides Manufacturing – an initiative by the Homecare division to facilitate the creation of a co-packer company for specific Tiger products that has credible BEE credentials – has been implemented and it has had a positive impact on the business and employment beyond the Black Economic Empowerment credentials.
The catering partnership with the Centre for Culinary Excellence is a project that is intended to build capability (cooking and catering skills) among black-owned catering companies and chefs in a manner that facilitates a route to market for our Out of Home and Groceries divisions. The programme has completed the first phase of training of the women and started a second phase which is targeting rural women involved in the catering business.
As a consequence of these initiatives, the Enterprise Development Scorecard also improved significantly to 10,13 points out of a possible 15 points.
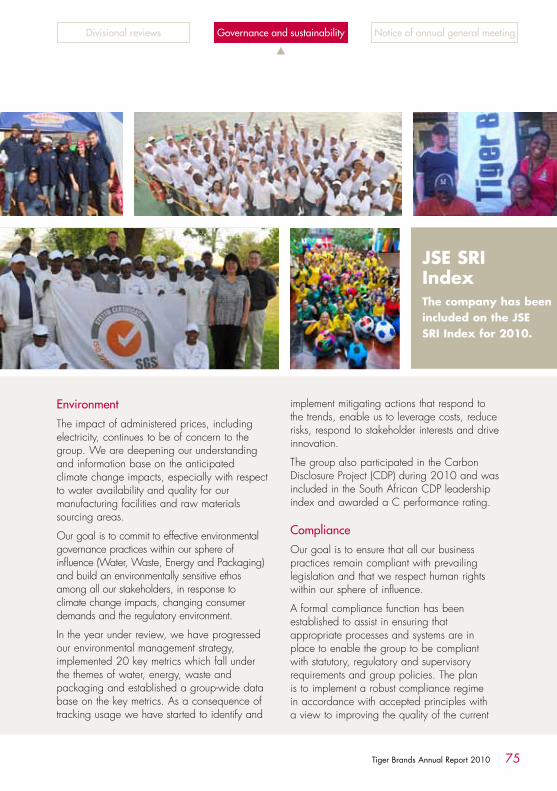
75Tiger Brands Annual Report 2010
▲
Governance and sustainabilityDivisional reviews Notice of annual general meeting
EnvironmentThe impact of administered prices, including electricity, continues to be of concern to the group. We are deepening our understanding and information base on the anticipated climate change impacts, especially with respect to water availability and quality for our manufacturing facilities and raw materials sourcing areas.
Our goal is to commit to effective environmental governance practices within our sphere of influence (Water, Waste, Energy and Packaging) and build an environmentally sensitive ethos among all our stakeholders, in response to climate change impacts, changing consumer demands and the regulatory environment.
In the year under review, we have progressed our environmental management strategy, implemented 20 key metrics which fall under the themes of water, energy, waste and packaging and established a group-wide data base on the key metrics. As a consequence of tracking usage we have started to identify and
implement mitigating actions that respond to the trends, enable us to leverage costs, reduce risks, respond to stakeholder interests and drive innovation.
The group also participated in the Carbon Disclosure Project (CDP) during 2010 and was included in the South African CDP leadership index and awarded a C performance rating.
ComplianceOur goal is to ensure that all our business practices remain compliant with prevailing legislation and that we respect human rights within our sphere of influence.
A formal compliance function has been established to assist in ensuring that appropriate processes and systems are in place to enable the group to be compliant with statutory, regulatory and supervisory requirements and group policies. The plan is to implement a robust compliance regime in accordance with accepted principles with a view to improving the quality of the current
JSE SRI Index The company has been included on the JSE SRI Index for 2010.

76 Tiger Brands Annual Report 2010
Sustainability report continued
Group at a glance Group review
connecting all the other themes of our CSI strategy. This is evidenced through the Thusani Trust, The Ikusasa Lami Programmes, various bursaries and internship programmes, and the establishment of our Tiger Brands Foundation which has a strong focus on education.
Partnering for successIn the year under review, we engaged with our key partner organisations to improve the collective quality of our reporting, and more importantly, to develop ways in which we could better quantify the impacts of our programmes on building social fabric in our communities. Some of the observations and feedback from our partner organisation emerging from this past year include the following:
Improved health outcomes
Given that a balanced diet and access to clean water are the basis for good health, the unavailability or erratic access to food predisposes vulnerable groups of peoples (such as children, those suffering from chronic infections and the elderly) to malnourishment, opportunistic infections and general malaise. In this reporting period, the majority of the parcels distributed were aimed at assisting primary beneficiaries and their families to gain consistent access to food and to subsequently enjoy a better quality of life. This was evident in families with sickly children and adults who after three months of continuous supply of nutritious food, started to report less time off work and school, improved sense of worth and general sense of feeling better.
Rebuilding pride, dignity and self-esteem
As a result of the way in which distributions happen through continuous engagement with
compliance processes. Appropriate awareness and monitoring tools will be implemented to give effect to the governance principles adopted by the group.
In the year under review, we participated in consultations on the key pieces of legislation and regulations that were of significance to us. We will be compliant with the new labelling regulations, and the Consumer Protection Act once promulgated.
GrowthWithout profitable growth we cannot expect the company to exist in the long term. The detail of the report on the growth strategy is contained in the body of the operational part of the report, with cross references to the emerging underlying principles of sustainability.
SocietyIn our mission to enhance the social capital in the areas in which we operate, we aim to be the most admired corporate citizen as we build community partnerships and develop our people in the society.
In 2010, we report on our impact of our contribution to building the social fabric as we shift the balance in our projects from philanthropic community investment to strategic areas. Tiger Brands Corporate Social Investment (CSI) focus areas are in our view contributors to the Millennium Development Goals and therefore has a developmental approach in both its form and impact. Much of what we do is done in partnership with other players and experts in the fields of food security, nutrition, education, hygiene, sanitation and heritage.
In the year under review, we have increased our focus on education as a central theme
77Tiger Brands Annual Report 2010
▲
Governance and sustainabilityDivisional reviews Notice of annual general meeting
Flagship projectsDefinition of Flagships – The main areas of intervention to which most of the CSI budget, time and resources would be allocated.
Flagship projects: EducationCraft-Ed
The country’s challenge on illiteracy and the inability to calculate by the majority of South African children in the not so privileged communities and schools, has necessitated an opportunity for Tiger Brands to partner with Craft-Ed in the fight for a literate and nutrition- aware country. In the group’s quest to improve the country’s social fabric, Tiger Brands has sponsored equipment to an amount of R980 000 that combines full teacher training for grade R through to grade 3 using the existing Outcome-based Education System to provide a solid foundation in numeracy, literacy and nutrition. Once implemented in a school, the three-year programme reaches 120 to 160 children per day.
Eleven schools are from Soweto in Gauteng and the other 17 are ‘No Fee’ schools in KwaZulu-Natal, Eastern Cape, Mpumalanga, Limpopo, North West, Free State and Western Cape. Tiger Brands will also involve its business units in the mentioned provinces so as to ensure involvement by Tiger Brands employees.
Our commitment therefore is to ensure that the schools which have been sponsored by Tiger Brands enjoy the massive benefits afforded to the teachers and indeed the children through this donation. The partnership between Craft-Ed and Tiger Brands combines the nutrition knowledge, mathematics and literacy skills for the children and thus results in improved education for all children. This initiative is truly refreshing and a source of pride, recognising that Tiger Brands is helping to change the face of teaching in these schools for the lifelong benefit of the children.
our partner organisations, the feedback received continues to provide hope given the immediate results observed within these families. In some instances, caregivers who previously struggled to provide food, showed greater self-esteem and pride on being able to feed their children. They also had better health enabling them to either look for work or alternative supplementary support such as setting up food gardens to grow vegetables. As a result of the above initiatives, there has been improved communication and parenting within such families. There is more laughter which also assists in building cohesion among family members.
Improved academic/work performance and productivity
Children learn better on a full stomach and the variety of energy-giving foods contained within the food parcels donated have been pivotal in improving academic performance. As part of Tiger Brands’ monitoring and evaluation programmes, the teams on site collect progress reports of the direct beneficiaries being supported through the many activities rendered. It has emerged that, coupled with providing food to children, all other programme activities are better received and as a result performance in school and sports is improved. Further to this, the adults who are eligible to receive food have also reported being able to work due to sustained energy levels.
CSI projects
This year we detail some of our projects that, together with flagship projects, have positioned our strategic approach and leverage the flexibility of our criteria to the benefit of all our communities. As mentioned earlier, over and above food security, we also focus on nutrition education, hygiene and heritage. We are consistently evaluating the impact of our CSI projects in our communities.

78 Tiger Brands Annual Report 2010
Sustainability report continued
Group at a glance Group review
The objective is to empower new farmers through effective practical skills training and holistic instruction to become competent in their abilities to understand and apply technical information, manage the farm as a production unit and a business, and market their produce profitably.
KZN Foundation
Tiger Brands has donated R582 000 towards the Department of Paediatrics and Child Health at the University of KwaZulu-Natal. This department is responsible for running a large HIV care and treatment programme in the Cato Manor Clinic, located at the boundary of the University’s Durban Campus. The Cato Manor Clinic is a fairly new clinic which provides primary healthcare to the community as well as chronic disease management. It has a midwife obstetric unit that has recently commenced offering a 24-hour service.
This programme at the University of KwaZulu-Natal caters for HIV-infected mothers and their families. There are approximately 1 000 adults currently on the programme, many of whom are unemployed and food insecure.
Flagships projects: Food SecurityAfrican Children’s Feeding Scheme (ACFS)
Tiger Brands’ partnership with ACFS dates back to 2002 when the company’s CSI initiative “Unite Against Hunger” adopted ACFS as a beneficiary project so as to work together to alleviate poverty and improve the social fabric of the communities.
Tiger Brands supports ACFS by providing schools/communities with basic needed standard monthly food parcels. In the 2010 year, Tiger Brands has donated R6,7 million of food products towards ACFS‘s 15 centres.
The ACFS takes care of many severely malnourished children who come from poverty-
City Campus (CIDA)
The partnership with CIDA dates back to 2007. Tiger Brands has over the years assisted CIDA in the provision of bursaries for the disadvantaged students. Recently our CSI unit has cemented its support to the campus providing meals for these students.
CIDA is a non-profit, private higher education institution based in Johannesburg. It contributes to the social and economic development of South Africa by providing access to quality higher education and skills development for financially disadvantaged students.
Since its initial intake of 120 students in 2000, CIDA has already graduated over 1 000 students who have begun their journey to a bright and promising future. Altogether 80% of these graduates are currently employed and it is estimated that the combined earnings during their working life (40 years) will be in excess of R4 billion.
Tiger Brands food products, valued at an annualised R300 000, provide three meals a day for 700 students. These students are at various stages of their studies towards their chosen degree. In the foreseeable future, CIDA plans to vastly expand its intake of students in order to provide more opportunities to the youth of South Africa – and even beyond its borders.
Buhle Farmers Academy (BFA)
In the year under review, Tiger Brands has partnered with BFA, providing food products to the academy valued at R288 000. The Buhle Farmers Academy, based in Delmas, Mpumalanga, is a practical agricultural training institution established in the year 2000 by the Food Health Hope Foundation in a collaborative effort with Tshwane University of Technology, previously Technikon Pretoria, for skills development in primary agriculture.

79Tiger Brands Annual Report 2010
▲
Governance and sustainabilityDivisional reviews Notice of annual general meeting
“very big thank you” to everyone who contributed towards the end. We wish you all the best in everything you do. People like you really build us very much”.
St Clement Home Based Care
Tiger Brands has a strong distribution and warehousing network and as such it is easier to manage transport logistics to our different partners based in almost all the provinces of the country including St Clement Home Based Care in KwaDabeka, Claremont. This year Tiger Brands has donated R890 000 to this organisation in KwaZulu-Natal.
This is a story of a granny-headed household headed by Mavis Samngweni, who benefits from Tiger Brands food products (sic):
“Out of nine of her children, six died, four from Aids-related infections and one was shot and killed and the other died in a car accident. Of the three remaining children, one is HIV positive: Zandile, ±40 years old, is on ARVs and has one child who is almost 20 years old and is healthy.”
“Grandchild Mandisa is 15 years old, is HIV positive and is on ARVs. She attends school and is doing grade 10. Her treatment is monitored by her aunt Zandile and her grandmother Mavis. A St Clement Home Based Care manager visits the family regularly. The family receives a food parcel from Tiger Brands every month as well as blankets and school uniforms from the centre.”
“Qiniso, the grandchild whose mother died of HIV infection, has tested negative in the Centre’s Healthcare facility. His grandmother, Mavis, was worried about his state of health as his father is also HIV positive. He does not live with the family and does not support the child.“
Over and above the Healthcare centre, St Clement also performs voluntary counselling and HIV testing.
stricken families through the Early Childhood Development (ECD) programme. Through Tiger Brands’ donation of food parcels, these children get a balanced daily meal, helping to provide necessary nutrition. The ECD programme helps to prepare children for school readiness by providing a stimulation programme. The ECD programmes are run in Alexandra, Naledi and Zola townships and help keep the children away from the abusive situations in the townships.
The ACFS’s modus operandi has worked well such that there has been active skills sharing with the sister organisation Stellenbosch Community Development Programme (SCDP) which is also supported by Tiger Brands. SCDP feeds about 1 200 and 1 400 children every school day of the year. This organisation works with other NGOs in Kayamandi on after-school care programmes, providing food which ensures good attendance.
The Nkabinde children from Emndeni South that benefit from Tiger Brands’ products through ACFS have this to say (sic):
“We as Nkabinde’s children, are very thankful for your sponsorship to us. We will like you to know that we really appreciate everything you are doing for us. Not everyone can do what you are doing. You really show us the love, support and the big hearts you have.
You have provided us with so much. Coming from our hearts we will like to repay you not with something small, but from our hearts which are very thankful for everything. We know it’s not that much but we really appreciate the work you are doing, it really means a lot to us as children.
To all, with all due respect, we say keep up the good work you are doing to all communities. Not only are you changing our lives, you are also encouraging us and building us as well. Altogether, we send a

80 Tiger Brands Annual Report 2010
Sustainability report continued
Group at a glance Group review
food gardening projects and bead-making businesses.
In the year under review, Tiger Brands has donated a total of R3,5 million towards Heartbeat’s centres in seven provinces.
Some of the direct beneficiaries’ stories that receive products from Tiger Brands (sic):
“My name is Lehlohonolo Makhele. I live in phase 4 Pieterswart. I live with my grandmother and my little sister. Their names are Gloria Makhele who is my grandmother and Lerato Makhele who is my sister.
“In the previous year we used to have food problems in my house because we had no income, but just after the intervention of Tiger Brands, we started having food and it made our lives easier and very much better because we know that we will have food.
“Tiger Brands came in very handy in our lives. We always know that every month we are having food and the other thing is that before Tiger Brands appeared, life was very difficult, but now it is very much better.
“In this case I would like to thank Heartbeat together with Tiger Brands for the food parcels that they give us every month as they are very handy.”
“My name is Tumo Ntai, 14 years old. I am in grade 6 at Relebeletse Primary School. I am a second born at home. Since my mother passed away, I stay with my elder sister, who has dropped out of school after my mother’s death. Things were not nice because there was nothing to survive with. Sometimes our neighbour gives us food but it is not enough.”
Nelson Mandela Metropolitan University – NMMU
In the Eastern Cape province, Tiger Brands has supported the NMMU to the tune of R237 945 this past financial year. The
Olive Leaf Foundation (OLF)
The Tiger Brands partnership with OLF spreads across many operational sites which include Soweto in Gauteng, Mthatha, Port Elizabeth, Durban and Cape Town. In 2010, hundreds of tons of food in the form of maize meal, Jungle Oats, samp, beans, peanut butter and various canned food products have been delivered to OLF. As a result the partnership has, over time, ensured that over 500 families and their members have continuous access to food and subsequently to better health outcomes.
In the 2010 year, Tiger Brands has contributed R800 000 to OLF ensuring assistance to approximately 2 000 families consisting of over 5 000 individuals that have benefited from the Tiger Brands food parcel distributions. The primary beneficiaries were mostly made up of support group members, clients who are bedridden, orphans and vulnerable children (OVC) and any other emergency cases from childheaded households.
Heartbeat
Heartbeat exists to empower OVC to reach their full potential through quality service provision, development and capacity building. According to the Heartbeat criteria, a child is considered orphaned only: if the mother is dead and the father not present; or if the father is dead and the mother not present; or both parents are dead or not present. Heartbeat defines a child as 18 years and younger or still attending school.
In the case of Heartbeat, caregivers visit the OVC three times weekly to assist with household chores, offer counselling and distribute the monthly food parcels donated by Tiger Brands. The food and emotional support provided is invaluable in helping to stabilise communities and Heartbeat works hard in promoting community self-sufficiency through

81Tiger Brands Annual Report 2010
▲
Governance and sustainabilityDivisional reviews Notice of annual general meeting
appreciated. We always look forward to prepare the special meals for the children.
“Once again I thank you from the bottom of my heart for making our dream come through.
Yours sincerelyM JamjamNoxolo Pre-School”
Building the Walls
In its quest to spread the community social investment footprint, Tiger Brands has made a donation to Building the Walls of our Communities organisation based in Plettenberg Bay.
This donation to the tune of R300 000 per annum, targets beneficiaries with nutrition needs in the greater Plettenberg Bay area (Bitou District). The main drive for the organisation has always been to provide food support to the needy. The support to beneficiaries is on soup kitchens servicing mostly children in the area, who will otherwise have no meal for the day.
Tiger Brands’ donation of food products contributes to the food parcel distribution programme which distributes food to home care environments within the New Horizon community. Beneficiaries of this food parcel are typically disabled people and people living with HIV/Aids and acute TB.
INMED Partnership for children
Poverty remains the bigger challenge for our country’s food security agenda.
Among the children who attend school, many arrive hungry, and for most, their only significant meal of the day is the food they receive through the school lunch programme. Tiger Brands’ focus on food security is the reason for support towards INMED’s Healthy Futures Programme which will have a
university has a community outreach programme that allows it to reach out to its nearest communities. This has been possible through the food donations from Tiger Brands.
Tiger Brands food products are also distributed to various identified needy groups of adults and children. These groups of children and adults are from children’s homes in and around the Port Elizabeth area.
Some of the beneficiaries are: Maranatha Street Children’s Haven which takes care of children found on the street and feeds and clothes them until they can be reunited with their families, with most of these children remaining in the haven until they matriculate; the Mother of Hope Crisis Centre, which provides for women and children who are victims of abuse; Sinethemba’s Children Shelter, a centre for abandoned children and orphans, and also the Aids Haven.
Thank you letter from Noxolo Pre-School (sic)
“Dear Sir/Madam
RE: Thank You Letter
“I would like to thank you for your support in the form of groceries. There has been a tremendous improvement in the health status of children that attend Noxolo pre-school.
“The food that comes from you is nutritious and keeps the children healthy always. Children look forward to their meals as they enjoy the food that is prepared and served to them. As a result, nurses were here recently to give them vaccine and they had good comments on the kids, saying that they are looking healthy and happy.
“I believe that good nutrition makes children healthy and happy too. I could not have achieved my goals and vision to nature and feed these children without your assistance. Your continuous support is very much

82 Tiger Brands Annual Report 2010
Sustainability report continued
Group at a glance Group review
been identified for this donation are Musina, Polokwane, Randfontein, Hennenman and Pietermaritzburg. The play pumps come with Tiger Brands’ branding on the tank stand, in line with the group’s corporate identity.
Water remains a key resource and a means to a better quality of life to all South Africans. Tiger Brands is joining hands in improving the social fabric for our communities.
Other projects supported by Tiger Brands
Soweto Hospice
In the year under review, Tiger Brands has supported the Soweto Hospice with food products to an amount of R306 093. Soweto Hospice’s objective is to deliver integrated intervention programmes and services to the terminally ill with a particular focus on those infected and affected by HIV/Aids. Tiger Brands provides at least one nutritional meal daily to patients in the in-patient unit as well as day care patients to build up their immune systems. Poverty, malnutrition, violence and abuse are rife in Soweto due to informal settlements, hence the need for nutritional support.
positive ripple effect from the learners to their families and communities.
Tiger Brands is encouraging sustainable development through food gardens in schools and not-for-profit organisations. INMED’s Healthy Futures Programme will see four schools in Polokwane, Limpopo, start their own vegetable gardens that will serve more children and families who desperately need access to healthy foods.
With a Tiger Brands’ grant of R500 000, the Healthy Futures Programme expanded into the Limpopo province at the northern most point of South Africa, an area that is economically depressed with a high rate of malnutrition and poor school attendance. This programme will also involve the Tiger Brands unit in Polokwane, to ensure ownership and participation by the employees as well.
Flagships projects: HygieneRoundabout Outdoor/Water Solutions – Play Pumps
Water is the nation’s most vital natural resource, and yet for more communities it is a scarce commodity not just from an availability point of view, but in some cases the access issues are a serious challenge in poor communities and schools.
Tiger Brands has partnered with Roundabout Outdoor/Water Solutions to sponsor six roundabout water play pumps in provinces where the group has key operations to ensure involvement by the employees in the units.
The roundabout play pumps will be installed in identified deserving previously disadvantaged schools that are in real need of water to a value of R660 000. The areas which have

83Tiger Brands Annual Report 2010
▲
Governance and sustainabilityDivisional reviews Notice of annual general meeting
their concentration ability at school as a result of undernourishment. Notable signs of improvement from learners, since food parcels were introduced, have been evident. Most of the needy children come from child-headed and granny-headed families.
Vlakteplaas UCC Primary School
Adopted by Tiger Brands in 2007, the school is situated at Oudtshoorn, towards De Rust. Vlakteplaas UCC is a farm school incorporating traditional school learning, but also teaches children daily life skills like personal hygiene and etiquette, as well as trying to develop musical and other talents. The children are from impoverished areas with poor nutrition and health. In 2010, Tiger Brands has donated food products valued at R182 665.
News from Vlakteplaas Skool – De Rust (sic)
“We’ve completed building at the school, and I wish to thank all our hundreds of sponsors the world over who’ve made the impossibility of yesterday, the reality of today! Above all, I again salute the donors who laid the major foundations to the future of our children.
“The childrens’ teachers and parents thank Tiger Brands most sincerely for their magnanimous food contribution to the health of our children.
Rebontsheng Primary School
Rebontsheng Primary School is situated in the heart of Vosloorus. Tiger Brands adopted this project in November 2008. The school has approximately 700 learners who have enrolled to benefit from the feeding scheme. Demand for more food is on the increase as more and more learners are joining the feeding scheme. Most learners have no parents and are raised by siblings. According to the principal of the school, Dora Monyake, there are notable signs of improvement from learners since the programme started, namely improved concentration span and lower absenteeism. Parents are also more supportive towards the school.
Phomolong Primary School
Tiger Brands has been supporting Phomolong Primary School situated in Thembisa, from March 2006, with food parcels to support approximately 800 learners on a monthly basis. Whilst Phomolong has a 2 500 enrolment, the 800 that were identified as most needy to take food parcels home, resulted from the fact that it was evident that the only meal would be served was at school. When they left school, they would ordinarily go unfed until the next day, which affected

84 Tiger Brands Annual Report 2010
Sustainability report continued
Group at a glance Group review
This year, we continued to donate food parcels to our people in response to ad hoc requests and were also able to make contributions to emergency relief operations in areas in which we operate. These included aged and disabled people in Uitkyk Village, Madikwe; families of four learners murdered in drag racing in Soweto; fire disaster at Pieter Wessels Old Age Home and Palmerton Child Care Centre. Palmerton is an organisation situated in Lusikisiki in the former Transkei, in the most rural area. This is an organisation which provides a home to children who were forced into marriage, infected and affected by HIV/Aids. At Palmerton centre, they are provided with education, shelter, food, clothing and care. This centre depends entirely on donor funding and sponsorship, which support has not been adequate in the recent past.
The centre has a high school with enrolment of approximately 1 897 students, as well as 15 schools within surrounds of Lusikisiki, which includes junior and primary schools. At present, the school is being run under the supervision of the O. R. Tambo District Municipality.
Goodwill building activitiesTiger Brands continues to participate in a range of goodwill building projects as part of its corporate social investment activities, that involve staff as well as outside partners and communities.
Mandela Day 2010
Mandela Day which takes place on Nelson Mandela’s birthday, 18 July, is an international day officially recognised by the United Nations, backed by a campaign that encourages people around the world to spend at least 67 minutes doing something good for others in honour of Nelson Mandela’s 67 years of service to humanity.
“Two full time cooks prepare hot wholesome meals for about 120 primary and 30 pre-school children, whilst also feeding 10 to 15 babies with special nutritious feed daily.
“Tiger Brands has indeed alleviated the hunger in our poor rural community. Our kids have new energy… a new lust for life, and a new future. DANKIE TIGER.”
Jans Rautenbach
Due to the donations from Tiger Brands, daily nutritious feeding remains the core of the school’s success. Vlakteplaas has also completed a modern and efficient day care centre where children from 6 to 24 months, whose mothers have to do seasonal farm work, attend. There the babies and toddlers also receive a daily nutritious meal.
Ad hoc donations
We continue to report on ad hoc donations that, as a group, we have deemed worthy of consideration. As previously reported, the assistance covers specific, once-off needs in our society. The ad hoc donations contribute to urgent and pressing requests to address food insecurity to all affected bodies, household levels and groups. The capacity developed in this area is to respond within hours so as to maximise and have a meaningful impact on the affected victims.

85Tiger Brands Annual Report 2010
▲
Governance and sustainabilityDivisional reviews Notice of annual general meeting
Stakeholders
Stakeholders’ (employees, customers, shareholders, regulators and suppliers) perceptions of the company drive our reputation and influence our ability to do business. We have committed to respect values and manage our relationships with key stakeholders.
Most of our CSI initiatives take place because we are in partnership with a range of customers, communities, governmental and non-governmental organisations. Experience has shown that in the absence of clearly defined objectives, roles and responsibilities, and auditable procedures, it becomes almost impossible to do good in communities in need. At Tiger Brands we are proud of our governance systems that support the CSI interventions we make.
Our People
This section of the report is structured to provide an update on Our People strategy, the group values and culture, key focus areas for 2011, an update on our progress in the implementation of Our People strategy, a summary of our attraction and retention strategy as well as an update on relevant statistics.
Update on the Our People strategy
Our People strategy has been reviewed and aligned to the corporate growth strategy referred to under the key strategic thrusts on page 4. In line with the group vision, our vision remains to be the most admired employer in the selected emerging market countries in which we operate. We will pursue the attainment of this vision through specific deliverables in the following strategic thrusts:• Admired multi-country employer.• Enabling and inclusive culture.
Tiger Brands employees in the respective units sprung into action and spent their 67 minutes on their respective charities. Of note is Tiger Brands International who spent this day with Siphumelele Home in Kempton Park. The business unit donated products, clothes and brought lunch for the children at the home. The Beverages division spent time with a special needs school, Woodside Sanctuary, in Auckland Park. The Beverages team also donated beverage products and generally spent 67 minutes with the children. The Enterprise team spent the Mandela Day with vulnerable children from Diepsloot and Fourways, who are fed by the Daily Bread organisation. Individual employees also spent their 67 minutes with charities that are close to them and shared their activities on the day. All these activities and stories were also published on our internal website.
SANDF Goodwill Parcel Project – 2010
Once again this year, Tiger Brands was requested to come on board as a sponsor for the SANDF Goodwill project at a SANDF breakfast organised by one of the contributors, Massmart. Tiger Brands was highly recognised by both Massmart and SANDF for its great contribution to this project since 2008.
Tiger Brands contributes to the hampers alongside other companies and these are delivered each December.
The secretary of Defence Designate, Ms Mpumi Mpofu, noted that this Goodwill project, leading to the annual visit, has emerged as one of the most important events on the Department of Defence calendar. She expressed her utmost appreciation to the contributors that supported deployed soldiers.

86 Tiger Brands Annual Report 2010
Sustainability report continued
Group at a glance Group review
Our ability to bolt-on local acquisitions has, over the years, been honed to a key strength and a core-competence. We continue to improve on our ability to integrate new businesses, which invariably are not wholly-owned, as efficiently and seamlessly as possible.
Preferred suppliers are being engaged to assist us to determine drivers for the most admired employer in the select emerging market countries in which we operate, improve our talent sourcing capability, partner us in people development initiatives, as well as other key deliverables identified for implementation in 2011.
Update on strategy implementation
Some of the projects that were pursued during 2010 in a quest to deliver on the people strategy are are:
• Enhancing our standing as an admired FMCG company – we participated in the “Best Company to Work For” survey. We were rated number 13 in the large companies section and seventh in the consumer goods industry sector. Of importance is that we noted areas in which we needed to improve the most in and continue to find ways to improve our performance. We are exploring options to introduce similar audits in the other geographies in which we have a presence.
• Continuing our efforts in creating and maintaining an enabling culture – embedment of our organisational values commenced in 2010 and implementation thereof is at different stages within each of our businesses. Our employee recognition programme, Tiger Stripes, is well entrenched and is applied across the group with winners coming from multiple countries. Award categories are aligned to the group values and passions, namely, excellence; people;
• Sustainable long-term organisational health.• People capability and capacity delivering
distinctive competencies.• Integrated people management platform.
Implementation plans are in place to ensure continued delivery of the group people strategy.
Our values and culture
Following the development of the group values in 2009, all businesses assessed their own culture cultivation programmes to establish how these could be aligned to the revised group values. Embedment programmes and implementation plans are underway.
The value statements have been simplified and are reflected as “Our Passions”. These group passions are:• Our Performance• Our Consumers• Our People• Our Integrity• Our World
Various toolkits and communication mechanisms are in place to assist the businesses in their implementation and embedment of values. Each business finds its own relevant expressions of the group passions.
Key focus areas for 2011
As the group intensifies efforts to expand into multiple countries and geographies, it is imperative that we continually revisit our operating model and organisational design as well as build specific skills and capabilities required to manage across different geographies. Additionally, we continue our focus on strengthening our capability to partner, as geographic expansion is largely driven off a brownfield acquisition-based platform.

87Tiger Brands Annual Report 2010
▲
Governance and sustainabilityDivisional reviews Notice of annual general meeting
Level 6; 2007: Level 7). The targets for 2010 were constructed to ensure the company obtains Level 4 status, even without the recently implemented Phase II BBBEE transaction. Factoring in the benefits of the Phase II BBBEE transaction, our performance improved to Level 3.
Equity ownership of 19,74 points or 98,72%, comprises a 6,4% employee ownership, including 3,99% ownership by black managers and 0,56% ownership by general staff. Thusani Trust, whose beneficiaries are children of our black employees, holds 1,85%. A total of 6,4% therefore, is directly or indirectly accruing to our employees. The Tiger Brands Foundation holds a further 5%.
Since inception in 2005 and operation in 2006, Thusani Trust has funded tertiary education of the children of qualifying beneficiaries and has produced 173 graduates (2009: 30; 2008: 65 and 2007: 78). Qualifications obtained span Commerce, IT, Law and Medicine. Part of the class of 2007, a total of 35 students, will complete their studies in 2010, bringing the total number of graduates to 208.
Our performance with respect to the second BBBEE element, management control, remains strong. We achieved 9,56 points (95,55%) of the possible 10. The group remains committed to maintaining these high levels of performance.
Tiger Brands is a vast group, procuring from tens of thousands of suppliers. The group has a policy in place to encourage suppliers to improve their BBBEE performance, either by one level per annum in step with Tiger Brands or two levels per annum if their rating is well below acceptable levels as defined in the Codes.
service; brands; and the world we live in. We continue to find different ways to energise the programme using our passion and, consequently, Sing Proud, an internal singing competition was introduced in 2010 to bring to life our passion for excellence in everything we do.
• Increasing our efforts in growing people capability and capacity – the functional academies were all refreshed and enhanced. Additionally, a web-based learner management portal was developed to enable employees to plan their learning calendar and book themselves onto the Tiger Brands Academy learning programme.
• Integrating people management practices – we continued to simplify some of the group people management practices, including performance, talent and people development processes and introduced a web-based recruitment portal where both employees and external applicants can view vacancies online as well as submit applications online.
• Ongoing improvement of organisational health metrics – we have an agreed metric to measure long-term organisational health and continue to show improvement on the overall metric. Some of the elements of the metric include leadership development, retention rate of key and critical staff, as well as our progress with respect to organisational transformation.
Update on BBBEE performance
The group undertook to improve its performance by one level per annum in its quest to increase its momentum on its contribution to nation building through BBBEE. We have met and exceeded our commitment, achieving a Level 3 contributor status for 2010 (2009: Level 5; 2008:

88 Tiger Brands Annual Report 2010
Sustainability report continued
Group at a glance Group review
score for Enterprise Development improved significantly to 10,13 (67,55%) out of a possible 15 points.
Update on attract and retain
Our group Employee Value Proposition, developed in 2009, elicited the key attraction drivers which drew prospective employees to join the group as well as key retention drivers which keep our key and critical staff engaged. These key drivers are clustered in four broad categories, namely:
Our Company is healthy and reputable, striving for an enabling inclusive Culture, whilst offering competitive Compensation for consistent high performers, and providing meaningful Career opportunities.
The group retention strategies and implementation toolkits were developed to bring effect to these elements.
Our goal remains to be the most admired employer in the branded consumer packaged goods sector in our chosen geographies. One of the acid tests for “most admired” is our ability to attract and retain key talent. Our performance for 2010 was as follows:
This policy continues to accelerate the progress on transformation, with the group’s preferential procurement score totalling 18,78 (93,89%) out of a possible 20 points.
The group’s focus on “Socio-Economic Development” (formerly CSI), dates back many years as corporate social responsibility was group practice long before the Codes were published. Examples of such are noted elsewhere in the annual report, with the group’s anchor project, Unite Against Hunger, continuing to grow in strength and influence. Although the group scores maximum CSI points, giving back to our communities and making a difference is part of the way we do business as espoused in our values and passions.
The areas of focused attention for 2010 were Employment Equity, Skills Development and Enterprise Development. Although our performance in the first two areas has been improving progressively, as detailed in the statistics under separate headings below, our Employment Equity score remains low at 9,1 (i.e. 60,74%) out of a possible 15 points. For Skills Development we scored 9,47 (63%) out of the possible 15 points, while the group
Grade Black White Total % Black
E 5 1 6 83
D 46 3 49 94
C 130 44 174 75
Total 181 48 229 79

89Tiger Brands Annual Report 2010
▲
Governance and sustainabilityDivisional reviews Notice of annual general meeting
competencies, has been carefully refined to ensure that the quality of learning is comparable to that of a formal institution while still delivering learning that is specific and focused on building Tiger Brands leaders.
The functional academies continue to offer refreshed modules to ensure functional depth and bench strength throughout the organisation.
Sharing the wealth
Our equity ownership mechanisms such as the General Staff Trust, the Black Managers’ Trust as well as the Thusani Trust, provide additional benefits – retention as well as engagement of participating employees.
All our employees who participated in the general staff share allocation have enjoyed bi-annual dividend payments since January 2006. Based on the success of the Phase I BEE transaction, the company allocated an additional tranche of 100 shares to our qualifying South African-based employees with effect from 20 October 2009. As the allocation was on the same basis, beneficiaries of the general staff trust continue to receive dividends from the company whenever they are declared.
In December 2009, the Tiger Brands Black Managers Trust allocated all remaining rights to shares that were warehoused for allocation to black managers in terms of the Phase I BEE transaction. The rights to a further 1,58% of Tiger Brands’ share capital were allocated to participants in the Black Managers’ Trust II during the course of 2010. This further strengthened the company’s ability to attract and retain quality black managers.
The Thusani Trust acquired a further 1,01% of Tiger Brands’ share capital on 20 October 2009 and continues to utilise proceeds from the dividends to fund tertiary education in support of an increased number of the qualifying employees’ children. To qualify for
With respect to retention, the company has a retention target of 80% for key and critical talent. In 2010 we retained 89% (2009: 88%). Specific examples of the group retention mechanisms are outlined below:
Growing our own timber
We continue to grow our own timber as detailed in the people development section further on in this report. We offer bursaries to our employees, financial support for tertiary education to the children of our employees through the Thusani Trust as well as personal development opportunities to our employees on an ongoing basis. Development and introduction of young talent into the business has been focused into four young talent projects. The graduate programme continues to be a successful source of young talent with 12 graduates on the 2010 programme that are being developed through the ranks (2009: 14). External bursaries were awarded to three engineering students who commenced their studies in 2010. The workplace experience project provides the group with a strong source of talent in the scarce skills areas and is a feeder pool into the graduate programme and entry level appointments. Finally, the Ikusasa Lami project focuses on providing grade 11 and 12 learners with exposure to formal industry and supports their career choices for tertiary studies. These learners, who are within the top five academic performers in their respective schools, provide a feeder pool for external bursary awards upon matriculation.
Organisational and individual performance and talent potential reviews are conducted annually. Individual performance and personal development remain an important aspect of each Tiger employee’s growth prospects.
The Leadership Licence programme, a customised leadership development model based on 20 group-specific leadership

90 Tiger Brands Annual Report 2010
Sustainability report continued
Group at a glance Group review
support, the employee needs to remain in the group’s employ, which enhances retention.
Senior managers participate in the company’s long-term incentive scheme, the cash-settled phantom share option scheme, where half of the allocation award is geared specifically toward retention.
Remuneration philosophy, policy and practices
Periodically, the company appoints external experts to review our remuneration philosophy, policy and practices. In 2010, this review focused on the level of the group compliance with the relevant principles proposed by the King III report.
Our variable remuneration instruments such as the short-term profit incentive scheme and the long-term incentive programme are well entrenched. The remuneration committee sets targets for and reviews the rules of the short-
term profit incentive scheme annually. The committee also reviews and amends the rules for the long-term incentive scheme periodically, when necessary.
Update on relevant statistics
We continue to provide sustainable employment to a significant number of people as per the table below. Our total salary and wage bill is approximately R1,9 billion (2009: R1,9 billion).
We set employment equity targets annually as part of our broader transformation targets and track performance on a quarterly basis. The group annual scores are reflected in the group scorecard and disclosed under group BBBEE performance.
Our levels of representivity are reflected in the composition of staff table below.
The composition of our staff is as follows:
African Indian Coloured WhiteDis-
abledPer-
manentTem-
porary Total
2010 6 035 837 1 067 1 083 87 9 022 2 326 11 3482009 5 895 820 1 032 1 154 83 8 901 2 542 11 443
People with disabilities as a % of our total headcount:
year ActualPercentageheadcount
2010 87 0,82009 83 0,7
The overall employee turnover rate for 2010 is 8% (2009: 8%). The reasons for these staff movements were:
Reason2010
%2009
%
Resignation 29,9 28,7Contract expired 0,1 2,1Retrenchment 8,6 23,6Retirement 14,5 9,9Dismissal 29,9 18,9Deceased 12,2 8,9Other (disability/absconded) 4,8 7,9

91Tiger Brands Annual Report 2010
▲
Governance and sustainabilityDivisional reviews Notice of annual general meeting
Our gender track record
Women constitute 52% of the total national population. Our transformation agenda includes the gender issue. Our performance to date is as follows:
Executive Senior Middle Junior
2010 27% 16% 31% 26%2009 30% 13% 29% 37%2008 30% 13% 30% 26%2007 17% 14% 33% 33%2006 13% 12% 31% 33%
Our black management talent
In this environment where it is challenging to retain management talent, regardless of race, we have been able to steadily grow our black management talent pool. Our performance to date is reflected in the table below.
Executive Senior Middle Junior
2010 55% 37% 49% 56%2009 50% 35% 43% 55%2008 50% 29% 39% 51%2007 18% 24% 36% 55%2006 13% 18% 29% 43%2005 10% 9% 27% 42%
Employee rights and relations
Our code of ethics governs our relationships with each other, as well as with our customers, suppliers, competitors and communities.
Our employees enjoy freedom of association. To that extent we have 13 unions recognised and operating at our various sites. In 2010, one business lost three days due to strike action and another lost one day due to work stoppage (2009: nine days).
The group continues to monitor and assess the implementation of our continuous improvement and culture creation processes at our manufacturing units to improve on our employment relations. Currently 95% of our operating sites have completed the culture creation process (Involvement and Communication), and 88% have gone a step further and implemented 20 Keys, the group’s continuous improvement programme.

92 Tiger Brands Annual Report 2010
Sustainability report continued
Group at a glance Group review
The table below reflects our performance to date: Sites which completed
InvoCom implementationSites busy implementing
20 Keys
2010 95% 88%2009 88% 87%2008 88% 87%2007 80% 84%2006 71% 69%
As all our permanent employees are shareholders, the Tiger share price performance is tracked on a daily basis and communicated during the InvoComs in most of the units, just as productivity is tracked. This is in addition to the tracking of the share price via our intranet.
Update on people development
We continue to invest in the learning and development of our employees. In 2010, we spent approximately R14 million (2009: R10 million) on various in-house learning programmes.
The Tiger Brands Academy (TBA), the group’s in-house learning institution, provides an opportunity for our employees to acquire portable cross-functional skills. During 2010, a web-based learner management system was introduced to simplify the TBA administration and reporting processes and to enhance the fulfilment of our Personal Development Plan (PDP) process. Our recent performance is represented below:
Number of learners
Actual training
days2010 2009 2010
Customer academy 103 188 306IT academy 250 440 250Leadership academy 758 279 1 151Marketing academy 66 52 344Manufacturing academy 165 268 269Finance academy 45 102 90
Total 1 387 1 329 2 410

93Tiger Brands Annual Report 2010
▲
Governance and sustainabilityDivisional reviews Notice of annual general meeting
These figures exclude programmes offered by external providers such as Adult Basic Education and Training (ABET), core skills, and business-specific skills, which are reflected separately below.
Additionally, we offer bursaries to our employees. In 2010, we offered bursaries to 117 employees (2009: 96).
The group continues to support national skills development initiatives through learnerships. TBA has offered the national certificate in manufacturing management (NQF5) and national diploma in manufacturing management (NQF6) since 2001. In 2010, we worked with SAQA to revise this diploma to a National Diploma in Supply Chain Management with electives in manufacturing, procurement or logistics. This qualification will be aimed at upskilling employees in other areas of the supply chain to further entrench our commitment to world-class manufacturing practices. The group also introduced a plant baking learnership and embarked on a formal apprentice programme.
In 2010, we enrolled 165 learners in learnerships per the table below (2009: 169).
Learnership title
Number of learners2010 intake
2009intake
Qualified in 2010
National certificate in manufacturing management (NQF5) 11 21 1National diploma in manufacturing management (NQF6) 3 3 —FET certificate in generic management (NQF4) 18 19 —Meat processing learnership (NQF3) 18 10 —Electrical learnership (Artisans and Apprentices) (NQF3) 15 9 8Electrical learnership (Artisans and Apprentices) (NQF2) 15 — —Fitter learnership (Artisans and Apprentices) (NQF3) 15 51 6Packaging learnership (NQF3) 16 56 56Plant baking learnership (NQF3) 30 — —Apprentices (Section 18) 24 — —Fundamentals Programme (NQF3) — 15 15
Total 165 174 86
We participate in sector-specific skills programmes which relate to basic manufacturing practices and operating skills and in 2010, 81 learners participated in our Core Skills Programme (NQF2) (2009: 122).
We have remained committed to the placement of workplace experience students in areas of scarce skills such as food technology and engineering. The table below reflects our current and 2009 intake per functional discipline. These workplace experience students become a feeder pool for our graduate programme or entry level appointments.
2010 2009
DisciplineFood Tech
Engi-neering Finance
Market-ing Other*
Food Tech
Engi-neering Finance
Market-ing Other*
Total 15 3 1 4 8 24 18 2 2 18
*Other includes Production and Operations.

94 Tiger Brands Annual Report 2010
Sustainability report continued
Group at a glance Group review
We have in place a comprehensive HIV/Aids management framework as well as a policy for the group. We support our HIV-positive employees through a third-party administered programme designed to cater especially for employees not on medical aid. Employees on medical aid are supported by the same third party but their process is slightly different as their access to ARVs is through the medical scheme.
Of the employees voluntarily counselled and tested in 2010, 7,5% tested positive (2009: 6%). They have all been enrolled on the programme and are provided with immune-boosting supplements and appropriate education. An encouraging trend is that all employees who test positive enrol and remain on the programme. Although we have a number of employees in stages two and three, the bulk (86%) remain in stage one. Approximately 92% of the affected employees in stages one to three are healthy, with no opportunistic infections. Antiretroviral treatment is provided to 81% of the positive employees on medical aid and their beneficiaries and to 14% of employees who are not – through provincial clinics.
Update on employee wellness
We continue to provide holistic wellness services to our employees either through on-site clinics or contracted professional services. We invested over R6,2 million in 2010 to provide these services (2009: R11,1 million). These services are offered free of charge to all employees, irrespective of whether they are on a permanent or temporary contract.
We offer our employees voluntary membership to our in-house medical scheme. The scheme has 4 929 principal members (2009: 5 007) and 11 397 beneficiaries (2009: 11 622), of which 1 944 are pensioners (2009: 1 744). These members and their dependants have access to cost-effective comprehensive health cover.
Although access to the medical scheme is open to all employees, affordability remains a barrier for some. From our bargaining unit side, we have 250 (2009: 247) employees covered by Sechaba Medical Solutions (Sizwe). Additionally, 241 employees are on the Food Workers Medical Benefit Fund (2009: 368) and 65 employees are on Umvuzo.
Our ABET programme is well entrenched in most business units and has been introduced in further units in 2010. A total of 33 employees completed the programme in 2010 (2009: 47). We currently have 540 learners on the programme at different levels – from basic orientation (BO) to level 4, as per the table below.
yearActive
learners
Literacy Numeracy
BO 1 2 3 4 BO 1 2 3 4
2010 540 9 114 165 78 52 0 23 67 25 72009 400 1 132 58 54 77 0 10 31 22 15

95Tiger Brands Annual Report 2010
▲
Governance and sustainabilityDivisional reviews Notice of annual general meeting
American Institute of Baking and the South African Food Safety Inspection Services. The majority of our units have HACCP accreditation, whilst some are in preparation for ISO 22000 accreditation.
Risk control is high on the group’s agenda and all sites are audited annually by an external provider. Included in our risk control system are elements such as health and safety, fire defence, security, emergency planning, etc. We have set a health and safety target of 95% for all our businesses. Our overall risk control score for our South African-based operations improved to 97% for 2010 (2009: 94%). Similarly, the overall health and safety score improved to 96% (2009: 94%).
As a minimum, all our operating sites have health and safety committees. Aspects of health and safety form part of the culture creation and continuous improvement process referred to under employee rights and relations. Audit results are shared not only with the executive team but also with the risk/sustainability committee.
Another facet of our employee wellness programme focuses on providing our employees, and their dependants, access to a counselling service through a 24-hour telephonic counselling service as well as face-to-face professional counselling sessions. This service is fully paid for by the company. The main areas of support include access to psychologists, social workers, dieticians, biokineticists, and financial and legal advisers. The programme is operational in four business units in order to establish demand and usage.
Health and safety As a food company, the health and safety of our employees and the end-consumer of our products is vital to us. We have an in-house consumer services centre that addresses all consumer complaints and queries relating to any of our products. We adhere to generally accepted food manufacturing standards and have external bodies auditing food safety at our facilities on an ongoing basis. Examples include the
96 Tiger Brands Annual Report 2010
Group at a glance Group review
Responsibility for annual financial statements
The directors of Tiger Brands Limited are responsible for the integrity of the annual financial statements of the company, consolidated subsidiaries, associates and proportionately consolidated entities and the objectivity of other information presented in the annual report.
The fulfilment of this responsibility is discharged through the establishment and maintenance of sound management and accounting systems, the maintenance of an organisation structure which provides for delegation of authority and establishes clear responsibility, together with the constant communication and review of operations’ performance measured against approved plans and budgets.
Management and employees operate in terms of a code of ethics approved by the board. The code requires compliance with all applicable laws and maintenance of the highest integrity in the conduct of all aspects of the business.
The annual financial statements, prepared in terms of International Financial Reporting Standards, are examined by our auditors in conformity with International Standards on Auditing.
An audit committee of the board of directors, composed entirely of independent non-executive directors, meets periodically with our internal and external auditors and management to discuss internal accounting controls and auditing and financial reporting matters. The auditors have unrestricted access to the audit committee.

97Tiger Brands Annual Report 2010
Divisional reviews Governance and sustainability
▲
Annual financial statements
Independent auditors’ report
Report on the financial statementsWe have audited the group annual financial statements and annual financial statements of Tiger Brands Limited, which comprise the consolidated and separate statements of financial position as at 30 September 2010, the consolidated and separate income statements, the consolidated and separate statements of other comprehensive income, the consolidated and separate statements of changes in equity and consolidated and separate statements of cash flow for the year then ended, a summary of significant accounting policies and other explanatory notes, and the directors’ report, as set out in pages 12, 13, 99, 100 and 102 to 185.
Directors’ responsibility for the financial statementsThe company’s directors are responsible for the preparation and fair presentation of these financial statements in accordance with International Financial Reporting Standards, and in the manner required by the Companies Act of South Africa. This responsibility includes: designing, implementing and maintaining internal control relevant to the preparation and fair presentation of financial statements that are free from material misstatement, whether due to fraud or error; selecting and applying appropriate accounting policies; and making accounting estimates that are reasonable in the circumstances.
Auditor’s responsibilityOur responsibility is to express an opinion on these financial statements based on our audit. We conducted our audit in accordance with International Standards on Auditing. Those standards require that we comply with ethical requirements and plan and perform the audit to obtain reasonable assurance whether the financial statements are free from material misstatement.
An audit involves performing procedures to obtain audit evidence about the amounts and disclosures in the financial statements. The procedures selected depend on the auditor’s judgement, including the assessment of the risk of material misstatement of the financial statements, whether due to fraud or error. In making those risk assessments, the auditor considers internal control relevant to the entity’s preparation and fair presentation of the financial statements in order to design audit procedures that are appropriate in the circumstances, but not for the purpose of expressing an opinion on the effectiveness of the entity’s internal control. An audit also includes evaluating the appropriateness of accounting policies used and the reasonableness of accounting estimates made by the directors, as well as evaluating the overall presentation of the financial statements.
We believe that the audit evidence we have obtained is sufficient and appropriate to provide a basis for our audit opinion.
OpinionIn our opinion, these financial statements present fairly, in all material respects, the consolidated and separate financial position of Tiger Brands Limited as at 30 September 2010, and its consolidated and separate financial performance and consolidated and separate cash flows for the year then ended in accordance with International Financial Reporting Standards, and in the manner required by the Companies Act of South Africa.
Ernst & young Inc.
Registered Auditor
Johannesburg
15 December 2010
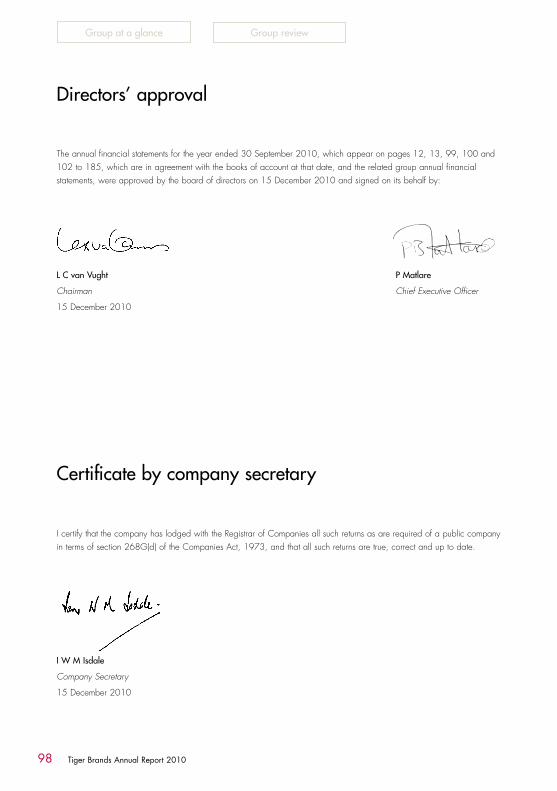
98 Tiger Brands Annual Report 2010
Group at a glance Group review
Directors’ approval
Certificate by company secretary
The annual financial statements for the year ended 30 September 2010, which appear on pages 12, 13, 99, 100 and 102 to 185, which are in agreement with the books of account at that date, and the related group annual financial statements, were approved by the board of directors on 15 December 2010 and signed on its behalf by:
L C van Vught P Matlare
Chairman Chief Executive Officer
15 December 2010
I certify that the company has lodged with the Registrar of Companies all such returns as are required of a public company in terms of section 268G(d) of the Companies Act, 1973, and that all such returns are true, correct and up to date.
I W M Isdale
Company Secretary
15 December 2010

99Tiger Brands Annual Report 2010
Divisional reviews Governance and sustainability
▲
Annual financial statements
Statutory information
Authorised and issued share capitalDetails of authorised and issued share capital are set out in notes 24 and 25 on pages 152 to 153 of the annual financial statements and in the statements of changes in equity on pages 108 to 110.
During the year under review, the number of shares in issue increased by 317 133 (74 800 excluding Spar and Adcock employees) shares as a result of options exercised in terms of the Tiger Brands (1985) Share Option Scheme.
Share purchase and share option schemesTiger Brands (1985) Share Purchase SchemeDuring the year under review, loans were granted in respect of 9 100 ordinary shares acquired by employees in terms of the Tiger Brands (1985) Share Purchase Scheme. 170 100 shares were paid for in full and released to the employees concerned. A total of 117 100 ordinary shares remain subject to the provisions of the Tiger Brands (1985) Share Purchase Scheme.
Tiger Brands (1985) Share Option Scheme2010 2009
Shares under option at beginning of the year 1 490 230 1 856 518Adjustment (2 700) 3 000Disposal of Sea Harvest — 2 400Options granted — —Exercised subject to loans (9 100) —Exercised and paid in full (65 700) (335 488)Forfeited — (31 400)
Shares under option at end of year 1 412 730 1 490 230
Options available for issue 4 866 216 4 866 216
The above table excludes Spar and Adcock Ingram employees. Refer to note 24.2, which reflects details including both Spar and Adcock employees.
Subsidiaries, associates, joint ventures and investmentsFinancial information concerning the principal subsidiaries, associates, joint ventures and investments of Tiger Brands
Limited is set out in Annexure A to C of the annual financial statements. Details of joint ventures are given in note 38.
Dividends and capital distributionsDetails of dividends and capital distributions declared and paid during the year are outlined in note 10 to the annual financial statements.
Attributable interestThe attributable interest of the company in the profits and losses of its subsidiaries, joint ventures and associated companies is as follows:
(Rands in millions) 2010 2009
Subsidiaries and joint venturesTotal income after taxation 1 923,8 2330,4Associate companiesTotal income after taxation 251,7 203,6
Major shareholdersDetails of the registered and beneficial shareholders of the company are outlined on pages 186 to 190.
DirectorsIn terms of the company’s articles of association, M P Nyama, R D Nisbet and M Makanjee, having been appointed since the last annual general meeting of the company, retire at the forthcoming annual general meeting to be held on 15 February 2011. In terms of the company’s articles of association, C F H Vaux, A C Parker, K D K Mokhele and S L Botha retire by rotation.
All retiring directors are eligible and offer themselves for re-election.
The names of the directors who presently hold office are set out on pages 18 to 20 of this report.
No director holds 1% or more of the ordinary shares of the company. The directors of the company beneficially hold, directly and indirectly, 22 980 ordinary shares of its issued ordinary shares (2009:13 880 shares).

100 Tiger Brands Annual Report 2010
Group at a glance Group review
Statutory information continued
Details of the directors’ shareholding (direct and indirect beneficial) are reflected in the table below. The register of interests of directors and others in shares of the company is available to the members on request.
2010 2009
Name of director
Directnumber
of shares
Indirectnumber
of shares
Direct number
of shares
Indirectnumber
of shares
M Fleming 15 100 — 6 000 —R M W Dunne — 5 000 — 5 000L C van Vught — 2 880 — 2 880
15 100 7 880 6 000 7 880
Share repurchaseAt the annual general meeting of shareholders held in February 2010, shareholders passed a special resolution authorising the company, or a subsidiary, to acquire the company’s own ordinary shares. Notwithstanding the approval obtained, during the period to 30 September 2010, no further shares were acquired as the directors did not deem it appropriate.
The company, through its subsidiary Tiger Consumer Brands Limited, has previously purchased a total of 10 326 758 shares at an average price of R106,67 per share, for a total consideration of R1 101,5 million.
American Depository Receipt facilityWith effect from 9 September 1994 a sponsored American Depository Receipt (ADR) facility was established. This ADR facility is sponsored by the Bank of New York Mellon and details of the administrators are reflected under Administration on page 192.
Special resolutionsNo special resolutions relating to capital structure, borrowing powers or any other material matter that affects the understanding of the group were passed by subsidiary companies during the year under review.
Retirements fundsDetails in respect of the retirement funds of the group are set out on page 65, on pages 160 to 162 of the annual financial statements.
Insurance and risk managementThe group’s practice regarding insurance includes an annual assessment, in conjunction with the group’s insurance brokers, of the risk exposure relative to assets and possible liabilities arising from business transactions. In addition, the group’s insurance programme is monitored by the risk/sustainability committee.
All risks are considered to be adequately covered, except for political risks in the case of which as much cover as is reasonably available has been arranged. Self-insurance programmes are in operation covering primary levels of risk at a cost more advantageous than open-market premiums. Regular risk management audits are conducted by the group’s risk management consultants, whereby improvement areas are identified and resultant action plans implemented accordingly. Assets are insured at current replacement values.
Events subsequent to the year-endM Fleming has advised the board that he will resign as financial director of the company with effect from close of business on 31 December 2010.
On 26 November 2010 the company received two summonses arising from the admission in 2007 of price fixing in the baking industry. Refer to note 42 for further information.

101Tiger Brands Annual Report 2010
Divisional reviews Governance and sustainability
▲
Annual financial statements
Effects of changing prices
The group has a diverse range of operations spread throughout South Africa as well as internationally. Many of these operations are affected by different inflation factors due to the varying nature of businesses, climatic conditions, geographical locations and business cycles. The diversity of these factors does not allow for meaningful inflation-adjusted statements to be prepared using a simple, standardised procedure.
The effect of inflation is monitored by examination of cash flows inherent in operating results, budgets, plans and new projects, with emphasis concentrated towards the objective of the creation of shareholder wealth in real terms.
The following graphs show the extent to which certain key performance indicators compare when discounted by the movement in the Consumer Price Index (base 2008).
* 2007 adjusted for the Adcock unbundling. Years prior to 2009 have not been adjusted for the sale of Sea Harvest or change in accounting treatment of Oceana.
* 2007 adjusted for the Adcock unbundling. Years prior to 2009 have not been adjusted for the sale of Sea Harvest or change in accounting treatment of Oceana.
* 2007 adjusted for the Adcock unbundling. Years prior to 2009 have not been adjusted for the sale of Sea Harvest or change in accounting treatment of Oceana.
Capital expenditure (Rm)
Adjusted for inflationNormal
634
561
642
540
416380
462437
10090807*
10090807*
2 9522 909
2 575
2 207
1 9381 9711 8521 784
Profit before tax and abnormal items (excludes income from associates) (Rm)
Adjusted for inflationNormal
2 626
1 841
1 360
1 906
1 724
1 248984
1 541
Cash available from operations (Rm)
Adjusted for inflationNormal
10090807*

102 Tiger Brands Annual Report 2010
Group at a glance Group review
Income statementsfor the year ended 30 September 2010
COMPANy GROUP2010 2009 (Rands in millions) Notes 2010 2009
Continuing operations1 053,4 883,1 Total revenue 2 19 554,7 20 642,5
Turnover 3 19 316,0 20 430,4
19,2 6,6 Operating income before abnormal items 4 3 015,1 3 133,4(41,0) 205,4 Abnormal items 5 (187,6) 343,9
(21,8) 212,0 Operating income/(loss) after abnormal items 2 827,5 3 477,3(29,0) (82,8) Interest paid 6.1 (302,3) (436,3)137,2 147,2 Interest received 6.2 220,1 181,6916,2 735,9 Dividend income 7 18,6 30,5
Income from associated companies 16 251,7 203,6
1 002,6 1 012,3 Profit before taxation 3 015,6 3 456,7(31,9) (150,9) Taxation 8 (840,1) (977,7)
970,7 861,4 Profit for the year from continuing operations 2 175,5 2 479,0Discontinued operations 40 — 55,0
970,7 861,4 Profit for the year 2 175,5 2 534,0
Attributable to:970,7 861,4 Owners of the parent 2 192,3 2 485,5
Non-controlling interest (16,8) 48,5
970,7 861,4 2 175,5 2 534,0
Basic earnings per ordinary share (cents) 1 386 1 583Diluted basic earnings per ordinary share (cents) 1 364 1 573Basic earnings per ordinary share (cents) for continuing operations 1 386 1 557Diluted basic earnings per ordinary share (cents) for continuing operations 1 364 1 547Basic earnings per ordinary share (cents) for discontinued operations — 26Diluted basic earnings per ordinary share (cents) for discontinued operations — 26Headline earnings per share is disclosed in note 9.

103Tiger Brands Annual Report 2010
Divisional reviews Governance and sustainability
▲
Annual financial statements
Statements of other comprehensive incomefor the year ended 30 September 2010
COMPANy GROUP2010 2009 (Rands in millions) Note 2010 2009
970,7 861,4 Profit for the year 2 175,5 2 534,0
Net gain on hedge of net investment 29,8 16,1 Foreign currency translation adjustments (37,4) (34,6)
(14,7) — Net loss on cash flow hedges (19,9) (22,6) (1,5) 5,6 Net gain/(loss) on available-for-sale financial assets 91,3 (24,9)
Tax effect 26.2 (17,6) 1,0
(16,2) 5,6 Other comprehensive income, net of tax 46,2 (65,0)Other comprehensive income, net of tax for associates — (14,5)
954,5 867,0 Total comprehensive income for the year, net of tax 2 221,7 2 454,5
Attributable to: 954,5 867,0 Owners of the parent 2 238,5 2 406,0
— — Non-controlling interests (16,8) 48,5
954,5 867,0 2 221,7 2 454,5

104 Tiger Brands Annual Report 2010
Group at a glance Group review
Statements of financial positionat 30 September 2010
COMPANy GROUP2010 2009 (Rands in millions) Notes 2010 2009
ASSETSNon-current assetsProperty, plant and equipment 11 2 585,6 2 202,7
Land and buildings 819,3 700,7 Plant, vehicles and equipment 1 766,3 1 502,0
Goodwill and intangible assets 12 1 985,8 1 669,1 1 256,0 1 258,5 Interest in subsidiary companies 14 2 867,8 2 893,7 Amounts owed by subsidiaries 15 1 936,8 195,5 Investments 1 717,2 1 509,8
31,5 31,5 Investments in associated companies 16 1 167,5 1 046,3 1 826,7 161,6 Other investments 17 535,8 441,4
78,6 2,4 Loans 18 13,9 22,1
498,2 431,9 Current assets 6 695,3 6 237,3
Inventories 20 2 898,7 3 059,9 7,0 17,9 Trade and other receivables* 21 2 875,3 2 671,2
491,2 414,0 Cash and cash equivalents 22 921,3 506,2
6 558,8 4 779,6 Total assets 12 983,9 11 618,9
EQUITy AND LIABILITIES 5 521,6 4 039,2 Issued capital and reserves 8 315,9 6 983,7
481,4 70,8 Ordinary share capital and share premium 25 481,4 70,8 2 926,8 2 943,0 Non-distributable reserves 26 957,3 788,7 1 865,0 894,3 Accumulated profits 9 366,5 7 309,8
Tiger Brands Limited shares held by subsidiary 27 (742,4) (817,7)Tiger Brands Limited shares held by empowerment entities 27 (1 998,5) (502,2)
248,4 131,1 Share-based payment reserve 23 251,6 134,3
Non-controlling interests 285,5 301,0
5 521,6 4 039,2 Total equity 8 601,4 7 284,7
606,0 682,5 Non-current liabilities 878,0 907,1
(3,6) 7,1 Deferred taxation liability 28 123,5 97,9 Provision for post-retirement medical aid 35 350,7 326,4
136,7 198,5 Long-term borrowings 31 403,8 482,8
472,9 476,9 Amounts owed to subsidiaries 39
431,2 57,9 Current liabilities 3 504,5 3 427,1
42,0 49,5 Trade and other payables* 29 2 578,9 2 643,3 Provisions* 30 387,3 330,7
0,1 0,2 Taxation 62,3 52,3 389,1 8,2 Short-term borrowings 31 476,0 400,8
6 558,8 4 779,6 Total equity and liabilities 12 983,9 11 618,9
*Certain reclassifications were made to 2009 figures to align with 2010 disclosure. Refer to notes 21, 29 and 30.

105Tiger Brands Annual Report 2010
Divisional reviews Governance and sustainability
▲
Annual financial statements
COMPANy GROUP2010 2009 (Rands in millions) Notes 2010 2009
19,2 7,4 Cash operating profit from continuing operations A 3 492,6 3 472,5 Cash operating profit from discontinued operations A — 93,6
19,2 7,4 3 492,6 3 566,1 (10,5) (15,5) Working capital changes B (112,6) (424,7)
8,7 (8,1) Cash generated from/(utilised by) operations 3 380,0 3 141,4 137,8 148,3 Interest received and income from investments 238,7 189,8 (29,0) (82,8) Interest paid (302,3) (436,8)
781,2 734,8 Dividends received from associate companies and subsidiaries 130,6 86,7
134,4 — Dividends received from empowerment entities — — (42,6) (142,2) Taxation paid C (821,5) (1 033,2)
990,5 650,0 Cash available from operations 2 625,5 1 947,9 (1 355,0) (1 361,3) Dividends paid (including capital distributions) D (1 179,5) (1 267,8)
(364,5) (711,3) Net cash inflow/(outflow) from operating activities 1 446,0 680,1
Purchase of property, plant, equipment and intangibles E (634,2) (603,9)Proceeds from disposal of property, plant and equipment 3,5 6,8 Cash cost of businesses acquired F (474,5) (5,2)Net proceeds from disposal of businesses G — 242,2 Repayment of investment loans — 21,7
(1 611,4) (5,2) Investments acquired — (3,7) — (4,3) Disposal of AVI shares — (4,3)
2,3 575,8 Proceeds from disposal of investments 8,3 465,5 (33,1) 452,8 Other (outflow)/inflow H (3,5) 13,3
(1 642,2) 1 019,1 Net cash (outflow)/inflow from investing activities (1 100,4) 132,4
(2 006,7) 307,8 Net cash inflow/(outflow) before financing activities 345,6 812,5
1 764,8 29,0 Increase in shareholder funding I 1 764,8 29,0 Cash outflow relating to an increase in treasury shares (1 620,5) — Foreign long-term borrowings raised — 92,3
319,1 (486,2) Long- and short-term borrowings (repaid)/raised (29,1) (21,2)BEE Phase II – donation to General Staff Trust (127,4) —BEE Phase II – donation by strategic black partner 13,4 —
2 083,9 (457,2) Net cash inflow/(outflow) from financing activities 1,2 100,1
77,2 (149,4) Net increase/(decrease) in cash and cash equivalents 346,8 912,6 Effect of exchange rate changes (10,7) (15,1)
414,0 563,4 Cash and cash equivalents at beginning of year J 172,1 (725,4)
491,2 414,0 Cash and cash equivalents at end of year K 508,2 172,1
Cash flow statementsfor the year ended 30 September 2010

106 Tiger Brands Annual Report 2010
Group at a glance Group review
COMPANy GROUP2010 2009 (Rands in millions) 2010 2009
A. Cash operating profit 19,2 6,6 Operating profit before abnormal items 3 015,1 3 190,2
Add back: — 0,8 Depreciation and other non-cash items 448,0 359,0
Loss/(profit) on sale of property, plant and equipment 5,2 (1,0) Provision for post-retirement medical aid 24,3 17,9
19,2 7,4 Cash operating profit 3 492,6 3 566,1
Attributable to: Cash operating profit from continuing operations 3 492,6 3 472,5 Cash operating profit from discontinued operations — 93,6
3 492,6 3 566,1
B. Working capital changes Decrease/(increase) in inventories 222,0 (64,3)
10,8 (0,2) (Increase)/decrease in trade and other receivables (233,0) 30,5 (21,3) (15,3) Decrease in trade and other payable (101,6) (390,9)
(10,5) (15,5) Working capital changes (112,6) (424,7)
C. Taxation paid 0,1 1,2 Amounts (payable)/receivable at beginning of year, net (52,3) (54,6)
(42,6) (143,3) Per income statements (831,8) (1 049,4) Subsidiaries disposed of, net — 17,8 Exchange rate difference 0,3 0,7
(0,1) (0,1) Amounts payable/(receivable) at end of year, net 62,3 52,3
(42,6) (142,2) Total taxation paid (821,5) (1 033,2)
D. Dividends and capital distributions paid — — Amounts accrued and payable at beginning of year — (7,3) — (1 361,3) Per statement of changes in equity (13,2) (1 244,8)
(1 355,0) — Capital distribution (net of group credit in respect of treasury
and empowerment shares) (1 155,4) — Dividends paid to outside shareholders (10,9) (15,7) Amounts accrued and payable at end of year — —
(1 355,0) (1 361,3) Total dividends paid (1 179,5) (1 267,8)
E. Purchase of property, plant, equipment and intangibles Expansion (271,1) (240,4) Replacement (363,1) (363,5)
(634,2) (603,9)
Notes to the cash flow statementsfor the year ended 30 September 2010
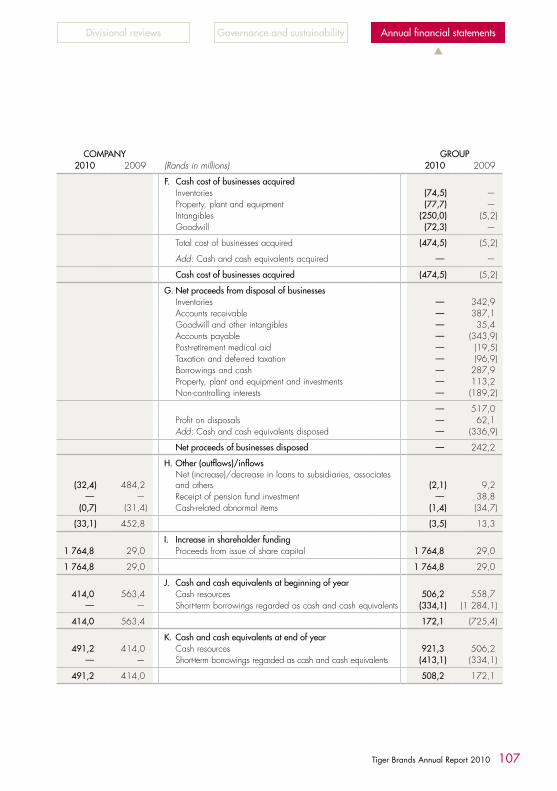
107Tiger Brands Annual Report 2010
Divisional reviews Governance and sustainability
▲
Annual financial statements
COMPANy GROUP2010 2009 (Rands in millions) 2010 2009
F. Cash cost of businesses acquired Inventories (74,5) — Property, plant and equipment (77,7) — Intangibles (250,0) (5,2) Goodwill (72,3) —
Total cost of businesses acquired (474,5) (5,2)
Add: Cash and cash equivalents acquired — —
Cash cost of businesses acquired (474,5) (5,2)
G. Net proceeds from disposal of businesses Inventories — 342,9 Accounts receivable — 387,1 Goodwill and other intangibles — 35,4 Accounts payable — (343,9) Post-retirement medical aid — (19,5) Taxation and deferred taxation — (96,9) Borrowings and cash — 287,9 Property, plant and equipment and investments — 113,2 Non-controlling interests — (189,2)
— 517,0 Profit on disposals — 62,1 Add: Cash and cash equivalents disposed — (336,9)
Net proceeds of businesses disposed — 242,2
H. Other (outflows)/inflows
(32,4) 484,2 Net (increase)/decrease in loans to subsidiaries, associates
and others (2,1) 9,2 — — Receipt of pension fund investment — 38,8
(0,7) (31,4) Cash-related abnormal items (1,4) (34,7)
(33,1) 452,8 (3,5) 13,3
I. Increase in shareholder funding 1 764,8 29,0 Proceeds from issue of share capital 1 764,8 29,0
1 764,8 29,0 1 764,8 29,0
J. Cash and cash equivalents at beginning of year 414,0 563,4 Cash resources 506,2 558,7
— — Short-term borrowings regarded as cash and cash equivalents (334,1) (1 284,1)
414,0 563,4 172,1 (725,4)
K. Cash and cash equivalents at end of year 491,2 414,0 Cash resources 921,3 506,2
— — Short-term borrowings regarded as cash and cash equivalents (413,1) (334,1)
491,2 414,0 508,2 172,1

108 Tiger Brands Annual Report 2010
Group at a glance Group review
(Rands in millions)
Sharecapital
and premium
Non-distribut-
able reserves
Other capital reserves
Cash flow
hedge reserve
Available- for-sale reserve
Foreign currency
translationreserve
Accumu-lated
profits
Shares held by
subsidiaryand
empower-ment entities
Share-based
payment reserve
Total attribut-able to
owners of the parent
Non-controlling
interestsTotal
equity
GROUP
Balance at 30 September 2008 41,8 473,8 82,3 17,4 163,2 (23,1) 6 203,5 (1 319,9) 121,7 5 760,7 458,3 6 219,0 Net profit for the period — — — — — — 2 485,5 — — 2 485,5 48,5 2 534,0 Other comprehensive income for the year — — — (30,8) (12,3) (36,4) — — — (79,5) — (79,5)
41,8 473,8 82,3 (13,4) 150,9 (59,5) 8 689,0 (1 319,9) 121,7 8 166,7 506,8 8 673,5 Issue of share capital and premium 29,0 — — — — — — — — 29,0 — 29,0 Adjustment due to finalisation of African acquisitions — — — — — — — — — — (2,5) (2,5)Transfers between reserves — 154,9 2,5 — — — (157,4) — — — — —Other reserve movements — — — — — — 14,8 — 28,2 43,0 — 43,0 Reclassification from joint venture to associate — — — — — — 2,3 — (12,8) (10,5) (13,7) (24,2)Dividends on ordinary shares — — — — — — (1 244,8) — — (1 244,8) (14,1) (1 258,9)
Total dividends — — — — — — (1 362,7) — — (1 362,7) (23,7) (1 386,4) Less: Dividends on treasury and empowerment shares — — — — — — 117,9 — — 117,9 9,6 127,5
Adjustment due to sale of Sea Harvest — — — — (2,8) — 5,9 — (2,8) 0,3 (175,5) (175,2)
Balance at 30 September 2009 70,8 628,7 84,8 (13,4) 148,1 (59,5) 7 309,8 (1 319,9) 134,3 6 983,7 301,0 7 284,7
Net profit for the period — — — — — — 2 192,3 — — 2 192,3 (16,8) 2 175,5 Other comprehensive income for the year — — — (19,9) 87,6 (21,5) — — — 46,2 — 46,2
70,8 628,7 84,8 (33,3) 235,7 (81,0) 9 502,1 (1 319,9) 134,3 9 222,2 284,2 9 506,4 Issue of share capital and premium 1 765,6 — — — — — — (1 625,0) — 140,6 — 140,6 Capital distributions out of share premium (1 355,0) — — — — — — 199,6 — (1 155,4) (8,9) (1 164,3)BEE Phase II capital contribution — — — — — — — — — — 13,4 13,4 Transfers between reserves — 121,2 1,2 — — — (122,4) — — — — —Share-based payment reserve — — — — — — — — 117,3 117,3 — 117,3 Dividends paid to empowerment entities and non-controlling interests — — — — — — (13,2) — — (13,2) (2,0) (15,2)Sale of shares by empowerment entity — — — — — — — 4,4 — 4,4 (1,2) 3,2
Balance at 30 September 2010 481,4 749,9 86,0 (33,3) 235,7 (81,0) 9 366,5 (2 740,9) 251,6 8 315,9 285,5 8 601,4
Refer to note: 25 26 26 26 26 26 27 23
Statements of changes in equityfor the year ended 30 September 2010

109Tiger Brands Annual Report 2010
Divisional reviews Governance and sustainability
▲
Annual financial statements
(Rands in millions)
Sharecapital
and premium
Non-distribut-
able reserves
Other capital reserves
Cash flow
hedge reserve
Available- for-sale reserve
Foreign currency
translationreserve
Accumu-lated
profits
Shares held by
subsidiaryand
empower-ment entities
Share-based
payment reserve
Total attribut-able to
owners of the parent
Non-controlling
interestsTotal
equity
GROUP
Balance at 30 September 2008 41,8 473,8 82,3 17,4 163,2 (23,1) 6 203,5 (1 319,9) 121,7 5 760,7 458,3 6 219,0 Net profit for the period — — — — — — 2 485,5 — — 2 485,5 48,5 2 534,0 Other comprehensive income for the year — — — (30,8) (12,3) (36,4) — — — (79,5) — (79,5)
41,8 473,8 82,3 (13,4) 150,9 (59,5) 8 689,0 (1 319,9) 121,7 8 166,7 506,8 8 673,5 Issue of share capital and premium 29,0 — — — — — — — — 29,0 — 29,0 Adjustment due to finalisation of African acquisitions — — — — — — — — — — (2,5) (2,5)Transfers between reserves — 154,9 2,5 — — — (157,4) — — — — —Other reserve movements — — — — — — 14,8 — 28,2 43,0 — 43,0 Reclassification from joint venture to associate — — — — — — 2,3 — (12,8) (10,5) (13,7) (24,2)Dividends on ordinary shares — — — — — — (1 244,8) — — (1 244,8) (14,1) (1 258,9)
Total dividends — — — — — — (1 362,7) — — (1 362,7) (23,7) (1 386,4) Less: Dividends on treasury and empowerment shares — — — — — — 117,9 — — 117,9 9,6 127,5
Adjustment due to sale of Sea Harvest — — — — (2,8) — 5,9 — (2,8) 0,3 (175,5) (175,2)
Balance at 30 September 2009 70,8 628,7 84,8 (13,4) 148,1 (59,5) 7 309,8 (1 319,9) 134,3 6 983,7 301,0 7 284,7
Net profit for the period — — — — — — 2 192,3 — — 2 192,3 (16,8) 2 175,5 Other comprehensive income for the year — — — (19,9) 87,6 (21,5) — — — 46,2 — 46,2
70,8 628,7 84,8 (33,3) 235,7 (81,0) 9 502,1 (1 319,9) 134,3 9 222,2 284,2 9 506,4 Issue of share capital and premium 1 765,6 — — — — — — (1 625,0) — 140,6 — 140,6 Capital distributions out of share premium (1 355,0) — — — — — — 199,6 — (1 155,4) (8,9) (1 164,3)BEE Phase II capital contribution — — — — — — — — — — 13,4 13,4 Transfers between reserves — 121,2 1,2 — — — (122,4) — — — — —Share-based payment reserve — — — — — — — — 117,3 117,3 — 117,3 Dividends paid to empowerment entities and non-controlling interests — — — — — — (13,2) — — (13,2) (2,0) (15,2)Sale of shares by empowerment entity — — — — — — — 4,4 — 4,4 (1,2) 3,2
Balance at 30 September 2010 481,4 749,9 86,0 (33,3) 235,7 (81,0) 9 366,5 (2 740,9) 251,6 8 315,9 285,5 8 601,4
Refer to note: 25 26 26 26 26 26 27 23

110 Tiger Brands Annual Report 2010
Group at a glance Group review
Statements of changes in equity continuedfor the year ended 30 September 2010
(Rands in millions)
Sharecapital
and premium
Non-distribut-
ablereserve
Othercapital
reserves
Cashflow
hedgereserve
Available-for-salereserve
Accumu-lated
profits
Share- based
paymentreserve
Totalattribut-able toowners
of theparent
COMPANy
Balance at 30 September 2008 41,8 2 918,6 19,3 — (0,5) 1 394,2 105,1 4 478,5
Net profit for the year — — — — — 861,4 — 861,4Other comprehensive income for the year — — — — 5,6 — — 5,6
41,8 2 918,6 19,3 — 5,1 2 255,6 105,1 5 345,5Issue of share capital and premium 29,0 — — — — — — 29,0Other reserve movements — — — — — — 26,0 26,0Dividends on ordinary shares — — — — — (1 361,3) — (1 361,3)
Balance at 30 September 2009 70,8 2 918,6 19,3 — 5,1 894,3 131,1 4 039,2
Net profit for the year — — — — — 970,7 — 970,7Other comprehensive income for the year — — — (14,7) (1,5) — — (16,2)
70,8 2 918,6 19,3 (14,7) 3,6 1 865,0 131,1 4 993,7Issue of share capital and premium 1 765,6 — — — — — — 1 765,6Capital distributions out of share premium (1 355,0) — — — — — — (1 355,0)Other reserve movements — — — — — — 117,3 117,3
Balance at 30 September 2010 481,4 2 918,6 19,3 (14,7) 3,6 1 865,0 248,4 5 521,6

111Tiger Brands Annual Report 2010
Divisional reviews Governance and sustainability
▲
Annual financial statements
A change in the ownership interest of a subsidiary, without a change of control, is accounted for as an equity transaction.
Losses are attributed to the non-controlling interest even if that results in a deficit balance.
If the group loses control over a subsidiary, it:
• Derecognises the assets (including goodwill) and liabilities of the subsidiary;
• Derecognises the carrying amount of any non-controlling interest;
• Derecognises the cumulative translation differences, recorded in equity;
• Recognises the fair value of the consideration received;
• Recognises the fair value of any investment retained;
• Recognises any surplus or deficit in profit or loss; and
• Reclassifies the parent’s share of components previously recognised in other comprehensive income to profit or loss.
Changes in accounting policiesThe accounting policies adopted are consistent with those of the previous financial year except as set out below. The group has adopted the following new and amended IFRS and IFRIC interpretations during the year:
• IFRS 2 Share-based Payment: Vesting Conditions and Cancellations effective 1 January 2009
• IFRS 3 Business Combinations (Revised) and IAS 27 Consolidated and Separate Financial Statements (Amended) effective 1 July including consequential amendments to IFRS 7, IAS 21, IAS 28, IAS 31 and IAS 39
• IFRS 7 Financial Instruments: Disclosures effective 1 January 2009
• IFRS 8 Operating Segments effective 1 January 2009
• IAS 1 Presentation of Financial Statements effective 1 January 2009
• IAS 23 Borrowing Costs (Revised) effective 1 January 2009
• IAS 32 Financial Instruments: Presentation and IAS 1 Puttable Financial Instruments and Obligations Arising on Liquidation effective 1 January 2009
Accounting policiesCorporate informationThe consolidated financial statements of Tiger Brands Limited (the company) and the Tiger Brands group (the group) for the year ended 30 September 2010 were authorised for issue in accordance with a resolution of the directors on 15 December 2010. Tiger Brands Limited is incorporated and domiciled in South Africa, where the shares are publicly traded.
Basis of preparationThe consolidated financial statements have been prepared on the historical-cost basis, except as indicated below.
Statement of complianceThe consolidated financial statements have been prepared in accordance with International Financial Reporting Standards (IFRS).
Basis of consolidationThe consolidated financial statements include the financial statements of the company and its subsidiaries (as well as special-purpose entities controlled by the group or company). The financial statements of the subsidiaries are prepared for the same reporting period using consistent accounting policies. Where the financial year-end of a subsidiary is not coterminous with that of the group or the accounting policies adopted by the subsidiary differ from the group’s accounting policies, the financial statements of the subsidiary are adjusted in accordance with the group’s accounting policies and year-end.
The results of subsidiaries acquired are included in the consolidated financial statements from the date of acquisition, being the date on which the group obtains control, and continue to be consolidated until the date that such control ceases.
Subsidiaries acquired with the intention of disposal within 12 months are consolidated in line with the principles of IFRS 5 Non-current Assets Held for Sale and Discontinued Operations and disclosed as held for sale.
All intragroup transactions, balances, income and expenses are eliminated on consolidation.
Non-controlling interests represent the portion of profit or loss, or net assets not held by the group. It is presented separately in the consolidated income statement, and in the consolidated statement of financial position, separately from own shareholder’s equity.
Notes to the financial statements for the year ended 30 September 2010

112 Tiger Brands Annual Report 2010
Notes to the financial statements continuedfor the year ended 30 September 2010
Group at a glance Group review
Foreign operationsAt the reporting date the assets and liabilities of the foreign operations are translated into the presentation currency of the group (Rands) at the exchange rate ruling at the reporting date. The income statement is translated at the weighted average exchange rate for the year. Exchange differences are taken directly to a separate component of other comprehensive income. On disposal of a foreign operation, the deferred cumulative amount recognised in other comprehensive income relating to that particular foreign operation is recognised in the income statement.
Goodwill and fair value adjustments to the carrying amounts of assets and liabilities arising on the acquisition of a foreign operation are treated as assets and liabilities of that foreign operation, and are translated at the closing rate.
The functional currencies of the foreign operations are as follows:
Chococam (subsidiary) – Cameroon Franc; Haco (subsidiary) – Kenyan Shilling; and Empresas Carozzi (associate) – Chilean Peso.
Hyperinflationary economiesWhere the functional currency of a foreign operation is the currency of a hyperinflationary economy, the financial statements are restated for the decrease in general purchasing power before they are translated into the group’s presentation currency.
Interest in group companiesBusiness combinationsBusiness combinations are accounted for using the acquisition method. The value of an acquisition is measured as the aggregate of the consideration transferred, measured at acquisition date fair value and the amount of any non-controlling interest in the acquiree. For each business combination, the acquirer measures the non-controlling interest in the acquiree either at fair value or at the proportionate share of the acquiree’s identifiable net assets. Acquisition costs incurred are expensed.
When the group acquires a business, it assesses the financial assets and liabilities assumed for appropriate classification and designation in accordance with the contractual terms, economic circumstances and pertinent conditions as at the acquisition date. This includes the separation of embedded derivatives in host contracts by the acquiree.
• IAS 39 Financial Instruments: Recognition and Measurement – Eligible Hedged Items effective 1 July 2009
• IFRIC 9 Remeasurement of Embedded Derivatives and IAS 39 Financial Instruments: Recognition and Measurement effective for periods ending on or after 30 June 2009
• IFRIC 15 Agreements for the Construction of Real Estate
• IFRIC 17 Distributions of Non-cash Assets to Owners
• IFRIC 18 Transfers of Assets from Customers effective1 July 2009
• Improvements to IFRSs (May 2008)
When the adoption of the standard or interpretation is deemed to have an impact on the financial statements or performance of the group, its impact is described in more detail under the heading “Further information on changes to accounting policies” on page 124.
Foreign currenciesForeign currency transactionsThe consolidated financial statements are presented in South African Rands, which is the company’s functional and presentation currency. Each foreign entity in the group determines its own functional currency. Transactions in foreign currencies are initially recorded in the functional currency at the rate of exchange ruling at the date of the transaction.
Translation of foreign currency transactionsMonetary assets and liabilities denominated in foreign currencies are retranslated at the functional currency rate of exchange ruling at the reporting date. Exchange differences are taken to profit or loss, except for differences arising on foreign currency borrowings that provide a hedge against a net investment in a foreign entity. These are taken directly to other comprehensive income, in the consolidated annual financial statements, until the disposal of the net investment, at which time they are recognised in profit and loss. Tax charges and credits attributable to such exchange differences are also accounted for in other comprehensive income.
If non-monetary items measured in a foreign currency are carried at historical cost, the exchange rate used is the rate applicable at the initial transaction date. If they are carried at fair value, the rate used is the rate at the date when the fair value was determined.

113Tiger Brands Annual Report 2010
Divisional reviews Governance and sustainability
▲
Annual financial statements
Where an associate’s reporting date differs from the group’s, the associate prepares financial statements as of the same date as the group. If this is impracticable, financial statements are used where the date difference is no more than three months. Adjustments are made for significant transactions between the relevant dates. Where the associate’s accounting policies differ from those of the group, appropriate adjustments are made to conform the accounting policies.
Joint venturesA joint venture is a contractual arrangement whereby the group and other parties undertake an economic activity that is subject to joint control. The strategic, financial and operating policy decisions of the joint venture require the unanimous consent of the parties sharing control.
The group reports its interests in joint ventures using proportionate consolidation. The group’s share of the assets, liabilities, income and expenses of joint ventures are combined with the equivalent items in the consolidated financial statements on a line-by-line basis. Where the group transacts with its joint ventures, unrealised profits and losses are eliminated to the extent of the group’s interest in the joint venture.
Any goodwill arising on the acquisition of a joint venture is accounted for in accordance with the group’s policy for goodwill. The financial statements of the joint venture are prepared for the same reporting period as the group, using consistent accounting policies.
Where an investment in a joint venture is classified as held for sale in terms of IFRS 5 proportionate consolidation is discontinued, and the investment is held at the lower of its carrying value and fair value less costs to sell.
Segment reportingReporting segmentsThe group has reportable segments that comprise the structure used by the chief operating decision-maker (“CODM”) to make key operating decisions and assess performance. The group’s reportable segments are operating segments that are differentiated by the activities that each undertakes and the products they manufacture and market (referred to as business segments). No geographical segments are reported as the group operates mainly in South Africa and the international operations do not meet the thresholds for reportable segments.
The group evaluates the performance of its reportable segments based on operating profit. The group accounts
If the business combination is achieved in stages, the acquisition date fair value of the acquirer’s previously held equity interest in the acquiree is remeasured to fair value as at the acquisition date through profit and loss.
Any contingent consideration to be transferred by the acquirer will be recognised at fair value at the acquisition date. Subsequent changes to the fair value of the contingent consideration which is deemed to be an asset or liability, will be recognised in accordance with IAS 39 either in profit or loss or as change to other comprehensive income. If the contingent consideration is classified as equity, it shall not be remeasured until it is finally settled within equity.
The company carries its investments in subsidiaries and associate companies at cost less accumulated impairment losses.
AssociatesAn associate is an entity over which the group has significant influence through participation in the financial and operating policy decisions. The entity is neither a subsidiary nor a joint venture.
Associates are accounted for using the equity method of accounting. Under this method, investments in associates are carried in the consolidated statement of financial position at cost, plus post-acquisition changes in the group’s share of the net assets of the associate. Goodwill relating to an associate is included in the carrying amount of the investment and is not tested separately for impairment.
The income statement reflects the group’s share of the associate’s profit or loss. However, an associate’s losses in excess of the group’s interest are not recognised. Where an associate recognises an entry directly in other comprehensive income, the group in turn recognises its share in the consolidated statement of other comprehensive income. Profits and losses resulting from transactions between the group and associates are eliminated to the extent of the interest in the underlying associate.
After application of the equity method, each investment is assessed for indicators of impairment. If applicable, the impairment is calculated as the difference between the current carrying value and the higher of its value in use or fair value less costs to sell. Impairment losses are recognised in the income statement.
Where an investment in an associate is classified as held for sale in terms of IFRS 5, equity accounting is discontinued, and the investment is held at the lower of its carrying value and fair value less costs to sell.

114 Tiger Brands Annual Report 2010
Notes to the financial statements continuedfor the year ended 30 September 2010
Group at a glance Group review
Goodwill and intangible assetsGoodwillGoodwill is initially measured at cost being the excess of the consideration transferred over the group’s net identifiable assets acquired and liabilities assumed. If this consideration is lower than the fair value of the net assets of the subsidiary acquired, the difference is recognised in profit or loss. Goodwill relating to subsidiaries and joint ventures is recognised as an asset and is subsequently measured at cost less accumulated impairment losses.
After initial recognition, goodwill is measured at cost less any accumulated impairment losses.
Goodwill is reviewed annually for impairment, or more frequently if there is an indicator of impairment. Goodwill is allocated to cash-generating units expected to benefit from the synergies of the combination. When the recoverable amount of a cash-generating unit is less than its carrying amount, an impairment loss is recognised. The impairment loss is allocated first to any goodwill assigned to the unit, and then to other assets of the unit pro rata on the basis of their carrying values. Impairment losses recognised for goodwill cannot be reversed in subsequent periods.
Where goodwill relates to a specific cash-generating unit and part of the operation within that unit is disposed of, the goodwill associated with the operation disposed of is included in the carrying amount of the operation when determining the gain or loss on disposal of the operation. Goodwill disposed of in this circumstance is measured based on the relative values of the operation disposed of and the portion of the cash-generating unit retained.
Intangible assetsIntangible assets acquired separately are measured on initial recognition at cost. The cost of an intangible asset acquired in a business combination is the fair value at the date of acquisition. Subsequently, intangible assets are carried at cost less any accumulated amortisation and accumulated impairment losses. Internally generated intangible assets, excluding capitalised development costs, are not capitalised and expenditure is charged to the income statement in the year in which the expense is incurred.
The useful lives of intangible assets are either finite or indefinite.
Intangible assets with finite lives are amortised over their useful life and assessed for impairment when there is an indication that the asset may be impaired.
for intersegment sales and transfers as if the sales and transfers were entered into under the same terms and conditions as would have been entered into in a market related transaction.
The financial information of the group’s reportable segments is reported to the CODM for purposes of making decisions about allocating resources to the segment and assessing its performance.
Property, plant and equipmentProperty, plant and equipment are stated at cost, excluding the costs of day-to-day servicing, less accumulated depreciation and accumulated impairment losses. Assets subject to finance lease agreements are capitalised at the lower of the fair value of the asset and the present value of the minimum lease payments.
Where an item of property, plant and equipment comprises major components with different useful lives, the components are accounted for as separate assets. Expenditure incurred on major inspection and overhaul, or to replace an item, is also accounted for separately if the recognition criteria are met.
Depreciation is calculated on a straight-line basis, on the difference between the cost and residual value of an asset, over its useful life. Depreciation starts when the asset is available for use. An asset’s residual value, useful life and depreciation method is reviewed at least at each financial year-end. Any adjustments are accounted for prospectively.
The following useful lives have been estimated:Freehold land Not depreciated
Freehold buildings
– general purpose 40 years
– specialised 20 – 50 years
Leasehold improvements The lease term or useful life, whichever is the shorter period
Vehicles and computer equipment 3 – 5 years
Plant and equipment 5 – 15 years
An item of property, plant and equipment is derecognised upon disposal or when no future economic benefits are expected from its use. Any gain or loss arising on derecognition of the asset (calculated as the difference between the net disposal proceeds and the carrying amount of the asset) is included in the income statement in the year the asset is derecognised.

115Tiger Brands Annual Report 2010
Divisional reviews Governance and sustainability
▲
Annual financial statements
at each reporting date for an indication that an asset may be impaired. If such an indication exists, the recoverable amount is estimated as the higher of the fair value less costs to sell and the value in use. If the carrying value exceeds the recoverable amount, the asset is impaired and is written down to the recoverable amount. Where it is not possible to estimate the recoverable amount of an individual asset, the recoverable amount of the cash-generating unit to which the asset belongs is estimated.
In assessing value in use, the estimated future cash flows are discounted to their present value using an appropriate discount rate that reflects current market assessments of the time value of money and the risks specific to the asset. In determining fair value less costs to sell, the hierarchy is firstly a binding arm’s length sale, then the market price if the asset is traded in an active market, and lastly recent transactions for similar assets.
Impairment losses of continuing operations are recognised in the income statement in those expense categories consistent with the function of the impaired asset.
For assets excluding goodwill, an assessment is made at each reporting date as to whether there is any indication that previously recognised impairment losses may no longer exist or may have decreased. If such an indication exists, the group estimates the asset’s or cash-generating unit’s recoverable amount. A previously recognised impairment loss is reversed only if there is a change in the estimates used to determine the asset’s recoverable amount since the last impairment loss was recognised. If this is the case, the carrying amount of the asset is increased to the revised recoverable amount, but not in excess of what the carrying amount would have been had there been no impairment. A reversal of an impairment loss is recognised immediately in profit or loss.
Derecognition of intangible assetsAn intangible asset is derecognised on disposal; or when no future economic benefits are expected from its use.
Gains or losses arising from derecognition of an intangible asset are measured as the difference between the net disposal proceeds and the carrying amount of the asset and are recognised in the income statement when the asset is derecognised.
Financial instrumentsFinancial instruments are initially recognised when the group becomes a party to the contract. The group has adopted trade date accounting for “regular way” purchases or sales of financial assets. The trade date is the date that the group commits to purchase or sell an asset.
The amortisation period and the method are reviewed at each financial year-end. Changes in the expected useful life or pattern of consumption of future benefits are accounted for prospectively.
The following useful lives have been estimated:Trademarks 1 – 20 years
Customer and supplier-related intangibles 5 – 15 years
Other intangible assets 1 – 5 yearsIntangible assets with indefinite useful lives are not amortised but are tested annually for impairment either individually or at the cash-generating level. The useful lives are also reviewed each period to determine whether the indefinite life assessment continues to be supportable. If not, the change in the useful life assessment to a finite life is accounted for prospectively.
Certain trademarks have been assessed to have indefinite useful lives, as presently there is no foreseeable limit to the period over which the assets can be expected to generate cash flows for the group.
Research and development costsResearch costs, being the investigation undertaken with the prospect of gaining new knowledge and understanding, are recognised in profit or loss as they are incurred.
Development costs arise on the application of research findings to plan or design for the production of new or substantially improved materials, products or services, before the start of commercial production. Development costs are only capitalised when the group can demonstrate the technical feasibility of completing the project, its intention and ability to complete the project and use or sell the materials, products or services flowing from the project, how the project will generate future economic benefits, the availability of sufficient resources and the ability to measure reliably the expenditure during development. Otherwise development costs are recognised in profit or loss.
During the period of development, the asset is tested annually for impairment. Following the initial recognition of the development costs, the asset is carried at cost less accumulated amortisation and accumulated impairment losses. Amortisation begins when development is complete. The development costs are amortised over the period of expected future sales.
ImpairmentThe group assesses tangible and intangible assets, excluding goodwill and indefinite life intangible assets,

116 Tiger Brands Annual Report 2010
Notes to the financial statements continuedfor the year ended 30 September 2010
Group at a glance Group review
statement using the effective interest rate method. Dividends earned are recognised in the income statement when the right of receipt has been established.
Held-to-maturity investmentsHeld-to-maturity investments are non-derivative financial assets with fixed or determinable payments and fixed maturities where there is a positive intention and ability to hold them to maturity.
After initial recognition, held-to-maturity assets are measured at amortised cost less impairment losses. Amortised cost is computed as the amount initially recognised minus the principal repayments, plus or minus the cumulative amortisation. Amortisation is calculated using the effective interest rate method. The effective interest rate method allocates interest over the relevant period using a rate that discounts the estimated future cash flows (excluding future credit losses) to the net carrying amount of the instrument. The rate calculation includes all fees, transaction costs, premiums and discounts.
Loans and receivablesLoans and receivables are non-derivative financial assets with fixed or determinable payments that are not quoted in an active market. After initial recognition, loans and receivables are measured at amortised cost less impairment losses.
Gains and losses are recognised in the income statement when the loans and receivables are derecognised or impaired, as well as through the amortisation process.
Financial liabilities at amortised costAfter initial recognition, liabilities that are not carried at fair value through profit or loss are measured at amortised cost using the effective interest rate method.
Gains and losses are recognised in the income statement when the liabilities are derecognised as well as through the amortisation process.
Fair valueThe fair value of listed investments is the quoted market bid price at the close of business on the reporting date. For unlisted investments, the fair value is determined using appropriate valuation techniques. Such techniques include using recent arm’s length market transactions, reference to the current market value of similar instruments, discounted cash flow analysis and option-pricing models.
An analysis of fair values of financial instruments and further details as to how they are measured are provided in note 37.
Financial instruments are initially measured at fair value plus transaction costs, except that transaction costs in respect of financial instruments classified at fair value through profit or loss are expensed immediately. Transaction costs are the incremental costs that are directly attributable to the acquisition of a financial instrument, i.e. those costs that would not have been incurred had the instrument not been acquired.
A contract is assessed for embedded derivatives when the entity first becomes a party to the contract. When the economic characteristics and risks of the embedded derivative are not closely related to the host contract, the embedded derivative is separated out, unless the host contract is measured at fair value through profit and loss.
The group determines the classification of its financial instruments at initial recognition.
ClassificationThe group’s classification of financial assets and financial liabilities are as follows:
Description of asset/liability ClassificationInvestments Available-for-sale
Preference share investments Held-to-maturity
Loans and advances receivable
Loans and receivables
Loans to subsidiaries Loans and receivables
Trade and other receivables Loans and receivables
Cash and cash equivalents Loans and receivables
Loans payable and borrowings
Financial liabilities at amortised cost
Trade and other payables Financial liabilities at amortised cost
Loans from subsidiaries Financial liabilities at amortised cost
Available-for-sale financial assetsThese are non-derivative financial assets that are designated as available-for-sale or are not classified as loans and receivables or held-to-maturity investments or financial assets at fair value through profit or loss.
Available-for-sale financial assets are subsequently measured at fair value with unrealised gains or losses recognised directly in other comprehensive income. When such a financial asset is disposed of, the cumulative gain or loss previously recognised in other comprehensive incomes is recognised in the income statement and interest earned on the financial asset is recognised in the income

117Tiger Brands Annual Report 2010
Divisional reviews Governance and sustainability
▲
Annual financial statements
If, in a subsequent period, the amount of the impairment decreases and the decrease relates objectively to an event occurring after the impairment, it is reversed to the extent that the carrying value does not exceed the amortised cost. Any subsequent reversal of an impairment loss is recognised in profit or loss.
Held-to-maturity financial investmentsFor held-to-maturity investments the group assesses individually whether there is objective evidence of impairment such as significant financial difficulty of the issuer. If there is objective evidence that an impairment loss has been incurred, the amount of the loss is measured as the difference between the asset’s carrying amount and the present value of estimated future cash flows. The carrying amount of the asset is reduced and the amount of the loss is recognised in the income statement.
If, in a subsequent year, the amount of the estimated impairment loss decreases because of an event occurring after the impairment was recognised, any amounts formerly charged are credited to the profit or loss.
Derivative instrumentsDerivatives are financial instruments whose value changes in response to an underlying factor, require no initial or little net investment and are settled at a future date. Derivatives, other than those arising on designated hedges, are measured at fair value with changes in fair value being recognised in profit or loss.
Hedge accountingAt the inception of a hedge relationship, the group formally designates and documents the hedge relationship to which the group wishes to apply hedge accounting and the risk management objective and strategy for undertaking the hedge. The documentation includes identification of the hedging instrument, the hedged item or transaction, the nature of the risk being hedged and how the entity will assess the hedging instrument’s effectiveness in offsetting the exposure to changes in the hedged item’s fair value or cash flows attributable to the hedged risk. Such hedges are expected to be highly effective in achieving offsetting changes in fair value or cash flows and are assessed on an ongoing basis to determine that they actually have been highly effective throughout the financial reporting periods for which they were designated.
Impairment of financial assetsThe group assesses at each reporting date whether there is objective evidence a financial asset, or group of assets, is impaired.
Available-for-sale financial assetsIn the case of equity investments classified as available- for-sale, objective evidence would include a significant or prolonged decline in the fair value of the investment below its cost. “Significant” is to be evaluated against the original cost of the investment and ‘prolonged’ against the period in which the fair value has been below its original cost. Factors taken into consideration would include external market and economic outlook reports, observable trends and cyclicality.
If an available-for-sale asset is impaired, the amount transferred from other comprehensive income to the income statement is:
• the difference between the asset’s acquisition cost (net of any principal payments and amortisation); and
• its current fair value, less any impairment loss previously recognised in profit or loss.
Reversals in respect of equity instruments classified as available-for-sale are not recognised in profit or loss. Reversals of impairment losses on debt instruments are reversed through profit or loss if the increase in fair value of the instrument can be objectively related to an event occurring after the impairment loss was recognised in profit or loss.
Assets carried at amortised costIf there is objective evidence that an impairment loss has been incurred, the amount of the loss is measured as the difference between the asset’s carrying amount and the present value of the estimated future cash flows (excluding future expected credit losses) discounted at the asset’s original effective interest rate.
The group assesses whether there is objective evidence of impairment individually for financial assets that are individually significant, and individually or collectively for financial assets that are not individually significant. In relation to trade receivables, a provision for impairment is made when there is objective evidence (such as the probability of insolvency or significant financial difficulties of the debtor) that the group will not be able to collect all of the amounts due under the original terms of the sale. The carrying amount of the asset is reduced through the use of an allowance account, and is recognised in profit and loss. Impaired debts are derecognised when they are assessed as uncollectible.

118 Tiger Brands Annual Report 2010
Notes to the financial statements continuedfor the year ended 30 September 2010
Group at a glance Group review
without replacement or rollover, or if its designation is revoked, amounts previously recognised in other comprehensive income remain in other comprehensive income until the forecast transaction occurs. If the related transaction is not expected to occur, the amount is taken to profit or loss.
Hedges of a net investmentHedges of a net investment in a foreign operation, including a hedge of a monetary item that is accounted for as part of the net investment, are accounted for similarly to cash flow hedges. On consolidation, gains or losses on the hedging instrument relating to the effective portion of the hedge are recognised in other comprehensive income, while any gains or losses relating to the ineffective portion are recognised in profit or loss. On disposal of the foreign operation, the cumulative gain or loss recognised in other comprehensive income is transferred to profit or loss.
Current versus non-current classificationDerivative instruments that are not designated and effective hedging instruments are classified as current or non-current or separated into a current and non-current portion based on an assessment of the facts and circumstances (i.e. the underlying contracted cash flows).
• Where the group will hold a derivative as an economic hedge (and does not apply hedge accounting) for a period beyond 12 months after the reporting date, the derivative is classified as non-current (or separated into current and non-current portions) consistent with the classification of the underlying item.
• Embedded derivatives that are not closely related to the host contract are classified consistent with the cash flows of the host contract.
• Derivative instruments that are designated as, and are effective hedging instruments, are classified consistent with the classification of the underlying hedged item. The derivative instrument is separated into a current portion and non-current portion only if a reliable allocation can be made.
Derecognition of financial assets and financial liabilitiesFinancial assets or parts thereof are derecognised when:
• the right to receive the cash flows have expired;
• the right to receive the cash flows is retained, but an obligation to pay them to a third party under a ‘pass-through’ arrangement is assumed; or
Fair value hedgesFair value hedges cover the exposure to changes in the fair value of a recognised asset or liability, or an unrecognised firm commitment (except for foreign currency risk). Foreign currency risk of an unrecognised firm commitment is accounted for as a cash flow hedge.
The gain or loss on the hedged item adjusts the carrying amount of the hedged item and is recognised immediately in profit and loss. The gain or loss from remeasuring the hedging instrument at fair value is also recognised in profit or loss.
When an unrecognised firm commitment is designated as a hedged item, the change in the fair value of the firm commitment is recognised as an asset or liability with a corresponding gain or loss recognised in profit or loss. The change in the fair value of the hedging instrument is also recognised in profit or loss in the “Operating income/(loss) before abnormal items” line in the income statement.
The group discontinues fair value hedge accounting if the hedging instrument expires or is sold, terminated or exercised, the hedge no longer meets the criteria for hedge accounting or the group revokes the designation.
Cash flow hedgesCash flow hedges cover the exposure to variability in cash flows that are attributable to a particular risk associated with:
• a recognised asset or liability; or
• a highly probable forecast transaction; or
• the foreign currency risk in an unrecognised firm commitment.
The portion of the gain or loss on the hedging instrument that is determined to be an effective hedge is recognised directly in other comprehensive income, while any ineffective portion is recognised in the income statement.
Amounts taken to other comprehensive income are transferred to the income statement when the hedged transaction affects profit or loss, such as when the hedged income or financial asset or liability is recognised or when the forecast sale or purchase occurs. Where the hedged item is the cost of a non-financial asset or liability, the amount deferred in other comprehensive income is transferred to the initial carrying amount of the non-financial asset or liability.
If the forecast transaction is no longer expected to occur, amounts previously recognised in other comprehensive income are transferred to profit or loss. If the hedging instrument expires or is sold, terminated or exercised

119Tiger Brands Annual Report 2010
Divisional reviews Governance and sustainability
▲
Annual financial statements
cash flow hedges in respect of the purchases of raw materials.
Net realisable value is the estimated selling price in the ordinary course of business, less estimated completion and selling costs.
ProvisionsProvisions are recognised when the group has a present legal or constructive obligation, as a result of past events, for which it is probable that an outflow of economic benefits will be required to settle the obligation, and a reliable estimate can be made of the amount of the obligation.
Where the group expects some or all of a provision to be reimbursed, for example under an insurance contract, the reimbursement is recognised as a separate asset, but only when the reimbursement is virtually certain. The expense relating to any provision is presented in the income statement net of any reimbursement.
If the effect of the time value of money is material, provisions are discounted using a current pretax rate that reflects the risks specific to the liability. Where discounting is used, the increase in the provision due to the passage of time is recognised as a finance cost.
LeasesAt inception date an arrangement is assessed to determine whether it is, or contains, a lease. An arrangement is accounted for as a lease where it is dependent on the use of a specific asset and it conveys the right to use that asset.
Leases are classified as finance leases where substantially all the risks and rewards associated with ownership of an asset are transferred from the lessor to the group as lessee. Finance lease assets and liabilities are recognised at the lower of the fair value of the leased property or the present value of the minimum lease payments. Finance lease payments are allocated, using the effective interest rate method, between the lease finance cost, which is included in financing costs, and the capital repayment, which reduces the liability to the lessor.
Capitalised lease assets are depreciated in line with the group’s stated depreciation policy. If there is no reasonable certainty that the group will obtain ownership by the end of the lease term, the asset is depreciated over the shorter of its estimated useful life and lease term.
Operating leases are those leases which do not fall within the scope of the above definition. Operating lease rentals are charged against trading profit on a straight-line basis over the lease term.
• the group transfers the right to receive the cash flows, and also transfers either all the risks and rewards, or control over the asset.
Financial liabilities are derecognised when the obligation is discharged, cancelled or expired.
Non-current assets held for sale and discontinued operationsAn item is classified as held-for-sale if its carrying amount will be recovered principally through a sale transaction rather than through continuing use. This condition is regarded as met only when the sale is highly probable and the asset or disposal group is available for immediate sale in its present condition. Management must be committed to the sale, which should be expected to qualify for recognition as a completed sale within one year from the date of classification.
Assets classified as held-for-sale are not subsequently depreciated and are held at the lower of their carrying value and fair value less costs to sell.
A discontinued operation is a separate major line of business or geographical area of operation that has been disposed of, or classified as held-for-sale, as part of a single coordinated plan. Alternatively, it could be a subsidiary acquired exclusively with a view to resale.
In the consolidated income statement of the reporting period and of the comparable period, income and expenses from discontinued operations are reported separate from income and expenses from continuing activities down to the level of profit after taxes, even when the group retains a non-controlling interest in the subsidiary after the sale. The resulting profit or loss (after taxes) is reported separately in the income statement.
InventoriesInventories are stated at the lower of cost or net realisable value. Costs incurred in bringing each product to its present location and condition are accounted for as follows:
Raw materials: Purchase cost on a first-in first-out basis.
Finished goods and work-in-progress:
Cost of direct material and labour and a proportion of manufacturing overheads based on normal operating capacity but excluding borrowing costs.
Consumables are written down with regard to their age, condition and utility.
Costs of inventories include the transfer from other comprehensive income of gains and losses on qualifying
120 Tiger Brands Annual Report 2010
Notes to the financial statements continuedfor the year ended 30 September 2010
Group at a glance Group review
TaxationThe income tax expense represents the sum of current tax payable (both current and deferred) and secondary taxation on companies.
Normal tax – currentThe normal tax is based on taxable profit for the year. Taxable profit differs from profit as reported in the income statement because it excludes items of income or expense that are taxable or deductible in other years, and it further excludes items that are never taxable or deductible. Normal tax may include under- or over provisions relating to prior year taxation. The group’s liability for normal tax is calculated using tax rates that have been enacted or substantively enacted by the reporting date.
Normal tax relating to items recognised outside profit or loss is recognised outside profit or loss. Normal tax items are recognised in correlation to the underlying transaction either in other comprehensive income or directly in equity.
Normal tax – deferredDeferred tax is calculated on the liability method, using the difference between the carrying amounts of assets and liabilities and their corresponding tax base used in the computation of taxable profit.
Deferred tax liabilities are recognised for taxable temporary differences:
• except where the liability arises from the initial recognition of goodwill or an asset or liability in a transaction that is not a business combination and, at the time of the transaction, affects neither the accounting profit nor taxable profit or loss; and
• except in respect of taxable temporary differences associated with investments in subsidiaries, associates and interests in joint ventures, where the timing of the reversal of the temporary differences can be controlled, and it is probable that the temporary differences will not reverse in the foreseeable future.
Deferred tax assets are recognised for all deductible temporary differences, carry forward of unused tax credits and unused tax losses, where it is probable that the asset will be utilised in the foreseeable future:
• except where the asset arises from the initial recognition of an asset or liability in a transaction that is not a business combination and, at the time of the transaction, affects neither the accounting profit nor taxable profit or loss; and
RevenueRevenue comprises turnover, dividend income and interest income. Revenue is recognised to the extent that it is probable that the economic benefits will flow to the group and the revenue can be reliably measured. Revenue is measured at the fair value of the consideration received/ receivable excluding value-added tax, normal discounts, rebates, settlement discounts, promotional allowances, and internal revenue which is eliminated on consolidation.
The group assesses its revenue arrangements against specific criteria in order to determine if it is acting as principal or agent. The group has concluded that it is acting as a principal in all of its revenue arrangements.
Sale of goodsTurnover from the sale of goods is recognised when the significant risks and rewards of ownership have passed to the buyer, usually on dispatch of the goods.
Dividend incomeDividend income is recognised when the group’s right to receive payment is established. Non-resident shareholders’ taxation is provided in respect of foreign dividends receivable, where applicable.
Interest incomeFor all financial instruments measured at amortised cost, interest income or expense is recorded using the effective interest rate (“EIR”), which is the rate that exactly discounts the estimated future cash payments or receipts through the expected life of the financial instrument or a shorter period, where appropriate, to the net carrying amount of the financial asset or liability. Interest income is included in finance income in the income statement.
Borrowing costsBorrowing costs directly attributable to the acquisition, construction or production of an asset that necessarily takes a substantial period of time to get ready for its intended use or sale are capitalised as part of the cost of the respective assets. All other borrowing costs are expensed in the period they occur. Borrowing costs consist of interest and other costs that an entity incurs in connection with the borrowing of funds.
The group capitalises borrowing costs for all eligible assets where construction was commenced on or after 1 October 2009. The group continues to expense borrowing costs relating to construction projects that commenced prior to 1 October 2009.

121Tiger Brands Annual Report 2010
Divisional reviews Governance and sustainability
▲
Annual financial statements
expense when the entity consumes the economic benefit arising from the service provided by the employee.
In respect of defined contribution plans, the contribution paid by the company is recognised as an expense. If the employee has rendered the service, but the contribution has not yet been paid, the amount payable is recognised as a liability.
In respect of defined benefit plans, the company’s contributions are based on the recommendations of independent actuaries as determined using the projected unit credit actuarial valuation method.
Actuarial gains and losses are recognised in the income statement when the net cumulative unrecognised actuarial gains and losses for each individual plan at the end of the previous reporting period exceed 10% of the higher of the defined benefit obligation and the fair value of plan assets at that date. These gains or losses are recognised over the expected average remaining working lives of the employees participating in the plans.
Past-service costs are recognised as an expense on a straight-line basis over the average period until the benefits become vested. If the benefits vest immediately following the introduction of, or changes to, a defined benefit plan, the past-service cost is recognised immediately.
The defined benefit asset or liability recognised in the statement of financial position comprises the present value of the defined benefit obligation, plus any unrecognised actuarial gains (minus losses), less unrecognised past-service costs, net actuarial losses and the fair value of plan assets out of which the obligations are to be settled. The value of an asset recognised is restricted to the sum of the unrecognised past-service costs and unrecognised actuarial gain or loss and the present value of any economic benefits available in the form of refunds from the plan or reductions in the future contributions.
Post-retirement medical obligationsThe group provides post-retirement healthcare benefits to certain of its retirees based on the qualifying employee remaining in service up to retirement age. The expected costs of these benefits are accrued over the period of employment, using the projected unit credit method. Valuations are based on assumptions which include employee turnover, mortality rates, discount rate based on current bond yields of appropriate terms, healthcare inflation costs and rates of increase in salary costs. Valuations of these obligations are carried out by independent qualified actuaries.
Actuarial gains or losses are recognised in the same manner as those of pension obligations.
• except in respect of deductible temporary differences associated with investments in subsidiaries, associates and interests in joint ventures, only to the extent that it is probable that the differences will reverse in the foreseeable future, and taxable profit will be available against which these differences can be utilised.
The carrying amount of deferred tax assets is reviewed at each reporting date and reduced to the extent that it is no longer probable that sufficient taxable profits will be available to allow all or part of the asset to be recovered. Unrecognised deferred tax assets are reassessed at each reporting date and recognised to the extent it has become probable that future taxable profit will allow the asset to be utilised.
Deferred tax is calculated at the tax rates that are expected to apply in the period when the liability is settled or the asset realised based on tax rates/laws that have been enacted or substantively enacted by the reporting date.
Deferred tax relating to items recognised outside profit or loss is recognised outside profit or loss. Deferred tax items are recognised in correlation to the underlying transaction either in other comprehensive income or directly in equity.
Secondary tax on companiesSecondary taxation on companies (STC) on dividends declared is accrued in the period in which the dividend is declared.
Value added taxRevenues, expenses and assets are recognised net of the amount of value added tax except:
• where the value added tax incurred on a purchase of assets or services is not recoverable from the taxation authority, in which case the value added tax is recognised as part of the cost of acquisition of the asset or as part of the expense item as applicable; and
• receivables and payables that are stated with the amount of value added tax included.
The net amount of value added tax recoverable from, or payable to, the taxation authority is included as part of receivables or payables in the statement of financial position.
Employee benefitsA liability is recognised when an employee has rendered services for benefits to be paid in the future, and an
122 Tiger Brands Annual Report 2010
Notes to the financial statements continuedfor the year ended 30 September 2010
Group at a glance Group review
expense as if the terms had not been modified, if the original terms of the award are met. If, at the date of modification, the total fair value of the share-based payment is increased or is otherwise beneficial to the employee, the difference is recognised as an additional expense.
Where an equity-settled award is cancelled (other than forfeiture), it is treated as if it had vested on the date of cancellation, and any unrecognised expense recognised immediately. This includes any award where non-vesting conditions within the control of either the entity or the employee are not met. However, if a new award is substituted and designated as a replacement for the cancelled award, the cancelled and new awards are treated as if they were a modification of the original award, as described above.
The dilutive effect of outstanding equity-settled options is reflected as additional share dilution in the computation of earnings and headline earnings per share.
Cash-settled transactionsThe cost of cash-settled transactions is measured initially at fair value at the grant date using a modified version of the Black-Schöles model, taking into account the terms and conditions upon which the instruments were granted (see note 23). This fair value is expensed over the period until vesting with recognition of a corresponding liability. The liability is remeasured at each reporting date up to and including the settlement date with changes in fair value recognised in profit or loss.
Accounting for BEE transactionsWhere equity instruments are issued to a black economic empowerment (BEE) party at less than fair value, the instruments are accounted for as share-based payments in terms of the stated accounting policy.
Any difference between the fair value of the equity instrument issued and the consideration received is accounted for as an expense in the income statement.
A restriction on the BEE party to transfer the equity instrument subsequent to its vesting is not treated as a vesting condition, but is factored into the fair value determination of the instrument.
Treasury sharesShares in Tiger Brands Limited held by the group are classified within total equity as treasury shares. The shares acquired by the Black Managers Trust (I and II),Thusani Trust, Brimstone SPV and The Tiger Brands Foundation are accounted for as treasury shares in line with the
Share-based paymentsCertain employees (including senior executives) of the group receive remuneration in the form of share-based payment transactions, whereby employees render services as consideration for equity instruments (“equity-settled transactions”) or share appreciation rights (“cash-settled transactions”).
Equity-settled share options granted before 7 November 2002No expense is recognised in the income statement for such awards.
The group has taken advantage of the voluntary exemption provision of IFRS 1 First-time Adoption of International Financial Reporting Standards in respect of equity-settled awards and has applied IFRS 2 Share-based Payment – only to equity-settled awards granted after 7 November 2002 that had not vested on 1 January 2005.
Equity-settled and cash-settled share options granted after 7 November 2002Equity-settled transactionsThe cost of equity-settled transactions with employees is measured by reference to the fair value at the date on which they are granted. The fair value is determined by an external valuer using a modified version of the Black-Schöles model, further details of which are given in note 23.
The cost of equity-settled transactions is recognised, together with a corresponding increase in equity, over the period in which the service conditions are fulfilled, ending on the date on which the relevant employees become fully entitled to the award (‘the vesting date’). The cumulative expense recognised reflects the extent to which the vesting period has expired and the group’s best estimate of the number of equity instruments that will ultimately vest. The income statement charge for a period represents the movement in the cumulative expense at the beginning and end of that period.
No expense is recognised for awards that do not ultimately vest, except for equity-settled transactions where vesting is conditional upon a market or non-vesting condition, which are treated as vesting irrespective of whether or not the market or non-vesting condition is satisfied, provided that all other performance and/or service conditions are satisfied.
Where the terms of an equity-settled transaction award are modified, the minimum expense recognised is the

123Tiger Brands Annual Report 2010
Divisional reviews Governance and sustainability
▲
Annual financial statements
Consolidation of special-purpose entitiesThe special-purpose entities established in terms of the BEE transaction implemented in October 2005 and October 2009, have been consolidated in the group results. The substance of the relationship between the company and these entities has been assessed and the decision made that they are controlled entities, mainly due to the fact that they have been formed to carry out specific objectives and that they will operate in terms of the autopilot principles as set out in SIC 12.
Estimates and assumptionsThe key assumptions concerning the future and other key sources of estimation uncertainty at the reporting date, that have a significant risk of causing a material adjustment to the carrying amounts of assets and liabilities within the next financial year, are discussed below.
Carrying value of goodwill, tangible and intangible assetsGoodwill and indefinite life intangible assets are tested for impairment annually or more frequently if there is an indicator of impairment. Tangible assets and finite life intangible assets are tested when there is an indicator of impairment. The calculation of the recoverable amount requires the use of estimates and assumptions concerning the future cash flows which are inherently uncertain and could change over time. In addition, changes in economic factors, such as discount rates, could also impact this calculation. Further details are given in notes 11 and 12.
Residual values and useful lives of tangible and intangible assetsResidual values and useful lives of tangible and intangible assets are assessed on an annual basis. Estimates and judgements in this regard are based on historical experience and expectations of the manner in which assets are to be used, together with expected proceeds likely to be realised when assets are disposed of at the end of their useful lives. Such expectations could change over time and therefore impact both depreciation charges and carrying values of tangible and intangible assets in the future. Further details are given in notes 11 and 12.
Fair value of BEE share allocationsIn calculating the amount to be expensed as a share-based payment, the group was required to calculate the fair value of the equity instruments granted to the BEE participants in terms of the staff empowerment transaction implemented in October 2005 and October 2009. This
consolidation requirement for special-purpose entities. Treasury shares are treated as a deduction from the issued and weighted average number of shares for earnings per share and headline earnings per share purposes, and the cost price of the shares is reflected as a separate component of capital and reserves in the statement of financial position. Dividends received on treasury shares are eliminated on consolidation. No gain or loss is recognised in the income statement on the purchase, sale, issue or cancellation of treasury shares. Consideration received or paid in respect of treasury shares is recognised in equity.
Contingent assets and contingent liabilitiesA contingent asset is a possible asset that arises from past events and whose existence will be confirmed by the occurrence or non-occurrence of one or more uncertain future events not wholly within the control of the company. Contingent assets are not recognised as assets.
A contingent liability is a possible obligation that arises from past events and whose existence will be confirmed by the occurrence or non-occurrence of one or more uncertain future events not wholly within the control of the company. Alternatively, it may be a present obligation that arises from past events but is not recognised because an outflow of economic benefits to settle the obligation is not probable, or the amount of the obligation cannot be measured with sufficient reliability. Contingent liabilities are not recognised as liabilities unless they are acquired as part of a business combination.
Events after the reporting periodRecognised amounts in the financial statements are adjusted to reflect significant events arising after the reporting date, but before the financial statements are authorised for issue, provided there is evidence of conditions that existed at the reporting date. Events after the reporting date that are indicative of conditions that arose after the reporting date are dealt with by way of a note.
Significant accounting judgements and estimatesJudgementsIn the process of applying the group’s accounting policies, management has made the following judgements, apart from those involving estimations, which has the most significant effect on the amounts recognised in the financial statements:

124 Tiger Brands Annual Report 2010
Notes to the financial statements continuedfor the year ended 30 September 2010
Group at a glance Group review
specific to the liability, all of which requires management judgement.
The establishment and review of the provisions requires significant judgement by management as to whether or not a reliable estimate can be made of the amount of the obligation.
The group is required to record provisions for legal or constructive contingencies when the contingency is probable of occurring and the amount of the loss can be reasonably estimated. Liabilities provided for legal matters require judgements regarding projected outcomes and ranges of losses based on historical experience and recommendations of legal counsel. Litigation is however unpredictable and actual costs incurred could differ materially from those estimated at the reporting date. Further details are given in note 30.
Further information on changes to accounting policies • IFRS 2 Share-based Payment (Revised)
The IASB issued an amendment to IFRS 2 which clarifies the definition of vesting conditions and prescribes the treatment for an award that is cancelled. The group adopted this amendment as of 1 October 2009. It did not have an impact on the financial position or performance of the group.
• IFRS 3 Business Combinations (Revised) and IAS 27 Consolidated and Separate Financial Statements (Amended)
The group adopted the revised IFRS 3 and amended IAS 27 from 1 October 2009. IFRS 3 (Revised) introduces significant changes in the accounting for business combinations occurring after this date. Changes affect the valuation of non-controlling interest, the accounting for transaction costs, the initial recognition and subsequent measurement of a contingent consideration and business combinations achieved in stages. The amount of goodwill recognised and the reported results will be impacted in the period that an acquisition occurs.
IAS 27 (Amended) requires that a change in the ownership interest of a subsidiary (without loss of control) is accounted for as a transaction with owners in their capacity as owners. Therefore, such transactions will no longer give rise to goodwill, nor will it give rise to a gain or loss. Furthermore, the amended standard changes the accounting for losses incurred by the subsidiary as well as the loss of control of a subsidiary. The changes by IFRS 3 (Revised) and IAS 27 (Amended) will affect future acquisitions or loss
fair value was calculated by applying a valuation model which is in itself judgemental and takes into account certain inherently uncertain assumptions (detailed in note 23).
Had different assumptions been applied, this could have impacted the expense recognised.
Share-based paymentsThe group measures the cost of equity-settled transactions with employees by reference to the fair value of the equity instruments at the date at which they are granted. Estimating fair value requires determining the most appropriate valuation model for a grant of equity instruments, which is dependent on the terms and conditions of the grant. This also requires determining the most appropriate inputs to the valuation model including the expected life of the option, volatility and dividend yield and making assumptions about them. The assumptions and models used are disclosed in note 23.
Deferred tax assetsDeferred tax assets are recognised for all unused tax losses to the extent that it is probable that taxable profit will be available against which the losses can be utilised. Significant management judgement is required to determine the amount of deferred tax assets that can be recognised, based upon the likely timing and level of future taxable profits together with future tax planning strategies. Further details are contained in note 19.
Pension and other post-employment benefitsThe cost of defined benefit pension plans and other post-employment medical benefits is determined using actuarial valuations. The actuarial valuation involves making assumptions about discount rates, expected rates of return on assets, future salary increases, mortality rates and future pension increases. Due to the long-term nature of these plans, such estimates are subject to significant uncertainty. Further details are given in notes 34 and 35.
ProvisionsBest estimates, being the amount that the group would rationally pay to settle the obligation, are recognised as provisions at the reporting date. Risks, uncertainties and future events, such as changes in law and technology, are taken into account by management in determining the best estimates. Where the effect of discounting is material, provisions are discounted. The discount rate used is the pre-tax rate that reflects current market assessments of the time value of money and, where appropriate, the risks

125Tiger Brands Annual Report 2010
Divisional reviews Governance and sustainability
▲
Annual financial statements
basis. Therefore, borrowing costs are capitalised on qualifying assets where construction was commenced on or after 1 October 2009, the impact of which has been included in note 11.
• IAS 39 Financial Instruments: Recognition and Measurement – Eligible Hedged Items
The amendment clarifies that an entity is permitted to designate a portion of the fair value changes or cash flow variability of a financial instrument as a hedged item. This also covers the designation of inflation as a hedged risk or portion in particular situations. The group has concluded that the amendment will have no impact on the financial position or performance of the group, as the group has not entered into any such hedges.
• IFRIC 9 Reassessment of Embedded Derivatives and IAS 39 Financial Instruments: Recognition and Measurement
This amendment to IFRIC 9 requires an entity to assess whether an embedded derivative must be separated from a host contract when the entity reclassifies a hybrid financial asset out of the fair value through profit or loss category. This assessment is to be made based on circumstances that existed on the later of the date the entity first became a party to the contract and the date of any contract amendments that significantly change the cash flows of the contract. IAS 39 now states that if an embedded derivative cannot be reliably measured, the entire hybrid instrument must remain classified as at fair value through profit or loss. While the group does have embedded derivatives, this will not have an impact on the group.
May 2008 improvements to IFRSIn May 2008 the IFRS Board issued its first omnibus of amendments to its standards, primarily with a view to removing inconsistencies and clarifying wording. Most of these are applicable for financial periods beginning on or after 1 January 2009. A description of the more significant changes is included below. These changes will have no material effect on the financial statements.
• IFRS 7 Financial Instruments: Disclosures: Removal of the reference to ‘total interest income’ as a component of finance costs.
• IAS 1 Presentation of Financial Statements: Assets and liabilities classified as held-for-trading in accordance with IAS 39 are not automatically classified as current in the statement of financial position.
of control of subsidiaries and transactions with non-controlling interests.
The change in accounting policy was applied prospectively and had no material impact on earnings per share.
• IFRS 7 Financial Instruments: Disclosures
The amended standard requires additional disclosures about fair value measurement and liquidity risk. Fair value measurements related to items recorded at fair value are to be disclosed by source of inputs using a three level fair value hierarchy, by class, for all financial instruments recognised at fair value. In addition, a reconciliation between the beginning and ending balance for level 3 fair value measurements is now required, as well as significant transfers between levels in the fair value hierarchy. The amendments also clarify the requirements for liquidity risk disclosures with respect to derivative transactions and assets used for liquidity management. The fair value measurement disclosures are presented in note 37. The liquidity risk disclosures are not significantly impacted by the amendments and are presented in note 37.
• IFRS 8 Operating Segments
IFRS 8 replaced IAS 14 Segment Reporting upon its effective date. The group concluded that the operating segments determined in accordance with IFRS 8 are the same as the business segments previously identified under IAS 14. IFRS 8 disclosures are shown on pages 12 to 13 and in note 3, including the related revised comparative information.
• IAS 1 Presentation of Financial Statements
The revised standard separates owner and non-owner changes in equity. The statement of changes in equity includes only details of transactions with owners, with non-owner changes in equity presented in a reconciliation of each component of equity. In addition, the standard introduces the statement of comprehensive income: it presents all items of recognised income and expense, either in one single statement, or in two linked statements. The group has elected to present two statements.
• IAS 23 Borrowing Costs
The revised IAS 23 requires capitalisation of borrowing costs that are directly attributable to the acquisition, construction or production of a qualifying asset. The group’s previous policy was to expense borrowing costs as they were incurred. In accordance with the transitional provisions of the amended IAS 23, the group has adopted the standard on a prospective

126 Tiger Brands Annual Report 2010
Notes to the financial statements continuedfor the year ended 30 September 2010
Group at a glance Group review
investment in an associate is a single asset for the purpose of conducting the impairment test. Therefore, any impairment test is not separately allocated to the goodwill included in the investment balance.
• IAS 29 Financial Reporting in Hyperinflationary Economies: Revised the reference to the exception to measure assets and liabilities at historical cost, such that it notes property, plant and equipment as being an example, rather than implying that it is a definitive list. Also, revised various terms used to be consistent with other IFRS.
• IAS 31 Interest in Joint Ventures: If a joint venture is accounted for at fair value, in accordance with IAS 39, only the requirements of IAS 31 to disclose the commitments of the venturer and the joint venture, as well as summary financial information about the assets, liabilities, income and expense will apply.
• IAS 34 Interim Financial Reporting: Earnings per share is disclosed in interim financial reports if an entity is within the scope of IAS 33.
• IAS 36 Impairment of Assets: When discounted cash flows are used to estimate “fair value less cost to sell” additional disclosure is required about the discount rate, consistent with disclosures required when the discounted cash flows are used to estimate “value in use”.
• IAS 38 Intangible Assets: Expenditure on advertising and promotional activities is recognised as an expense when the group either has the right to access the goods or has received the service.
• IAS 39 Financial Instruments: Recognition and Measurement: Changes in circumstances relating to derivatives are not reclassifications and therefore may be either removed from, or included in, the “fair value through profit or loss” classification after initial recognition. Removed the reference in IAS 39 to a “segment” when determining whether an instrument qualifies as a hedge. Requires the use of the revised effective interest rate when remeasuring a debt instrument on the cessation of fair value hedge accounting.
• IAS 40 Investment Property: Revision of the scope such that property under construction or development for future use as an investment property is classified as investment property. Also revised the conditions for a voluntary change in accounting policy to be consistent with IAS 8 and clarified that the carrying amount of investment property held under lease is the valuation obtained increased by any recognised liability.
• IAS 8 Accounting Policies, Change in Accounting Estimates and Errors: Clarifies that only implementation guidance that is an integral part of an IFRS is mandatory when selecting accounting policies.
• IAS 10 Events after the Reporting Period: Clarifies that dividends declared after the end of the reporting period are not obligations.
• IAS 16 Property, Plant and Equipment: Items of property, plant and equipment held for rental that are routinely sold in the ordinary course of business after rental, are transferred to inventory when rental ceases and they are held for sale. The term “net selling price” was replaced with “fair value less costs to sell”.
• IAS 18 Revenue: Replaces the term “direct costs” with “transaction costs” as defined in IAS 39.
• IAS 19 Employee Benefits: Revised the definition of “past service costs”, “return on plan assets” and “short-term” and “other long-term” employee benefits. Amendments to plans that result in a reduction in benefits related to future services are accounted for as curtailment. The reference to the recognition of contingent liabilities has been deleted to ensure consistency with IAS 37.
• IAS 20 Accounting for Government Grants and Disclosures of Government Assistance: Loans granted in the future with no or low interest rates will not be exempt from the requirement to impute interest. The difference between the amount received and the discounted amount is accounted for as government grants.
• IAS 23 Borrowing Costs: The definition of borrowing costs is revised to consolidate the two types of items that are considered components of “borrowing costs” into one – the interest expense calculated using the effective interest rate method calculated in accordance with IAS 39.
• IAS 27 Consolidated and Separate Financial Statements: When a parent entity accounts for a subsidiary at fair value in accordance with IAS 39 in its separate financial statements, this treatment continues when the subsidiary is subsequently classified as held-for-sale.
• IAS 28 Investment in Associates: If an associate is accounted for at fair value in accordance with IAS 39, only the requirement of IAS 28 to disclose the nature and extent of any significant restrictions on the ability of the associate to transfer funds to the entity in the form of cash or repayment of loans applies. An

127Tiger Brands Annual Report 2010
Divisional reviews Governance and sustainability
▲
Annual financial statements
for financial periods beginning on or after 1 February 2010. The standard is unlikely to have a significant impact on the group.
• Amendments to IFRS 2 Share-based Payments – Group Cash-settled Share-based Payment Arrangements: This amendment provides guidance on accounting for cash-settled transactions in a group. The standard is effective for financial periods beginning on or after 1 January 2010 and is not expected to have a material impact on the group.
• Amendments to IFRS 9 Financial Instruments – Classification and Measurement: On 28 October 2010, the IASB issued amendments to IFRS 9 to address financial liabilities. Furthermore, these amendments also incorporate the current derecognition principles of IAS 39 into IFRS 9.
IFRS 9 retains the existing IAS 39 classification and measurement requirements for financial liabilities not designated at fair value through profit or loss using the Fair Value Option (“FVO”) (i.e. financial liabilities at amortised cost and held for trading liabilities).
In addition, the criteria within IAS 39 for using the FVO for financial liabilities are also retained however changes from the amendments affect the measurement of FVO liabilities. Loan commitments and financial guarantee contracts which have been designated under the FVO are not within the scope of the amendments.
The amendments are mandatory for annual periods beginning on or after 1 January 2013. Early application is permitted. The amendments will not have a significant impact on the financial statements.
• Amendments to IFRIC 14 Prepayments of a Minimum Funding Requirement: The requirements of IFRIC 14 meant that some entities that were subject to minimum funding requirements could not treat any surplus in a defined benefit pension plan as an economic benefit. This amendment will allow these entities to recognise a prepayment of pension contributions as an asset rather than an expense. This amendment is effective for financial periods beginning on or after 1 January 2011 and will not have an impact on the group.
April 2009 improvements to IFRS These improvements are mostly effective from 1 January 2010. The second omnibus of improvements to IFRS was issued in April 2009. The items below are a summary of some of the more significant changes:
• IFRS 2 Share-based Payment: This was amended to confirm that the contribution of a business on the
Standards and interpretations not yet effectiveThe group has not applied the following IFRS and IFRIC Interpretations that have been issued but are not yet effective and will be adopted by the group when they become effective. These are as follows:
• IFRS 9 Financial Instruments: IFRS 9 specifies how an entity should classify and measure financial assets, including some hybrid contracts. They require all financial assets to be:
(a) classified on the basis of the entity’s business model for managing the financial assets and the contractual cash flow characteristics of the financial asset;
(b) initially measured at fair value plus, in the case of a financial asset not at fair value through profit or loss, particular transaction costs; and
(c) subsequently measured at amortised cost or fair value.
The revised standard is effective for financial periods beginning on or after 1 January 2013. It will have an impact on the classification and measurement of financial assets.
• IAS 24 Related-party Disclosure: This standard clarifies and simplifies the definition of a related party. The revised standard also provides some relief for government-related entities (to disclose details of all transactions with other government-related entities (as well as with the government itself). This standard prescribes additional disclosure in certain circumstances. The revised standard is effective for financial periods beginning on or after 1 January 2011. It may have an impact on the disclosure of related parties.
• IFRIC 19 Extinguishing Financial Liabilities with Equity Instruments: IFRIC 19 addresses the accounting by an entity when the terms of a financial liability are renegotiated and result in the entity issuing equity instruments to a creditor of the entity to extinguish all or part of the financial liability. This interpretation is effective for periods beginning on or after 1 July 2010 and is unlikely to have a significant impact on the group.
• IAS 32 Classification of Rights Issues – Amendment to IAS 32: This amendment provides relief to entities that issue rights in a currency other than their functional currency, from treating the rights as derivatives with fair value changes recorded in profit or loss. Such rights will now be classified as equity instruments when certain conditions are met. The amendment is effective

128 Tiger Brands Annual Report 2010
Notes to the financial statements continuedfor the year ended 30 September 2010
Group at a glance Group review
or sell an acquiree that will result in a business combination at a future acquisition date. The amendment clarifies that a reclassification adjustment of the gain or losses on cash flow hedges should be recorded in the period that the hedged forecast cash flows affect profit or loss
The impacts of the above amendments are not known. However, these are not expected to have a significant impact on the financial statements.
May 2010 improvements to IFRS These improvements are mostly effective from 1 January 2011. The items below are a summary of some of the more significant changes:
• IFRS 1 First-time Adoption of International Financial Reporting Standards: This amendment prescribes additional guidance for first time adopters.
• IFRS 3 Business Combinations: This amendment provides more guidance on the measurement of non-controlling interests and the accounting for unreplaced and voluntarily replaced share-based payments.
• IFRS 7 Financial Instruments: Disclosure: This amendment provides clarification of disclosures of financial instruments.
• IAS 1 Presentation of Financial Statements: This amendment clarifies that an entity shall present an analysis of each component of other comprehensive income.
• IAS 27 Consolidated and Separate Financial Statements: This amendment provides clarity that transitional provisions relating to IAS 21, IAS 28 and IAS 31 apply prospectively.
• IAS 34 Interim Financial Reporting: This amendment provides guidance to indicate how to apply disclosure principles in IAS 34 and provides additional disclosure.
• IFRIC 13 Customer Loyalty Programmes: This amendment provides clarity on the measurement of the fair value of an award credit.
The impacts of the above amendments are not known. However, these are not expected to have a significant impact on the financial statements.
The following amendment has also been issued but will not have an impact:
• IFRS 1 Limited Exemption from Comparative IFRS 7 Disclosures for First-time Adopters
formation of a joint venture and common control transactions are not within the scope of IFRS 2.
• IFRS 5 Non-current Assets Held-for-Sale: This amendment clarifies that the disclosures required in respect of non-current assets (or disposal groups) classified as held-for-sale or discontinued operations are only those set out in IFRS 5.
• IFRS 8 Operating Segments: This amendment clarifies that segment assets and liabilities need only be reported when included in measures used by the chief operating decision maker.
• IAS 1 Presentation of Financial Statements: The amendment clarifies that the terms of a liability that could at the option of the counterparty, result in its settlement by the issue of equity instruments do not affect its classification.
• IAS 7 Statement of Cash Flows: This amendment clarifies that only an expenditure that results in a recognised asset can be classified as a cash flow from investing activities.
• IAS 17 Leases: This amendment clarifies that lease of land may be classified as a finance lease even if the transfer of title does not take place but the risks and rewards of ownership have been transferred.
• IAS 18 Revenue: This amendment provides guidance on when an entity is a principal or agent.
• IAS 36 Impairment of Assets: This amendment was made to state that the largest unit permitted for allocating goodwill acquired in a business combination for the purpose of impairment testing is an operating segment as defined by IFRS 8 before aggregation.
• IAS 38 Intangible Assets: The amendment clarifies that if an intangible asset acquired in a business combination is identifiable only with another intangible asset, the acquirer may recognise the group of intangible assets as a single asset, provided the individual assets have similar useful lives. The amendment clarifies the valuation techniques an entity may use to determine value of intangible assets in a business combination.
• IAS 39 Financial Instruments: Recognition and Measurement: The standard clarifies that the scope exemption for contracts between an acquirer and a vendor in a business combination to buy or sell an acquiree at a future date applies only to binding forward contracts entered into before the acquirer obtains control at a specified price or on a specified basis. The Standard scopes out any forward contracts between an acquirer and a selling shareholder to buy

129Tiger Brands Annual Report 2010
Divisional reviews Governance and sustainability
▲
Annual financial statements
1. BUSINESS COMBINATIONS
1.1 Crosse & Blackwell On 1 October 2009, Tiger Brands acquired the Crosse & Blackwell mayonnaise business from Nestlé. The acquisition is in line with Tiger Brands’ strategy of expanding into adjacent categories with well-established brands. The purchase included both the mayonnaise production plant and staff in Bellville, Cape Town, as well as inventory and intangible assets. The purchase consideration, accounted for from 1 October 2009, comprises the following:
(Rands in millions) 2010
Trademarks 250,0Land and buildings 50,0Plant and equipment 27,7Inventories 74,5
Fair value of assets acquired 402,2Goodwill 72,3
Purchase consideration 474,5
From date of acquisition to 30 September 2010, the Crosse & Blackwell business has contributed R618,8 million to group revenue and R56,3 million to profit after tax after accounting for acquisition financing costs.Apart from plant and equipment and inventories, where the carrying value approximated fair value, the carrying values of the remaining assets at the date of acquisition, being trademarks and land and buildings, are not disclosed as these values were not made available to the company during the sale transaction.Goodwill represents the difference between the purchase consideration and the fair value of the net assets acquired as there are no further separately identifiable intangible assets.The purchase consideration was financed out of operating cash flows.
COMPANy GROUP
2010 2009 (Rands in millions) 2010 2009
2. TOTAL REVENUETurnover 19 316,0 20 430,4
137,2 147,2 Interest received 220,1 181,6916,2 735,9 Dividend income 18,6 30,5
1 053,4 883,1 19 554,7 20 642,5
3. TURNOVER
3.1 Turnover comprises:Turnover denominated in foreign currencies 1 786,5 2 138,8Turnover denominated in functional currency 17 529,5 18 291,6
19 316,0 20 430,4
Turnover is net of value-added tax, normal discounts, rebates and promotional allowances.
3.2 Turnover by major customerCustomer 1 3 454,0 3 308,0Customer 2 2 815,0 2 937,0Customer 3 2 023,0 1 939,0Customer 4 1 633,0 1 553,0Customer 5 499,0 826,0All other customers 8 892,0 9 867,4
19 316,0 20 430,4
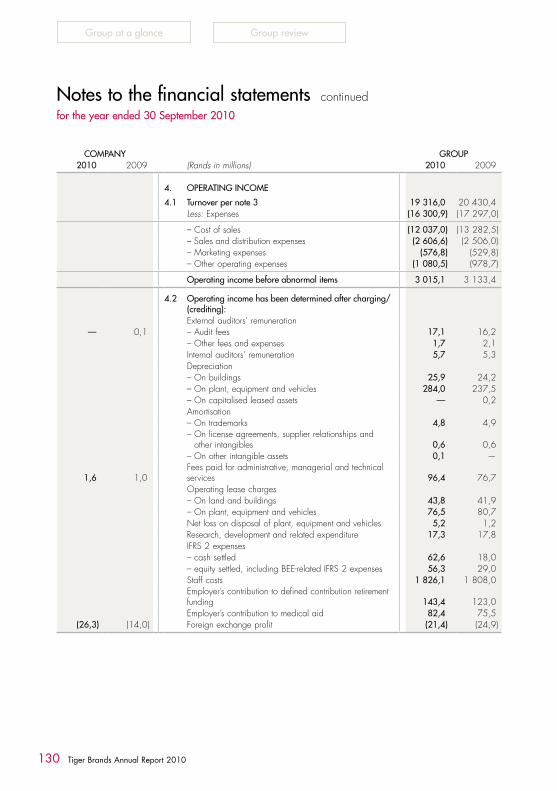
130 Tiger Brands Annual Report 2010
Group at a glance Group review
Notes to the financial statements continuedfor the year ended 30 September 2010
COMPANy GROUP2010 2009 (Rands in millions) 2010 2009
4. OPERATING INCOME
4.1 Turnover per note 3 19 316,0 20 430,4Less: Expenses (16 300,9) (17 297,0)
– Cost of sales (12 037,0) (13 282,5)– Sales and distribution expenses (2 606,6) (2 506,0)– Marketing expenses (576,8) (529,8)– Other operating expenses (1 080,5) (978,7)
Operating income before abnormal items 3 015,1 3 133,4
4.2 Operating income has been determined after charging/(crediting):External auditors’ remuneration
— 0,1 – Audit fees 17,1 16,2– Other fees and expenses 1,7 2,1Internal auditors’ remuneration 5,7 5,3Depreciation– On buildings 25,9 24,2– On plant, equipment and vehicles 284,0 237,5– On capitalised leased assets — 0,2Amortisation– On trademarks 4,8 4,9– On license agreements, supplier relationships and
other intangibles 0,6 0,6– On other intangible assets 0,1 —
1,6 1,0Fees paid for administrative, managerial and technical services 96,4 76,7Operating lease charges– On land and buildings 43,8 41,9– On plant, equipment and vehicles 76,5 80,7Net loss on disposal of plant, equipment and vehicles 5,2 1,2Research, development and related expenditure 17,3 17,8IFRS 2 expenses– cash settled 62,6 18,0– equity settled, including BEE-related IFRS 2 expenses 56,3 29,0Staff costs 1 826,1 1 808,0Employer’s contribution to defined contribution retirement funding 143,4 123,0Employer’s contribution to medical aid 82,4 75,5
(26,3) (14,0) Foreign exchange profit (21,4) (24,9)

131Tiger Brands Annual Report 2010
Divisional reviews Governance and sustainability
▲
Annual financial statements
COMPANy GROUP2010 2009 (Rands in millions) 2010 2009
4. OPERATING INCOME (continued)
4.3 Directors’ emolumentsExecutive directors– salaries and bonuses 17,5 24,0– retirement, medical and other benefits 4,3 4,7Non-executive directors
3,9 3,4 – fees 3,9 3,4
3,9 3,4 Total directors’ emoluments 25,7 32,1Less: Paid by subsidiaries 21,8 28,7
3,9 3,4 Emoluments paid by company 3,9 3,4
Refer to page 69 of the remuneration report for further details pertaining to directors’ emoluments.
4.4 Directors’ service contractsNo directors have service contracts with notice periods of more than three months. Refer to page 66 for further information.
5. ABNORMAL ITEMS
5.1 Net profit/(loss) on sale of property, plant and equipment and intangibles, including impairment charges 0,4 (11,7)
— 355,1Net profit on sale of interest in subsidiaries and joint ventures — 62,7
— (4,3) Loss on sale of investments — (4,3)0,9 — Profit on sale of investments 1,0 234,3
— (29,8)Costs relating to the unsuccessful attempt to acquire AVI Limited — (29,8)
(60,9) (12,0) Empowerment transaction costs (188,4) (12,0)Release of provision for Sea Harvest put option — 81,4Release of provision for Healthcare unbundling costs — 1,1Recognition of pension fund surpluses 1,2 27,5
19,7 25,3 Exchange rate translation of Mauritian loan— (132,3) Impairment of investment in dormant subsidiary
(0,7) 3,4 Other (1,8) (5,3)
(41,0) 205,4 Abnormal (loss)/profit before taxation (187,6) 343,9(5,5) — Income tax expense 35,7 (36,7)
(46,5) 205,4 Attributable to shareholders in Tiger Brands Limited (151,9) 307,2
Abnormal items are items of income and expenditure which are not directly attributable to normal operations or where their size or nature are such that additional disclosure is considered appropriate.

132 Tiger Brands Annual Report 2010
Group at a glance Group review
Notes to the financial statements continuedfor the year ended 30 September 2010
COMPANy GROUP2010 2009 (Rands in millions) 2010 2009
5. ABNORMAL ITEMS (continued)
5.2 Asset impairmentsThe following asset impairments are included in abnormal items above.The impairments are shown before tax and non-controlling interests:Impairment of property, plant and equipment — (7,6)Impairment of intangible assets — (4,0)
— (11,6)
The value-in-use method was used in assessing impairments and the discount rate used was 11,0% (2009: 11,4%) for the whole group and 12,0% (2009: 16,0%) for Langeberg and Ashton Foods.
Included in abnormal items from continuing operations for 2009 is an amount of R4,0 million relating to the impairment of goodwill and trademarks in respect of the pre-prepared meals division of the Out Of Home business, as well as R7,6 million in respect of plant and equipment. The impairments were attributable to the expected reduction in the future profit stream of the business. Refer to note 13 for further details.
6. INTEREST(29,0) (82,8) 6.1 Interest paid (302,3) (436,3)
(15,8) (19,9) – Long-term borrowings (43,7) (52,3)(13,1) (62,8) – Bank and other short-term borrowings (246,0) (365,8)(0,1) (0,1) – Other (12,6) (18,2)
137,2 147,2 6.2 Interest received 220,1 181,6
21,2 28,0 – From subsidiary companies115,9 117,8 – From cash and cash equivalents 214,0 165,4
0,1 1,4 – From other sources 6,1 16,2
108,2 64,4 Net interest (paid)/received (82,2) (254,7)
7. DIVIDEND INCOME781,2 734,8 From subsidiary companies and joint ventures
From employer-controlled reserve invested by pension fund on behalf of Tiger Brands Limited 10,6 12,5
134,4 — From BEE empowerment entitiesFrom other investments
0,6 1,0 – listed 7,9 12,7— 0,1 – unlisted 0,1 5,3
916,2 735,9 18,6 30,5

133Tiger Brands Annual Report 2010
Divisional reviews Governance and sustainability
▲
Annual financial statements
COMPANy GROUP2010 2009 (Rands in millions) 2010 2009
8. TAXATION
42,2 27,5 8.1 South African current taxation 832,0 769,8— 115,5 Secondary tax on companies 8,0 122,5
0,5 — Foreign taxes 11,4 25,4
42,7 143,0 851,4 917,7(16,2) 1,1 Deferred taxation 31,2 21,1
(2,0) 1,1 – temporary differences 48,1 21,1(14,2) — – secondary tax on companies (16,9) —
26,5 144,1 882,6 938,8(0,1) (0,3) Adjustments in respect of previous years – current (4,9) 1,7
– foreign taxation 0,1 —– deferred (2,0) 0,6
26,4 143,8 875,8 941,1Taxation on abnormal items – current (23,1) 31,8
5,5 7,1 – deferred (12,6) 4,8
31,9 150,9 840,1 977,7
Income tax expense reported in the consolidated income statement for continuing operations 840,1 977,7Income tax attributable to discontinued operations — 19,7
840,1 997,4
% %8.2 The reconciliation of the effective rate of taxation with the
statutory taxation rate is as follows: % %
3,2 14,9Taxation for the year as a percentage of income before taxation 27,9 28,3
25,6 20,3 Dividend income 0,1 0,2(2,4) (4,7) Expenses and provisions not allowed for taxation (1,9) (1,1)1,4 (11,4) Secondary tax on companies 0,3 (3,5)— 0,1 Reversal of expenditure previously disallowed for taxation — 0,7— 8,8 Tax effect of capital profits (0,3) 1,2
Income from associates 2,3 1,6
0,2 —
Effect of differing rates of foreign taxes, prior year adjustments and timing differences not provided for and other sundries (0,4) 0,6
28,0 28,0 Rate of South African company taxation 28,0 28,0
(Rands in millions)
Tax effect of losses available to reduce future taxable income 39,1 —

134 Tiger Brands Annual Report 2010
Group at a glance Group review
Notes to the financial statements continuedfor the year ended 30 September 2010
COMPANy GROUP2010 2009 (Rands in millions) 2010 2009
8. TAXATION (continued)
8.3 Reconciliation of movement on deferred taxationMovement recognised in income statement this year
(16,2) 1,1 Current year charge 31,2 21,1Adjustments in respect of previous years (2,0) 0,6
5,5 7,1 Deferred tax on abnormal items (12,6) 4,8
(10,7) 8,2 16,6 26,5
Movement per deferred tax accounts(12,2) 0,9 (Increase)/decrease in deferred taxation asset (67,2) 22,1
1,5 7,3 Increase in deferred taxation liability 83,8 4,4
(10,7) 8,2 16,6 26,5
9. CALCULATION OF WEIGHTED AVERAGE NUMBER OF SHARES FOR HEADLINE EARNINGS PER SHARE AND BASIC EARNINGS PER SHARE PURPOSES
9.1 Opening balance of number of ordinary shares 163 233 594 162 716 406Weighted number of ordinary shares – issued 15 050 609 191 445Weighted number of shares held for BEE deal (20 090 901) (5 896 140)
Weighted average number of shares in issue 158 193 302 157 011 711
Anti-dilutive instruments not included in the weighted average number of shares in issue 459 357 239 700
9.2 Weighted average number of shares in issue 158 193 302 157 011 711Share options dilution 2 587 038 1 009 922
Adjusted number of ordinary shares for diluted headline and basic earnings per share purposes 160 780 340 158 021 633
9.3 Headline earnings (Rm) 2 203,5 2 209,8Income attributable to shareholders of the parent (Rm) 2 192,3 2 485,5

135Tiger Brands Annual Report 2010
Divisional reviews Governance and sustainability
▲
Annual financial statements
9. CALCULATION OF WEIGHTED AVERAGE NUMBER OF SHARES FOR HEADLINE EARNINGS PER SHARE AND BASIC EARNINGS PER SHARE PURPOSES (continued)
9.4 Reconciliation between profit for the year and headline earnings
(Rands in millions) Gross Tax Net
2010Profit attributable to shareholders of the parent 2 192,3Adjusted for:Loss on sale of property, plant and equipment 3,5 — 3,5Net profit on sale of investments (1,0) — (1,0)Associates 8,7 — 8,7
Impairment of goodwill 8,7 — 8,7
Headline earnings for the year 11,2 — 2 203,5
2009Profit attributable to shareholders of the parent 2 485,5Adjusted for:Net profit on sale of interest in subsidiaries and joint ventures (62,7) — (62,7)Loss on sale of property, plant and equipment, including impairment charge on intangibles 5,3 (1,8) 3,5Net profit on sale of investments (230,0) 33,2 (196,8)Associates (16,6) — (16,6)
Profit on sale of partial interest in subsidiary (16,6) — (16,6)
Other (3,6) 0,5 (3,1)
Headline earnings for the year (307,6) 31,9 2 209,8
9.5 Reconciliation between profit for the year and headline earningsDiscontinued operations2010Profit attributable to shareholders of the parentAdjusted for:Profit on sale of property, plant and equipment — — —
Headline earnings for the year — — —
2009Profit attributable to shareholders of the parent 41,1Adjusted for:Profit on sale of property, plant and equipment, including impairment charges on intangibles (1,7) 0,3 (1,4)
Headline earnings for the year (1,7) 0,3 39,7
GROUP2010 2009
9.6 Headline earnings per shareHeadline earnings per ordinary share (cents) 1 393 1 407Diluted headline earnings per ordinary share (cents) 1 371 1 398Headline earnings per ordinary share (cents) for continuing operations 1 393 1 382Diluted headline earnings per ordinary share (cents) for continuing operations 1 371 1 373Headline earnings per ordinary share (cents) for discontinued operations — 25Diluted headline earnings per ordinary share (cents) for discontinued operations — 25
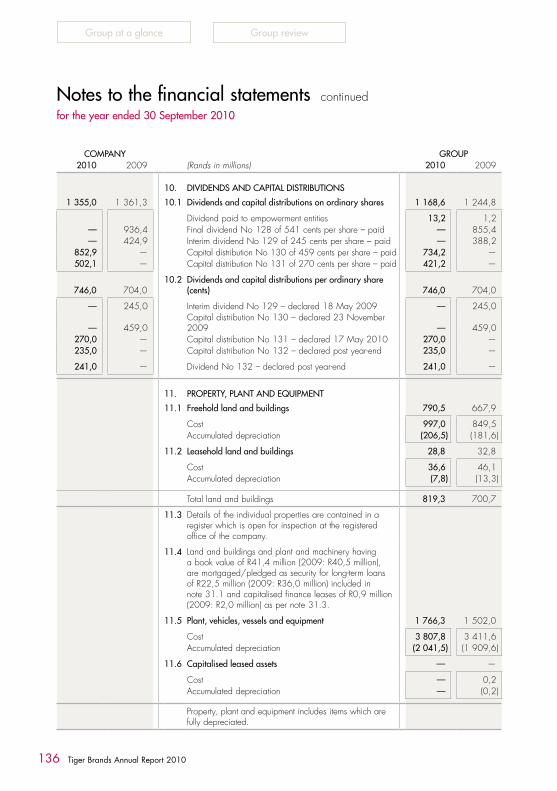
136 Tiger Brands Annual Report 2010
Group at a glance Group review
Notes to the financial statements continuedfor the year ended 30 September 2010
COMPANy GROUP2010 2009 (Rands in millions) 2010 2009
10. DIVIDENDS AND CAPITAL DISTRIBUTIONS
1 355,0 1 361,3 10.1 Dividends and capital distributions on ordinary shares 1 168,6 1 244,8
Dividend paid to empowerment entities 13,2 1,2— 936,4 Final dividend No 128 of 541 cents per share – paid — 855,4— 424,9 Interim dividend No 129 of 245 cents per share – paid — 388,2
852,9 — Capital distribution No 130 of 459 cents per share – paid 734,2 —502,1 — Capital distribution No 131 of 270 cents per share – paid 421,2 —
746,0 704,010.2 Dividends and capital distributions per ordinary share
(cents) 746,0 704,0
— 245,0 Interim dividend No 129 – declared 18 May 2009 — 245,0
— 459,0Capital distribution No 130 – declared 23 November 2009 — 459,0
270,0 — Capital distribution No 131 – declared 17 May 2010 270,0 —235,0 — Capital distribution No 132 – declared post year-end 235,0 —
241,0 — Dividend No 132 – declared post year-end 241,0 —
11. PROPERTy, PLANT AND EQUIPMENT
11.1 Freehold land and buildings 790,5 667,9
Cost 997,0 849,5Accumulated depreciation (206,5) (181,6)
11.2 Leasehold land and buildings 28,8 32,8
Cost 36,6 46,1Accumulated depreciation (7,8) (13,3)
Total land and buildings 819,3 700,7
11.3 Details of the individual properties are contained in a register which is open for inspection at the registered office of the company.
11.4 Land and buildings and plant and machinery having a book value of R41,4 million (2009: R40,5 million), are mortgaged/pledged as security for long-term loans of R22,5 million (2009: R36,0 million) included in note 31.1 and capitalised finance leases of R0,9 million (2009: R2,0 million) as per note 31.3.
11.5 Plant, vehicles, vessels and equipment 1 766,3 1 502,0
Cost 3 807,8 3 411,6Accumulated depreciation (2 041,5) (1 909,6)
11.6 Capitalised leased assets — —
Cost — 0,2Accumulated depreciation — (0,2)
Property, plant and equipment includes items which are fully depreciated.
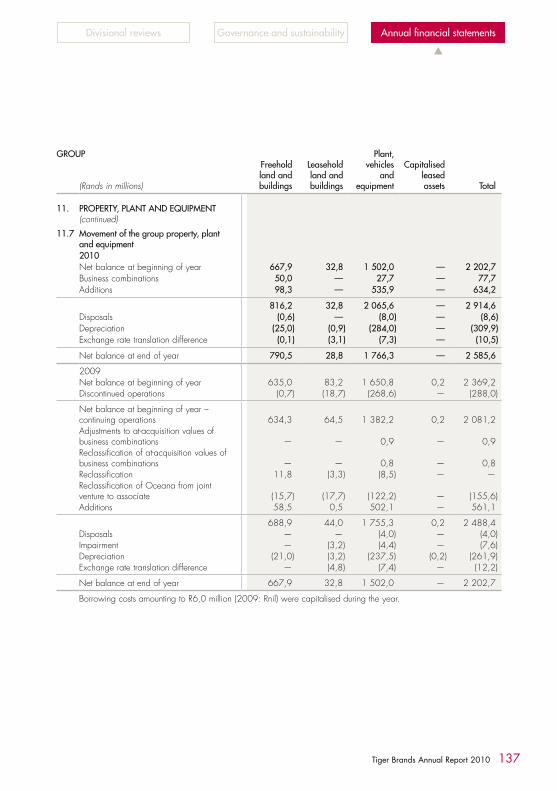
137Tiger Brands Annual Report 2010
Divisional reviews Governance and sustainability
▲
Annual financial statements
GROUP
(Rands in millions)
Freehold land andbuildings
Leaseholdland andbuildings
Plant,vehicles
andequipment
Capitalisedleasedassets Total
11. PROPERTy, PLANT AND EQUIPMENT (continued)
11.7 Movement of the group property, plant and equipment2010Net balance at beginning of year 667,9 32,8 1 502,0 — 2 202,7Business combinations 50,0 — 27,7 — 77,7Additions 98,3 — 535,9 — 634,2
816,2 32,8 2 065,6 — 2 914,6Disposals (0,6) — (8,0) — (8,6)Depreciation (25,0) (0,9) (284,0) — (309,9)Exchange rate translation difference (0,1) (3,1) (7,3) — (10,5)
Net balance at end of year 790,5 28,8 1 766,3 — 2 585,6
2009Net balance at beginning of year 635,0 83,2 1 650,8 0,2 2 369,2Discontinued operations (0,7) (18,7) (268,6) — (288,0)
Net balance at beginning of year – continuing operations 634,3 64,5 1 382,2 0,2 2 081,2Adjustments to at-acquisition values of business combinations — — 0,9 — 0,9Reclassification of at-acquisition values of business combinations — — 0,8 — 0,8Reclassification 11,8 (3,3) (8,5) — —Reclassification of Oceana from joint venture to associate (15,7) (17,7) (122,2) — (155,6)Additions 58,5 0,5 502,1 — 561,1
688,9 44,0 1 755,3 0,2 2 488,4Disposals — — (4,0) — (4,0)Impairment — (3,2) (4,4) — (7,6)Depreciation (21,0) (3,2) (237,5) (0,2) (261,9)Exchange rate translation difference — (4,8) (7,4) — (12,2)
Net balance at end of year 667,9 32,8 1 502,0 — 2 202,7
Borrowing costs amounting to R6,0 million (2009: Rnil) were capitalised during the year.

138 Tiger Brands Annual Report 2010
Group at a glance Group review
Notes to the financial statements continuedfor the year ended 30 September 2010
GROUP(Rands in millions) 2010 2009
12. GOODWILL AND INTANGIBLE ASSETS
12.1 Trademarks 807,0 561,9
Cost 825,7 575,7Accumulated amortisation (18,7) (13,8)
12.2 Goodwill 1 156,1 1 083,8
Cost 1 272,2 1 185,2Adjustments to at-acquisition values of business combinations — 14,7Accumulated impairment/amortisation (116,1) (116,1)
12.3 Licence agreements and supplier relationships 22,6 23,2
Cost 25,0 25,8Reclassification of at-acquisition values of business combinations — (0,8)Accumulated amortisation (2,4) (1,8)
12.4 Other intangible assets 0,1 0,2
Cost 0,3 0,3Accumulated amortisation (0,2) (0,1)
Total goodwill and intangible assets 1 985,8 1 669,1

139Tiger Brands Annual Report 2010
Divisional reviews Governance and sustainability
▲
Annual financial statements
GROUP
(Rands in millions)Trade-marks Goodwill
Licenceagreements
and supplierrelationships
Fishingrights
Otherintangible
assets Total
12. GOODWILL AND INTANGIBLE ASSETS (continued)
12.5 Goodwill and intangible assetsMovement of group goodwill and intangible assets2010Net balance at beginning of year 561,9 1 083,8 23,2 — 0,2 1 669,1Business combinations 250,0 72,3 — — — 322,3
811,9 1 156,1 23,2 — 0,2 1 991,4Amortisation (4,9) — (0,6) — (0,1) (5,6)
Net balance at end of year 807,0 1 156,1 22,6 — 0,1 1 985,8
2009Net balance at beginning of year 576,9 1 093,3 25,8 17,7 0,2 1 713,9Adjustment to accumulated amortisation — — (1,2) — — (1,2)Discontinued operations — — — (17,7) — (17,7)
Net balance at beginning of year – Continuing operations 576,9 1 093,3 24,6 — 0,2 1 695,0Reclassification of at-acquisition values of business combinations — — (0,8) — — (0,8)Business combinations — 14,7 — — — 14,7Reclassification of Oceana from joint venture to listed associate (9,1) (19,6) — — — (28,7)
567,8 1 088,4 23,8 — 0,2 1 680,2Amortisation (4,9) — (0,6) — — (5,5)Impairment (0,2) (3,8) — — — (4,0)Exchange rate translation difference (0,8) (0,8) — — — (1,6)
Net balance at end of year 561,9 1 083,8 23,2 — 0,2 1 669,1

140 Tiger Brands Annual Report 2010
Group at a glance Group review
Notes to the financial statements continuedfor the year ended 30 September 2010
GROUP(Rands in millions) 2010 2009
12. GOODWILL AND INTANGIBLE ASSETS (continued)
12.5 Goodwill and intangible assets (continued)The carrying value of goodwill at 30 September 2010 is allocated to cash generating units as follows:African acquisitions 32,4 32,4Bromor 580,5 580,5Crosse & Blackwell 72,3 —Designer Group 308,4 308,4Enterprise 6,0 6,0Home and Personal care 156,5 156,5
1 156,1 1 083,8
Trademarks comprise well-established, growing brands. Except for trademarks with a cost of R60,9 million (2009: R60,9 million) which are amortised, the brand portfolio is considered to have indefinite useful lives and are therefore not amortised. Refer to the accounting policies for further details on amortisation.
13. IMPAIRMENT TESTING OF GOODWILL AND INTANGIBLES WITH INDEFINITE LIVESAnnually or if there is an indication of impairment, all indefinite life intangible assets and goodwill are assessed for impairment. Goodwill acquired through business combinations, trademarks, licence agreements, supplier relationships and restraint of trade agreements has been allocated to cash-generating units to facilitate this assessment.
The key assumptions disclosed below are based on management’s experience and expectations. Based on this experience and the well-established brands the group owns, management considers forecast cashflow periods in excess of five years to be appropriate.
13.1 Methods and assumptionsThe group applies a discounted cash flow methodology to assess goodwill and certain indefinite life intangible assets for impairment. This methodology entails a calculation of the present value of future cash flows generated by applicable cash-generating units over a period of 10 years and incorporates a terminal growth rate.
These cash flows are based on forecasts which include assumptions on profit before interest and tax, depreciation, working capital movements, capital maintenance expenditure, an appropriate discount rate and a terminal growth rate. The terminal growth rate used is 1% (2009: 1%), however it is dependent on the industry and maturity of the cash generating unit.
TrademarksThe group applies the “relief-from-royalty” valuation methodology to value trademark assets. This methodology entails quantifying royalty payments, which would be required if the trademark were owned by a third party and licensed to the company.
Main inputs used are forecast future sales, a notional royalty rate payable in an arm’s length transaction and an appropriate discount rate.
Customer listsThe group applies the “excess earnings” valuation methodology to value customer lists. The method is based on apportioning the returns earned by a business across its tangible and intangible assets.
Main inputs used were forecast sales to which the customer relationships contribute and estimated cash flows earned from these sales, a tax rate of 28% (2009: 28%) and a required rate of return.
13.2 Discount ratesDiscount rates applied range from 11,0% to 12,0% (2009: 11,4% to 16,0%) as applicable to the cash generating unit.
The discounted cash flow models are most sensitive to the discount rates, although reasonably possible movements in the discount rate of 1% do not result in any material movements to recoverable amounts which could cause them to be exceeded by carrying amounts.
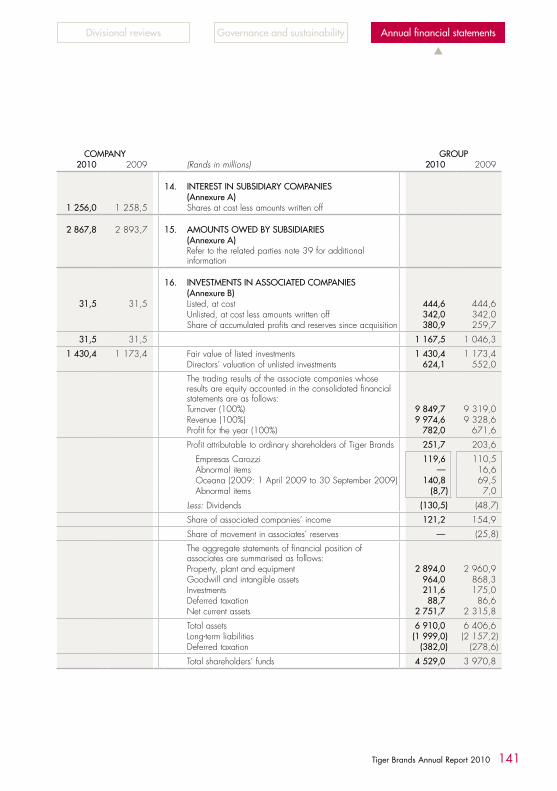
141Tiger Brands Annual Report 2010
Divisional reviews Governance and sustainability
▲
Annual financial statements
COMPANy GROUP2010 2009 (Rands in millions) 2010 2009
14. INTEREST IN SUBSIDIARy COMPANIES(Annexure A)
1 256,0 1 258,5 Shares at cost less amounts written off
2 867,8 2 893,7 15. AMOUNTS OWED By SUBSIDIARIES(Annexure A)Refer to the related parties note 39 for additional information
16. INVESTMENTS IN ASSOCIATED COMPANIES(Annexure B)
31,5 31,5 Listed, at cost 444,6 444,6Unlisted, at cost less amounts written off 342,0 342,0Share of accumulated profits and reserves since acquisition 380,9 259,7
31,5 31,5 1 167,5 1 046,3
1 430,4 1 173,4 Fair value of listed investments 1 430,4 1 173,4Directors’ valuation of unlisted investments 624,1 552,0
The trading results of the associate companies whose results are equity accounted in the consolidated financial statements are as follows:Turnover (100%) 9 849,7 9 319,0Revenue (100%) 9 974,6 9 328,6Profit for the year (100%) 782,0 671,6
Profit attributable to ordinary shareholders of Tiger Brands 251,7 203,6
Empresas Carozzi 119,6 110,5 Abnormal items — 16,6 Oceana (2009: 1 April 2009 to 30 September 2009) 140,8 69,5 Abnormal items (8,7) 7,0
Less: Dividends (130,5) (48,7)
Share of associated companies’ income 121,2 154,9
Share of movement in associates’ reserves — (25,8)
The aggregate statements of financial position of associates are summarised as follows:Property, plant and equipment 2 894,0 2 960,9Goodwill and intangible assets 964,0 868,3Investments 211,6 175,0Deferred taxation 88,7 86,6Net current assets 2 751,7 2 315,8
Total assets 6 910,0 6 406,6Long-term liabilities (1 999,0) (2 157,2)Deferred taxation (382,0) (278,6)
Total shareholders’ funds 4 529,0 3 970,8

142 Tiger Brands Annual Report 2010
Group at a glance Group review
Notes to the financial statements continuedfor the year ended 30 September 2010
COMPANy GROUP2010 2009 (Rands in millions) 2010 2009
16. INVESTMENTS IN ASSOCIATED COMPANIES (continued)16.1 Oceana
On 1 April 2009 the group ceased proportional consolidation of Oceana and commenced equity accounting. The results of Oceana for the six months to 31 March 2009, which were included in the group results, are presented below:Turnover — 730,6
Operating income before abnormal items — 78,5Abnormal items — 1,5Interest paid — (3,7)Interest received — 5,5Dividends received — 5,2Profit before tax — 87,0
Taxation — (28,4)
Profit for the year — 58,6
The results of Empresas Carozzi for the 12 months ended 31 August 2010 have been used in preparation of these financial statements. The management accounts represent the latest available financial information which have been subject to a limited review by the associate company auditors. There have been no material differences noted in the associate’s results during September 2010. Empresas Carozzi operates in various food categories as outlined on page 45.
With effect from 1 April 2009, the company no longer had joint control of Oceana. It was reclassified as an associate and is therefore equity accounted whereas previously it was a joint venture which was proportionately consolidated.
17. OTHER INVESTMENTS(Annexure C)
— — Listed, at fair value 388,6 303,24,5 6,1 Unlisted, at fair value 4,5 6,1
Employer-controlled reserve invested by pension fund on behalf of Tiger Brands Limited 142,7 132,1
1 610,4 — BEE Phase II empowerment entities preference shares
211,8 155,5Notional investment in subsidiary companies in terms of IFRS 2
1 826,7 161,6 535,8 441,4
— — Fair value of listed investments 388,6 303,2
4,5 6,1Directors’ valuation of unlisted investments and employer-controlled reserve 147,2 138,2
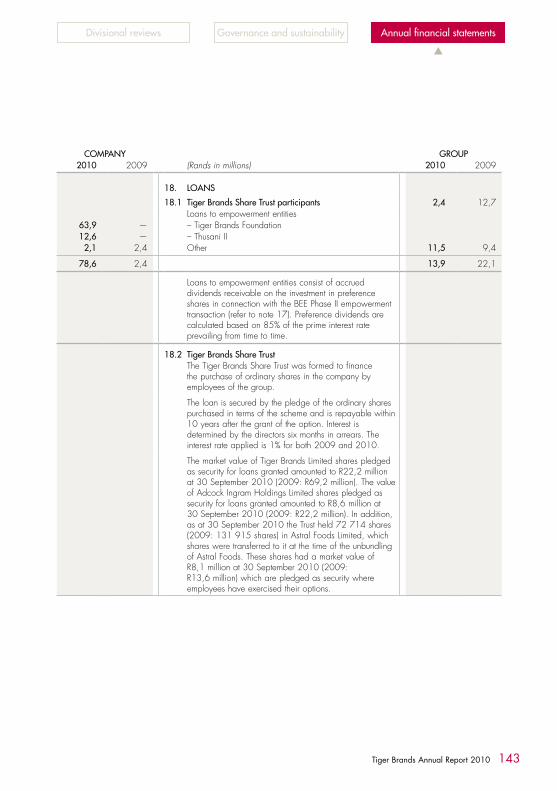
143Tiger Brands Annual Report 2010
Divisional reviews Governance and sustainability
▲
Annual financial statements
COMPANy GROUP2010 2009 (Rands in millions) 2010 2009
18. LOANS
18.1 Tiger Brands Share Trust participants 2,4 12,7Loans to empowerment entities
63,9 — – Tiger Brands Foundation12,6 — – Thusani II
2,1 2,4 Other 11,5 9,4
78,6 2,4 13,9 22,1
Loans to empowerment entities consist of accrued dividends receivable on the investment in preference shares in connection with the BEE Phase II empowerment transaction (refer to note 17). Preference dividends are calculated based on 85% of the prime interest rate prevailing from time to time.
18.2 Tiger Brands Share TrustThe Tiger Brands Share Trust was formed to finance the purchase of ordinary shares in the company by employees of the group.
The loan is secured by the pledge of the ordinary shares purchased in terms of the scheme and is repayable within 10 years after the grant of the option. Interest is determined by the directors six months in arrears. The interest rate applied is 1% for both 2009 and 2010.
The market value of Tiger Brands Limited shares pledged as security for loans granted amounted to R22,2 million at 30 September 2010 (2009: R69,2 million). The value of Adcock Ingram Holdings Limited shares pledged as security for loans granted amounted to R8,6 million at 30 September 2010 (2009: R22,2 million). In addition, as at 30 September 2010 the Trust held 72 714 shares (2009: 131 915 shares) in Astral Foods Limited, which shares were transferred to it at the time of the unbundling of Astral Foods. These shares had a market value of R8,1 million at 30 September 2010 (2009: R13,6 million) which are pledged as security where employees have exercised their options.

144 Tiger Brands Annual Report 2010
Group at a glance Group review
Notes to the financial statements continuedfor the year ended 30 September 2010
COMPANy GROUP2010 2009 (Rands in millions) 2010 2009
19. DEFERRED TAXATION ASSET
19.1 Movement of deferred taxation asset2,0 4,9 Balance at beginning of year 238,9 89,2
— (2,0)Net reallocation between deferred taxation asset and deferred taxation liability (refer note 28.1) 11,1 177,7
2,0 2,9 Adjusted balance at beginning of year 250,0 266,9Reclassification of Oceana from joint venture to listed associate — (3,0)Adjustment in respect of disposals of businesses — (1,0)Exchange rate translation reserve (0,2) (1,9)
12,2 (0,9) Income statement movement 67,2 (22,1)
12,2 (0,9) – current year timing differences 67,2 (22,1)
14,2 2,0 Balance at end of year (refer to note 28.1) 317,0 238,9
19.2 Analysis of deferred taxation asset— 2,0 Pension fund surpluses — 2,1
14,2 — Secondary tax on companies 17,0 —Losses available for offset against future taxable income 39,1 —Provisions 227,3 217,6Other temporary differences 33,6 19,2
14,2 2,0 317,0 238,9
Losses available for offset against future taxable income have been recognised as it is probable that there will be future taxable income against which the assessed loss may be utilised.

145Tiger Brands Annual Report 2010
Divisional reviews Governance and sustainability
▲
Annual financial statements
COMPANy GROUP2010 2009 (Rands in millions) 2010 2009
20. INVENTORIESRaw materials 1 034,2 1 162,9Partly processed goods 42,4 37,0Finished goods and merchandise 1 616,5 1 685,7Consumable stores and spares 193,7 156,7Other 11,9 17,6
2 898,7 3 059,9
Inventories to the value of R134,1 million (2009: R89,6 million) are carried at net realisable value.The amount of write-down of inventories recognised as an expense is R21,0 million (2009: R34,1 million).This expense is included in cost of sales. Refer to note 4.1.
21. TRADE AND OTHER RECEIVABLES
21.1 Analysis of trade and other receivablesTrade receivables* 2 497,4 2 321,8
— 0,1 Tax overpaidPrepayments 64,7 79,3
7,0 17,8 Sundry receivables 367,8 326,0
7,0 17,9 2 929,9 2 727,1Impairment provision (54,6) (55,9)
Trade receivables (54,6) (55,9)Sundry receivables — —
7,0 17,9 2 875,3 2 671,2
Trade receivables, which generally have 30 – 60 day terms, are recognised and carried at original invoice amount less an allowance for any uncollectable amounts.
* Certain 2009 provisions against receivables were reclassified to align with 2010 disclosure.
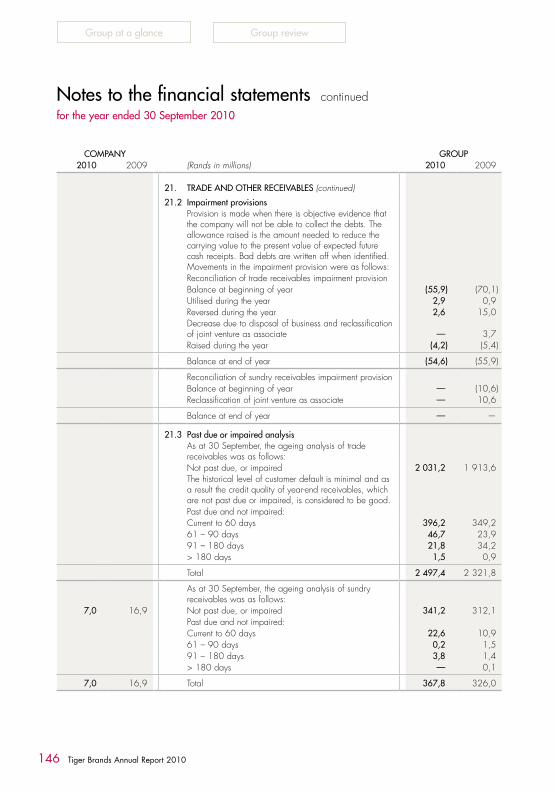
146 Tiger Brands Annual Report 2010
Group at a glance Group review
Notes to the financial statements continuedfor the year ended 30 September 2010
COMPANy GROUP2010 2009 (Rands in millions) 2010 2009
21. TRADE AND OTHER RECEIVABLES (continued)
21.2 Impairment provisionsProvision is made when there is objective evidence that the company will not be able to collect the debts. The allowance raised is the amount needed to reduce the carrying value to the present value of expected future cash receipts. Bad debts are written off when identified. Movements in the impairment provision were as follows:Reconciliation of trade receivables impairment provisionBalance at beginning of year (55,9) (70,1)Utilised during the year 2,9 0,9Reversed during the year 2,6 15,0Decrease due to disposal of business and reclassification of joint venture as associate — 3,7Raised during the year (4,2) (5,4)
Balance at end of year (54,6) (55,9)
Reconciliation of sundry receivables impairment provisionBalance at beginning of year — (10,6)Reclassification of joint venture as associate — 10,6
Balance at end of year — —
21.3 Past due or impaired analysisAs at 30 September, the ageing analysis of trade receivables was as follows:Not past due, or impaired 2 031,2 1 913,6The historical level of customer default is minimal and as a result the credit quality of year-end receivables, which are not past due or impaired, is considered to be good.Past due and not impaired:Current to 60 days 396,2 349,261 – 90 days 46,7 23,991 – 180 days 21,8 34,2> 180 days 1,5 0,9
Total 2 497,4 2 321,8
As at 30 September, the ageing analysis of sundry receivables was as follows:
7,0 16,9 Not past due, or impaired 341,2 312,1Past due and not impaired:Current to 60 days 22,6 10,961 – 90 days 0,2 1,591 – 180 days 3,8 1,4> 180 days — 0,1
7,0 16,9 Total 367,8 326,0

147Tiger Brands Annual Report 2010
Divisional reviews Governance and sustainability
▲
Annual financial statements
COMPANy GROUP2010 2009 (Rands in millions) 2010 2009
21. TRADE AND OTHER RECEIVABLES (continued)21.4 Trade receivable analysis
Industry spread of trade receivables:Retail 1 277,7 1 251,5Wholesale/Distributors 1 028,5 905,3Export 139,1 135,9Other 52,1 29,1
Total 2 497,4 2 321,8
Geographical spread of trade receivables:South Africa 2 177,2 2 039,4Rest of Africa 221,4 191,3Europe 33,3 41,7Rest of the world 65,5 49,4
Total 2 497,4 2 321,8
21.5 Collateral held and pledgedCollateral pledgedA subsidiary of the group has pledged trade receivables with a carrying amount of R192,5 million (2009: R182,2 million) as security for a loan from the Landbank with a carrying amount of R405,8 million (2009: R323,5 million).Collateral heldFair value of collateral held 11,1 11,6
Collateral held represents hawker deposits which may be applied against accounts which are in default.
22. CASH AND CASH EQUIVALENTS491,2 414,0 Cash 921,3 506,2
491,2 414,0 921,3 506,2

148 Tiger Brands Annual Report 2010
Group at a glance Group review
Notes to the financial statements continuedfor the year ended 30 September 2010
23. SHARE-BASED PAyMENT PLANS
23.1 General employee share-option planCertain senior employees are entitled to receive options based on merit. Options are issued annually by the board of directors of the company.Options vest as follows: a third after three years, a third after four years and a third after five years. The exercise price is determined in accordance with the rules of the scheme.From January 2006 a new option scheme was adopted by the company. The new scheme is a cash-settled option scheme, which replaces the previous equity-settled share option scheme.The expense recognised for employee services received during the year to 30 September 2010 is R62,6 million (2009: R18,0 million). The portion of that expense arising from equity-settled share-based payment transactions is R0,2 million (2009: R0,8 million).Equity settledThe following table illustrates the number and weighted average exercise prices (WAEP) of, and movements in, share options during the year:
2010 2009Number WAEP Number WAEP
Outstanding at beginning of year 1 490 230 52,10 1 856 518 52,56Reinstated during the year — — 3 000 33,29Disposal of Sea Harvest — — (2 400) 75,13Forfeited during the year (2 700) 51,29 (31 400) 74,37Exercised during the year2 (74 800) 57,76 (335 488) 52,24Outstanding at end of year1 1 412 730 51,80 1 490 230 52,10
Exercisable at end of year 1 409 330 51,67 1 371 130 49,891 Included within the number of options outstanding at the end of the year are options over 310 400 shares that have not been recognised in accordance with IFRS 2 as the options were granted on or before 7 November 2002. These options have not been subsequently modified and therefore do not need to be accounted for in accordance with IFRS 2.
2 The weighted average share price at the date of exercise for the options exercised is R175,46 (2009: R140,49). The weighted average remaining contractual life for share options outstanding as at 30 September 2010 is 2,87 years (2009: 3,88 years).
The range of exercise prices for options outstanding at the end of the year was R39,42 – R106,67 (2009: R32,72 – R106,67).The observable volatility in the market was the basis upon which the options were valued.Share options were fair valued using a modified Black-Schöles model.The following inputs were used:
Date of grantStrike price
(Rand) Expiry date
Market price ofthe underlyingstock at grant
date (Rand)
Expectedvolatility of thestock over theremaining life
of option(%)
Dividendcover(times)
03/02/2003 69,16 02/02/2013 66,11 22,0 2,708/08/2003 69,76 07/08/2013 70,55 22,0 2,729/01/2004 80,02 28/01/2014 82,65 18,0 2,528/02/2004 82,16 27/02/2014 84,66 18,0 2,501/08/2004 89,08 31/07/2014 89,70 19,0 2,525/01/2005 95,09 24/01/2015 95,36 18,0 2,018/05/2005 97,93 17/05/2015 100,69 18,0 2,001/07/2005 107,70 30/06/2015 113,74 19,0 2,001/09/2005 125,60 31/08/2015 131,80 19,0 2,0
The interest rate yield curve was derived from the Nedbank Treasury calculation.

149Tiger Brands Annual Report 2010
Divisional reviews Governance and sustainability
▲
Annual financial statements
23. SHARE BASED PAyMENT PLANS (continued)
23.1 General employee share-option plan (continued)Cash settledThe following table illustrates the number and weighted average exercise prices (WAEP) of, and movements in, cash-settled options during the year:
2010 2009Number WAEP Number WAEP
Outstanding at beginning of year 2 063 520 129,57 1 723 677 124,69Sale of Sea Harvest — — (6 455) 118,13Granted during the year 1 082 900 172,17 574 800 141,91Forfeited during the year (58 871) 132,82 (200 012) 124,72Exercised during the year (54 386) 127,45 (28 490) 119,83Outstanding at end of year1 3 033 163 144,75 2 063 520 129,57
Exercisable at end of year 230 336 123,31 87 655 118,131 The weighted average remaining contractual life for cash-settled options outstanding as at 30 September 2010 is 4,07 years (2009: 4,32).
The weighted average fair value of options granted during the year was R44,65 per option (2009: R35,56).The range of exercise prices for options outstanding at the end of the year was R106,44 – R176,39 (2009: R106,44 – R141,91).Cash options were valued using a modified Black-Schöles model taking into account the dividend cover, expected exercise pattern and volatility of the Tiger Brands share price.The following inputs were used:
Date of grant
Strike priceof option
(Rand) Expiry date
Market price ofthe underlyingstock at grant
date (Rand)
Expectedvolatility of thestock over theremaining life
of option(%)
Expecteddividend
cover(times)
21/06/2010 176,39 20/06/2016 177,00 25,4 2,003/02/2010 172,07 02/02/2016 176,50 25,0 2,006/07/2009 141,63 05/07/2015 144,01 25,3 2,002/02/2009 141,91 01/02/2015 137,60 24,5 2,016/09/2008 131,35 15/09/2014 137,00 25,6 2,001/04/2008 106,44 31/03/2014 132,90 24,4 2,022/01/2008 130,59 21/01/2014 146,50 23,8 2,030/03/2007 136,53 29/03/2013 177,00 23,1 2,022/01/2007 133,39 21/01/2013 172,51 22,4 2,008/05/2006 133,61 07/05/2012 170,00 20,7 2,021/04/2006 130,43 20/04/2012 171,00 20,6 2,026/01/2006 118,13 25/01/2012 162,00 19,2 2,0
The interest rate yield curve was derived from the Nedbank Treasury calculation. The average volatility was 24,0% and the risk-free rate ranged from 5,9% to 7,0% during the year.The carrying amount of the liability relating to the cash-settled options at 30 September 2010 is R94,7 million (2009: R35,2 million). Cash-settled options exercised during the year amounted to R3,4 million (2009: R0,8 million).

150 Tiger Brands Annual Report 2010
Group at a glance Group review
Notes to the financial statements continuedfor the year ended 30 September 2010
23. SHARE-BASED PAyMENT PLANS (continued)
23.2 Black Managers participation right scheme (equity-settled)In terms of the BEE transaction implemented on 17 October 2005, 4 381 831 Tiger Brands shares were acquired by the Tiger Brands Black Managers Trust. Allocations of vested rights to these shares were made to 435 black managers. The allocation of vested rights entitles beneficiaries to receive Tiger Brands shares (after making capital contributions to the Black Managers Trust) at any time after the defined lock-in period, i.e. from 1 January 2015. These vested rights are non-transferable.From 1 January 2015, the beneficiaries may exercise their vested rights, in which event the beneficiary may:– instruct trustees to sell all their shares and distribute the proceeds to them, net of the funds required to pay the
capital contributions, taxation (including employees’ tax), costs and expenses;– instruct the trustees to sell sufficient shares to fund the capital contributions, pay the taxation (including employees’
tax), costs and expenses, and distribute to them the remaining shares to which they are entitled; or– fund the capital contributions, taxation (including employees’ tax) costs and expenses themselves and receive the
shares to which they are entitled.The expense recognised for employee services received during the year to 30 September 2010 is R35,0 million (2009: R30,4 million).The following table illustrates the number of, and movements in, share participation rights during the year:
2010 2009Number Number
Outstanding at beginning of year 2 719 700 2 217 400Granted during the year 491 793 689 400Forfeited during the year (212 031) (187 100)Shares sold (death of employees) (39 405) —Outstanding at end of year 2 960 057 2 719 700
Exercisable at end of year — —
The weighted average remaining contractual life for share options outstanding as at 30 September 2010 is 4,25 years (2009: 5,25 years).The weighted average fair value of options granted during the year was R81,83 (2009: R67,46).The notional exercise price of participation rights at 30 September 2010 was R94,54 per option (2009: R95,06).No weighted average exercise price has been calculated as there were no participation rights exercised.Participation rights were valued using the Monte-Carlo simulation approach to estimate the average, optimal payoff of the participation rights using 5 000 permutations. The payoff of each random path was based on: the projected Tiger Brands share price, outstanding debt projections and optimal early exercise conditions.The following inputs were used:
Date of grant
Initial strikeprice of the
participationrights(Rand) Expiry date
Market price ofthe underlyingstock at grant
date (Rand)
Expectedvolatility of thestock over the
remaining life ofthe participation
right(%)
Expecteddividend yield ofthe stock over theremaining life ofthe participation
right(%)
01/11/2005 112,28 30/09/2027 140,00 22,0 3,631/01/2006 110,90 30/09/2027 159,90 25,0 3,631/07/2006 112,89 30/09/2027 150,00 25,0 3,631/01/2007 112,99 30/09/2027 172,30 30,4 3,531/07/2007 115,17 30/09/2027 186,70 27,8 3,531/01/2008 115,43 30/09/2027 151,00 27,5 4,031/07/2008 117,91 30/09/2027 145,00 28,1 4,231/01/2009 91,46 30/09/2027 140,99 28,5 4,731/07/2009 93,97 30/09/2027 157,00 28,7 4,431/12/2009 96,71 30/09/2027 171,11 28,7 4,4
The risk-free interest rate was obtained from the Standard Bank, zero-coupon South African bond curves.

151Tiger Brands Annual Report 2010
Divisional reviews Governance and sustainability
▲
Annual financial statements
23. SHARE-BASED PAyMENT PLANS (continued)
23.3 Black Managers Trust II and Brimstone participation right schemes (equity settled)In terms of the BEE Phase II transaction implemented on 20 October 2009, 2 835 427 Tiger Brands shares were acquired by the Black Managers Trust II and 1 813 613 shares by Brimstone Investment Corporation Limited (“Brimstone”).BrimstoneBrimstone is required to hold its shares via Business Venture Investments No 1323 (Proprietary) Limited (“Brimstone SPV”). Brimstone and the Brimstone SPV may not sell or encumber such shares until 31 December 2017 (the “end date”). The IFRS 2 charge of R61,9 million relating to Brimstone has been expensed upfront as an abnormal item in 2010.At the end date, Tiger Brands will be entitled to repurchase a certain number of shares from Brimstone at the subscription price of R7,40. The number of shares will be calculated in terms of a repurchase formula, whose primary inputs are:– the total discounted value of the shares (being an amount equal to R148,07 per share) less the initial equity
contribution by Brimstone, increased over the transaction term by a hurdle rate (being 85% of the prevailing prime rate);– an amount equal to 85% of the distributions declared by Tiger Brands but not received by Brimstone SPV as a
result of the condition attaching to the issue of the shares, increased over the transaction term by the hurdle rate;– the market value of a Tiger Brands ordinary share at the end date; and– the subscription price of R7,40 per share.Black Managers Trust IIAllocations of vested rights to these shares were made to a total number of 484 black managers and are non-transferable.The effective dates of these allocations were 31 January 2010 and 31 July 2010. Where participants forfeit their rights in terms of the scheme rules, such rights may be reissued to new participants.With effect from 31 December 2017, the black managers may elect to take delivery of the full benefit of a portion of the shares allocated to them in accordance with their vested rights (after Tiger Brands has exercised its rights to repurchase a certain number of the shares from the Black Managers Trust II at the subscription price of 10 cents per share).The number of shares to be repurchased by Tiger Brands will be calculated in terms of a repurchase formula, the inputs of which are similar to those as disclosed under the “Brimstone” heading above, other than for the fact that 90% of any distributions declared by Tiger Brands are not received by the Black Managers Trust II (as opposed to 85% in the case of Brimstone SPV) and the subscription price is 10 cents per share (as opposed to R7,40 in the case of the Brimstone SPV).Upon termination of the trust on 31 December 2018, the black managers shall take delivery of all benefits due to them, failing which these will be forfeited, and the Trustees shall transfer those benefits and any unallocated Tiger Brands ordinary shares, or the net proceeds thereof, to the black managers who are beneficiaries of the Black Managers Trust II at that time.In calculating the IFRS 2 charge, the following input parameters were utilised to determine the fair value of the rights granted to the beneficiaries of the Black Managers Trust II in terms of the BEE Phase II transaction:– The allocation date;– The maturity date of the rights;– The market price of the underlying equity as at the valuation date;– The strike price of the rights;– The expected volatility of the underlying equity over the life of the rights;– The expected dividend yield on the underlying equity over the life of the rights;– The risk-free interest rates over the life of the rights; and– The prime interest rates over the life of the rights.Participation rights were valued using the Monte-Carlo simulation approach with the “market variable” being the Tiger Brands share price. The path-dependency of the option results from the relationship between the Tiger Brands share price and the strike price of the option, by virtue of the impact on the strike price of dividends paid by Tiger Brands during the life of the BEE Phase II transaction.A risk-free rate was constructed using a zero-coupon ZAR swap interest rate curve as at the valuation date using a raw interpolation bootstrapping algorithm, with inputs from South African money-market rates (interbank acceptance rates and Forward Rate Agreement (“FRA”) rates) and swap rates, as published by Bloomberg.The following table illustrates the number of, and movements in, share participation rights during the year:
2010Number
2009Number
Outstanding at beginning of year — —Granted during the year 2 954 100 —Forfeited during the year (126 376) —Shares sold (death of employees) (1 069) —Outstanding at end of year 2 826 655 —
Exercisable at end of year — —

152 Tiger Brands Annual Report 2010
Group at a glance Group review
Notes to the financial statements continuedfor the year ended 30 September 2010
COMPANy GROUP2010 2009 (Rands in millions) 2010 2009
24. AUTHORISED SHARE CAPITAL
25,0 25,024.1 250 000 000 (2009: 250 000 000) ordinary shares
of 10 cents each 25,0 25,0
25,0 25,0 25,0 25,0
Number of shares Number of shares
1 879 863 2 181 99624.2 Number of outstanding options in terms of the company’s
share option scheme
— 1 400 At R36,69 per share, exercisable until 8 November 2009— 1 700 At R32,72 per share, exercisable until 13 October 2010— 28 300 At R33,74 per share, exercisable until 14 November 2010
1 700 1 733 At R39,42 per share, exercisable until 1 September 2011429 733 484 133 At R36,53 per share, exercisable until 29 January 2012450 930 530 130 At R44,33 per share, exercisable until 3 February 201369 200 74 900 At R44,33 per share, exercisable until 31 March 2013
545 300 599 800 At R51,29 per share, exercisable until 29 January 2014356 000 428 200 At R75,13 per share, exercisable until 25 January 2015
— 4 700 At R77,22 per share, exercisable until 18 May 201510 000 10 000 At R85,10 per share, exercisable until 1 July 201510 000 10 000 At R99,24 per share, exercisable until 1 September 20157 000 7 000 At R106,67 per share, exercisable until 1 October 2015
52 930 026 69 252 546 24.3 Unissued shares 52 930 026 69 252 546
4 990 106 5 005 106
24.4 Number of shares under the control of the directors for purposes of the Tiger Brands (1985) Share Purchase Scheme and the Tiger Brands (1985) Share Option Scheme. 4 990 106 5 005 106
COMPANyNumber of shares
under optionOptions exercised
during 2010
2010 2009Number
of sharesGain in
Rand
24.5 Executive directors’ options over shares in Tiger Brands LimitedM Fleming — 9 100 9 100 934 001
At R51,29 per share, exercisable until 29 January 2014 — 2 400 2 400 288 456At R75,13 per share, exercisable until 25 January 2015 — 6 700 6 700 645 545
N G Brimacombe 69 100 69 100 — —
At R36,53 per share, exercisable until 29 January 2012 21 400 21 400At R44,33 per share, exercisable until 3 February 2013 24 700 24 700At R51,29 per share, exercisable until 29 January 2014 13 000 13 000At R75,13 per share, exercisable until 25 January 2015 10 000 10 000
C F H Vaux 65 400 65 400 — —
At R44,33 per share, exercisable until 3 February 2013 23 400 23 400At R51,29 per share, exercisable until 29 January 2014 19 000 19 000At R75,13 per share, exercisable until 25 January 2015 23 000 23 000
Totals for Tiger Brands Limited 134 500 143 600 9 100 934 001

153Tiger Brands Annual Report 2010
Divisional reviews Governance and sustainability
▲
Annual financial statements
COMPANy GROUP2010 2009 (Rands in millions) 2010 2009
25. ISSUED ORDINARy SHARE CAPITAL AND PREMIUM
19,0 17,425.1 Issued share capital 190 200 005
(2009: 173 560 352) ordinary shares of 10 cents each 19,0 17,4
25.2 Share premium53,4 24,5 Balance at beginning of year 53,4 24,5
1 764,0 28,9 Issues of shares 1 764,0 28,9(502,1) — Capital distribution out of share premium – interim (502,1) —(852,9) — Capital distribution out of share premium – final (852,9) —
462,4 53,4 462,4 53,4
481,4 70,8 481,4 70,8
The increase in ordinary shares issued is due to share options exercised and the BEE Phase II transaction.
26. NON-DISTRIBUTABLE RESERVES
26.1 Non-distributable reserves16,6 16,6 Amounts transferred from share premium account 16,6 16,62,7 2,7 Capital redemption reserve fund
2 918,6 2 918,6 Other reserves 69,4 68,2Share of accumulated profits and reserves since acquisition in associated companies 749,9 628,7
(14,7) — Cash flow hedge reserve (33,3) (13,4)3,6 5,1 Available-for-sale reserve 235,7 148,1
Foreign currency translation reserve (81,0) (59,5)
2 926,8 2 943,0 957,3 788,7
26.2 Tax effect of other comprehensive incomeThe tax effect of the items reflected in the statement of other comprehensive income is as follows:Net gain on hedge of net investment (8,4) (4,5)Foreign currency translation adjustments (5,5) (7,1)Net gain/(loss) on available-for-sale financial assets (3,7) 12,6
(17,6) 1,0

154 Tiger Brands Annual Report 2010
Group at a glance Group review
Notes to the financial statements continuedfor the year ended 30 September 2010
27. TIGER BRANDS LIMITED SHARES HELD By SUBSIDIARy AND EMPOWERMENT ENTITIES27.1 Tiger Brands Limited shares held by subsidiary
10 326 758 (2009: 10 326 758) shares are held as treasury stock.
27.2 Tiger Brands Limited shares held by empowerment entities21 375 586 (2009: 5 896 140) shares are owned by empowerment entities.
On 19 September 2005, shareholders approved a Scheme of Arrangement (section 311 of the Companies Act) in terms of which Tiger Brands would facilitate the acquisition of a 4% direct ownership interest in its issued ordinary share capital by a broad base of staff employed within the group. The court order sanctioning the Scheme was registered by the Registrar of Companies on 29 September 2005, being the effective date of acquisition of the Scheme shares.
The total value of the staff empowerment transaction was R723,5 million, based on the closing price of the company’s shares on the JSE Limited on 13 July 2005 of R112 per share. The transaction was implemented on 17 October 2005 through a number of trusts and a special purpose vehicle. The acquisition of 5 896 140 Tiger Brands shares by the Black Managers Trust and Thusani Empowerment Investment Holdings (Proprietary) Limited in terms of the Scheme, at an aggregate cost of R649,5 million was shown as a deduction from equity in the group balance sheet. This reduced to R502,2 million in 2008 as a result of the Adcock Ingram unbundling. As from 2008 such shares in Adcock Ingram are reflected as listed investments held for sale.
The cost of the Tiger Brands shares acquired by the General Staff Trust (547 733 shares), together with the total expenses of the BEE transaction, was reflected as an abnormal item of R69,4 million in the group income statement in 2005.
On 20 October 2009 the company listed a further 16 322 520 new ordinary shares on the JSE Limited in terms of the BEE Phase II transaction. In terms of the transaction, 9,09% of Tiger Brands’ enlarged issued share capital at the time was allocated to the following empowerment entities:– Brimstone Investment Corporation Limited (1,01%)– The Tiger Brands Black Managers Trust No II (1,58%)– The Tiger Brands General Staff Share Trust (0,44%)– The Thusani Trust (1,01%)– The Tiger Brands Foundation (5,05%)The financial impact of the BEE Phase II transaction is included in note 41.

155Tiger Brands Annual Report 2010
Divisional reviews Governance and sustainability
▲
Annual financial statements
COMPANy GROUP2010 2009 (Rands in millions) 2010 2009
28. DEFERRED TAXATION LIABILITy
28.1 Movement of deferred taxation liability9,1 3,8 Balance at beginning of year 336,8 316,5
Discontinued operations — (57,4)
9,1 3,8 Balance at beginning of year – continuing operations 336,8 259,1
— (2,0)Net reallocation between deferred taxation asset and deferred taxation liability (refer note 19.1) 11,1 177,7
9,1 1,8 Adjusted balance at beginning of year 347,9 436,8Fair value adjustments – investments 3,7 (12,6)Reclassification of Oceana joint venture to associate — (19,1)Adjustment in respect of currency losses taken directly to non-distributable reserve 5,5 7,0Exchange rate translation reserve (0,4) (3,9)Reallocation to taxation — (75,8)
1,5 7,3 Income statement movement 83,8 4,4
1,5 7,3 – current year timing differences 83,8 4,4
10,6 9,1 Balance at end of year 440,5 336,8
(14,2) (2,0) Less: Deferred tax asset per note 19.1 (317,0) (238,9)
(3,6) 7,1 Net deferred tax liability/(asset) 123,5 97,9
28.2 Analysis of deferred taxation liabilityFair value adjustments – investments 9,9 8,7Property, plant and equipment 276,4 218,0Prepayments 4,6 6,1Retirement fund surpluses 54,4 44,7
10,6 — Revaluation of loan 10,6 —— 9,1 Other temporary differences 84,6 59,3
10,6 9,1 440,5 336,8
29. TRADE AND OTHER PAyABLESTrade payables 1 344,7 1 509,3
42,0 49,5 Accruals and other payables* 1 234,2 1 134,0
42,0 49,5 2 578,9 2 643,3
* Certain 2009 amounts were reclassified from other creditors to provisions to align with 2010 disclosure. Refer to note 30.
Trade payables are non-interest bearing and are normally settled on 45-day terms.Other payables are non-interest bearing and have an average term of 60 days.
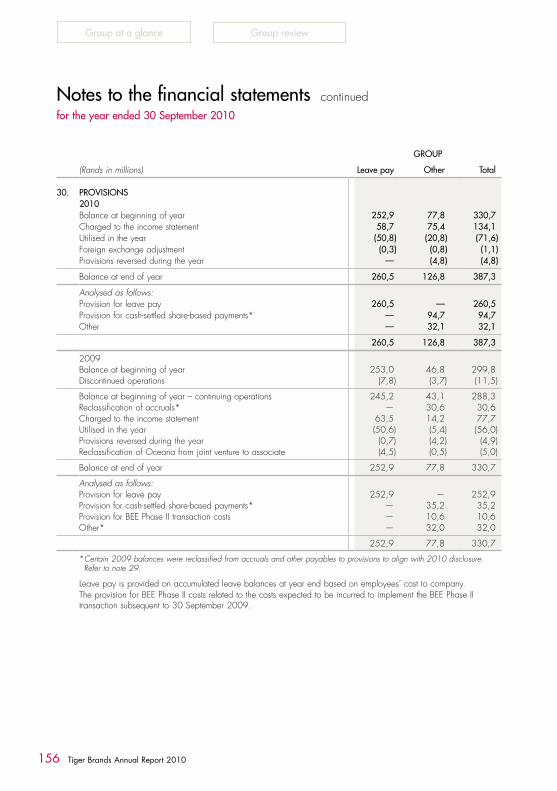
156 Tiger Brands Annual Report 2010
Group at a glance Group review
Notes to the financial statements continuedfor the year ended 30 September 2010
GROUP
(Rands in millions) Leave pay Other Total
30. PROVISIONS2010Balance at beginning of year 252,9 77,8 330,7Charged to the income statement 58,7 75,4 134,1Utilised in the year (50,8) (20,8) (71,6)Foreign exchange adjustment (0,3) (0,8) (1,1)Provisions reversed during the year — (4,8) (4,8)
Balance at end of year 260,5 126,8 387,3
Analysed as follows:Provision for leave pay 260,5 — 260,5Provision for cash-settled share-based payments* — 94,7 94,7Other — 32,1 32,1
260,5 126,8 387,3
2009Balance at beginning of year 253,0 46,8 299,8Discontinued operations (7,8) (3,7) (11,5)
Balance at beginning of year – continuing operations 245,2 43,1 288,3Reclassification of accruals* — 30,6 30,6Charged to the income statement 63,5 14,2 77,7Utilised in the year (50,6) (5,4) (56,0)Provisions reversed during the year (0,7) (4,2) (4,9)Reclassification of Oceana from joint venture to associate (4,5) (0,5) (5,0)
Balance at end of year 252,9 77,8 330,7
Analysed as follows:Provision for leave pay 252,9 — 252,9Provision for cash-settled share-based payments* — 35,2 35,2Provision for BEE Phase II transaction costs — 10,6 10,6Other* — 32,0 32,0
252,9 77,8 330,7
* Certain 2009 balances were reclassified from accruals and other payables to provisions to align with 2010 disclosure. Refer to note 29.
Leave pay is provided on accumulated leave balances at year end based on employees’ cost to company.The provision for BEE Phase II costs related to the costs expected to be incurred to implement the BEE Phase II transaction subsequent to 30 September 2009.

157Tiger Brands Annual Report 2010
Divisional reviews Governance and sustainability
▲
Annual financial statements
COMPANy GROUP2010 2009 (Rands in millions) 2010 2009
31. BORROWINGS
138,3 162,2 31.1 Secured loans 416,3 503,6
Loan bearing interest at 15,5% per annum, repayable by 2011 18,7 51,2
138,3 162,2Loan bearing interest at 6,8% per annum, repayable by 2013 (denominated in CAF Franc) 138,3 162,2Loan bearing interest at 13,5% per annum, repayable by 2014 22,5 36,0Loan bearing interest at 7,53% per annum, repayable by 2015 236,8 254,2
Refer also to notes 11.4 and 36 for details of security.
— 43,9 31.2 Unsecured loans 39,5 43,9
— 43,9Loan bearing interest at 8,6% (2009: 13,5%) per annum, repayable by 2016 (denominated in Kenyan Shillings) 39,5 43,9
31.3 Capitalised finance leases 0,9 2,0
Repayment during the next year 0,8 1,3Repayment during the next five years subsequent to year 1 0,1 0,7
Liabilities under capitalised finance leases bear interest at 8,7% per annum.Capitalised finance leases relate to property, plant and equipment with a book value of R nil (2009: R nil) as per note 11.6 of these annual financial statements.
138,3 206,1 456,7 549,5
31.4 Instalments disclosed as:1,6 7,6 Short-term borrowings 52,9 66,7
136,7 198,5 Long-term borrowings 403,8 482,8
138,3 206,1 456,7 549,5
(Rands in millions)Total
SA Rand
TotalKenyan
Shillings
TotalCAF
FrancGroup
total
31.5 Summary of borrowings by currency and year of repaymentDuring 2011 40,9 10,4 1,6 52,9During 2012 26,5 11,2 2,1 39,8During 2013 32,0 11,6 134,6 178,2During 2014 38,2 9,7 — 47,9During 2015 and thereafter 118,8 19,1 — 137,9
256,4 62,0 138,3 456,7
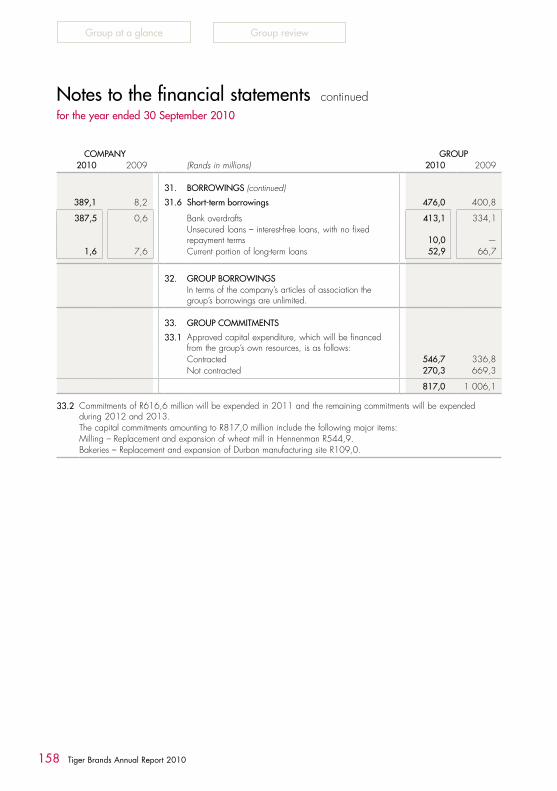
158 Tiger Brands Annual Report 2010
Group at a glance Group review
Notes to the financial statements continuedfor the year ended 30 September 2010
COMPANy GROUP2010 2009 (Rands in millions) 2010 2009
31. BORROWINGS (continued)
389,1 8,2 31.6 Short-term borrowings 476,0 400,8
387,5 0,6 Bank overdrafts 413,1 334,1Unsecured loans – interest-free loans, with no fixed repayment terms 10,0 —
1,6 7,6 Current portion of long-term loans 52,9 66,7
32. GROUP BORROWINGSIn terms of the company’s articles of association the group’s borrowings are unlimited.
33. GROUP COMMITMENTS
33.1 Approved capital expenditure, which will be financed from the group’s own resources, is as follows:Contracted 546,7 336,8Not contracted 270,3 669,3
817,0 1 006,1
33.2 Commitments of R616,6 million will be expended in 2011 and the remaining commitments will be expended during 2012 and 2013.The capital commitments amounting to R817,0 million include the following major items:Milling – Replacement and expansion of wheat mill in Hennenman R544,9.Bakeries – Replacement and expansion of Durban manufacturing site R109,0.
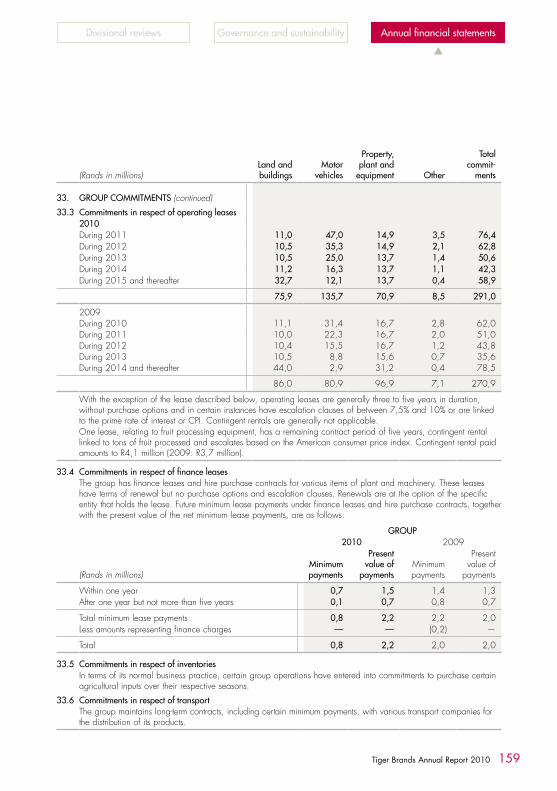
159Tiger Brands Annual Report 2010
Divisional reviews Governance and sustainability
▲
Annual financial statements
(Rands in millions)Land andbuildings
Motorvehicles
Property,plant and
equipment Other
Totalcommit-
ments
33. GROUP COMMITMENTS (continued)
33.3 Commitments in respect of operating leases2010During 2011 11,0 47,0 14,9 3,5 76,4During 2012 10,5 35,3 14,9 2,1 62,8During 2013 10,5 25,0 13,7 1,4 50,6During 2014 11,2 16,3 13,7 1,1 42,3During 2015 and thereafter 32,7 12,1 13,7 0,4 58,9
75,9 135,7 70,9 8,5 291,0
2009During 2010 11,1 31,4 16,7 2,8 62,0During 2011 10,0 22,3 16,7 2,0 51,0During 2012 10,4 15,5 16,7 1,2 43,8During 2013 10,5 8,8 15,6 0,7 35,6During 2014 and thereafter 44,0 2,9 31,2 0,4 78,5
86,0 80,9 96,9 7,1 270,9
With the exception of the lease described below, operating leases are generally three to five years in duration, without purchase options and in certain instances have escalation clauses of between 7,5% and 10% or are linked to the prime rate of interest or CPI. Contingent rentals are generally not applicable.One lease, relating to fruit processing equipment, has a remaining contract period of five years, contingent rental linked to tons of fruit processed and escalates based on the American consumer price index. Contingent rental paid amounts to R4,1 million (2009: R3,7 million).
33.4 Commitments in respect of finance leasesThe group has finance leases and hire purchase contracts for various items of plant and machinery. These leases have terms of renewal but no purchase options and escalation clauses. Renewals are at the option of the specific entity that holds the lease. Future minimum lease payments under finance leases and hire purchase contracts, together with the present value of the net minimum lease payments, are as follows:
GROUP2010 2009
(Rands in millions)Minimumpayments
Presentvalue of
paymentsMinimumpayments
Presentvalue of
payments
Within one year 0,7 1,5 1,4 1,3After one year but not more than five years 0,1 0,7 0,8 0,7
Total minimum lease payments 0,8 2,2 2,2 2,0Less amounts representing finance charges — — (0,2) —
Total 0,8 2,2 2,0 2,0
33.5 Commitments in respect of inventoriesIn terms of its normal business practice, certain group operations have entered into commitments to purchase certain agricultural inputs over their respective seasons.
33.6 Commitments in respect of transportThe group maintains long-term contracts, including certain minimum payments, with various transport companies for the distribution of its products.

160 Tiger Brands Annual Report 2010
Group at a glance Group review
Notes to the financial statements continuedfor the year ended 30 September 2010
34. PENSION OBLIGATIONSThe company and its subsidiaries contribute to retirement plans that cover all employees. The retirement plans are either defined benefit plans or defined contribution plans and are funded. The assets of the funds are held in independent trustee administered funds, administered in terms of the Pension Funds Act of 1956 (Act No 24), as amended. In terms of the Pension Funds Act, certain of the retirement funds are exempt from actuarial valuation. Those funds not exempt from valuation must, in terms of the Pension Funds Act, be valued at least every three years. For purposes of these disclosures, and in order to comply with the requirements of IAS 19 (Revised), valuations have been performed by independent actuaries, using the projected unit credit method. Where valuations were not possible due to the limited availability of complete data, roll forward projections of prior completed actuarial valuations were used, taking account of actual subsequent experience.Within the company’s group of subsidiaries, there are a total of 32 retirement plans, four of which are defined benefit pension funds, two are defined benefit provident funds, three are defined contribution pension funds, one a defined benefit plan and 16 are defined contribution provident funds. There are a further six schemes of insurance into which the company and its subsidiaries contribute. Certain companies within the group sponsor external death, funeral and disability benefit insurance policies. These insurance costs have been allowed for in the disclosures provided.The actual return on plan assets for the period 1 October 2009 to 30 September 2010 was R28,0 million (2009: R13,2 million). This compares with the expected return for the same period of R31,0 million (2009: R48,6 million).The value of contributions expected to be paid by group companies for the year ending 30 September 2011 amounts to R160,0 million (2010 actual: R154,4 million).As at 30 September 2010, there were no properties occupied by, or other assets used by, group companies which formed part of the fair value of plan assets (2009: Rnil).As at 30 September 2010, the percentage of the fair value of plan assets invested in Tiger Brands Limited shares amounted to 0,04% (2009: 0,40%).Major categories of plan assets as at 30 September:
GROUP2010 2009
Equities 20,7% 22,9%Bonds 20,5% 10,1%Cash 49.0% 58,3%Property 1,8% 2,3%International 7,5% 5,8%Other 0,5% 0,6%
100,0% 100,0%
(Rands in millions)Balance at end of yearPresent value of funded defined benefit obligations 261,3 245,6Fair value of plan assets in respect of defined benefit obligations (389,6) (376,0)
Funded status of defined benefit plans (128,3) (130,4)Unrecognised actuarial gains (1,7) —Asset not recognised at reporting date 92,3 100,1IFRIC 14 additional liability — —
(Asset)/liability at reporting date (37,7) (30,3)
The disclosure of the funded status is for accounting purposes only, and does not necessarily indicate any assets available to the company or its subsidiaries. Once a surplus apportionment exercise is completed, and approved by the Registrar of Pension Funds in terms of the provisions of the Pension Funds Second Amendment Act, 2001, only at that stage would it be appropriate for the company or its subsidiaries to recognise any assets in respect of the retirement funds, to the extent that they are apportioned such assets. The surplus apportionment schemes for the Tiger Brands Defined Benefit Pension Fund and the Beacon Products Staff Pension Fund were approved by the Registrar in 2008. Where appropriate, surplus apportioned to the company has been recognised on the statement of financial position. This legislation is not applicable to arrangements not registered in terms of the Pension Funds Act, such as special purpose entities established for purposes of providing disability benefits.

161Tiger Brands Annual Report 2010
Divisional reviews Governance and sustainability
▲
Annual financial statements
GROUP2010 2009
34. PENSION OBLIGATIONS (continued)Funded statusThe principal actuarial assumptions used for accounting purposes were:Discount rate 8,75% 9,00%Expected return on plan assetsTiger Brands Defined Benefit Pension Fund 8,75% 8,50%Tiger Oats Benefit Foundation 2,25% 9,00%Nestlé Pension Fund 9,50% 9,50%ICS Pension Fund 6,75% 6,00%Future salary increases 6,25% 6,75%Future pension increasesTiger Brands Defined Benefit Pension Fund 5,07% 5,31%Nestlé Pension Fund 4,07% 4,31%
(Rands in millions)The fund’s expected long-term return is a function of the expected long-term returns on equities, cash and bonds. In setting these assumptions reference was made to the asset split as at 31 July 2010. The expected long-term rate of return on bonds was set at the same level as the discount rate. This implies a yield on government bonds of 8,75% per annum. The expected long-term rate of return on equities was set at a level of 3% above the bond rate, whilst the expected long-term rate of return on cash was set at a level of 1% below the bond rate. Adjustments were made to reflect the effect of expenses.Reconciliation of the Defined Benefit ObligationDefined benefit obligation at beginning of year 245,6 388,5Service cost 3,9 3,5Member contributions 1,4 1,0Interest cost 23,1 36,3Actuarial loss 10,6 16,8Benefits paid (32,6) (199,5)Risk premiums (0,4) (0,2)Amount settled (0,6) (0,8)Take-on liability 10,3 —
Defined benefit obligation at end of year 261,3 245,6
Reconciliation of fair value of plan assetsAssets at fair market value at beginning of year 376,0 528,0Expected return on assets 31,0 48,7Contributions 8,6 43,6Risk premiums (0,4) (0,2)Benefits paid (32,6) (199,5)Actuarial loss (2,9) (35,5)Amount settled — (9,1)Take-on asset 9,9 —
Assets at fair market value at end of year 389,6 376,0
Asset balance at end of year (128,3) (130,4)

162 Tiger Brands Annual Report 2010
Group at a glance Group review
Notes to the financial statements continuedfor the year ended 30 September 2010
34. PENSION OBLIGATIONS (continued)Trend information
(Rands in millions)30 Sept
200630 Sept
200730 Sept
200830 Sept
200930 Sept
2010
Present value of defined benefit obligation 125,7 111,8 388,5 245,6 261,3Fair value of plan assets (521,2) (580,4) (528,0) (376,0) (389,6)Funded status (395,5) (468,5) (139,5) (130,4) (128,3)Experience loss on liabilities 2,4 13,3Experience loss on assets 35,5 2,9
35. POST-RETIREMENT MEDICAL AID OBLIGATIONSThe company and its subsidiaries operate post-employment medical benefit schemes that cover certain of their employees and retirees. This practice has since been stopped for new employees. The liabilities are valued annually using the projected unit credit method. The latest actuarial valuation was performed on 30 September 2010.
GROUP(Rands in millions) 2010 2009
Balance at end of yearPresent value of obligations 499,3 467,8
499,3 467,8Unrecognised actuarial losses (148,6) (141,4)
Liability at reporting date 350,7 326,4
Movement in the liability recognised in the statement of financial position:Balance at beginning of year 326,4 327,9Liabilitiy acquired in business combination (business sold) 0,8 (19,5)Contributions paid (29,1) (24,4)Settlements — —Other expenses included in staff costs 52,6 42,4
Current service cost 2,5 1,9Interest cost 40,8 32,2Actual losses recognised 9,3 8,3
Balance at end of year 350,7 326,4
Current portion 31,2 29,1
The principal actuarial assumptions used for accounting purposes were:Discount rate 8,75% 9,00%Medical inflation 6,75% 7,00%Future salary increases 6,75% 7,25%Post-employment mortality tables PA(90)
ultimaterated down
2 yearsplus 1,0%improve-ment pa
from 2006
PA(90)ultimate
rated down2 years
with 1,0%improve-ment pa
from 2006
The employer’s estimate of contributions expected to be paid for the 2011 financial year is R31,2 million (2010: R29,1 million).

163Tiger Brands Annual Report 2010
Divisional reviews Governance and sustainability
▲
Annual financial statements
35. POST-RETIREMENT MEDICAL AID OBLIGATIONS (continued)
35.1 Sensitivity analysis2010 Base case Healthcare cost inflation
Key assumption 6,75% (1,0%) 1,0%
Accrued liability 30 September 2010(Rands in millions) 499,3 448,6 560,7% change (10,2%) 12,3%Current service cost plus interest cost 2010/2011(Rands in millions) 45,0 40,1 51,0% change (11,0%) 13,4%
2009
Key assumption 7,00% (1,0%) 1,0%
Accrued liability 30 September 2009(Rands in millions) 467,8 420,1 525,4% change (10,2%) 12,3%Current service cost plus interest cost 2009/2010(Rand millions) 43,2 38,5 49,0% change (10,9%) 13,4%
2010 Base case Discount rate
Key assumption 8,75% (1,0%) 1,0%
Present value of obligations 30 September 2010(Rands in millions) 499,3 563,2 447,3% change 12,8% (10,4%)
2009
Key assumption 9,00% (1,0%) 1,0%
Present value of obligations 30 September 2009(Rands in millions) 467,8 527,8 418,9% change 12,8% (10,5%)
2010 Base case Expected retirement age
Key assumption60/63/
65 years1 year
younger1 year
older
Present value of obligations 30 September 2010(Rands in millions) 499,3 503,4 495,8% change 0,8% (0,7%)
2009
Key assumption60/63/65 years
1 year younger
1 yearolder
Present value of obligations 30 September 2009(Rands in millions) 467,8 471,5 464,5% change 0,8% (0,7%)

164 Tiger Brands Annual Report 2010
Group at a glance Group review
Notes to the financial statements continuedfor the year ended 30 September 2010
35. POST-RETIREMENT MEDICAL AID OBLIGATIONS (continued)35.1 Sensitivity analysis (continued)
Trend information
(Rands in millions)30 Sept
200630 Sept
200730 Sept
200830 Sept
200930 Sept
2010
Present value of obligation 330,7 317,8 363,3 467,8 499,3Fair value of plan assets — — — — —Present value of obligations in excess of plan assets 330,7 317,8 363,3 467,8 499,3Experience adjustments 5,0 (9,3) (15,0) (61,3) (17,4)Actuarial gains/(losses) before changes in assumptions:In respect of present value of obligations 5,0 (9,3) (15,0) (61,3) (17,4)In respect of fair value of plan assets — — — — —
GROUP(Rands in millions) 2010 2009
36. GUARANTEES AND CONTINGENT LIABILITIESGuarantees and contingent liabilities 318,4 308,8
CompanyThe company has bound itself as surety and co-principal debtor for the obligations of certain subsidiaries amounting to R18,7 million at 30 September 2010 (2009: R51,2 million). Refer to note 31.1.
Guarantees exist against the company for the obligations of certain subsidiaries amounting to R30,5 million at 30 September 2010 (2009: R35,5 million).
An intercompany loan granted by the company to one of its subsidiaries with a book value of R1 227,6 million (2009: R1 227,6 million) has been assigned by the company as security for its obligations as surety. Refer Annexure A.
Shares in Chocolaterie Confiserie Camerounaise Sa (“Chococam”) acquired on 1 August 2008 have been pledged as security for the foreign loan utilised to acquire the subsidiary.
Refer to note 31.1.

165Tiger Brands Annual Report 2010
Divisional reviews Governance and sustainability
▲
Annual financial statements
37. FINANCIAL INSTRUMENTSThe group’s objective in using financial instruments is to reduce the uncertainty over future cash flows arising principally as a result of commodity price, currency and interest rate fluctuations. The use of derivatives for the hedging of firm commitments against commodity price, foreign currency and interest rate exposures is permitted in accordance with group policies, which have been approved by the board of directors. Where significant finance is taken out, this is approved at board meetings.
The foreign exchange contracts outstanding at year end are marked to market at closing spot rate.
The group finances its operations through a combination of retained surpluses, bank borrowings and long-term loans.
The group borrows short-term funds with fixed or floating rates of interest through the holding company, Tiger Brands Limited.
The main risks arising from the group’s financial instruments are in order of priority, procurement risk, foreign currency risk, interest rate risk, liquidity risk and credit risk as detailed below.
37.1 Procurement risk (commodity price risk)Commodity price risk arises from the group being subject to raw material price fluctuations caused by supply conditions, weather, economic conditions and other factors. The strategic raw materials acquired by the group include wheat, maize, rice, oats and sorghum.
The group uses commodity futures and options contracts or other derivative instruments to reduce the volatility of commodity input prices of strategic raw materials. These derivative contracts are only taken out to match an underlying physical requirement for the raw material. The group does not write naked derivative contracts.
The group has developed a comprehensive risk management process to facilitate, control and monitor these risks. The procurement of raw materials takes place in terms of specific mandates given by the executive management. Position statements are prepared on a monthly basis and these are monitored by management and compared to the mandates.
The board has approved and monitors this risk management process, inclusive of documented treasury policies, counterparty limits, controlling and reporting structures.
At year-end the exposure to derivative contracts relating to strategic raw materials is as follows:
Derivative contracts expiring within 0 – 3 months
(Rands in millions)
Unrealisedloss at
30 SeptemberHedged
value
2010Maize and wheatFutures 6,2 26,5
6,2 26,5
2009Maize and wheatFutures 6,5 138,9
6,5 138,9
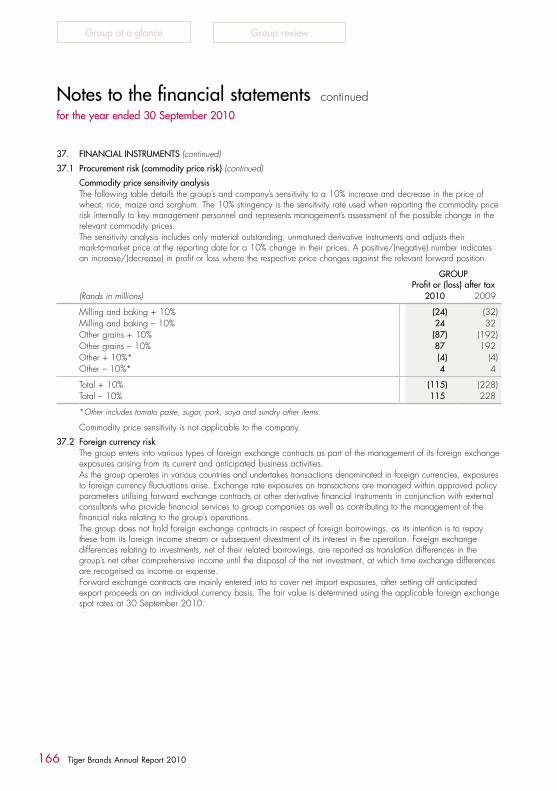
166 Tiger Brands Annual Report 2010
Group at a glance Group review
Notes to the financial statements continuedfor the year ended 30 September 2010
37. FINANCIAL INSTRUMENTS (continued)
37.1 Procurement risk (commodity price risk) (continued)
Commodity price sensitivity analysisThe following table details the group’s and company’s sensitivity to a 10% increase and decrease in the price of wheat, rice, maize and sorghum. The 10% stringency is the sensitivity rate used when reporting the commodity price risk internally to key management personnel and represents management’s assessment of the possible change in the relevant commodity prices.The sensitivity analysis includes only material outstanding, unmatured derivative instruments and adjusts their mark-to-market price at the reporting date for a 10% change in their prices. A positive/(negative) number indicates an increase/(decrease) in profit or loss where the respective price changes against the relevant forward position.
GROUPProfit or (loss) after tax
(Rands in millions) 2010 2009
Milling and baking + 10% (24) (32)Milling and baking – 10% 24 32Other grains + 10% (87) (192)Other grains – 10% 87 192Other + 10%* (4) (4)Other – 10%* 4 4
Total + 10% (115) (228)Total – 10% 115 228
*Other includes tomato paste, sugar, pork, soya and sundry other items.
Commodity price sensitivity is not applicable to the company.
37.2 Foreign currency riskThe group enters into various types of foreign exchange contracts as part of the management of its foreign exchange exposures arising from its current and anticipated business activities.As the group operates in various countries and undertakes transactions denominated in foreign currencies, exposures to foreign currency fluctuations arise. Exchange rate exposures on transactions are managed within approved policy parameters utilising forward exchange contracts or other derivative financial instruments in conjunction with external consultants who provide financial services to group companies as well as contributing to the management of the financial risks relating to the group’s operations.The group does not hold foreign exchange contracts in respect of foreign borrowings, as its intention is to repay these from its foreign income stream or subsequent divestment of its interest in the operation. Foreign exchange differences relating to investments, net of their related borrowings, are reported as translation differences in the group’s net other comprehensive income until the disposal of the net investment, at which time exchange differences are recognised as income or expense.Forward exchange contracts are mainly entered into to cover net import exposures, after setting off anticipated export proceeds on an individual currency basis. The fair value is determined using the applicable foreign exchange spot rates at 30 September 2010.

167Tiger Brands Annual Report 2010
Divisional reviews Governance and sustainability
▲
Annual financial statements
37. FINANCIAL INSTRUMENTS (continued)
37.2 Foreign currency risk (continued)The exposure and concentration of foreign currency risk is included in the table below.
GROUP
SouthAfrican
RandRm
US DollarRm
PoundRm
EuroRm
Other*Rm
TotalRm
2010
Financial assetsAccounts receivable 2 387,1 62,4 8,4 17,7 21,8 2 497,4Cash and cash equivalents 715,4 191,4 2,1 10,5 1,9 921,3
Financial liabilitiesBorrowings** (701,1) — — — (178,7) (879,8)Accounts payable (1 483,9) (79,0) (29,1) (32,4) (2,3) (1 626,7)
2009Financial assetsAccounts receivable 2 176,7 53,8 7,7 28,2 23,4 2 289,8Cash and cash equivalents 339,0 119,3 1,2 45,7 1,0 506,2
Financial liabilitiesBorrowings** (677,6) — — — (206,0) (883,6)Accounts payable (1 671,7) (58,4) (16,1) (30,6) (1,7) (1 778,5)
* Other includes the Australian Dollar, Canadian Dollar and Japanese Yen.** In 2009 all foreign borrowings were held by the company. In 2010, R138,3 million is held by the company and R39,5
million is held by a subsidiary. Refer to note 31.
The following spot rates were used to translate financial instruments denominated in foreign currency:
Assets Liabilities
2010US Dollar 6,97 6,99Pound Sterling 10,99 11,02Euro 9,50 9,53
2009US Dollar 7,54 7,57Pound Sterling 12,04 12,09Euro 11,01 11,05

168 Tiger Brands Annual Report 2010
Group at a glance Group review
Notes to the financial statements continuedfor the year ended 30 September 2010
37. FINANCIAL INSTRUMENTS (continued)
37.2 Foreign currency risk (continued)
(in millions)Foreign
currencyAverage
rate Rands
Forward exchange contracts outstanding at the reporting date all fall due within 12 months. A summary of forward exchange contract positions bought to settle group foreign liabilities and sold to settle group foreign assets is shown below.2010GROUPForeign currency soldUS Dollar 1,1 7,0 8,0Pound Sterling 0,2 11,1 2,2Euro 1,1 9,5 10,1Other currencies — — 13,4Foreign currency purchasedUS Dollar 76,2 7,0 535,5Pound Sterling 2,8 11,1 31,1Euro 4,1 9,6 39,0Other currencies — — 10,5COMPANyForeign currency purchasedUS Dollar 52,7 7,3 385,0
GROUPUnhedged foreign currency monetary assetsUS Dollar 9,3 7,6 56,4Pound Sterling 0,9 12,1 9,6Euro 2,5 11,0 23,4Other currencies — — 13,7Unhedged foreign currency monetary liabilitiesUS Dollar 0,7 7,6 4,6Other currencies — — 2,2
2009GROUPForeign currency soldUS Dollar 1,1 7,6 8,6Pound Sterling 0,3 12,1 3,8Euro 0,7 11,1 7,6Other currencies — — 9,3Foreign currency purchasedUS Dollar 34,3 7,6 260,5Pound Sterling 1,6 12,1 19,8Euro 2,6 11,2 29,2Other currencies — — 9,7COMPANyForeign currency purchasedUS Dollar — — —
GROUPUnhedged foreign currency monetary assetsUS Dollar 5,3 7,6 39,5Pound Sterling 0,7 12,1 7,9Euro 3,1 11,0 33,8Other currencies — — 17,3Unhedged foreign currency monetary liabilitiesUS Dollar 1,4 7,6 10,9Other currencies — — 3,3

169Tiger Brands Annual Report 2010
Divisional reviews Governance and sustainability
▲
Annual financial statements
37. FINANCIAL INSTRUMENTS (continued)
37.2 Foreign currency risk (continued)
Cash flow hedgesAt 30 September 2010, the group had foreign exchange contracts outstanding designated as hedges of future purchases from suppliers outside South Africa for which the group has firm commitments or highly likely forecast transactions.A summary of these contracts are:
(in millions)Foreign
currencyAverage
rate Rands
2010GROUPForeign currency boughtUS Dollar 72,3 7,3 529,0Euro 2,7 9,8 26,5Pound Sterling 2,1 11,7 24,9Other currencies — — 7,9
COMPANyForeign currency boughtUS Dollar 52,7 7,3 385,0
2009GROUPForeign currency boughtUS Dollar 15,3 7,6 116,6Euro 1,8 11,5 20,9Pound Sterling 1,0 13,3 13,1Other currencies — — 8,9
COMPANyForeign currency boughtUS Dollar — — —
The terms of the forward currency contracts have been negotiated to match the terms of the commitments.The cash flow hedge of expected future purchases was assessed to be effective and an unrealised loss of R22,7 million (2009: profit R3 million), with deferred tax of Rnil (2009: R0,9 million) relating to the hedging instrument is included in other comprehensive income. These are expected to affect the income statement in the following financial year:
GROUPForeign currency(in millions)
1 – 6months
7 – 12months
US Dollar 71,7 0,7Euro 2,3 0,4Pound Sterling 2,1 —Australian Dollar 0,3 0,1Japanese Yen 64,6 —Hong Kong Dollar 0,2 —
During the year R8,4 million (2009: R9,5 million) was removed from other comprehensive income and included in the cost or carrying amount of the non-financial asset or liability.
There are no forecast transactions for which hedge accounting was previously used but is no longer expected to occur.

170 Tiger Brands Annual Report 2010
Notes to the financial statements continuedfor the year ended 30 September 2010
Group at a glance Group review
37. FINANCIAL INSTRUMENTS (continued)
37.2 Foreign currency risk (continued)
COMPANyForeign currency(in millions)
1 – 6months
7 – 12months
US Dollar 52,7 —
During the year Rnil (2009: Rnil) was removed from other comprehensive income and included in the cost or carrying amount of the non-financial asset or liability.
There are no forecast transactions for which hedge accounting was previously used but is no longer expected to occur.
Foreign currency sensitivityThe following table details the group’s and company’s sensitivity to a 10% weakening/strengthening in the ZAR against the respective foreign currencies.
The sensitivity analysis includes only material outstanding foreign currency denominated monetary items as detailed in the table above and adjusts their translation at the reporting date for a 10% change in foreign currency rates. A positive number indicates an increase in profit or (loss) and other comprehensive income where the ZAR weakens against the relevant currency:
GROUP
Profit or (loss) after taxOther comprehensive
income2010 2009 2010 2009
Rm Rm Rm Rm
USD + 10% 42 107 (119) 0USD – 10% (42) (107) 119 (0)EUR + 10% (15) (3) 1 (1)EUR – 10% 15 3 (1) 1Pound sterling + 10% (1) (0) — —Pound sterling – 10% 1 0 — —Other + 10% 8 19 — —Other – 10% (8) (19) — —
Total + 10% 34 122 (118) (1)Total – 10% (34) (122) 118 1
COMPANy
Profit or (loss) after taxOther comprehensive
income2010 2009 2010 2009
Rm Rm Rm Rm
USD + 10% (2) 26 (37) —USD – 10% 2 (26) 37 —Other + 10% (2) 3 — —Other – 10% 2 (3) — —
Total + 10% (4) 28 (37) —Total – 10% 4 (28) 37 —
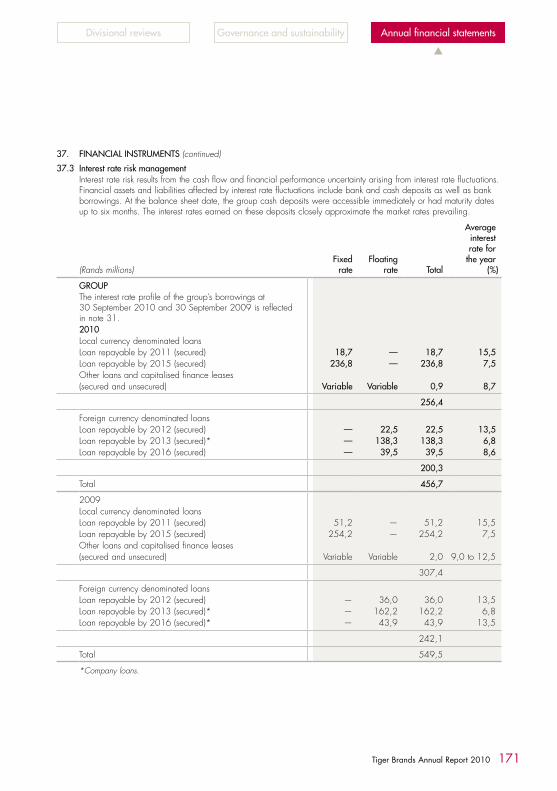
171Tiger Brands Annual Report 2010
Divisional reviews Governance and sustainability
▲
Annual financial statements
37. FINANCIAL INSTRUMENTS (continued)
37.3 Interest rate risk managementInterest rate risk results from the cash flow and financial performance uncertainty arising from interest rate fluctuations. Financial assets and liabilities affected by interest rate fluctuations include bank and cash deposits as well as bank borrowings. At the balance sheet date, the group cash deposits were accessible immediately or had maturity dates up to six months. The interest rates earned on these deposits closely approximate the market rates prevailing.
(Rands millions)Fixed
rateFloating
rate Total
Averageinterestrate for
the year(%)
GROUPThe interest rate profile of the group’s borrowings at 30 September 2010 and 30 September 2009 is reflected in note 31.2010Local currency denominated loansLoan repayable by 2011 (secured) 18,7 — 18,7 15,5Loan repayable by 2015 (secured) 236,8 — 236,8 7,5Other loans and capitalised finance leases(secured and unsecured) Variable Variable 0,9 8,7
256,4
Foreign currency denominated loansLoan repayable by 2012 (secured) — 22,5 22,5 13,5Loan repayable by 2013 (secured)* — 138,3 138,3 6,8Loan repayable by 2016 (secured) — 39,5 39,5 8,6
200,3
Total 456,7
2009Local currency denominated loansLoan repayable by 2011 (secured) 51,2 — 51,2 15,5Loan repayable by 2015 (secured) 254,2 — 254,2 7,5Other loans and capitalised finance leases(secured and unsecured) Variable Variable 2,0 9,0 to 12,5
307,4
Foreign currency denominated loansLoan repayable by 2012 (secured) — 36,0 36,0 13,5Loan repayable by 2013 (secured)* — 162,2 162,2 6,8Loan repayable by 2016 (secured)* — 43,9 43,9 13,5
242,1
Total 549,5
*Company loans.
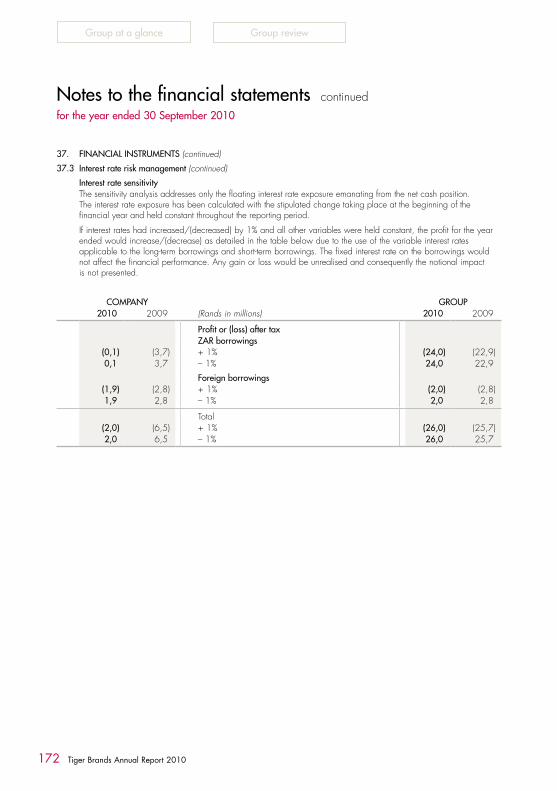
172 Tiger Brands Annual Report 2010
Group at a glance Group review
Notes to the financial statements continuedfor the year ended 30 September 2010
37. FINANCIAL INSTRUMENTS (continued)
37.3 Interest rate risk management (continued)
Interest rate sensitivityThe sensitivity analysis addresses only the floating interest rate exposure emanating from the net cash position. The interest rate exposure has been calculated with the stipulated change taking place at the beginning of the financial year and held constant throughout the reporting period.
If interest rates had increased/(decreased) by 1% and all other variables were held constant, the profit for the year ended would increase/(decrease) as detailed in the table below due to the use of the variable interest rates applicable to the long-term borrowings and short-term borrowings. The fixed interest rate on the borrowings would not affect the financial performance. Any gain or loss would be unrealised and consequently the notional impact is not presented.
COMPANy GROUP2010 2009 (Rands in millions) 2010 2009
Profit or (loss) after taxZAR borrowings
(0,1) (3,7) + 1% (24,0) (22,9)0,1 3,7 – 1% 24,0 22,9
Foreign borrowings(1,9) (2,8) + 1% (2,0) (2,8)1,9 2,8 – 1% 2,0 2,8
Total(2,0) (6,5) + 1% (26,0) (25,7)2,0 6,5 – 1% 26,0 25,7

173Tiger Brands Annual Report 2010
Divisional reviews Governance and sustainability
▲
Annual financial statements
37. FINANCIAL INSTRUMENTS (continued)
37.4 Liquidity risk managementLiquidity risk arises from the seasonal fluctuations in short-term borrowing positions. A material and sustained shortfall in cashflows could undermine investor confidence and restrict the group’s ability to raise funds.
The group manages its liquidity risk by monitoring weekly cash flows and ensuring that adequate cash is available or borrowing facilities maintained. In terms of the articles of association, the group’s borrowing powers are unlimited. Other than the major loans disclosed in note 31 to these annual financial statements which are contractedwith various financial institutions, the group has no significant concentration of liquidity risk with any other single counterparty.
The group’s liquidity exposure is represented by the aggregate balance of financial liabilities as indicated in the categorisation table in note 37.7.
The following tables detail the group’s and company’s remaining contractual maturity for non-derivative financial liabilities.
The tables have been drawn up based on the undiscounted cash flows of financial liabilities based on the earliest date on which the group and company will be required to pay.
The table includes both interest and principal cash flows. The “Finance charge” column represents the possible future cash flows attributable to the instrument included in the maturity analysis, which are not included in the carrying amount of the financial liability.
(Rands in millions)Carrying
amountFinancecharge
0 – 6 months
7 – 12 months
1 – 5 years
> 5 years
GROUPFor the year ended30 September 2010Trade and other payables 1 600,9 — 1 600,9 — — —Borrowings (long- and short-term) 879,8 134,0 271,6 240,7 425,7 75,8
Total 2 480,7 134,0 1 872,5 240,7 425,7 75,8
For the year ended30 September 2009Trade and other payables 1 771,6 — 1 769,3 1,8 0,5 —Borrowings (long- and short-term) 883,6 190,2 222,0 203,2 520,4 128,2
Total 2 655,2 190,2 1 991,3 205,0 520,9 128,2
COMPANyFor the year ended30 September 2010Borrowings (long- and short-term) 78,4 31,5 1,5 — 108,4 —Intergroup loan accounts 472,9 — — — 472,9 —
Total 551,3 31,5 1,5 — 581,3 —
For the year ended30 September 2009Borrowings (long- and short-term) 206,7 73,1 — — 279,8 —Intergroup loan accounts 476,9 — — — 476,9 —
Total 683,6 73,1 — — 756,7 —
Refer to note 33.3 and 33.4 for disclosure relating to operating and finance lease commitments.

174 Tiger Brands Annual Report 2010
Group at a glance Group review
Notes to the financial statements continuedfor the year ended 30 September 2010
37. FINANCIAL INSTRUMENTS (continued)
37.5 Credit risk managementGROUPCredit risk arises from the risk that a counterparty may default or not meet its obligations timeously.
The group limits its counterparty exposure arising from financial instruments by only dealing with well-established institutions of high credit standing. The group does not expect any counterparties to fail to meet their obligations given their high credit ratings.
Credit risk in respect of the group’s customer base is controlled by the application of credit limits and credit monitoring procedures. Certain significant receivables are monitored on a daily basis. Where appropriate, credit guarantee insurance is obtained.
The group’s credit exposure, in respect of its customer base, is represented by the net aggregate balance of amounts receivable. The maximum credit exposure at reporting date was R2 865,2 million (2009: R2 647,8 million). Concentrations of credit risk are disclosed in note 21.4.
COMPANyThe company had no significant credit exposure at 30 September 2010.
37.6 Capital managementThe primary objective of the company and group’s capital management is to ensure that it maintains a strong credit rating and healthy capital ratios in order to support its business and maximise shareholder value.
The company and group manages its capital structure, calculated as equity plus net debt, and makes adjustments to it, in light of changes in economic conditions. To maintain or adjust the capital structure, the company and group may adjust the dividend payment to shareholders, return capital to shareholders, issue new shares or increase or decrease levels of debt. No changes were made in the objectives, policies or processes during the years ended 30 September 2010 and 30 September 2009.
The company and group monitor capital using a gearing ratio, which is net debt divided by total equity. The group targets a long-term gearing ratio of 30% to 40%, except when major investments are made where this target may be exceeded.
(Rands in millions) 2010 2009
GROUPCash and cash equivalents (921,3) (506,2)Long-term borrowings 403,8 482,8Short-term borrowings 476,0 400,8
Net debt (41,5) 377,4Total equity 8 601,4 7 284,7
Total capital 8 559,9 7 662,1Net (cash)/debt to equity (%) (0,5) 5,2
COMPANyCash and cash equivalents (491,2) (414,0)Long-term borrowings 136,8 198,5Short-term borrowings 389,1 8,2
Net cash/(debt) 34,7 (207,3)Total equity 5 521,6 4 039,2
Total capital 5 556,3 3 831,9Net debt/(cash) to equity (%) 0,6 (5,1)
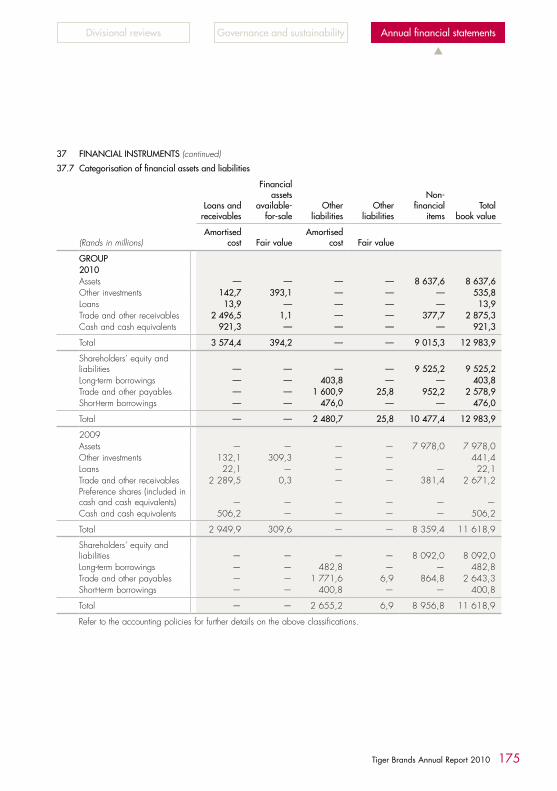
175Tiger Brands Annual Report 2010
Divisional reviews Governance and sustainability
▲
Annual financial statements
37 FINANCIAL INSTRUMENTS (continued)
37.7 Categorisation of financial assets and liabilities
Loans and receivables
Financialassets
available-for-sale
Otherliabilities
Otherliabilities
Non-financial
itemsTotal
book value
(Rands in millions)Amortised
cost Fair valueAmortised
cost Fair value
GROUP2010Assets — — — — 8 637,6 8 637,6Other investments 142,7 393,1 — — — 535,8Loans 13,9 — — — — 13,9Trade and other receivables 2 496,5 1,1 — — 377,7 2 875,3Cash and cash equivalents 921,3 — — — — 921,3
Total 3 574,4 394,2 — — 9 015,3 12 983,9
Shareholders’ equity and liabilities — — — — 9 525,2 9 525,2Long-term borrowings — — 403,8 — — 403,8Trade and other payables — — 1 600,9 25,8 952,2 2 578,9Short-term borrowings — — 476,0 — — 476,0
Total — — 2 480,7 25,8 10 477,4 12 983,9
2009Assets — — — — 7 978,0 7 978,0Other investments 132,1 309,3 — — 441,4Loans 22,1 — — — — 22,1Trade and other receivables 2 289,5 0,3 — — 381,4 2 671,2Preference shares (included in cash and cash equivalents) — — — — — —Cash and cash equivalents 506,2 — — — — 506,2
Total 2 949,9 309,6 — — 8 359,4 11 618,9
Shareholders’ equity and liabilities — — — — 8 092,0 8 092,0Long-term borrowings — — 482,8 — — 482,8Trade and other payables — — 1 771,6 6,9 864,8 2 643,3Short-term borrowings — — 400,8 — — 400,8
Total — — 2 655,2 6,9 8 956,8 11 618,9
Refer to the accounting policies for further details on the above classifications.
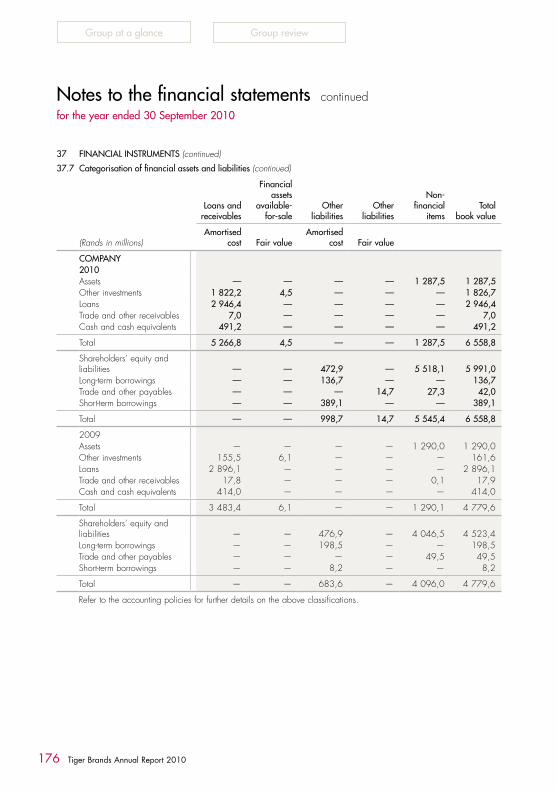
176 Tiger Brands Annual Report 2010
Group at a glance Group review
Notes to the financial statements continuedfor the year ended 30 September 2010
37 FINANCIAL INSTRUMENTS (continued)
37.7 Categorisation of financial assets and liabilities (continued)
Loans and receivables
Financialassets
available-for-sale
Otherliabilities
Otherliabilities
Non-financial
itemsTotal
book value
(Rands in millions)Amortised
cost Fair valueAmortised
cost Fair value
COMPANy2010Assets — — — — 1 287,5 1 287,5Other investments 1 822,2 4,5 — — — 1 826,7Loans 2 946,4 — — — — 2 946,4Trade and other receivables 7,0 — — — — 7,0Cash and cash equivalents 491,2 — — — — 491,2
Total 5 266,8 4,5 — — 1 287,5 6 558,8
Shareholders’ equity and liabilities — — 472,9 — 5 518,1 5 991,0Long-term borrowings — — 136,7 — — 136,7Trade and other payables — — — 14,7 27,3 42,0Short-term borrowings — — 389,1 — — 389,1
Total — — 998,7 14,7 5 545,4 6 558,8
2009Assets — — — — 1 290,0 1 290,0Other investments 155,5 6,1 — — — 161,6Loans 2 896,1 — — — — 2 896,1Trade and other receivables 17,8 — — — 0,1 17,9Cash and cash equivalents 414,0 — — — — 414,0
Total 3 483,4 6,1 — — 1 290,1 4 779,6
Shareholders’ equity and liabilities — — 476,9 — 4 046,5 4 523,4Long-term borrowings — — 198,5 — — 198,5Trade and other payables — — — — 49,5 49,5Short-term borrowings — — 8,2 — — 8,2
Total — — 683,6 — 4 096,0 4 779,6
Refer to the accounting policies for further details on the above classifications.

177Tiger Brands Annual Report 2010
Divisional reviews Governance and sustainability
▲
Annual financial statements
37.8 Fair value hierarchyFinancial instruments are normally held by the group until they close out in the normal course of business. The fair values of the group’s financial instruments, which principally comprise futures positions with SAFEX, approximate their carrying values. The maturity profile of these financial instruments fall due within 12 months. The maturity profile of the group’s long-term liabilities is disclosed in note 31.1 of these annual financial statements.
There are no significant differences between carrying values and fair values of financial assets and liabilities, except for intercompany loans at a company level, which are eliminated on consolidation.
Trade and other receivables, investments and loans and trade and other payables carried on the statement of financial position approximate the fair values thereof.
Long-term and short-term borrowings are measured at amortised cost using the effective interest rate method and the carrying amounts approximate their fair value.
The group used the following hierarchy for determining and disclosing the fair value of financial instruments by valuation technique:
Level 1: quoted (unadjusted) prices in active markets for identical assets or liabilities.
Level 2: other techniques for which all inputs which have a significant effect on the recorded fair value are observable, either directly or indirectly.
Level 3: techniques which use inputs which have a significant effect on the recorded fair value that are not based on observable market data.
As at 30 September, the group held the following financial instruments measured at fair value:
2010 2009Level 1 Level 2 Level 3 Total Level 1 Level 2 Level 3 Total
GROUPAssets measured at fair valueAvailable-for-sale financial assetsOther Investments 388,6 4,5 — 393,1 303,2 6,1 — 309,3Foreign exchange contracts – hedged 1,1 — — 1,1 0,3 — — 0,3Liabilities measured at fair valueForeign exchange contracts – hedged 25,8 — — 25,8 6,9 — — 6,9
COMPANyAssets measured at fair valueAvailable-for-sale financial assetsOther Investments — 4,5 — 4,5 — 6,1 — 6,1Liabilities measured at fair valueForeign exchange contracts – hedged 14,7 — — 14,7 — — — —

178 Tiger Brands Annual Report 2010
Group at a glance Group review
Notes to the financial statements continuedfor the year ended 30 September 2010
38. JOINT VENTURES
(Rands in millions) 2010 2009
38.1 The group’s proportionate share of the trading results of the joint ventures is as follows:Revenue — 730,6
Profit before abnormal items — 85,5Abnormal items — 1,5
Profit after abnormal items — 87,0Income tax expense – inclusive of tax on abnormal items — (28,4)
Profit for the year — 58,6
Attributable to:Shareholders of the parent — 55,2Non-controlling interests — 3,4
38.2 The group’s proportionate share of cash flows of the joint ventures is as follows:Cash operating income after interest and taxation — 66,3Working capital changes — (86,3)
Cash utilised in operations — (20,0)Dividends paid — (61,1)
Net cash outflow from operating activities — (81,1)Net cash outflow from investing activities — (10,7)
Net cash outflow before financing activities — (91,8)Net cash inflow from financing activities — 8,9
Net decrease in cash and cash equivalents — (82,9)
38.3 The group’s proportionate share of the joint ventures’ capital commitments included in the financial statements is Rnil for both 2010 and 2009.
38.4 The group’s proportionate share of the joint ventures’ contingent liabilities is R nil for both 2010 and 2009.
39. RELATED-PARTy DISCLOSURESThe board of directors of Tiger Brands Limited has given general declarations in terms of section 234 of the Companies Act. These declarations indicate that certain directors hold positions of influence in other entities which are suppliers, service providers, customers and/or competitors of Tiger Brands Limited. Transactions conducted with these director-related customers and suppliers were on an arm’s length basis.
The sales to and purchases from related parties are made at normal market prices. Outstanding balances at the year-end are unsecured and settlement occurs in cash. For the year ended 30 September 2010, the group has not recorded any impairment of receivables relating to amounts owed by related parties (2009: R nil). This assessment is undertaken each financial year through examining the financial position of the related party and the market in which the related party operates.

179Tiger Brands Annual Report 2010
Divisional reviews Governance and sustainability
▲
Annual financial statements
39. RELATED-PARTy DISCLOSURES (continued)Details of material transactions with related parties not disclosed elsewhere in the financial statements are as follows:
(Rands in millions)
Sales torelated parties
Purchases from
related parties
Amounts owed
to related parties
Rentals and fees received
fromrelated parties
2010GROUPRelated partyAssociate/subsidiaryOceana Group Limited* — — — —Sea Vuna Fishing Company (Pty) Limited** — — — —
2009Related partyAssociate/subsidiaryOceana Group Limited* — 10,9 0,4 —Sea Vuna Fishing Company (Pty) Limited** 0,8 24,6 0,6 5,3
*With effect from 1 April 2009 Oceana and its related companies were reclassified as an associate.**Sea Harvest was sold on 28 May 2009.
(Rands in millions) 2010 2009
Other related partiesKey management personnel*Short-term employee benefits 63,5 75,3Post-employment and medical benefits 10,3 8,8Share-based payments 25,6 11,8Total compensation paid to key management personnel 99,4 95,9
* Key management personnel comprises the top tier of the organisation and the managing executives of the individual businesses, forming the core of the decision making process for the group.

180 Tiger Brands Annual Report 2010
Group at a glance Group review
Notes to the financial statements continuedfor the year ended 30 September 2010
(Rands in millions)
Amounts owed by
related parties1
Amountsowed torelatedparties1
Dividendsreceived
39. RELATED-PARTy DISCLOSURES (continued)COMPANy2010Related party – intergroupSubsidiariesDurban Confectionery Works (Pty) Limited 483,0 — —Tiger Consumer Brands Limited — 17,8 650,0Tiger Brands Mauritius (Pty) Limited — 236,8 —Enterprise Foods (Pty) Limited 0,4 — 45,0Langeberg Holdings Limited 702,4 — —Langeberg Foods Africa (Pty) Limited — 201,6 —The Duntulum Trust 18,9 — —Gloriande NV 0,2 — —The Designer Group (Pty) Limited — — —Tiger Food Brands Intellectual Property Holding Company (Pty) Limited 269,8 — —Investment and dormant companies 1 393,1 16,7 —Chocolaterie Confiserie Camerounaise — — 3,1
Empowerment entitiesTiger Brands Foundation 63,9 — —Thusani II 12,6 — —
AssociateOceana Group Limited — — 83,1
OtherTiger Brands Employee Share Trust 0,5 3,7 —
Notes:1Interest free with no fixed repayment terms. Not repayable before 30 September 2011.

181Tiger Brands Annual Report 2010
Divisional reviews Governance and sustainability
▲
Annual financial statements
(Rands in millions)
Amounts owed by
related parties1
Amountsowed torelatedparties1
Dividendsreceived
39. RELATED-PARTy DISCLOSURES (continued)
COMPANy2009SubsidiariesSea Harvest Corporation Limited — — 22,8Durban Confectionery Works (Pty) Limited 483,0 — —Tiger Consumer Brands Limited 2,1 — 236,0Tiger Brands Mauritius (Pty) Limited — 256,1 0,7Enterprise Foods (Pty) Limited 0,4 — 270,0Langeberg Holdings Limited 702,4 — —Langeberg Foods Africa (Pty) Limited — 201,6 —The Duntulum Trust 18,9 — —Gloriande NV 0,2 — —The Designer Group (Pty) Limited — — 35,0Tiger Food Brands Intellectual Property Holding Company (Pty) Limited 248,6 — —Investment and dormant companies 1 438,1 19,2 92,7Chocolaterie Confiserie Camerounaise — — 5,6
AssociateOceana Group Limited2 — — 72,0
OtherTiger Brands Employee Share Trust 0,8 8,8 —
Notes:1Interest free with no fixed repayment terms. Not repayable before 30 September 2010.2With effect from 1 April 2009, Oceana was reclassified from a joint venture to an associate.
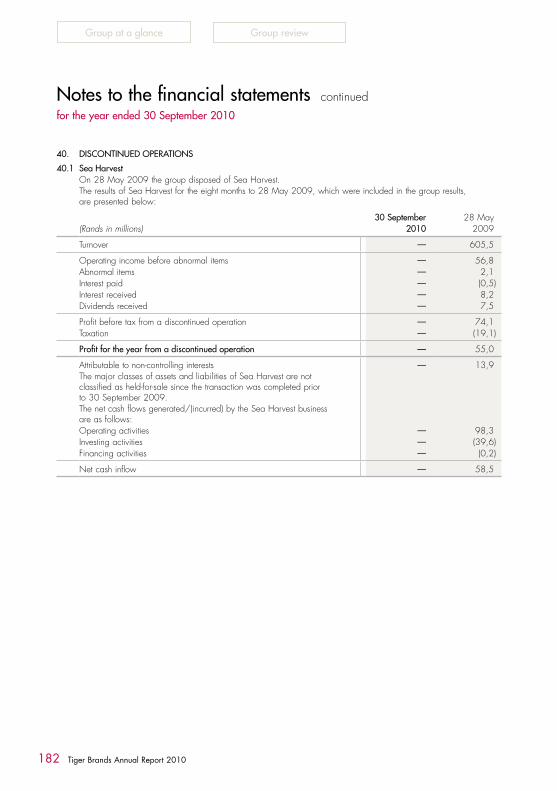
182 Tiger Brands Annual Report 2010
Group at a glance Group review
Notes to the financial statements continuedfor the year ended 30 September 2010
40. DISCONTINUED OPERATIONS
40.1 Sea HarvestOn 28 May 2009 the group disposed of Sea Harvest.The results of Sea Harvest for the eight months to 28 May 2009, which were included in the group results, are presented below:
30 September 28 May(Rands in millions) 2010 2009
Turnover — 605,5
Operating income before abnormal items — 56,8Abnormal items — 2,1Interest paid — (0,5)Interest received — 8,2Dividends received — 7,5
Profit before tax from a discontinued operation — 74,1Taxation — (19,1)
Profit for the year from a discontinued operation — 55,0
Attributable to non-controlling interests — 13,9The major classes of assets and liabilities of Sea Harvest are not classified as held-for-sale since the transaction was completed prior to 30 September 2009.The net cash flows generated/(incurred) by the Sea Harvest business are as follows:Operating activities — 98,3Investing activities — (39,6)Financing activities — (0,2)
Net cash inflow — 58,5

183Tiger Brands Annual Report 2010
Divisional reviews Governance and sustainability
▲
Annual financial statements
GROUP(Rands in millions) 2010 2009
41. IMPACT OF BEE PHASE II TRANSACTION
The impact of the implementation of the BEE Phase II transaction is as follows:Operating loss before abnormal items – IFRS 2 charge (21,0) —Abnormal items (188,4) (12,0)Taxation 35,7 —Dividends paid 11,9 —Cash and cash equivalents 1,1 —Taxation receivable 22,5 —Deferred taxation asset 12,9 —Ordinary share capital and share premium (1 659,2) —Tiger Brands Limited shares held by empowerment trusts 1 543,6 —Share-based payment reserve (82,9) —Non-controlling interests (12,4) —Trade and other payables — (12,0)
42. SUBSEQUENT EVENTS
Class actionOn 26 November 2010, Tiger Consumer Brands Limited received two summonses arising from the admission in 2007 of price fixing in the baking industry. The summonses were issued in respect of purported class actions instituted by several plaintiffs allegedly on behalf of bread consumers and by two distributors allegedly on behalf of bread distributors. The claims relate to damages allegedly suffered by consumers and by distributors as a consequence of price fixing in the bread industry. The company and its legal team are considering the summonses and will respond as is appropriate in law. The amounts claimed are for an amount to be determined by the Court as being damages suffered alternatively R460 156 737,26 in respect of consumers and R9 062 142,00 in respect of the two distributors. Costs of the actions are also being sought by the plaintiffs.
Business combinationsSubsequent to the year end, agreements were signed in terms of which the company will acquire 51% of the existing consumer branded products businesses of East Africa Group (Eth) Plc of Ethiopia and 100% of the biscuit manufacturing operations of Deli Foods of Nigeria Limited. These acquisitions, although not transformational in nature, are regarded as important steps in order to expand and consolidate the company’s African footprint.
Both acquisitions are subject to the fulfilment of various conditions precedent, including regulatory approvals where appropriate, and are expected to be completed early in the new calendar year. These acquisitions are expected to generate a combined annualised turnover of approximately R500 million in the first year. The acquisitions will have no material impact on the company’s headline earnings or net asset value per share in the short term.
Also subsequent to the year end, an agreement in principle has been reached between UAC of Nigeria Plc and Tiger Brands in terms of which Tiger Brands will acquire a 49% interest in the Nigerian food and beverage interests of UAC. The acquisition specifically excludes the franchised quick service restaurants of UAC. UAC is listed on the Nigerian stock exchange and is a well-established and leading private enterprise champion in the economic advancement of Nigeria. The affected UAC businesses reported a total turnover for the financial year ended 31 December 2009 of Naira 9,8 billion which equates to approximately R477 million.
The agreement in principle is subject to approval by UAC shareholders at an extraordinary general meeting of the company, scheduled to take place on 17 December 2010. Thereafter, the proposed transaction will be subject to the necessary Nigerian and South African regulatory approvals as well as the conclusion of appropriate agreements relevant to the joint venture arrangement.

184 Tiger Brands Annual Report 2010
Group at a glance Group review
Annexure A
INTEREST IN SUBSIDIARy COMPANIESIssued Effective Company’s interest
ordinary capital percentage holding Shares at cost Indebtedness
(Rands in millions)2010 2009 2010
%2009
%2010 2009 2010 2009
Designer Group 0,1 0,1 100,00 100,00 396,3 396,3 — —Durban Confectionery Works (Pty) Limited 0,4 0,4 100,00 100,00 63,4 63,4 483,0 483,0Enterprise Foods (Pty) Limited — — 100,00 100,00 49,7 49,7 0,4 0,4Langeberg Holdings Limited 1,6 1,6 100,00 100,00 190,8 190,8 702,4 702,4Langeberg & Ashton Foods (Pty) Limited — — 66,67 66,67 — — — —Tiger Food Brands Intellectual Property Holding Company (Pty) Limited 1,0 1,0 100,00 100,00 17,3 17,3 269,8 248,6Tiger Consumer Brands Limited 0,1 0,1 100,00 100,00 0,1 0,1 (17,8) 2,1Tiger Brands Mauritius2 35,7 35,7 100,00 100,00 337,9 337,9 (236,8) (256,1)Haco Industries Kenya Limited2 11,1 11,1 51,00 51,00 45,5 45,5 — —Chocolaterie Confiserie Camerounaise2 71,8 71,8 74,70 74,70 152,7 152,7 — —Pharma I Investment Holdings Limited3 — — 100,00 100,00 — — 1 227,6 1 227,6Other miscellaneous, property, investment and dormant companies — — 100,00 100,00 2,3 4,8 (33,7) 8,8
1 256,0 1 258,5 2 394,9 2 416,81 Amounts owed to the company 2 867,8 2 893,7
Amounts owed by the company (472,9) (476,9)
2 394,9 2 416,82 All companies are incorporated in South Africa other than four, two of which are incorporated in Mauritius, one in Kenya and one in Cameroon.
3 Previously Adcock Ingram Holdings (Pty) Limited.
All Rand amounts of less than R100 000 are shown as nil in the above table.

185Tiger Brands Annual Report 2010
Divisional reviews Governance and sustainability
▲
Annual financial statements
Annexure B
Annexure C
INTEREST IN ASSOCIATED COMPANIES
Date of financial Effectivestatements percentage holding Nature of business
(Rands in millions) 2010 2009
Empresas Carozzi (Chile) 31/12/2009 24,4 24,4 Food processingOceana Group Limited1 30/09/2010 44,4 45,1 Fishing1With effect from 1 April 2009 Oceana was reclassified from a joint venture to an associate.
OTHER INVESTMENTSEffective GROUP COMPANy
percentage holding Number of shares Number of shares
(Rands in millions)2010
%2009
%2010 2009 2010 2009
Listed investmentsAdcock Ingram Holdings Limited 3,4 3,4 5 856 033 5 896 140 — —National Foods Holdings Limited 26,1 26,1 17 596 696 17 596 696 12 557 991 12 557 991
Unlisted investmentsOrdinary sharesBusiness Partners Limited 0,2 0,2 336 550 336 550 336 550 336 550
The above lists the number of shares held by the group and the company, where material. A register is available for inspection at the registered office of the company.

186 Tiger Brands Annual Report 2010
Group at a glance Group review
Analysis of ordinary shareholdersas at 1 October 2010
REGISTERED SHAREHOLDER SPREADNumber of
holders% of total
shareholdersNumber of
shares% of issued
capital
1—1 000 shares 18 218 78,4 6 017 450 3,2 1 001—10 000 shares 4 151 17,9 12 378 030 6,5 10 001—100 000 shares 717 3,1 21 939 151 11,5 100 001—1 000 000 shares 136 0,6 39 176 281 20,6 1 000 001 shares and above 28 0,1 110 680 993 58,2
Total 23 250 100,0 190 191 905 100,0
PUBLIC AND NON-PUBLIC SHAREHOLDINGS
SHAREHOLDER TyPENumber of
holders% of total
shareholdersNumber of
shares% of issued
capital
Non-public shareholders 14,0 0,1 33 197 639 17,4
• Directors and associates 3,0 0,0 22 980 0,0
• Own holding 1,0 0,0 10 326 758 5,4
• Share trusts/share incentive scheme 3,0 0,0 1 469 939 0,8
• Empowerment Holdings 6,0 0,0 21 375 586 11,2
• Tiger Brands Workers Provident Fund 1,0 0,0 2 376 0,0
Public Shareholders 23 236 99,9 156 994 266 82,6
Total 23 250 100,0 190 191 905 100,0
SUBSTANTIAL INVESTMENT MANAGEMENT AND BENEFICIAL INTERESTS – ABOVE 3%Through regular analysis of STRATE registered holdings, and pursuant to the provisions of Section 140a of the Companies Act, the following shareholders held directly and indirectly equal to or in excess of 3% of the issued share capital as at 1 October 2010:
INVESTMENT MANAGEMENT SHAREHOLDINGSTotal
shareholding %
Public Investment Corporation (PIC) 19 269 152 10,1Lazard Asset Management 11 202 100 5,9Tiger Consumer Brands Limited 10 326 758 5,4Tiger Brands Foundation SPV 9 068 067 4,8Investec Asset Management 8 243 012 4,3Old Mutual Investment Group SA 7 213 665 3,8Tiger Brands Black Managers Trust 7 165 984 3,8Coronation Fund Managers 6 493 710 3,4Blackrock Inc 5 990 699 3,2
Total 84 973 147 44,7

187Tiger Brands Annual Report 2010
Divisional reviews Governance and sustainability
▲
Annual financial statements
6,0m6,5m7,2m7,2m8,2m9,1m10,3m
11,2m
19,3m
5,3m
9,5m
4,4m2,5m
12,1m
0,0m
10,3m
13,8m
21,3m
BlackrockInc
CoronationFund
Managers
Tiger BrandsBlack
ManagersTrust
Old MutualInvestmentGroup SA
Investec AssetManagement
Tiger BrandsFoundation
SPV
TigerConsumerBrands Ltd
LazardAsset
Management
PIC
Share price (R)
Current year shareholding Prior year shareholding Share price over one year
120
130
140
150
160
170
180
190
200
BENEFICIAL SHAREHOLDINGSTotal
shareholding %
Government Employees Pension Fund (PIC) 24 000 137 12,6Tiger Consumer Brands Limited 10 326 758 5,4Tiger Brands Foundation SPV 9 068 067 4,8Tiger Brands Black Managers Trust 7 165 984 3,8Lazard Emerging Markets Fund 6 291 202 3,3
Total 56 852 148 29,9
Investment management shareholding positions above 3% with 12-month change

188 Tiger Brands Annual Report 2010
Group at a glance Group review
Analysis of ordinary shareholders continuedas at 1 October 2010
PREVIOUSLy DISCLOSED HOLDINGS
Investment managers now holding below 3%
INVESTMENT MANAGERTotal
shareholding % Previous %
Dodge & Cox 4 072 043 2,1 4,1
Total 4 072 043 2,1 4,1
Beneficial owners now holding below 3%
BENEFICIAL OWNERTotal
shareholding % Previous %
Dodge & Cox International Stock Fund 4 072 043 2,1 4,1
Total 4 072 043 2,1 4,1
Share price (R)
6,3m7,2m9,1m
10,3m
24,0m
7,5m
0,0m0,0m
10,3m
22,6m
Lazard EmergingMarkets Fund
Tiger BrandsBlack Managers
Trust
Tiger BrandsFoundation SPV
Tiger ConsumerBrands Ltd
GovernmentEmployees Pension
Fund (PIC)
130
140
150
160
170
180
190
200
Current year shareholding Prior year shareholding Share price over one year
Beneficial shareholding positions above 3% with 12-month change

189Tiger Brands Annual Report 2010
Divisional reviews Governance and sustainability
▲
Annual financial statements
GEOGRAPHIC SPLIT OF SHAREHOLDERSGeographic split of investment managers and company related holdings
REGIONTotal
shareholding% of issued
capitalSouth Africa 117 454 714 61,8United States of America and Canada 37 136 319 19,5United Kingdom 12 186 119 6,4Rest of Europe 4 229 593 2,2Rest of world1 19 185 160 10,1Total 190 191 905 100,01Represents all shareholdings except those in the above regions.
GEOGRAPHIC SPLIT OF BENEFICIAL SHAREHOLDERS
REGIONTotal
shareholding% of issued
capitalSouth Africa 128 718 071 67,7United States of America and Canada 38 154 067 20,0United Kingdom 6 664 448 3,5Rest of Europe 7 184 627 3,8Rest of world1 9 470 692 5,0Total 190 191 905 100,01Represents all shareholdings except those in the above regions.
GEOGRAPHIC SPLIT OF BENEFICIAL SHAREHOLDERS
Europe 7,28%Remainder
27,10%
UK 48,12%
Netherlands 14,93%
Norway9,85%
Rest of the world 92,72%
Rest of the world 31,94%
Rest of the world 79,92% USA 96,00%
North America 20,08%
Rest of the world 96,22%
Asia/Pacific 3,78%
South Africa 99,44%African 68,06%
Swaziland 0,11%Remainder 0,04%Namibia
0,41%
Australia17,58%
Singapore28,26%
Remainder34,17%
UAE 20,00%
Bermuda 0,10%Canada 3,90%
Total Europeanholding
Split ofbeneficial shares
Split ofbeneficial shares
Total North Americanholding
Total Asia/Pacificholding
Split ofbeneficial shares
Total Africanholding
Split ofbeneficial shares
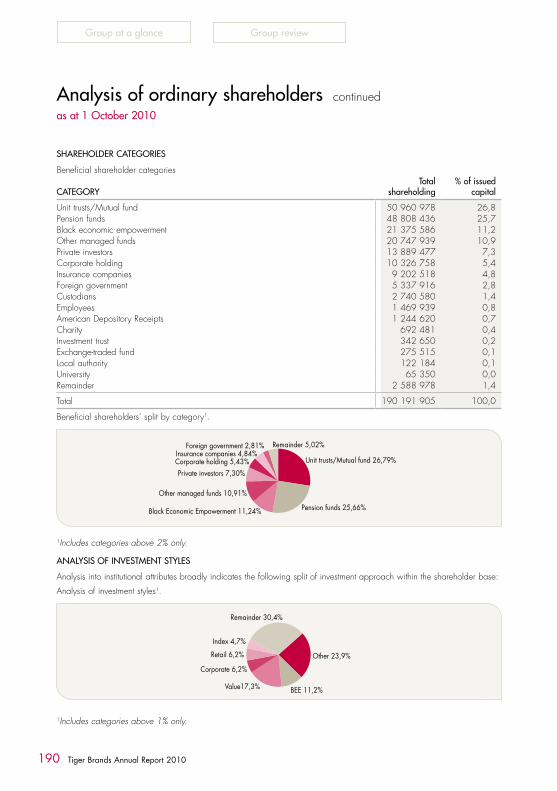
190 Tiger Brands Annual Report 2010
Group at a glance Group review
SHAREHOLDER CATEGORIES
Beneficial shareholder categories
CATEGORyTotal
shareholding% of issued
capital
Unit trusts/Mutual fund 50 960 978 26,8Pension funds 48 808 436 25,7Black economic empowerment 21 375 586 11,2Other managed funds 20 747 939 10,9Private investors 13 889 477 7,3Corporate holding 10 326 758 5,4Insurance companies 9 202 518 4,8Foreign government 5 337 916 2,8Custodians 2 740 580 1,4Employees 1 469 939 0,8American Depository Receipts 1 244 620 0,7Charity 692 481 0,4Investment trust 342 650 0,2Exchange-traded fund 275 515 0,1Local authority 122 184 0,1University 65 350 0,0Remainder 2 588 978 1,4
Total 190 191 905 100,0
Beneficial shareholders’ split by category1.
1Includes categories above 2% only.
ANALySIS OF INVESTMENT STyLES
Analysis into institutional attributes broadly indicates the following split of investment approach within the shareholder base:
Analysis of investment styles1.
1Includes categories above 1% only.
Analysis of ordinary shareholders continuedas at 1 October 2010
Unit trusts/Mutual fund 26,79%
Remainder 5,02%
Pension funds 25,66%Black Economic Empowerment 11,24%
Other managed funds 10,91%
Private investors 7,30%Corporate holding 5,43%Insurance companies 4,84%
Foreign government 2,81%
BEE 11,2%
Other 23,9%
Value17,3%
Corporate 6,2%
Retail 6,2%
Index 4,7%
Remainder 30,4%

191Tiger Brands Annual Report 2010
Divisional reviews Governance and sustainability
▲
Annual financial statements
Shareholders’ diary
Financial year-end 30 SeptemberAnnual general meeting February
Report and accountsAnnouncement of interim report and interim dividend for half-year ending 31 March MayAnnouncement of annual results and final dividend for the year ended 30 September NovemberAnnual report published December
Dividends Declaration PaymentOrdinary shares Interim dividend May July Final dividend November January

192 Tiger Brands Annual Report 2010
Group at a glance Group review
Tiger Brands Limited
Reg No 1944/017881/06
Company secretary
I W M Isdale
Registered office
3010 William Nicol Drive
Bryanston
Sandton
PO Box 78056, Sandton, 2146
Telephone 27 11 840 4000
Telefax 27 11 514 0477
Auditors
Ernst & Young Inc.
Principal banker
Nedbank Limited
Sponsor
J P Morgan Equities Limited
South African share transfer secretaries
Computershare Investor Services (Pty) Limited
70 Marshall Street
Johannesburg
2001
PO Box 61051, Marshalltown, 2107
American Depository Receipt (ADR) facility
ADR Administrator
The Bank of New York Mellon
Shareholder Relations Department for ADRs
PO Box 11258
New York, NY10286
Level I ADR Symbol: T10AY
Website address
http://www.tigerbrands.com
Administration

Divisional reviews Governance and sustainability
▲
Annual financial statements
BASTION GRAPHICS