thunder road report -february 2013
DESCRIPTION
Silver forecast for 2013TRANSCRIPT

This is a marketing communication. It has not been prepared in accordance with legal requirements designed to promote the independence of investment research and is not subject to any prohibition on dealing ahead of the dissemination of investment research.
Thunder Roadreport
Silver: right now (probably) the best asset in the world
For more than a century, the silver price has correlated most closely with a cycle based on the combination of two further statistically significant cycles in silver prices lasting 5.58 years and 31 years, respectively. The next peak in this combined cycle is forecast for July-August 2013, which would imply a new all-time high in the silver price in excess of US$50/oz (the current price is US$31.47/oz.). Having underperformed significantly from their most recent price relative peaks in 2011, the risk/reward trade-off for premier silver mining stocks, like Fresnillo (quoted in London) and Pan American Silver (North America) looks favourable.
February 2013 | Thunder Road report
Paul Mylchreest Market Strategy +44 (0) 20 7107 8049 [email protected]

2 Seymour Pierce equity research
| February 2013 | Thunder Road report
Meanwhile, the silver price has been undergoing a lengthy bottoming out phase following the spike up to US$49.50/oz on 28 April 2011.
Silver price (US$/oz.) since January 2010
10.00
15.00
20.00
25.00
30.00
35.00
40.00
45.00
50.00
55.00
Jan 10 Apr 10 Jul 10 Oct 10 Jan 11 Apr 11 Jul 11 Oct 11 Jan 12 Apr 12 Jul 12 Oct 12 Jan 13
Silver (COMEX:^SI) - Day Close Price
Source: Capital IQ
Before we touch briefly on silver fundamentals, there are grounds for believing that the next six months could be very positive for the silver price – and, therefore, for silver mining stocks.
Silver price cycles
In the early 1970s, Gertrude Shirk of the “Foundation for the Study of Cycles” (FSC) concluded that:
“the 5.58 year cycle appears to be the dominant component in silver prices.”
Another analyst, Jack Gillen, using a different methodology, concluded that there is a 5.64 year cycle in silver prices. Why the silver price displays this pattern of cyclical behaviour remains unclear. It has nothing to do with silver production, which the FSC determined to follow a 12.5 year cycle. Edward R. Dewey, who founded the FSC in 1941, found scores of cycles in financial markets and could only conclude that there was “Something out there” which was responsible.
Gertrude Shirk’s analysis was based on silver prices dating back to 1850. In simple terms, her methodology was to “de-trend” the data before measuring the resulting amplitude of price deviations.
What was so impressive about Shirk’s work in the 1970s was its accuracy with regard to predicting price moves in silver. For example, her assertion in October 1974 was that:
“The cycle analysis indicates that 1974 may be a peak year.”
The silver price peaked at US$6.70/oz on 26 February 1974 and didn’t regain that level until early-1979. Secondly, Shirk argued in 1979 that the model was predicting:
“An ideal crest at 1980.”
Thanks to the efforts of the Hunt brothers, the silver price famously peaked at US$50/oz on 21 January 1980.
Silver price – basing pattern
Cycles in silver prices detected in the 1970s
The predictive ability was excellent back then

Seymour Pierce equity research 3
| February 2013 | Thunder Road report
Silver price (US$/oz.) 1973-75 Silver price (US$/oz.) 1979-80
1.50
2.50
3.50
4.50
5.50
6.50
Feb 73 Apr 73 Jun 73 Aug 73 Oct 73 Dec 73 Feb 74 Apr 74 Jun 74 Aug 74 Oct 74 Dec 74 Jan 75
Silver (COMEX:^SI) - Day Close…
Source: Capital IQ
The next chart shows the close correlation between the actual “de-trended” price of silver versus the predicted 5.58 year cycle during 1901-82. The predicted 5.58-year cycle in the silver price is shown by the dotted line and its actual outcome by the solid black line.
The 5.58 year cycle in the silver price 1901-82
Source: Seymour Pierce
Out of 14 full cycles, the silver price tracked the 5.58 year cycle in broad terms on 11 occasions. On 6 occasions, there were large upward spikes in the silver price which corresponded almost precisely with the predicted peaks in the 5.58-year cycle. These culminated with the two peaks – 1974 and 1980 – mentioned above.
After the 1980 peak, as you can see from the chart below, something “strange” happened and the silver price moved out of “sync” with the predicted 5.58 year cycle for the next four cycles. Indeed, in the period that followed the all-time high in the silver price and the subsequent low in 1982, silver actually moved TOTALLY out of “sync” with the cycle. The silver price made lows or intermediate lows when it should have been making highs.
The 5.58-year cycle
Cycle inversion in the period following the 1980
all-time high
4 Seymour Pierce equity research
| February 2013 | Thunder Road report
One might conclude that the historic correlation of the silver price and the 5.58 year cycle had come to an end. However, two points are worth making. Firstly, from its extensive research, the FSC concluded that so-called “cycle inversions” are fairly common:
“The subject of inversions is very controversial in the study of cycles. It is founded upon the fact that 65% of cycle turns yield profits, however, while cycle timing can identify about 78% of the market turns, an unidentified 13% is the result of inversions. We believe this information to be valuable.”
And:
“Cycles invert about 12-15% of the time”
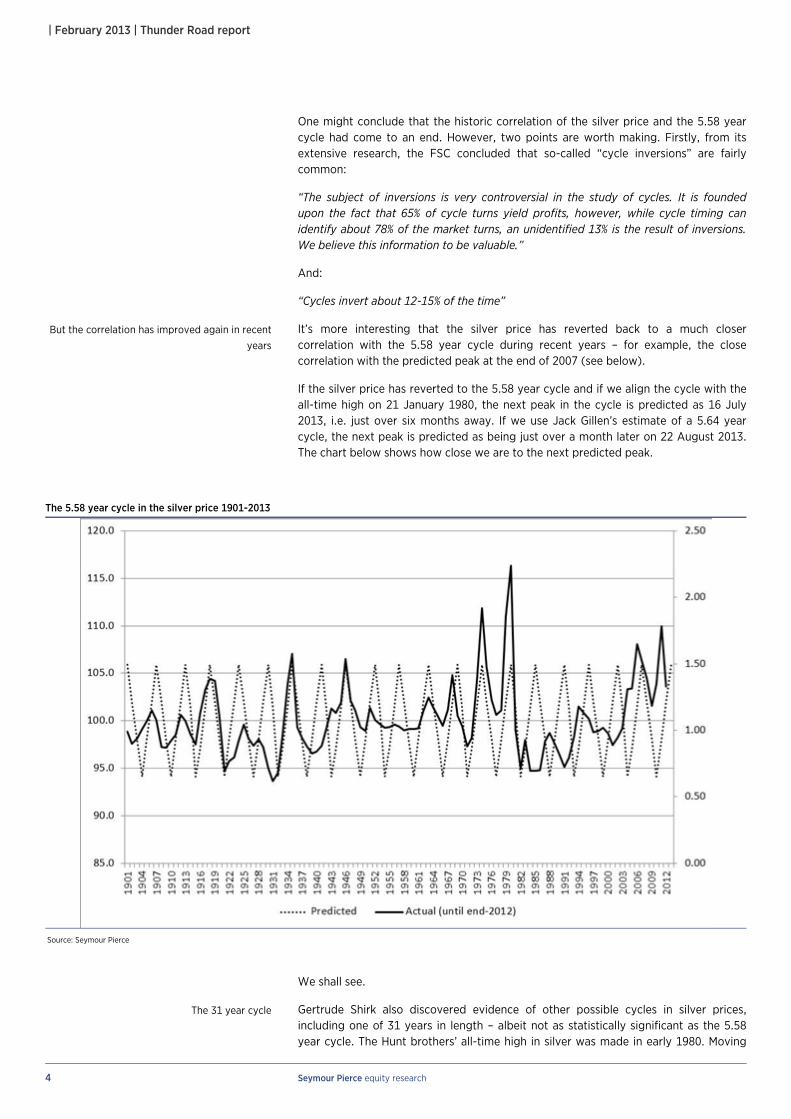
It’s more interesting that the silver price has reverted back to a much closer correlation with the 5.58 year cycle during recent years – for example, the close correlation with the predicted peak at the end of 2007 (see below).
If the silver price has reverted to the 5.58 year cycle and if we align the cycle with the all-time high on 21 January 1980, the next peak in the cycle is predicted as 16 July 2013, i.e. just over six months away. If we use Jack Gillen’s estimate of a 5.64 year cycle, the next peak is predicted as being just over a month later on 22 August 2013. The chart below shows how close we are to the next predicted peak.
The 5.58 year cycle in the silver price 1901-2013
Source: Seymour Pierce
We shall see.
Gertrude Shirk also discovered evidence of other possible cycles in silver prices, including one of 31 years in length – albeit not as statistically significant as the 5.58 year cycle. The Hunt brothers’ all-time high in silver was made in early 1980. Moving
But the correlation has improved again in recent
years
The 31 year cycle
Seymour Pierce equity research 5
| February 2013 | Thunder Road report
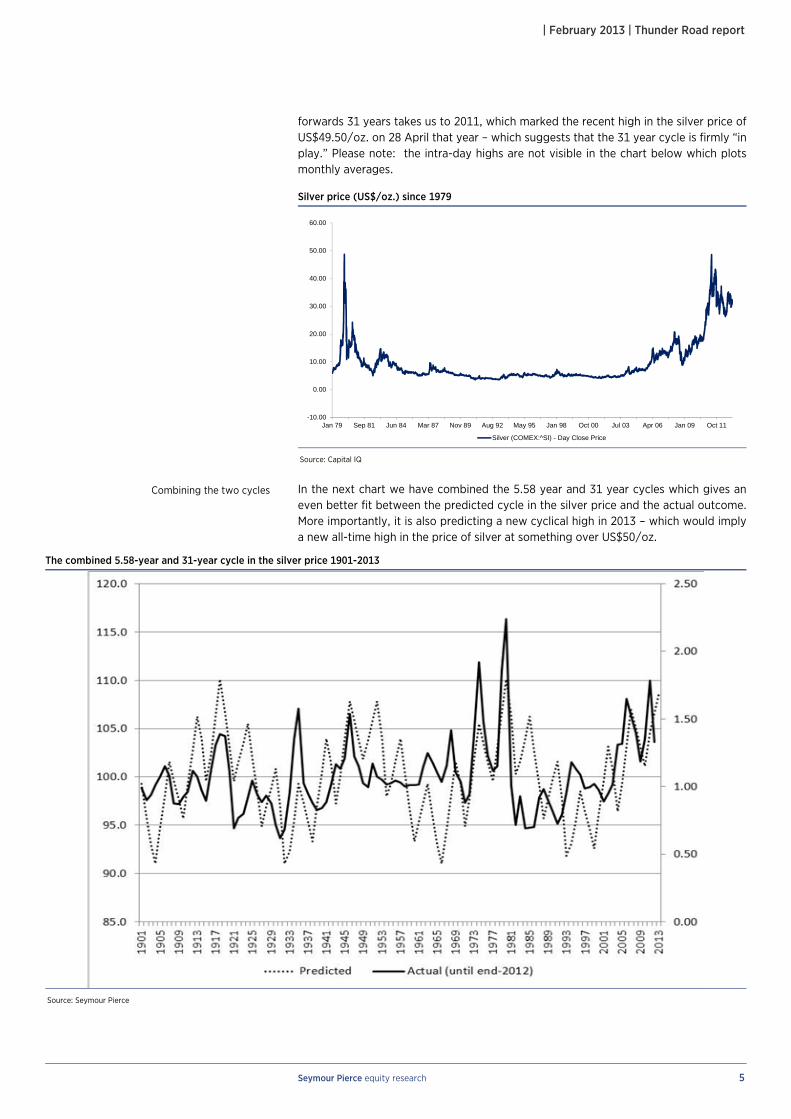
forwards 31 years takes us to 2011, which marked the recent high in the silver price of US$49.50/oz. on 28 April that year – which suggests that the 31 year cycle is firmly “in play.” Please note: the intra-day highs are not visible in the chart below which plots monthly averages.
Silver price (US$/oz.) since 1979
-10.00
0.00
10.00
20.00
30.00
40.00
50.00
60.00
Jan 79 Sep 81 Jun 84 Mar 87 Nov 89 Aug 92 May 95 Jan 98 Oct 00 Jul 03 Apr 06 Jan 09 Oct 11
Silver (COMEX:^SI) - Day Close Price
Source: Capital IQ
In the next chart we have combined the 5.58 year and 31 year cycles which gives an even better fit between the predicted cycle in the silver price and the actual outcome. More importantly, it is also predicting a new cyclical high in 2013 – which would imply a new all-time high in the price of silver at something over US$50/oz.
The combined 5.58-year and 31-year cycle in the silver price 1901-2013
Source: Seymour Pierce
Combining the two cycles

6 Seymour Pierce equity research
| February 2013 | Thunder Road report
More on the investment case for silver and silver equities
Aside from the analysis of silver price cycles, there is a strong investment case for silver and the related equities and it is worth highlighting a few key issues.
Silver is unique as it is both a monetary metal and an industrial metal. Unlike gold, there are limited above-ground stocks of silver because so much has been consumed in industrial applications. Almost all of the gold ever mined is still available as theoretical supply in the form of bars, coins or jewellery. The official (significantly understated) estimate for the world gold stock is approximately 185,000 tonnes, or 6 billion oz. Nobody knows the level of above-ground silver stocks, although the majority of estimates are in the 1.0-2.0bn oz. range, i.e. between one sixth and one third of the comparable figure for gold.
Of the estimated 185,000 tonnes (6 billion oz.) of above-ground gold stocks, approximately 31,500 tonnes (1 billiion oz.) are reportedly held by the central banks. These institutions are able to lease this gold into the market to affect the price. Central banks, as far as we are aware, have divested their silver reserves.
The long-term gold/silver ratio is currently 49.0x but has averaged 15-16x for several thousand years and, at times, has been considerably lower than this. For example, the ratio was 12.5x during the era of Alexander the Great in the fourth century B.C. and was fixed at 12.0x during the Roman Empire. The ratio started to rise with the progressive demonetisation across Europe and the US in the late nineteenth century, which culminated in China jettisoning the silver standard in 1935.
For more than a decade, however, the gold/silver ratio has been on a declining trend for more than a decade. Taking the latest annual data for mined silver and gold production, there was only 8.3x more silver mined than gold in 2011. Further “reversion to the mean” seems inevitable during the coming years.
Gold/silver price ratio since 1687
Source: Measuring Worth
If we add the recycling of silver scrap, total annual “incremental” supply of silver was 1,018m oz. in 2011 according to the GFMS consultancy. GFMS estimated that total “fabrication” demand for silver in 2011 was 877m oz. Fabrication is defined as industrial applications, photography, jewellery, silverware and coins & medals. This left only 141m oz. of incremental supply for “Implied Net Investment” – which is nothing more than a balancing figure in the GFMS analysis. At an average silver price of US$35.12/oz. in 2011, this amounts to a miniscule sum (in terms of global financial markets) of less than US$5.0bn.
Above-ground silver stocks are estimated to be
lower than those for gold
A significant proportion of gold reserves are held
by central banks
Gold/silver ratio has averaged 15-16x over the
last two thousand years
More “reversion to the mean” is likely
Seymour Pierce equity research 7
| February 2013 | Thunder Road report
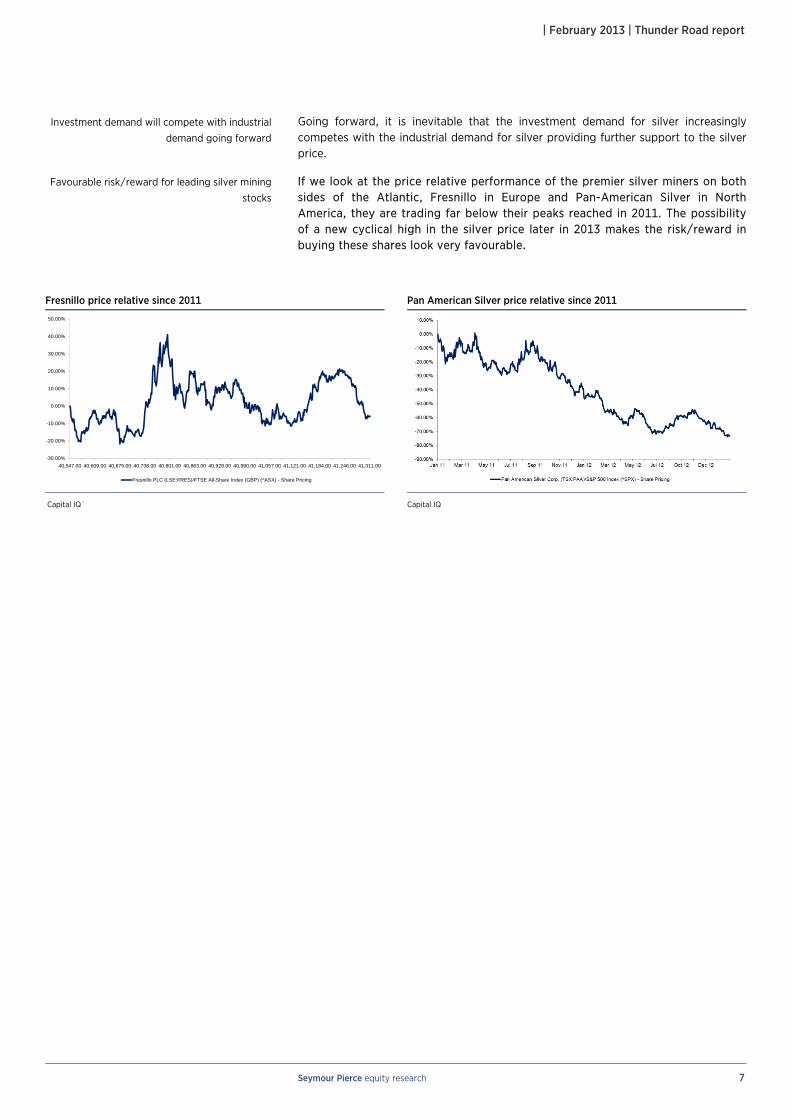
Going forward, it is inevitable that the investment demand for silver increasingly competes with the industrial demand for silver providing further support to the silver price.
If we look at the price relative performance of the premier silver miners on both sides of the Atlantic, Fresnillo in Europe and Pan-American Silver in North America, they are trading far below their peaks reached in 2011. The possibility of a new cyclical high in the silver price later in 2013 makes the risk/reward in buying these shares look very favourable.
Fresnillo price relative since 2011 Pan American Silver price relative since 2011
-30.00%
-20.00%
-10.00%
0.00%
10.00%
20.00%
30.00%
40.00%
50.00%
40,547.00 40,609.00 40,675.00 40,738.00 40,801.00 40,863.00 40,928.00 40,990.00 41,057.00 41,121.00 41,184.00 41,246.00 41,311.00
Fresnillo PLC (LSE:FRES)/FTSE All-Share Index (GBP) (^ASX) - Share Pricing
Capital IQ` Capital IQ
Investment demand will compete with industrial
demand going forward
Favourable risk/reward for leading silver mining
stocks

Seymour Pierce Limited 20 Old Bailey, London EC4M 7EN
Switchboard: 020 7107 8000Corporate Finance fax: 020 7107 8100 Research + Sales fax: 020 7107 8102
www.seymourpierce.com
Key to material interests 1 The analyst has a personal holding of the securities issued by the company, or of derivatives
related to such securities. 2 Seymour Pierce Limited or an affiliate owns more than 5% of the issued share capital of the
company. 3 Seymour Pierce Limited or an affiliate is party to an agreement with the company relating to the
provision of investment banking services, or has been party to such an agreement within the past 12 months. Our corporate broking agreements include a provision that we will prepare and publish research at such times as we consider appropriate.
4 Seymour Pierce or an affiliate has been lead manager or co-lead manager of a publicly disclosed offer of securities for the company within the past 12 months.
5 Seymour Pierce is a market maker or liquidity provider in the securities issued by the company. 6 Seymour Pierce is party to an agreement with the company relating to the production of research.
Distribution of ratings Our research ratings are defined with reference to the absolute return we expect over the next 12 months:
Rating Definition
Buy Absolute return expected to be more than 10%
Add Absolute return expected to be between 5% and 10%
Hold Absolute return expected to be between -5% and +5%
Reduce Absolute return expected to be between -5% and -10%
Sell Absolute return expected to be less than -10% As from 25 October 2010 the nomenclature of our recommendation was changed. Prior to that time Add recommendations were described as Outperform and Reduce recommendations were described as Underperform.
As at 31 December 2012 the distribution of all our published recommendations is as follows:
Rating Proportion of recommendations
BUY 53.8% (of which 54.5% are provided with investment banking services)
ADD 4.9% (of which 14.3% are provided with investment banking services)
HOLD 20.3% (of which 10.3% are provided with investment banking services)
REDUCE 7.0% (of which 0.0%% are provided with investment banking services)
SELL 6.3% (of which 0.0% are provided with investment banking services)
NONE 7.7% (of which 90.9% are provided with investment banking services)
Important Notes Our research recommendations are issued and approved for distribution within the United Kingdom bySeymour Pierce Limited only to eligible counterparties and professional clients as defined under the FSA rules. Our research is not directed at, may not be suitable for and should not be relied upon by any other person.The information contained in our research is compiled from a number of sources and is believed to be correct, but cannot be guaranteed. It is not to be construed as an offer, invitation or solicitation to buy or sell anysecurities of any of the companies referred to within it. All statements made and opinions expressed are madeas at the date on the face of the material and are subject to change without notice. Where prices of securities are mentioned, these are the mid-market prices as at the close-of-business on the business day immediatelypreceding the date of the research. The meanings of our research ratings, together with the proportion of ourrecommendations issued during the previous quarter carrying each rating, is set out on our website atwww.seymourpierce.com. Seymour Pierce Limited and/or its associated companies and ultimate holdingcompany may from time-to-time provide investment or other services to, or solicit such business from, any ofthe companies referred to in research material. In addition, they and/or their directors and employees and/orany connected persons may have an interest in the securities of any of the companies in the report and mayfrom time-to-time add to or dispose of such interests. Details of the significant conflicts relating to thecompanies that we research are set out on our website www.seymourpierce.com, together with a summary of our policies for managing conflicts of interest.
Seymour Pierce does not meet all of the FSA standards for managing conflicts of interest, as a result ourresearch should not be regarded as an impartial or objective assessment of the value or prospects of itssubject matter, though of course we will always ensure that it remains clear, fair and not misleading.
Seymour Pierce Limited is authorised and regulated by the Financial Services Authority, and is a member of the London Stock Exchange.
FTSE®”, "FT-SE®", "Footsie®", “FTSE4Good®” and “techMARK are trade marks jointly owned by the LondonStock Exchange Plcand The Financial Times Limited and are used by FTSE International Limited (“FTSE”) under licence. “All-World®”, “All-Share®” and“All-Small®” are trade marks of FTSE. "The FTSE INDICES] are calculatedby FTSE. FTSE does not sponsor, endorse or promote [this presentation] and is not in any wayconnected to itand does not accept any liability in relation to its issue. All copyright and database rights in the index valuesand constituent list vest in FTSE. Seymour Pierce Limited has obtained full licence from FTSE to use suchcopyright and database rights in the creation of this presentation.