thèse de doctorat - polytechnique montréal - mesamhassanipour.pdf · universitÉ de montrÉal...
TRANSCRIPT
ÉCOLE POLYTECHNIQUE DE MONTRÉAL
FATIGUE CRACK PROPAGATION UNDER VARIABLE AMPLITUDE LOADING IN
STEELS USED IN FRANCIS TURBINE RUNNERS
MEYSAM HASSANIPOUR
DÉPARTEMENT DE GÉNIE MÉCANIQUE
ÉCOLE POLYTECHNIQUE DE MONTRÉAL
THÈSE PRÉSENTÉE EN VUE DE L’OBTENTION
DU DIPLÔME DE PHILOSOPHIAE DOCTOR
(GÉNIE MÉCANIQUE)
OCTOBRE 2017
© Meysam Hassanipour, 2017.
UNIVERSITÉ DE MONTRÉAL
ÉCOLE POLYTECHNIQUE DE MONTRÉAL
Cette thèse intitulée :
FATIGUE CRACK PROPAGATION UNDER VARIABLE AMPLITUDE LOADING IN
STEELS USED IN FRANCIS TURBINE RUNNERS
présentée par : HASSANIPOUR Meysam
en vue de l’obtention du diplôme de : Philosophiae Doctor
a été dûment acceptée par le jury d’examen constitué de :
M. VADEAN Aurelian, Doctorat, président
M. TURENNE Sylvain, Ph. D., membre et directeur de recherche
M. LANTEIGNE Jacques, Ph. D., membre et codirecteur de recherche
Mme BROCHU Myriam, Ph. D., membre
M. LAROUCHE Daniel, Ph. D., membre externe

iii
DEDICATION
I hereby dedicate this thesis
to everyone who contributes to
better understanding of
the phenomena in this universe.

iv
ACKNOWLEDGEMENTS
First of all, I would like to thank Yves Verreman, who is more than just a supervisor for me; He
taught me how to conduct research, how to think, and how to express myself. He helped me to gain
knowledge in this field and also contributed to my writing and speaking skills. I am grateful to
have him as a supervisor and thankful for his great contribution to this thesis.
I would also like to thank senior researcher, Jacques Lanteigne, who co-supervised me and gave
me access to the facilities at Institut de Recherche d’Hydro-Québec (IREQ), Hydro-Québec’s
research center. Jianqiang Chen had a remarkable contribution in the beginning of this project and
helped me to plan and develop the experimental program, so I am grateful to him for his help. I
would like to thank Carlo Baillargeon who always found time to help me regarding problems that
I encountered with the hydraulic machines during my 2-year experimental program at IREQ. I
would also like to thank Stéphane Godin who supported me morally and scientifically while I was
conducting my experiments. I am also thankful for the help and support I received from other
researchers and technicians at IREQ.
I am grateful to the Natural Science and Engineering Research Council of Canada, Alstom
Renewable Power Canada and Hydro-Québec Research Institute for their support.
Finally, I would like to thank my family who supported from a big distance. My dear friends Matjaz
Panjan and Pierre Schell who put their time on reading and correcting some parts of this manuscript.
I appreciate the help and encouragement of my beautiful friends in Montreal that kept me motivated
during these 6 years. Thanks to my new friends here in Japan, especially Fransisca van Esterik and
Ziane Izri, for their support and encouragement to reach the end of the line.
v
RÉSUMÉ
Les turbines hydrauliques sont soumises à de très grands nombres de cycles à faible amplitude de
contrainte et à haute fréquence. Ces petits cycles sont générés par des phénomènes hydrauliques et
sont superposés à une contrainte statique de tension. Aussi, dépendant des conditions de
fonctionnement, il est possible d’avoir superposé aux petits cycles un plus faible nombre de grands
cycles à forte amplitude de contrainte et basse fréquence. On a ainsi en pratique une superposition
de petits cycles, de grands cycles et d’une contrainte statique de tension durant les 70 ans de durée
de vie de la turbine.
Les turbines hydrauliques qui sont fabriquées à partir des aciers AISI 415, ASTM A516, et AISI
304L (notés 415, A516, et 304L pour simplification) sont soumises à de telles contraintes cycliques
et statique. Ces contraintes ont pour effet de favoriser la propagation des défauts existants dans les
roues des turbines et peuvent mener à leur rupture.
Pour éviter la propagation des fissures, les petits cycles doivent induire un ΔK qui est en dessous
du seuil de fatigue. Néanmoins, les grands cycles peuvent contribuer à propager ces fissures. Ainsi,
pour prédire la vitesse de propagation des fissures dans de telles conditions de cycles superposés,
on a recours à la sommation linéaire de dommage (SLD). Il a été observé que les grands cycles
superposés aux petits cycles peuvent induire une diminution du seuil de fatigue des petits cycles.
Différentes procédures ont été proposées dans la littérature pour mesurer les seuils associés au
petits cycles seuls et avec superposition des grands cycles. Cependant, la plupart des procédures ne
minimise pas la fermeture induite lors de la mesure du seuil conduisant ainsi à une surestimation
de leur valeur. La présente étude propose de nouvelles procédures d’essais pour réduire la
fermeture lors de la mesure du seuil de fatigue pour les aciers mentionnés précédemment. De plus,
différentes études ont démontré que les fissures peuvent se propager plus rapidement sous l’effet
des grands cycles que ce que prédit la SLD. Nous vérifierons ainsi la précision de la prédiction
LDS par rapport aux mesures de propagation.
Dans une première étude, la propagation des fissures par l’interaction de petits et de grands cycles
est caractérisée dans les trois aciers. Les cycles de base sont entrecoupés par les grands cycles. Les
vitesses de propagation des fissures par les cycles de base et les grands cycles de sous-charges sont
additionnées dans la SLD pour évaluer la vitesse de propagation de fissure. Les mesures
expérimentales de vitesse de propagation en sous-charges périodiques sont ensuite comparées avec
vi
la prévision de la SLD. Le ratio entre la mesure de propagation de fissure et la prédiction SLD est
définie comme facteur d’accélération.
Les résultats montrent que les mesures de propagation par les sous-charges périodiques dans l’acier
415 sont proches de celles déterminées par la méthode de SLD. Cependant, le facteur d’accélération
est égal à trois dans l’acier 304L. Des valeurs intermédiaires sont obtenues pour l’acier A516. On
montre que le facteur d’accélération est directement relié au coefficient d’écrouissage de chacun
des aciers. En ordre croissant, l’acier 415 a le plus faible coefficient d’écrouissage, suivi par l’acier
A516 et par l’acier 304L.
Les observations fractographiques montrent que la sous-charge cause une accélération de la
propagation de fissure pendant les cycles de base. La cause de cette accélération est attribuée à une
combinaison de contrainte résiduelle en tension et d’écrouissage causée par les sous-charges.
Une deuxième étude avait pour but de mesurer le seuil de fatigue des petits cycles (cycles de base)
et de vérifier comment il pouvait être diminué par la superposition de grands cycles (sous-charges
périodiques). Les essais de fatigue de cette seconde étude ont été réalisés dans la région du seuil de
propagation sur les aciers avec le plus petit et le plus grand facteur d’accélération, soit les aciers
415 et 304L respectivement.
Le ratio de nombre de cycles de base sur nombre de sous-charges est noté n. Deux procédures
d’essais ont été realisés. Le premier a été realisé par une reduction de ΔK pour mesurer un seuil
conventionnel, ΔKth,conv, de 2 × 10⁻⁷ mm/cycle en amplitude constante et avec les sous-charges
périodiques avec différents n. Le deuxième procédure a été realisé par une croissance de ΔKBL de
zero avec les sous-charge periodiques pour n = 1.25 × 10³ pour atteindre un seuil réel, ΔKth,true,
avec une vitesse de propagation de 6.7 × 10⁻⁹ mm/cycle et ensuite ΔKth,conv.
Le seuil de fatigue des petits cycles ne décroît pas pour n > 1.25 × 10⁵. Le nombre de petits cycles
est de l’ordre de 7 × 10¹⁰ pendant une durée de vie de 70 ans. Le nombre de grands cycles ne doit
donc pas dépasser 5.6 × 10⁵ cycles. Lorsque n < 105, le seuil de fatigue commence à décroître.
Cette décroissance est moins importante dans le 415 que dans le 304L. Il a été démontré que le
seuil de fatigue décroît 5 fois plus quand la vitesse de propagation est en dessous de 6.7 × 10⁻⁹
mm/cycle par rapport à 2 × 10⁻⁷ mm/cycle.
Les contraintes résiduelles de tension sont induites dans les roues lors de la fabrication et du
soudage. Ces contraintes augmentent le facteur d’intensité de contrainte maximal, Kmax, induit aux
défauts et peuvent favoriser la propagation des fissures. L’effet d’une augmentation de Kmax sur le

vii
seuil de fatigue en amplitude constante et sous-charges périodiques doit être étudiée. Il a été
démontré qu’une augmentation de Kmax décroît légèrement les deux seuils.
viii
ABSTRACT
Hydraulic turbine runners are subjected to a very large number of cycles with small stress
amplitudes at high frequencies. These cycles are generated by hydraulic phenomena and are
superimposed to a tensile static stress. Depending on the operating conditions, much lower number
of large cycles are generated with large stress amplitudes at low frequencies. As a summary, the
whole stress spectrum consists of small cycles superimposed to a tensile static stress that is intercut
with large cycles during the 70 years design life of turbine runners.
Turbine runners, which are fabricated from AISI 415, ASTM A516, and AISI 304L steels (i.e.
called 415, A516 and 304L for simplicity), are subjected to the aforementioned stress cycles. The
imposed stress spectrum propagates the existing defects or cracks in turbine runners and may lead
to their failure.
In order to avoid crack propagation, the small cycles should induce a ΔK that is lower than the
fatigue threshold. Nonetheless, the crack can grow due to large cycles. As a result, linear damage
summation (LDS) is employed to predict the crack growth. The large cycles superimposed to small
cycles can also induce a decrease in fatigue threshold of the small cycles.
Different test procedures have been proposed to measure the fatigue threshold of small cycles and
the ones superimposed to large cycles; however, most of them do not minimize the crack closure
while reaching the fatigue threshold leading to an overestimation of fatigue thresholds. In this study
new test procedures are proposed in order to minimize crack closure while reaching the fatigue
thresholds in turbine runner steels. Different studies have shown that crack can grow faster than
the LDS prediction due to the interaction between large cycles. Therefore, we verify the precision
of LDS prediction compared to the measured crack growth rates.
In this first study, crack growth due to the interaction between two large cycles is investigated in
the three aforementioned turbine runner steels. Baseline cycles are periodically intercut by an
underload cycle. This variable amplitude loading is hereafter called periodic underloads. Crack
growth rates of baseline cycles and underload cycles are summated in LDS to predict crack growth
under periodic underloads. Crack growth measured under periodic underloads is then compared to
LDS prediction. A ratio between the measured and predicted crack growth, that is greater than
unity, is defined as an acceleration factor.
Results show that the measured crack growths under periodic underloads in the 415 steel are close
to the ones predicted by LDS. On the other hand, the acceleration factor in the 304L steel can reach

ix
up to three. Intermediate values are obtained for the A516 steel. We show that there is a direction
relationship between the strain hardening exponent and the acceleration factors in each steel. In
increasing order, the 415 steel has the lowest monotonic strain hardening exponent, followed by
A516 and 304L steels.
The fractography analysis showed that an underload followed by baseline cycles causes an increase
in crack growth during baseline cycles, which leads to acceleration factors. It is presumed that an
underload induces a combination of tensile residual stress and strain hardening that increase crack
growth during subsequent baseline cycles.
In the second study, the aim is to measure the fatigue threshold of small cycles (baseline cycles)
and to verify its reduction due to large cycles (periodic underloads) are called periodic underloads..
Given that these tests in this region are time-consuming, fatigue tests were only conducted on steels
with the lowest and highest acceleration factors in the first study; thus, the 415 and 304L steels,
respectively.
The ratio of the number of baseline cycles over number of periodic underloads is defined as n. Two
load procedures were conducted to investigate the effect of underloads on the baseline cycles. A
first load procedure was conducted with decreasing ΔK to measure a conventional fatigue threshold,
ΔKth,conv, at a crack growth rate of 2 × 10⁻⁷ mm/cycle under constant amplitude loading and under
periodic underloads at different n ratios. Then a second load procedure was conducted with
increasing ΔKBL from zero to measured ΔKth,true at a crack growth rate of 6.7 × 10⁻⁹ mm/cycle and
ΔKth,conv under periodic underloads at n = 1.25 × 10³.
The fatigue threshold of small cycles does not decrease for n > 1.25 × 10⁵. In turbine runners, the
number of small cycles during 70 years of design life (about 7 × 10¹⁰). In order to avoid a decrease
in the fatigue threshold, the number of large cycles (periodic underloads) should be kept below
5.6 × 10⁵. The fatigue threshold of small cycles starts to decrease for n < 1.25 × 10⁵. This decrease
is lower for the 415 steel as compared to 304L. The decrease in fatigue threshold due to periodic
underloads is about five times higher when it is measured at 6.7 × 10⁻⁹ mm/cycle.
Tensile residual stress is induced in turbine runners during the fabrication and welding procedure.
This stress increases the tensile static stress in runners, which leads to an increase in the Kmax at the
defect tip. As a result, the effect of an increase in the Kmax on crack growth under constant and
periodic underloads was also investigated. It is revealed that an increase in the Kmax slightly
decreases the fatigue threshold under constant and under periodic underloads.
x
TABLE OF CONTENTS
DEDICATION ............................................................................................................................... iii
ACKNOWLEDGEMENTS ............................................................................................................ iv
RÉSUMÉ .......................................................................................................................................... v
ABSTRACT ................................................................................................................................. viii
TABLE OF CONTENTS ................................................................................................................. x
LIST OF TABLES ....................................................................................................................... xiii
LIST OF FIGURES ....................................................................................................................... xiv
LIST OF SYMBOLS AND ABBREVIATIONS....................................................................... xviii
CHAPTER 1 INTRODUCTION ..................................................................................................... 1
1.1 Context.................................................................................................................................... 1
1.2 Problematics ........................................................................................................................... 3
1.3 Research objectives ................................................................................................................ 4
1.4 Outline of the thesis ................................................................................................................ 5
CHAPTER 2 LITERATURE REVIEW .......................................................................................... 6
2.1 Brief historical review ............................................................................................................ 6
2.2 Approaches in structural fatigue design ................................................................................. 6
2.2.1 Total life approach ........................................................................................................... 6
2.2.2 Defect tolerant approach .................................................................................................. 7
2.3 Fatigue life .............................................................................................................................. 7
2.3.1 Crack nucleation .............................................................................................................. 8
2.3.2 Short crack growth ........................................................................................................... 9
2.3.3 Long crack growth ........................................................................................................... 9
2.4. Crack growth under constant amplitude loading ................................................................. 12
2.4.1 Crack growth regions ..................................................................................................... 12
2.4.2 Crack closure ................................................................................................................. 15
2.4.3 Crack growth prediction methods .................................................................................. 23
2.5 Crack growth under variable amplitude loading .................................................................. 25
2.5.1 Basics and definitions .................................................................................................... 25
2.5.2 Effects of overloads and underloads in crack growth regions ....................................... 26
2.5.3 Crack growth prediction methods .................................................................................. 31
2.6 Conclusion of the literature .................................................................................................. 36

xi
CHAPTER 3 METHODOLOGY AND EXPERIMENTAL PROCEDURE ................................ 38
3.1 Methodology ......................................................................................................................... 38
3.1.1 Stress spectra in turbine runners .................................................................................... 38
3.1.2 Stress spectra simplifications ......................................................................................... 41
3.2 Experimental procedure ........................................................................................................ 44
3.2.1 Material characterization ............................................................................................... 44
3.2.2 Tensile testing ................................................................................................................ 45
3.2.3 Fatigue testing ................................................................................................................ 45
CHAPTER 4 ORGANIZATION OF THE FOLLOWING SECTIONS ....................................... 49
CHAPTER 5 CRACK GROWTH UNDER CONSTANT AMPLITUDE LOADING ................. 51
5.1 ASTM load procedure .......................................................................................................... 51
5.2 Materials and experimental procedures ................................................................................ 51
5.2.1 Materials ........................................................................................................................ 51
5.2.2 Fatigue testing ................................................................................................................ 51
5.3 Results .................................................................................................................................. 52
5.4 Discussion ............................................................................................................................. 54
5.4.1 Plastic zone size and phase transformation .................................................................... 54
5.4.2 Crack path irregularities ................................................................................................. 56
CHAPTER 6 ARTICLE 1: EFFECT OF PERIODIC UNDERLOADS ON FATIGUE CRACK
GROWTH IN THREE STEELS USED IN HYDRAULIC TURBINE RUNNERS ..................... 58
6.1 Introduction .......................................................................................................................... 61
6.2 Materials ............................................................................................................................... 64
6.2.1 Chemical compositions and heat treatments .................................................................. 64
6.2.2 Microstructural characterization and tensile properties ................................................. 65
6.3 Experimental procedures ...................................................................................................... 67
6.3.1 Loading parameters ........................................................................................................ 67
6.3.2 Fatigue testing ................................................................................................................ 68
6.4 Results .................................................................................................................................. 70
6.4.1 Constant amplitude loading ........................................................................................... 70
6.4.2 Periodic underloads ........................................................................................................ 74
6.5 Discussion ............................................................................................................................. 78
6.6 Conclusions .......................................................................................................................... 80
xii
CHAPTER 7 ARTICLE 2: FATIGUE THRESHOLD AT HIGH STRESS RATIO UNDER
PERIODIC UNDERLOADS IN TURBINE RUNNER STEELS ................................................. 82
7.1 Introduction .......................................................................................................................... 84
7.2 Materials and experimental procedure ................................................................................. 89
7.2.1 Materials ........................................................................................................................ 89
7.2.2 Fatigue testing ................................................................................................................ 90
7.3 Results and discussion .......................................................................................................... 94
7.3.1 First load procedure ....................................................................................................... 94
7.3.2 Second load procedure ................................................................................................... 98
7.4 Conclusions ........................................................................................................................ 100
CHAPTER 8 GENERAL DISCUSSION .................................................................................... 102
8.1 Crack growth under constant amplitude loading ................................................................ 102
8.2 Crack growth under periodic underloads ............................................................................ 105
CHAPTER 9 CONCLUSION AND RECOMMENDATIONS ................................................... 112
9.1 Conclusions ........................................................................................................................ 112
9.2 Further recommendations ................................................................................................... 113
REFERENCES ............................................................................................................................. 115

xiii
LIST OF TABLES
Table 6.1 Typical load pattern for a Francis turbine runner [1] ..................................................... 61
Table 6.2 Chemical compositions of studied materials (wt. %) ..................................................... 64
Table 6.3 Average prior austenite grain size on the three orthogonal planes of each steel (μm) .. 66
Table 6.4 Tensile properties of the three wrought steels in L and T directions at room temperature
........................................................................................................................................................ 67
Table 6.5 Maximum SIF at the tip of initial defects corresponding to runner lifetimes of 20 and
70 years .......................................................................................................................................... 68
Table 6.6 Loading parameters for POV and SS sequences ............................................................ 68
Table 6.7 Parameters of Walker equation for each steel ................................................................ 73
Table 6.8 Maximum acceleration factors for the three steels at both Kmax and n .......................... 75
Table 6.9 Comparison of measured crack growth with different prediction methods for the three
steels (acceleration factors are calculated at Kmax,70, Ψ = 0.33 and n = 10) ................................... 77
Table 8.1 Comparison of tensile properties in the old and new A516 steel with ASTM A516...106
Table 8.2 Comparison of acceleration factors in the old and new A516 steels at n = 3 and 10 at
Kmax = 19.44 MPa.m1/2 ................................................................................................................. 107

xiv
LIST OF FIGURES
Figure 1.1 Hydraulic Francis turbine and runner components ......................................................... 1
Figure 2.1 Different periods of fatigue life [14]...............................................................................7
Figure 2.2 Slips bands under a) monotonous load, and b) cyclic load [11] ..................................... 8
Figure 2.3 Stress intensity factor at the tip of a sharp crack in an infinite plane [14] .................... 10
Figure 2.4 a) Three load modes of fatigue crack in a specimen, and b) monotonous plastic zones
for each load mode under plane stress and plane stress using the Von Mises yield criterion
[21]..................................................................................................................................................11
Figure 2.5 Crack growth rates versus ΔK in three different regions (adapted from [34]) ............. 13
Figure 2.6 Two different procedures to measure the fatigue threshold, a) constant R ratio (ASTM
standard), b) constant Kmax [32, 37]................................................................................................ 15
Figure 2.7 Crack growth rates versus ΔKeff in the three different crack propagation regions
[25, 31] ........................................................................................................................................... 16
Figure 2.8 a) Variation in plastic zone throughout the thickness, and b) variations in Kcl at three
different ΔK due to a decrease in thickness in an 7075-T6 aluminum alloy specimen [21, 49] .... 17
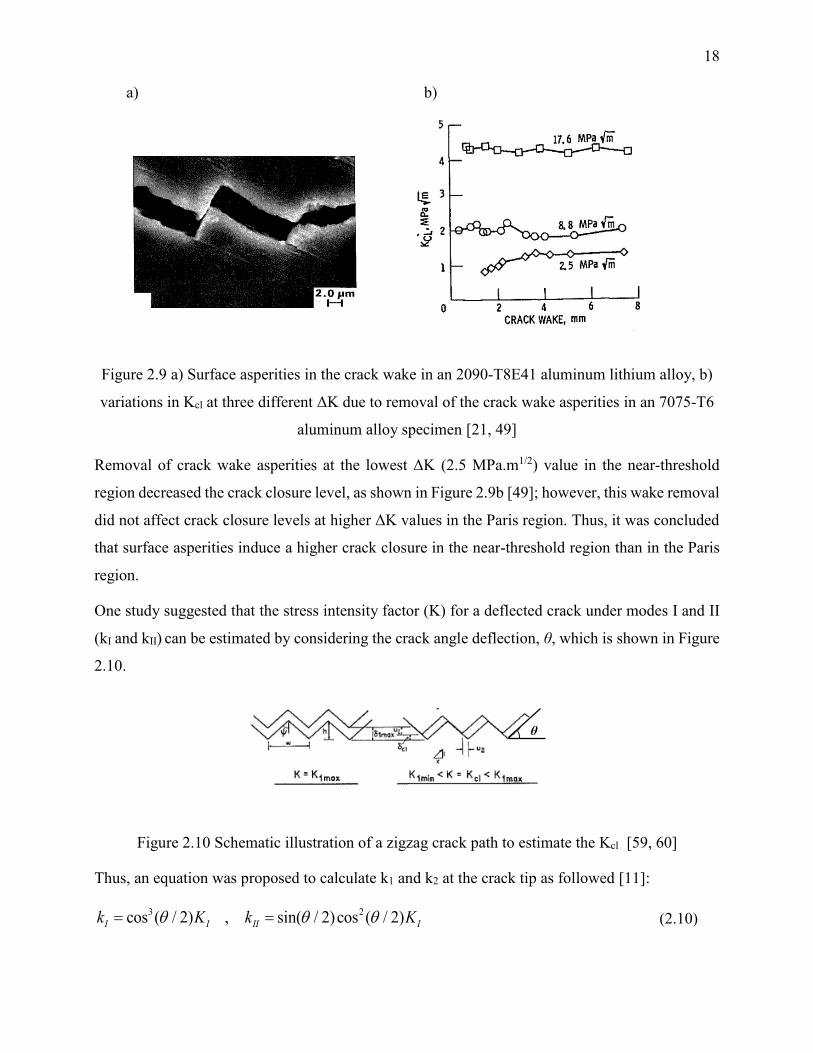
Figure 2.9 a) Surface asperities in the crack wake in an 2090-T8E41 aluminum lithium alloy, b)
variations in Kcl at three different ΔK due to removal of the crack wake asperities in an 7075-T6
aluminum alloy specimen [21, 49] ................................................................................................. 18
Figure 2.10 Schematic illustration of a zigzag crack path to estimate the Kcl [59, 60]................. 18
Figure 2.11 Crack closure mechanisms at different crack growth regions at R = 0.05 [29] ......... 20
Figure 2.12 Schematic of load and crack opening displacement measured from crack mouth clip
gauges behind the crack tip ............................................................................................................ 21
Figure 2.13 Test procedures to determine the SIF corresponding to the crack propagation, a) at
low R ratios, b) at high R ratios [93-94] ........................................................................................ 22
Figure 2.14 Crack growth after an applied overload, a) crack growth rate as a function of crack
length, b) crack length as a function of number of cycles [108] .................................................... 27
Figure 2.15 Crack growth rates as a function of crack length after an applied overload and
compressive underloads in austenitic stainless steel 316L [118] ................................................... 28
xv
Figure 2.16 Schematic of crack closure variation after an applied overload and underload at
different crack growth regions (adapted from [123]) ..................................................................... 29
Figure 2.17 Two prediction models, a) Wheeler, and b) Willenborg (adapted from [144]) .......... 33
Figure 2.18 Prediction of the crack growth rate following a single overload [148] ...................... 35
Figure 2.19 Example of CORPUS crack closure model in a simplified spectrum [151] ............... 36
Figure 3.1 a) Different regions of a runner blade based on stress magnitude [154], and b) steel
plate filled with epoxy and silicone to protect strain gauges installed on region A of a runner
blade [4]..........................................................................................................................................38
Figure 3.2 Typical stress spectrum imposed on turbine runners with small cycles superimposed
to the highest tensile static stress, a) small cycles with low stress amplitudes, and b) small cycles
with high stress amplitudes (adapted from [155, 156]) .................................................................. 39
Figure 3.3 a) Linear damage summation employed to predict initial defect dimensions that will
not cause rupture for 70 years, b) initial allowable semi-elliptical defect dimensions in different
regions of a blade runner ................................................................................................................ 40
Figure 3.4 Simplified load spectrum with POVs and SS sequences .............................................. 42
Figure 3.5 Simplified load spectrum with small cycles and SS sequences .................................... 43
Figure 3.6 Compact tension specimen installed in an Instron servo-hydraulic machine ............... 46
Figure 5.1 Crack growth rates versus ΔK and ΔKeff at R = 0.1 in the 415 and 304L steels……..53
Figure 5.2 Comparison of crack growth rates at R = 0.1 and 0.7 in the 415 steel ......................... 54
Figure 5.3 Comparison of crack growth rates at R = 0.1 and 0.7 in the 304L steel ....................... 54
Figure 5.4 Microstructure of the 304L in the LS orientation, a) as received, b) close to the
necking of the tensile specimen (L direction) ................................................................................ 55
Figure 5.5 Crack path on the surface of the specimen at ΔKth,conv in the 415 steel at, a) R = 0.1,
and b) R = 0.7 ................................................................................................................................. 56
Figure 5.6 Crack path on the surface of the specimen at ΔKth,conv in the 304L steel at, a) R = 0.1,
and b) R = 0.7 ................................................................................................................................. 56
Figure 6. 1 Different load cycles under variable amplitude loading..............................................62
Figure 6.2 Microstructure of the three wrought steels, a) 415, b) A516, and c) 304L ................... 66
xvi
Figure 6.3 Applied loading sequence on the three steels at constant Kmax, ................................... 69
Figure 6.4 Schematic of crack deflection angle (θ) and crack deflection length (l) ...................... 70
Figure 6.5 Crack path deflection under constant amplitude loading at Kmax,70 and R = 0.1 in the a)
415 steel, b) A516 steel, and c) 304L steel (crack propagates from left to right in the three cases)
........................................................................................................................................................ 71
Figure 6.6 Crack growth rates versus load ratio and corresponding Walker predictions at Kmax,70
........................................................................................................................................................ 72
Figure 6.7 Crack growth rates versus load ratio and corresponding Walker predictions at Kmax,20
........................................................................................................................................................ 72
Figure 6.8 Fatigue striations on fatigue surfaces under constant amplitude loading at Kmax,20, (a)
415 steel at R = 0.1, (b) A516 steel at R = 0.1, c) 304L steel at R = 0.1, and d) 304L steel at R =
0.7 (crack propagates from left to right in all cases) ...................................................................... 74
Figure 6.9 Acceleration factors for the three steels at Kmax,70 and n = 10 (curves are obtained from
a third order polynomial regression of the data) ............................................................................ 76
Figure 6.10 Acceleration factors for the three steels at Kmax,20 and n = 10 (curves are obtained
from a third order polynomial regression of the data) ................................................................... 76
Figure 6.11 Striations on fatigue surfaces in the 304L steel at Kmax,20 under periodic underloads
(RBL = 0.7, RUL = 0.1 and n =10). Figure 5.11 (b) is an enlargement of Figure 5.11 (a) (the crack
propagates from left to right in all cases) ....................................................................................... 79
Figure 7.1 Two different load procedures to measure the fatigue threshold at high R ratio, (a)
constant R ratio (ASTM standard), (b) constant Kmax [37]..............................................................86
Figure 7.2 Step-by-step decreasing Kmax load procedure to measure the fatigue threshold at
constant high R ratio under PUL (adapted from [128]) ................................................................. 87
Figure 7.3 Effect of n ratio on the fatigue threshold at high R ratio of an 2024-T351 aluminum
alloy under periodic underloads (PUL) and periodic compressive underloads (PCUL) (adapted
from [128]) ..................................................................................................................................... 88
Figure 7.4 Constant Kmax procedure to measure the fatigue threshold at high R ratio under PUL
(adapted from [132]) ...................................................................................................................... 88
Figure 7.5 Kmax effect on the fatigue threshold under CAL and PUL (adapted from [132]) ......... 89
xvii
Figure 7.6 Microstructure of the two wrought steels: (a) 415 steel, and (b) 304L steel ................ 90
Figure 7.7 Load sequences in the first load procedure with decreasing ΔK under CAL and PUL at
a given n ratio ................................................................................................................................. 92
Figure 7.8 Expected results of load procedure in Figure 7.7 in a da/dN – ΔKBL plot .................... 92
Figure 7.9 Load sequences in the second load procedure with increasing ΔKBL under PUL (n =
103) ................................................................................................................................................. 94
Figure 7.10 Expected results of load procedure in Figure 7.9 in a da/dN – ΔKBL plot .................. 94
Figure 7.11 Log-linear plot of crack growth rates versus SIF range of baseline cycles under CAL
and PUL at different n ratios in the 415 steel ................................................................................. 96
Figure 7.12 Log-linear plot of crack growth rates versus SIF range of baseline cycles under CAL
and PUL at different n ratios in the 304L steel .............................................................................. 96
Figure 7.13 Decrease in ΔKth,conv due to periodic underloads in both steels .................................. 97
Figure 7.14 Effect of periodic underloads at n = 103 on ΔKth,conv and ΔKth,true of the 415 steel in a
log-linear da/dN – ΔKBL plot ......................................................................................................... 99
Figure 7.15 Effect of periodic underloads at n = 103 on ΔKth,conv and ΔKth,true of the 304L steel in
a log-linear da/dN – ΔKBL plot ....................................................................................................... 99
Figure 8.1 Effect of Kmax on crack growth rates at high R ratios in the 415 steel............................104
Figure 8.2 Effect of Kmax on crack growth rates at high R ratios in the 304L steel ..................... 105
Figure 8.3 Log-linear of da/dN versus ΔKBL curve under CAL and PUL in the 415 and the 304L
steels at n = 102............................................................................................................................. 109
Figure 8.4 Crack growth rates versus linear ΔKBL from different test procedures under CAL and
PUL in 415 steel ........................................................................................................................... 111
Figure 8.5 Crack growth rates versus linear ΔKBL from different test procedures under CAL and
PUL in 304L steel ........................................................................................................................ 111
Figure 9.1 Startup and SNL in an operating turbine runner with a repeated sequence...................113
Figure 9.2 Stress spectrum with three stress cycles imposed at the defect tip ............................. 114
xviii
LIST OF SYMBOLS AND ABBREVIATIONS
Latin symbols
a and c length and width of semi-elliptical defect
a20 maximum initial crack length allowed for 20 years design life
a70 maximum initial crack length allowed for 70 years design life
b and t runner blade length and thickness
b’ Basquin equation exponent
c’ Coffin-Manson equation exponent
CR0 and p Walker equation parameters
F and Q geometric functions for calculating stress intensity factor
H strength coefficient
Kmax,OL maximum stress intensity factor of an overload
Kt stress concentration factor
Kmax,th maximum stress intensity factor range at the fatigue threshold
Kmax,1 maximum stress intensity factor of 11.11 MPa.m1/2
Kmax,2 maximum stress intensity factor of 19.43 MPa.m1/2
l crack length deflection
m Paris equation exponent
n frequency of baseline cycles over underload cycles, ΔNBL/ΔNUL
q number of underload cycles in one block
R stress ratio
RBL load ratio of baseline cycles
RUL load ratio of underload cycles
ry,OL monotonous plastic zone size created by an overload
ry monotonous plastic zone size
xix
ryc cyclic plastic zone size
ryc′ cyclic plastic zone size of an underload cycle
s strain hardening exponent
W compact tension specimen width
Greek symbols
Δablock crack growth in one load block
ΔK stress intensity factor range
ΔKeff effective SIF range
ΔKBL stress intensity factor range of baseline cycles
ΔKth stress intensity factor range at the fatigue threshold
ΔKth,eff effective stress intensity factor range at the fatigue threshold
ΔKth,conv conventional fatigue threshold (2 × 10⁻⁷ mm/cycle)
ΔKth,true true fatigue threshold (6.7 × 10⁻⁹ mm/cycle)
ΔKth,CAL true fatigue threshold under constant amplitude loading
ΔKUL stress intensity factor range of an underload
ΔNBL number of baseline cycles in one load block
ΔNUL number of underload cycles in one load block
δUL underload cycle striation width
δBL baseline cycle striation width
ε true strain
εe elastic strain
εf true strain at fracture
εp plastic strain
εr relative elongation at rupture
θ crack deflection angle
xx
σ true stress
σij stress components
σf true stress at fracture
φ angle of a specific point at the front of a semi-elliptical defect
Ψ ratio of stress intensity factor ranges, ΔKBL/ΔKUL
Abbreviations
BL baseline cycles
CAL constant amplitude loading
CT compact tension specimen
COD crack opening displacement
L longitudinal (rolling) direction of the plate
LT long transverse orientation
LS long-short transverse orientation
LDS linear damage summation
OL single overload
POV power output variations
PUL periodic underloads
S short-transverse direction of the plate
SS start/stop sequences
SIF stress intensity factor
T transverse direction of the plate
TS transverse-short transverse orientation
UL single underload
1
CHAPTER 1 INTRODUCTION
1.1 Context
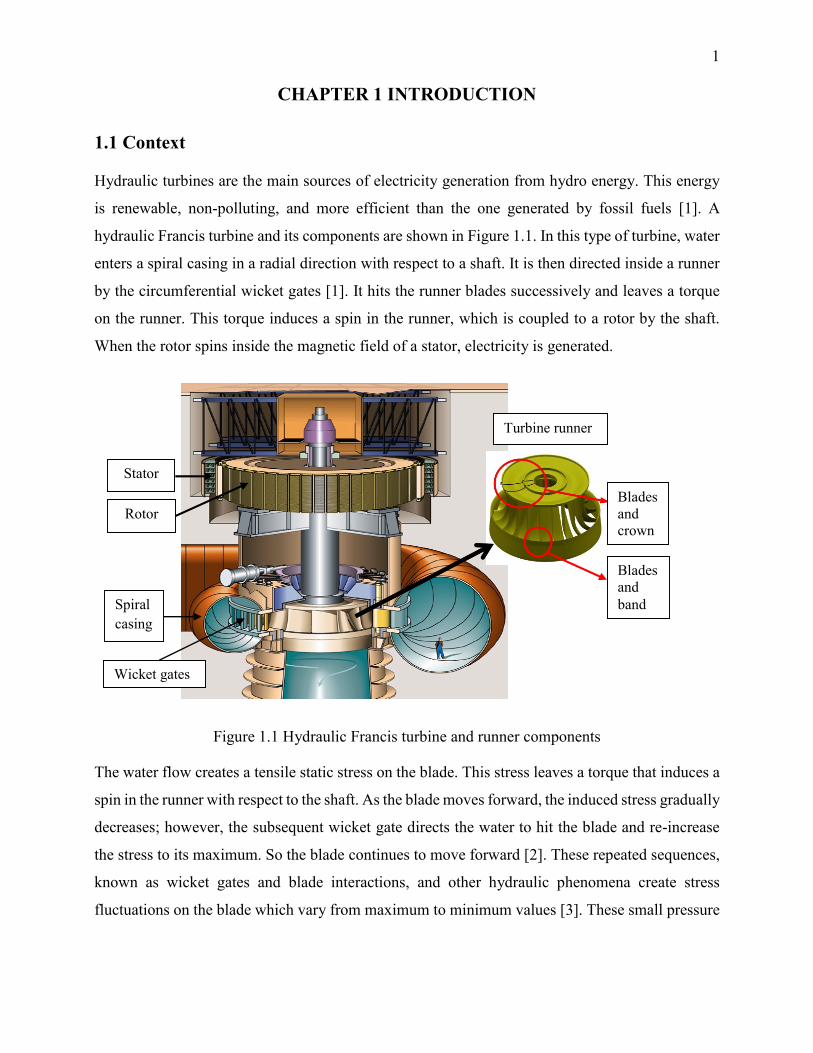
Hydraulic turbines are the main sources of electricity generation from hydro energy. This energy
is renewable, non-polluting, and more efficient than the one generated by fossil fuels [1]. A
hydraulic Francis turbine and its components are shown in Figure 1.1. In this type of turbine, water
enters a spiral casing in a radial direction with respect to a shaft. It is then directed inside a runner
by the circumferential wicket gates [1]. It hits the runner blades successively and leaves a torque
on the runner. This torque induces a spin in the runner, which is coupled to a rotor by the shaft.
When the rotor spins inside the magnetic field of a stator, electricity is generated.
Figure 1.1 Hydraulic Francis turbine and runner components
The water flow creates a tensile static stress on the blade. This stress leaves a torque that induces a
spin in the runner with respect to the shaft. As the blade moves forward, the induced stress gradually
decreases; however, the subsequent wicket gate directs the water to hit the blade and re-increase
the stress to its maximum. So the blade continues to move forward [2]. These repeated sequences,
known as wicket gates and blade interactions, and other hydraulic phenomena create stress
fluctuations on the blade which vary from maximum to minimum values [3]. These small pressure
Wicket gates
Rotor
Spiral
casing
Turbine runner
Blades
and
crown
Blades
and
band
Stator
2
fluctuations create cycles with small stress amplitudes that are superimposed to the tensile static
stress.
During an initial period, where the runner is not coupled to the rotor, the wicket gates are partially
opened and direct the water flow to spin the runner. This flow generates an initial startup and spin-
no-load in the stress spectrum. Subsequently, to generate electricity, the runner becomes coupled
to the rotor and the wicket gates become completely open. As a result, the tensile static stress
increases to a maximum level.
During the runner operation, electricity demands vary and cause variations in the electricity
production known as power output variations. These variations are adjusted by pivoting the wicket
gates that control the water flow. By completely closing the wicket gates, the static stress induced
on the runner blades is reduced to zero, so that the runner stops spinning. These start/stop sequences
are repeated throughout the design life of the runner. In some cases, a sudden uncoupling between
the rotor and runner may occur [4]. As a result, the runner does not transfer the torque to the rotor.
This causes the runner to spin at a higher speed (overspeed) till the wicket gates stop the water
flowing into the runner. This is known as load rejection or overspeed [4, 5]. The aforementioned
changes in the operating conditions create cycles with large stress amplitude, which intercut the
tensile static stress.
As a summary, on one hand, interaction between the wicket gates and blade plus other hydraulic
phenomena creates small stress amplitude cycles in the runner. On the other hand, power output
variations, start/stop sequences, and load rejections create large stress amplitude cycles in the
runner. Therefore, the runner is subjected to small stress amplitude cycles that are superimposed to
tensile static stress, which is intercut with large stress amplitude cycles in the stress spectrum. For
convenience, we refer to the aforementioned stress cycles as small and large cycles, hereafter.
3
1.2 Problematics
Runners are mostly fabricated from cast steels. A martensitic stainless steel, ASTM CA6NM, has
recently been used to fabricate the turbine runners. The ASTM A36, a ferritic-pearlitic cast steel,
was used to fabricate many runners which are installed in Hydro-Quebec power stations. Some
other runners are fabricated from the ASTM CF8, a cast austenitic stainless steel. Runners may
also be fabricated using the wrought version of the aforementioned steels, which are the AISI 415,
ASTM 516, and 304L steels, respectively. In this study, the wrought steels are chosen in order to
have less dispersion in the results.
Defects are formed during the fabrication process (i.e. casting and welding) or the operation (i.e.
cavitation) of runners. Defects or cracks in high stress regions of the blade propagate due to small
cycles superimposed to a tensile static stress intercut with large cycles.
In some power stations with recently built runners, the stress amplitude of small cycles is low (few
MPa) and induces a ΔK that is below the crack propagation threshold. As a result, they do not
induce crack growths and can be neglected; however, large cycles generated by operating
conditions can grow the defects in the runner and can lead to its failure within 70 years of design
life.
In the engineering approach, linear damage summation (LDS) is employed to predict defect growth
due to large stress amplitude cycles. Thus, using the LDS prediction method, during the operation
runners are periodically stopped to inspect and verify defect growth as compared to the one
predicted by LDS; however, stopping runners for an inspection decreases energy production, which
is a costly procedure. Thus, there is a tendency to rely on crack growth predicted by LDS and
minimize inspections or carry them out when it is necessary.
In reality, however, interaction between large cycles can increase defect growth in runners.
Consequently, defects will grow faster than the one predicted by LDS and may lead to the failure
of the runners before a scheduled inspection. As a result, there is a need for a precise crack growth
prediction that will enable designers to minimize the frequency of inspections.
In some power stations with aged runners, the stress amplitude of small cycles is high (tens of
MPa) and induces a ΔK that is close to the fatigue threshold. The hydraulic phenomena generate a
large number of small cycles during the life design of the runners. Therefore, the ΔK at the defect
tips will be below the fatigue threshold. Otherwise, small cycles will propagate the defects, which
4
lead to an early failure of runners. Large cycles can further decrease the fatigue threshold of small
cycles and lead to the propagation of defects. Thus, the fatigue threshold of small cycles and the
one intercut with large should be measured.
Tensile residual stresses are induced in the runners during the fabrication and welding process. As
the crack propagates in the runner it can be subjected to these tensile residual stresses, which will
increase the tensile static stress at the defect tip. Higher tensile static stress may decrease the fatigue
threshold of small cycles. Moreover, higher tensile static stress may decrease the fatigue threshold
of small cycles intercut with periodic underloads.
1.3 Research objectives
In a first study, small cycles induce a ΔK that is below the fatigue threshold. So they do not cause
crack propagation. Thus, the cycles are neglected in the load spectrum and the effect of large cycles
on crack growth is investigated. Crack growths measured under large cycles will be compared to
the ones predicted using linear damage summation.
In a second study, small cycles induce a ΔK that is close to the fatigue threshold. So the crack can
grow and may lead to runner’s premature failure. Thus, the fatigue threshold of small cycles will
be measured. Moreover, large cycles can decrease the fatigue threshold of small cycles. Thus, the
decrease in the fatigue threshold of small cycles due to large cycles will be defined.
A higher tensile static stress may induce a decrease in the fatigue threshold of small cycles and the
ones intercut with large cycles. Therefore, the decrease in both fatigue thresholds due to higher
tensile static stress will be defined.
Specific objectives
Crack growth under constant amplitude loading in the three different steels at different R ratios
will be investigated. Factors that may affect crack growth at different R ratios will also be
investigated.
Different load procedures proposed in literature will be studied, and a procedure leading to better
estimation of load interaction between load cycles and more accurate measurement of ΔKth will be
conducted. Fatigue testing with two different amplitude cycles (small and large) in a load spectrum
will be developed and implemented.
5
Accuracy of LDS prediction is verified for each steel, and factors leading to an increase in crack
growth due to small and large cycles will be analyzed. The effect of large cycles on the fatigue
threshold of small cycles measured with low and very low crack growth rate will be investigated.
1.4 Outline of the thesis
The second chapter is a literature review on fatigue. The fatigue initiation that may lead to
propagation is shortly summarized. A review of different studies on fatigue crack propagation
under constant amplitude loading and variable amplitude loading is then presented. Finally, factors
influencing crack propagation and the suggested prediction methods are presented.
The third chapter explains the methodology that was chosen to carry out the studies and conduct
fatigue tests. The microstructural characterization and tensile test are then explained in detail.
The fourth chapter, exaplins about the following chapter and the organization of the whole
The fifth chapter presents the fatigue tests conducted under constant amplitude loading. The results
of this chapter are employed in chapter 6.
The sixth chapter presents the fatigue tests conducted according to the first study and the
corresponding results. This chapter is presented as a published article.
The seventh chapter presents the fatigue tests conducted according to the second study and the
corresponding results. This chapter is presented as a published article.
The eighth chapter is a general discussion on the studies conducted in the previous chapters. Crack
growth rates under constant amplitude loading and periodic underloads are discussed.
The final chapter covers the main conclusion and proposes to study a real and non-simplified stress
spectrum in runners.
6
CHAPTER 2 LITERATURE REVIEW
2.1 Brief historical review
During the first industrial revolution, most structures were made of steels that could be loaded
under a high tensile load [6]. Steels were widely used in the railroad industry. In the design, stress
applied on steels was limited to monotonous yield stress while taking into account a safety factor;
however, regular failures were reported on railroad axles made of steels [7]. These failures implied
that cyclic stresses below the yield stress can induce local deformation in the railroad axles leading
to their failure. This was a first incident implying the importance of considering cyclic stresses and
loads in design.
During the Second World War, failure occurred in a large number of ships that were made of steels
and whose hulls were welded. In 2003, in Quebec, at the Sainte-Marguerite 3 power station, many
defects grew during the operation of the Francis turbine runners, which were made of steels. This
problem caused a huge reduction in the production of electricity [8]. Thus, different incidents such
as those mentioned above have implied that more investigations should be conducted on the effect
of the cyclic stresses on steels in order to improve their design in structures.
The term fatigue is defined as “ the process of progressive localized permanent structural change
occurring in a material subjected to conditions which produce fluctuating stresses and strains at
some points and which may culminate in cracks or complete fracture after a sufficient number of
fluctuations [9].” Two major approaches in structural fatigue design employed to conduct fatigue
tests in materials will be presented.
2.2 Approaches in structural fatigue design
2.2.1 Total life approach
In the total life approach, a laboratory specimen is usually subjected to a cyclic nominal stress
amplitude (ΔS) or cyclic local strain amplitude (Δε) until it fails [10]. Different levels of cyclic
stress or strain are applied as a function of the number of cycles until the failure occurs, which are
known as the ΔS-N or Δε-N curves. High amplitude of the stress or strain will result in failure with
a low number of cycles, or low cycle fatigue. Otherwise, this is known as high cycle fatigue [11].
7
A real structure can be designed based on the aforementioned curves for a high or low number of
cycles; however, a small defect free laboratory specimen subjected to ΔS under stress will endure
more cycles as compared to the real structure with defects [12]. Thus, in this case, the estimated
fatigue life will be longer and the design approach is non-conservative; however, as the specimen
becomes similar to the real structure, the design becomes realistic.
2.2.2 Defect tolerant approach
In this approach, a structure is considered to have defects. So, an initial crack length, which
represents the defect, is generated in the laboratory specimen under nominal stress or strain [13].
The crack growth rates in materials are measured in the specimen. Then using the measured crack
growth rates and Fracture Mechanics concepts, the initial defect dimensions that will not lead to
the structure’s failure during their design life is estimated.
2.3 Fatigue life
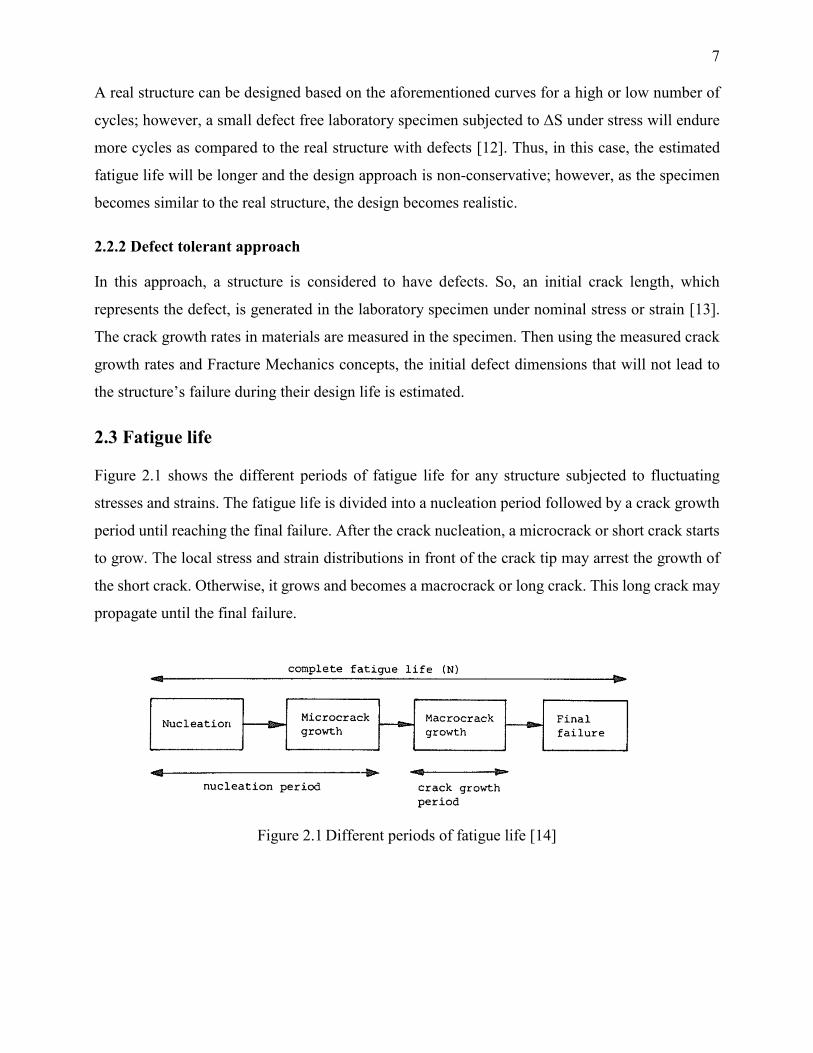
Figure 2.1 shows the different periods of fatigue life for any structure subjected to fluctuating
stresses and strains. The fatigue life is divided into a nucleation period followed by a crack growth
period until reaching the final failure. After the crack nucleation, a microcrack or short crack starts
to grow. The local stress and strain distributions in front of the crack tip may arrest the growth of
the short crack. Otherwise, it grows and becomes a macrocrack or long crack. This long crack may
propagate until the final failure.
Figure 2.1 Different periods of fatigue life [14]
8
2.3.1 Crack nucleation
In crystalline materials such as steels, there are inherent defects in crystals called dislocations.
Plastic deformation results from the dislocation movements in high atomic density planes, called
slip planes [11]. When a steel specimen is monotonically loaded, local slip bands resembling to a
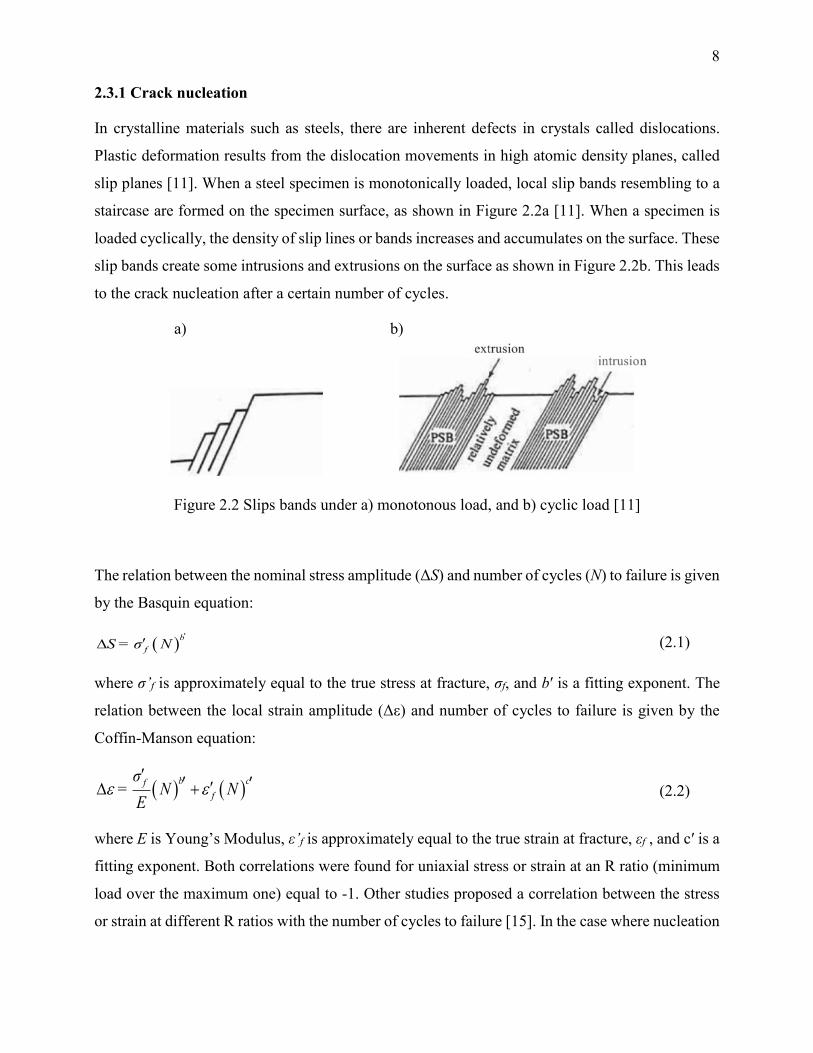
staircase are formed on the specimen surface, as shown in Figure 2.2a [11]. When a specimen is
loaded cyclically, the density of slip lines or bands increases and accumulates on the surface. These
slip bands create some intrusions and extrusions on the surface as shown in Figure 2.2b. This leads
to the crack nucleation after a certain number of cycles.
a) b)
Figure 2.2 Slips bands under a) monotonous load, and b) cyclic load [11]
The relation between the nominal stress amplitude (ΔS) and number of cycles (N) to failure is given
by the Basquin equation:
b
fS σ N=
(2.1)
where σ’f is approximately equal to the true stress at fracture, σf, and b′ is a fitting exponent. The
relation between the local strain amplitude (Δε) and number of cycles to failure is given by the
Coffin-Manson equation:
b cf
f
σN N
E=
(2.2)
where E is Young’s Modulus, ε’f is approximately equal to the true strain at fracture, εf , and c′ is a
fitting exponent. Both correlations were found for uniaxial stress or strain at an R ratio (minimum
load over the maximum one) equal to -1. Other studies proposed a correlation between the stress
or strain at different R ratios with the number of cycles to failure [15]. In the case where nucleation
9
does not occur for a specified high number of cycles (e.g. 107 cycles), it is assumed that the fatigue
limit is reached and the specimen will not fail [16].
It was, however, observed that the specimen fails at a stress below the fatigue limit with a number
of cycles that is higher than 107 [17]. In this case, it is observed that nucleation occurs below the
surface from an inclusion or void in the steel [17].
2.3.2 Short crack growth
After that crack nucleates, it is still small or short and may continue to grow [18]. The cracks is
microstructurally small if its length is comparable to the length of the microstructure, for example,
a crack smaller than the grain size [19]. It is mechanically small if its length is small as compared
to the local plastic deformation, for example, a crack growing out of a notch [20]. It is physically
small if its length is small, for example, a length typically between 0.1 and 1 mm. A short crack
must overcome microstructural barriers and the local plastic strain at its tip to propagate and
become a macro crack, and leading to complete failure.
2.3.3 Long crack growth
Once the crack has overcome microstructural barriers and the plastic deformation at its tip, it
becomes physically long. At this stage, the crack grows in a continuum medium. As it grows, the
crack tip plasticity becomes negligible as compared to the crack length and specimen geometry
[16]. Thus, the specimen is considered to be nominally elastic and plasticity is only limited to the
crack tip. These conditions are called small scale yielding [21].
a) Stress intensity factor
Stress intensity factor is a parameter that characterizes the elastic field in the vicinity of a sharp
crack tip under small scale yielding conditions. Structures in the linear elastic continuum mechanics
must satisfy equilibrium and compatibility equations. The Airy stress function (φ) satisfies both
equations which are combined in one equation called the bi-harmonic [22].
A singular stress field is created in the vicinity of a sharp crack. A complex stress function was
proposed to satisfy bi-harmonic equations for singular stress fields [21]. This function was first
proposed for a sharp crack under a bi-axial stress in an infinite plate. However, it was modified
later for a uni-axial tensile stress, which results to the definition of a stress intensity factor (K) [23],
which is given by following equation:
10
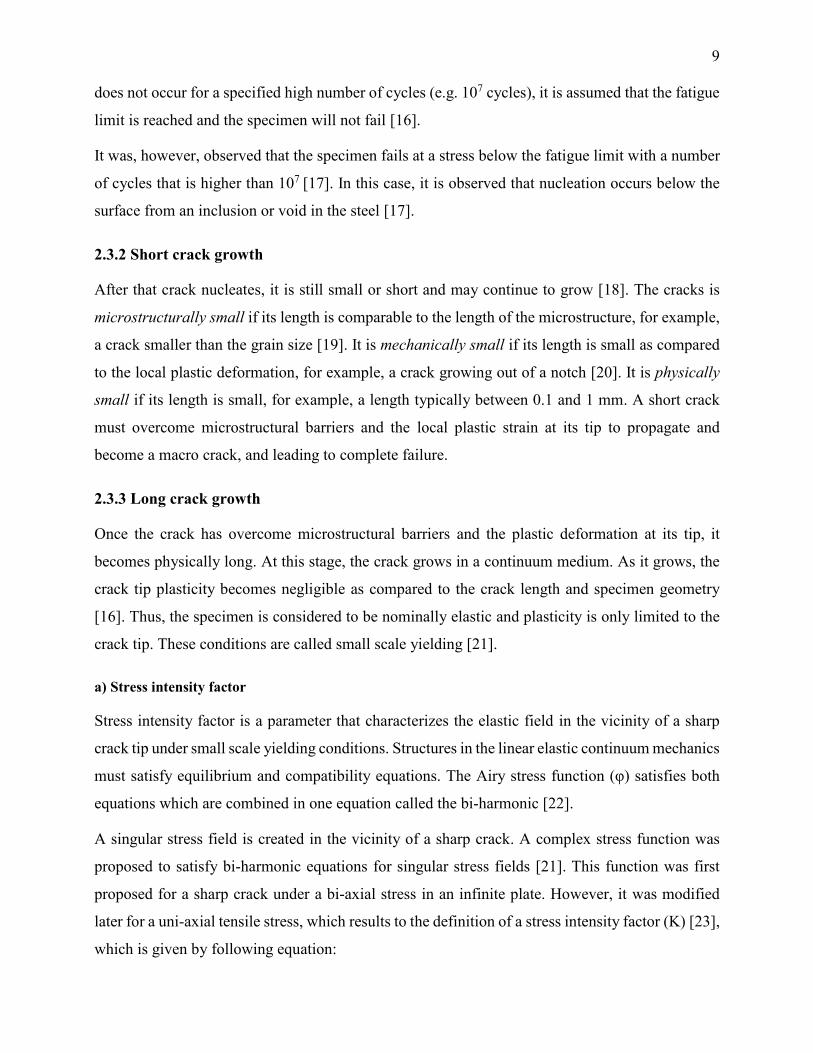
IK = S 2πa
where S is the nominal applied stress, and 2a is the crack length in the infinite plate shown in Figure
2.3. Later a geometric function, Y, was used to define a corresponding K in a finite plate.
Figure 2.3 Stress intensity factor at the tip of a sharp crack in an infinite plane [14]
b) Load modes and plasticity
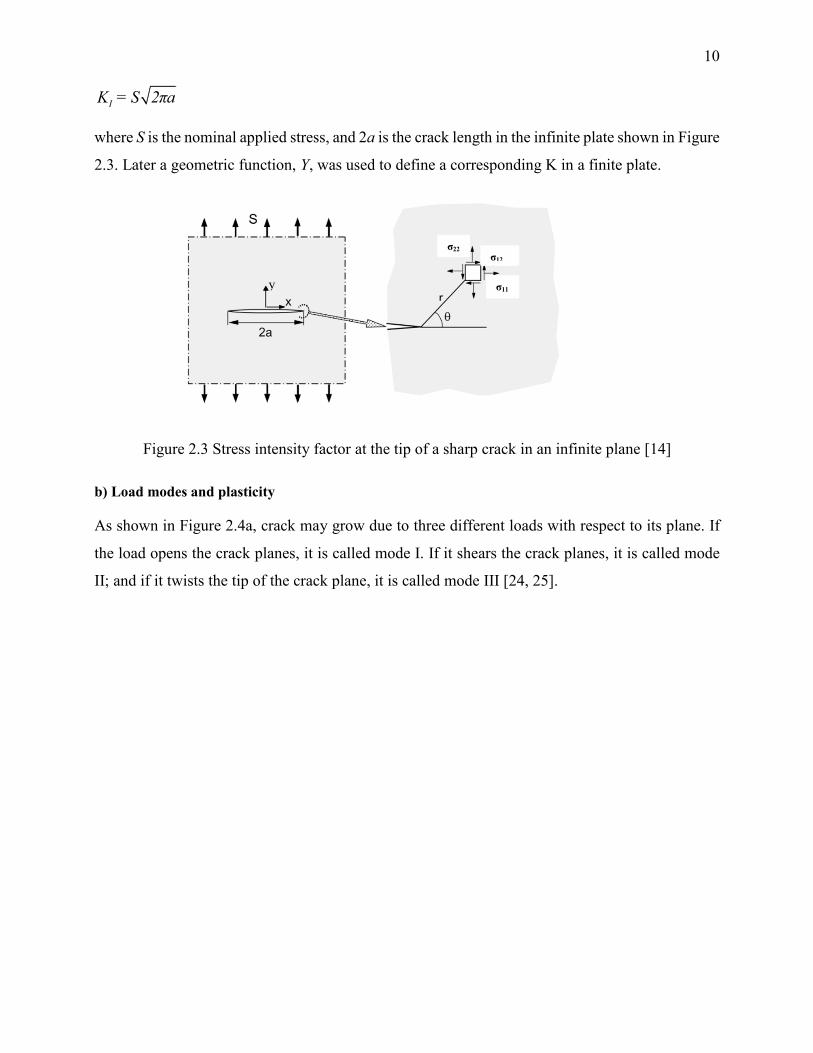
As shown in Figure 2.4a, crack may grow due to three different loads with respect to its plane. If
the load opens the crack planes, it is called mode I. If it shears the crack planes, it is called mode
II; and if it twists the tip of the crack plane, it is called mode III [24, 25].
σ12
σ11
σ22
11
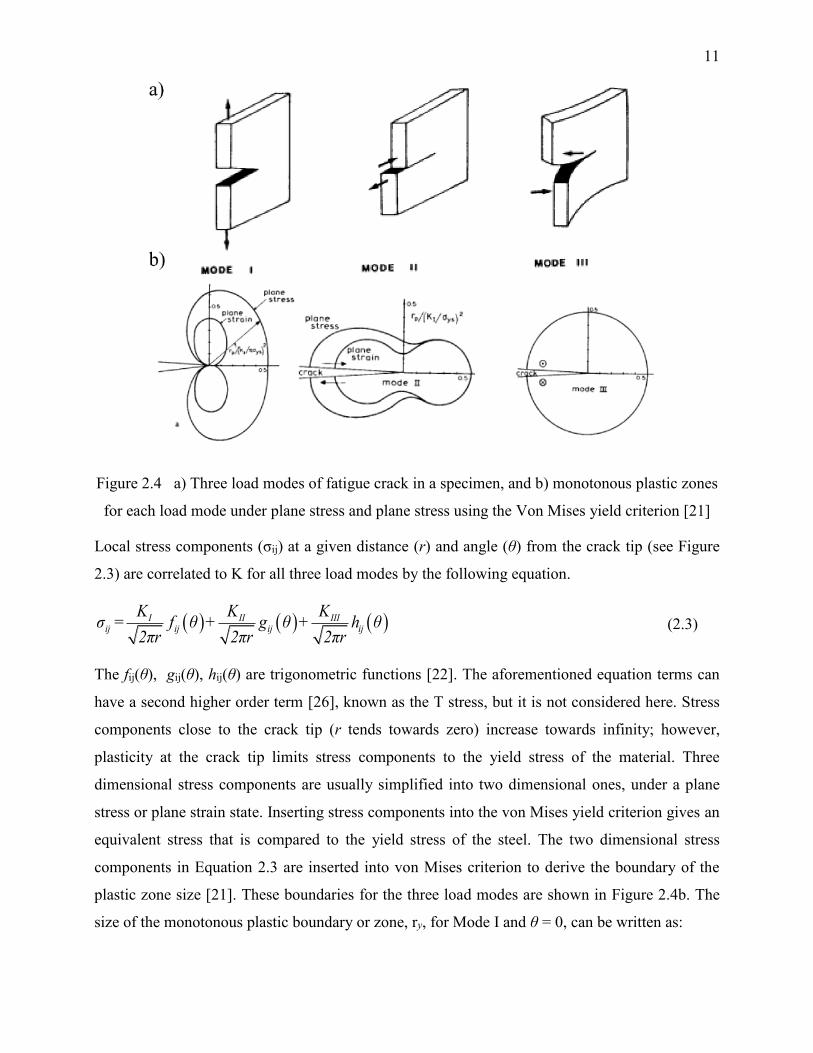
Figure 2.4 a) Three load modes of fatigue crack in a specimen, and b) monotonous plastic zones
for each load mode under plane stress and plane stress using the Von Mises yield criterion [21]
Local stress components (σij) at a given distance (r) and angle (θ) from the crack tip (see Figure
2.3) are correlated to K for all three load modes by the following equation.
I II IIIij ij ij ij
K K Kσ f θ + g θ + h θ
2πr 2πr 2πr= (2.3)
The fij(θ), gij(θ), hij(θ) are trigonometric functions [22]. The aforementioned equation terms can
have a second higher order term [26], known as the T stress, but it is not considered here. Stress
components close to the crack tip (r tends towards zero) increase towards infinity; however,
plasticity at the crack tip limits stress components to the yield stress of the material. Three
dimensional stress components are usually simplified into two dimensional ones, under a plane
stress or plane strain state. Inserting stress components into the von Mises yield criterion gives an
equivalent stress that is compared to the yield stress of the steel. The two dimensional stress
components in Equation 2.3 are inserted into von Mises criterion to derive the boundary of the
plastic zone size [21]. These boundaries for the three load modes are shown in Figure 2.4b. The
size of the monotonous plastic boundary or zone, ry, for Mode I and θ = 0, can be written as:
12
max
2
y
ys
K1r =
απ σ (2.4)
where Kmax is the maximum stress intensity factor (SIF), σys is the yield stress of the steel, and the
value of α depends on the stress state at the crack tip. The value of α is estimated by two different
approaches for the plane stress state [27]. Both approaches results in roughly similar values, where
α is equal to 1 [21, 22]. The value of α increases to 3 for the plane strain state due to stress triaxiality
at the crack tip.
On the other hand, the size of the cyclic plastic zone, ry is given as:
2
yc
yc
1 ΔKr =
π σ (2.5)
where ΔK is the SIF range (Kmax - Kmin), σyc is the cyclic yield stress of the steel, and the value of
β depends on the cyclic stress at the crack tip. Some studies estimated that β is equal to 4α for a
quasi-stationary crack. Thus, the cyclic plastic zone size is estimated to be roughly one-fourth of
the monotonous one [28]; however, other studies suggested that the cyclic plastic zone may be one-
fourth to one-tenth of the monotonous one for a growing crack [29, 30].
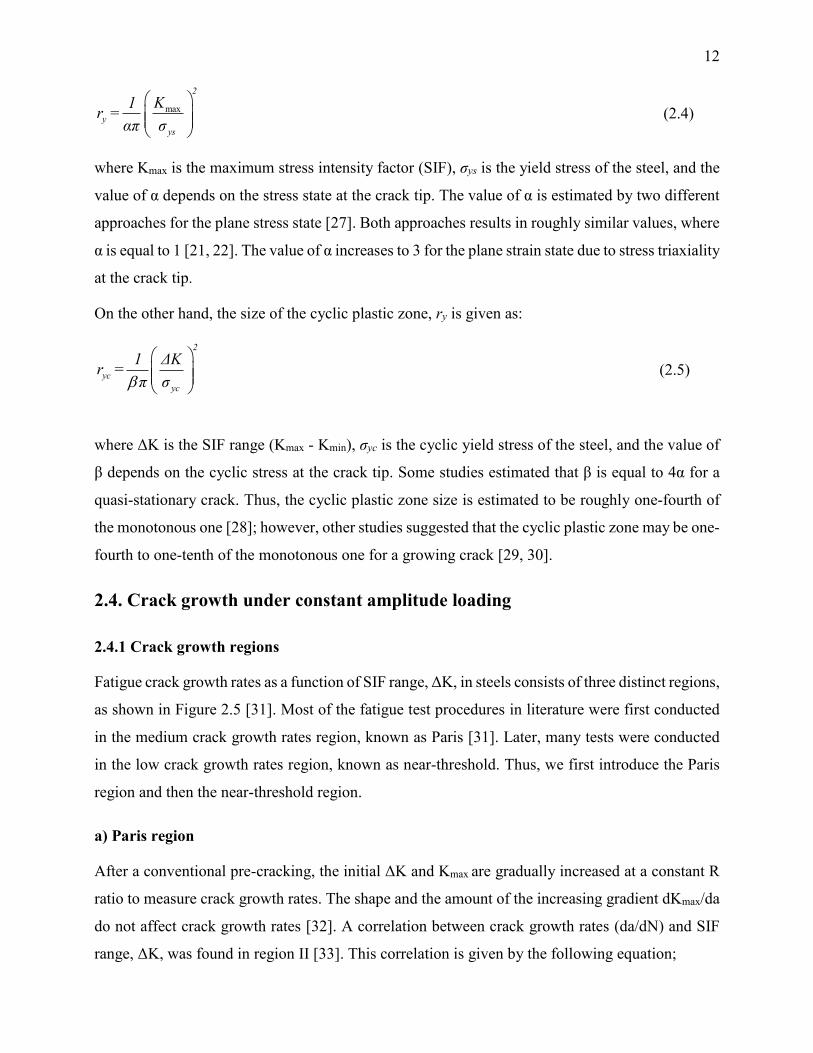
2.4. Crack growth under constant amplitude loading
2.4.1 Crack growth regions
Fatigue crack growth rates as a function of SIF range, ΔK, in steels consists of three distinct regions,
as shown in Figure 2.5 [31]. Most of the fatigue test procedures in literature were first conducted
in the medium crack growth rates region, known as Paris [31]. Later, many tests were conducted
in the low crack growth rates region, known as near-threshold. Thus, we first introduce the Paris
region and then the near-threshold region.
a) Paris region
After a conventional pre-cracking, the initial ΔK and Kmax are gradually increased at a constant R
ratio to measure crack growth rates. The shape and the amount of the increasing gradient dKmax/da
do not affect crack growth rates [32]. A correlation between crack growth rates (da/dN) and SIF
range, ΔK, was found in region II [33]. This correlation is given by the following equation;
13
Δmda
C KdN
Δ max minK K K (2.6)
which is known as the Paris equation and where c and m are the steel or material parameters. Crack
growth rates versus ΔK are measured using a laboratory specimen to obtain Paris equation
parameters. In real structures, ΔK is calculated by estimating a geometric factor (Y), the applied
load range and a typical crack length (ao) [21, 22]. Next, crack growth in each step (Δai) is
calculated at a given ΔK using Paris equation parameters for a number of cycles. Finally, the total
crack growth is incremented step-by-step to predict crack growth in the structure as shown in
Equation 2.7.
0Δ , m
i i ia C K N a a a (2.7)
Crack growth rates are high in Region III. Thus, a given crack length is reached with much fewer
cycles as compared to the Paris region. Crack growth is quasi-static within this region, and when
the maximum SIF reaches the critical SIF, catastrophic failure occurs.
Figure 2.5 Crack growth rates versus ΔK in three different regions (adapted from [34])
14
b) Fatigue threshold region
After a conventional pre-cracking, the initial ΔK and Kmax parameter should be decreased at a
constant R ratio following a specific procedure to reach a ΔK that will not induce crack growth,
known as the fatigue threshold; however, a high decreasing gradient of the aforementioned
parameter builds up a higher amount of plasticity and roughness in the crack wake, which can close
the crack while reaching the fatigue threshold [25]. This can underestimate the crack growth rate
at a given ΔK in the near-threshold region and overestimate the fatigue threshold [32].
Consequently, different test procedures are proposed in literature to minimize extra crack closure,
while reaching the fatigue threshold.
An early test procedure was conducted by keeping the maximum displacement constant as the
crack length increases during the test; however, this procedure induces a constant and low
decreasing gradient, dKmax/da. Consequently, this test procedure is time consuming. Afterwards, it
was proposed to decrease Kmax step-by-step but by imposing some limit conditions on the decrease
in Kmax [32]. However, these conditions do not minimize the crack closure at the near-threshold
region. Finally, a procedure known as the ASTM E647 was proposed to conduct a continuous
decrease in the Kmax and limit the decreasing gradient of dKmax/da in order for it not to be higher
than 0.08 mm-1 (Figure 2.6).
That being said, even low dKmax/da can induce extra crack closure [35]. Thus, in order to eliminate
the consequences of dKmax/da, some studies proposed a constant Kmax procedure where only ΔK
was decreased to reach ΔKth (Figure 2.6). This procedure minimizes extra crack closure induced in
the crack wake [36]. The aforementioned test procedures are explained in detail in Chapter 7.

15
a) b)
Figure 2.6 Two different procedures to measure the fatigue threshold, a) constant R ratio (ASTM
standard), b) constant Kmax [32, 37]
The near-threshold region is sensitive to the microstructure [21]. The beginning of this region
corresponds to a crack growth rate that may vary from 10-8 to 10-7 mm/cycle, and the corresponding
ΔK is the so-called fatigue threshold (ΔKth) [38]. The SIF at the crack tip below the ΔKth value is
assumed to not cause any crack propagation [34]. The end of region I is estimated to be close to
10-6 mm/cycle for steels, which is close to a lattice spacing per cycle [31, 39].
2.4.2 Crack closure
As the R ratio increases, the crack growth rate versus ΔK increases in the Paris region as shown in
Figure 2.5. Crack growth rates further increase in the near threshold region and lead to a lower
fatigue threshold, ΔKth, at a high R ratio as compared to a low R ratio [40-42].
It was reported that during the unloading, the crack may close at a SIF, Kcl above Kmin at low R
ratios. On the other hand, during the loading, the crack opens at a SIF, Kop, above Kmin. The SIF at
closure (Kcl) and opening (Kop) are close to each other [30]. It was concluded that crack grows only
when the opening part of ΔK is applied. Thus, Kcl is deducted from Kmax to calculate the opening
part of ΔK, known as the effective SIF range, ΔKeff, and is given in Equation 2.8.
min, , ,Δ eff m x ca l clK K K R KK KR K (2.8)
At a given Kmax, as R ratio increases, Kmin increases until it becomes equal to or higher than Kcl.
As a result, ΔKeff becomes equal to ΔK. The estimated crack growth rate as a function of ΔKeff at
different R ratios is given by the following equation,

16
Δ Δm
eff eff
daf K C K
dN (2.9)
results in similar crack growth rates and gives a constant ΔKth. Therefore, crack growth rates at
different R ratios can be shown as a single curve as a function of ΔKeff as shown in Figure 2.7.
Figure 2.7 Crack growth rates versus ΔKeff in the three different crack propagation regions
[25, 31]
a) Crack closure in different crack growth rates regions
It was reported that plasticity induces compressive residual stress in the crack wake, which leads
to crack closure in the Paris region [43]. This assumption was validated with compliance
measurements and fractographic evidence [44, 45]; however, fatigue tests in the near-threshold
region revealed that other factors can also induce crack closure [46, 47].
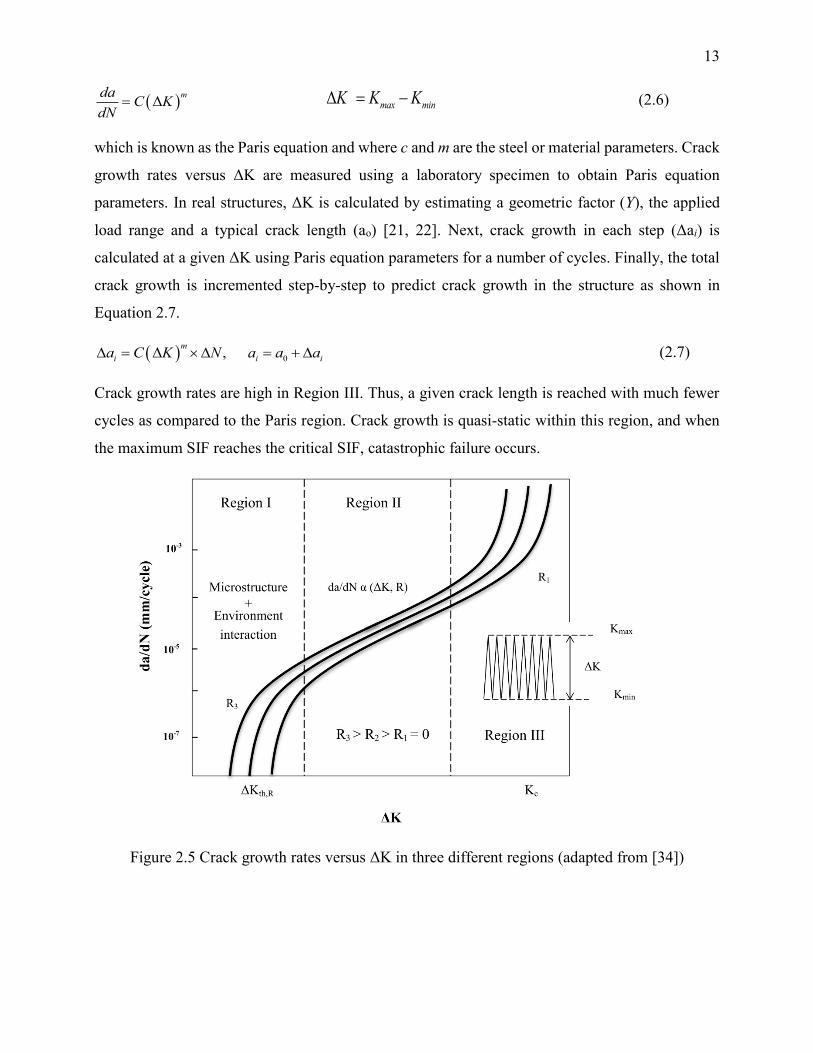
Plasticity is higher on the surface of the specimen as compared to the center of it [48], as shown in
Figure 2.8a. Removing material at the surface of the specimen around the crack and decreasing its
thickness lead to a decrease in the estimated crack closure level at higher ΔK values (8.8 and 17.6
MPa.m1/2) in the Paris region in an 7075-T6 aluminum alloy. Crack closure level reaches a constant
value at certain thickness as shown in Figure 2.8b [49]; however, crack closure level remains
constant throughout the thickness at the lowest ΔK value (2.5 MPa.m1/2) corresponding to the near-
threshold region as shown in Figure 2.8b. Thus, it was concluded that plasticity induces crack
17
closure (plasticity-induced crack closure) mainly on the surface of the specimen (crack flanks) and
is higher in the Paris region than in the near-threshold region.
The plastic deformation left in the crack flanks transforms the austenite to martensite in some steels
[50, 51]. The austenite phase in steels has a face centered cubic crystal structure. A sufficient
amount of deformation transforms the face centered cubic crystals to the body centered tetragonal
crystals, which is the martensitic phase [52-55]. It has been shown that this transformation leads to
a decrease of ductility at the crack tip and increases crack growth rates in the Paris region. On the
other hand, this transformation induces volume expansion in crack flanks, which induces crack
closure in the near-threshold region [51, 54, 56, 57].
a) b)
Figure 2.8 a) Variation in plastic zone throughout the thickness, and b) variations in Kcl at three
different ΔK due to a decrease in thickness in an 7075-T6 aluminum alloy specimen [21, 49]
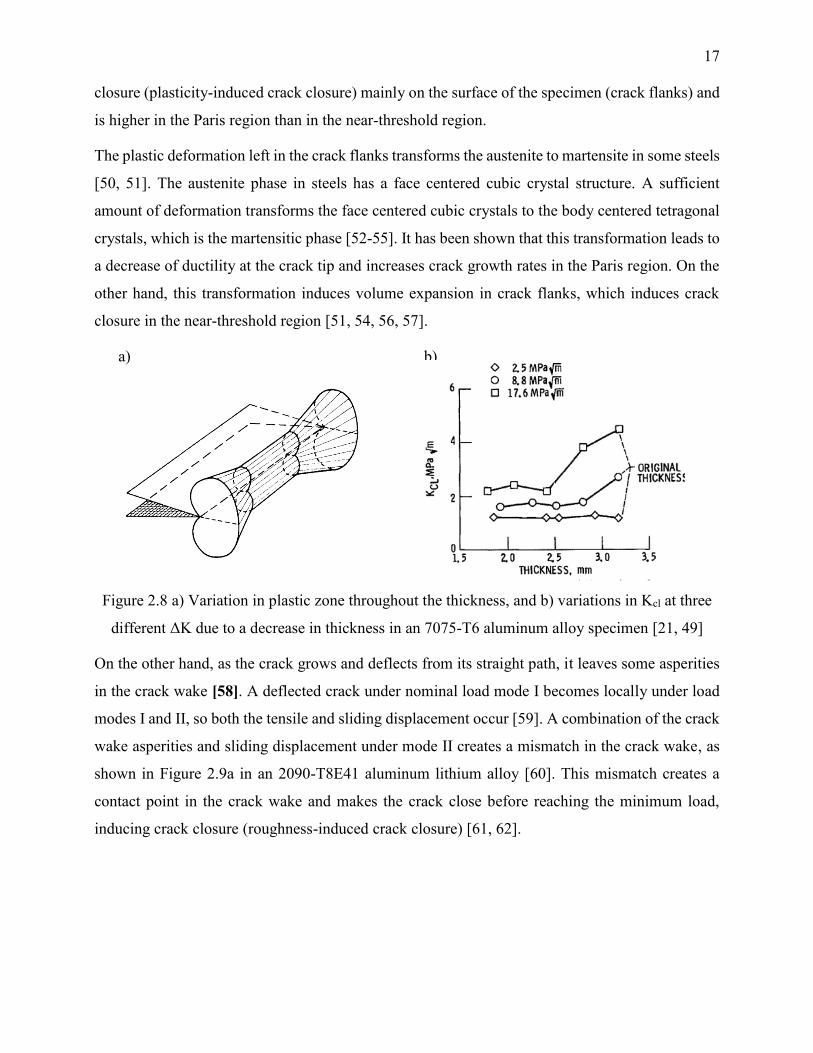
On the other hand, as the crack grows and deflects from its straight path, it leaves some asperities
in the crack wake [58]. A deflected crack under nominal load mode I becomes locally under load
modes I and II, so both the tensile and sliding displacement occur [59]. A combination of the crack
wake asperities and sliding displacement under mode II creates a mismatch in the crack wake, as
shown in Figure 2.9a in an 2090-T8E41 aluminum lithium alloy [60]. This mismatch creates a
contact point in the crack wake and makes the crack close before reaching the minimum load,
inducing crack closure (roughness-induced crack closure) [61, 62].
18
a) b)
Figure 2.9 a) Surface asperities in the crack wake in an 2090-T8E41 aluminum lithium alloy, b)
variations in Kcl at three different ΔK due to removal of the crack wake asperities in an 7075-T6
aluminum alloy specimen [21, 49]
Removal of crack wake asperities at the lowest ΔK (2.5 MPa.m1/2) value in the near-threshold
region decreased the crack closure level, as shown in Figure 2.9b [49]; however, this wake removal
did not affect crack closure levels at higher ΔK values in the Paris region. Thus, it was concluded
that surface asperities induce a higher crack closure in the near-threshold region than in the Paris
region.
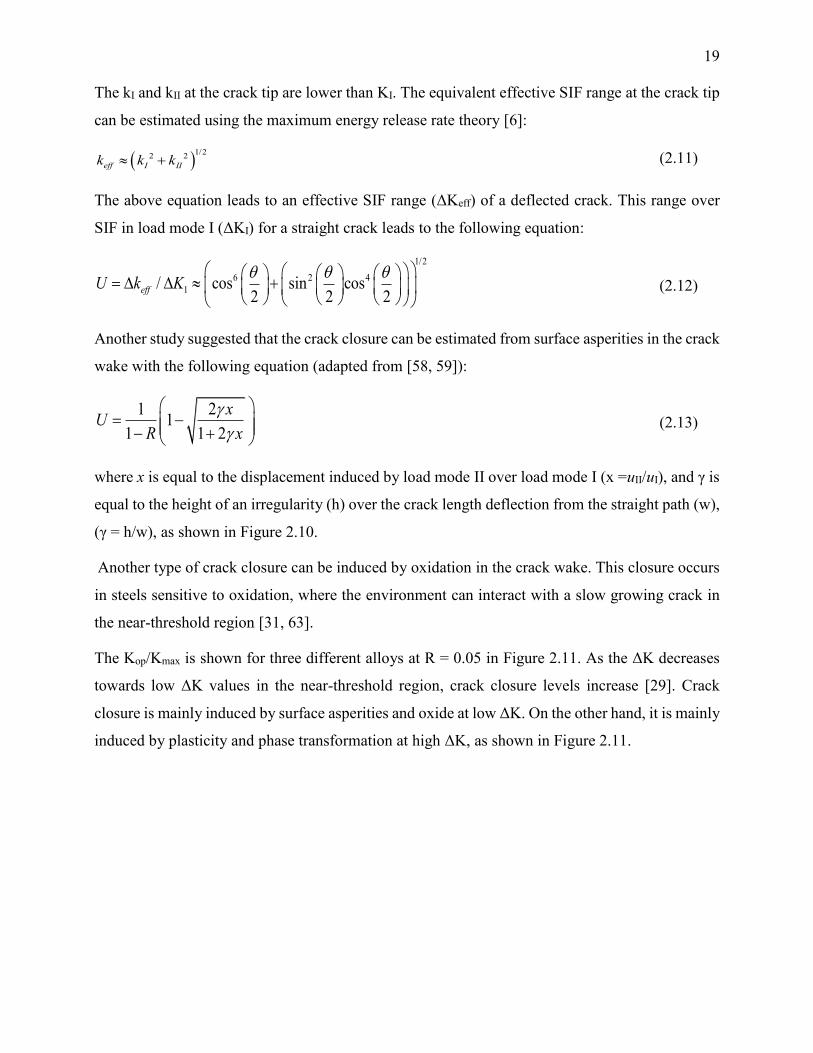
One study suggested that the stress intensity factor (K) for a deflected crack under modes I and II
(kI and kII) can be estimated by considering the crack angle deflection, θ, which is shown in Figure
2.10.
Figure 2.10 Schematic illustration of a zigzag crack path to estimate the Kcl [59, 60]
Thus, an equation was proposed to calculate k1 and k2 at the crack tip as followed [11]:
3 2cos ( / 2) , sin( / 2)cos ( / 2) I I II Ik K k K (2.10)
θ
19
The kI and kII at the crack tip are lower than KI. The equivalent effective SIF range at the crack tip
can be estimated using the maximum energy release rate theory [6]:
1/2
2 2 eff I IIk k k (2.11)
The above equation leads to an effective SIF range (ΔKeff) of a deflected crack. This range over
SIF in load mode I (ΔKI) for a straight crack leads to the following equation:
1/2
6 2 4
1/ cos sin cos2 2 2
effU k K (2.12)
Another study suggested that the crack closure can be estimated from surface asperities in the crack
wake with the following equation (adapted from [58, 59]):
1 21
1 1 2
xU
R x (2.13)
where x is equal to the displacement induced by load mode II over load mode I (x =uII/uI), and γ is
equal to the height of an irregularity (h) over the crack length deflection from the straight path (w),
(γ = h/w), as shown in Figure 2.10.
Another type of crack closure can be induced by oxidation in the crack wake. This closure occurs
in steels sensitive to oxidation, where the environment can interact with a slow growing crack in
the near-threshold region [31, 63].
The Kop/Kmax is shown for three different alloys at R = 0.05 in Figure 2.11. As the ΔK decreases
towards low ΔK values in the near-threshold region, crack closure levels increase [29]. Crack
closure is mainly induced by surface asperities and oxide at low ΔK. On the other hand, it is mainly
induced by plasticity and phase transformation at high ΔK, as shown in Figure 2.11.

20
Figure 2.11 Crack closure mechanisms at different crack growth regions at R = 0.05 [29]
b) Errors in crack closure estimation
The SIF at crack closure, Kcl, is conventionally estimated from the point where a deviation occurs
in the linear load-COD curve; this method is suggested by the ASTM E647 [64]. A first contact
induced by plasticity and/or surface asperities in the crack wake creates the aforementioned
deviation in the load-COD curve, which corresponds to the load at crack closure, Pcl (Figure 2.12).
Using the Pcl to estimate the ΔKeff leads to crack growth rates that are equal at all R ratios. This
was conventionally accepted in the literature [25, 65]; however, some new studies have found that
the Kcl estimated using the ASTM E647 method, leads to a ΔKeff at low R ratios that is lower than
the one at high R ratios [66]. Therefore, different studies were conducted to explain the difference
in Kcl and ΔKeff at low and high R ratios [43, 67-73].
Some studies stated that as the crack wake behind the crack tip is in contact locally, the crack tip
can still be in tension [74, 75]. On the other hand, as the load gradually decreases to a minimum
load (Pmin), the dP/dCOD gradually increases until it becomes equal to the one corresponding to
the dPmin/dCODmin. Therefore, there is a gradual decrease in the Pcl point until it reaches the Pmin.
This gradual decrease makes it difficult to define a Pcl point in the load-COD curve.
Region I Region II
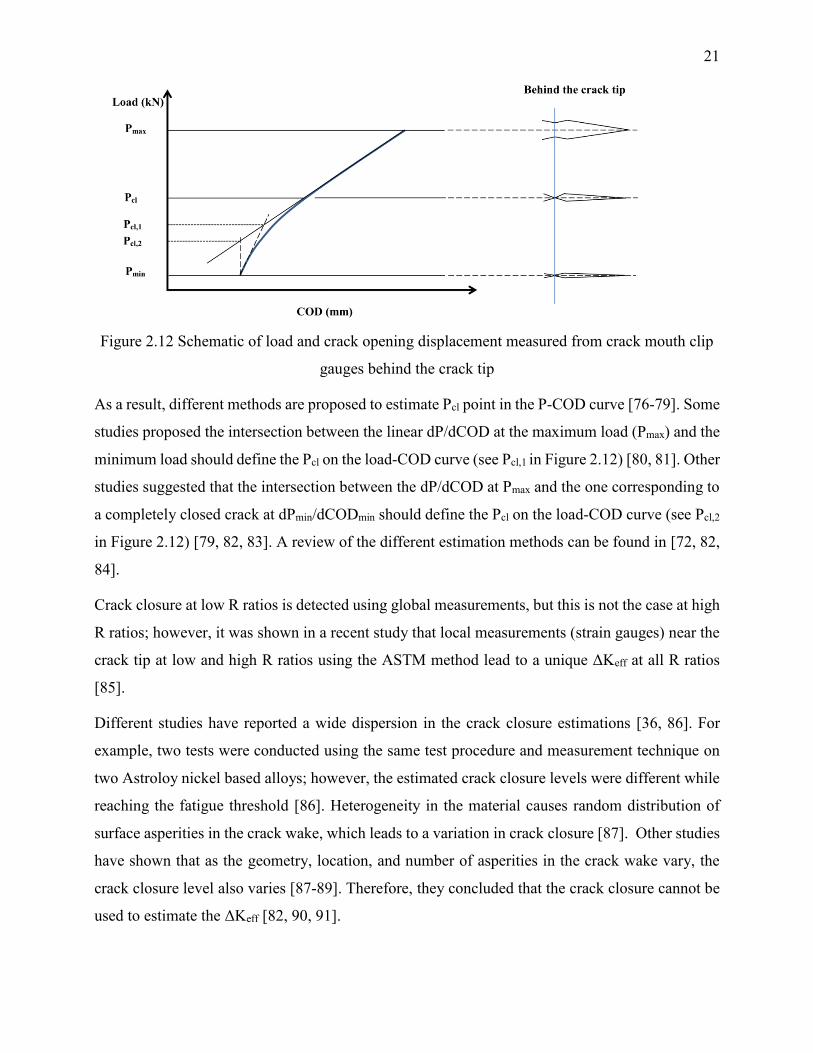
21
Figure 2.12 Schematic of load and crack opening displacement measured from crack mouth clip
gauges behind the crack tip
As a result, different methods are proposed to estimate Pcl point in the P-COD curve [76-79]. Some
studies proposed the intersection between the linear dP/dCOD at the maximum load (Pmax) and the
minimum load should define the Pcl on the load-COD curve (see Pcl,1 in Figure 2.12) [80, 81]. Other
studies suggested that the intersection between the dP/dCOD at Pmax and the one corresponding to
a completely closed crack at dPmin/dCODmin should define the Pcl on the load-COD curve (see Pcl,2
in Figure 2.12) [79, 82, 83]. A review of the different estimation methods can be found in [72, 82,
84].
Crack closure at low R ratios is detected using global measurements, but this is not the case at high
R ratios; however, it was shown in a recent study that local measurements (strain gauges) near the
crack tip at low and high R ratios using the ASTM method lead to a unique ΔKeff at all R ratios
[85].
Different studies have reported a wide dispersion in the crack closure estimations [36, 86]. For
example, two tests were conducted using the same test procedure and measurement technique on
two Astroloy nickel based alloys; however, the estimated crack closure levels were different while
reaching the fatigue threshold [86]. Heterogeneity in the material causes random distribution of
surface asperities in the crack wake, which leads to a variation in crack closure [87]. Other studies
have shown that as the geometry, location, and number of asperities in the crack wake vary, the
crack closure level also varies [87-89]. Therefore, they concluded that the crack closure cannot be
used to estimate the ΔKeff [82, 90, 91].
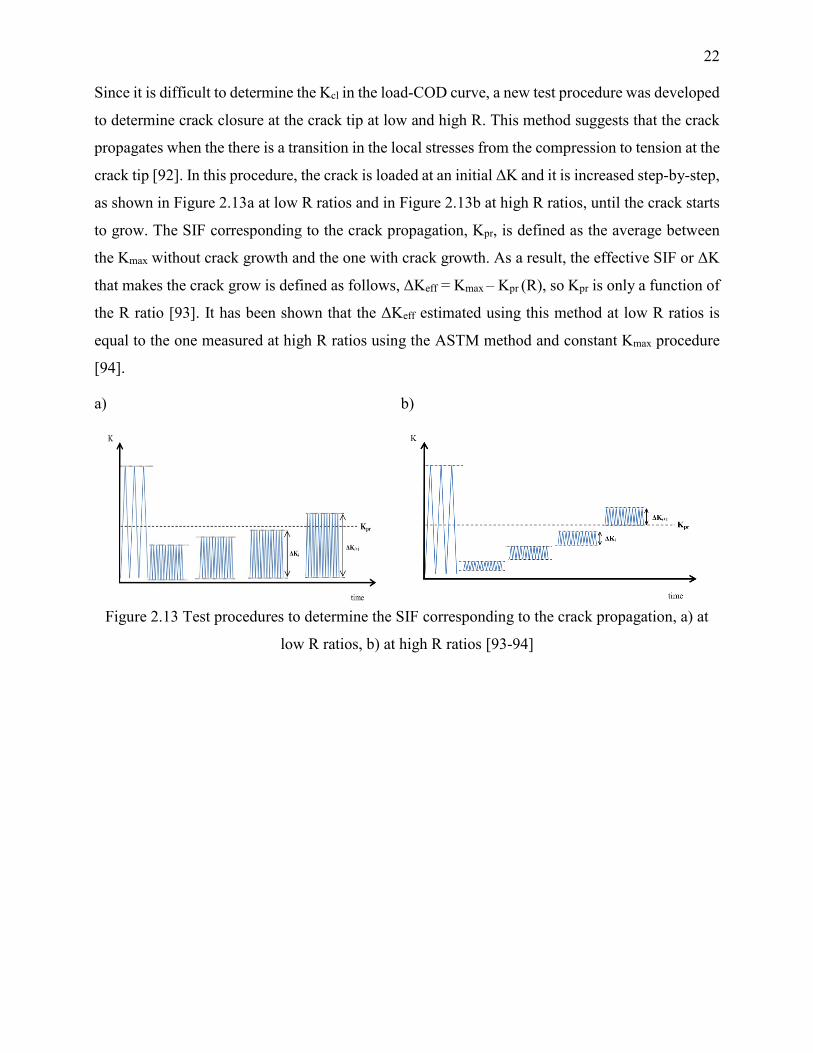
22
Since it is difficult to determine the Kcl in the load-COD curve, a new test procedure was developed
to determine crack closure at the crack tip at low and high R. This method suggests that the crack
propagates when the there is a transition in the local stresses from the compression to tension at the
crack tip [92]. In this procedure, the crack is loaded at an initial ΔK and it is increased step-by-step,
as shown in Figure 2.13a at low R ratios and in Figure 2.13b at high R ratios, until the crack starts
to grow. The SIF corresponding to the crack propagation, Kpr, is defined as the average between
the Kmax without crack growth and the one with crack growth. As a result, the effective SIF or ΔK
that makes the crack grow is defined as follows, ΔKeff = Kmax – Kpr (R), so Kpr is only a function of
the R ratio [93]. It has been shown that the ΔKeff estimated using this method at low R ratios is
equal to the one measured at high R ratios using the ASTM method and constant Kmax procedure
[94].
a) b)
Figure 2.13 Test procedures to determine the SIF corresponding to the crack propagation, a) at
low R ratios, b) at high R ratios [93-94]
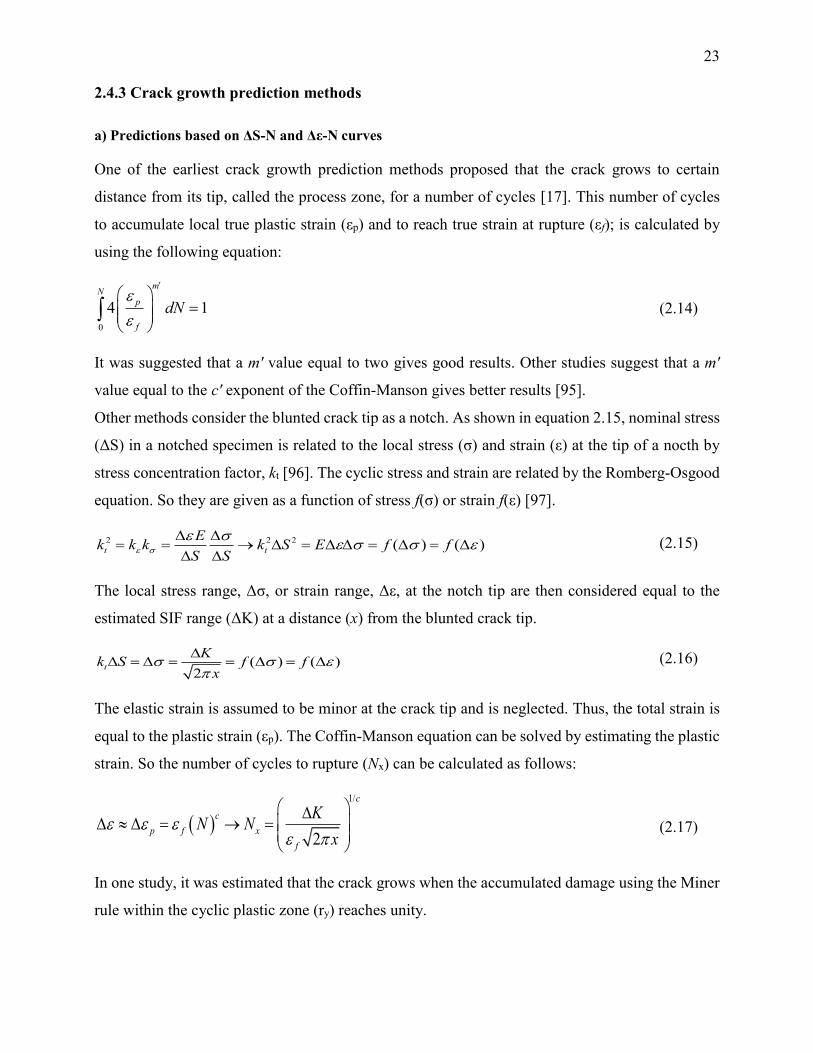
23
2.4.3 Crack growth prediction methods
a) Predictions based on ΔS-N and Δε-N curves
One of the earliest crack growth prediction methods proposed that the crack grows to certain
distance from its tip, called the process zone, for a number of cycles [17]. This number of cycles
to accumulate local true plastic strain (εp) and to reach true strain at rupture (εf); is calculated by
using the following equation:
0
4 1
mN
p
f
dN
(2.14)
It was suggested that a m′ value equal to two gives good results. Other studies suggest that a m′
value equal to the c′ exponent of the Coffin-Manson gives better results [95].
Other methods consider the blunted crack tip as a notch. As shown in equation 2.15, nominal stress
(ΔS) in a notched specimen is related to the local stress (σ) and strain (ε) at the tip of a nocth by
stress concentration factor, kt [96]. The cyclic stress and strain are related by the Romberg-Osgood
equation. So they are given as a function of stress f(σ) or strain f(ε) [97].
2 2 2 ( ) ( )t t
Ek k k k S E f f
S S
(2.15)
The local stress range, Δσ, or strain range, Δε, at the notch tip are then considered equal to the
estimated SIF range (ΔK) at a distance (x) from the blunted crack tip.
( ) ( )2
t
Kk S f f
x
(2.16)
The elastic strain is assumed to be minor at the crack tip and is neglected. Thus, the total strain is
equal to the plastic strain (εp). The Coffin-Manson equation can be solved by estimating the plastic
strain. So the number of cycles to rupture (Nx) can be calculated as follows:
1/
2
c
c
p f x
f
KN N
x (2.17)
In one study, it was estimated that the crack grows when the accumulated damage using the Miner
rule within the cyclic plastic zone (ry) reaches unity.
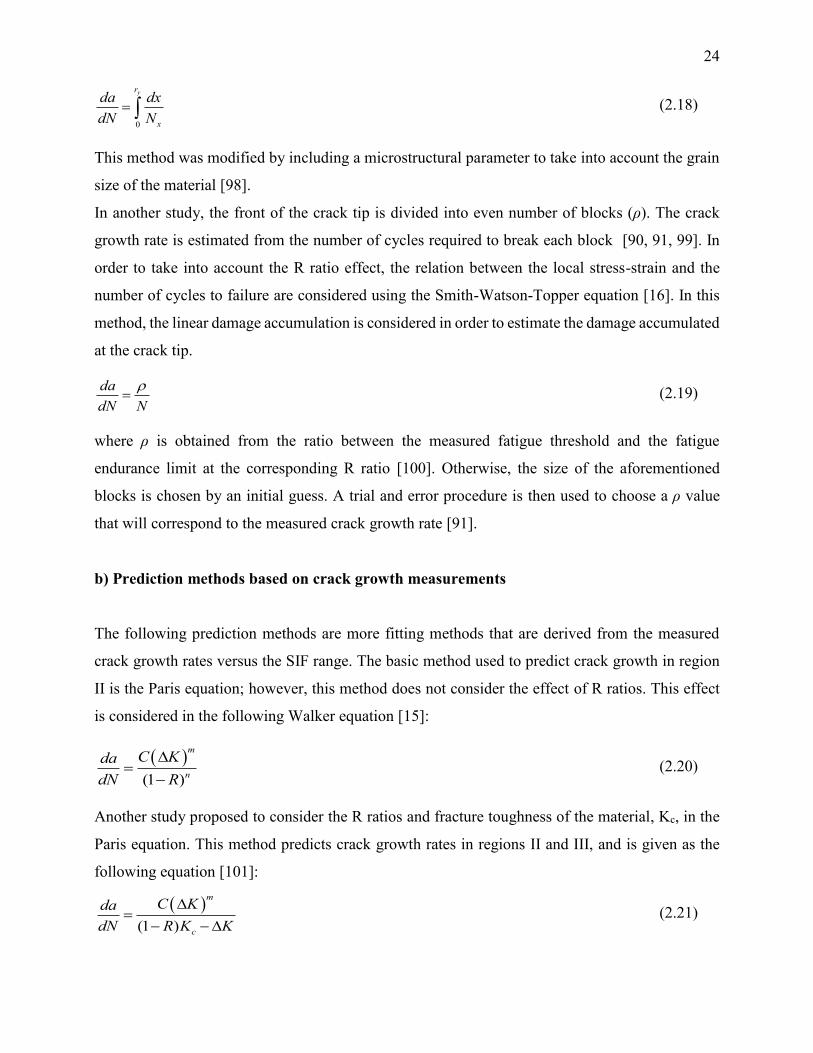
24
0
yr
x
da dx
dN N (2.18)
This method was modified by including a microstructural parameter to take into account the grain
size of the material [98].
In another study, the front of the crack tip is divided into even number of blocks (ρ). The crack
growth rate is estimated from the number of cycles required to break each block [90, 91, 99]. In
order to take into account the R ratio effect, the relation between the local stress-strain and the
number of cycles to failure are considered using the Smith-Watson-Topper equation [16]. In this
method, the linear damage accumulation is considered in order to estimate the damage accumulated
at the crack tip.
da
dN N
(2.19)
where ρ is obtained from the ratio between the measured fatigue threshold and the fatigue
endurance limit at the corresponding R ratio [100]. Otherwise, the size of the aforementioned
blocks is chosen by an initial guess. A trial and error procedure is then used to choose a ρ value
that will correspond to the measured crack growth rate [91].
b) Prediction methods based on crack growth measurements
The following prediction methods are more fitting methods that are derived from the measured
crack growth rates versus the SIF range. The basic method used to predict crack growth in region
II is the Paris equation; however, this method does not consider the effect of R ratios. This effect
is considered in the following Walker equation [15]:
(1 )
m
n
C Kd
RdN
a
(2.20)
Another study proposed to consider the R ratios and fracture toughness of the material, Kc, in the
Paris equation. This method predicts crack growth rates in regions II and III, and is given as the
following equation [101]:
(1 )
m
c
C Kda
R K KdN
(2.21)
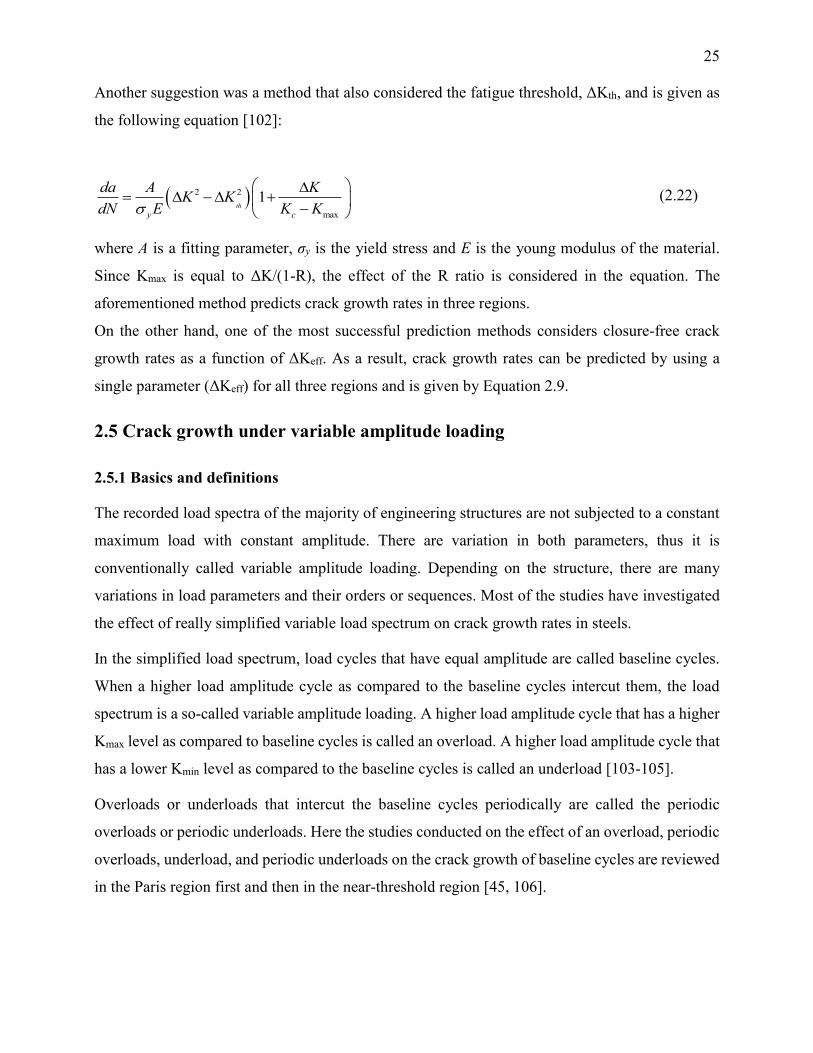
25
Another suggestion was a method that also considered the fatigue threshold, ΔKth, and is given as
the following equation [102]:
2 2
max
1th
y c
da A KK K
E K KdN
(2.22)
where A is a fitting parameter, σy is the yield stress and E is the young modulus of the material.
Since Kmax is equal to ΔK/(1-R), the effect of the R ratio is considered in the equation. The
aforementioned method predicts crack growth rates in three regions.
On the other hand, one of the most successful prediction methods considers closure-free crack
growth rates as a function of ΔKeff. As a result, crack growth rates can be predicted by using a
single parameter (ΔKeff) for all three regions and is given by Equation 2.9.
2.5 Crack growth under variable amplitude loading
2.5.1 Basics and definitions
The recorded load spectra of the majority of engineering structures are not subjected to a constant
maximum load with constant amplitude. There are variation in both parameters, thus it is
conventionally called variable amplitude loading. Depending on the structure, there are many
variations in load parameters and their orders or sequences. Most of the studies have investigated
the effect of really simplified variable load spectrum on crack growth rates in steels.
In the simplified load spectrum, load cycles that have equal amplitude are called baseline cycles.
When a higher load amplitude cycle as compared to the baseline cycles intercut them, the load
spectrum is a so-called variable amplitude loading. A higher load amplitude cycle that has a higher
Kmax level as compared to baseline cycles is called an overload. A higher load amplitude cycle that
has a lower Kmin level as compared to the baseline cycles is called an underload [103-105].
Overloads or underloads that intercut the baseline cycles periodically are called the periodic
overloads or periodic underloads. Here the studies conducted on the effect of an overload, periodic
overloads, underload, and periodic underloads on the crack growth of baseline cycles are reviewed
in the Paris region first and then in the near-threshold region [45, 106].

26
2.5.2 Effects of overloads and underloads in crack growth regions
a) Paris region
A procedure similar the one under constant amplitude loading can be conducted by increasing an
initial ΔK and Kmax at constant R ratio for baseline cycles and periodic underloads to measure crack
growth rates; however, an increasing dΔK/da and dKmax/da can affect the crack growth rate under
periodic underloads [107]. Therefore, in most studies, it was decided to conduct crack growth at a
constant Kmax in order to better measure the interaction between baseline cycles and overloads or
underloads.
An overload is a load amplitude cycle that is larger than the baseline load cycles and which
momentarily increases the size of the monotonous plastic zone [108]. The overload applied
momentarily increases the crack growth rate of baseline cycles, as shown in Figure 2.14a [107].
The crack growth rate then decreases gradually until it reaches a minimum rate, then it gradually
increases to reach the steady and constant growth rate of the baseline cycles under constant
amplitude loading. The average crack growth is lower rate as compared to the constant amplitude
loading. The crack length affected by the overload is denoted as ΔaOL.
The required number of cycles to grow the ΔaOL under constant amplitude loading is denoted as
NCA (Figure 2.14b); however, after an overload, a high number of cycles, denoted as NOL, is needed
for baseline cycles with low crack growth rates to grow ΔaOL [107, 109]. This number of cycles is
deducted from the NCA to estimate the number of cycles during which the crack does not grow after
an applied overload. This number of cycles corresponds to the crack growth retardation and is
denoted as NR in Figure 2.14b[108].
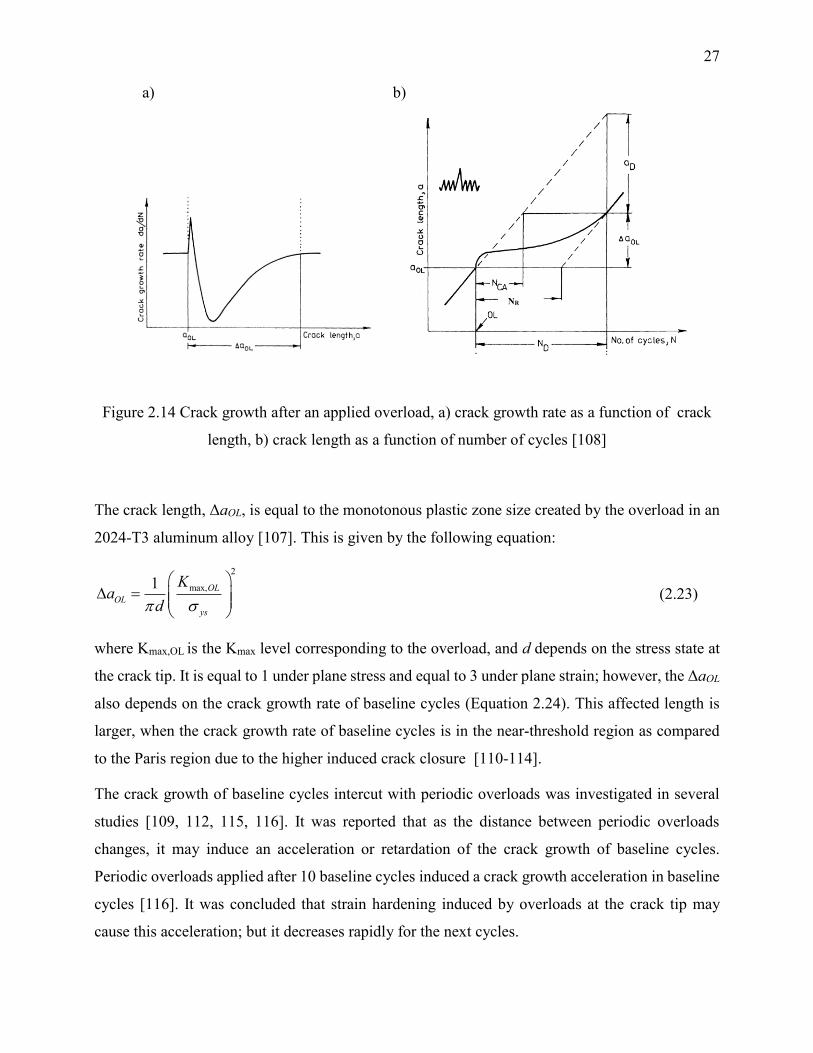
27
a) b)
Figure 2.14 Crack growth after an applied overload, a) crack growth rate as a function of crack
length, b) crack length as a function of number of cycles [108]
The crack length, ΔaOL, is equal to the monotonous plastic zone size created by the overload in an
2024-T3 aluminum alloy [107]. This is given by the following equation:
2
max,1 OL
ys
OL
Ka
d
(2.23)
where Kmax,OL is the Kmax level corresponding to the overload, and d depends on the stress state at
the crack tip. It is equal to 1 under plane stress and equal to 3 under plane strain; however, the ΔaOL
also depends on the crack growth rate of baseline cycles (Equation 2.24). This affected length is
larger, when the crack growth rate of baseline cycles is in the near-threshold region as compared
to the Paris region due to the higher induced crack closure [110-114].
The crack growth of baseline cycles intercut with periodic overloads was investigated in several
studies [109, 112, 115, 116]. It was reported that as the distance between periodic overloads
changes, it may induce an acceleration or retardation of the crack growth of baseline cycles.
Periodic overloads applied after 10 baseline cycles induced a crack growth acceleration in baseline
cycles [116]. It was concluded that strain hardening induced by overloads at the crack tip may
cause this acceleration; but it decreases rapidly for the next cycles.
NR

28
On the other hand, a maximum retardation occurs when the subsequent overload was applied at
one-fourth of the monotonic plastic zone created by the previous overload in an 2024-T3 aluminum
alloy [109]. This retardation was 20% higher than the one induced from each overload applied
separately. Therefore, it was stated that there is an interaction between overloads. As the distance
between overloads increases, the interaction between them decreases. There is no interaction when
the subsequent overload is applied after a distance equal to three times the monotonous plastic zone
size of the previous overload in an 2024-T3 aluminum alloy [109, 112].
An underload (RUL ≥ 0) is a load amplitude cycle that is larger than baseline cycles and which
momentarily increases the size of the cyclic plastic zone. A compressive underload (RUL ˂ 0)
slightly increases the crack growth rate of baseline cycles in the Paris region [106]. It was
concluded that the crack is totally closed under compressive underloads. So it has a slight effect on
the crack growth rate of subsequent baseline cycles [106]. As it is shown in Figure 2.15, after an
applied compressive underload there is an increase in the crack growth rate of the baseline cycles
followed by a gradual decrease until it reaches a steady state. This increase occurs in a much shorter
crack length and with a lower change in the crack growth rate as compared to the one that occurs
after an overload in a 316L austenitic stainless steel (Figure 2.15) [117, 118].
Figure 2.15 Crack growth rates as a function of crack length after an applied overload and
compressive underloads in austenitic stainless steel 316L [118]
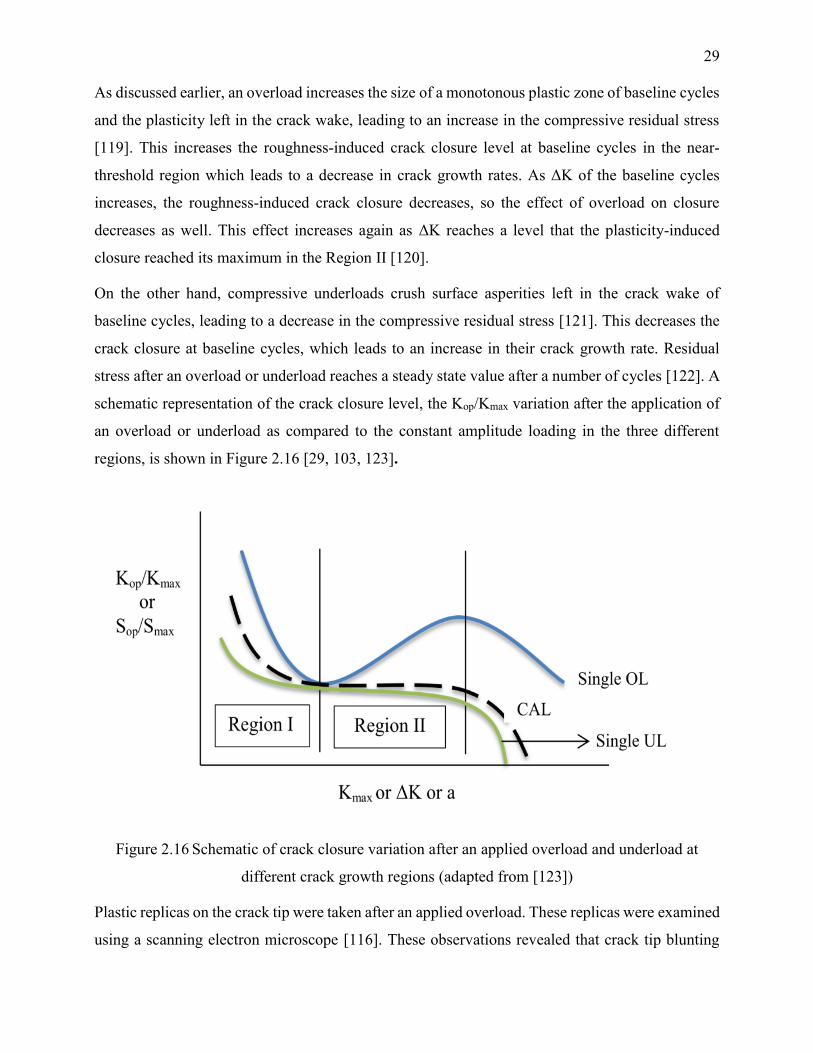
29
As discussed earlier, an overload increases the size of a monotonous plastic zone of baseline cycles
and the plasticity left in the crack wake, leading to an increase in the compressive residual stress
[119]. This increases the roughness-induced crack closure level at baseline cycles in the near-
threshold region which leads to a decrease in crack growth rates. As ΔK of the baseline cycles
increases, the roughness-induced crack closure decreases, so the effect of overload on closure
decreases as well. This effect increases again as ΔK reaches a level that the plasticity-induced
closure reached its maximum in the Region II [120].
On the other hand, compressive underloads crush surface asperities left in the crack wake of
baseline cycles, leading to a decrease in the compressive residual stress [121]. This decreases the
crack closure at baseline cycles, which leads to an increase in their crack growth rate. Residual
stress after an overload or underload reaches a steady state value after a number of cycles [122]. A
schematic representation of the crack closure level, the Kop/Kmax variation after the application of
an overload or underload as compared to the constant amplitude loading in the three different
regions, is shown in Figure 2.16 [29, 103, 123].
Figure 2.16 Schematic of crack closure variation after an applied overload and underload at
different crack growth regions (adapted from [123])
Plastic replicas on the crack tip were taken after an applied overload. These replicas were examined
using a scanning electron microscope [116]. These observations revealed that crack tip blunting
30
occurs after an overload and crack tip shape becomes similar to a notch. The required number of
cycles to re-grow the crack from a notch is assumed to cause the retardation; however, the
calculated number of cycles in order to initiate a crack from a notch is much lower than the
measured one [75].
On the other hand, underloads are reported to resharpen the crack tip. This sharpening is reported
to accelerate the crack growth of baseline cycles [110, 124]; however, a study reported that the
crack tip was slightly blunted after an applied underload [116].
In some studies, specimens were strain hardened monotonically at a plastic strain equal to 3% in
an 2024-T3 aluminum alloy [125]. Crack growth at R = 0.1 in the strain-hardened specimen was
higher than unstrained specimens [125-127]. It was concluded that two factors cause higher crack
growth rates in strain hardened specimens. The first one is strain hardening at the crack tip, which
reduces ductility. The second one is lower crack closure levels in strain hardened specimens as
compared to unstrained ones [125]. The strain hardened specimen has higher yield stress, so the
plastic zone size is smaller leading to a smaller plasticity-induced crack closure on the crack wake.
The case of periodic underloads and compressive underloads was investigated in literature [116,
120, 128, 129]. It was reported that as the distance between underloads decreases, the acceleration
increases until a maximum is reached [116]. This maximum acceleration is attributed to the strain
hardening ahead of the crack tip inducing a higher mean stress which leads to an increase in crack
growth [116].
b) Near-threshold region
Different test procedures are proposed to measure fatigue crack growth rates in the near-threshold
region and reach the fatigue threshold. In some studies, after a conventional pre-cracking, crack
growth rates under constant amplitude loading are decreased to reach the fatigue threshold of
baseline cycles (ASTM or constant Kmax procedure) [130]. An overload or underload is then applied
to observe its effect on the fatigue threshold of baseline cycles [130, 131].
Other studies applied the decreasing gradient proposed by ASTM for baseline cycles and periodic
overloads or underloads to reach the fatigue threshold. In other procedures, the Kmax was kept
constant, while the ΔKBL was decreased to reach the fatigue threshold under periodic overloads or
underloads. These procedures are explained in detail in Chapter 7 for periodic underloads [132].

31
Here, the effects of overloads and underloads on crack growth rates in near-threshold region are
reviewed.
An overload increases the fatigue threshold of baseline cycles. As the Kmax,OL increases, the fatigue
threshold of baseline cycles also increases. This increase was higher for a nickel based alloy as
compared to the titanium alloy 6Al-4V [120]; however, an applied overload with a Kmax,OL smaller
than 10% of the Kmax of baseline cycles did not modify the fatigue threshold of baseline cycles for
both aforementioned materials [113].
On the other hand, it has been shown that periodic overloads can increase the crack growth of
baseline cycles at ΔK that is lower than the fatigue threshold in low carbon steels [133]. This means
that the fatigue threshold of baseline cycles is decreased. This decrease was ascribed to a change
of dislocation configuration ahead of the crack tip caused by overloads [103, 133, 134].
In the case of underloads, three compressive underloads in the near threshold region showed that
the crack reinitiated under baseline cycles in an 7150 aluminum alloy [128, 135, 136]; however,
the crack growth rates gradually decreased until the crack stopped growing. It was concluded that
compressive underloads crush surface asperities in the crack wake and cause the crack to be the re-
initiated [135].
On the other hand, periodic underloads and periodic compressive underloads (RUL ˂ 0) increase
the crack growth rate of the baseline cycles, which leads to a decrease in ΔKth of baseline cycles
under constant amplitude loading decrease [114, 128, 135]. It was shown that as frequencies of
applied periodic underloads and compressive underloads increase, the fatigue threshold of baseline
cycles decreases to lower values for low carbon steels and aluminum alloys [120, 128]. It was also
shown that underloads decrease the crack closure level of subsequent baseline cycles. As the crack
grows, the crack closure gradually increases as it returns to its steady state of baseline cycles [120,
137, 138].
2.5.3 Crack growth prediction methods
One of the earliest methods to predict failure under variable amplitude loading was of Miner’s
linear cumulative damage method [139]. A similar method was employed using the Paris equation
and has been referred to as linear damage summation (LDS) [116]. In this method, crack growth
(Δa) is calculated using the Paris equation for each cycle and is incremented to the previous crack
length until it reaches a critical length (af), as shown in Equation 2.25.
32
0
1
,
m
f i
i
a a a a C K (2.24)
This method can be employed for periodic load blocks too, as shown in Equation 2.25. Crack length
is incremented for each load block (Δablock,j) [10].
0 , ,
1
,
m
f block j block j j j
j
a a a a C K N (2.25)
The linear summation method is employed in engineering designs because of its simplicity [140];
however, the effect of interaction between different load cycles is not considered in this method.
In particular the effect of overloads or underloads on the crack growth of subsequent baseline
cycles is not considered. A load interaction factor is determined by comparing crack growth
measured under variable amplitude loading (Δameasured) to the predicted growth by LDS (ΔaLDS),
load interaction = measured
LDS
a
a
(2.26)
A measured crack growth that is lower than the linear damage summation means a crack growth
retardation, otherwise it is acceleration [116].
In order to predict the crack growth of the baseline cycles after an applied overloads, Wheeler
proposed a modified linear damage summation method [141]. As it was mentioned earlier, the
crack length affected by the overload, ΔaOL, is again equal to the size of the overload monotonous
plastic size. The Wheeler prediction inserts a load interaction factor Cy (lower than unity) in the
linear damage summation which leads to a decrease in ΔK and crack growth of baseline cycles
within the monotonous plastic zone size , and is given by the following equations [141, 142]:
,
, , , Δi
i
y
y i y OL i
z
i
rC r a
(2.27)
0
1
, n mm
f y i i
i
a a C a a C K C S a
(2.28)
As it can be seen in Equation 2.27, the Cy,i is a load interaction factor for each cycle (i). The ry,i is
the current baseline cycles monotonous plastic zone size and λi is the distance between the crack
tip and overload monotonous plastic zone (ry,OL), as shown in Figure 2.17a. As the crack grows,
the distance between the crack tip and overload monotonous plastic zone sizes decreases, so the Cy

33
increases from a minimum value to a value of one. The z is a curve fitting parameter, which depends
on the type of applied loads and the material. For this reason the Wheeler method has been
criticized for being more of a curve fitting method than a prediction method [143].
a) b)
Figure 2.17 Two prediction models, a) Wheeler, and b) Willenborg (adapted from [144])
Later, a modified Wheeler method was proposed to replace the fitting curve parameter z with the
following equation [143, 144]:
log
2 log r
th
K
Kmz
K
(2.29)
The m value is the Paris equation exponent, ΔKth is the fatigue threshold of the material, and Kr is
the Kmax,OL/Kmax [143].
Willenborg also proposed to use Equation 2.30 to predict crack growth after an applied overload
(Figure 2.17b). The Kmax,OL is reduced to Kred as given in Equation 2.31. This SIF reduction (Kred)
decreases with increasing crack length (ai) and reaches zero when the crack grows out of the
monotonic plastic zone created by the overload,
m
,
ax, 1i OL
p
e OL
L
r d
O
a aK K
R
(2.30)
Effective parameters, Kmax,eff,i, Kmin,eff,i, and Reff,i are calculated using Equation 2.33:

34
max, , max,eff i i redK K K min, , min,eff i i redK K K min, ,
,
max, ,
eff i
eff i
eff i
RK
K (2.31)
The Walker equation is then used to predict crack growth for each cycle.
0 0 max, ,
1
, (1 R )n
mp
f R eff i eff
i
a a a a C K
(2.32)
In this method, ΔK is constant, but a decrease in the Kmin and Kmax levels is applied to decrease
crack growth. Several other methods were proposed to improve this method [145-147]. Chang et
al. modified the Willenborg method by taking into account the effect of periodic overloads and
compressive underloads [144, 146, 147].
As seen in Figure 2.18, the crack growth rates of baseline cycles measured experimentally after an
overload are compared to those predicted by different methods [148]. This figure shows that the
Wheeler method predicts in average higher growth rates as compared to measured crack growth
rates. On the other hand, the Willenborg method predicts lower crack growth rates as compared to
the measured ones. Both methods do not predict the initial acceleration of the crack growth rate.
Note that the Wheeler and Willenborg methods were developed based on results of an applied
single overload on baseline cycles with a crack growth rate corresponding to the Paris region;
however, the crack length retardation can be larger as baseline cycles approach the near-threshold
region [110].
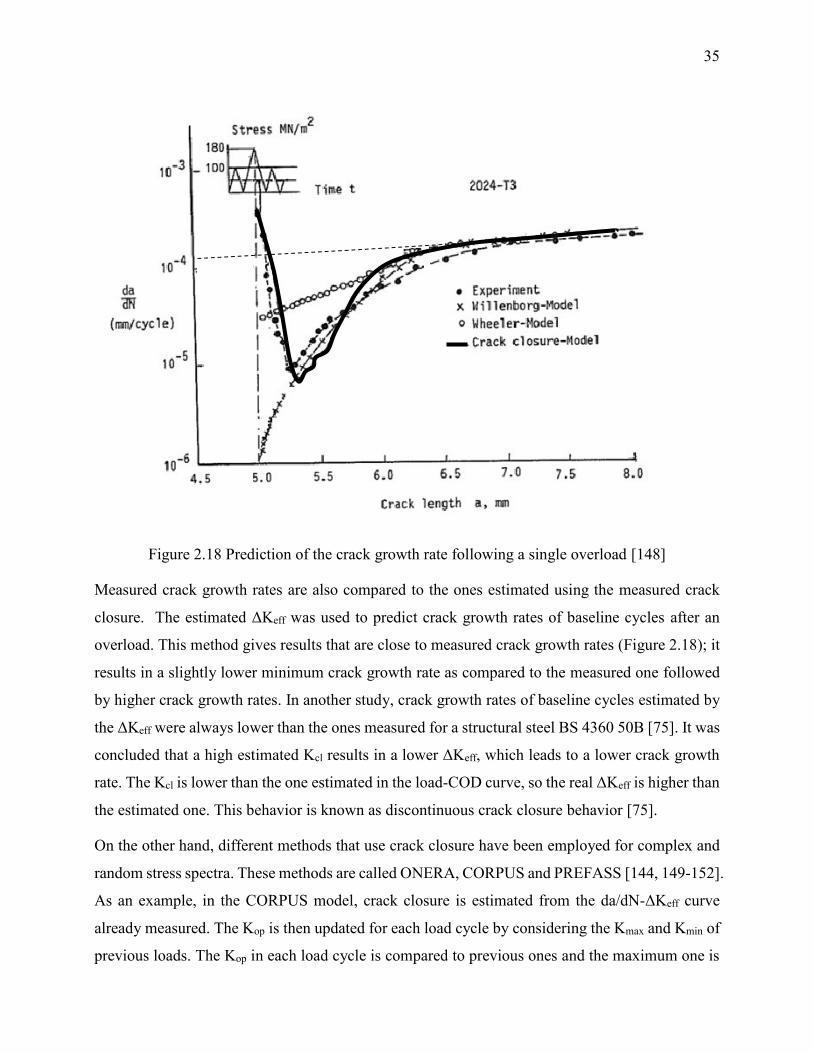
35
Figure 2.18 Prediction of the crack growth rate following a single overload [148]
Measured crack growth rates are also compared to the ones estimated using the measured crack
closure. The estimated ΔKeff was used to predict crack growth rates of baseline cycles after an
overload. This method gives results that are close to measured crack growth rates (Figure 2.18); it
results in a slightly lower minimum crack growth rate as compared to the measured one followed
by higher crack growth rates. In another study, crack growth rates of baseline cycles estimated by
the ΔKeff were always lower than the ones measured for a structural steel BS 4360 50B [75]. It was
concluded that a high estimated Kcl results in a lower ΔKeff, which leads to a lower crack growth
rate. The Kcl is lower than the one estimated in the load-COD curve, so the real ΔKeff is higher than
the estimated one. This behavior is known as discontinuous crack closure behavior [75].
On the other hand, different methods that use crack closure have been employed for complex and
random stress spectra. These methods are called ONERA, CORPUS and PREFASS [144, 149-152].
As an example, in the CORPUS model, crack closure is estimated from the da/dN-ΔKeff curve
already measured. The Kop is then updated for each load cycle by considering the Kmax and Kmin of
previous loads. The Kop in each load cycle is compared to previous ones and the maximum one is
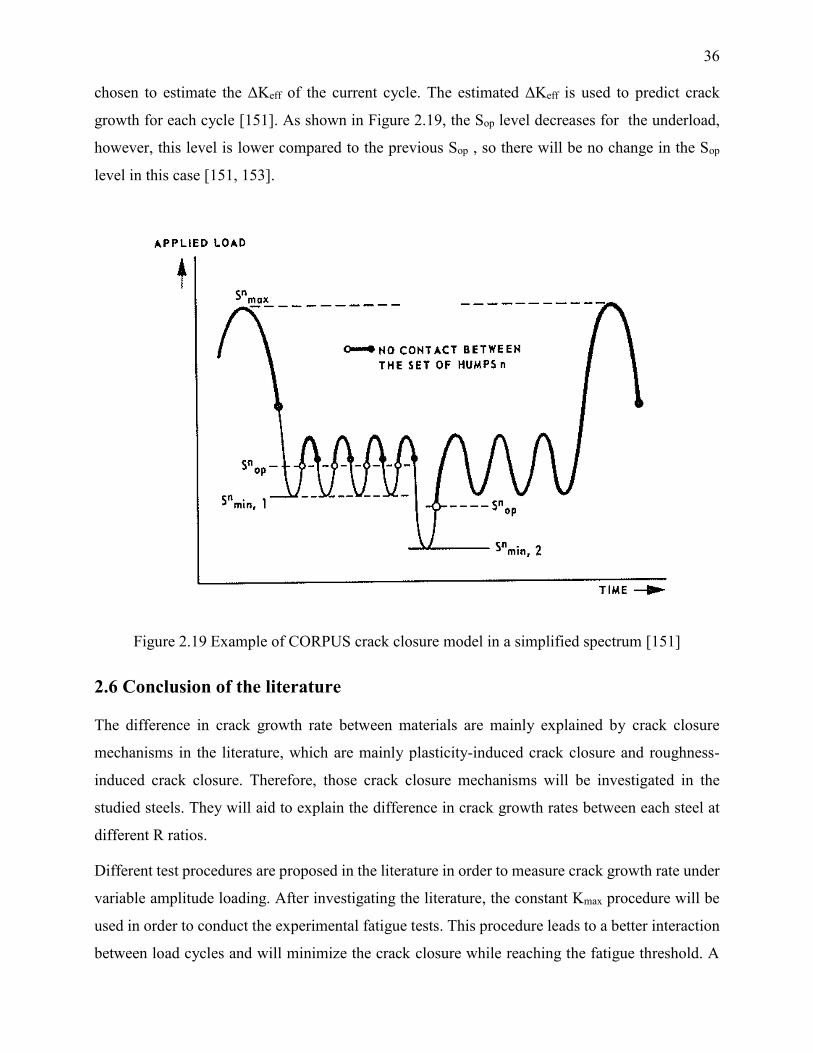
36
chosen to estimate the ΔKeff of the current cycle. The estimated ΔKeff is used to predict crack
growth for each cycle [151]. As shown in Figure 2.19, the Sop level decreases for the underload,
however, this level is lower compared to the previous Sop , so there will be no change in the Sop
level in this case [151, 153].
Figure 2.19 Example of CORPUS crack closure model in a simplified spectrum [151]
2.6 Conclusion of the literature
The difference in crack growth rate between materials are mainly explained by crack closure
mechanisms in the literature, which are mainly plasticity-induced crack closure and roughness-
induced crack closure. Therefore, those crack closure mechanisms will be investigated in the
studied steels. They will aid to explain the difference in crack growth rates between each steel at
different R ratios.
Different test procedures are proposed in the literature in order to measure crack growth rate under
variable amplitude loading. After investigating the literature, the constant Kmax procedure will be
used in order to conduct the experimental fatigue tests. This procedure leads to a better interaction
between load cycles and will minimize the crack closure while reaching the fatigue threshold. A
37
new test procedure in order to measure fatigue threshold under variable amplitude loading at very
low crack growth rates will be proposed. However, these procedures should have a value that is
close to the real load conditions otherwise these interactions and the fatigue threshold depends on
the level of Kmax values.
The acceleration factors in the studied steels are not estimated in the literature, therefore this study
will give the acceleration factor for those steels. Moreover, the mechanisms that will lead to an
increase in crack growth compared to the LDS prediction will be proposed by considering the
mechanism proposed in the literature.

38
CHAPTER 3 METHODOLOGY AND EXPERIMENTAL PROCEDURE
3.1 Methodology
3.1.1 Stress spectra in turbine runners
The water hits the runner blade and induces tensile stresses that vary depending on the region of
the blades. A finite element simulation is performed in order to estimate these stresses in different
regions of the blade [154]. These regions are shown in Figure 3.1a. In region A, the stress is the
highest on the blade, but a lower stress is applied on region B and C.
a) b)
Figure 3.1 a) Different regions of a runner blade based on stress magnitude [154], and b) steel
plate filled with epoxy and silicone to protect strain gauges installed on region A of a runner
blade [4]
Strain gauges are installed to measure the strain applied on region A of the blade while the runner
is operating. The results of two different measurements are shown in Figure 3.2. Measured strains
are converted to stresses.
Small stress cycles of very high frequency are generated by a small amount of water flow that is
directed by partially opened wicket gates to blades at the beginning of the runner operation. These
cycles generate startup and spin-no-load (SNL). A maximum opening of wicket gates then directs
a maximum flow to runner blades. As a result, the tensile static stress rises to its highest level. As
seen in Figure 3.2a, the stress amplitude of small cycles is low and reaches a few MPa. Figure 3.2b
shows that the stress amplitude of small cycles is high and reaches tens of MPa.
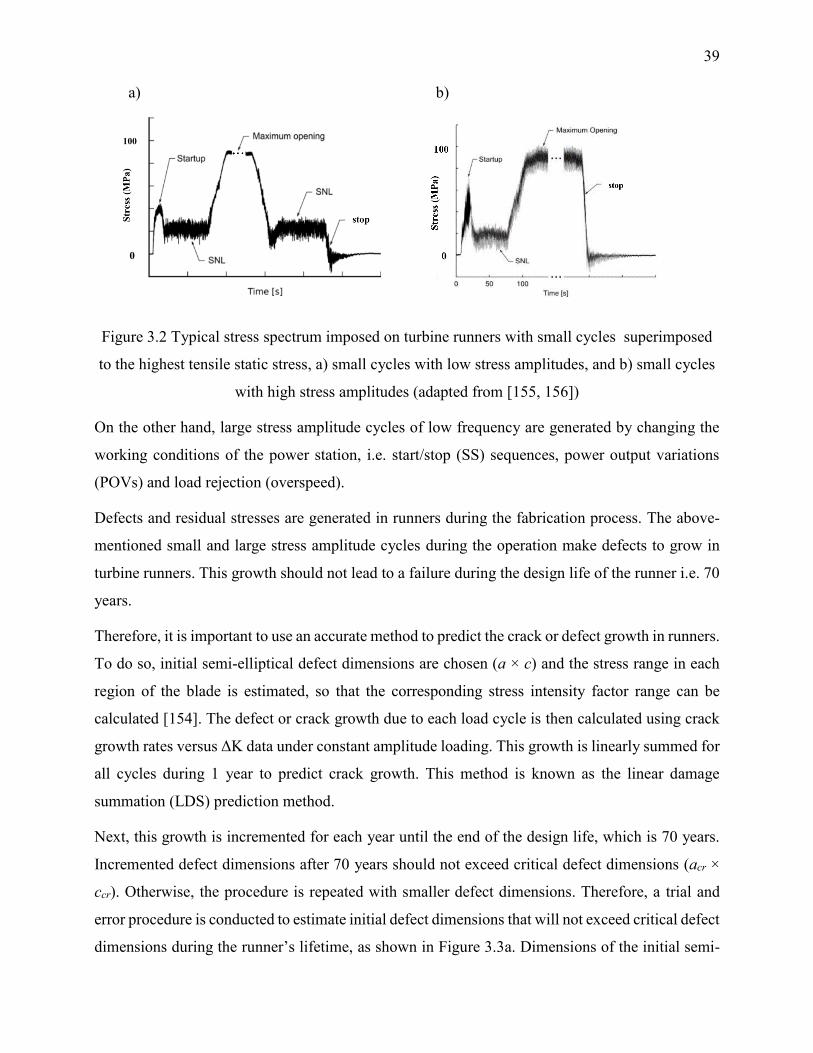
39
a) b)
Figure 3.2 Typical stress spectrum imposed on turbine runners with small cycles superimposed
to the highest tensile static stress, a) small cycles with low stress amplitudes, and b) small cycles
with high stress amplitudes (adapted from [155, 156])
On the other hand, large stress amplitude cycles of low frequency are generated by changing the
working conditions of the power station, i.e. start/stop (SS) sequences, power output variations
(POVs) and load rejection (overspeed).
Defects and residual stresses are generated in runners during the fabrication process. The above-
mentioned small and large stress amplitude cycles during the operation make defects to grow in
turbine runners. This growth should not lead to a failure during the design life of the runner i.e. 70
years.
Therefore, it is important to use an accurate method to predict the crack or defect growth in runners.
To do so, initial semi-elliptical defect dimensions are chosen (a × c) and the stress range in each
region of the blade is estimated, so that the corresponding stress intensity factor range can be
calculated [154]. The defect or crack growth due to each load cycle is then calculated using crack
growth rates versus ΔK data under constant amplitude loading. This growth is linearly summed for
all cycles during 1 year to predict crack growth. This method is known as the linear damage
summation (LDS) prediction method.
Next, this growth is incremented for each year until the end of the design life, which is 70 years.
Incremented defect dimensions after 70 years should not exceed critical defect dimensions (acr ×
ccr). Otherwise, the procedure is repeated with smaller defect dimensions. Therefore, a trial and
error procedure is conducted to estimate initial defect dimensions that will not exceed critical defect
dimensions during the runner’s lifetime, as shown in Figure 3.3a. Dimensions of the initial semi-
0
100
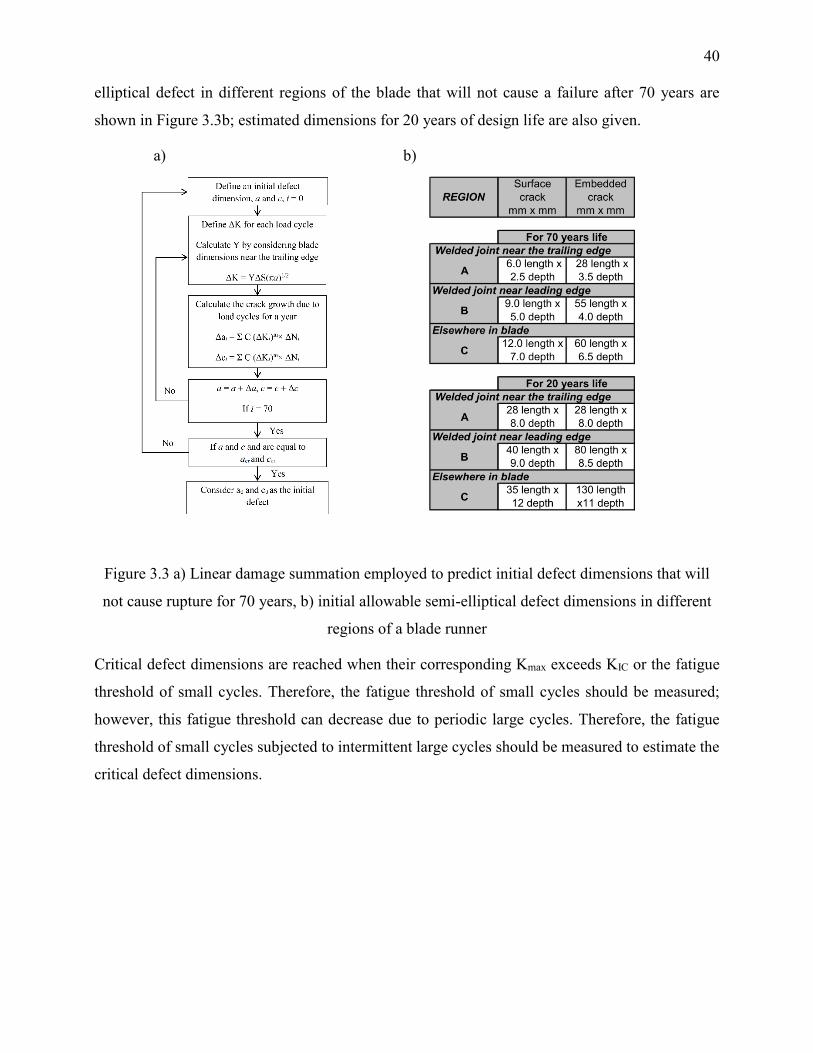
40
elliptical defect in different regions of the blade that will not cause a failure after 70 years are
shown in Figure 3.3b; estimated dimensions for 20 years of design life are also given.
a) b)
Figure 3.3 a) Linear damage summation employed to predict initial defect dimensions that will
not cause rupture for 70 years, b) initial allowable semi-elliptical defect dimensions in different
regions of a blade runner
Critical defect dimensions are reached when their corresponding Kmax exceeds KIC or the fatigue
threshold of small cycles. Therefore, the fatigue threshold of small cycles should be measured;
however, this fatigue threshold can decrease due to periodic large cycles. Therefore, the fatigue
threshold of small cycles subjected to intermittent large cycles should be measured to estimate the
critical defect dimensions.

41
3.1.2 Stress spectra simplifications
The real stress spectrum has many different types of small and large stress amplitude cycles i.e.,
start/stop (SS) sequences, power output variations (POVs) and load rejection (overspeed). Studying
the effect of all these stress cycles on crack growth can be complicated and is not appropriate for
an initial study on the subject. A better approach is to investigate and analyze the effect of
interaction between two stress cycles on crack growth. The real stress spectrum is thus simplified
and reduced only two stress cycles. Thus, the stress cycles that do not contribute to a significant
crack growth are neglected in the simplified stress spectrum.
In the stress spectrum, the startup and SNL last for few cycles at the beginning or end of each
sequence and have a low Smax, as shown in Figure 3.2. Thus, they only account for few cycles with
low stress amplitudes in the stress spectrum, which do not contribute to a large crack growth, so
they are neglected. Load rejections due to sudden uncoupling between the rotor and turbine runner
rarely occur in the load spectrum and so they are also neglected in the stress spectrum.
Consequently, only three stress cycles remain in the simplified load spectrum: small cycles, POVs
and SS sequences. The stress amplitude of small stress cycles and generation of POVs depends on
the type of power stations [154, 157].
In power stations that generate POVs, small cycles have low amplitudes, as shown in Figure 3.2a.
They induce a ΔK that is much lower than the fatigue threshold and so they can be neglected. On
the other hand, in power stations that do not generate POVs, the small cycles have high amplitudes,
as shown in Figure 3.2b. They induce a ΔK that is close to the fatigue threshold and may induce a
crack growth, so they are considered in the load spectrum.
Therefore, POVs and SS sequence remain in the stress spectrum in the first case and small cycles
and SS sequences in the second. As a result, two studies are defined to investigate the effect of
these two stress cycles on crack growth in each case. There are variations in the stress amplitude
of small cycles. For simplicity, the highest stress amplitude is considered to be constant for all
cycles.
a) First study
In a first study, crack growth is measured under POVs and SS sequences. This growth is compared
to the one predicted by LDS using crack growth rates versus ΔK data of large cycles under constant
amplitude loading. Fatigue tests are conducted on the 415, ASTM A516 and 304L steels.

42
Figure 3.4 Simplified load spectrum with POVs and SS sequences
Crack growth is measured at Kmax = 19.43 and 40.77 MPa.m1/2. These Kmax levels are estimated
from stress levels and initial defect dimensions in region A of runner blades [154]. The ratio of
POV cycles over SS sequences during 70 years of turbine runner lifetime is calculated according
to [154] and is shown as n in Figure 3.4. The n values range from a minimum of 3 to a maximum
of 10. Measured crack growths induced by POVs and SS sequences are compared to the ones
predicted by LDS, and results are reported in Chapter 6. This study verifies if LDS can be employed
to predict defect growth in turbine runners.
b) Second study
In the second study, the effect of SS sequences on the fatigue threshold of small cycles is
investigated. A large number of small cycles with high amplitude are generated during the
operation, which can propagate defects. Therefore, it is important to measure a ΔKth corresponding
to small cycles that will not propagate defects. SS sequences can further decrease the ΔKth of small
cycles. Thus, it is important to estimate the decrease in ΔKth due to SS sequences.
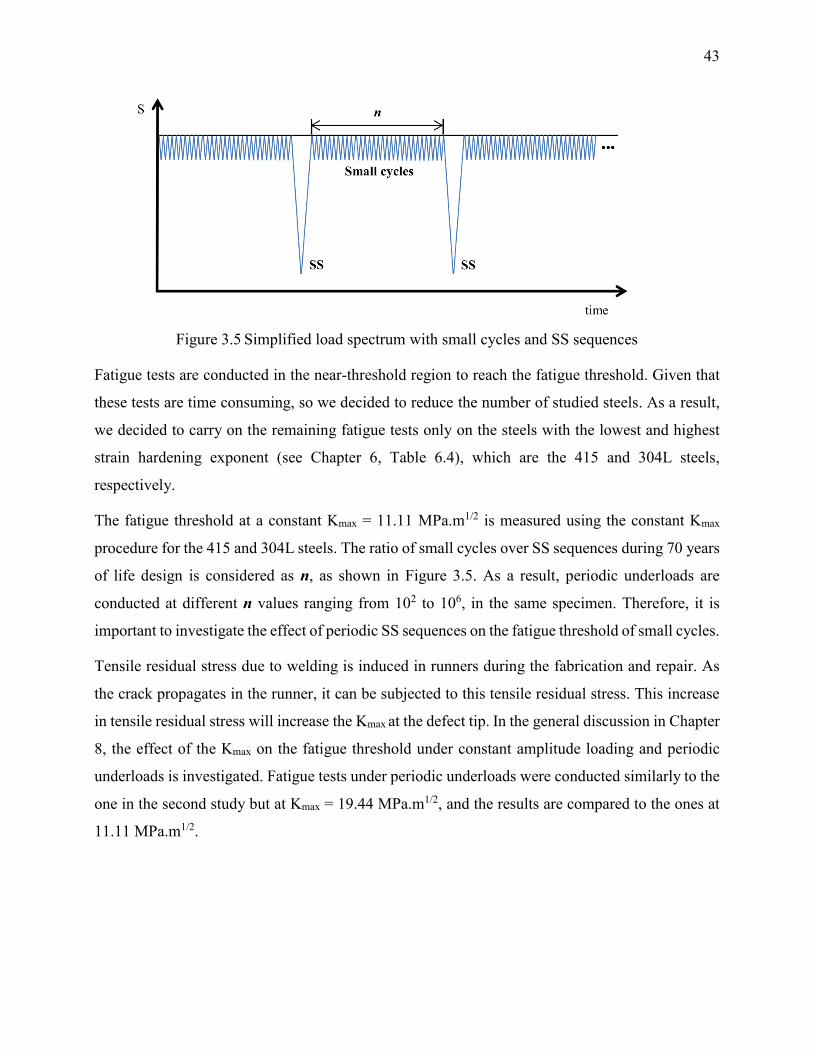
43
Figure 3.5 Simplified load spectrum with small cycles and SS sequences
Fatigue tests are conducted in the near-threshold region to reach the fatigue threshold. Given that
these tests are time consuming, so we decided to reduce the number of studied steels. As a result,
we decided to carry on the remaining fatigue tests only on the steels with the lowest and highest
strain hardening exponent (see Chapter 6, Table 6.4), which are the 415 and 304L steels,
respectively.
The fatigue threshold at a constant Kmax = 11.11 MPa.m1/2 is measured using the constant Kmax
procedure for the 415 and 304L steels. The ratio of small cycles over SS sequences during 70 years
of life design is considered as n, as shown in Figure 3.5. As a result, periodic underloads are
conducted at different n values ranging from 102 to 106, in the same specimen. Therefore, it is
important to investigate the effect of periodic SS sequences on the fatigue threshold of small cycles.
Tensile residual stress due to welding is induced in runners during the fabrication and repair. As
the crack propagates in the runner, it can be subjected to this tensile residual stress. This increase
in tensile residual stress will increase the Kmax at the defect tip. In the general discussion in Chapter
8, the effect of the Kmax on the fatigue threshold under constant amplitude loading and periodic
underloads is investigated. Fatigue tests under periodic underloads were conducted similarly to the
one in the second study but at Kmax = 19.44 MPa.m1/2, and the results are compared to the ones at
11.11 MPa.m1/2.
44
3.2 Experimental procedure
3.2.1 Material characterization
Material characterization, tensile and fatigue tests were conducted on three different steels, namely
the AISI 415, ASTM A516 and AISI 304L. The heat treatment and chemical composition of these
steels is given in Chapter 6.
Plates of each steel were received; they were 1000 mm long, 400 mm wide, and 50 mm thick.
These plates were cut into smaller pieces with a band saw and then further cut with a precision saw
to a size of 50 mm long, 50 mm wide, and 50 mm thick, in three orthogonal planes (LT, LS, and
TS). Each plane section was placed in a hot mounting machine, and the resin was added on top of
the specimen. The resin was heated up to 170°C and cooled down to room temperature to mount
the specimen.
Specimens were then polished using silicon carbide abrasive papers. This process was carried out
by increasing the grit numbers at each step from 240 up to 800 grits. The polishing was then
continued using diamond suspensions from 6 microns down to 1 micron. Etchants were used to
reveal the microstructure of each type of steel, as shown in Chapter 6. Grain size measurements
were carried out with an optical microscope equipped with an image analysis software. All
measurements were carried out with a magnification of 200 X. The grain size was estimated
visually by considering the grain boundaries of each grain. The spherical diameter was defined as
the grain diameter size. At least 100 measurements were taken in each plane.
After conducting grain size measurements, specimens were polished with the diamond suspension
of 1 micron to conduct microhardness measurements. Vickers microhardness measurements on the
three orthogonal planes (10 measurements per plane) were carried out with a force of 100 gf and
15 second dwell time for all steels according to ASTM E384.
In order to conduct an X-ray diffraction analysis, the above-mentioned samples were polished with
the diamond suspension of 1 micron and subsequently thinned with acid (75 ml HCl, 75 ml HNO3
and 100 ml H2O) to remove the deformation induced during polishing. The X-ray diffraction
analysis was then conducted using a Cu Kα source radiation with 0.05 degree per 4 seconds for
angles 2θ from 40° to 140° using the Rietveld method with an accuracy of ± 1.5%.
45
3.2.2 Tensile testing
The tensile test was conducted for each steel in longitudinal (L) and transverse (T) directions with
respect to the rolling direction. Three tests were conducted in each direction on standard specimens,
with reduced cross section of dimensions of 30 mm long and 5 mm diameter [158]. An
extensometer of 25 mm was attached on the reduced section of the specimen surface in order to
measure the strain. Tests were conducted using a servo-electronic machine with a 100 kN dynamic
load cell. The displacement was increased with a relative ramp equal to 0.45 mm/min, according
to the ASTM E8 standard [158]. Tests were stopped when specimens were fractured.
Young’s modulus, the 0.2% yield stress (σ0.2%), ultimate tensile strength (σUTS), elongation at the
rupture (εr) and strain hardening exponents are given as results in order to compare the three
different steels. These parameters are also used as input parameters in da/dN Instron software for
fatigue tests.
3.2.3 Fatigue testing
a) Choice of the specimen
Defects in critical regions of the runner blade are subjected to a combination of tensile and bending
loading [1, 4]. The compact tension, CT, specimen induces a tension load and high bending load
at the crack tip. Thus, the CT specimen represents the aforementioned loading condition in the
runner blade [159]. CT specimens were fabricated with dimensions of 50.8 mm wide and 12.7 mm
thick according to the ASTM E647 standard. This specimen is much smaller than the runner blade
geometry; however, the fabricated specimen has a lower cost as compared to the real geometry to
investigate crack growth under constant amplitude loading and periodic underloads.
b) Specimen installation and precracking
Compact tension specimens were tested in the LT orientation. Dimensions in each specimen were
verified using a caliper before conducting each test. Tests were conducted using a closed loop
servo-hydraulic machine equipped with a 100 kN dynamic load cell for fatigue tests at high ΔK
values. On the other hand, fatigue tests at low ΔK values in the near-threshold region require higher
load precision. Thus, they were carried out with a smaller 20 kN dynamic load cell (Figure 3.6),
with higher load precision as compared to the 100 kN load cell. The CT specimen was installed on
the grips of the hydraulic machine. Optical microscopes were then installed on both sides of the
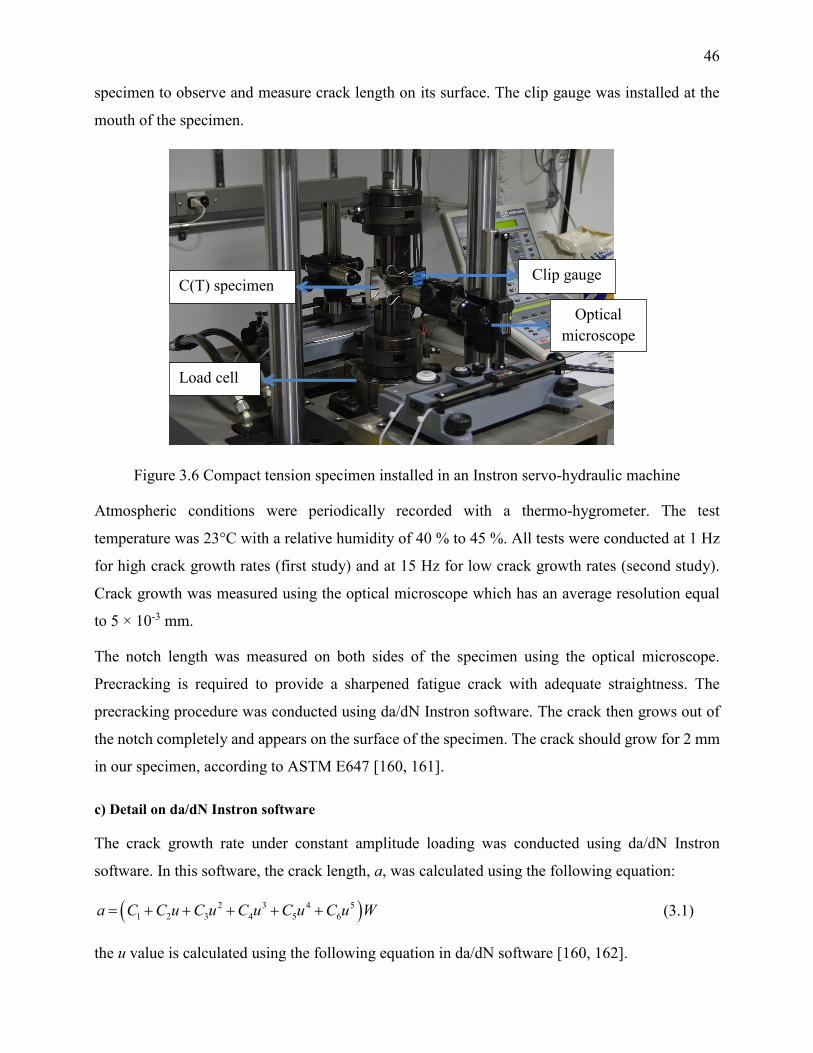
46
specimen to observe and measure crack length on its surface. The clip gauge was installed at the
mouth of the specimen.
Figure 3.6 Compact tension specimen installed in an Instron servo-hydraulic machine
Atmospheric conditions were periodically recorded with a thermo-hygrometer. The test
temperature was 23°C with a relative humidity of 40 % to 45 %. All tests were conducted at 1 Hz
for high crack growth rates (first study) and at 15 Hz for low crack growth rates (second study).
Crack growth was measured using the optical microscope which has an average resolution equal
to 5 × 10⁻³ mm.
The notch length was measured on both sides of the specimen using the optical microscope.
Precracking is required to provide a sharpened fatigue crack with adequate straightness. The
precracking procedure was conducted using da/dN Instron software. The crack then grows out of
the notch completely and appears on the surface of the specimen. The crack should grow for 2 mm
in our specimen, according to ASTM E647 [160, 161].
c) Detail on da/dN Instron software
The crack growth rate under constant amplitude loading was conducted using da/dN Instron
software. In this software, the crack length, a, was calculated using the following equation:
2 3 4 5
1 2 3 4 5 6 a C C u C u C u C u C u W (3.1)
the u value is calculated using the following equation in da/dN software [160, 162].
Load cell
C(T) specimen
Optical
microscope
Clip gauge
47
1
2
1
1
uBE V
P
(3.2)
where ΔV is the crack opening displacement measured using strain gauges installed at the mouth
of the specimen; ΔP is the load range measured using strain gauges in the load cell; B is the
thickness of the specimen, and E is Young’s modulus of the steel.
The values of coefficients C1 to C6 in Equation 3.1 are given below and correspond to
measurements carried out at the mouth of the specimen,
1 2 3 4 5 61.001, 4.669, 18.46, 236.82, 1214.9, 2143.6 C C C C C C
however, the strain gauge was installed with a knife edge with a width of 1.9 mm from the mouth
of the specimen. As a consequence, C1 to C6 coefficients in Equation 3.1 were calculated and
modified in da/dN software. Corresponding coefficients were calculated according to [162], and
using the following equation,
1 2 3 4 5 61.001, 4.752, 19.453, 257.16, 1351.3, 2466C C C C C C (3.3)
The estimated crack length from da/dN software should be equal to the one measured with the
optical microscope on the surface of the specimen. If there is a difference, the crack length
calculated should be adjusted to the one measured by slightly modifying Young’s modulus in
Equation 3.2.
The ΔK in da/dN software is calculated from the crack length estimated using the following
equation (α ≥ 0.2) [163, 164]:
2 3 4
32
20.886 4.64 13.32 14.72 5.6
1
P aK a a a a
B W a
(3.4)
d) Software choice to conduct fatigue tests
Tests under constant amplitude loading were conducted using da/dN Instron software; however, in
the case of periodic underloads, a periodic and sudden decrease from the Pmax of baseline cycles
followed by an increase to the same level is necessary to generate periodic underloads. That said,
da/dN Instron software only induces a gradual decrease in the Pmax of baseline cycles followed by
a gradual increase until it reaches the Pmax.

48
This software could not be used to represent periodic underloads loading. So finally, periodic
underloads were generated using Wavemaker Instron software. The crack length was measured
with the microscope installed on both sides of the specimen. After measuring an average crack
length, the load was manually adjusted to have a constant Kmax during the tests.
e) Fractography analysis
Once the fatigue tests were completed, specimens were fractured into two pieces to observe and
analyze fatigued surfaces. These observations were performed using a scanning electron
microscope (SEM). Specimens were cleaned by soaking them in ethanol and putting them in the
ultrasonic bath. They were then stuck in the specimen holder to be entered into the SEM chamber.
The pressure in the vacuum chamber was set at 60 Pa. Observations were generally conducted with
a voltage equal to 15 kV. Specimens were at a maximum distance of 7 mm from the beam.
Fractography observations were carried out to observe the striation spacing on the fracture surface
of each steel. At least four pictures were taken to measure striation spacings, the taken pictures
were then analyzed with image analysis software.
49
CHAPTER 4 ORGANIZATION OF THE FOLLOWING SECTIONS
In Chapter 5, the ASTM E647 load procedure is used to measure crack growth rates under constant
amplitude loading at R = 0.1 and R = 0.7 by reaching the fatigue threshold in the 415 and 304L
steels. Measured crack growth rates versus ΔK will be compared in both steels at both R ratios.
Crack closure at R = 0.1 will be compared with the one at R = 0.7. The mechanisms that induce
crack closure such as roughness-induced and plasticity-induced crack closure will be analyzed in
both steels.
A first published article in Chapter 6 is written in order to investigate the first study by determining
the effect of large cycles on crack growth rates in turbine runners. In this article, the microstructure
and tensile properties of three wrought steels, AISI 415, ASTM A516, and AISI 304L, used to
fabricate the runners will be compared. The experimental procedure will be defined to be similar
to the load conditions in the load spectrum. A test procedure at constant Kmax will be defined in
order to have a better estimation of the interaction between baseline cycles and periodic underloads.
The crack growth rate under constant amplitude loading will be measured at different R ratios at
two constant Kmax values in those three steels. These measured crack growth rates will be employed
to calculate the LDS prediction which is used to predict the crack growth rates under periodic
underloads.
Afterwards, the real crack growth rates under periodic underloads will be measured at two constant
Kmax values and compared to the LDS prediction in each steel. The accelerations factors in each
steel will be specified at each Kmax. The mechanisms that may cause the crack to grow faster under
periodic underloads than the one predicted by LDS in each steel will be investigated.
A second published article in Chapter 7 is written in order to investigate the second study by
determining the effect of turbine start/stop sequences (periodic underloads) on the fatigue threshold
of small cycles at high stress ratio (baseline cycles) in two steels used in turbine runners, i.e. AISI
415 and 304L steels.
In this article, a review of different load procedures to reach the fatigue threshold under constant
amplitude loading and periodic underloads will be presented. The procedure, that will give a better
estimation of the effect of periodic underloads on the fatigue threshold, will be used to conduct the
experiments. Moreover, a new test procedure to measure fatigue threshold at very low crack growth
rates under periodic underloads will be proposed.
50
Keeping Kmax constant, a first load procedure is conducted with decreasing ΔK to measure fatigue
thresholds at 2 × 10⁻⁷ mm/cycle under both constant amplitude loading and periodic underloads at
various frequencies. We will able to specify that after a certain frequency of periodic underloads
the fatigue threshold will start to decrease Therefore, in the load spectrum periodic underloads or
start/stop sequences should not exceed this frequency during the 70 years of life design.
Then a second load procedure is conducted to measure fatigue thresholds under periodic underloads
at one frequency with increasing ΔK of baseline cycles from zero. Therefore, the effect of periodic
underloads at very low ΔK and low crack growth rate of baseline cycles will be investigated and
compared to the ones at higher crack growth rates as well.
In Chapter 8, the results of the last four chapters are summarized and discussed and some additional
results will be presented and discussed. The procedures in order to measure crack growth rate under
constant amplitude loading in the Paris and in the near-threshold regions will be summarized. The
effect of Kmax on crack growth rate under constant amplitude loading and periodic underloads is
investigated and the results will be discussed.
In Chapter 9, the conclusion will be given, the load conditions in order to avoid crack propagation
due to small cycles will be specified. The acceleration factors that should be considered in order to
be able to predict the crack growth rate due to large cycles will be specified. Some
recommendations are given for further studies in order to have a better estimation of the interaction
between different load cycles based on the non-simplified load spectrum is presented.
51
CHAPTER 5 CRACK GROWTH UNDER CONSTANT AMPLITUDE
LOADING
5.1 ASTM load procedure
The ASTM load procedure is a classical one that is often used to reach the fatigue threshold at low
and high R ratios. This procedure is employed to measure crack growth rates under constant
amplitude loading at R = 0.1 and R = 0.7 while reaching the fatigue threshold. Crack closure at R
= 0.1 and 0.7 can be estimated in both steels. Measured crack growth rates versus ΔK at R = 0.1
can then be compared with the ones versus ΔKeff at R = 0.7. Measured crack growth rates in this
chapter will be employed in Chapter 6 for the LDS calculation.
5.2 Materials and experimental procedures
5.2.1 Materials
The studied materials are the AISI 415, ASTM A516 and AISI 304L steels. Crack growth rate
measurements in the near-threshold are time consuming. So, we decided to conduct fatigue tests
only on the steels with the lowest and highest strain hardening exponent (see Chapter 6, Table 6.4),
which are the AISI 415 and 304L steels.
This study investigates fatigue crack propagation in two wrought steels, namely the AISI 415 and
304L steels. For simplicity, these two steels will be called 415 and 304L, hereafter. The chemical
composition and heat treatment of both steels are given in Chapter 6.
5.2.2 Fatigue testing
Fatigue tests are performed using a closed loop servo-hydraulic machine equipped with a 20 kN
dynamic load cell. Compact tension specimens are tested with dimensions of 50.8 mm wide and
12.7 mm thick, according to ASTM E647 in LT orientation. Atmospheric conditions were
periodically recorded with a thermo-hygrometer. The test temperature was 23°C with a relative
humidity of 40% to 45%. All tests are conducted with a frequency equal to 15 Hz. Crack growth
rates are measured optically using the secant method.
The compact tension specimen is pre-cracked at a constant Kmax = 11.1 MPa.m1/2 and R = 0.1. This
value corresponds to an Smax = 170 MPa applied to a semi-elliptical defect with dimensions of 2.5
× 6 mm at the surface of a turbine runner [154]. After the pre-cracking, the initial ΔK and Kmax are
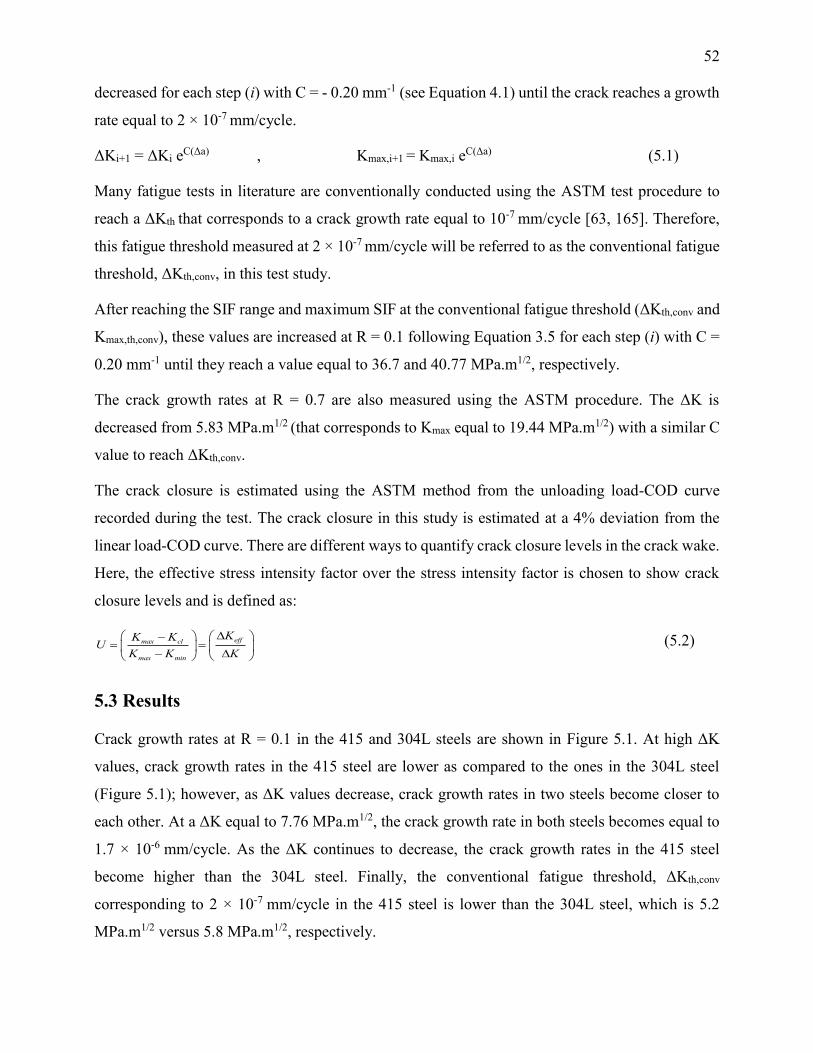
52
decreased for each step (i) with C = - 0.20 mm-1 (see Equation 4.1) until the crack reaches a growth
rate equal to 2 × 10⁻⁷ mm/cycle.
ΔKi+1 = ΔKi eC(Δa) , Kmax,i+1 = Kmax,i e
C(Δa) (5.1)
Many fatigue tests in literature are conventionally conducted using the ASTM test procedure to
reach a ΔKth that corresponds to a crack growth rate equal to 10-7 mm/cycle [63, 165]. Therefore,
this fatigue threshold measured at 2 × 10⁻⁷ mm/cycle will be referred to as the conventional fatigue
threshold, ΔKth,conv, in this test study.
After reaching the SIF range and maximum SIF at the conventional fatigue threshold (ΔKth,conv and
Kmax,th,conv), these values are increased at R = 0.1 following Equation 3.5 for each step (i) with C =
0.20 mm-1 until they reach a value equal to 36.7 and 40.77 MPa.m1/2, respectively.
The crack growth rates at R = 0.7 are also measured using the ASTM procedure. The ΔK is
decreased from 5.83 MPa.m1/2 (that corresponds to Kmax equal to 19.44 MPa.m1/2) with a similar C
value to reach ΔKth,conv.
The crack closure is estimated using the ASTM method from the unloading load-COD curve
recorded during the test. The crack closure in this study is estimated at a 4% deviation from the
linear load-COD curve. There are different ways to quantify crack closure levels in the crack wake.
Here, the effective stress intensity factor over the stress intensity factor is chosen to show crack
closure levels and is defined as:
effmax cl
max min
KK KU
K K K
(5.2)
5.3 Results
Crack growth rates at R = 0.1 in the 415 and 304L steels are shown in Figure 5.1. At high ΔK
values, crack growth rates in the 415 steel are lower as compared to the ones in the 304L steel
(Figure 5.1); however, as ΔK values decrease, crack growth rates in two steels become closer to
each other. At a ΔK equal to 7.76 MPa.m1/2, the crack growth rate in both steels becomes equal to
1.7 × 10⁻⁶ mm/cycle. As the ΔK continues to decrease, the crack growth rates in the 415 steel
become higher than the 304L steel. Finally, the conventional fatigue threshold, ΔKth,conv
corresponding to 2 × 10⁻⁷ mm/cycle in the 415 steel is lower than the 304L steel, which is 5.2
MPa.m1/2 versus 5.8 MPa.m1/2, respectively.

53
Figure 5.1 Crack growth rates versus ΔK and ΔKeff at R = 0.1 in the 415 and 304L steels
Recorded curves show no crack closure at ΔK values above 14.03 MPa.m1/2 in the 415 steel and 16
MPa.m1/2 in the 304L steel; however, below the aforementioned ΔK values, and as the ΔK
approaches the near-threshold region, the estimated crack closure level increases.
Crack growth rates as a function of ΔKeff are lower in the 415 steel as compared to the ones in the
304L steel. However, as ΔKeff decreases to lower values, the crack growth rates in two steels
become closer to each other (Figure 5.1). The estimated crack closure level at the conventional
fatigue threshold in both steels is equal to 0.39. As a result, the estimated effective ΔKth,conv
corresponding to 2 × 10⁻⁷ mm/cycle at R = 0.1 in the 415 and 304L steel are equal to 2.05 and 2.30
MPa.m1/2, respectively. On the other hand, ΔKth,conv at R = 0.7 is equal to 3.35 MPa.m1/2 and 3.38
MPa.m1/2 in the 415 and 304L steels, respectively. No crack closure was detected at R = 0.7 in both
steels.
As shown in Figure 5.2 and Figure 5.3, the ΔKeff values estimated from the linear load-COD curve
at R = 0.1 are compared to the ones at R = 0.7. Crack growth rates versus ΔKeff at R = 0.1 are
higher than the ones at R = 0.7. The difference increases as crack growth rates decrease towards 2
× 10-7 mm/cycle. The effective ΔKth,conv at the fatigue threshold at R = 0.1 is 39% and 32% lower
than the one at R = 0.7 in the 415 and 304L steels, respectively.
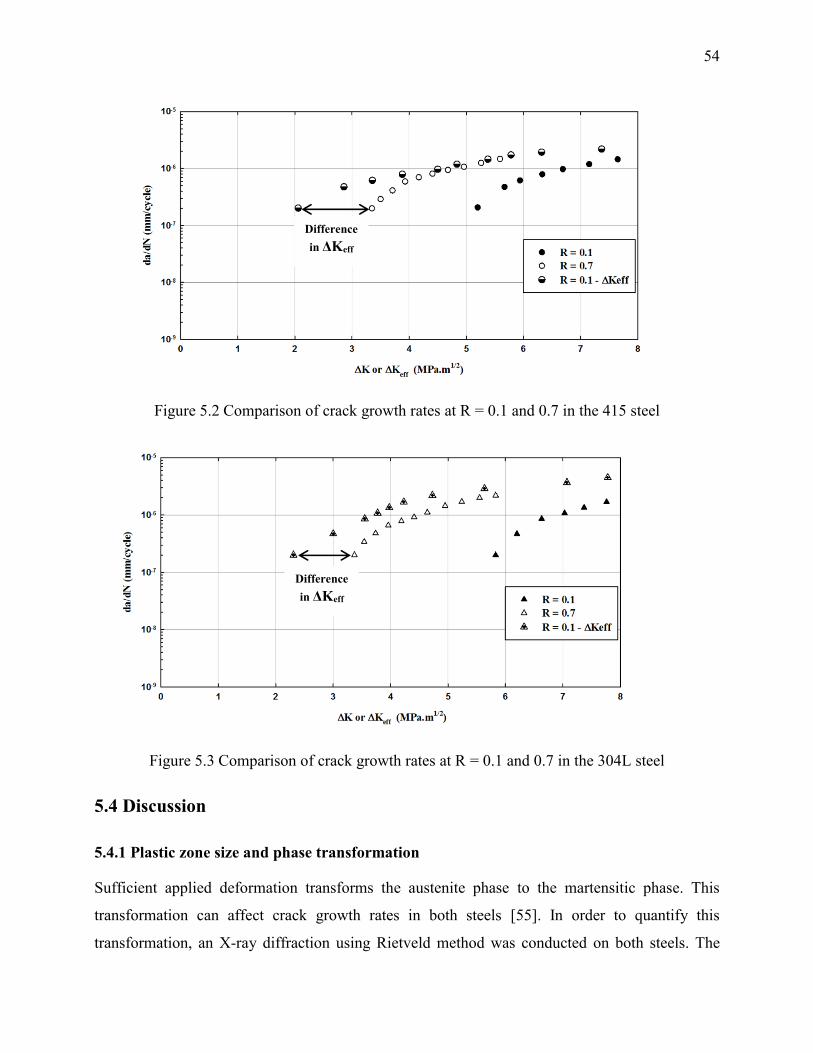
54
Figure 5.2 Comparison of crack growth rates at R = 0.1 and 0.7 in the 415 steel
Figure 5.3 Comparison of crack growth rates at R = 0.1 and 0.7 in the 304L steel
5.4 Discussion
5.4.1 Plastic zone size and phase transformation
Sufficient applied deformation transforms the austenite phase to the martensitic phase. This
transformation can affect crack growth rates in both steels [55]. In order to quantify this
transformation, an X-ray diffraction using Rietveld method was conducted on both steels. The
Difference
in ΔKeff
Difference
in ΔKeff
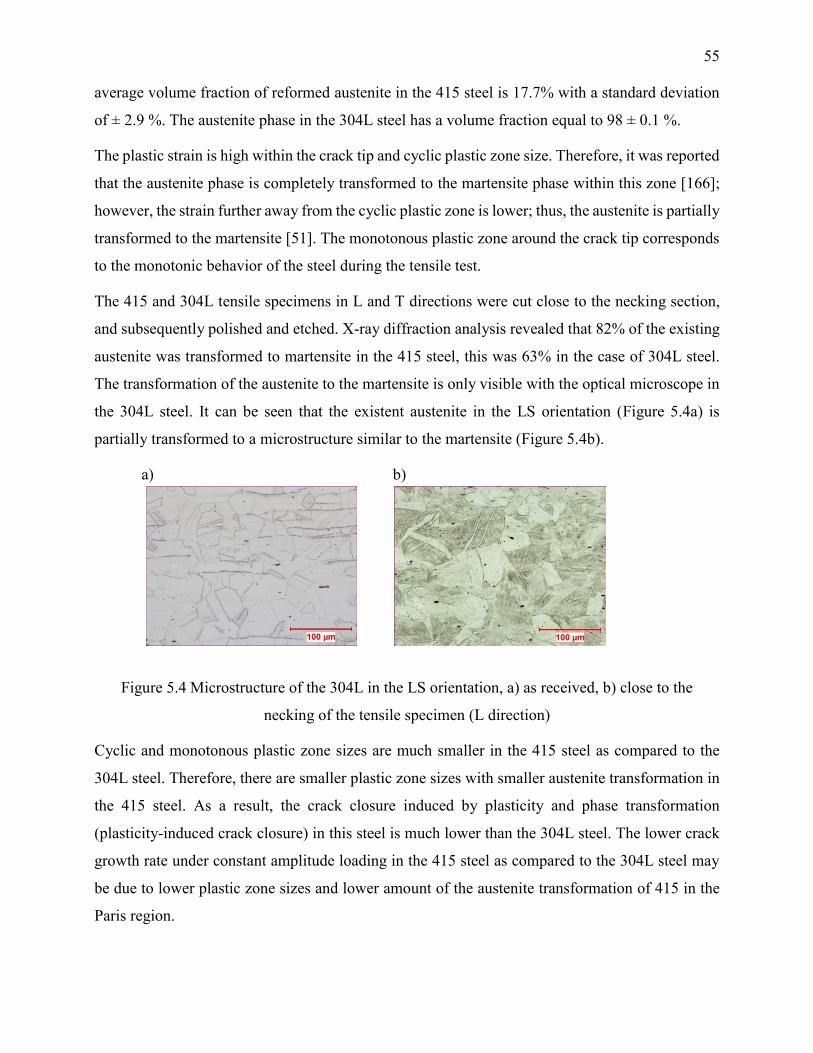
55
average volume fraction of reformed austenite in the 415 steel is 17.7% with a standard deviation
of ± 2.9 %. The austenite phase in the 304L steel has a volume fraction equal to 98 ± 0.1 %.
The plastic strain is high within the crack tip and cyclic plastic zone size. Therefore, it was reported
that the austenite phase is completely transformed to the martensite phase within this zone [166];
however, the strain further away from the cyclic plastic zone is lower; thus, the austenite is partially
transformed to the martensite [51]. The monotonous plastic zone around the crack tip corresponds
to the monotonic behavior of the steel during the tensile test.
The 415 and 304L tensile specimens in L and T directions were cut close to the necking section,
and subsequently polished and etched. X-ray diffraction analysis revealed that 82% of the existing
austenite was transformed to martensite in the 415 steel, this was 63% in the case of 304L steel.
The transformation of the austenite to the martensite is only visible with the optical microscope in
the 304L steel. It can be seen that the existent austenite in the LS orientation (Figure 5.4a) is
partially transformed to a microstructure similar to the martensite (Figure 5.4b).
a) b)
Figure 5.4 Microstructure of the 304L in the LS orientation, a) as received, b) close to the
necking of the tensile specimen (L direction)
Cyclic and monotonous plastic zone sizes are much smaller in the 415 steel as compared to the
304L steel. Therefore, there are smaller plastic zone sizes with smaller austenite transformation in
the 415 steel. As a result, the crack closure induced by plasticity and phase transformation
(plasticity-induced crack closure) in this steel is much lower than the 304L steel. The lower crack
growth rate under constant amplitude loading in the 415 steel as compared to the 304L steel may
be due to lower plastic zone sizes and lower amount of the austenite transformation of 415 in the
Paris region.

56
5.4.2 Crack path irregularities
The crack angle and length deflection are much higher in the 415 steel (Figure 5.6) as compared to
the 304L steel (Figure 5.6). Therefore, crack closure is mainly induced by surface asperities in the
415 (roughness-induced crack closure) steel and is higher than the one in the 304L steel.
In the 415 steel, analysis of the recorded P-COD curves at both R ratios shows crack closure at R
= 0.1 but not at R = 0.7; however, the crack angle and length deflection at ΔKth,conv at R = 0.1 and
0.7 are similar in the 415 steel (Figure 5.5a and b).
a) b)
Figure 5.5 Crack path on the surface of the specimen at ΔKth,conv in the 415 steel at, a) R = 0.1,
and b) R = 0.7
a) b)
Figure 5.6 Crack path on the surface of the specimen at ΔKth,conv in the 304L steel at, a) R = 0.1,
and b) R = 0.7
In order to correlate the effective ΔKth,conv at R = 0.1 to the one at R = 0.7, crack closure is estimated
with a higher percentage deviation from the recorded P-COD curve. This method has also been
employed in [82, 167]. In this study, a deviation equal to 15% leads to an estimated effective

57
ΔKth,conv at R = 0.1 equal to 2.89 and 3.25 MPa.m1/2 in the 415 and 304L steels, respectively. These
values are 13% and 4% lower than the ones at R = 0.7, respectively.
58
CHAPTER 6 ARTICLE 1: EFFECT OF PERIODIC UNDERLOADS ON
FATIGUE CRACK GROWTH IN THREE STEELS USED IN HYDRAULIC
TURBINE RUNNERS
Published in International Journal of Fatigue, Vol. 85, 2016, pp. 40-48
M. Hassanipoura, Y. Verremana, J. Lanteigneb, J. Q. Chena
aDepartment of Mechanical Engineering, École Polytechnique de Montréal, Montréal, Québec, Canada, H3T 1J4
bInstitut de Recherche d’Hydro-Québec, Varennes, Québec, Canada, J3X 1S1
Abstract
The aim of the present work is to study the interaction between two loading cycles in hydraulic
turbine runners, i.e. baseline cycles which are the result of power output variations and periodic
underloads which correspond to runner start/stop sequences. In order to make better evaluations of
fatigue lives, there is a need to determine the real crack growth as compared to those predicted by
linear damage summation. This comparison is made for three wrought steels, AISI 415, ASTM
A516, and AISI 304L. Fatigue tests were run under both constant amplitude loading and periodic
underloads at two constant values of maximum stress intensity factor, Kmax. The crack growth
under periodic underloads was faster than that predicted by linear damage summation for the A516
and 304L steels, while almost no acceleration was found for the 415 steel. The acceleration factors
reached the highest values under low Kmax and high load ratio of baseline cycles. High tensile
residual stresses and strain hardening at the crack tip caused by underloads contribute to crack
growth acceleration during the subsequent baseline cycles.
Keywords: Fatigue crack growth; Periodic underloads; Turbine runners steels; Linear damage
summation; Interaction factor
Corresponding author. Tel.: (+1) 514 - 9614990.
E-mail address: [email protected]
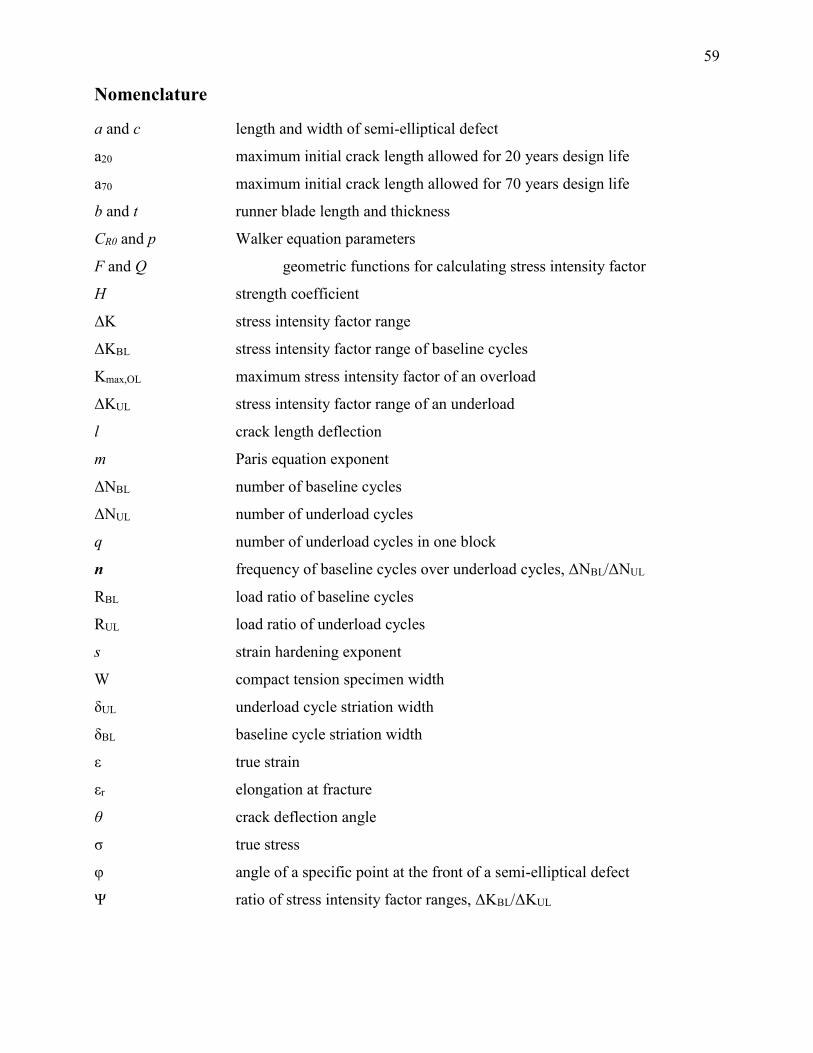
59
Nomenclature
a and c length and width of semi-elliptical defect
a20 maximum initial crack length allowed for 20 years design life
a70 maximum initial crack length allowed for 70 years design life
b and t runner blade length and thickness
CR0 and p Walker equation parameters
F and Q geometric functions for calculating stress intensity factor
H strength coefficient
ΔK stress intensity factor range
ΔKBL stress intensity factor range of baseline cycles
Kmax,OL maximum stress intensity factor of an overload
ΔKUL stress intensity factor range of an underload
l crack length deflection
m Paris equation exponent
ΔNBL number of baseline cycles
ΔNUL number of underload cycles
q number of underload cycles in one block
n frequency of baseline cycles over underload cycles, ΔNBL/ΔNUL
RBL load ratio of baseline cycles
RUL load ratio of underload cycles
s strain hardening exponent
W compact tension specimen width
δUL underload cycle striation width
δBL baseline cycle striation width
ε true strain
εr elongation at fracture
θ crack deflection angle
σ true stress
φ angle of a specific point at the front of a semi-elliptical defect
Ψ ratio of stress intensity factor ranges, ΔKBL/ΔKUL
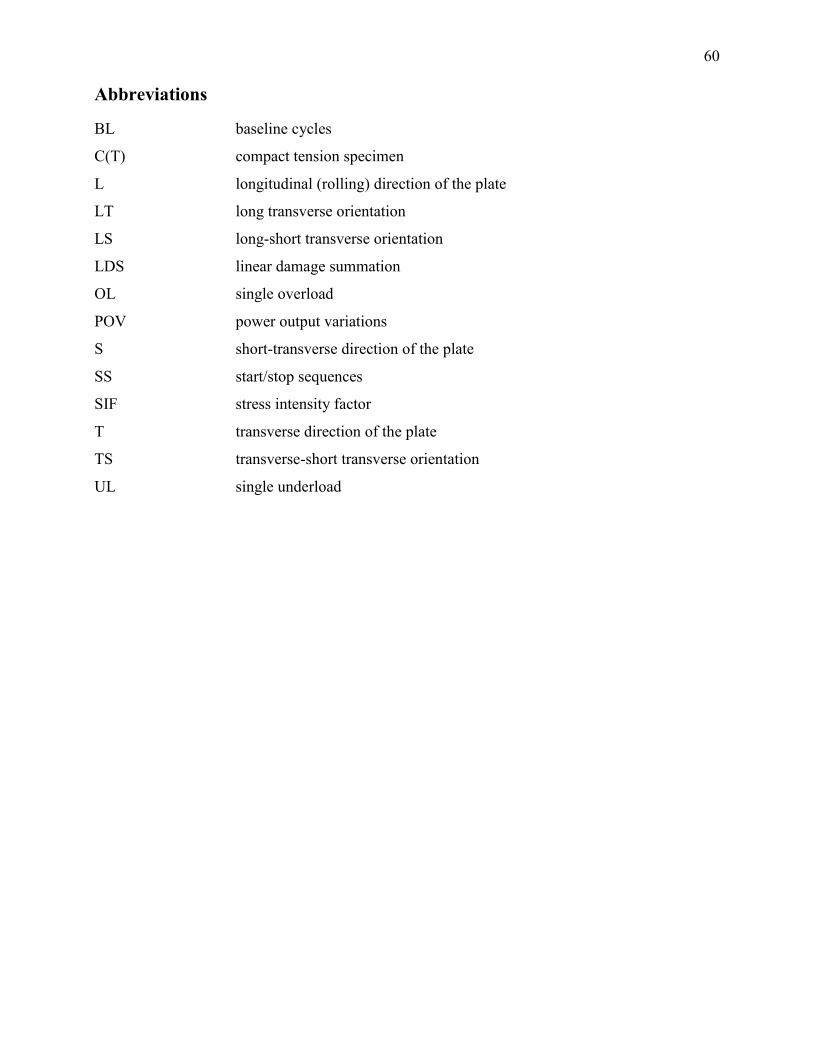
60
Abbreviations
BL baseline cycles
C(T) compact tension specimen
L longitudinal (rolling) direction of the plate
LT long transverse orientation
LS long-short transverse orientation
LDS linear damage summation
OL single overload
POV power output variations
S short-transverse direction of the plate
SS start/stop sequences
SIF stress intensity factor
T transverse direction of the plate
TS transverse-short transverse orientation
UL single underload
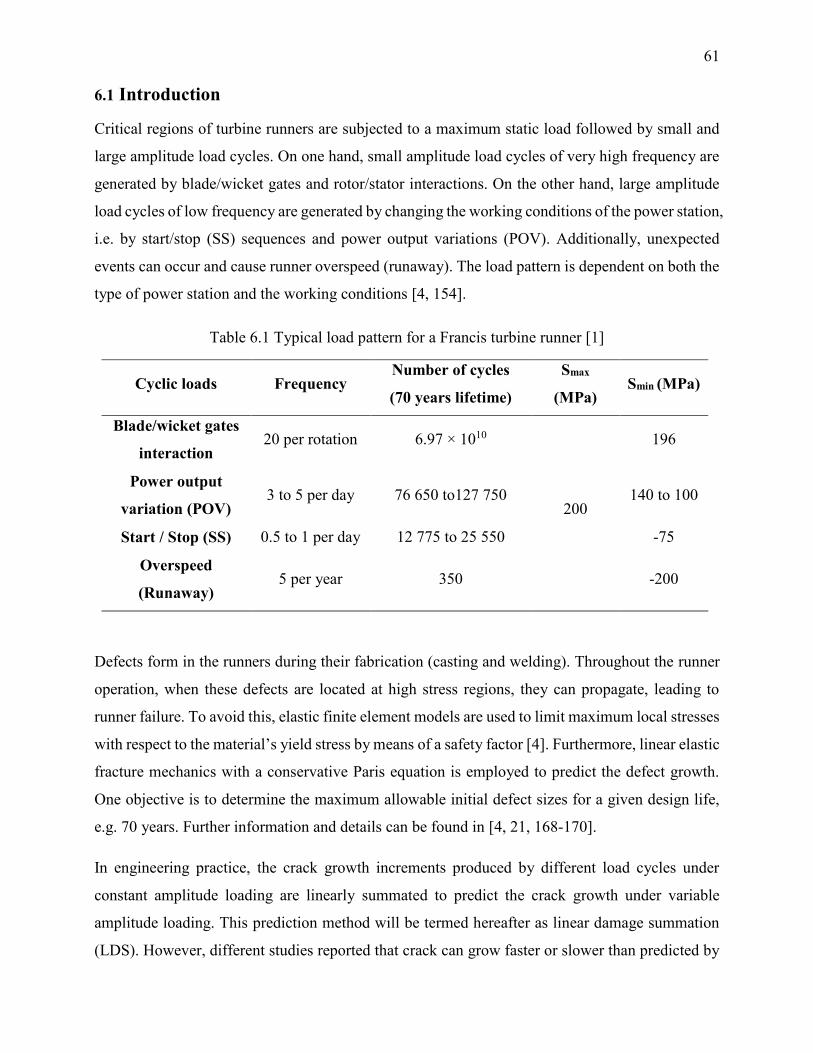
61
6.1 Introduction
Critical regions of turbine runners are subjected to a maximum static load followed by small and
large amplitude load cycles. On one hand, small amplitude load cycles of very high frequency are
generated by blade/wicket gates and rotor/stator interactions. On the other hand, large amplitude
load cycles of low frequency are generated by changing the working conditions of the power station,
i.e. by start/stop (SS) sequences and power output variations (POV). Additionally, unexpected
events can occur and cause runner overspeed (runaway). The load pattern is dependent on both the
type of power station and the working conditions [4, 154].
Table 6.1 Typical load pattern for a Francis turbine runner [1]
Cyclic loads Frequency Number of cycles
(70 years lifetime)
Smax
(MPa) Smin (MPa)
Blade/wicket gates
interaction 20 per rotation 6.97 × 10¹⁰
200
196
Power output
variation (POV) 3 to 5 per day 76 650 to127 750 140 to 100
Start / Stop (SS) 0.5 to 1 per day 12 775 to 25 550 -75
Overspeed
(Runaway) 5 per year 350 -200
Defects form in the runners during their fabrication (casting and welding). Throughout the runner
operation, when these defects are located at high stress regions, they can propagate, leading to
runner failure. To avoid this, elastic finite element models are used to limit maximum local stresses
with respect to the material’s yield stress by means of a safety factor [4]. Furthermore, linear elastic
fracture mechanics with a conservative Paris equation is employed to predict the defect growth.
One objective is to determine the maximum allowable initial defect sizes for a given design life,
e.g. 70 years. Further information and details can be found in [4, 21, 168-170].
In engineering practice, the crack growth increments produced by different load cycles under
constant amplitude loading are linearly summated to predict the crack growth under variable
amplitude loading. This prediction method will be termed hereafter as linear damage summation
(LDS). However, different studies reported that crack can grow faster or slower than predicted by

62
linear damage summation [105, 108]. For instance, a single overload (OL) can notably decrease
the crack growth rates of the subsequent baseline cycles. A crack can even become non-growing
for a certain number of cycles that depends on load parameters such as Kmax,OL, ΔKBL and RBL (see
nomenclature and Figure 6. 1) [115, 171]. Thus, the LDS prediction overestimates crack growth in
the case of an overload followed by baseline cycles [172]. The crack growth delay or arrest was
mainly ascribed to larger plastic deformation and surface roughness left in the crack wake [45, 59].
Figure 6. 1 Different load cycles under variable amplitude loading
On the other hand, LDS underestimates the effect of compressive underloads (RUL ≤ 0) and
underloads (RUL ˃ 0) [106, 117]. Compressive underloads flatten the crack wake asperities, which
propagates a non-growing crack or leads to crack growth acceleration of the baseline cycles. This
acceleration depends on ΔKUL, ΔKBL and RBL parameters. However, as the crack grows, the
asperities are rebuilt in the crack wake, so progressive deceleration and crack arrest can occur again
[135]. The simple underload or the compressive underload must be applied periodically in order to
reduce the fatigue threshold [120, 128].
For simplicity, baseline cycles intercut with periodic underload cycles will be termed hereafter as
periodic underloads. The predicted crack growth in one block using LDS for a certain number of
underload cycles (ΔNUL) and for baseline cycles (ΔNBL) is given by the following equation [173]:
LDS UL BL
UL BLa a N a N (6.1)
The frequency of baseline cycles over underload cycles ΔNBL/ΔNUL ratio is defined as n, hereafter.
As shown in Figure 6. 1, in the case of ΔNUL = 1, ΔNBL becomes equal to n. The measured crack
63
growth per block (Δa)measured is compared to the predicted one (Δa)LDS. An interaction factor is
defined as the (Δa)measured / (Δa)LDS ratio. When the ratio is higher than unity, it is an acceleration
factor; otherwise it is a retardation factor.
No interaction was found in a titanium alloy between periodic underloads (RUL = 0.1) and baseline
cycles (RBL = 0.75 to 0.90) for n = 103 to 105 [174]. However, it was shown that as the underloads
are applied more frequently, the acceleration factor increases [95, 117]. These factors reached
values up to two in the Paris region [116, 117]. As high R ratios were employed (RUL = 0.5 and
RBL = 0.75 to 0.85) the maximum acceleration factor of a given material is obtained for a particular
combination of ΔKBL/ΔKUL (ψ) and ΔNBL/ΔNUL (n) [116]. The effect was higher for a structural
steel as compared to an aluminum alloy.
Little information is available about physical mechanisms responsible for the crack growth
acceleration. In one study, after applying compressive underloads, a local measurement ahead of
the crack tip revealed a negative strain [120]. It was argued that this negative local strain favors the
crack tip to open at lower stress levels and leads to higher crack growth rate during of subsequent
baseline cycles. These lower stress opening levels are associated with tensile residual stress at the
crack tip. In the case of periodic underloads, it was also argued that the crack tip is periodically
squeezed and subjected to a tensile residual stress [175]. This stress decreases during the
subsequent baseline cycles until it reaches a steady state
Strain hardening can also explain the crack growth accelerations. Monotonically pre-strained
specimens (ε = + 3%) made of aluminum alloy 2024-T351 and tested at R = 0.1 showed 50% crack
growth acceleration with respect to unstrained specimens made of the same material [125]. Crack
growth acceleration was also observed for the titanium alloy 6Al-4V in similar circumstances [126].
It was concluded that the strain hardening tends to decrease the ductility at the crack tip, leading to
an increase in crack growth rates.
Fractography analyses in the literature have shown that overloads and irregular loadings can
modify the striation spacings of the subsequent baseline cycles [176, 177]. In the case of periodic
underloads, baseline cycles striation spacings were not modified and it was concluded that the
acceleration effect occurs during the underloads [117]. However, other studies concluded that the
acceleration occurs during the crack growth of baseline cycles [116, 178].
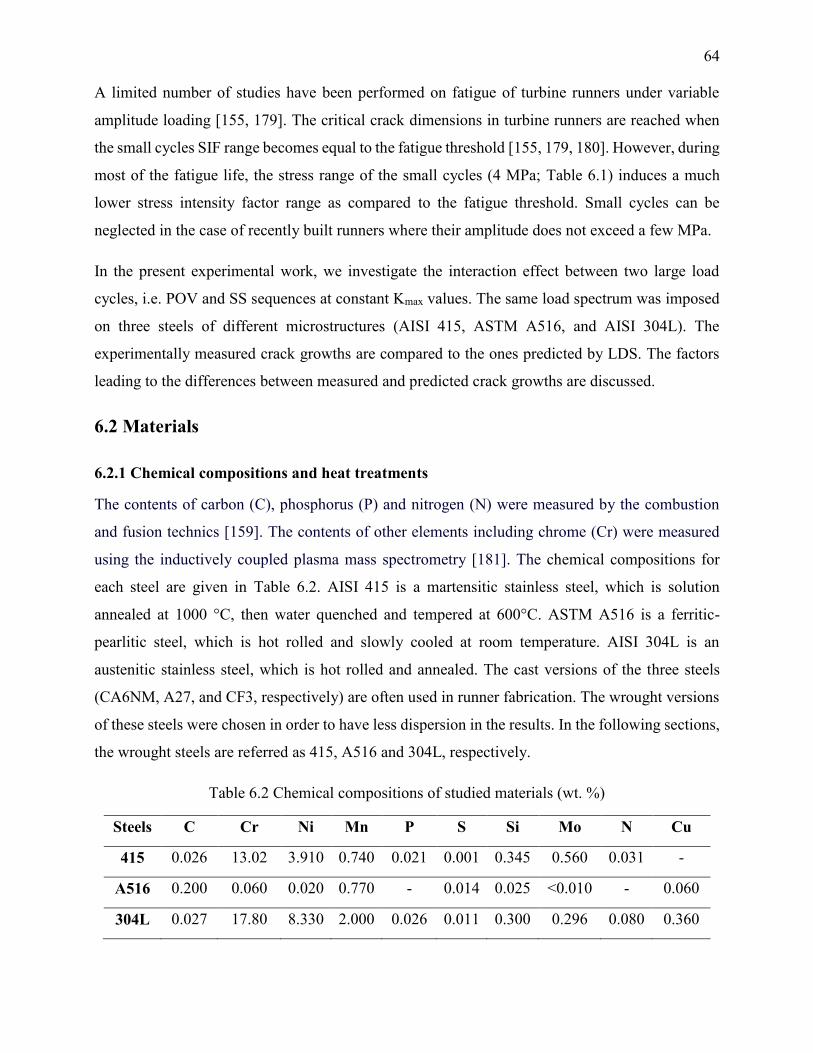
64
A limited number of studies have been performed on fatigue of turbine runners under variable
amplitude loading [155, 179]. The critical crack dimensions in turbine runners are reached when
the small cycles SIF range becomes equal to the fatigue threshold [155, 179, 180]. However, during
most of the fatigue life, the stress range of the small cycles (4 MPa; Table 6.1) induces a much
lower stress intensity factor range as compared to the fatigue threshold. Small cycles can be
neglected in the case of recently built runners where their amplitude does not exceed a few MPa.
In the present experimental work, we investigate the interaction effect between two large load
cycles, i.e. POV and SS sequences at constant Kmax values. The same load spectrum was imposed
on three steels of different microstructures (AISI 415, ASTM A516, and AISI 304L). The
experimentally measured crack growths are compared to the ones predicted by LDS. The factors
leading to the differences between measured and predicted crack growths are discussed.
6.2 Materials
6.2.1 Chemical compositions and heat treatments
The contents of carbon (C), phosphorus (P) and nitrogen (N) were measured by the combustion
and fusion technics [159]. The contents of other elements including chrome (Cr) were measured
using the inductively coupled plasma mass spectrometry [181]. The chemical compositions for
each steel are given in Table 6.2. AISI 415 is a martensitic stainless steel, which is solution
annealed at 1000 °C, then water quenched and tempered at 600°C. ASTM A516 is a ferritic-
pearlitic steel, which is hot rolled and slowly cooled at room temperature. AISI 304L is an
austenitic stainless steel, which is hot rolled and annealed. The cast versions of the three steels
(CA6NM, A27, and CF3, respectively) are often used in runner fabrication. The wrought versions
of these steels were chosen in order to have less dispersion in the results. In the following sections,
the wrought steels are referred as 415, A516 and 304L, respectively.
Table 6.2 Chemical compositions of studied materials (wt. %)
Steels C Cr Ni Mn P S Si Mo N Cu
415 0.026 13.02 3.910 0.740 0.021 0.001 0.345 0.560 0.031 -
A516 0.200 0.060 0.020 0.770 - 0.014 0.025 <0.010 - 0.060
304L 0.027 17.80 8.330 2.000 0.026 0.011 0.300 0.296 0.080 0.360
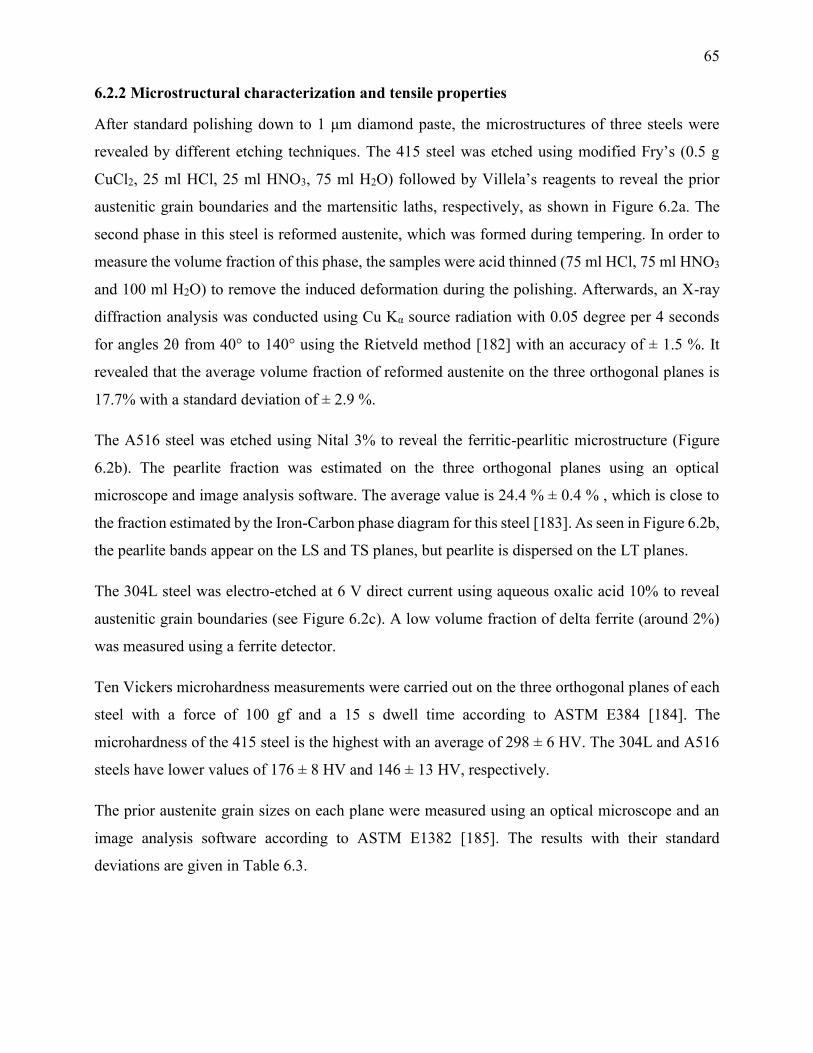
65
6.2.2 Microstructural characterization and tensile properties
After standard polishing down to 1 μm diamond paste, the microstructures of three steels were
revealed by different etching techniques. The 415 steel was etched using modified Fry’s (0.5 g
CuCl2, 25 ml HCl, 25 ml HNO3, 75 ml H2O) followed by Villela’s reagents to reveal the prior
austenitic grain boundaries and the martensitic laths, respectively, as shown in Figure 6.2a. The
second phase in this steel is reformed austenite, which was formed during tempering. In order to
measure the volume fraction of this phase, the samples were acid thinned (75 ml HCl, 75 ml HNO3
and 100 ml H2O) to remove the induced deformation during the polishing. Afterwards, an X-ray
diffraction analysis was conducted using Cu Kα source radiation with 0.05 degree per 4 seconds
for angles 2θ from 40° to 140° using the Rietveld method [182] with an accuracy of ± 1.5 %. It
revealed that the average volume fraction of reformed austenite on the three orthogonal planes is
17.7% with a standard deviation of ± 2.9 %.
The A516 steel was etched using Nital 3% to reveal the ferritic-pearlitic microstructure (Figure
6.2b). The pearlite fraction was estimated on the three orthogonal planes using an optical
microscope and image analysis software. The average value is 24.4 % ± 0.4 % , which is close to
the fraction estimated by the Iron-Carbon phase diagram for this steel [183]. As seen in Figure 6.2b,
the pearlite bands appear on the LS and TS planes, but pearlite is dispersed on the LT planes.
The 304L steel was electro-etched at 6 V direct current using aqueous oxalic acid 10% to reveal
austenitic grain boundaries (see Figure 6.2c). A low volume fraction of delta ferrite (around 2%)
was measured using a ferrite detector.
Ten Vickers microhardness measurements were carried out on the three orthogonal planes of each
steel with a force of 100 gf and a 15 s dwell time according to ASTM E384 [184]. The
microhardness of the 415 steel is the highest with an average of 298 ± 6 HV. The 304L and A516
steels have lower values of 176 ± 8 HV and 146 ± 13 HV, respectively.
The prior austenite grain sizes on each plane were measured using an optical microscope and an
image analysis software according to ASTM E1382 [185]. The results with their standard
deviations are given in Table 6.3.
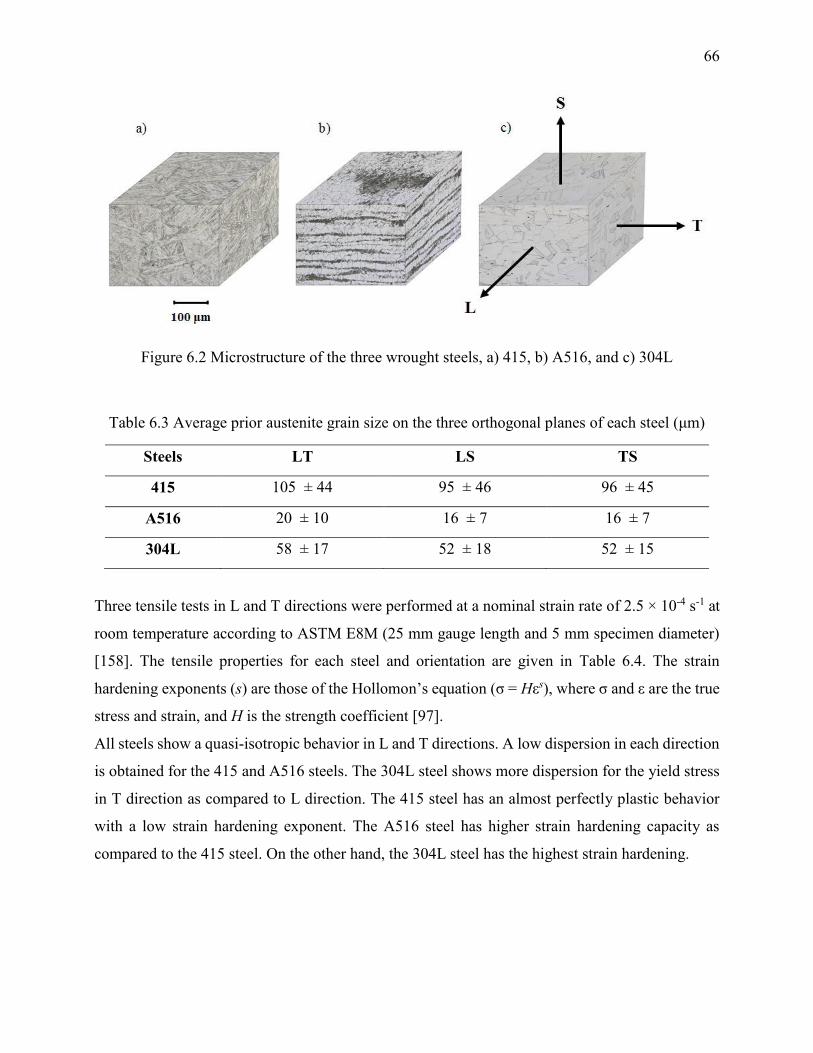
66
Figure 6.2 Microstructure of the three wrought steels, a) 415, b) A516, and c) 304L
Table 6.3 Average prior austenite grain size on the three orthogonal planes of each steel (μm)
Steels LT LS TS
415 105 ± 44 95 ± 46 96 ± 45
A516 20 ± 10 16 ± 7 16 ± 7
304L 58 ± 17 52 ± 18 52 ± 15
Three tensile tests in L and T directions were performed at a nominal strain rate of 2.5 × 10⁻⁴ s-1 at
room temperature according to ASTM E8M (25 mm gauge length and 5 mm specimen diameter)
[158]. The tensile properties for each steel and orientation are given in Table 6.4. The strain
hardening exponents (s) are those of the Hollomon’s equation (σ = Hεs), where σ and ε are the true
stress and strain, and H is the strength coefficient [97].
All steels show a quasi-isotropic behavior in L and T directions. A low dispersion in each direction
is obtained for the 415 and A516 steels. The 304L steel shows more dispersion for the yield stress
in T direction as compared to L direction. The 415 steel has an almost perfectly plastic behavior
with a low strain hardening exponent. The A516 steel has higher strain hardening capacity as
compared to the 415 steel. On the other hand, the 304L steel has the highest strain hardening.
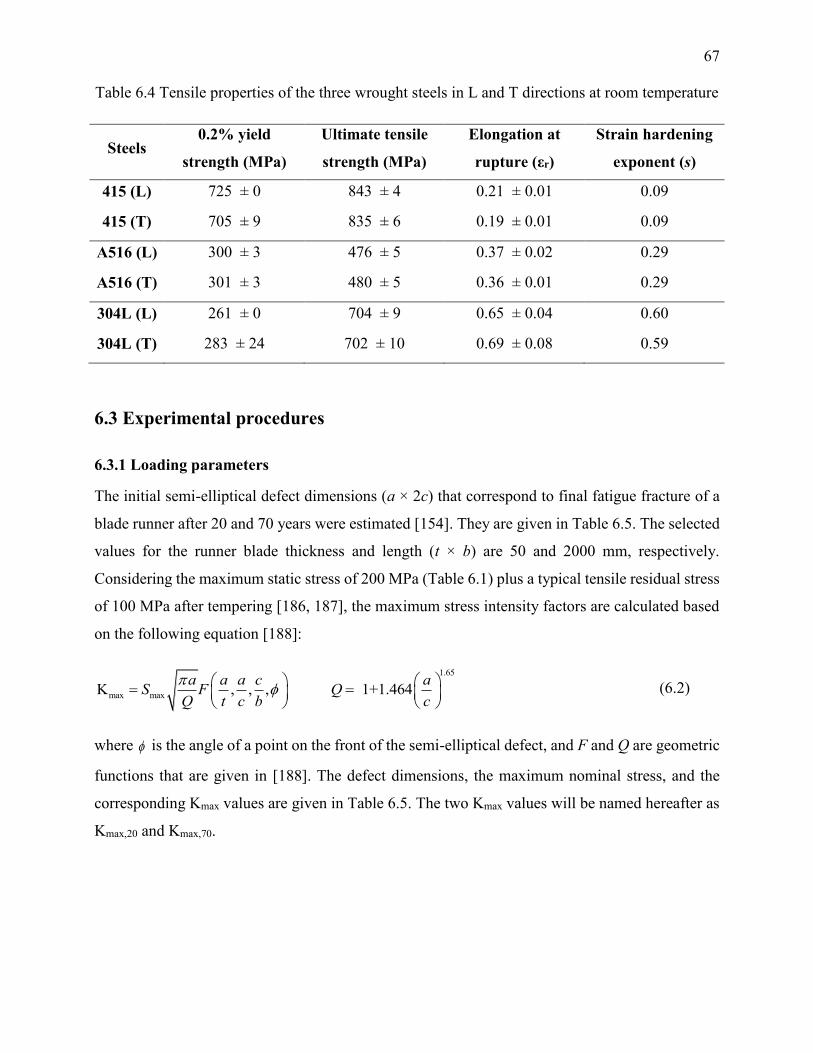
67
Table 6.4 Tensile properties of the three wrought steels in L and T directions at room temperature
Steels 0.2% yield
strength (MPa)
Ultimate tensile
strength (MPa)
Elongation at
rupture (εr)
Strain hardening
exponent (s)
415 (L) 725 ± 0 843 ± 4 0.21 ± 0.01 0.09
415 (T) 705 ± 9 835 ± 6 0.19 ± 0.01 0.09
A516 (L) 300 ± 3 476 ± 5 0.37 ± 0.02 0.29
A516 (T) 301 ± 3 480 ± 5 0.36 ± 0.01 0.29
304L (L) 261 ± 0 704 ± 9 0.65 ± 0.04 0.60
304L (T) 283 ± 24 702 ± 10 0.69 ± 0.08 0.59
6.3 Experimental procedures
6.3.1 Loading parameters
The initial semi-elliptical defect dimensions (a × 2c) that correspond to final fatigue fracture of a
blade runner after 20 and 70 years were estimated [154]. They are given in Table 6.5. The selected
values for the runner blade thickness and length (t × b) are 50 and 2000 mm, respectively.
Considering the maximum static stress of 200 MPa (Table 6.1) plus a typical tensile residual stress
of 100 MPa after tempering [186, 187], the maximum stress intensity factors are calculated based
on the following equation [188]:
1.65
max maxK , , , 1+1.464
a a a c aS F Q
Q t c b c (6.2)
where is the angle of a point on the front of the semi-elliptical defect, and F and Q are geometric
functions that are given in [188]. The defect dimensions, the maximum nominal stress, and the
corresponding Kmax values are given in Table 6.5. The two Kmax values will be named hereafter as
Kmax,20 and Kmax,70.
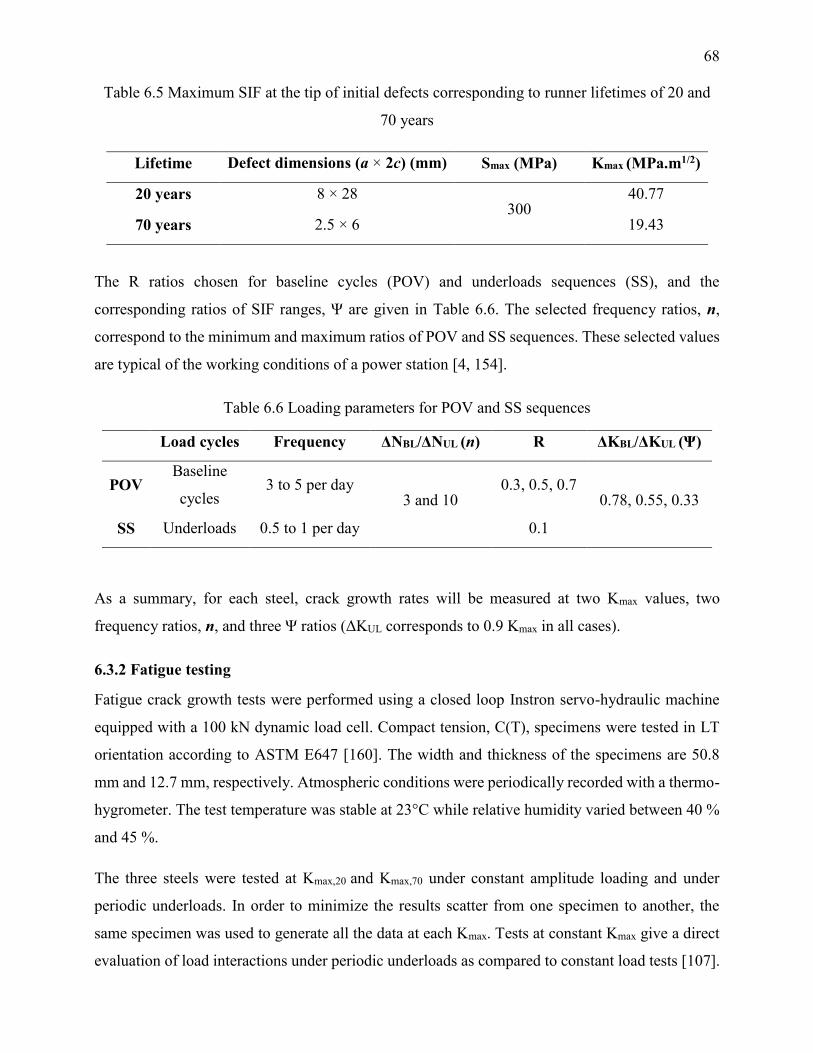
68
Table 6.5 Maximum SIF at the tip of initial defects corresponding to runner lifetimes of 20 and
70 years
Lifetime Defect dimensions (a × 2c) (mm) Smax (MPa) Kmax (MPa.m1/2)
20 years 8 × 28 300
40.77
70 years 2.5 × 6 19.43
The R ratios chosen for baseline cycles (POV) and underloads sequences (SS), and the
corresponding ratios of SIF ranges, Ψ are given in Table 6.6. The selected frequency ratios, n,
correspond to the minimum and maximum ratios of POV and SS sequences. These selected values
are typical of the working conditions of a power station [4, 154].
Table 6.6 Loading parameters for POV and SS sequences
Load cycles Frequency ΔNBL/ΔNUL (n) R ΔKBL/ΔKUL (Ψ)
POV Baseline
cycles 3 to 5 per day
3 and 10 0.3, 0.5, 0.7
0.78, 0.55, 0.33
SS Underloads 0.5 to 1 per day 0.1
As a summary, for each steel, crack growth rates will be measured at two Kmax values, two
frequency ratios, n, and three Ψ ratios (ΔKUL corresponds to 0.9 Kmax in all cases).
6.3.2 Fatigue testing
Fatigue crack growth tests were performed using a closed loop Instron servo-hydraulic machine
equipped with a 100 kN dynamic load cell. Compact tension, C(T), specimens were tested in LT
orientation according to ASTM E647 [160]. The width and thickness of the specimens are 50.8
mm and 12.7 mm, respectively. Atmospheric conditions were periodically recorded with a thermo-
hygrometer. The test temperature was stable at 23°C while relative humidity varied between 40 %
and 45 %.
The three steels were tested at Kmax,20 and Kmax,70 under constant amplitude loading and under
periodic underloads. In order to minimize the results scatter from one specimen to another, the
same specimen was used to generate all the data at each Kmax. Tests at constant Kmax give a direct
evaluation of load interactions under periodic underloads as compared to constant load tests [107].
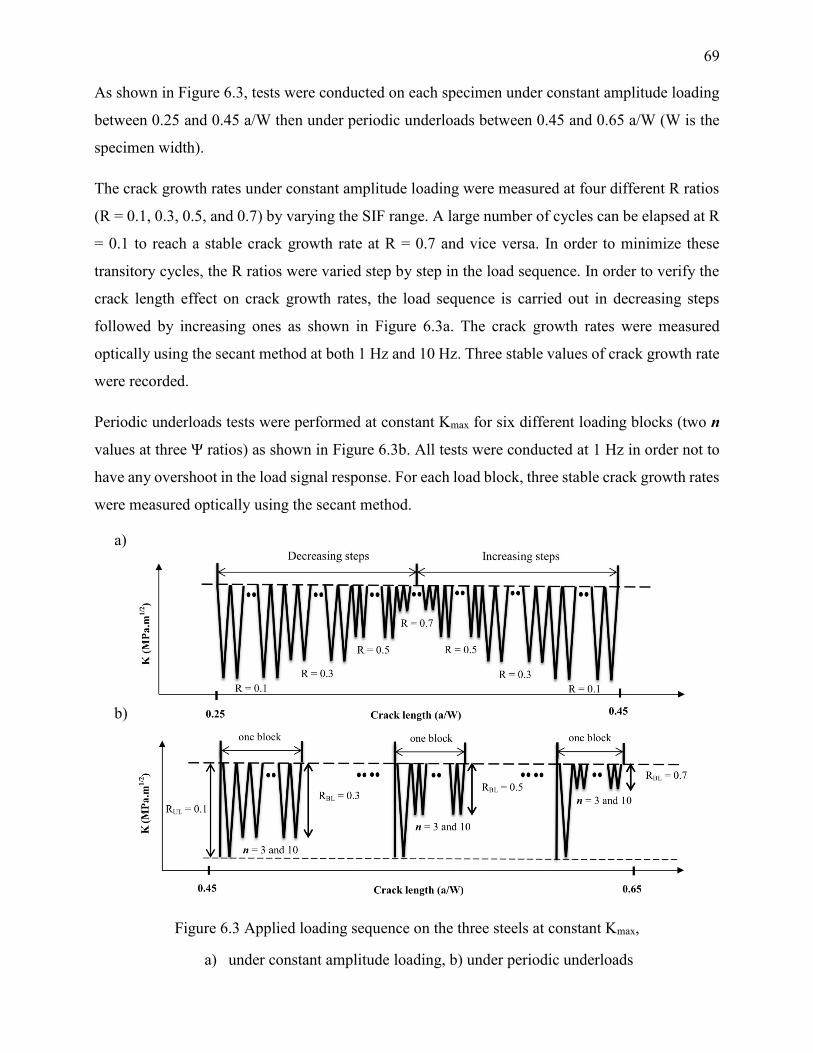
69
As shown in Figure 6.3, tests were conducted on each specimen under constant amplitude loading
between 0.25 and 0.45 a/W then under periodic underloads between 0.45 and 0.65 a/W (W is the
specimen width).
The crack growth rates under constant amplitude loading were measured at four different R ratios
(R = 0.1, 0.3, 0.5, and 0.7) by varying the SIF range. A large number of cycles can be elapsed at R
= 0.1 to reach a stable crack growth rate at R = 0.7 and vice versa. In order to minimize these
transitory cycles, the R ratios were varied step by step in the load sequence. In order to verify the
crack length effect on crack growth rates, the load sequence is carried out in decreasing steps
followed by increasing ones as shown in Figure 6.3a. The crack growth rates were measured
optically using the secant method at both 1 Hz and 10 Hz. Three stable values of crack growth rate
were recorded.
Periodic underloads tests were performed at constant Kmax for six different loading blocks (two n
values at three Ψ ratios) as shown in Figure 6.3b. All tests were conducted at 1 Hz in order not to
have any overshoot in the load signal response. For each load block, three stable crack growth rates
were measured optically using the secant method.
a)
b)
Figure 6.3 Applied loading sequence on the three steels at constant Kmax,
a) under constant amplitude loading, b) under periodic underloads
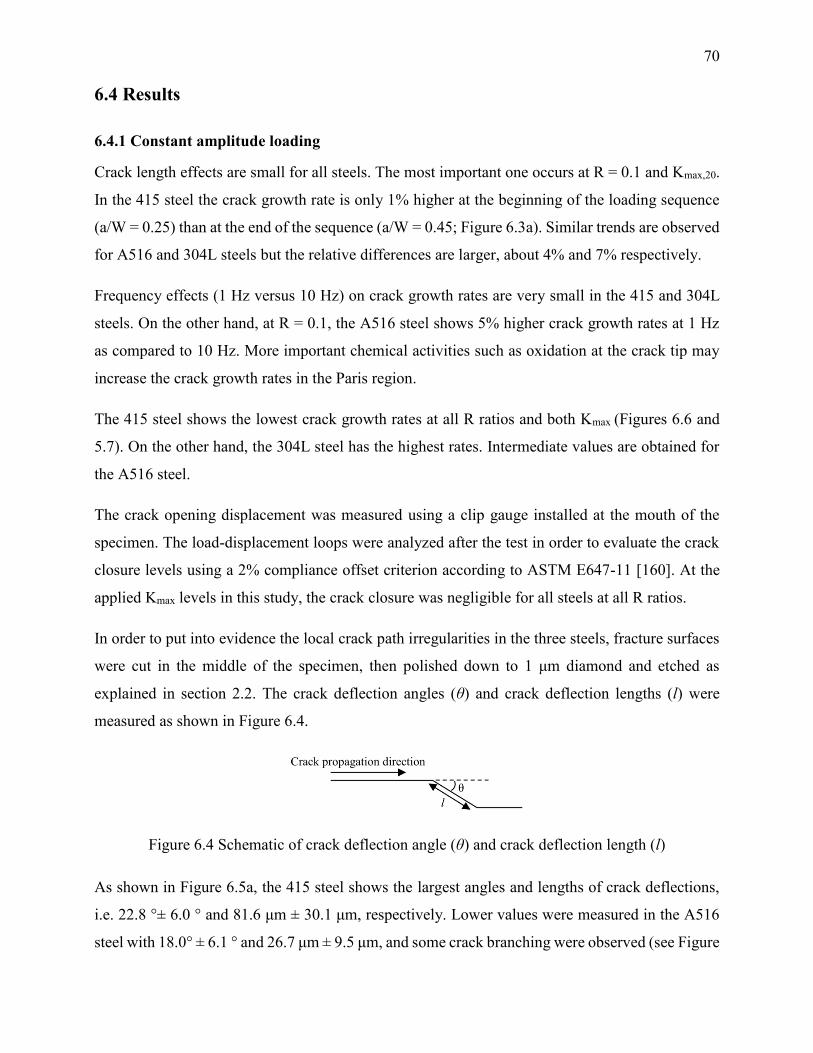
70
6.4 Results
6.4.1 Constant amplitude loading
Crack length effects are small for all steels. The most important one occurs at R = 0.1 and Kmax,20.
In the 415 steel the crack growth rate is only 1% higher at the beginning of the loading sequence
(a/W = 0.25) than at the end of the sequence (a/W = 0.45; Figure 6.3a). Similar trends are observed
for A516 and 304L steels but the relative differences are larger, about 4% and 7% respectively.
Frequency effects (1 Hz versus 10 Hz) on crack growth rates are very small in the 415 and 304L
steels. On the other hand, at R = 0.1, the A516 steel shows 5% higher crack growth rates at 1 Hz
as compared to 10 Hz. More important chemical activities such as oxidation at the crack tip may
increase the crack growth rates in the Paris region.
The 415 steel shows the lowest crack growth rates at all R ratios and both Kmax (Figures 6.6 and
5.7). On the other hand, the 304L steel has the highest rates. Intermediate values are obtained for
the A516 steel.
The crack opening displacement was measured using a clip gauge installed at the mouth of the
specimen. The load-displacement loops were analyzed after the test in order to evaluate the crack
closure levels using a 2% compliance offset criterion according to ASTM E647-11 [160]. At the
applied Kmax levels in this study, the crack closure was negligible for all steels at all R ratios.
In order to put into evidence the local crack path irregularities in the three steels, fracture surfaces
were cut in the middle of the specimen, then polished down to 1 μm diamond and etched as
explained in section 2.2. The crack deflection angles (θ) and crack deflection lengths (l) were
measured as shown in Figure 6.4.
Figure 6.4 Schematic of crack deflection angle (θ) and crack deflection length (l)
As shown in Figure 6.5a, the 415 steel shows the largest angles and lengths of crack deflections,
i.e. 22.8 °± 6.0 ° and 81.6 μm ± 30.1 μm, respectively. Lower values were measured in the A516
steel with 18.0° ± 6.1 ° and 26.7 μm ± 9.5 μm, and some crack branching were observed (see Figure
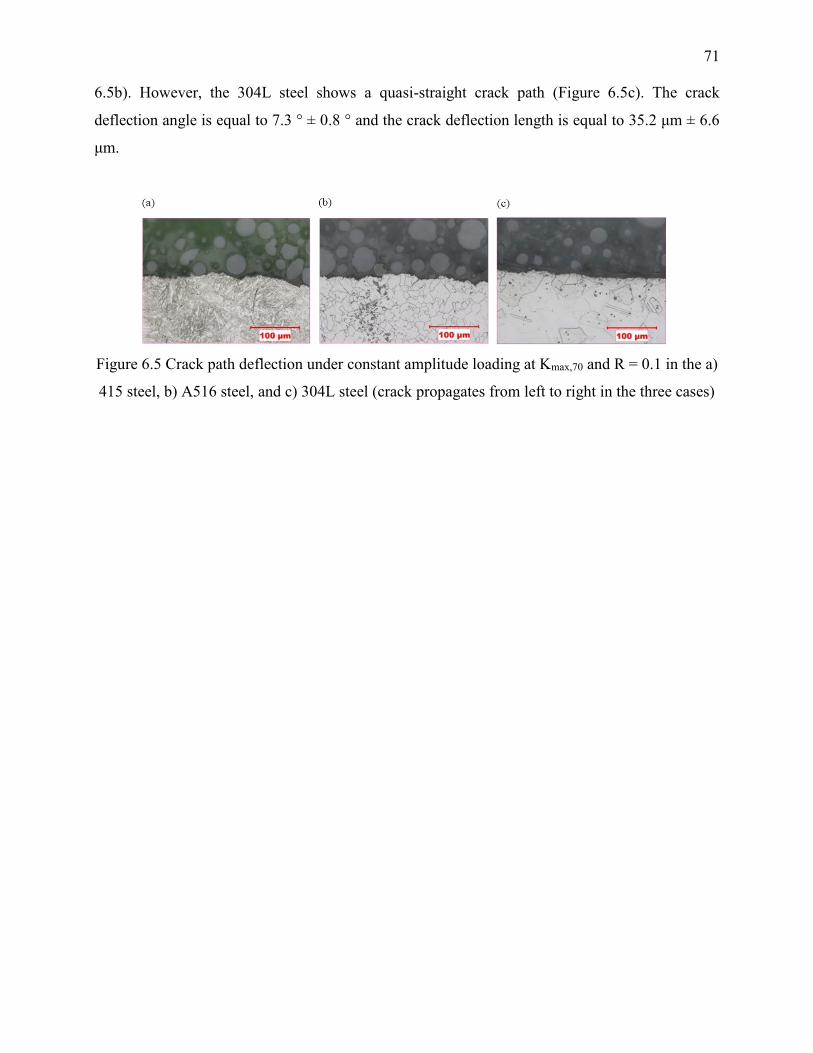
71
6.5b). However, the 304L steel shows a quasi-straight crack path (Figure 6.5c). The crack
deflection angle is equal to 7.3 ° ± 0.8 ° and the crack deflection length is equal to 35.2 μm ± 6.6
μm.
Figure 6.5 Crack path deflection under constant amplitude loading at Kmax,70 and R = 0.1 in the a)
415 steel, b) A516 steel, and c) 304L steel (crack propagates from left to right in the three cases)
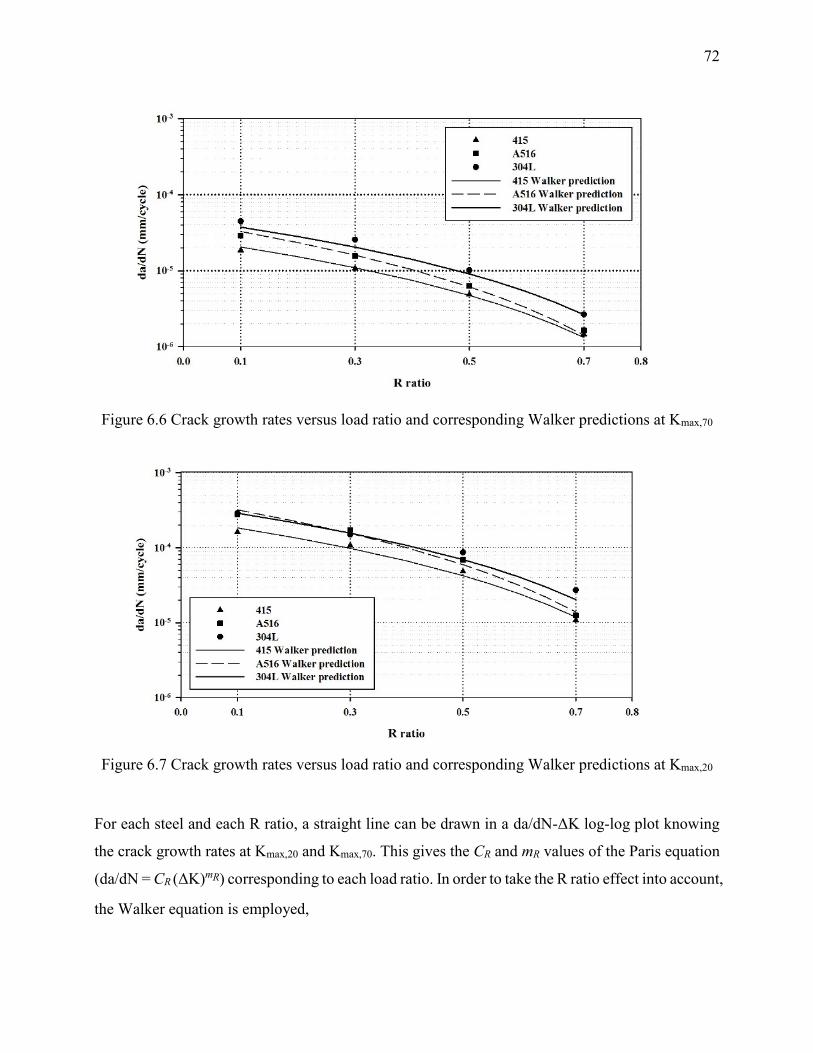
72
Figure 6.6 Crack growth rates versus load ratio and corresponding Walker predictions at Kmax,70
Figure 6.7 Crack growth rates versus load ratio and corresponding Walker predictions at Kmax,20
For each steel and each R ratio, a straight line can be drawn in a da/dN-ΔK log-log plot knowing
the crack growth rates at Kmax,20 and Kmax,70. This gives the CR and mR values of the Paris equation
(da/dN = CR (ΔK)mR) corresponding to each load ratio. In order to take the R ratio effect into account,
the Walker equation is employed,

73
0
1
m
R p
da KC
dN R
(6.3)
where the exponent m is the arithmetic average of the four mR values. The CR0 and p parameters
are derived from a linear regression of data points in a log CR – log (1-R) plot [22]. The three
parameters of the Walker equation are given in Table 6.7 for each steel. The crack growth rates
predicted by the Walker equation are compared to the measured ones at both Kmax in Figures 6.6
and 5.7. The root mean square of the relative errors is calculated at both Kmax. The mean error is
higher at Kmax,20; it is equal to 11%, 12% and 16% for the 415, the A516 and the 304L steels,
respectively.
Table 6.7 Parameters of Walker equation for each steel
Steels m CR0 p
415 2.96 4.08 × 10⁻⁹ 0.46
A516 3.07 4.92 × 10⁻⁹ 0.21
304L 2.75 1.38 × 10⁻⁸ 0.34
The fatigue striations under constant amplitude loading are not clearly visible for any steel at Kmax,70
even at R = 0.1. However, they are visible at Kmax,20 and R = 0.1on the fatigue surfaces of the 415
and A516 steels (Figure 6.8a and b) and well defined on those of the 304L steel (Figure 6.8c). The
striation spacing for the 415 steel is equal to 0.510 ± 0.03 µm/striation and is larger than the
macroscopic crack growth rate, equal to 0.161 ± 0.02 µm/cycle (see Figure 6.8). The striation
spacings for the A516 and 304L steels are equal to 0.405 ± 0.07 and 0.497 ± 0.05 µm/striation,
respectively, and are closer to the macroscopic growth rates, equal to 0.277 ± 0.02 and 0.285 ±
0.03 µm/cycle, respectively. As the load ratio increases towards 0.7, striations become no more
visible for the 415 and A516 steels but are still visible for the 304L steel (Figure 6.8d).
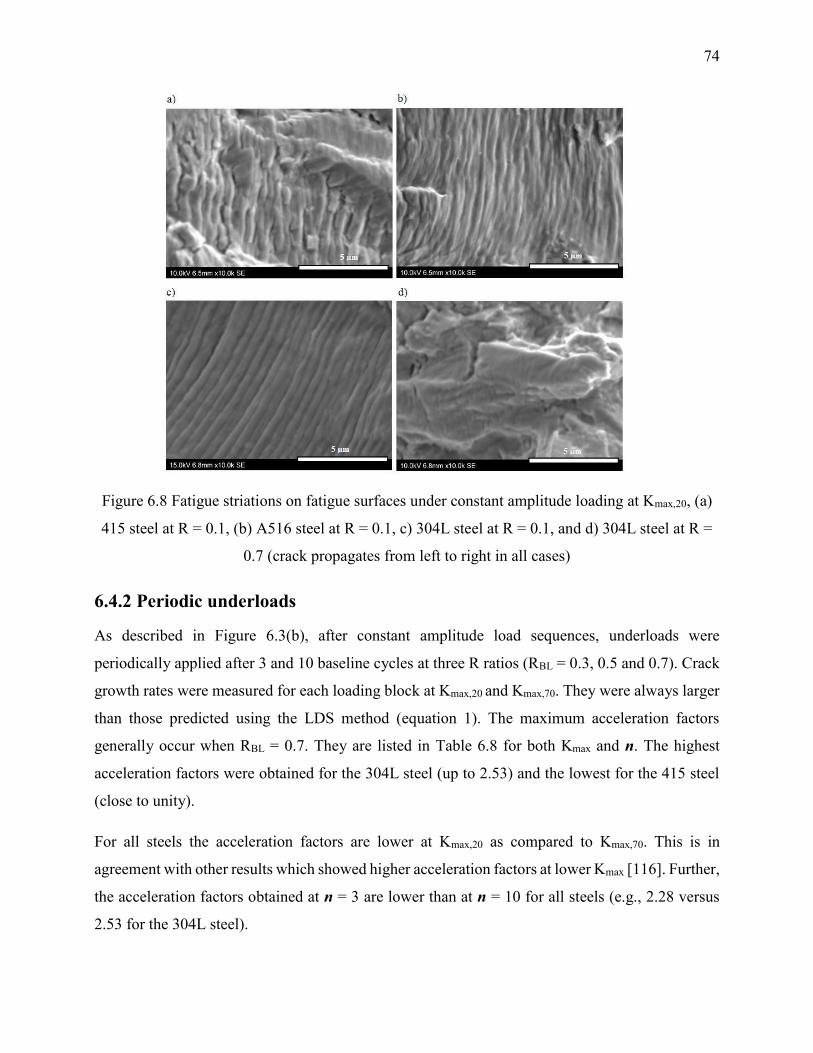
74
Figure 6.8 Fatigue striations on fatigue surfaces under constant amplitude loading at Kmax,20, (a)
415 steel at R = 0.1, (b) A516 steel at R = 0.1, c) 304L steel at R = 0.1, and d) 304L steel at R =
0.7 (crack propagates from left to right in all cases)
6.4.2 Periodic underloads
As described in Figure 6.3(b), after constant amplitude load sequences, underloads were
periodically applied after 3 and 10 baseline cycles at three R ratios (RBL = 0.3, 0.5 and 0.7). Crack
growth rates were measured for each loading block at Kmax,20 and Kmax,70. They were always larger
than those predicted using the LDS method (equation 1). The maximum acceleration factors
generally occur when RBL = 0.7. They are listed in Table 6.8 for both Kmax and n. The highest
acceleration factors were obtained for the 304L steel (up to 2.53) and the lowest for the 415 steel
(close to unity).
For all steels the acceleration factors are lower at Kmax,20 as compared to Kmax,70. This is in
agreement with other results which showed higher acceleration factors at lower Kmax [116]. Further,
the acceleration factors obtained at n = 3 are lower than at n = 10 for all steels (e.g., 2.28 versus
2.53 for the 304L steel).
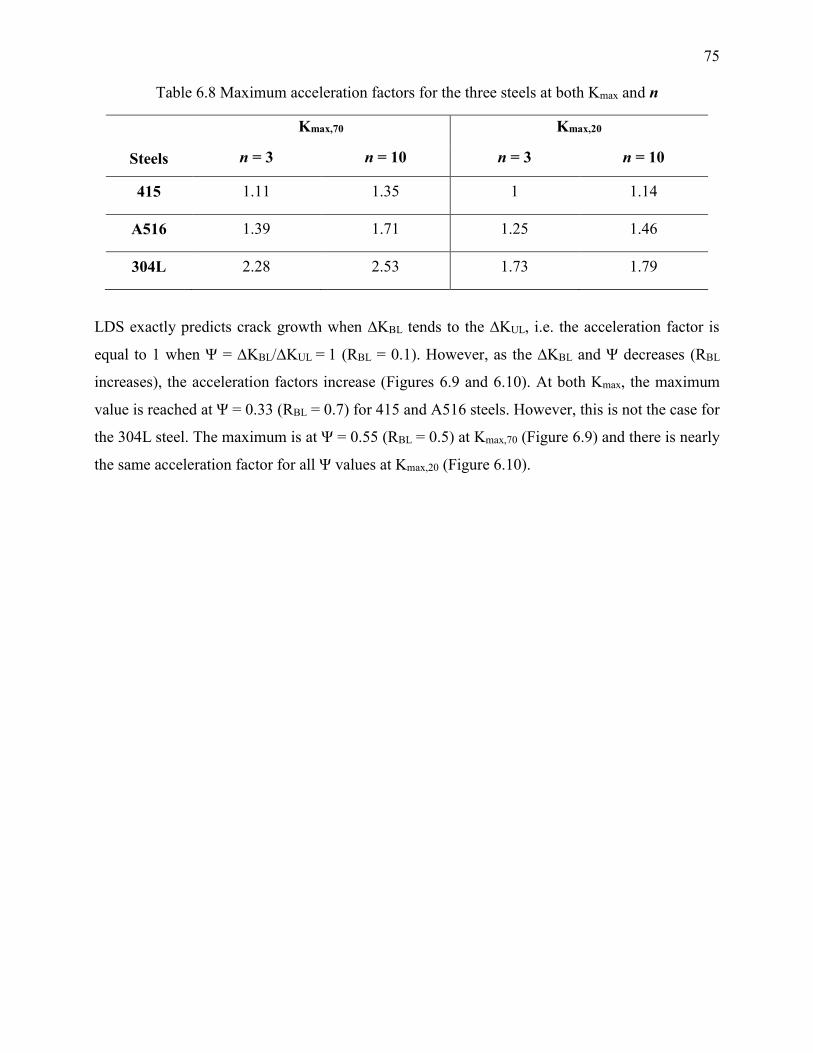
75
Table 6.8 Maximum acceleration factors for the three steels at both Kmax and n
Steels
Kmax,70 Kmax,20
n = 3 n = 10 n = 3 n = 10
415 1.11 1.35 1 1.14
A516 1.39 1.71 1.25 1.46
304L 2.28 2.53 1.73 1.79
LDS exactly predicts crack growth when ∆KBL tends to the ∆KUL, i.e. the acceleration factor is
equal to 1 when Ψ = ∆KBL/∆KUL = 1 (RBL = 0.1). However, as the ∆KBL and Ψ decreases (RBL
increases), the acceleration factors increase (Figures 6.9 and 6.10). At both Kmax, the maximum
value is reached at Ψ = 0.33 (RBL = 0.7) for 415 and A516 steels. However, this is not the case for
the 304L steel. The maximum is at Ψ = 0.55 (RBL = 0.5) at Kmax,70 (Figure 6.9) and there is nearly
the same acceleration factor for all Ψ values at Kmax,20 (Figure 6.10).
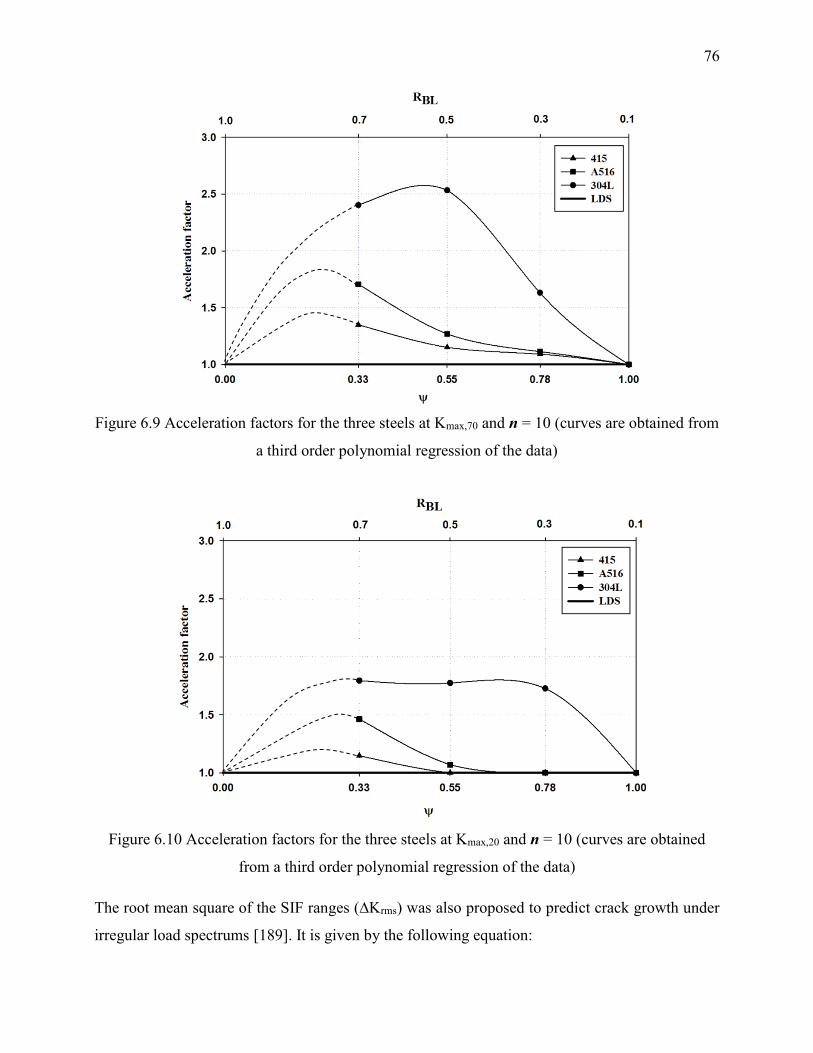
76
Figure 6.9 Acceleration factors for the three steels at Kmax,70 and n = 10 (curves are obtained from
a third order polynomial regression of the data)
Figure 6.10 Acceleration factors for the three steels at Kmax,20 and n = 10 (curves are obtained
from a third order polynomial regression of the data)
The root mean square of the SIF ranges (∆Krms) was also proposed to predict crack growth under
irregular load spectrums [189]. It is given by the following equation:
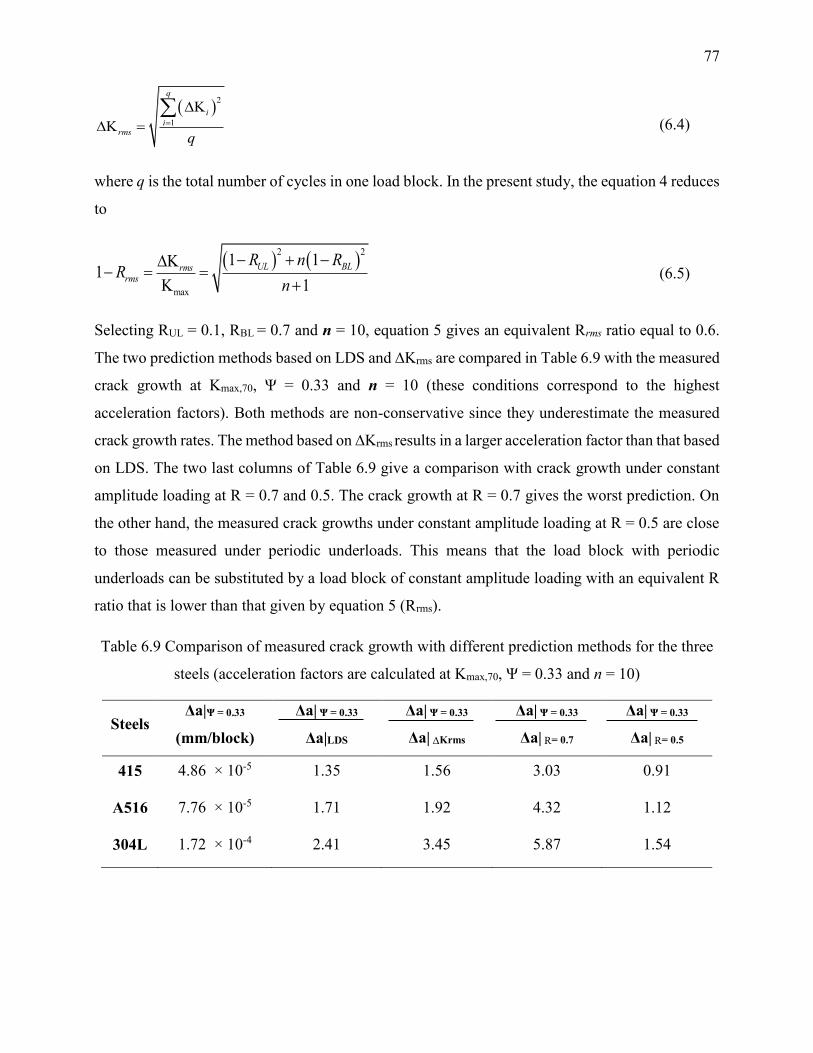
77
2
1
K
K
q
i
irms
q
(6.4)
where q is the total number of cycles in one load block. In the present study, the equation 4 reduces
to
2 2
max
1 1K1
K 1
UL BLrmsrms
R n RR
n (6.5)
Selecting RUL = 0.1, RBL = 0.7 and n = 10, equation 5 gives an equivalent Rrms ratio equal to 0.6.
The two prediction methods based on LDS and ∆Krms are compared in Table 6.9 with the measured
crack growth at Kmax,70, Ψ = 0.33 and n = 10 (these conditions correspond to the highest
acceleration factors). Both methods are non-conservative since they underestimate the measured
crack growth rates. The method based on ∆Krms results in a larger acceleration factor than that based
on LDS. The two last columns of Table 6.9 give a comparison with crack growth under constant
amplitude loading at R = 0.7 and 0.5. The crack growth at R = 0.7 gives the worst prediction. On
the other hand, the measured crack growths under constant amplitude loading at R = 0.5 are close
to those measured under periodic underloads. This means that the load block with periodic
underloads can be substituted by a load block of constant amplitude loading with an equivalent R
ratio that is lower than that given by equation 5 (Rrms).
Table 6.9 Comparison of measured crack growth with different prediction methods for the three
steels (acceleration factors are calculated at Kmax,70, Ψ = 0.33 and n = 10)
Steels Δa|Ψ = 0.33
(mm/block)
Δa| Ψ = 0.33
Δa|LDS
Δa| Ψ = 0.33
Δa| ΔKrms
Δa| Ψ = 0.33
Δa| R= 0.7
Δa| Ψ = 0.33
Δa| R= 0.5
415 4.86 × 10⁻⁵ 1.35 1.56 3.03 0.91
A516 7.76 × 10⁻⁵ 1.71 1.92 4.32 1.12
304L 1.72 × 10⁻⁴ 2.41 3.45 5.87 1.54

78
6.5 Discussion
As the crack tip interacts locally with the microstructure, the crack can deflect and branch. This
results in a reduction of the effective stress intensity factor and crack growth rate [190]. In other
words a deflected crack requires more elapsed cycles to grow along a certain distance as compared
to a quasi-straight crack. However, this deceleration can be outweighed by a preferential
microstructural path followed by the crack tip [75]. The crack growth rates were the highest for the
304L steel under constant amplitude loading. The quasi-straight crack path observed in the 304L
steel (Figure 6.5c) as compared to the tortuous crack path in the other two steels (Figure 6.5a and
b) can be one reason explaining the highest crack growth rates in this steel.
As explained in the Introduction, there is a debate in the literature whether crack growth
acceleration under periodic underloads occurs during the underload cycle or during the baseline
cycles [116, 117, 178]. In the present study, a fractography analysis was carried out to address this
question. There was a clear distinction between underload striations and baseline cycles striations
in the case of the 304L steel at Kmax,20 (Figure 6.11). Striation spacing measurements were carried
out using an image analysis software. The average striation spacing at RUL = 0.1 is close to the one
measured at R = 0.1 under constant amplitude loading (0.567 ± 0.05 versus 0.497 ± 0.05
µm/striation, respectively). Thus, acceleration of crack growth does not occur during the
underloads.
The fatigue striations at R = 0.7 under constant amplitude loading are poorly defined as compared
to the baseline cycle striations under periodic underloads. In spite of that, it was found that the
macroscopic crack growth in one cycle at R = 0.1 (0.285 ± 0.03 µm) is comparable to that of 10
cycles at R = 0.7 (0.272 ± 0.01 µm) as shown in Figure 6.7. Thus, assuming that the average
microscopic crack growth remains proportional, the striation spacing of ten baseline cycles should
be equal to that of an underload in one load block. However, the striation measurements in Figure
6.11a show that ten baseline cycles striation spacings, 10δBL, are on average three times larger than
one underload striation spacing, δUL (1.737 ± 0.70 versus 0.567 ± 0.05 µm, respectively). These
observations substantiate that acceleration factors are due to a faster crack growth during baseline
cycles rather than during underloads.
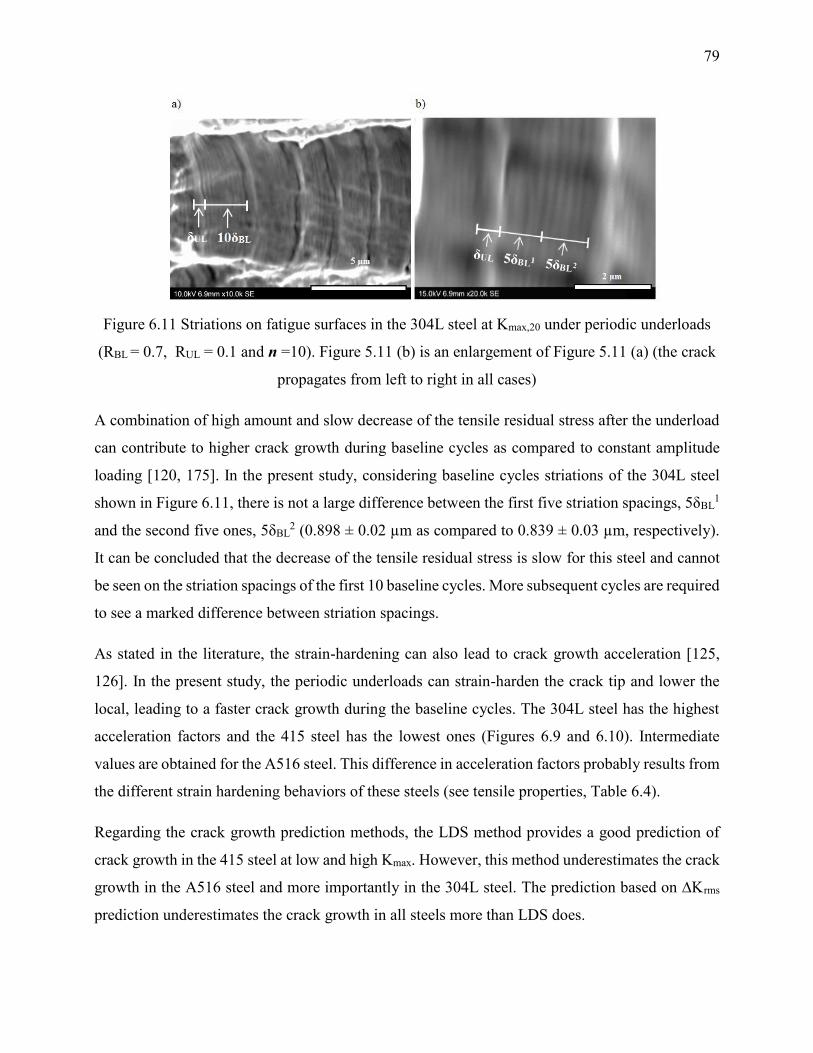
79
Figure 6.11 Striations on fatigue surfaces in the 304L steel at Kmax,20 under periodic underloads
(RBL = 0.7, RUL = 0.1 and n =10). Figure 5.11 (b) is an enlargement of Figure 5.11 (a) (the crack
propagates from left to right in all cases)
A combination of high amount and slow decrease of the tensile residual stress after the underload
can contribute to higher crack growth during baseline cycles as compared to constant amplitude
loading [120, 175]. In the present study, considering baseline cycles striations of the 304L steel
shown in Figure 6.11, there is not a large difference between the first five striation spacings, 5δBL1
and the second five ones, 5δBL2 (0.898 ± 0.02 µm as compared to 0.839 ± 0.03 µm, respectively).
It can be concluded that the decrease of the tensile residual stress is slow for this steel and cannot
be seen on the striation spacings of the first 10 baseline cycles. More subsequent cycles are required
to see a marked difference between striation spacings.
As stated in the literature, the strain-hardening can also lead to crack growth acceleration [125,
126]. In the present study, the periodic underloads can strain-harden the crack tip and lower the
local, leading to a faster crack growth during the baseline cycles. The 304L steel has the highest
acceleration factors and the 415 steel has the lowest ones (Figures 6.9 and 6.10). Intermediate
values are obtained for the A516 steel. This difference in acceleration factors probably results from
the different strain hardening behaviors of these steels (see tensile properties, Table 6.4).
Regarding the crack growth prediction methods, the LDS method provides a good prediction of
crack growth in the 415 steel at low and high Kmax. However, this method underestimates the crack
growth in the A516 steel and more importantly in the 304L steel. The prediction based on ∆Krms
prediction underestimates the crack growth in all steels more than LDS does.
80
6.6 Conclusions
Fatigue crack growths in three steels, AISI 415, ASTM A516, and AISI 304L were measured under
constant amplitude loading and variable amplitude loading at two Kmax levels. The tests under
constant amplitude loading were conducted at 4 load ratios (R = 0.1, 0.3, 0.5, and 0.7). Those under
variable amplitude loading consist of baseline cycles at three load ratios (R = 0.3, 0.5, and 0.7)
intercut with periodic underloads at R = 0.1. For simplicity, this load sequence was termed periodic
underloads. The crack growth rates under constant amplitude were employed in the linear damage
summation method to predict the crack growth under periodic underloads. Thereafter, the measured
crack growths were compared to this prediction.
The 304L steel has the highest crack growth rates as compared to the two other steels under constant
amplitude loading. The quasi-straightness of the crack path can be one parameter explaining this
difference. Walker equations were derived for each steel. They give good predictions of the crack
growth rates at both Kmax and all R ratios.
Crack growths under periodic underloads are higher than those predicted by linear damage
summation of crack growth under constant amplitude loading. The acceleration factors are the
highest in the 304L steel (up to 2.53) and the lowest in the 415 steel (close to unity). Intermediate
values are obtained for the A516 steel. The acceleration factors are maximum at the higher value
of n (n = 10 versus n = 3) and at the lower Kmax level (19.43 MPa.m1/2) for all three steels. The
higher the load ratio of baseline cycles, the higher the acceleration factors are in most conditions.
The fractography analysis of the 304L steel at Kmax,20 show that acceleration factors are due to
faster crack growth during the baseline cycles. A combination of high tensile residual stress and
slow decrease of this stress after an underload can be one cause of this faster crack growth.
Moreover, strain hardening induced by periodic underloads can decrease the ductility at the crack
tip, also leading to higher crack growth during the subsequent baseline cycles.
In the present study where the SIF range of small load cycles are much lower than the fatigue
threshold, the linear damage summation can be employed to predict the defects growth in the
runners made of 415 steel due to large cycles like POV and SS. However, for the runners made of
the other two steels, the acceleration factors should be considered in the prediction in order not to
underestimate fatigue crack propagation.

81
Acknowledgements
This work was supported by the Natural Science and Engineering Research Council of Canada,
Alstom Renewable Power Canada and Hydro-Québec Research Institute. The authors would like
to thank Denis Thibault and Stéphane Godin for the X-ray diffraction analysis and the technologist
Carlo Baillargeon for his assistance.
82
CHAPTER 7 ARTICLE 2: FATIGUE THRESHOLD AT HIGH STRESS
RATIO UNDER PERIODIC UNDERLOADS IN TURBINE RUNNER
STEELS
Published in International Journal of Fatigue, Vol. 103, 2017, pp. 264-271
M. Hassanipoura, Y. Verremana, J. Lanteigneb
aDepartment of Mechanical Engineering, École Polytechnique de Montréal, Montréal, Québec, Canada, H3T 1J4
bInstitut de Recherche d’Hydro-Québec, Varennes, Québec, Canada, J3X 1S1
A review of different load procedures to reach the fatigue threshold under constant amplitude
loading and periodic underloads is presented. The aim of this experimental work is to determine
the effect of turbine start/stop sequences (periodic underloads) on the fatigue threshold of small
cycles at high stress ratio (baseline cycles) in two steels used in turbine runners, i.e. AISI 415 and
304L steels. Keeping Kmax constant, a first load procedure is conducted with decreasing ΔK to
measure fatigue thresholds at 2 × 10⁻⁷ mm/cycle under both constant amplitude loading and
periodic underloads at various frequencies. Then a second load procedure is conducted to measure
fatigue thresholds under periodic underloads at one frequency with increasing ΔK of baseline
cycles from zero. The periodic underloads applied above a certain frequency decrease the fatigue
threshold measured at crack propagation rate of 2 × 10⁻⁷ mm/cycle. The decrease in fatigue
threshold due to periodic underloads is about five times higher when it is measured at 6.7 × 10⁻⁹
mm/cycle.
Keywords: Fatigue threshold; Constant Kmax procedure; Periodic underloads; Turbine runner steels; Linear
damage summation
83
Nomenclature
a crack length
Δablock crack growth in one load block
Kmax maximum SIF
ΔK SIF range
ΔKBL SIF range of baseline cycles
ΔKeff effective SIF range
ΔKth threshold SIF range
ΔKth,conv conventional fatigue threshold (2 × 10⁻⁷ mm/cycle)
ΔKth,true true fatigue threshold (6.7 × 10⁻⁹ mm/cycle)
ΔKth,CAL true fatigue threshold under constant amplitude loading
n number of baseline cycles over number of underload cycles
R stress ratio
RUL stress ratio of an underload cycle
ryc′ cyclic plastic zone size of an underload cycle
Abbreviations
BL baseline cycles
CAL constant amplitude loading
L longitudinal direction of the plate
LT long-long transverse orientation
PUL periodic underloads
SS start/stop sequences
SIF stress intensity factor
T transverse direction of the plate
UL single underload
84
7.1 Introduction
Critical regions of turbine runners are subjected to small stress amplitude cycles that are
superimposed to a static tensile stress. These small cycles at very high frequency are generated by
the pressure fluctuations in runners that are induced by hydraulic phenomena and rotor-stator
interactions. Further large stress amplitude cycles at low frequency are generated by changes in the
operating conditions of the power station that varies the static tensile stress, i.e., start/stop
sequences, power output variations and load rejections.
In recently built runners, the amplitude of small cycles is low (a few MPa) and does not induce
crack growth, so these cycles can be neglected on condition that the crack is not very large. In such
a case, the relevant issue is to know the interaction effect between different large cycles on the
crack growth. A first study on this effect was recently made by the authors for different steels used
in turbine runners [191]. However, in aged runners in operation since many years, the stress
amplitude of small cycles can reach higher values (tens of MPa) that contribute to the crack
propagation [154, 155].
The small stress cycles reach a very high number (about 7 × 10¹⁰ cycles) during the 70 years design
life of the runner [154]. If a pre-existing defect is subjected to these cycles, the SIF range at its tip
must be below the fatigue crack growth threshold; otherwise, the defect will propagate and cause
a premature failure of the runner. For this reason, the fatigue threshold at high R ratios has to be
measured at very low crack growth rates.
Further, the static tensile stress is periodically decreased to zero by the start/stop (SS) sequences.
These sequences, which are to be considered as periodic underloads, may cause a decrease in the
fatigue threshold of baseline cycles at high R ratios [103, 108]. As a consequence, the critical length
of a defect may be decreased. Therefore, the fatigue threshold of the baseline cycles intercut with
periodic underloads should also be measured.
First we present a literature review of previous studies on load procedures conducted to measure
fatigue threshold under constant amplitude loading and periodic underloads. The term ''periodic
underloads'' is also used to name the variable amplitude loading consisting of baseline cycles
intercut with periodic underloads.
In fatigue crack propagation tests at constant R-ratio, after a conventional pre-cracking, initial ΔK
and Kmax parameters have to be gradually decreased with respect to crack length, a, in order to
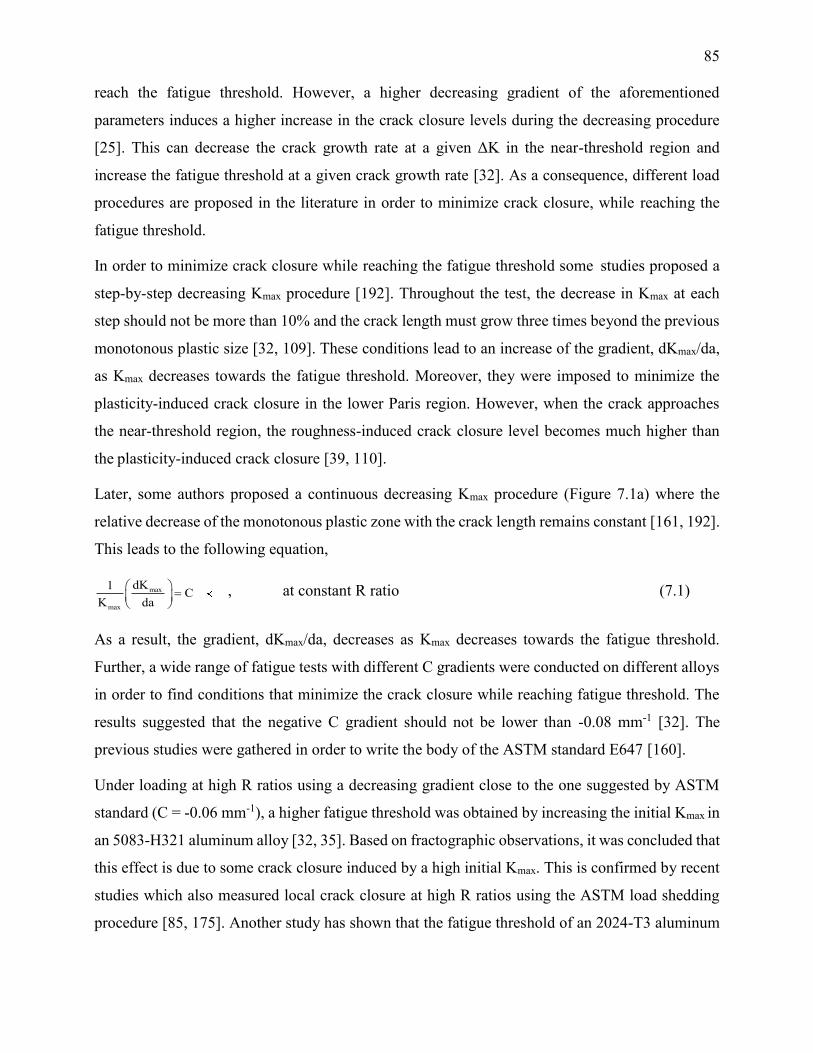
85
reach the fatigue threshold. However, a higher decreasing gradient of the aforementioned
parameters induces a higher increase in the crack closure levels during the decreasing procedure
[25]. This can decrease the crack growth rate at a given ΔK in the near-threshold region and
increase the fatigue threshold at a given crack growth rate [32]. As a consequence, different load
procedures are proposed in the literature in order to minimize crack closure, while reaching the
fatigue threshold.
In order to minimize crack closure while reaching the fatigue threshold some studies proposed a
step-by-step decreasing Kmax procedure [192]. Throughout the test, the decrease in Kmax at each
step should not be more than 10% and the crack length must grow three times beyond the previous
monotonous plastic size [32, 109]. These conditions lead to an increase of the gradient, dKmax/da,
as Kmax decreases towards the fatigue threshold. Moreover, they were imposed to minimize the
plasticity-induced crack closure in the lower Paris region. However, when the crack approaches
the near-threshold region, the roughness-induced crack closure level becomes much higher than
the plasticity-induced crack closure [39, 110].
Later, some authors proposed a continuous decreasing Kmax procedure (Figure 7.1a) where the
relative decrease of the monotonous plastic zone with the crack length remains constant [161, 192].
This leads to the following equation,
max
max
dK1C 0
K da
, at constant R ratio (7.1)
As a result, the gradient, dKmax/da, decreases as Kmax decreases towards the fatigue threshold.
Further, a wide range of fatigue tests with different C gradients were conducted on different alloys
in order to find conditions that minimize the crack closure while reaching fatigue threshold. The
results suggested that the negative C gradient should not be lower than -0.08 mm-1 [32]. The
previous studies were gathered in order to write the body of the ASTM standard E647 [160].
Under loading at high R ratios using a decreasing gradient close to the one suggested by ASTM
standard (C = -0.06 mm-1), a higher fatigue threshold was obtained by increasing the initial Kmax in
an 5083-H321 aluminum alloy [32, 35]. Based on fractographic observations, it was concluded that
this effect is due to some crack closure induced by a high initial Kmax. This is confirmed by recent
studies which also measured local crack closure at high R ratios using the ASTM load shedding
procedure [85, 175]. Another study has shown that the fatigue threshold of an 2024-T3 aluminum
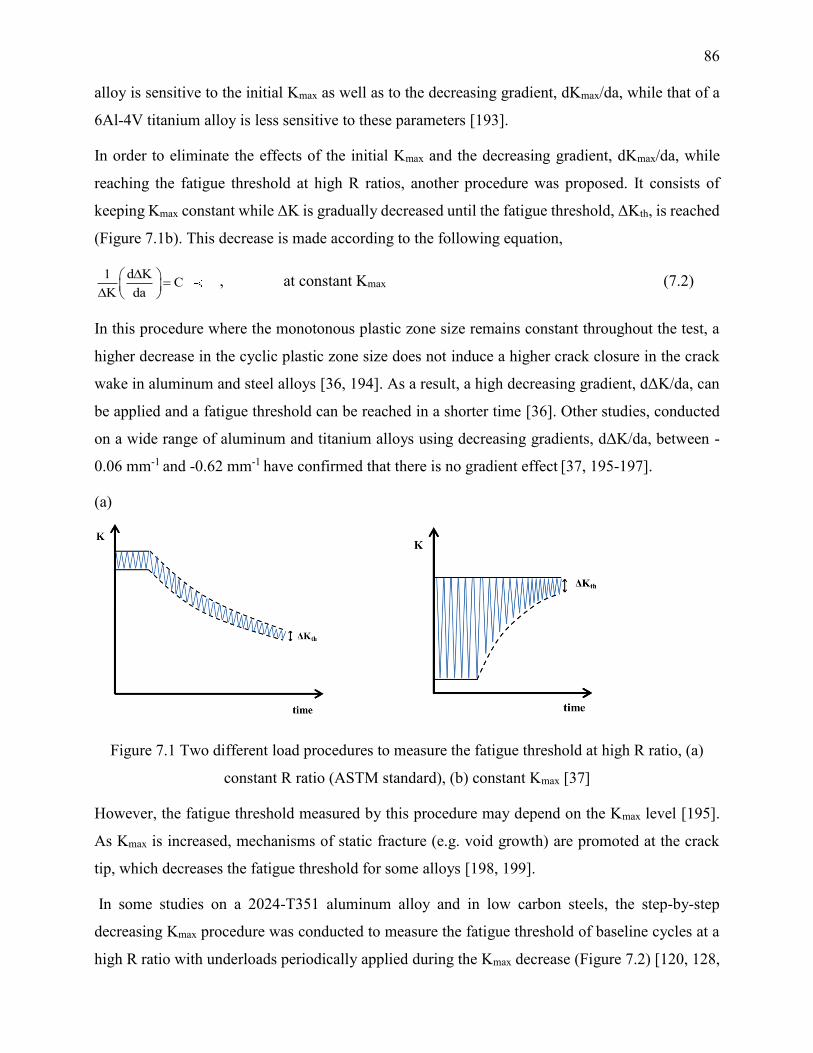
86
alloy is sensitive to the initial Kmax as well as to the decreasing gradient, dKmax/da, while that of a
6Al-4V titanium alloy is less sensitive to these parameters [193].
In order to eliminate the effects of the initial Kmax and the decreasing gradient, dKmax/da, while
reaching the fatigue threshold at high R ratios, another procedure was proposed. It consists of
keeping Kmax constant while ΔK is gradually decreased until the fatigue threshold, ΔKth, is reached
(Figure 7.1b). This decrease is made according to the following equation,
1 d KC 0
K da
, at constant Kmax (7.2)
In this procedure where the monotonous plastic zone size remains constant throughout the test, a
higher decrease in the cyclic plastic zone size does not induce a higher crack closure in the crack
wake in aluminum and steel alloys [36, 194]. As a result, a high decreasing gradient, dΔK/da, can
be applied and a fatigue threshold can be reached in a shorter time [36]. Other studies, conducted
on a wide range of aluminum and titanium alloys using decreasing gradients, dΔK/da, between -
0.06 mm-1 and -0.62 mm-1 have confirmed that there is no gradient effect [37, 195-197].
(a)
(b)
Figure 7.1 Two different load procedures to measure the fatigue threshold at high R ratio, (a)
constant R ratio (ASTM standard), (b) constant Kmax [37]
However, the fatigue threshold measured by this procedure may depend on the Kmax level [195].
As Kmax is increased, mechanisms of static fracture (e.g. void growth) are promoted at the crack
tip, which decreases the fatigue threshold for some alloys [198, 199].
In some studies on a 2024-T351 aluminum alloy and in low carbon steels, the step-by-step
decreasing Kmax procedure was conducted to measure the fatigue threshold of baseline cycles at a
high R ratio with underloads periodically applied during the Kmax decrease (Figure 7.2) [120, 128,
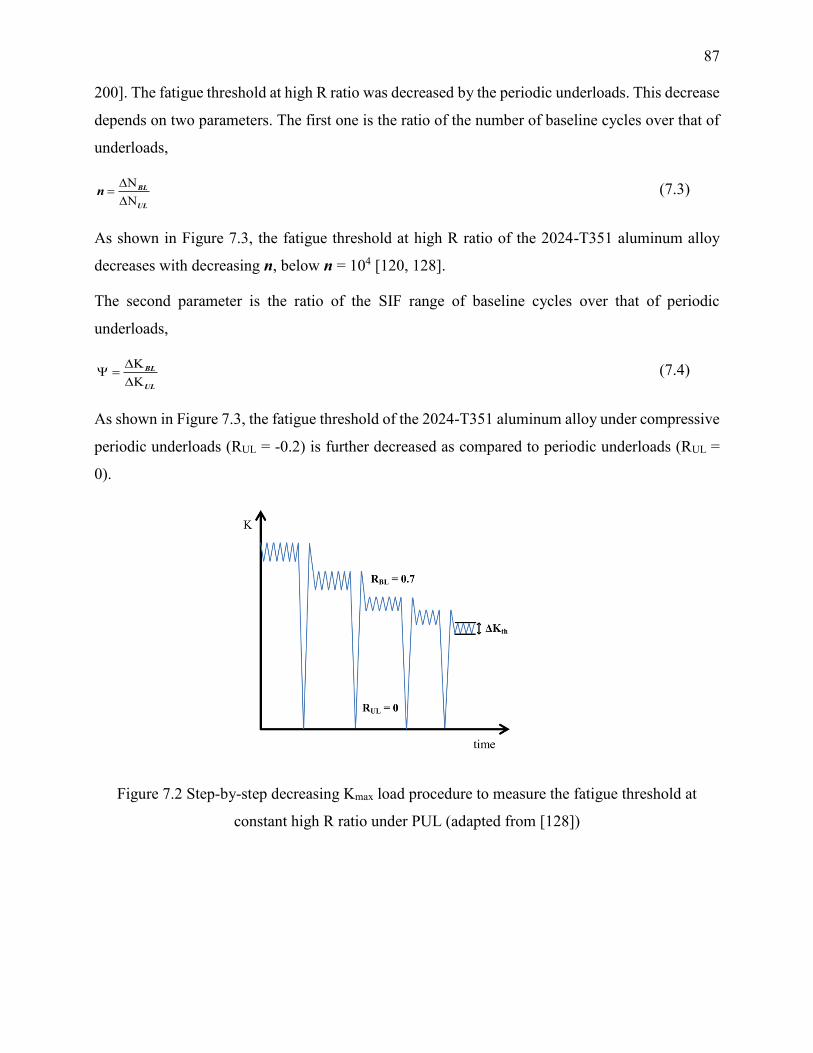
87
200]. The fatigue threshold at high R ratio was decreased by the periodic underloads. This decrease
depends on two parameters. The first one is the ratio of the number of baseline cycles over that of
underloads,
N
N
BL
UL
n
(7.3)
As shown in Figure 7.3, the fatigue threshold at high R ratio of the 2024-T351 aluminum alloy
decreases with decreasing n, below n = 104 [120, 128].
The second parameter is the ratio of the SIF range of baseline cycles over that of periodic
underloads,
K
K
BL
UL
(7.4)
As shown in Figure 7.3, the fatigue threshold of the 2024-T351 aluminum alloy under compressive
periodic underloads (RUL = -0.2) is further decreased as compared to periodic underloads (RUL =
0).
Figure 7.2 Step-by-step decreasing Kmax load procedure to measure the fatigue threshold at
constant high R ratio under PUL (adapted from [128])
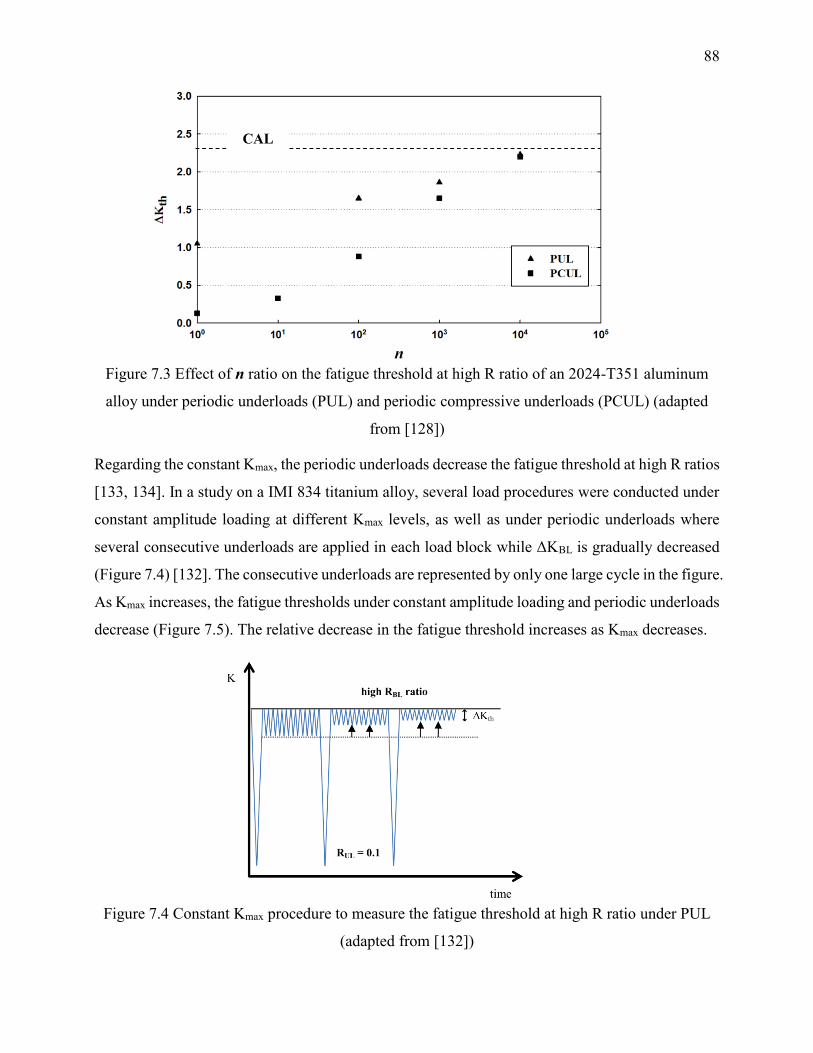
88
Figure 7.3 Effect of n ratio on the fatigue threshold at high R ratio of an 2024-T351 aluminum
alloy under periodic underloads (PUL) and periodic compressive underloads (PCUL) (adapted
from [128])
Regarding the constant Kmax, the periodic underloads decrease the fatigue threshold at high R ratios
[133, 134]. In a study on a IMI 834 titanium alloy, several load procedures were conducted under
constant amplitude loading at different Kmax levels, as well as under periodic underloads where
several consecutive underloads are applied in each load block while ΔKBL is gradually decreased
(Figure 7.4) [132]. The consecutive underloads are represented by only one large cycle in the figure.
As Kmax increases, the fatigue thresholds under constant amplitude loading and periodic underloads
decrease (Figure 7.5). The relative decrease in the fatigue threshold increases as Kmax decreases.
Figure 7.4 Constant Kmax procedure to measure the fatigue threshold at high R ratio under PUL
(adapted from [132])
CAL
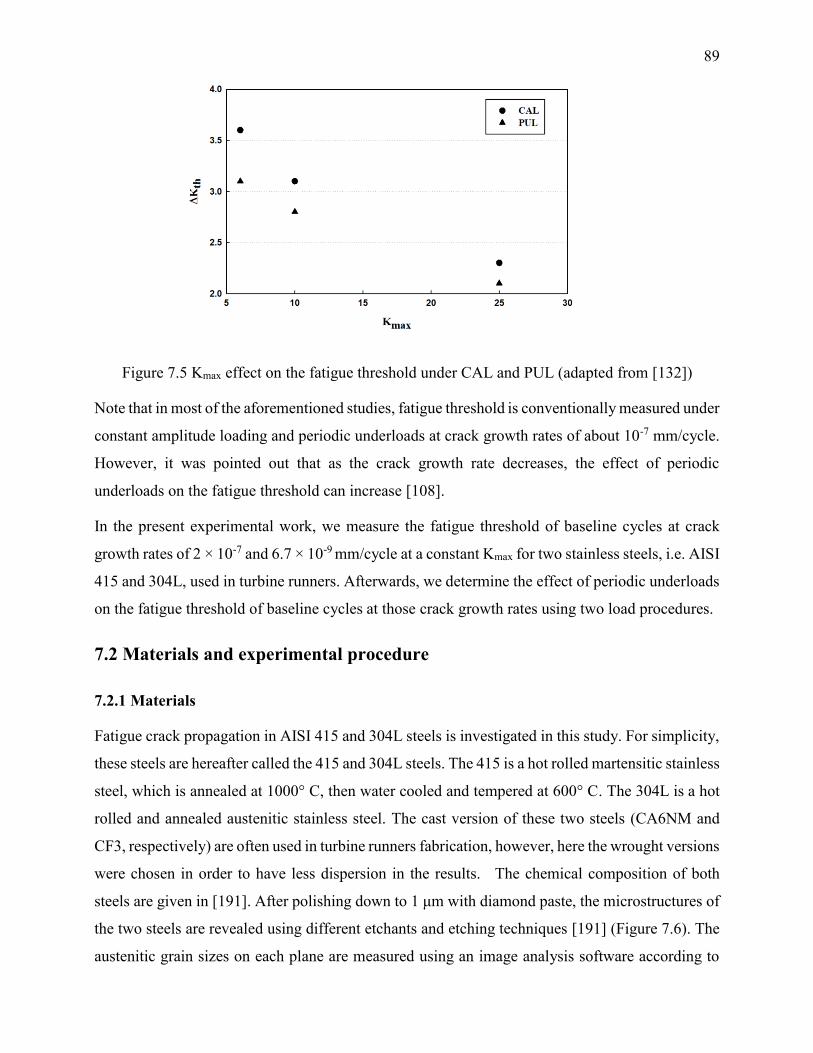
89
Figure 7.5 Kmax effect on the fatigue threshold under CAL and PUL (adapted from [132])
Note that in most of the aforementioned studies, fatigue threshold is conventionally measured under
constant amplitude loading and periodic underloads at crack growth rates of about 10-7 mm/cycle.
However, it was pointed out that as the crack growth rate decreases, the effect of periodic
underloads on the fatigue threshold can increase [108].
In the present experimental work, we measure the fatigue threshold of baseline cycles at crack
growth rates of 2 × 10⁻⁷ and 6.7 × 10⁻⁹ mm/cycle at a constant Kmax for two stainless steels, i.e. AISI
415 and 304L, used in turbine runners. Afterwards, we determine the effect of periodic underloads
on the fatigue threshold of baseline cycles at those crack growth rates using two load procedures.
7.2 Materials and experimental procedure
7.2.1 Materials
Fatigue crack propagation in AISI 415 and 304L steels is investigated in this study. For simplicity,
these steels are hereafter called the 415 and 304L steels. The 415 is a hot rolled martensitic stainless
steel, which is annealed at 1000° C, then water cooled and tempered at 600° C. The 304L is a hot
rolled and annealed austenitic stainless steel. The cast version of these two steels (CA6NM and
CF3, respectively) are often used in turbine runners fabrication, however, here the wrought versions
were chosen in order to have less dispersion in the results. The chemical composition of both
steels are given in [191]. After polishing down to 1 μm with diamond paste, the microstructures of
the two steels are revealed using different etchants and etching techniques [191] (Figure 7.6). The
austenitic grain sizes on each plane are measured using an image analysis software according to

90
the guidelines of ASTM E1382 [185]. The measured grain sizes on the three orthogonal planes are
close together in each steel. The average values are 100 ± 45 μm in the 415 steel, and 56 ± 16 μm
in the 304L steel.
(a) (b)
Figure 7.6 Microstructure of the two wrought steels: (a) 415 steel, and (b) 304L steel
Tensile properties of each steel in L and T directions are close together [191]. The average yield
strengths are 725 MPa and 261 MPa and the average ultimate tensile strengths are 843 MPa and
704 MPa, in the 415 and 304L steels, respectively.
7.2.2 Fatigue testing
Tests were performed using a closed loop servo-hydraulic machine equipped with a 20 kN dynamic
load cell. Compact tension specimens having geometry according to ASTM E647, 50.8 mm wide
and 12.7 mm thick, were tested in LT orientation [160].
For each steel, one compact tension specimen is pre-cracked at Kmax = 11.11 MPa.m1/2 and R = 0.1.
This value corresponds to a nominal stress of 170 MPa, applied to a semi-elliptical defect with
dimensions of 2.5 mm × 6 mm at the surface of a turbine runner [154, 155]. Keeping Kmax constant,
a first load procedure is conducted with decreasing ΔK in order to measure fatigue thresholds under
both constant amplitude loading and periodic underloads at various frequencies. Then a second
load procedure is conducted to measure fatigue thresholds under periodic underloads at one
frequency with increasing ΔKBL from zero.
Atmospheric conditions were periodically recorded with a thermo-hygrometer. The test
temperature was 23°C with a relative humidity between 40 % and 45 %. All tests were conducted
with a frequency equal to 15 Hz. The crack growths were optically measured and their rates were
determined using the secant method.
100 μm 100 μm
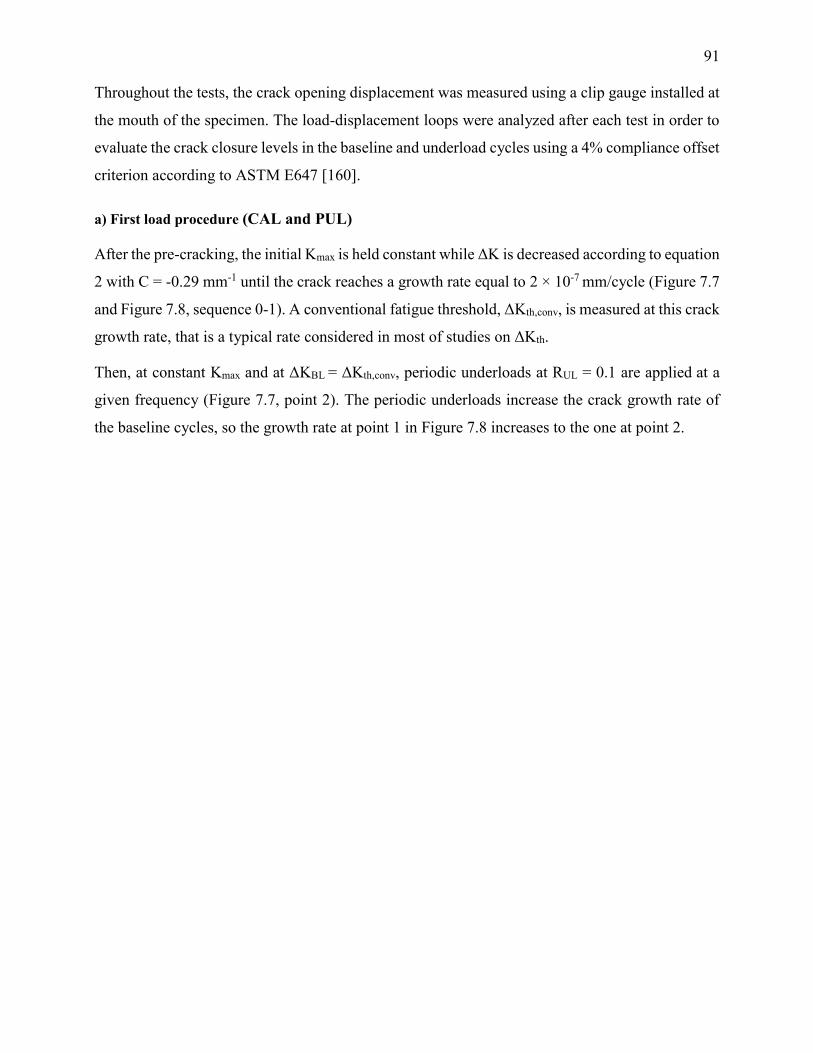
91
Throughout the tests, the crack opening displacement was measured using a clip gauge installed at
the mouth of the specimen. The load-displacement loops were analyzed after each test in order to
evaluate the crack closure levels in the baseline and underload cycles using a 4% compliance offset
criterion according to ASTM E647 [160].
a) First load procedure (CAL and PUL)
After the pre-cracking, the initial Kmax is held constant while ΔK is decreased according to equation
2 with C = -0.29 mm-1 until the crack reaches a growth rate equal to 2 × 10⁻⁷ mm/cycle (Figure 7.7
and Figure 7.8, sequence 0-1). A conventional fatigue threshold, ΔKth,conv, is measured at this crack
growth rate, that is a typical rate considered in most of studies on ΔKth.
Then, at constant Kmax and at ΔKBL = ΔKth,conv, periodic underloads at RUL = 0.1 are applied at a
given frequency (Figure 7.7, point 2). The periodic underloads increase the crack growth rate of
the baseline cycles, so the growth rate at point 1 in Figure 7.8 increases to the one at point 2.
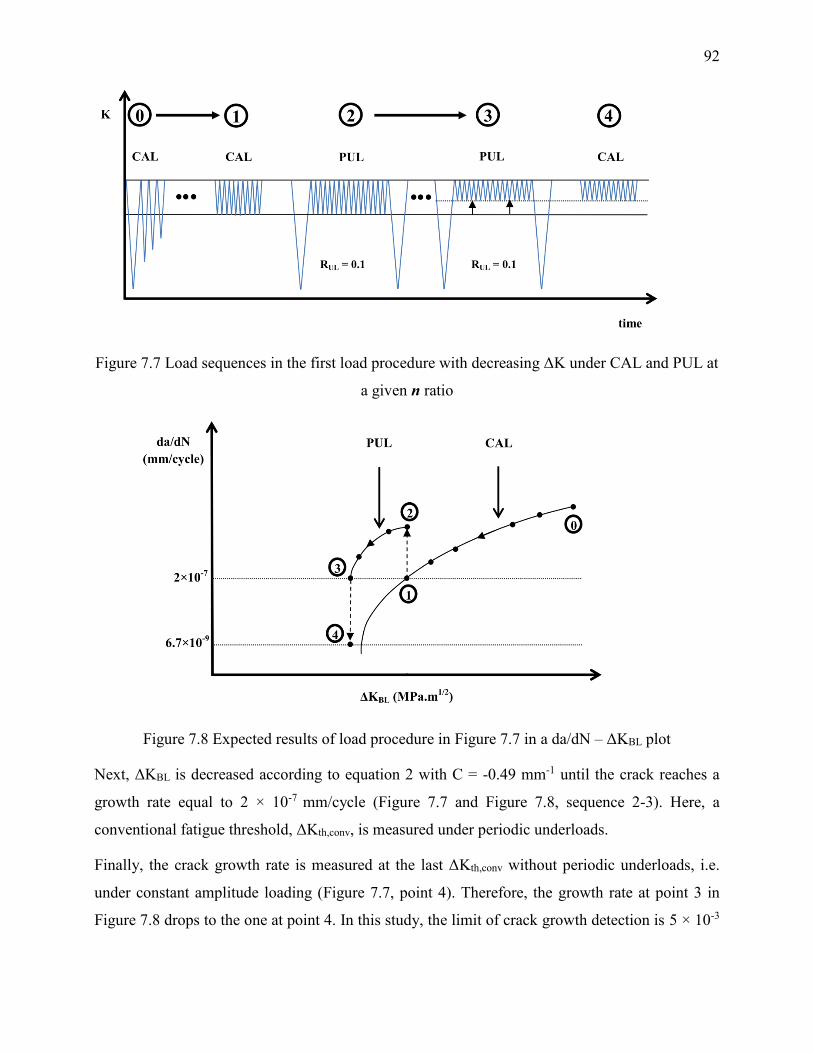
92
Figure 7.7 Load sequences in the first load procedure with decreasing ΔK under CAL and PUL at
a given n ratio
Figure 7.8 Expected results of load procedure in Figure 7.7 in a da/dN – ΔKBL plot
Next, ΔKBL is decreased according to equation 2 with C = -0.49 mm-1 until the crack reaches a
growth rate equal to 2 × 10⁻⁷ mm/cycle (Figure 7.7 and Figure 7.8, sequence 2-3). Here, a
conventional fatigue threshold, ΔKth,conv, is measured under periodic underloads.
Finally, the crack growth rate is measured at the last ΔKth,conv without periodic underloads, i.e.
under constant amplitude loading (Figure 7.7, point 4). Therefore, the growth rate at point 3 in
Figure 7.8 drops to the one at point 4. In this study, the limit of crack growth detection is 5 × 10⁻³
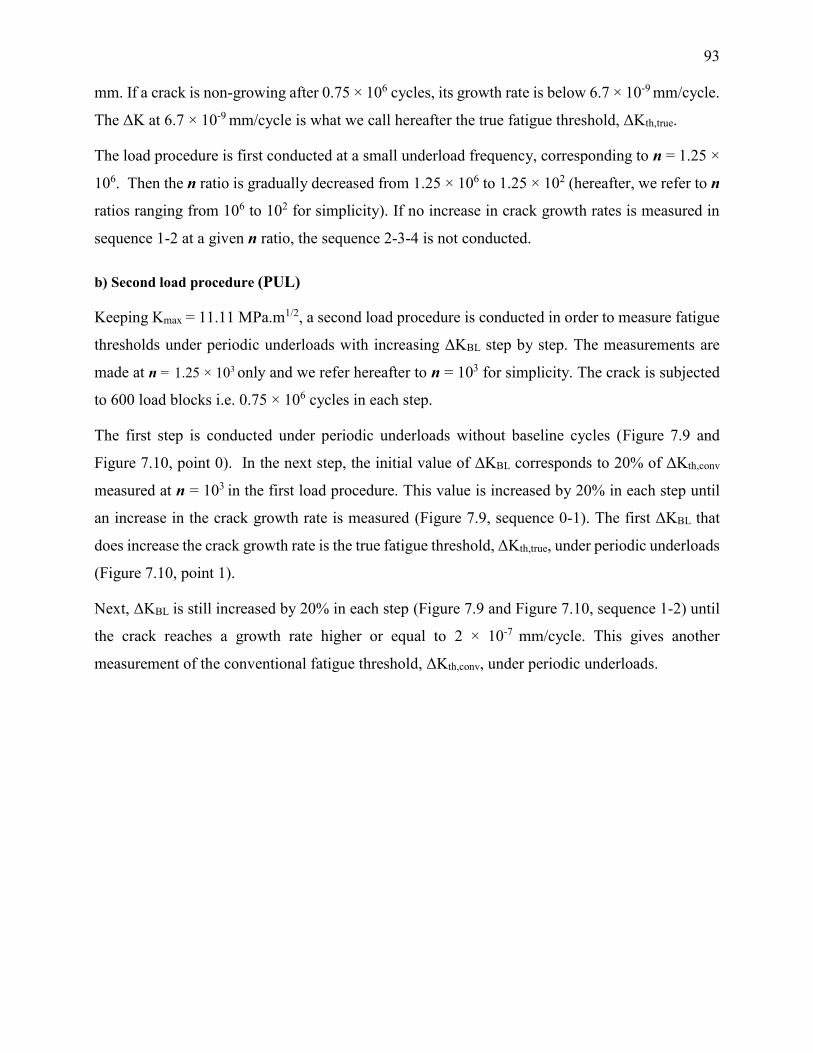
93
mm. If a crack is non-growing after 0.75 × 10⁶ cycles, its growth rate is below 6.7 × 10⁻⁹ mm/cycle.
The ΔK at 6.7 × 10⁻⁹ mm/cycle is what we call hereafter the true fatigue threshold, ΔKth,true.
The load procedure is first conducted at a small underload frequency, corresponding to n = 1.25 ×
106. Then the n ratio is gradually decreased from 1.25 × 10⁶ to 1.25 × 10² (hereafter, we refer to n
ratios ranging from 106 to 102 for simplicity). If no increase in crack growth rates is measured in
sequence 1-2 at a given n ratio, the sequence 2-3-4 is not conducted.
b) Second load procedure (PUL)
Keeping Kmax = 11.11 MPa.m1/2, a second load procedure is conducted in order to measure fatigue
thresholds under periodic underloads with increasing ΔKBL step by step. The measurements are
made at n = 1.25 × 10³ only and we refer hereafter to n = 103 for simplicity. The crack is subjected
to 600 load blocks i.e. 0.75 × 10⁶ cycles in each step.
The first step is conducted under periodic underloads without baseline cycles (Figure 7.9 and
Figure 7.10, point 0). In the next step, the initial value of ΔKBL corresponds to 20% of ΔKth,conv
measured at n = 103 in the first load procedure. This value is increased by 20% in each step until
an increase in the crack growth rate is measured (Figure 7.9, sequence 0-1). The first ΔKBL that
does increase the crack growth rate is the true fatigue threshold, ΔKth,true, under periodic underloads
(Figure 7.10, point 1).
Next, ΔKBL is still increased by 20% in each step (Figure 7.9 and Figure 7.10, sequence 1-2) until
the crack reaches a growth rate higher or equal to 2 × 10⁻⁷ mm/cycle. This gives another
measurement of the conventional fatigue threshold, ΔKth,conv, under periodic underloads.

94
Figure 7.9 Load sequences in the second load procedure with increasing ΔKBL under PUL (n =
103)
Figure 7.10 Expected results of load procedure in Figure 7.9 in a da/dN – ΔKBL plot
7.3 Results and discussion
7.3.1 First load procedure
The measured crack growth rates under constant amplitude loading in both steels are represented
by a full line in Figure 7.11 and Figure 7.12. The conventional fatigue thresholds, ΔKth,conv, at 2 ×
10-7 mm/cycle under constant amplitude loading (point 1) are close each other (3.32 and 3.35
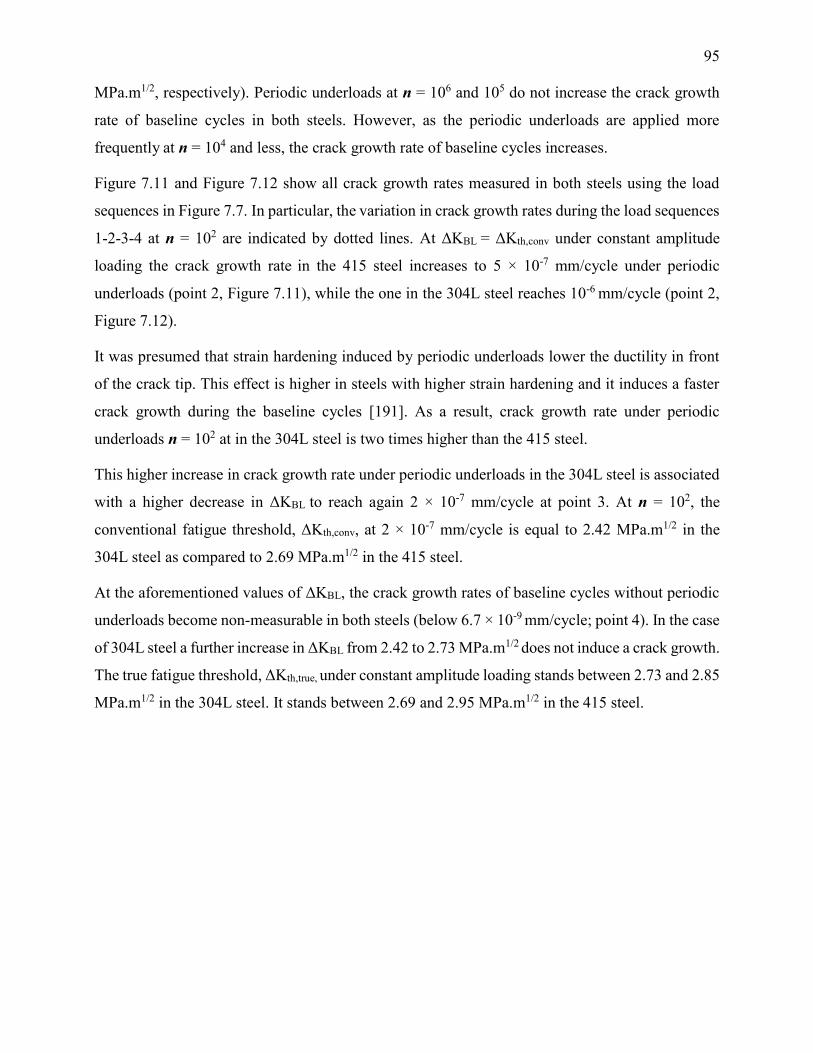
95
MPa.m1/2, respectively). Periodic underloads at n = 106 and 105 do not increase the crack growth
rate of baseline cycles in both steels. However, as the periodic underloads are applied more
frequently at n = 104 and less, the crack growth rate of baseline cycles increases.
Figure 7.11 and Figure 7.12 show all crack growth rates measured in both steels using the load
sequences in Figure 7.7. In particular, the variation in crack growth rates during the load sequences
1-2-3-4 at n = 102 are indicated by dotted lines. At ΔKBL = ΔKth,conv under constant amplitude
loading the crack growth rate in the 415 steel increases to 5 × 10⁻⁷ mm/cycle under periodic
underloads (point 2, Figure 7.11), while the one in the 304L steel reaches 10-6 mm/cycle (point 2,
Figure 7.12).
It was presumed that strain hardening induced by periodic underloads lower the ductility in front
of the crack tip. This effect is higher in steels with higher strain hardening and it induces a faster
crack growth during the baseline cycles [191]. As a result, crack growth rate under periodic
underloads n = 102 at in the 304L steel is two times higher than the 415 steel.
This higher increase in crack growth rate under periodic underloads in the 304L steel is associated
with a higher decrease in ΔKBL to reach again 2 × 10⁻⁷ mm/cycle at point 3. At n = 102, the
conventional fatigue threshold, ΔKth,conv, at 2 × 10⁻⁷ mm/cycle is equal to 2.42 MPa.m1/2 in the
304L steel as compared to 2.69 MPa.m1/2 in the 415 steel.
At the aforementioned values of ΔKBL, the crack growth rates of baseline cycles without periodic
underloads become non-measurable in both steels (below 6.7 × 10⁻⁹ mm/cycle; point 4). In the case
of 304L steel a further increase in ΔKBL from 2.42 to 2.73 MPa.m1/2 does not induce a crack growth.
The true fatigue threshold, ΔKth,true, under constant amplitude loading stands between 2.73 and 2.85
MPa.m1/2 in the 304L steel. It stands between 2.69 and 2.95 MPa.m1/2 in the 415 steel.
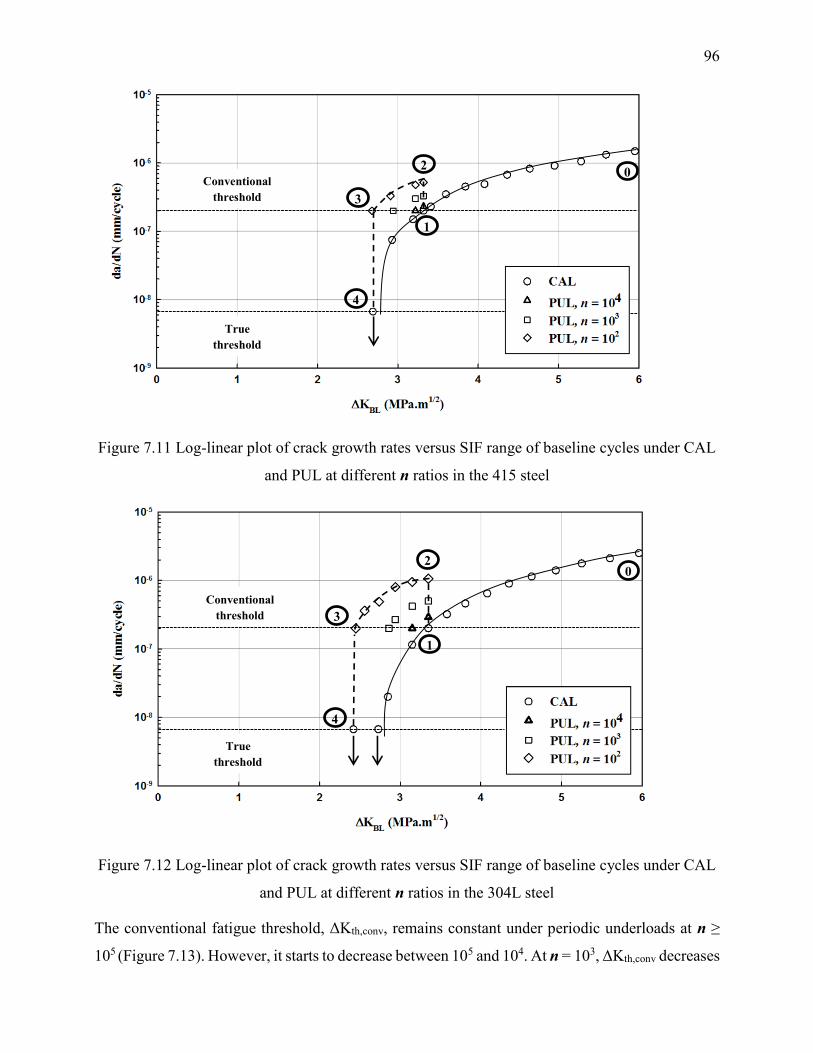
96
Figure 7.11 Log-linear plot of crack growth rates versus SIF range of baseline cycles under CAL
and PUL at different n ratios in the 415 steel
.
Figure 7.12 Log-linear plot of crack growth rates versus SIF range of baseline cycles under CAL
and PUL at different n ratios in the 304L steel
The conventional fatigue threshold, ΔKth,conv, remains constant under periodic underloads at n ≥
105 (Figure 7.13). However, it starts to decrease between 105 and 104. At n = 103, ΔKth,conv decreases
Conventional
threshold
True
threshold
3
2
1
4
0
Conventional
threshold
1
2
3
4
0
True
threshold
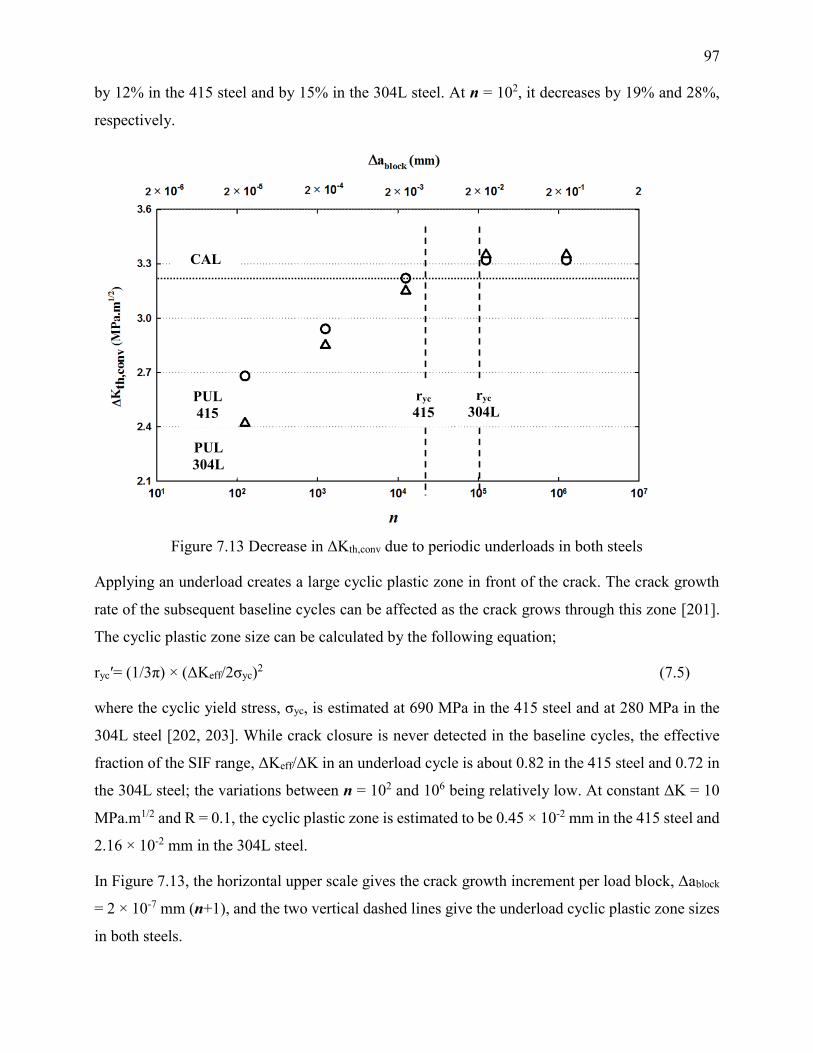
97
by 12% in the 415 steel and by 15% in the 304L steel. At n = 102, it decreases by 19% and 28%,
respectively.
Figure 7.13 Decrease in ΔKth,conv due to periodic underloads in both steels
Applying an underload creates a large cyclic plastic zone in front of the crack. The crack growth
rate of the subsequent baseline cycles can be affected as the crack grows through this zone [201].
The cyclic plastic zone size can be calculated by the following equation;
ryc′= (1/3π) × (ΔKeff/2σyc)2 (7.5)
where the cyclic yield stress, σyc, is estimated at 690 MPa in the 415 steel and at 280 MPa in the
304L steel [202, 203]. While crack closure is never detected in the baseline cycles, the effective
fraction of the SIF range, ΔKeff/ΔK in an underload cycle is about 0.82 in the 415 steel and 0.72 in
the 304L steel; the variations between n = 102 and 106 being relatively low. At constant ΔK = 10
MPa.m1/2 and R = 0.1, the cyclic plastic zone is estimated to be 0.45 × 10⁻² mm in the 415 steel and
2.16 × 10⁻² mm in the 304L steel.
In Figure 7.13, the horizontal upper scale gives the crack growth increment per load block, Δablock
= 2 × 10⁻⁷ mm (n+1), and the two vertical dashed lines give the underload cyclic plastic zone sizes
in both steels.
CAL
PUL
415
PUL
304L
ryc
415
ryc
304L

98
At high n, the crack growth per block, Δablock, is much higher than the cyclic plastic zone size, ryc,
so that the crack growth rate of baseline cycles is not affected. However, as n decreases, Δablock
decreases and becomes of the same order of magnitude as ryc′. The decrease in ΔKth,conv indicates
that the mean crack growth rate of the baseline cycles starts to increase.
7.3.2 Second load procedure
The second load procedure is first used to measure the true fatigue threshold, ΔKth,true, under
periodic underloads. As shown in Figure 7.14, crack growth rates are below 6.7 × 10⁻⁹ mm/cycle
in the 415 steel with underload cycles only (point 0) and with baseline cycles until ΔKBL = 1.5
MPa.m1/2 (point 1). The first increase in crack growth rates are obtained at ΔKBL = 1.7 MPa.m1/2.
Thus, the true fatigue threshold stands between 1.5 and 1.7 MPa.m1/2.
Then crack growth rates are measured by increasing ΔKBL until 2 × 10⁻⁷ mm/cycle. The
conventional fatigue threshold is close to that measured following the first load procedure (3.03
versus 2.93 MPa.m1/2).
The conventional fatigue threshold at 2 × 10⁻⁷ mm/cycle, ΔKth,conv, under constant amplitude
loading decreases by 9% due to periodic underloads (from 3.32 to 3.03 MPa.m1/2). However, as
shown in Figure 7.14, the decrease is much higher at very low crack growth rates. As previously
mentioned, the true fatigue threshold ΔKth,true under constant amplitude loading stands between
2.69 and 2.95 MPa.m1/2, while that under periodic underloads stands between 1.5 and 1.7 MPa.m1/2.
Therefore, ΔKth,true under constant amplitude loading decreases by an average of 43% due to
periodic underloads.

99
Figure 7.14 Effect of periodic underloads at n = 103 on ΔKth,conv and ΔKth,true of the 415 steel in a
log-linear da/dN – ΔKBL plot
Figure 7.15 Effect of periodic underloads at n = 103 on ΔKth,conv and ΔKth,true of the 304L steel in
a log-linear da/dN – ΔKBL plot
A similar behavior is observed in the 304L steel. The conventional fatigue threshold at 2 × 10⁻⁷
mm/cycle, ΔKth,conv under constant amplitude loading decreases by 12% due to periodic underloads
Decrease
in ΔKth,true True
threshold
0 1
Decrease
in ΔKth,conv
Conventional
threshold 2
Decrease
in ΔKth,true
True
threshold
0 1
Decrease
in ΔKth,conv
Conventional
threshold 2
100
(from 3.35 to 2.95 MPa.m1/2). However, as shown in Figure 7.15, the decrease is much higher at
very low crack growth rates. The true fatigue threshold, ΔKth,true, under constant amplitude loading
decreases by an average of 61% due to periodic underloads. The conventional fatigue threshold,
ΔKth,conv, under periodic underloads value is only 4% higher than the one measured following the
first load procedure.
7.4 Conclusions
The aim of the present study was to determine the effect of turbine runners start/stop (SS) sequences
(periodic underloads) on the fatigue threshold of small cycles at high stress ratio (baseline cycles)
in the 415 and 304L steels.
A first load procedure was conducted at constant Kmax with decreasing ΔK to measure a
conventional fatigue threshold, ΔKth,conv, under constant amplitude loading and under periodic
underloads at different n ratios. Then a second load procedure was conducted with increasing ΔKBL
from zero to measured ΔKth,true and ΔKth,conv under periodic underloads at n = 1.25 × 10³.
According to the first procedure, ΔKth,conv starts to decrease under periodic underloads at n below
105, when the crack growth per block becomes of the same magnitude as the underload cyclic
plastic zone. While ΔKth,conv under constant amplitude are close together in both steels, the decrease
in ΔKth,conv due to periodic underloads is higher in the 304L steel.
The conventional fatigue thresholds measured under periodic underloads following the first and
second procedures are close together. According to the second load procedure, ΔKth,true decreases
by 43% and 61% due to periodic underloads at n = 1.25 × 10³ in the 415 and 304L steels,
respectively, as compared to 9% and 12% decreases in ΔKth,conv.
The measured crack growth rates are higher than those predicted by linear damage summation
(LDS). As ΔKBL increases from zero, the acceleration factor increases and it reaches a maximum
value below ΔKth,true under constant amplitude loading. However, the crack growth rate predicted
by LDS increases above ΔKth,true , which leads to a rapid decrease in the acceleration factor.
The periodic underloads do not decrease the fatigue threshold of baseline cycles above n = 1.25 ×
105. In turbine runners, the number of small cycles (baseline cycles) is around 7 × 10¹⁰ during the
70 years of design life. As a result, in order to avoid a decrease in the fatigue threshold, the number
of start/stop sequences or other large cycles (periodic underloads) should be kept below 5 × 10⁵.

101
Acknowledgements
This work was supported by the Natural Science and Engineering Research Council of Canada,
Alstom Renewable Power Canada and Hydro-Québec Research Institute. The authors would like
to the technologist Carlo Baillargeon for his assistance.
102
CHAPTER 8 GENERAL DISCUSSION
8.1 Crack growth under constant amplitude loading
The results of the last four chapters are summarized and discussed in this chapter. Some additional
results are presented and discussed.
It is straightforward to measure crack growth rates under constant amplitude loading in the Paris
region. After a precracking, the initial ΔK and Kmax should be increased with respect to crack length,
a, at a constant R ratio. As an advantage, the shape and amount of the increasing gradients,
dKmax/da, do not affect crack growth rates in the Paris region [32].
In Chapter 5 and 6, crack growth rates were measured under constant amplitude loading in the
Paris region for the 415, A516 and 304L steels. Measured crack growth rates in the 415 steel are
lower than the 304L steels in the Paris region for all R ratios. The A516 has intermediate crack
growth rates as compared to other two steels.
It becomes more complicated to measure crack growth rates in the near-threshold region. After a
precracking, the initial ΔK and Kmax should be decreased with respect to crack length, a, at a
constant R ratio to reach a fatigue threshold [32]; however, a high amount of decreasing gradient,
dKmax/da, can induce extra crack closure level, which leads to an underestimation of the crack
growth rate at a given ΔK and an overestimation of the fatigue threshold. A load procedure with a
slow and continuous decreasing gradient, i.e. so called the ASTM E647 procedure, is proposed to
minimize extra crack closure while reaching the fatigue threshold [32]; however, initial Kmax level,
and dKmax/da can still induce extra crack closure [35].
In order to eliminate the consequences of the initial Kmax and its decreasing gradients, it was
proposed to keep the Kmax constant while ΔK is decreased to reach ΔKth at high R ratios. In this
procedure, the dKmax/da is equal to zero and only dΔK/da is gradually decreased to reach the fatigue
threshold. Still only dΔK/da can induce extra crack closure but it is much lower than the one
induced by both decreasing gradients [35].
Conducting the ASTM load procedure at high R ratio leads to an increase in measured crack growth
rates; however, after a specific high R ratio, crack growth rates do not further increase and the
fatigue threshold becomes constant [63]. On the other hand, in the constant Kmax procedure, crack
103
growth rates measured at high R ratios always increase and the fatigue threshold decreases. This is
reported in some aluminum alloys and titanium alloys [195, 198].
The definition of fatigue crack growth threshold corresponds to a crack that do not grow below a
certain ΔK or the one that starts to grow by increasing ΔK step by step from zero. It should be
stated that the definition of the crack growth rate that corresponds to the fatigue threshold crack
depends on the testing conditions such as precision of crack growth detection and the elapsed
number of cycles. In many studies, the test condition cannot reach a crack growth rate below 1 ×
10-7 mm/cycle [31, 120, 165]. Thus, they have defined a ΔK corresponding to the aforementioned
crack growth rate as the fatigue threshold [204, 205]. The aforementioned fatigue threshold is also
recommended in American Standard ASTM E647 [160]. Since many studies have used the
aforementioned definition, we preferred to call this fatigue threshold as the conventional fatigue
threshold (ΔKth,conv).
On the other hand, a ΔK corresponding to a lower crack growth rate equal to 1 × 10⁻⁸ mm/cycle is
defined as the fatigue threshold according to the British Standard [206]. In this study, when the
crack starts or stops growing after a given ΔK for a length of 0.005 mm and 0.75 × 10⁷ cycles, it is
considered a true fatigue threshold. This corresponds to a growth rate equal to 6.7 × 10⁻⁹ mm/cycle
(ΔKth,true). Visual crack growth detected with an optical microscope has enabled this study to reach
such precision.
In Chapter 5, crack growth rates were measured under constant amplitude loading using the ASTM
test procedure at R = 0.1 and 0.7. Crack growth rates at R = 0.1 in the 415 steel are lower than the
ones in the 304L steel, in the Paris region, but become higher in the near-threshold region. As the
ΔK approaches ΔKth,conv the near-threshold region, crack closure levels increase in both steels and
crack growth rates versus ΔKeff become close to each other. Crack closure is mainly induced by
crack path irregularities and crack tip plasticity. The crack path deflection that is presumed to
induce crack closure is higher in the 415 than the 304L steel. On the other hand, the plasticity that
induces crack closure is lower in the 415 steel than the 304L steel. Thus, it can be stated that the
crack closure is mainly induced by crack path irregularities in the 415 steel and mainly induced by
plasticity in the 304L.
Crack closure is detected at R = 0.1 but this is not the case at R = 0.7. Crack growth rates estimated
by ΔKeff at R = 0.1 are higher than the ones at R = 0.7 in both steels. This leads to an estimated
closure-free fatigue threshold at R = 0.1 that is lower than the one at R = 0.7. This may be due to
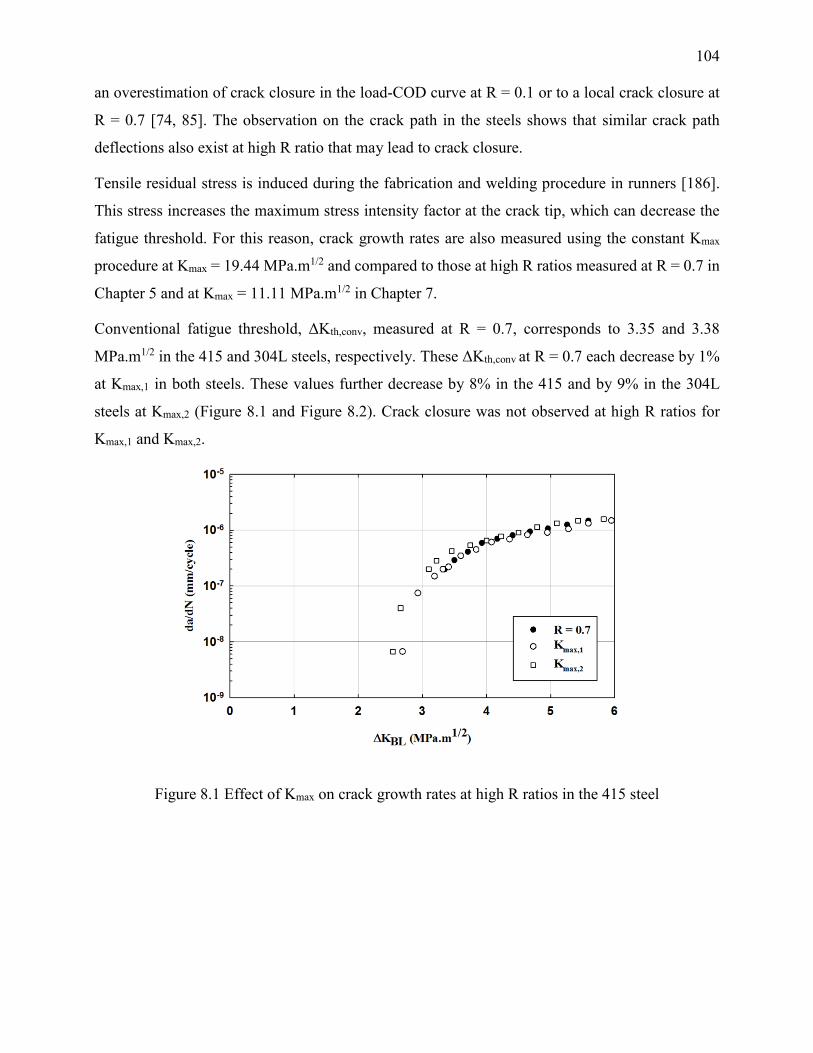
104
an overestimation of crack closure in the load-COD curve at R = 0.1 or to a local crack closure at
R = 0.7 [74, 85]. The observation on the crack path in the steels shows that similar crack path
deflections also exist at high R ratio that may lead to crack closure.
Tensile residual stress is induced during the fabrication and welding procedure in runners [186].
This stress increases the maximum stress intensity factor at the crack tip, which can decrease the
fatigue threshold. For this reason, crack growth rates are also measured using the constant Kmax
procedure at Kmax = 19.44 MPa.m1/2 and compared to those at high R ratios measured at R = 0.7 in
Chapter 5 and at Kmax = 11.11 MPa.m1/2 in Chapter 7.
Conventional fatigue threshold, ΔKth,conv, measured at R = 0.7, corresponds to 3.35 and 3.38
MPa.m1/2 in the 415 and 304L steels, respectively. These ΔKth,conv at R = 0.7 each decrease by 1%
at Kmax,1 in both steels. These values further decrease by 8% in the 415 and by 9% in the 304L
steels at Kmax,2 (Figure 8.1 and Figure 8.2). Crack closure was not observed at high R ratios for
Kmax,1 and Kmax,2.
Figure 8.1 Effect of Kmax on crack growth rates at high R ratios in the 415 steel
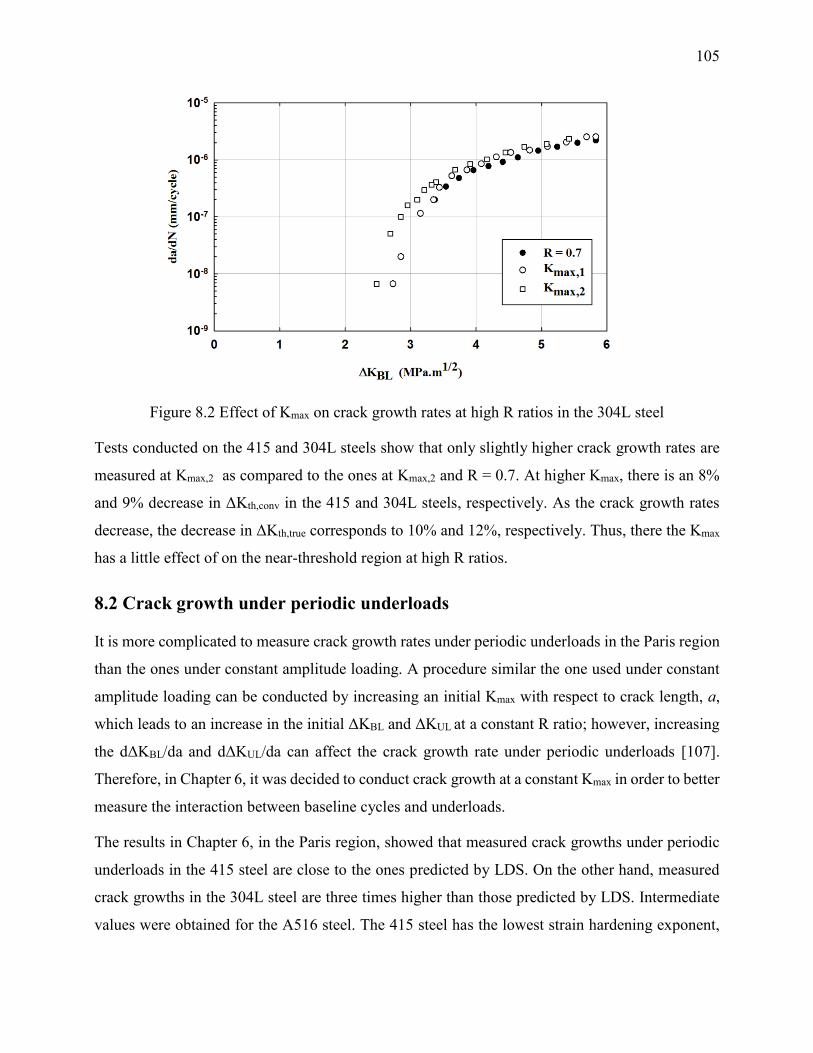
105
Figure 8.2 Effect of Kmax on crack growth rates at high R ratios in the 304L steel
Tests conducted on the 415 and 304L steels show that only slightly higher crack growth rates are
measured at Kmax,2 as compared to the ones at Kmax,2 and R = 0.7. At higher Kmax, there is an 8%
and 9% decrease in ΔKth,conv in the 415 and 304L steels, respectively. As the crack growth rates
decrease, the decrease in ΔKth,true corresponds to 10% and 12%, respectively. Thus, there the Kmax
has a little effect of on the near-threshold region at high R ratios.
8.2 Crack growth under periodic underloads
It is more complicated to measure crack growth rates under periodic underloads in the Paris region
than the ones under constant amplitude loading. A procedure similar the one used under constant
amplitude loading can be conducted by increasing an initial Kmax with respect to crack length, a,
which leads to an increase in the initial ΔKBL and ΔKUL at a constant R ratio; however, increasing
the dΔKBL/da and dΔKUL/da can affect the crack growth rate under periodic underloads [107].
Therefore, in Chapter 6, it was decided to conduct crack growth at a constant Kmax in order to better
measure the interaction between baseline cycles and underloads.
The results in Chapter 6, in the Paris region, showed that measured crack growths under periodic
underloads in the 415 steel are close to the ones predicted by LDS. On the other hand, measured
crack growths in the 304L steel are three times higher than those predicted by LDS. Intermediate
values were obtained for the A516 steel. The 415 steel has the lowest strain hardening exponent,

106
the 304L has the highest one, and the A516 has intermediate values. Therefore, it is concluded that
as the monotonous strain hardening increases in the steels, the acceleration factor increases.
That being said, the aforementioned conclusion is given by comparing three different steels with
different strain hardening capacity. Many other factors may influence the acceleration factor in one
steel as compared to the other two. Thus, acceleration factors should be compared in a same steel
with different monotonous strain hardening. It should be mentioned that comparing the cyclic strain
hardening curve for these steels should be compared, but we decided to compare them by the
available measured monotonic strain hardening curve.
For this reason, tensile and CT specimens were fabricated from a new plate of A516 steel to
compare their strain hardening and acceleration factors with those of A516 steel in Chapter 6 (old
plates of A516 steel). These two different plates are referred to as the new A516 steel and old A516
steel.
Results show that the new A516 steel respects all tensile properties suggested by the ASTM A516
standard. On the other hand, the old A516 steel respects all values proposed by the standard except
for the tensile strength (Table 8.1). The new A516 steel has a lower strain hardening exponent as
compared to the old one (0.24 vs 0.29).
Table 8.1 Comparison of tensile properties in the old and new A516 steel with ASTM A516
Steels 0.2% Yield
stress (MPa)
Tensile
strength (MPa)
Maximum
elongation (εr)
Strain hardening
exponent (s)
New A516 344 511 0.26 0.24
Old A516 300 476 0.37 0.29
ASTM A516 260 (min.) 485-620 0.21 (min.) -
In order to calculate acceleration factors in the new A516 steel, crack growth rates should be
measured under constant amplitude loading and periodic underloads. Using a CT specimen with
the same geometry as the one specified in Chapter 6, crack growth rates are measured under
constant amplitude loading at R = 0.1 and R = 0.7 to calculate the LDS in the new A516. The crack
growth rate under constant amplitude loading at R = 0.1 is 3.02 × 10⁻⁵ mm/cycle and at R = 0.7 is
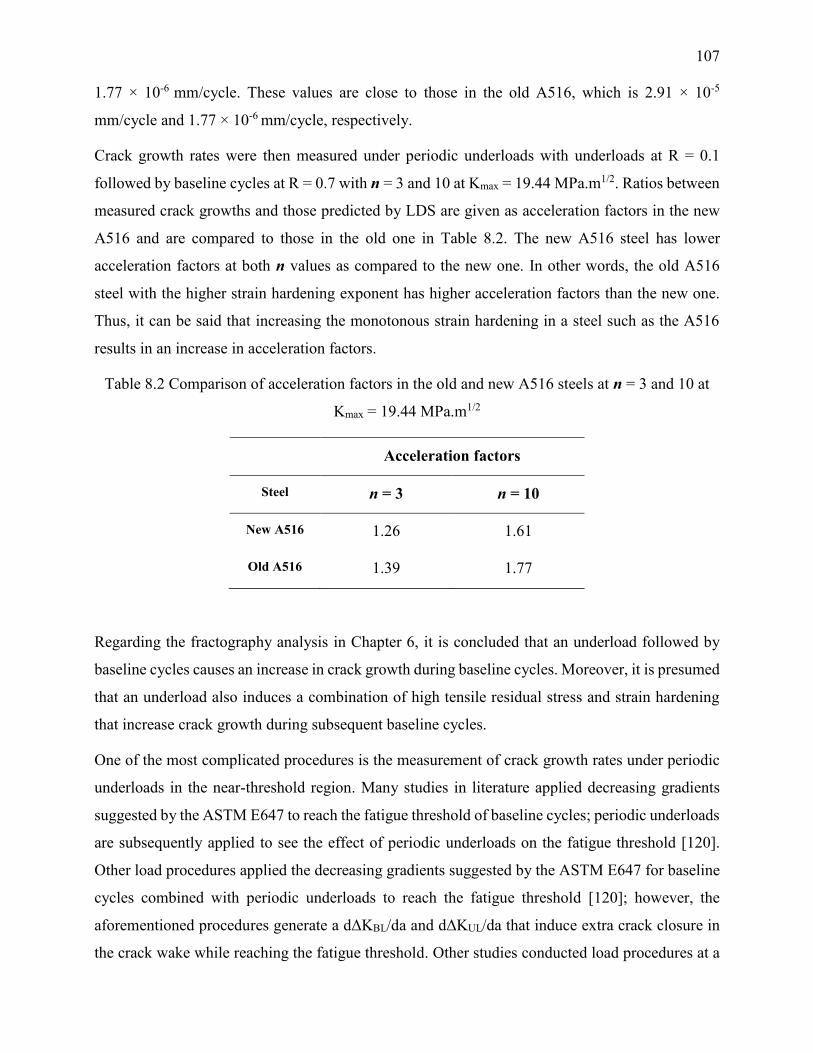
107
1.77 × 10⁻⁶ mm/cycle. These values are close to those in the old A516, which is 2.91 × 10⁻⁵
mm/cycle and 1.77 × 10⁻⁶ mm/cycle, respectively.
Crack growth rates were then measured under periodic underloads with underloads at R = 0.1
followed by baseline cycles at R = 0.7 with n = 3 and 10 at Kmax = 19.44 MPa.m1/2. Ratios between
measured crack growths and those predicted by LDS are given as acceleration factors in the new
A516 and are compared to those in the old one in Table 8.2. The new A516 steel has lower
acceleration factors at both n values as compared to the new one. In other words, the old A516
steel with the higher strain hardening exponent has higher acceleration factors than the new one.
Thus, it can be said that increasing the monotonous strain hardening in a steel such as the A516
results in an increase in acceleration factors.
Table 8.2 Comparison of acceleration factors in the old and new A516 steels at n = 3 and 10 at
Kmax = 19.44 MPa.m1/2
Acceleration factors
Steel n = 3 n = 10
New A516 1.26 1.61
Old A516 1.39 1.77
Regarding the fractography analysis in Chapter 6, it is concluded that an underload followed by
baseline cycles causes an increase in crack growth during baseline cycles. Moreover, it is presumed
that an underload also induces a combination of high tensile residual stress and strain hardening
that increase crack growth during subsequent baseline cycles.
One of the most complicated procedures is the measurement of crack growth rates under periodic
underloads in the near-threshold region. Many studies in literature applied decreasing gradients
suggested by the ASTM E647 to reach the fatigue threshold of baseline cycles; periodic underloads
are subsequently applied to see the effect of periodic underloads on the fatigue threshold [120].
Other load procedures applied the decreasing gradients suggested by the ASTM E647 for baseline
cycles combined with periodic underloads to reach the fatigue threshold [120]; however, the
aforementioned procedures generate a dΔKBL/da and dΔKUL/da that induce extra crack closure in
the crack wake while reaching the fatigue threshold. Other studies conducted load procedures at a
108
constant Kmax under periodic underloads in order to eliminate the decreasing gradient, dΔKUL/da,
to minimize extra crack closure levels while reaching the fatigue threshold [132].
In Chapter7 two load procedures were proposed at a constant Kmax. In the first load procedure, the
ΔK was decreased in order to reach the conventional fatigue threshold, ΔKth,conv under constant
amplitude loading. The load procedure also leads to the measurement of the conventional fatigue
threshold under periodic underloads for n ranging from 1.25 × 10² and 1.25 × 10⁶.
The conventional fatigue threshold, ΔKth,conv, under periodic underloads at n = 1.25 × 10⁵ and 1.25
× 106 is equal to the one under constant amplitude loading for the 415 and 304L steels; however,
as the n decreases below 105, the ΔKth,conv decreases to lower values. This decrease reaches a
maximum at n = 102 in both steels in our study, and is associated with a mean increase in crack
growth rate under periodic underloads.
This maximum increase in the mean crack growth rate at n = 102 and Kmax = 11.11 MPa.m1/2 can
be compared with the one at Kmax = 19.44 MPa.m1/2 in the 415 and 304L steels in Chapter 6. For
this reason, crack growth rates for baseline cycles are measured at R = 0.7 followed by periodic
underloads at R = 0.1 at Kmax = 19.44 MPa.m1/2 and n = 102. This increase in crack growth rate is
compared with the one at Kmax = 11.11 MPa.m1/2 in both steels and is shown in Figure 8.3. As the
ΔKBL decreases from 5.83 to 3.32 MPa.m1/2, acceleration factors increase from 1.35 to 2.35,
respectively in the 415 steel. This factor increases from 2.5 to 5 in the 304L steel, respectively.
This shows that as Kmax and ΔKBL decrease towards ΔKth,conv at 2 × 10⁻⁷ mm/cycle, periodic
underloads at R = 0.1 have a higher effect on baseline cycles at R = 0.7.
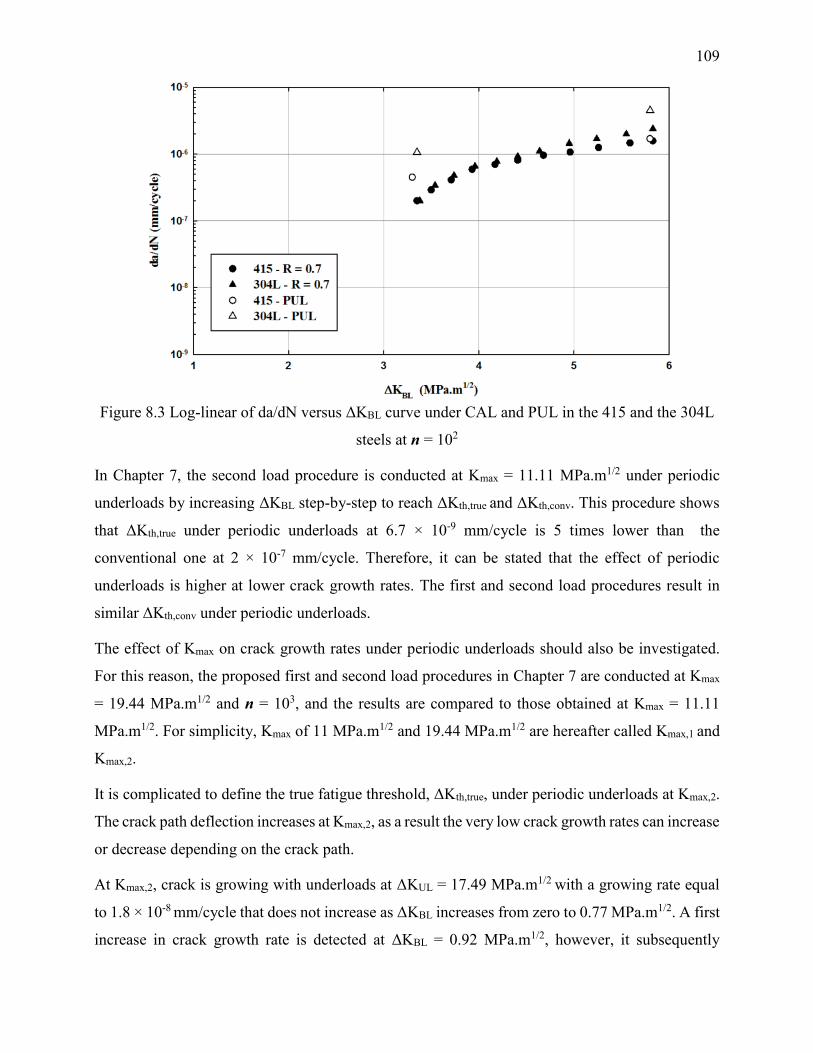
109
Figure 8.3 Log-linear of da/dN versus ΔKBL curve under CAL and PUL in the 415 and the 304L
steels at n = 102
In Chapter 7, the second load procedure is conducted at Kmax = 11.11 MPa.m1/2 under periodic
underloads by increasing ΔKBL step-by-step to reach ΔKth,true and ΔKth,conv. This procedure shows
that ΔKth,true under periodic underloads at 6.7 × 10⁻⁹ mm/cycle is 5 times lower than the
conventional one at 2 × 10⁻⁷ mm/cycle. Therefore, it can be stated that the effect of periodic
underloads is higher at lower crack growth rates. The first and second load procedures result in
similar ΔKth,conv under periodic underloads.
The effect of Kmax on crack growth rates under periodic underloads should also be investigated.
For this reason, the proposed first and second load procedures in Chapter 7 are conducted at Kmax
= 19.44 MPa.m1/2 and n = 103, and the results are compared to those obtained at Kmax = 11.11
MPa.m1/2. For simplicity, Kmax of 11 MPa.m1/2 and 19.44 MPa.m1/2 are hereafter called Kmax,1 and
Kmax,2.
It is complicated to define the true fatigue threshold, ΔKth,true, under periodic underloads at Kmax,2.
The crack path deflection increases at Kmax,2, as a result the very low crack growth rates can increase
or decrease depending on the crack path.
At Kmax,2, crack is growing with underloads at ΔKUL = 17.49 MPa.m1/2 with a growing rate equal
to 1.8 × 10⁻⁸ mm/cycle that does not increase as ΔKBL increases from zero to 0.77 MPa.m1/2. A first
increase in crack growth rate is detected at ΔKBL = 0.92 MPa.m1/2, however, it subsequently

110
decreases to that of underloads at ΔKBL = 1.33 MPa.m1/2 (Figure 8.4). As ΔKBL increases to 1.59
MPa.m1/2, the crack growth starts to increase continuously with ΔKBL until it reaches 2 × 10⁻⁷
mm/cycle.
The ΔKth,true at Kmax,2 under constant amplitude loading stands between 2.54 and 2.66 MPa.m1/2 at
Kmax,2, which is close to values at Kmax,1. A first increase of the crack growth rates under periodic
underloads leads to 67% decrease in ΔKth,true at Kmax,2 under constant amplitude loading. On the
other hand, a continuous increase in the crack growth rates under periodic underloads leads to 44%
decrease in ΔKth,true at Kmax,2 which is close to the 43% decrease in ΔKth at Kmax,1 (Figure 8.4).
As previously mentioned for the case of 415 steel, the conventional fatigue threshold, ΔKth,conv,
under periodic underloads at Kmax,1 is 12% lower than the one under constant amplitude loading at
Kmax,1 (3.12 versus 3.32 MPa.m1/2). This value at Kmax,2 is 14% lower than the one under constant
amplitude loading (2.66 versus 3.12 MPa.m1/2).
Similar results are obtained in the 304L steel, the true fatigue threshold under constant amplitude
loading is equal to 2.48 MPa.m1/2 and 2.70 MPa.m1/2 at Kmax,2. The first increase of the crack growth
of the underloads leads to 74% decrease in the ΔKth,true at Kmax,2. On the other hand, a continuous
increase in the crack growth rates leads to 62% decrease in the ΔKth,true which is close to 63%
decrease in ΔKth at Kmax,1 (Figure 8.5).
The conventional fatigue thresholds, ΔKth,conv, at Kmax,1 is 15% lower than the one under constant
amplitude loading (3.09 versus 3.35 MPa.m1/2). The conventional fatigue threshold under periodic
underloads at Kmax,2 is 19% lower than the one under constant amplitude loading (2.52 versus 3.09
MPa.m1/2) .

111
Figure 8.4 Crack growth rates versus linear ΔKBL from different test procedures under CAL and
PUL in 415 steel
Figure 8.5 Crack growth rates versus linear ΔKBL from different test procedures under CAL and
PUL in 304L steel
112
CHAPTER 9 CONCLUSION AND RECOMMENDATIONS
9.1 Conclusions
In the 415 steel, crack growth rates versus ΔK under constant amplitude loading at R = 0.1 are
lower than the ones in the 304L steel in the Paris region. As ΔK approaches ΔKth,conv in the near-
threshold region, crack closure levels increase in both steels and the crack growth rates versus the
estimated ΔKeff become close to each other. It is presumed that crack closure is mainly induced by
crack path irregularities in the 415 steel and mainly induced by plasticity in the 304L.
Crack growth rates and ΔKth,conv at R = 0.7 are close together in both steels. An increase in Kmax
slightly decreases the conventional and real fatigue thresholds in both steels.
In the first study, it can be concluded that crack growth due to POVs and SS sequences can be
linearly summed using the LDS prediction in the Paris region for the 415 steel; however, a
maximum acceleration factor of 1.5 and 2.5 should be considered in the LDS prediction for the
A516 and 304L steel, respectively. Increase in the monotonous strain hardening in turbine runner
steels increases acceleration factors.
Fractography analysis revealed that an underload followed by the baseline cycles causes an
increase in the crack growth during baseline cycles, which leads to higher acceleration factors.
It is presumed that a combination of high tensile residual stress and slow decrease of this stress
after an underload can be one cause of this faster crack growth. Moreover, strain hardening induced
by periodic underloads can decrease ductility at the crack tip, also leading to higher crack growth
during subsequent baseline cycles.
In the second study, periodic underloads do not decrease the fatigue threshold of small cycles
(baseline cycles) above n = 1.25 × 10⁵. In turbine runners, the number of small cycles is around 7
× 1010 during the 70 years of design life. As a result, in order to avoid a decrease in the fatigue
threshold, the number of start/stop sequences or other large cycles (periodic underloads) should be
kept below 5 × 10⁵.
Periodic underloads applied below n = 1.25 × 10⁵ decrease the conventional fatigue threshold
measured at 2 × 10⁻⁷ mm/cycle. This decrease is higher in the 304L steel as compared to 415 steel.
According to the second load procedure, ΔKth,true under constant amplitude loading decreases by
43% and 61% due to periodic underloads at n = 1.25 × 10³ in the 415 and 304L steels, respectively,

113
as compared to 9% and 12% decreases in ΔKth,conv. The decreases in the conventional fatigue
thresholds due to periodic underloads following the first and second procedures are similar.
Tensile residual stress is induced in runners during the fabrication and welding. This leads to an
increase in Kmax level at the tip of the defects in runners and may propagate them. At Kmax,2, the
conventional fatigue threshold decreases by 8% and 9% in the in the 415 and 304L steels. As the
crack growth rates decrease, the decrease in ΔKth,true corresponds to 10% and 12%, respectively.
There is a similar decrease in the conventional and real fatigue threshold due to periodic underloads
or large cycles at Kmax,1 and Kmax,2.
9.2 Further recommendations
In the turbine runners stress spectrum, a startup and a spin-no-load (SNL) occur before reaching
the maximum stress. The startup and SNL are shown in Figure 9.1 in a repeated start/stop sequence
(sequence A). It was assumed that both types of stress do not induce a crack growth at the beginning
of the stress spectrum. Consequently, they were neglected, and the effect of interaction between
small stress cycles and SS sequences on crack growth was investigated in Chapter 6; however,
some studies have considered that periodic startups can induce crack growth [155]. Consequently,
it was suggested to decrease the maximum stress reached by periodic startups [155]. This raises
the question about what the maximum stress level that periodic startups and the SNL can reach
without inducing crack growth is. A test procedure can be conducted to address this question.
Figure 9.1 Startup and SNL in an operating turbine runner with a repeated sequence
Repeated sequence A Sequence A
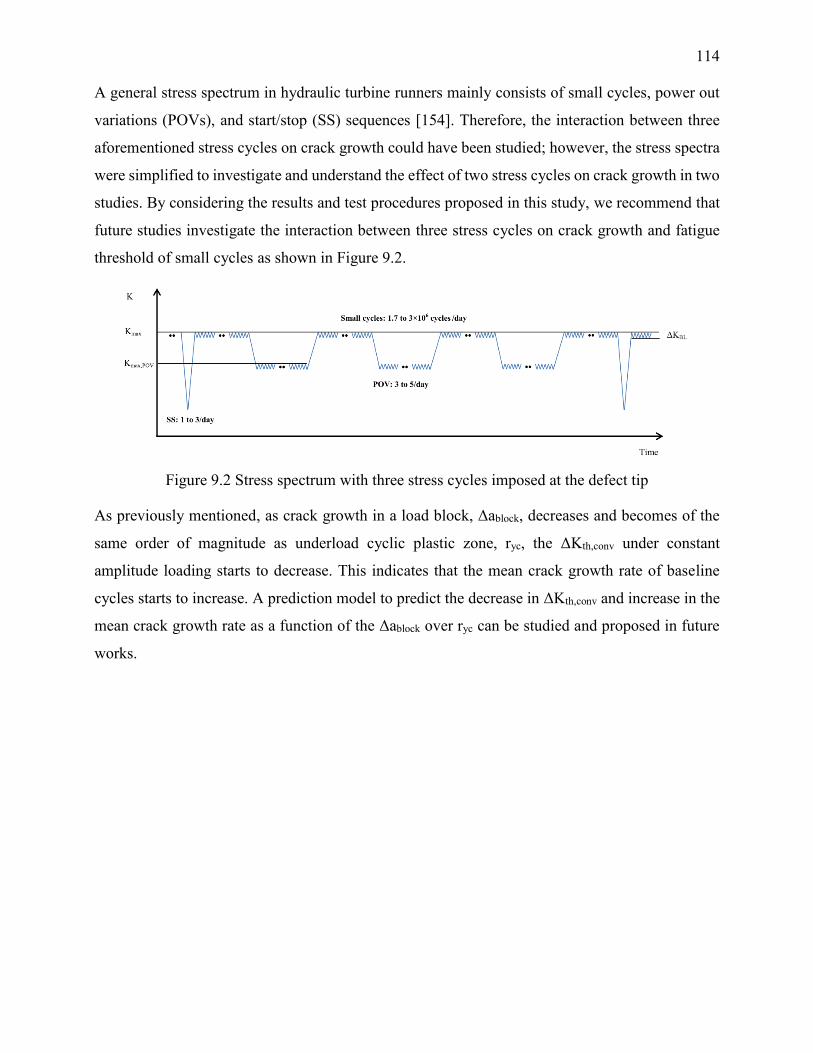
114
A general stress spectrum in hydraulic turbine runners mainly consists of small cycles, power out
variations (POVs), and start/stop (SS) sequences [154]. Therefore, the interaction between three
aforementioned stress cycles on crack growth could have been studied; however, the stress spectra
were simplified to investigate and understand the effect of two stress cycles on crack growth in two
studies. By considering the results and test procedures proposed in this study, we recommend that
future studies investigate the interaction between three stress cycles on crack growth and fatigue
threshold of small cycles as shown in Figure 9.2.
Figure 9.2 Stress spectrum with three stress cycles imposed at the defect tip
As previously mentioned, as crack growth in a load block, Δablock, decreases and becomes of the
same order of magnitude as underload cyclic plastic zone, ryc, the ΔKth,conv under constant
amplitude loading starts to decrease. This indicates that the mean crack growth rate of baseline
cycles starts to increase. A prediction model to predict the decrease in ΔKth,conv and increase in the
mean crack growth rate as a function of the Δablock over ryc can be studied and proposed in future
works.
115
REFERENCES
[1] H. Huth, "Fatigue design of hydraulic turbine runners," PhD thesis, Norwegian University
of Science and Technology, 2005.
[2] G. Franke, C. Powell, R. Fisher, U. Seidel, and J. Koutnik, "On pressure mode shapes
arising from rotor/stator interactions," Sound and Vibration, vol. 39, no. 3, pp. 14-18, 2005.
[3] B. Nennemann, T. Vu, and M. Farhat, "CFD prediction of unsteady wicket gate-runner
interaction in Francis turbines: A new standard hydraulic design procedure," in HYDRO
2005, 2005.
[4] M. Sabourin, J. L. Gagné, S. Giroux, A. St-Hilaire, and J. de la Bruere Terrault,
"Mechanical loads and fatigue analysis of a Francis runner," Hydro Vision, 2004.
[5] C. Trivedi, B. Gandhi, and C. J. Michel, "Effect of transients on Francis turbine runner life:
a review," Journal of Hydraulic Research, vol. 51, no. 2, pp. 121-132, 2013.
[6] T. L. Anderson, Fracture Mechanics: Fundamentals and Applications, 3th ed. CRC press,
pp. 12-13, 2005.
[7] R. I. Stephens, A. Fatemi, R. R. Stephens, and H. O. Fuchs, Metal fatigue in engineering.
John Wiley & Sons, 2000.
[8] A. Coutu, M. D. Roy, C. Monette, and B. Nennemann, "Experience with rotor-stator
interactions in high head Francis runner," Proceedings of 24th IAHR symposium on
hydraulic machinery and systems at Foz do Iguassu, Brazil, 2008.
[9] ASTM.E1823, "Standard Terminology Relating to Fatigue and Fracture Testing," 2012.
[10] R. I. Stephens, A. Fatemi, R. R. Stephens, and H. O. Fuchs, Metal fatigue in engineering,
2nd ed. New York ; Toronto: Wiley, pp. 67-69, 2001.
[11] S. Suresh, Fatigue of materials, 2nd ed. Cambridge University Press, pp. 322-326, 1998.
[12] R. W. Hertzberg, "Deformation and fracture mechanics of engineering materials," 1989.
[13] T. L. Anderson, Fracture Mechanics: Fundamentals and Applications, 3th ed. CRC press,
pp. 513-514, 2005.
[14] J. Schijve, Fatigue of structures and materials. Kluwer Academic Pub, 2001.
116
[15] K. Walker, "The effect of stress ratio during crack propagation and fatigue for 2024-T3 and
7075-T6 aluminum," Effects of environment and complex load history on fatigue life, ASTM
STP 462, pp. 1-14, 1970.
[16] N. Dowling, Mechanical Behavior of Materials (USA). pp. 421-427, 2007.
[17] C. Bathias and A. Pineau, Fatigue des matériaux et des structures. 1, Introduction,
endurance, amorçage et propagation des fissures, fatigue oligocyclique et gigacyclique
(Mécanique et ingénierie des matériaux). Paris: Hermès Science, 2008.
[18] K. Tanaka, "Mechanics and micromechanics of fatigue crack propagation," Fracture
mechanics: perspectives and directions (twentieth symposium), ASTM STP 1020, pp. 151-
183, 1989.
[19] C. Bathias and A. Pineau, Fatigue des matériaux et des structures. 2, Fissures courtes,
mécanismes et approche locale, fatigue-corrosion et effet de l'environnement, chargements
d'amplitude variable (Mécanique et ingénierie des matériaux). Paris: Hermès science :
Lavoisier, pp. 17-19, 2008.
[20] R. Ritchie and J. Lankford, "Small fatigue cracks: a statement of the problem and potential
solutions," Materials Science and Engineering, vol. 84, pp. 11-16, 1986.
[21] D. Broek, Elementary Engineering Fracture Mechanics, 4th ed. Martinus Nijhoff, pp. 441-
446, 1986.
[22] D. Broek, The Practical Use of Fracture Mechanics, 2nd ed. Kluwer Academic Publishers,
pp. 226-228, 1988.
[23] G. R. Irwin, "Analysis of stresses and strains near the end of a crack traversing a plate,"
Trans. ASME Journal of Applied Mechanics, vol. 24, pp. 361-364, 1957.
[24] J. Schijve, Fatigue of Structures and Materials (The Netherlands: Kluwer Academic
Publishers). 2001.
[25] R. O. Ritchie and S. Suresh, "Some considerations on fatigue crack closure at near-
threshold stress intensities due to fracture surface morphology," Metallurgical Transactions
A, vol. 13, no. 5, pp. 937-940, 1982.
[26] M. Williams, "The bending stress distribution at the base of a stationary crack," Journal of
Applied Mechanics, vol. 28, no. 1, pp. 78-82, 1961.

117
[27] D. Dugdale, "Yielding of steel sheets containing slits," Journal of the Mechanics and
Physics of Solids, vol. 8, no. 2, pp. 100-104, 1960.
[28] J. Rice, "Mechanics of crack tip deformation and Extension by fatigue," Fatigue crack
propagation, ASTM STP 415, pp. 247-311, 1966.
[29] R. McClung, "The influence of applied stress, crack length, and stress intensity factor on
crack closure," Metallurgical and Materials Transactions A, vol. 22, no. 7, pp. 1559-1571,
1991.
[30] B. Budiansky and J. Hutchinson, "Analysis of closure in fatigue crack growth," Journal of
Applied Mechanics, vol. 45, no. 2, pp. 267-276, 1978.
[31] R. Ritchie, "Near-threshold fatigue-crack propagation in steels," International Materials
Reviews, vol. 24, no. 1, pp. 205-230, 1979.
[32] R. Bucci, "Development of a proposed ASTM standard test method for near-threshold
fatigue crack growth rate measurement," Fatigue crack growth measurement and data
analysis, ASTM STP 738, no. 738, pp. 5-28, 1981.
[33] P. Paris, M. Gomez, and W. Anderson, "Rational Analytic Theory of Fatigue," Trend in
Engineering vol. 13, pp. 9-14, 1961.
[34] R. Ritchie, "Influence of microstructure on near-threshold fatigue-crack propagation in
ultra-high strength steel," Metal Science, vol. 11, no. 8-9, pp. 8-9, 1977.
[35] C. van Kranenburg, W. He, J. Zuidema, and F. Veer, "Influence of measurement method
on fatigue crack growth threshold," in ECF15, Stockolm 2004.
[36] W. Herman, R. Hertzberg, and R. Jaccard, "A simplified laboratory approach for the
prediction of short crack behavior in engineering structures," Fatigue & Fracture of
Engineering Materials & Structures, vol. 11, no. 4, pp. 303-320, 1988.
[37] R. Hertzberg, W. A. Herman, T. Clark, and R. Jaccard, "Simulation of short crack and other
low closure loading conditions utilizing constant Kmax ∆K-decreasing fatigue crack
growth procedures," Small-crack Test Methods, ASTM STP 1149, vol. 1149, pp. 197-220,
1992.
[38] D. Taylor, Fatigue thresholds. Butterworth-Heinemann, pp. 170-172, 1989.
118
[39] R. Vecchio, R. Hertzberg, and R. Jaccard, "Overload induced crack growth rate attenuation
behavior in aluminium alloys," Scripta Metallurgica, vol. 17, no. 3, pp. 343-346, 1983.
[40] J. Masounave and J. P. Bailon, "Dependence of the Threshold Stress Intensity Factor on the
Cyclic Stress Ratio in Fatigue of Ferritic-Pearlitic Steels," Scripta Metallurgica, vol. 9, no.
7, pp. 723-730, 1975.
[41] J. Masounave and J. P. Bailon, "Effect of grain size on the threshold stress intensity factor
in fatigue of a ferritic steel," Scripta Metallurgica, vol. 10, no. 2, pp. 165-170, 1976.
[42] O. Vosikovsky, "The effect of stress ratio on fatigue crack growth rates in steels,"
Engineering Fracture Mechanics, vol. 11, no. 3, pp. 595-602, 1979.
[43] J. Schijve, "Fatigue crack closure: observations and technical significance," Mechanics of
Fatigue Crack Closure, ASTM STP 982, pp. 5-34, 1988.
[44] W. Elber, "Fatigue crack closure under cyclic tension," Engineering Fracture Mechanics,
vol. 2, no. 1, pp. 37-45, 1970.
[45] W. Elber, "The significance of fatigue crack closure," Damage tolerance in aircraft
structures, ASTM STP 486, pp. 230-242, 1971.
[46] J. Newman Jr, "Prediction of fatigue crack growth under variable-amplitude and spectrum
loading using a closure model," Design of fatigue and fracture resistant structures, ASTM
STP 761, pp. 255-277, 1982.
[47] J. C. Newman Jr, "A crack-closure model for predicting fatigue crack growth under aircraft
spectrum loading," Methods and models for predicting fatigue crack growth under random
loading, ASTM STP 748, pp. 53-84, 1981.
[48] P. Bernard, T. Lindley, and C. Richards, "Mechanisms of overload retardation during
fatigue crack propagation," Fatigue crack growth under spectrum loads, ASTM STP 595,
pp. 78-97, 1976.
[49] J. Telesman and D. M. Fisher, "Influence of fatigue crack wake length and state of stress
on crack closure," NASA Tech. Memo., p. 25, 1986.
[50] E. Hornbogen, "Martensitic transformation at a propagating crack," Acta Metallurgica, vol.
26, no. 1, pp. 147-152, 1978.
119
[51] A. Pineau and R. Pelloux, "Influence of strain-induced martensitic transformations on
fatigue crack growth rates in stainless steels," Metallurgical and Materials Transactions B,
vol. 5, no. 5, pp. 1103-1112, 1974.
[52] D. A. Porter, K. E. Easterling, and M. Sherif, Phase Transformations in Metals and Alloys,
(Revised Reprint). CRC press, 2009.
[53] J. Bressanelli and A. Moskowitz, "Effects of strain rate, temperature, and composition on
tensile properties of metastable austenitic stainless steels," ASM Trans Quart, vol. 59, no.
2, pp. 223-239, 1966.
[54] D. Thibault, P. Bocher, M. Thomas, J. Lanteigne, P. Hovington, and P. Robichaud,
"Reformed austenite transformation during fatigue crack propagation of 13%Cr–4%Ni
stainless steel," Materials Science and Engineering: A, vol. 528, no. 21, pp. 6519-6526,
2011.
[55] Z. Khan and M. Ahmed, "Stress-induced martensitic transformation in metastable
austenitic stainless steels: Effect on fatigue crack growth rate," Journal of Materials
Engineering and Performance, vol. 5, no. 2, pp. 201-208, 1996.
[56] A. W. Thompson, "Fatigue crack propagation in austenitic stainless steels," Engineering
Fracture Mechanics, vol. 7, no. 1, pp. 61-66, IN7-IN8, 67-68, 1975.
[57] A. McEvily, W. Zagrany, J. Gonzalez, and S. Matsuoka, "Fatigue crack growth in type 304
stainless steel," Materials science monographs, vol. 46, pp. 271-279, 1988.
[58] S. Suresh, "Fatigue crack deflection and fracture surface contact: micromechanical
models," Metallurgical Transactions A, vol. 16, no. 1, pp. 249-260, 1985.
[59] S. Suresh, "Micromechanisms of fatigue crack growth retardation following overloads,"
Engineering Fracture Mechanics, vol. 18, no. 3, pp. 577-593, 1983.
[60] R. Ritchie, "Mechanisms of fatigue crack propagation in metals, ceramics and composites:
role of crack tip shielding," Materials Science and Engineering: A, vol. 103, no. 1, pp. 15-
28, 1988.
[61] C. Beevers, "Fatigue crack growth characteristics at low stress intensities of metals and
alloys," Metal Science, vol. 11, no. 8-9, pp. 8-9, 1977.
120
[62] C. Beevers, "Some aspects of the influence of microstructure and environment on ΔK
thresholds," Fatigue Thresholds, pp. 257-275, 1981.
[63] R. A. Schmidt and P. C. Paris, "Threshold for fatigue crack propagation and the effects of
load ratio and frequency," ASTM STP 536, pp. 79-94, 1973.
[64] ASTM.E407, Standard Practice for Microetching Metalls and Alloys, 2011.
[65] K. Minakawa, G. Levan, and A. McEvily, "The influence of load ratio on fatigue crack
growth in 7090-T6 and IN9021-T4 P/M aluminum alloys," Metallurgical and Materials
Transactions A, vol. 17, no. 10, pp. 1787-1795, 1986.
[66] D.-L. Chen, B. Weiss, and R. Stickler, "A new evaluation procedure for crack closure,"
International journal of fatigue, vol. 13, no. 4, pp. 327-331, 1991.
[67] M. Halliday and C. Beevers, "Some aspects of fatigue crack closure in two contrasting
titanium alloys," Journal of Testing and Evaluation, vol. 9, pp. 195-201, 1981.
[68] M. A. Sutton, W. Zhao, S. R. McNeill, J. D. Helm, R. S. Piascik, and W. T. Riddell, "Local
crack closure measurements: Development of a measurement system using computer vision
and a far-field microscope," in Advances in fatigue crack closure measurement and
analysis: second volume, ASTM STP 1343, pp. 145-156, 1999.
[69] W. Riddell, R. Piascik, M. Sutton, W. Zhao, S. McNeill, and J. Helm, "Determining fatigue
crack opening loads from near-crack-tip displacement measurements," in Advances in
Fatigue Crack Closure Measurement and Analysis: Second Volume, ASTM STP 1343, pp.
157-174, 1999.
[70] J. M. Larsen, J. C. Williams, and A. W. Thompson, "Crack-closure effects on the growth
of small surface cracks in titanium-aluminum alloys," in Mechanics of Fatigue Crack
Closure: ASTM International, ASTM STP 982, pp. 149-167, 1988.
[71] S. Hudak and D. L. Davidson, "The dependence of crack closure on fatigue loading
variables," in Mechanics of Fatigue Crack Closure, ASTM STP 982, pp. 121-139, 1988.
[72] J. E. Allison, R. C. Ku, and M. A. Pompetzki, "A comparison of measurement methods and
numerical procedures for the experimental characterization of fatigue crack closure," in
Mechanics of Fatigue Crack Closure, ASTM STP 982, pp. 171-185, 1988.
121
[73] H. O. Liknes and R. R. Stephens, "Effect of geometry and load history on fatigue crack
growth in Ti-62222," in Fatigue Crack Growth Thresholds, Endurance Limits, and Design,
ASTM STP 1372, pp. 175-191, 2000.
[74] P. C. Paris, H. Tada, and J. K. Donald, "Service load fatigue damage—a historical
perspective," International journal of fatigue, vol. 21, pp. S35-S46, 1999.
[75] N. Fleck, "Influence of stress state on crack growth retardation," Basic Questions in
Fatigue., vol. 1, pp. 157-183, 1984.
[76] D. Chen, B. Weiss, and R. Stickler, "Effect of stress ratio and loading condition on the
fatigue threshold," International journal of fatigue, vol. 14, no. 5, pp. 325-329, 1992.
[77] D. Chen, B. Weiss, and R. Stickler, "Contribution of the cyclic loading portion below the
opening load to fatigue crack growth," Materials Science and Engineering: A, vol. 208, no.
2, pp. 181-187, 1996.
[78] D. Chen, B. Weiss, and R. Stickler, "A model for crack closure," Engineering Fracture
Mechanics, vol. 53, no. 4, pp. 493-509, 1996.
[79] J. K. Donald, "Introducing the compliance ratio concept for determining effective stress
intensity," International journal of fatigue, vol. 19, no. 93, pp. 191-195, 1997.
[80] C. D. Carman, C. C. Turner, and B. M. Hillberry, "A method for determining crack opening
load from load-displacement data," in Mechanics of Fatigue Crack Closure, ASTM STP
982, pp. 214-221, 1988.
[81] W. Yisheng and J. Schijve, "Fatigue crack closure measurements on 2024-T3 sheet
specimens " Fatigue & Fracture of Engineering Materials & Structures, vol. 18, no. 9, pp.
917-921, 1995.
[82] K. Donald and P. C. Paris, "An evaluation of ΔKeff estimation procedures on 6061-T6 and
2024-T3 aluminum alloys," International journal of fatigue, vol. 21, pp. S47-S57, 1999.
[83] G. H. Bray and J. K. Donald, "Separating the influence of Kmax from closure-related stress
ratio effects using the adjusted compliance ratio technique," in Advances in Fatigue Crack
Closure Measurement and Analysis: Second Volume, ASTM STP 1343, pp. 57-79, 1999.
122
[84] D. Kujawski, "Methods for crack opening load and crack tip shielding determination: a
review," Fatigue & Fracture of Engineering Materials & Structures, vol. 26, no. 11, pp.
1053-1067, 2003.
[85] Y. Yamada and J. Newman, "Crack-closure behavior of 2324-T39 aluminum alloy near-
threshold conditions for high load ratio and constant Kmax tests," International Journal of
Fatigue, vol. 31, no. 11, pp. 1780-1787, 2009.
[86] R. Hertzberg, C. Newton, and R. Jaccard, "Crack closure: correlation and confusion,"
Mechanics of fatigue crack closure, ASTM STP 982, pp. 139-148, 1988.
[87] A. Vasudevan, K. Sadananda, and N. Louat, "Reconsideration of fatigue crack closure,"
Scripta metallurgica et materialia, vol. 27, pp. 1673-1678, 1992.
[88] A. Vasudevan and K. Sadananda, "Classification of fatigue crack growth behavior,"
Metallurgical and Materials Transactions A, vol. 26, no. 5, pp. 1221-1234, 1995.
[89] R. Pippan, H. Stüwe, and K. Golos, "A comparison of different methods to determine the
threshold of fatigue crack propagation," International journal of fatigue, vol. 16, no. 8, pp.
579-582, 1994.
[90] A. Noroozi, G. Glinka, and S. Lambert, "A two parameter driving force for fatigue crack
growth analysis," International journal of fatigue, vol. 27, no. 10, pp. 1277-1296, 2005.
[91] A. Noroozi, G. Glinka, and S. Lambert, "A study of the stress ratio effects on fatigue crack
growth using the unified two-parameter fatigue crack growth driving force," International
journal of fatigue, vol. 29, no. 9, pp. 1616-1633, 2007.
[92] G. Marci, "Effect of the active plastic zone on fatigue crack growth rates," in Fracture
Mechanics: Proceedings of the Eleventh National Symposium on Fracture Mechanics: Part
I, ASTM STP 677, pp. 168-186, 1979.
[93] H. Döker and G. Marci, "Threshold range and opening stress intensity factor in fatigue,"
International journal of fatigue, vol. 5, no. 4, pp. 187-191, 1983.
[94] G. Marci, "The ΔK eff-concept: A unique and complete description of fatigue crack
propagation," Engineering Fracture Mechanics, vol. 55, no. 1, pp. 95-114, 1996.
[95] S. D. Antolovich, A. Saxena, and G. R. Chanani, "A model for fatigue crack propagation,"
Engineering Fracture Mechanics, vol. 7, no. 4, pp. 649-652, 1975.
123
[96] H. Neuber, "Theory of stress concentration for shear-strained prismatical bodies with
arbitrary nonlinear stress-strain law," Journal of Applied Mechanics, vol. 28, pp. 544-549,
1961.
[97] G. Dieter, E., Mechanical Metallurgy, 3rd ed. McGraw-Hill, pp. 287-288, 1986.
[98] S. Majumdar and J. Morrow, "Correlation between fatigue crack propagation and low cycle
fatigue properties," Fracture toughness and slow-stable cracking, ASTM STP 559, pp. 159-
182, 1974.
[99] K. Smith, T. Topper, and P. Watson, "A stress-strain function for the fatigue of
metals(Stress-strain function for metal fatigue including mean stress effect)," Journal of
materials, vol. 5, pp. 767-778, 1970.
[100] G. Glinka, "A notch stress-strain analysis approach to fatigue crack growth," Engineering
Fracture Mechanics, vol. 21, no. 2, pp. 245-261, 1985.
[101] R. G. Forman, V. Kearney, and R. Engle, "Numerical analysis of crack propagation in
cyclic-loaded structures," Journal of Basic Engineering, vol. 89, no. 3, pp. 459-463, 1967.
[102] A. McEvily, "Current aspects of fatigue," Metal Science, vol. 11, no. 8-9, pp. 274-284, 1977.
[103] M. Skorupa, "Load interaction effects during fatigue crack growth under variable amplitude
loading—a literature review. Part II: qualitative interpretation," Fatigue & Fracture of
Engineering Materials & Structures, vol. 22, no. 10, pp. 905-926, 1999.
[104] K. D. Singh, M. R. Parry, and I. Sinclair, "Variable amplitude fatigue crack growth
behavior—a short overview," Journal of mechanical science and technology, vol. 25, no.
3, pp. 663-673, 2011.
[105] W. Geary, "A review of some aspects of fatigue crack growth under variable amplitude
loading," International Journal of Fatigue, vol. 14, no. 6, pp. 377-386, 1992.
[106] R. I. Stephens, D. K. Chen, and B. W. Hom, "Fatigue crack growth with negative stress
ratio following single overloads in 2024-T3 and 7075-T6 aluminum alloys," Fatigue crack
growth under spectrum loads, ASTM STP 595, 1976.
[107] E. Von Euw, R. Hertzberg, and R. Roberts, "Delay effects in fatigue crack propagation,"
stress analysis and growth of cracks: proceedings of the 1971 national symposium on
fracture mechanics: part 1, ASTM STP 513, pp. 230-259, 1972.
124
[108] M. Skorupa, "Load interaction effects during fatigue crack growth under variable amplitude
loading—a literature review. Part I: empirical trends," Fatigue & Fracture of Engineering
Materials & Structures, vol. 21, no. 8, pp. 987-1006, 1998.
[109] W. J. Mills and R. W. Hertzberg, "Load interaction effects on fatigue crack propagation in
2024-T3 aluminum alloy," Engineering Fracture Mechanics, vol. 8, no. 4, pp. 657-664,
IN15-IN16, 665-667, 1976.
[110] C. Ward-Close and R. Ritchie, "On the Role of Crack Closure Mechanisms in Influencing
Fatigue Crack Growth Following Tensile Overloads in a Titanium Alloy: Near Threshold
Versus Higher AK Behavior," Mechanics of Fatigue Crack Closure, ASTM STP 982, pp.
93-111, 1988.
[111] D. M. Shuter and W. Geary, "Some aspects of fatigue crack growth retardation behaviour
following tensile overloads in a structural steel," Fatigue & Fracture of Engineering
Materials & Structures, vol. 19, no. 2‐3, pp. 185-199, 1996.
[112] Y. K. Tür and Ö. Vardar, "Periodic tensile overloads in 2024-T3 Al-alloy," Engineering
Fracture Mechanics, vol. 53, no. 1, pp. 69-77, 1996.
[113] S. Hopkins and C. Rau, "Effect of Various Programmed Overloads on the Threshold for
High-Frequency Fatigue Crack Growth," Fatigue Crack Growth Under Spectrum Loads,
ASTM STP 595, pp. 125-141,1976.
[114] E. Zaiken and R. Ritchie, "On the development of crack closure and the threshold condition
for short and long fatigue cracks in 7150 aluminum alloy," Metallurgical and Materials
Transactions A, vol. 16, no. 8, pp. 1467-1477, 1985.
[115] Ö. Vardar and N. Yildirim, "Crack growth retardation due to intermittent overloads,"
International Journal of Fatigue, vol. 12, no. 4, pp. 283-287, 1990.
[116] N. A. Fleck, "Fatigue crack growth due to periodic underloads and overloads," Acta
Metallurgica, vol. 33, no. 7, pp. 1339-1354, 1985.
[117] N. Ohrloff, A. Gysler, and G. Lutjering, "Fatigue crack propagation behaviour under
variable amplitude loading," Fatigue Crack Growth Under Variable Amplitude Loading
(edited by J. Petit, D. L. Davidson, S. Suresh and P. Rabbe), Elsevier Applied Science,
London, pp. 24-34, 1988.

125
[118] C. Robin, M. L. Busch, M. Chergui, H. P. Lieurade, and G. Pluvinage, "Influence of series
of tensile and compressive overloads on 316L crack growth," Fatigue Crack Growth Under
Variable Amplitude Loading, pp. 87-97, 1988.
[119] M. L. Busch and J. L. Lebrun, "X-ray diffraction study of stress distributions following a
single tensile overload," Fatigue Crack Growth Under Variable Amplitude Loading, pp.
76-86, 1988.
[120] T. H. Topper and M. T. Yu, "The effect of overloads on threshold and crack closure,"
International Journal of Fatigue, vol. 7, no. 3, pp. 159-164, 1985.
[121] K. T. V. Rao and R. Ritchie, "Mechanisms for the Retardation of Fatigue Cracks Following
Single Tensile Overloads Behavior in Aluminum-Lithium Alloys," 1988.
[122] J. Schijve, "Fatigue cracks, plasticity effects and crack closure," Engineering Fracture
Mechanics, vol. 11, no. 1, pp. 182-196, 1979.
[123] K. Venkateswara Rao and R. Ritchie, "Micromechanisms of transient fatigue crack growth
behaviour in aluminium-lithium alloys following single tensile overloads," Fatigue crack
growth under variable amplitude loading. London: Elsevier Applied Science, pp. 134-145,
1988.
[124] C. S. Shin and S. H. Hsu, "On the mechanisms and behaviour of overload retardation in
AISI 304 stainless steel," International journal of fatigue, vol. 15, no. 3, pp. 181-192, 1993.
[125] J. Schijve, "The effect of pre-strain on fatigue crack growth and crack closure," Engineering
Fracture Mechanics, vol. 8, no. 4, pp. 575-581, 1976.
[126] R. E. Jones, "Fatigue crack growth retardation after single-cycle peak overload in Ti-6Al-
4V titanium alloy," Engineering Fracture Mechanics, vol. 5, no. 3, pp. 585-604, 1973.
[127] J. F. Knott and A. C. Pickard, "Effects of overloads on fatigue-crack propagation:
aluminium alloys," Metal Science, vol. 11, no. 8-9, pp. 8-9, 1977.
[128] M. T. Yu, T. H. Topper, and P. Au, "The Effects of Stress Ratio, Compressive Load and
Underload on the Threshold Behavior of a 2024-T 351 Aluminium Alloy," Proceedings of
the 2nd Conference on Fatigue and Fracture Thresholds, vol. 1, pp. 179-190, 1984.
126
[129] A. A. Dabayeh, R. X. Xu, B. P. Du, and T. H. Topper, "Fatigue of cast aluminium alloys
under constant and variable-amplitude loading," International journal of fatigue, vol. 18,
no. 2, pp. 95-104, 1996.
[130] D. Damri, "The effect of underload cycling on the fatigue threshold in a structural steel,"
Scripta metallurgica et materialia, vol. 25, no. 2, pp. 283-288, 1991.
[131] D. Damri, "Some observations on the cyclic unloading effects of a fatigue crack,"
International journal of fatigue, vol. 13, no. 3, pp. 271-277, 1991.
[132] Y. Lenets and T. Nicholas, "Load history dependence of fatigue crack growth thresholds
for a Ti-alloy," Engineering Fracture Mechanics, vol. 60, no. 2, pp. 187-203, 1998.
[133] R. Koterazawa, Y. Qinsheng, W. Tian-jian, and T. Nosh, "Acceleration of fatigue crack
growth under intermittent overstressing with different mean stress levels," Fatigue &
Fracture of Engineering Materials & Structures, vol. 17, no. 9, pp. 1033-1041, 1994.
[134] R. Koterazawa and T. Nosho, "Acceleration of crack growth under intermittent
overstressing in different environments," Fatigue & Fracture of Engineering Materials &
Structures, vol. 15, no. 1, pp. 103-113, 1992.
[135] E. Zaiken and R. Ritchie, "On the role of compression overloads in influencing crack
closure and the threshold condition for fatigue crack growth in 7150 aluminum alloy,"
Engineering Fracture Mechanics, vol. 22, no. 1, pp. 35-48, 1985.
[136] T. H. Topper, D. L. DuQuesnay, and M. A. Pompetzki, "Crack closure, damage, and short
crack growth under variable amplitude loading," Theoritical Concept and Numerical
Analysis of Fatigue, pp. 201-235, 25-27 May, 1992.
[137] R. L. Carlson and G. A. Kardomateas, "Effects of compressive load excursions on fatigue
crack growth," International journal of fatigue, vol. 16, no. 2, pp. 141-146, 1994.
[138] R. Yang, "Prediction of crack growth under complex loading cycles," International journal
of fatigue, vol. 16, no. 6, pp. 397-402, 1994.
[139] M. A. Miner, "Cumulative damage in fatigue," Journal of Applied Mechanics, vol. 12, no.
3, pp. 159-164, 1945.
[140] R. I. Stephens and H. O. Fuchs, Metal fatigue in engineering. Wiley New York, 2001.
127
[141] O. Wheeler, "Spectrum loading and crack growth," Journal of Basic Engineering, vol. 94,
p. 181, 1972.
[142] J. Willenborg, R. Engle, and H. Wood, "A crack growth retardation model using an
effective stress concept," ed: Technical report of air force flight dynamics lab wright-
patterson 1971.
[143] T. Gray and J. Gallagher, "Predicting fatigue crack retardation following a single overload
using a modified Wheeler model," Mechanics of Crack Growth, ASTM STP 590, pp. 331-
344, 1976.
[144] U. H. Padmadinata, "Investigation of crack-closure prediction models for fatigue in
aluminum alloy sheet under flight-simulation loading," PhD thesis, 1990.
[145] B. Chang, R. Engle, and J. Stolpestad, "Fatigue Crack Growth Behavior and Life
Predictions for 2219-T851 Aluminum Subjected to Variable-Amplitude Loadings," p. 3,
Fracture Mechanics, ASTM STP 743, pp. 3-27, 1981.
[146] J. Chang, R. Engle, and R. Hiyama, "Application of an improved crack growth prediction
methodology on structure preliminary design," Design of Fatigue and Fracture Resistant
Structures, ASTM STP 761, pp. 278-295, 1982.
[147] M. Sander and H. Richard, "Fatigue crack growth under variable amplitude loading Part II:
analytical and numerical investigations," Fatigue & Fracture of Engineering Materials &
Structures, vol. 29, no. 4, pp. 303-319, 2006.
[148] G. Wang and A. Blom, "A modified Dugdale-Barenblatt model for fatigue crack growth
predictions under general load conditions," FFA TN, vol. 79, 1987.
[149] D. Aliaga, A. Davy, and H. Schaff, "A simple crack closure model for predicting fatigue
crack growth under flight simulation loading," Mechanics of fatigue crack closure, ASTM
STP 982, pp. 491-504, 1988.
[150] G. Baudin, R. Labourdette, and M. Robert, "Prediction of crack growth under spectrum
loadings with ONERA model," ONERA, TP, p. 18, 1988.
[151] A. De Koning, "A simple crack closure model for prediction of fatigue crack growth rates
under variable-amplitude loading," Fracture Mechanics, pp. 63-85, 1981.

128
[152] D. Dougherty, A. De Koning, and B. Hillberry, "Modelling high crack growth rates under
variable amplitude loading," Advances in fatigue lifetime predictive techniques, ASTM STP
1122, pp. 214-233, 1992.
[153] A. DeKoning and D. Dougherty, "Prediction of low and high crack growth rates under
constant and variable amplitude loading," 1988.
[154] M. Sabourin, D. Bouffard, and F. Paquet, "Life prediction of hydraulic runners using
fracture mechanics analysis," in Waterpower XV, Chattanooga, Tennessee, 2007.
[155] M. Gagnon, S. A. Tahan, P. Bocher, and D. Thibault, "Impact of startup scheme on Francis
runner life expectancy," in 25th IAHR Symposium on Hydraulic Machinery and Systems,
September 20, 2010 - September 24, 2010, Timisoara, Romania, 2010, vol. 12: Institute of
Physics Publishing.
[156] M. Gagnon and D. Thibault, "Response Spectra and Expected Fatigue Reliability: A Look
at Hydroelectric Turbines Behavior," Procedia Engineering, vol. 133, pp. 613-621, 2015.
[157] M. Gagnon, S. Tahan, P. Bocher, and D. Thibault, "Impact of startup scheme on Francis
runner life expectancy," IOP Conference Series: Earth and Environmental Science, vol. 12,
no. 1, p. 012107, 2010.
[158] ASTM.E8/E8M, Standard Test Methods for Tension Testing of Metallic Materials, 2011.
[159] J. Schijve, "Four lectures on fatigue crack growth," Delft University of Technology1977.
[160] ASTM.E647, Standard Test Method for Measurement of Fatigue Crack Growth Rates, 2011.
[161] A. Saxena, S. Hudak, J. Donald, and D. Schmidt, "Computer-controlled decreasing stress
intensity technique for low rate fatigue crack growth testing," Journal of Testing and
Evaluation, vol. 6, pp. 167-174, 1978.
[162] A. Saxena and S. J. Hudak, "Review and extension of compliance information for common
crack growth specimens," International Journal of Fracture, vol. 14, no. 5, pp. 453-468,
1978.
[163] J. E. Srawley, "Wide range stress intensity factor expressions for ASTM E 399 standard
fracture toughness specimens," International Journal of Fracture, vol. 12, no. 3, pp. 475-
476, 1976.
129
[164] S. C. Forth, J. C. Newman Jr, and R. G. Forman, "On generating fatigue crack growth
thresholds," International journal of fatigue, vol. 25, no. 1, pp. 9-15, 2003.
[165] G. Marci, "Fatigue crack propagation threshold: what is it and how is it measured?," Journal
of testing and evaluation, vol. 26, no. 3, pp. 220-233, 1998.
[166] J. Colin, A. Fatemi, and S. Taheri, "Fatigue behavior of stainless steel 304L including strain
hardening, prestraining, and mean stress effects," Journal of Engineering Materials and
Technology, vol. 132, no. 2, p. 021008, 2010.
[167] J. E. Allison, R. C. Ku, and M. A. Pompetzki, "A comparison of measurement methods and
numerical procedures for the experimental characterization of fatigue crack closure," in
Mechanics of Fatigue Crack Closure: ASTM International, 1988.
[168] M. Sabourin, D. Thibault, D. A. Bouffard, and M. Levesque, "New parameters influencing
hydraulic runner lifetime," in 25th IAHR Symposium on Hydraulic Machinery and Systems,
Timisoara, Romania, 2010, vol. 12: Institute of Physics Publishing.
[169] J. Lanteigne, M. Sabourin, T. Bui-Quoc, and D. Julien, "A comprehensive research
programme on crack propagation characteristics of the base material used in hydraulic
turbine runnners," presented at the Waterpower XV, Chattanooga, USA, 2007.
[170] J. Lanteigne, M. Sabourin, T. Bui-Quoc, and D. Julien, "The characteristics of the steels
used in hydraulic turbine runners," IAHR 24th Symposium on Hydraulic Machinery and
Systems, Foz Do Iguassu, Brazil, 2008.
[171] V. W. Trebules, R. Roberts, and R. Hertzberg, "Effect of multiple overloads on fatigue
crack propagation in 2024-T3 aluminum alloy," Progress in flaw growth and fracture
toughness testing, ASTM STP 536, pp. 115-146, 1973.
[172] T. Iwasaki, A. Katou, and M. Kawahara, "Fatigue crack growth under random loading,"
Naval Architecture and Ocean Engineering, vol. 20, pp. 194-216, 1982.
[173] T. Nicholas, High Cycle Fatigue : a Mechanics of Materials Perspective. Elsevier, pp. 191-
193, 2006.
[174] B. Powell and T. Duggan, "Crack growth in Ti-6Al-4V under the conjoint action of high
and low cycle fatigue," International Journal of Fatigue, vol. 9, no. 4, pp. 195-202, 1987.
130
[175] A. A. Dabayeh and T. H. Topper, "Changes in crack-opening stress after underloads and
overloads in 2024-T351 aluminium alloy," International journal of fatigue, vol. 17, no. 4,
pp. 261-269, 1995.
[176] J. Schijve, "The significance of fractography for investigations of fatigue crack growth
under variable-amplitude loading," Fatigue and Fracture of Engineering Materials and
Structures, vol. 22, no. 2, pp. 87-100, 1999.
[177] J. C. McMillan and R. Pelloux, "Fatigue crack propagation under programmed and random
loads," Fatigue crack propagation, ASTM STP 415, pp. 505-535, 1966.
[178] M. J. Doré and S. J. Maddox, "Accelerated Fatigue Crack Growth in 6082 T651 Aluminium
Alloy Subjected to Periodic Underloads," Procedia Engineering, vol. 66, pp. 313-322, 2013.
[179] T. L. Anderson and T. Anderson, Fracture mechanics: fundamentals and applications.
CRC press, 2005.
[180] M. Fine and R. Ritchie, "Fatigue-crack initiation and near-threshold crack growth," Fatigue
and Microstructure, pp. 245-278, 1979.
[181] S. Majumdar and J. Morrow, "Correlation between fatigue crack propagation and low cycle
fatigue properties," ASTM STP, vol. 559, pp. 159-182, 1974.
[182] R. A. Young, The Rietveld Method, 1st ed. Oxford University Press, pp. 1-38, 1993.
[183] W. D. Callister and D. G. Rethwisch, Materials Science and Engineering: an Introduction.
Wiley New York, 2007.
[184] ASTM.E384, Standard Test Method for Knoop and Vickers Hardness of Materials, 2012.
[185] ASTM.E1382, Standard Test Methods for Determining Average Grain Size Using
Semiautomatic and Automatic Image Analysis, 2004.
[186] D. Thibault, P. Bocher, M. Thomas, M. Gharghouri, and M. Côté, "Residual stress
characterization in low transformation temperature 13% Cr–4% Ni stainless steel weld by
neutron diffraction and the contour method," Materials Science and Engineering: A, vol.
527, no. 23, pp. 6205-6210, 2010.
[187] D. Thibault, P. Bocher, and M. Thomas, "Residual stress and microstructure in welds of
13% Cr–4% Ni martensitic stainless steel," Journal of Materials Processing Technology,
vol. 209, no. 4, pp. 2195-2202, 2009.
131
[188] J. Newman Jr and I. Raju, "An empirical stress-intensity factor equation for the surface
crack," Engineering Fracture Mechanics, vol. 15, no. 1, pp. 185-192, 1981.
[189] J. Barsom, "Fatigue crack growth under variable amplitude loading in various bridge
steels," Fatigue crack growth under spectrum loads, ASTM STP 595, pp. 217-235, 1976.
[190] S. Suresh, "Crack deflection: implications for the growth of long and short fatigue cracks,"
Metallurgical Transactions A, vol. 14, no. 11, pp. 2375-2385, 1983.
[191] M. Hassanipour, Y. Verreman, J. Lanteigne, and J. Q. Chen, "Effect of Periodic Underloads
on Fartigue Crack Growth in Three Steels Used in Hydraulic Turbine Runners,"
International journal of fatigue, vol. 85, pp. 40-48, 2015.
[192] S. Hudak Jr, A. Saxena, R. Bucci, and R. Malcolm, "Development of standard methods of
testing and analyzing fatigue crack growth rate data," Technical Report AFML-TR-78-40,
Westinghouse R&D Center, Westinghouse Electric Corporation, Pittsburgh, PA, pp. 103-
107, 1978.
[193] R. W. Bush, J. K. Donald, and R. J. Bucci, "Pitfalls to avoid in threshold testing and its
interpretation," Fatigue Crack Growth Thresholds, Endurance Limits, and Design, ASTM
STP 1372, pp. 269-284, 2000.
[194] H. Doker, V. Bachmann, and G. Marci, "A comparison of different methods of
determination of the threshold for fatigue crack propagation," in International Symposium
on Fatigue Thresholds, Warley, UK, vol. 1, pp. 45-58, 1981.
[195] G. Marci, D. Castro, and V. Bachmann, "Fatigue crack propagation threshold," Journal of
Testing and Evaluation, vol. 17, no. 1, pp. 28-39, 1989.
[196] G. Marci, D. Castro, and V. Bachmann, "Closure measurements via a generalized threshold
concept," Fracture Mechanics: Twenty-First Symposium, ASTM STP 1074, no. 1074, pp.
563-580, 1990.
[197] G. Marci, "Fatigue crack growth threshold concept and test results for Al- and Ti-alloys,"
Fatigue Crack Growth Thresholds, Endurance Limits and Design, ASTM STP 1372, pp.
81-95, 2000.
132
[198] J. Newman, W. Riddell, and R. Piascik, "Effects of Kmax on Fatigue Crack Growth
Threshold in Aluminum Alloys," Fatigue crack growth thresholds, endurance limits, and
design, ASTM STP 1372, pp. 63-80, 2000.
[199] A. Tesch, R. Pippan, and H. Döker, "New testing procedure to determine da/dN–ΔK curves
at different, constant R-values using one single specimen," International journal of fatigue,
vol. 29, no. 7, pp. 1220-1228, 2007.
[200] B. Powell, M. Hawkyard, and L. Grabowski, "The growth of cracks in Ti–6Al–4V plate
under combined high and low cycle fatigue," International journal of fatigue, vol. 19, no.
93, pp. 167-176, 1997.
[201] P.A. Deschenes, "private discussion, "Fatigue crack propagation in a residual stress field",
MSc Thesis," École polytechnique de Montréal, Université de Montréal, to be published in
2016.
[202] J. Colin, A. Fatemi, and S. Taheri, "Cyclic hardening and fatigue behavior of stainless steel
304L," Journal of Materials Science, vol. 46, no. 1, pp. 145-154, 2011.
[203] P. Robichaud, "Master thesis," École de technologie supérieure, Université du Québec,
2007.
[204] M. A. Pompetzki, T. H. Topper, and D. L. DuQuesnay, "The effect of compressive
underloads and tensile overloads on fatigue damage accumulation in SAE 1045 steel,"
International journal of fatigue, vol. 12, no. 3, pp. 207-213, 1990.
[205] G. Marci, "Fatigue crack growth threshold concept and test results for Al-and Ti-alloys," in
Fatigue Crack Growth Thresholds, Endurance Limits, and Design: ASTM International,
2000.
[206] D. Taylor, "Fatigue thresholds: their applicability to engineering situations," International
journal of fatigue, vol. 10, no. 2, pp. 67-79, 1988.