three studies to drive campus conversations on student success/media/files/sbccd/chc/about...
TRANSCRIPT
Research to Drive Campus Conversations on Student Success
Prepared by Keith Wurtz
Director, Office of Research & Planning
Today we’ll cover:
• Working toward a “Culture of Inquiry” - Data, Evidence, College Decision-making, Student Success, and You…
• Strategies Related to Student Success
• Equity Research
• Basic Skills Improvement
Ground Rules
• Ask lots of questions – especially nagging and tough ones
• Data doesn’t make meaning; we make meaning from data
Data, Evidence, College Decision-making, Student Success, and You…
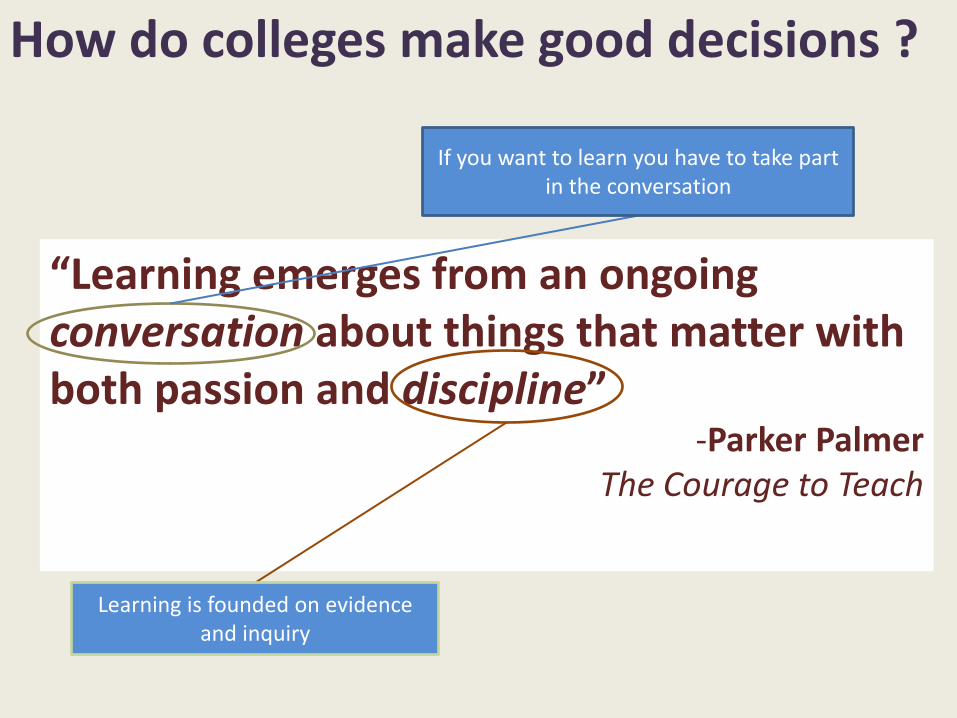
How do colleges make good decisions ?
“Learning emerges from an ongoing conversation about things that matter with both passion and discipline”
-Parker PalmerThe Courage to Teach
If you want to learn you have to take part in the conversation
Learning is founded on evidence and inquiry
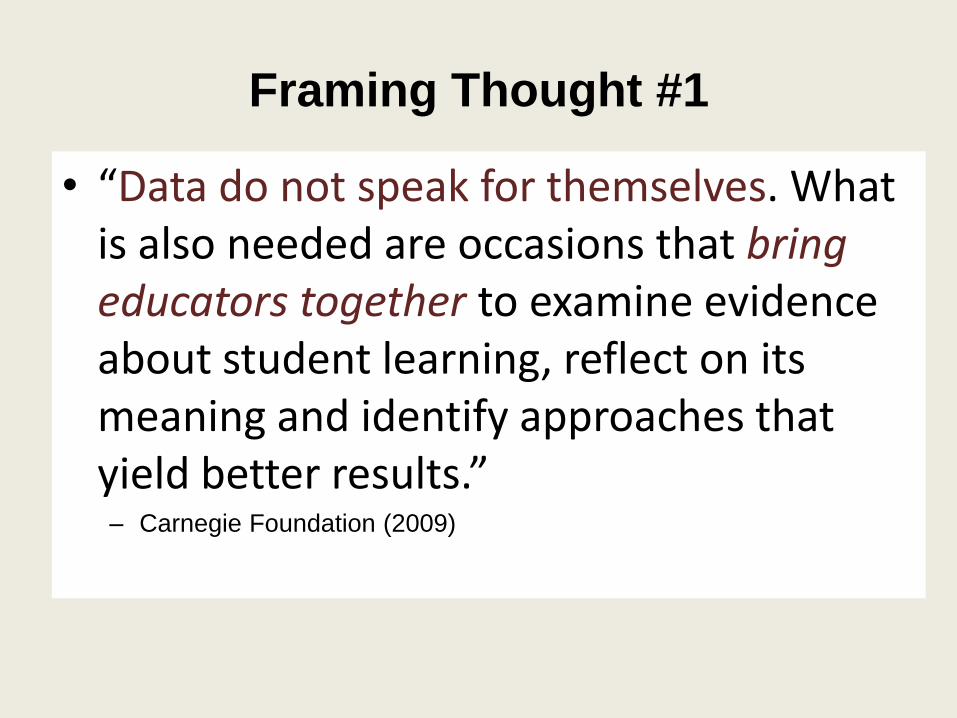
Framing Thought #1
• “Data do not speak for themselves. What is also needed are occasions that bring educators together to examine evidence about student learning, reflect on its meaning and identify approaches that yield better results.”– Carnegie Foundation (2009)
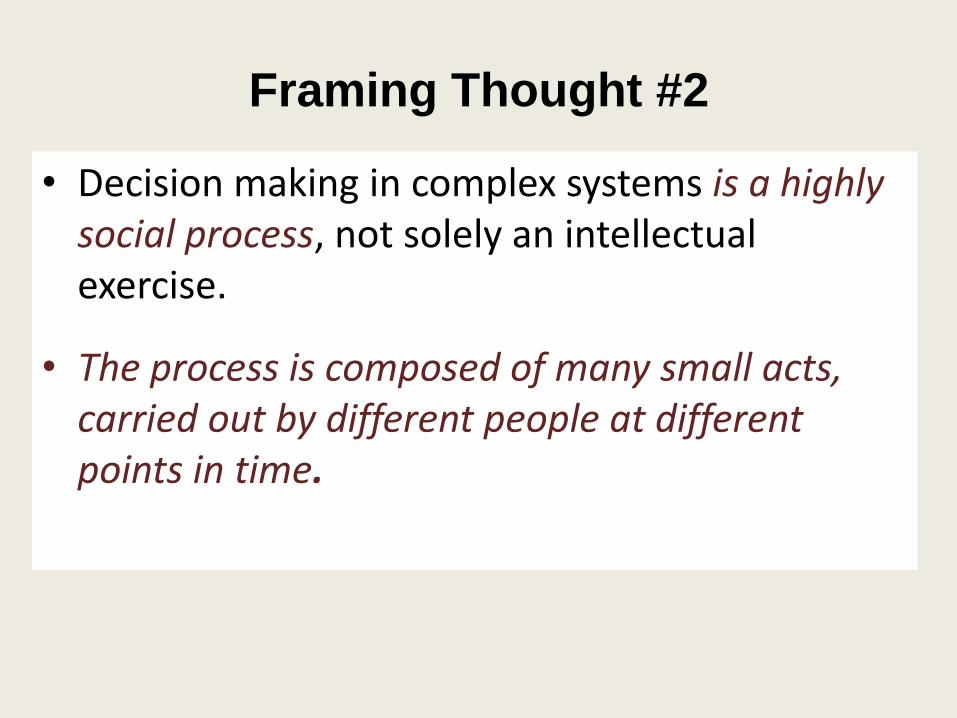
Framing Thought #2
• Decision making in complex systems is a highly social process, not solely an intellectual exercise.
• The process is composed of many small acts, carried out by different people at different points in time.
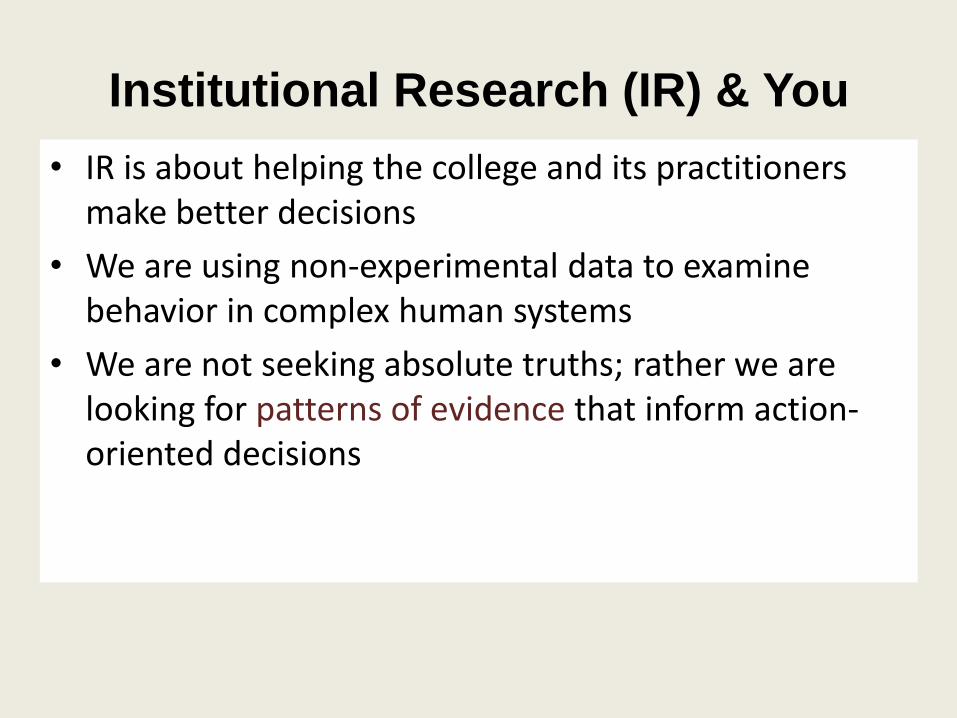
Institutional Research (IR) & You
• IR is about helping the college and its practitioners make better decisions
• We are using non-experimental data to examine behavior in complex human systems
• We are not seeking absolute truths; rather we are looking for patterns of evidence that inform action-oriented decisions
Office of Research & PlanningMission Statement
• “The purpose of the Crafton Hills College Office of Research and Planning is to collaborate with faculty, administration, staff, and students to provide high quality educational programs and services by integrating institutional research, planning, analysis, and systematic assessment to inform evidenced-based decision making and learning…”
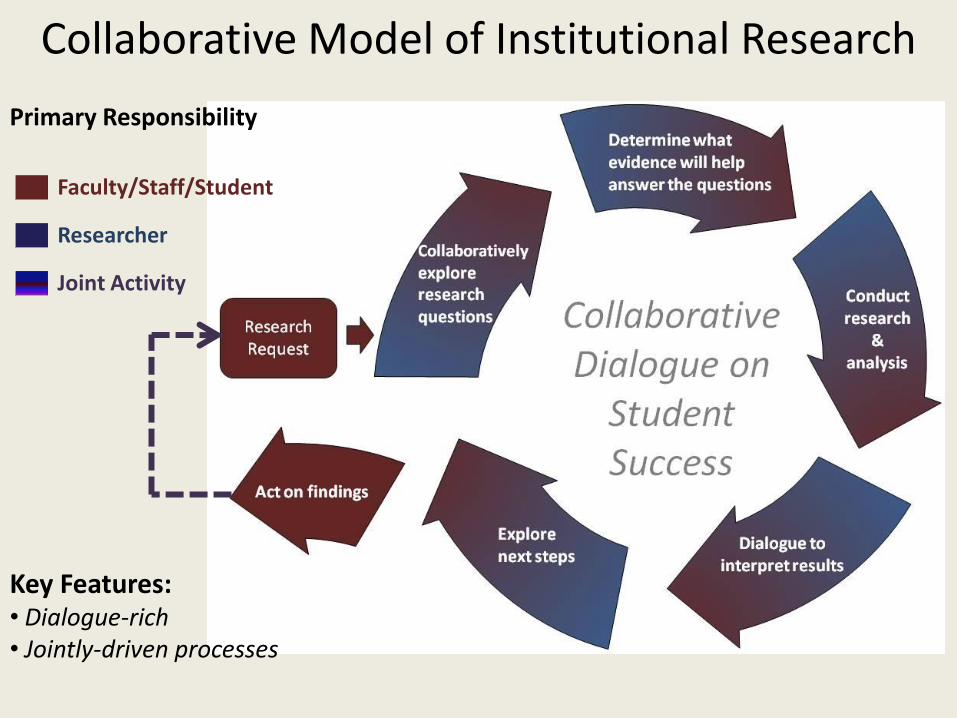
Collaborative Model of Institutional Research
Faculty/Staff/Student
Researcher
Joint Activity
Primary Responsibility
Key Features:• Dialogue-rich• Jointly-driven processes
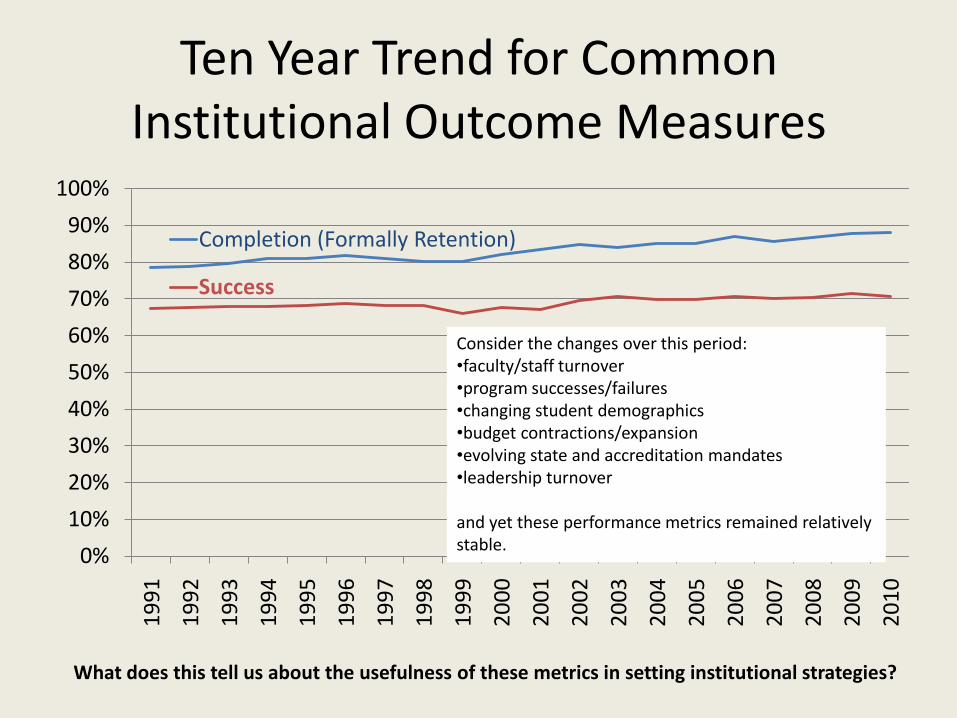
Ten Year Trend for Common Institutional Outcome Measures
0%
10%
20%
30%
40%
50%
60%
70%
80%
90%
100%
19
91
19
92
19
93
19
94
19
95
19
96
19
97
19
98
19
99
20
00
20
01
20
02
20
03
20
04
20
05
20
06
20
07
20
08
20
09
20
10
Completion (Formally Retention)
Success
Consider the changes over this period:•faculty/staff turnover•program successes/failures•changing student demographics•budget contractions/expansion•evolving state and accreditation mandates•leadership turnover
and yet these performance metrics remained relatively stable.
What does this tell us about the usefulness of these metrics in setting institutional strategies?
Much of what is needed to support good decision making lies beyond the current grasp of our institutional databases.
An Observation
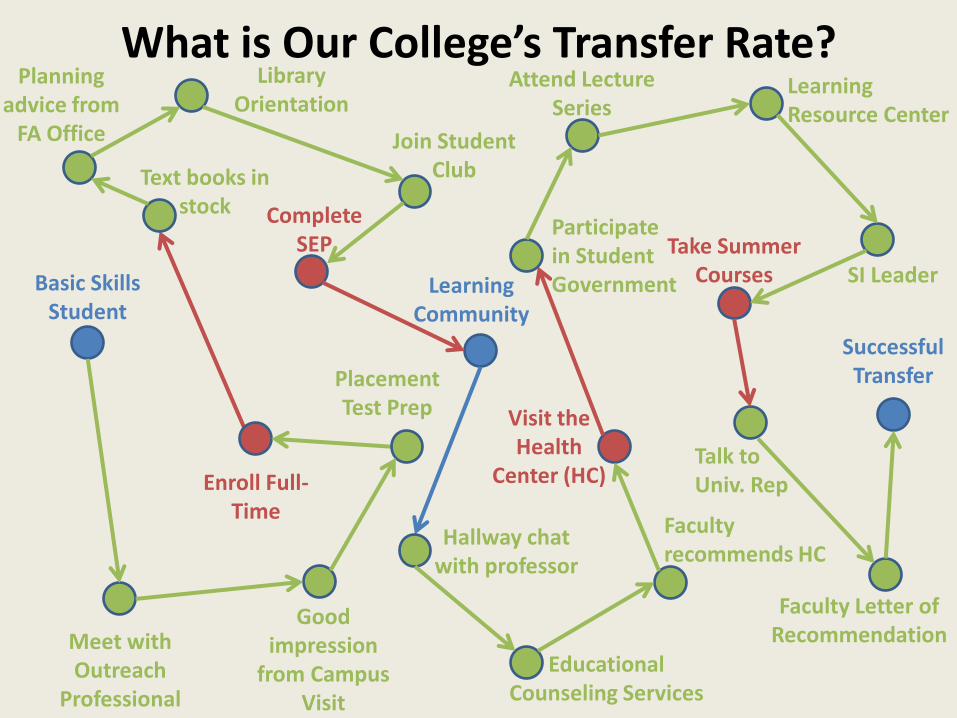
What is Our College’s Transfer Rate?
What is our college’s
transfer rate?
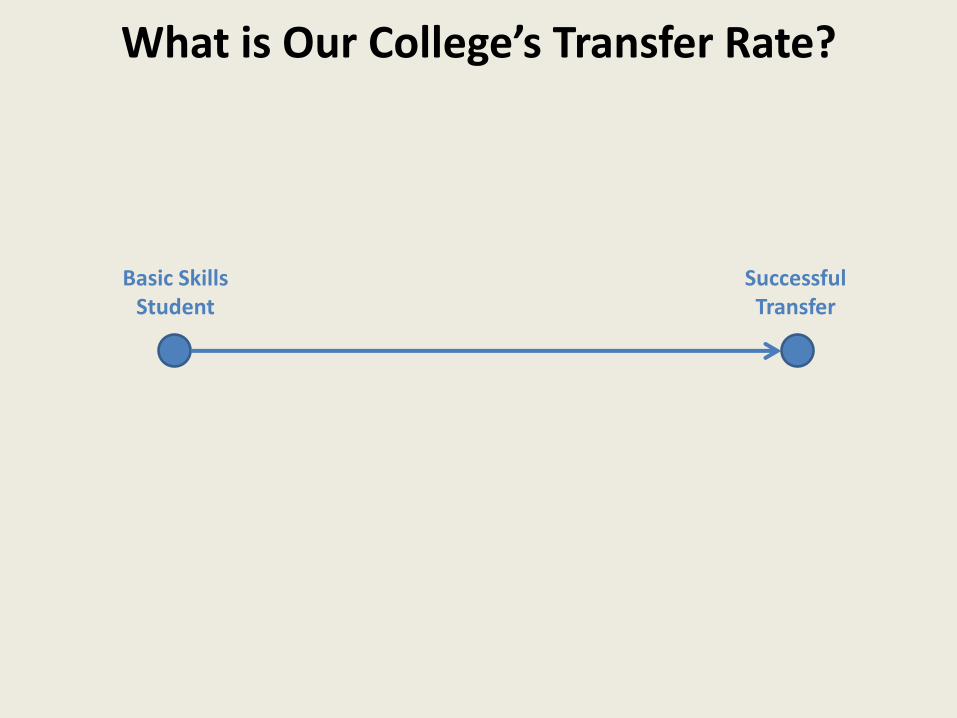
What is Our College’s Transfer Rate?
SuccessfulTransfer
Basic SkillsStudent
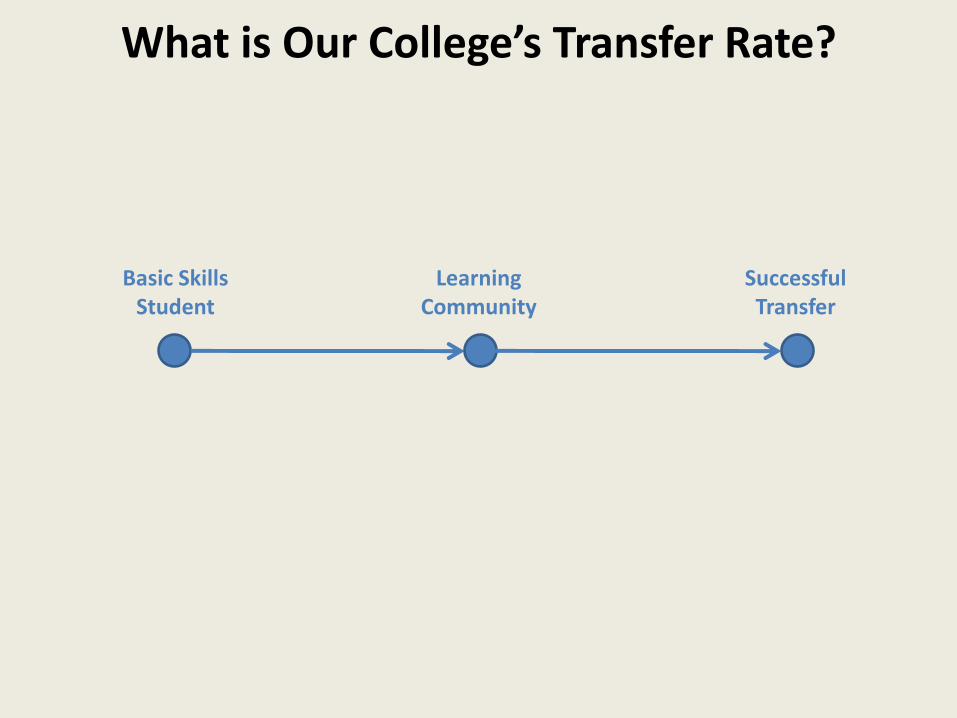
What is Our College’s Transfer Rate?
SuccessfulTransfer
Basic SkillsStudent
Learning Community
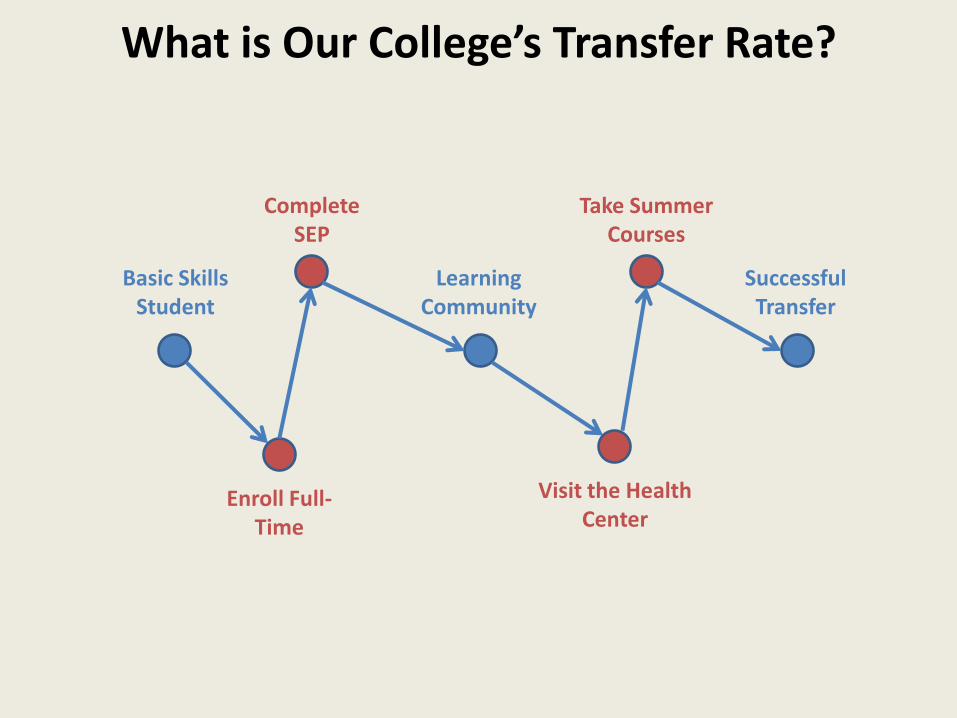
What is Our College’s Transfer Rate?
SuccessfulTransfer
Basic SkillsStudent
Learning Community
Enroll Full-Time
Complete SEP
Visit the Health Center
Take Summer Courses
What is Our College’s Transfer Rate?
SuccessfulTransfer
Basic SkillsStudent
Learning Community
Enroll Full-Time
Complete SEP
Visit the Health
Center (HC)
Take Summer Courses
Meet with Outreach
Professional
Good impression
from Campus Visit
Placement Test Prep
Text books in stock
Planning advice from
FA Office
LibraryOrientation
Join Student Club
Hallway chat with professor
Educational Counseling Services
Faculty recommends HC
Participate in Student Government
Attend Lecture Series
Learning Resource Center
SI Leader
Talk to Univ. Rep
Faculty Letter of Recommendation
A Look at Three Areas
• Strategies Related to Student Success
• Equity Research
• Basic Skills Improvement
Strategies Related to Student Success
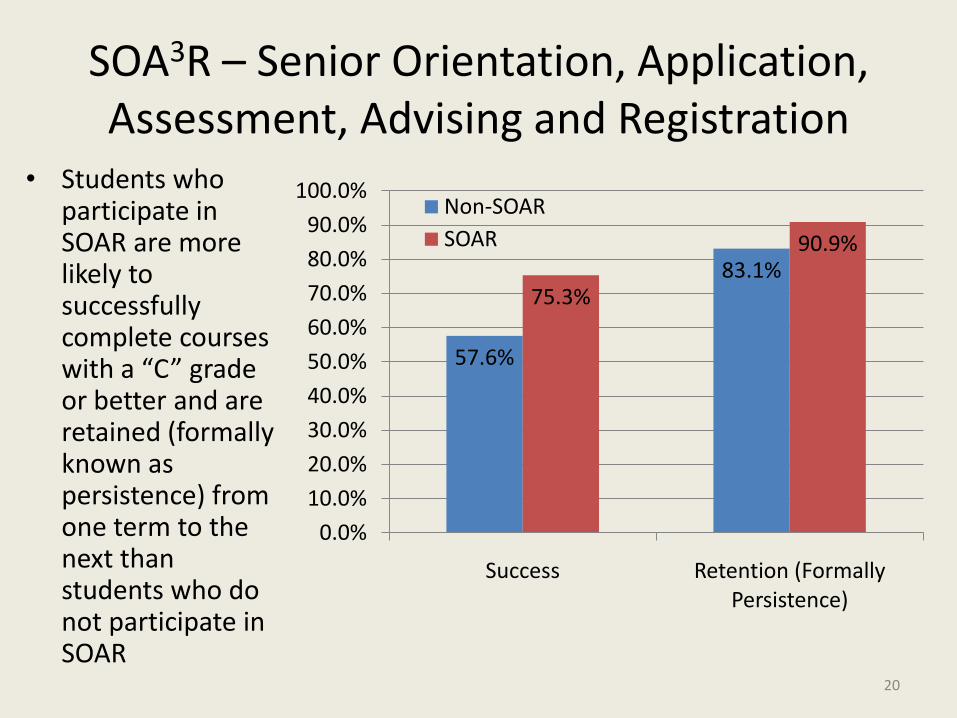
SOA3R – Senior Orientation, Application, Assessment, Advising and Registration
• Students who participate in SOAR are more likely to successfully complete courses with a “C” grade or better and are retained (formally known as persistence) from one term to the next than students who do not participate in SOAR
20
57.6%
83.1%75.3%
90.9%
0.0%
10.0%
20.0%
30.0%
40.0%
50.0%
60.0%
70.0%
80.0%
90.0%
100.0%
Success Retention (Formally Persistence)
Non-SOAR
SOAR
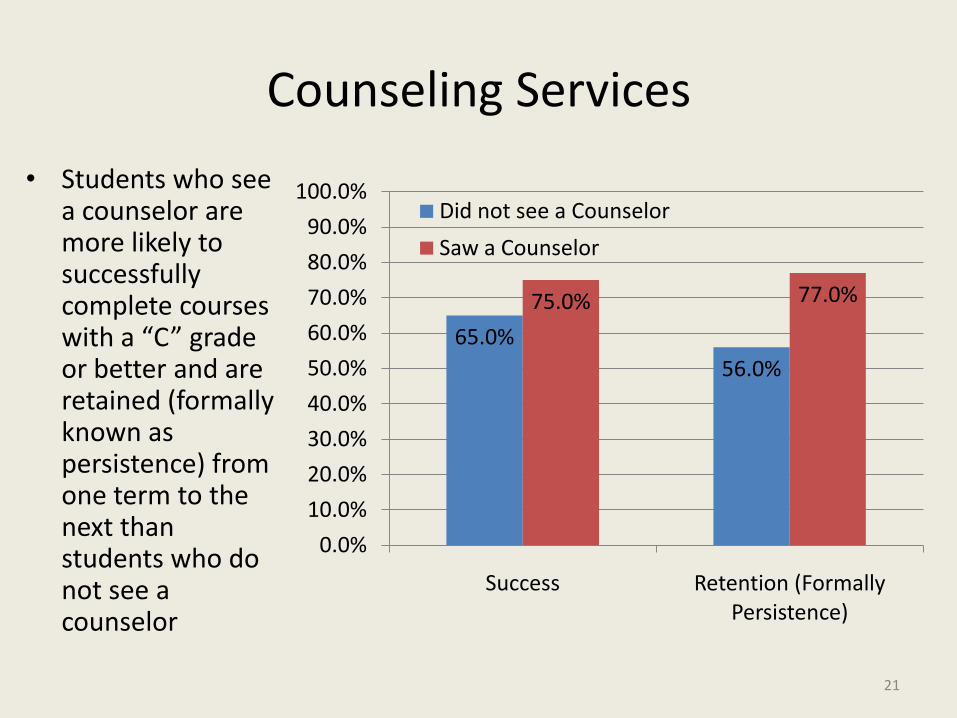
Counseling Services
• Students who see a counselor are more likely to successfully complete courses with a “C” grade or better and are retained (formally known as persistence) from one term to the next than students who do not see a counselor
21
65.0%
56.0%
75.0% 77.0%
0.0%
10.0%
20.0%
30.0%
40.0%
50.0%
60.0%
70.0%
80.0%
90.0%
100.0%
Success Retention (Formally Persistence)
Did not see a Counselor
Saw a Counselor
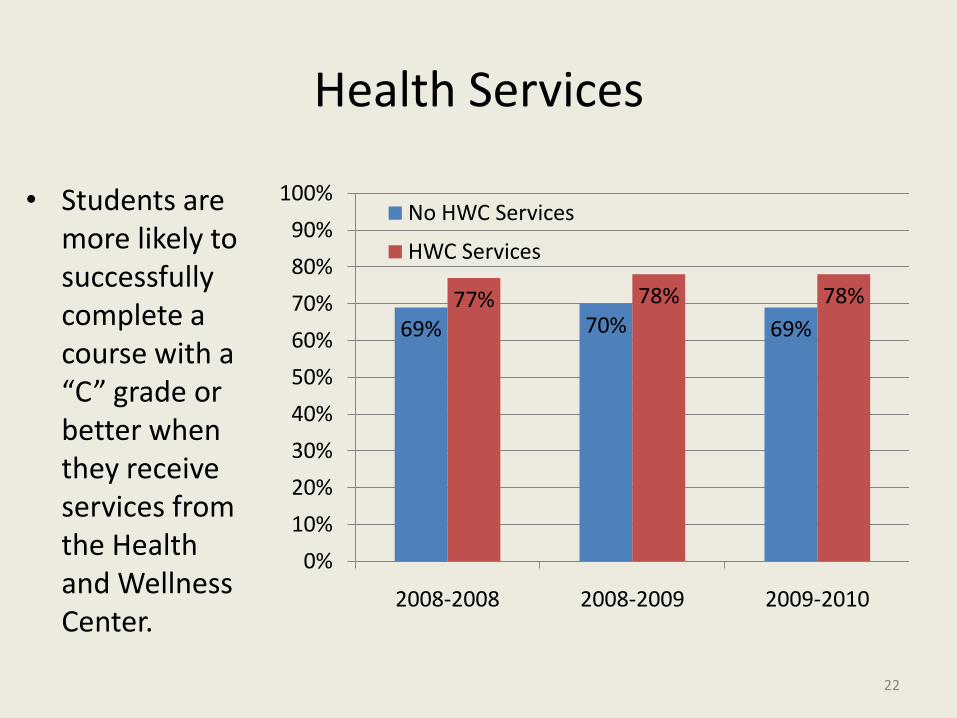
Health Services
• Students are more likely to successfully complete a course with a “C” grade or better when they receive services from the Health and Wellness Center.
22
69% 70% 69%77% 78% 78%
0%
10%
20%
30%
40%
50%
60%
70%
80%
90%
100%
2008-2008 2008-2009 2009-2010
No HWC Services
HWC Services
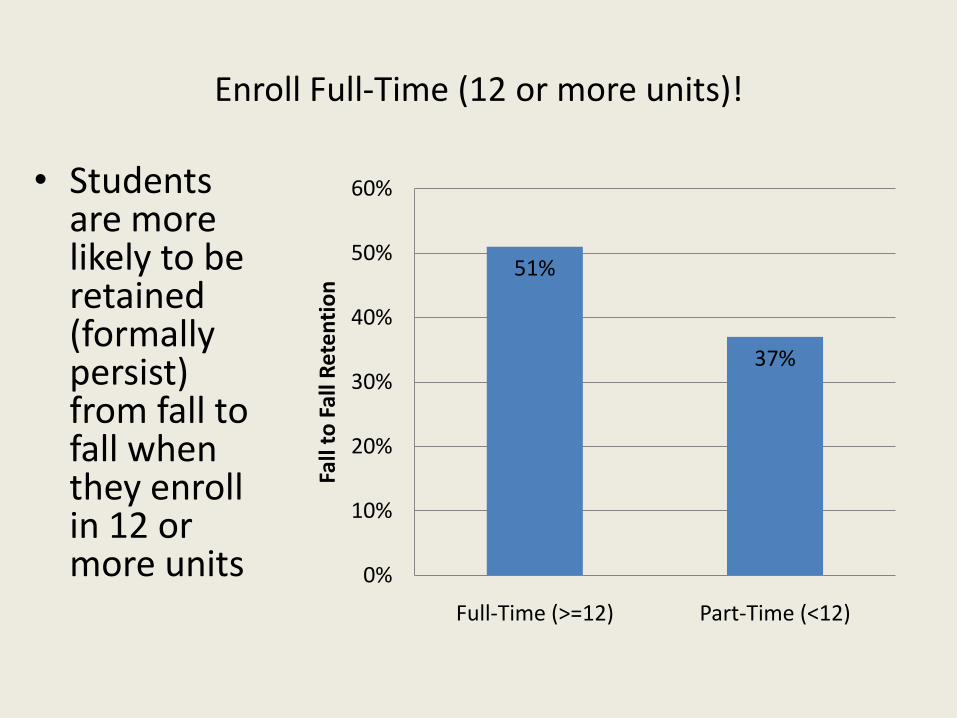
Enroll Full-Time (12 or more units)!
51%
37%
0%
10%
20%
30%
40%
50%
60%
Full-Time (>=12) Part-Time (<12)
Fall
to F
all R
ete
nti
on
• Students are more likely to be retained (formally persist) from fall to fall when they enrollin 12 or more units
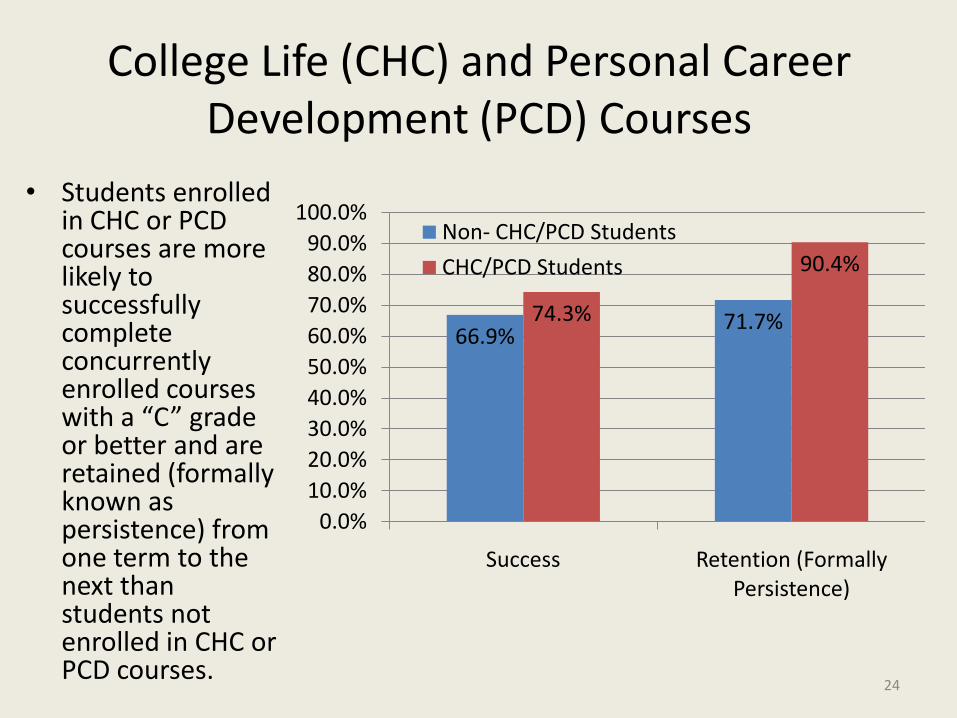
College Life (CHC) and Personal Career Development (PCD) Courses
• Students enrolled in CHC or PCD courses are more likely to successfully complete concurrently enrolled courses with a “C” grade or better and are retained (formally known as persistence) from one term to the next than students not enrolled in CHC or PCD courses.
24
66.9%71.7%74.3%
90.4%
0.0%
10.0%
20.0%
30.0%
40.0%
50.0%
60.0%
70.0%
80.0%
90.0%
100.0%
Success Retention (Formally Persistence)
Non- CHC/PCD Students
CHC/PCD Students
Learning Communities
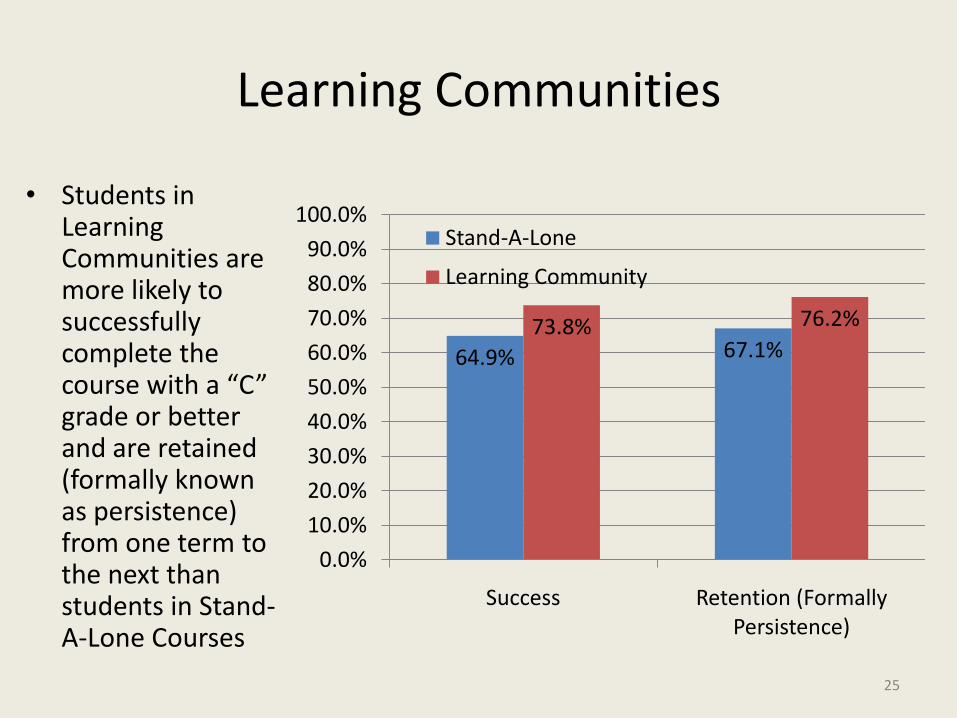
• Students in Learning Communities are more likely to successfully complete the course with a “C” grade or better and are retained (formally known as persistence) from one term to the next than students in Stand-A-Lone Courses
25
64.9% 67.1%73.8% 76.2%
0.0%
10.0%
20.0%
30.0%
40.0%
50.0%
60.0%
70.0%
80.0%
90.0%
100.0%
Success Retention (Formally Persistence)
Stand-A-Lone
Learning Community
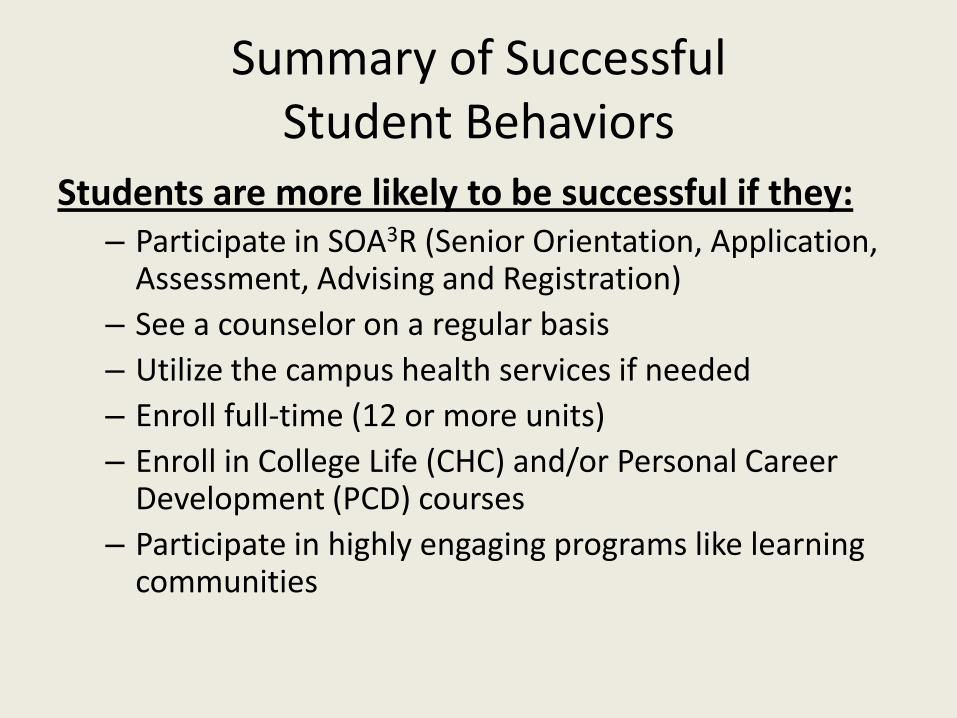
Summary of SuccessfulStudent Behaviors
Students are more likely to be successful if they:– Participate in SOA3R (Senior Orientation, Application,
Assessment, Advising and Registration)
– See a counselor on a regular basis
– Utilize the campus health services if needed
– Enroll full-time (12 or more units)
– Enroll in College Life (CHC) and/or Personal Career Development (PCD) courses
– Participate in highly engaging programs like learning communities
How can you use the research on Strategies Related to Student Success to help students?
Equity Research
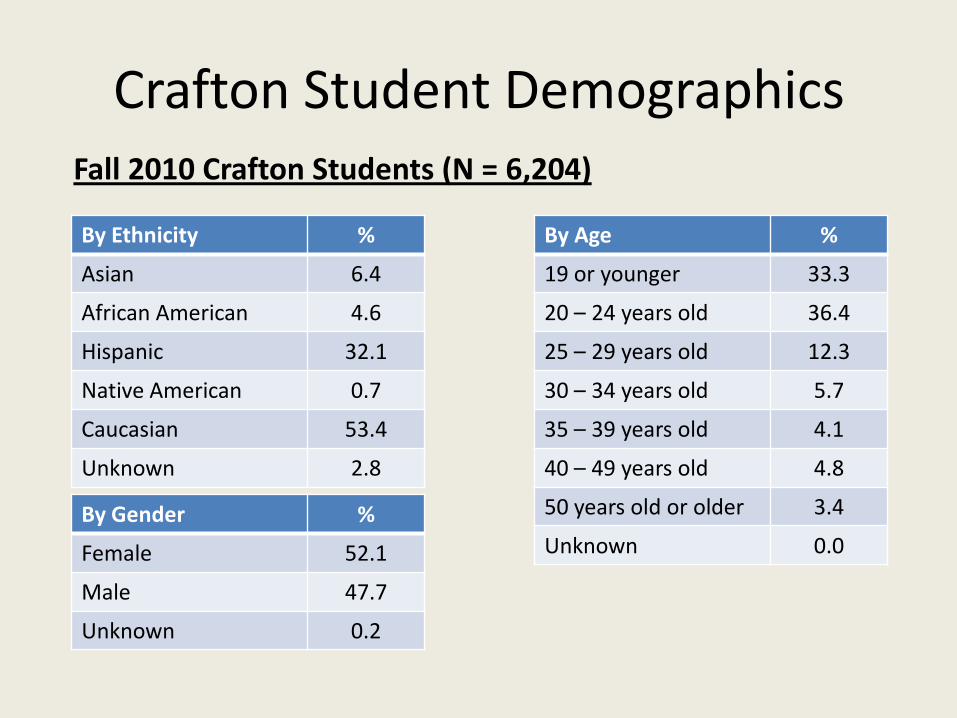
Crafton Student Demographics
By Ethnicity %
Asian 6.4
African American 4.6
Hispanic 32.1
Native American 0.7
Caucasian 53.4
Unknown 2.8
Fall 2010 Crafton Students (N = 6,204)
By Gender %
Female 52.1
Male 47.7
Unknown 0.2
By Age %
19 or younger 33.3
20 – 24 years old 36.4
25 – 29 years old 12.3
30 – 34 years old 5.7
35 – 39 years old 4.1
40 – 49 years old 4.8
50 years old or older 3.4
Unknown 0.0
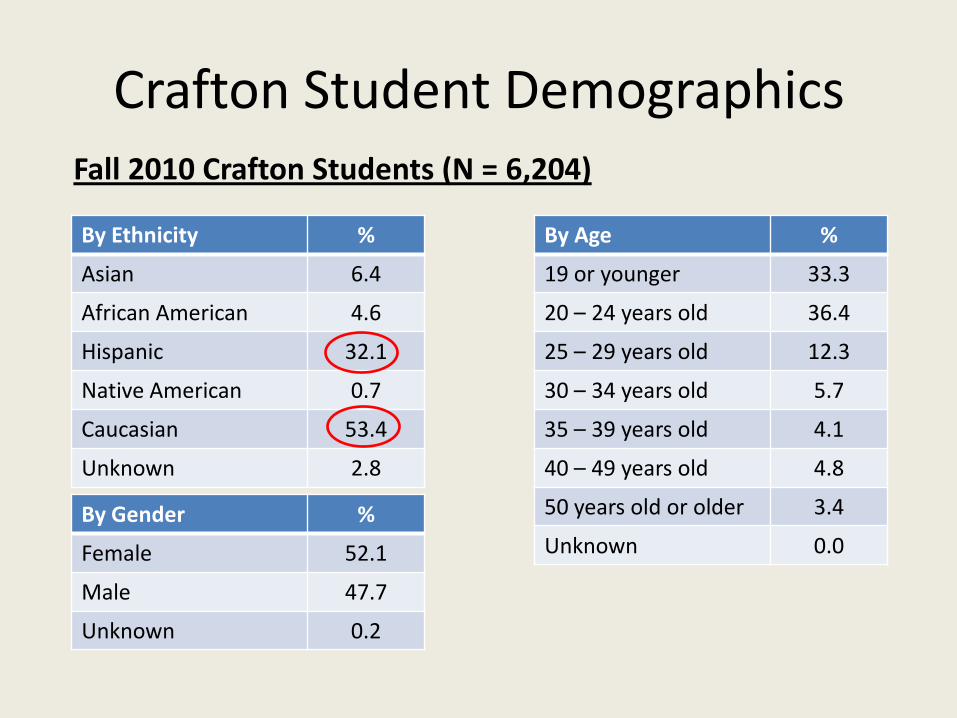
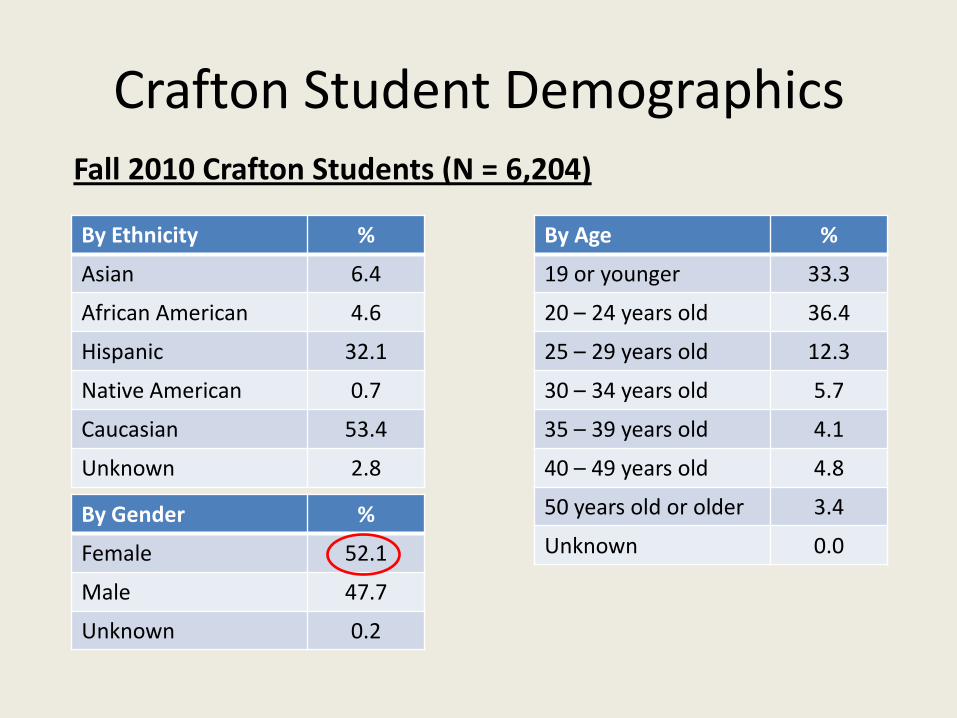
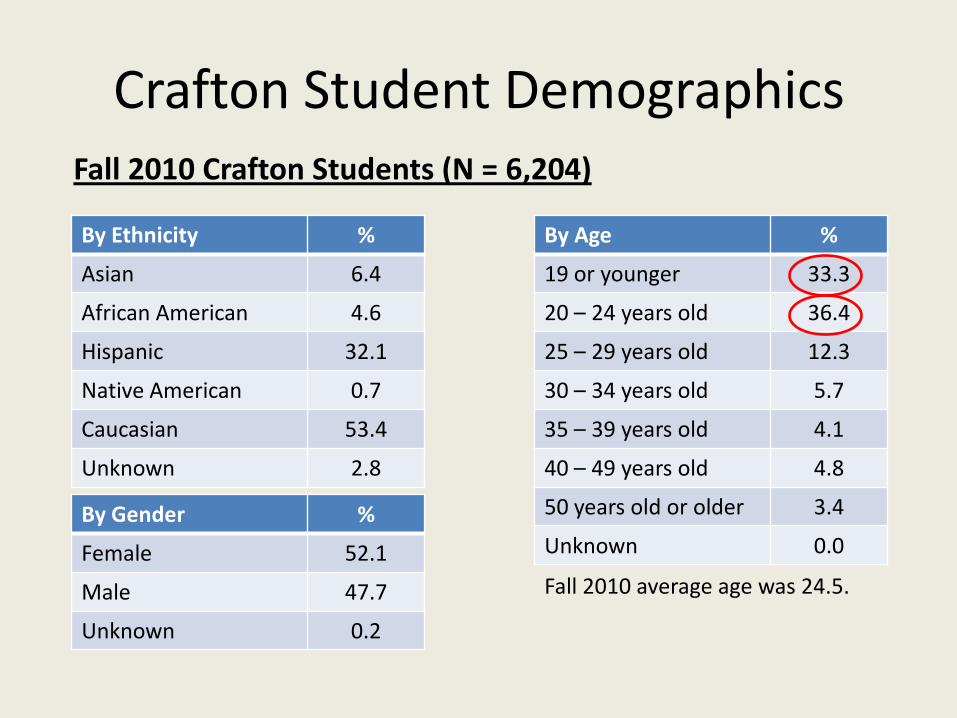
Fall 2010 average age was 24.5.
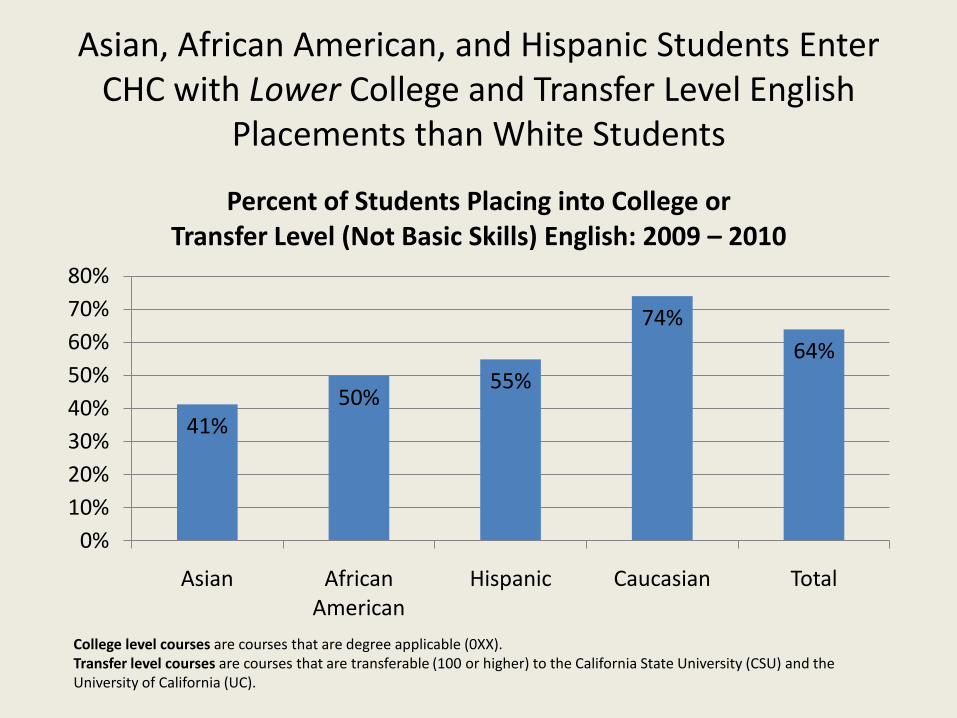
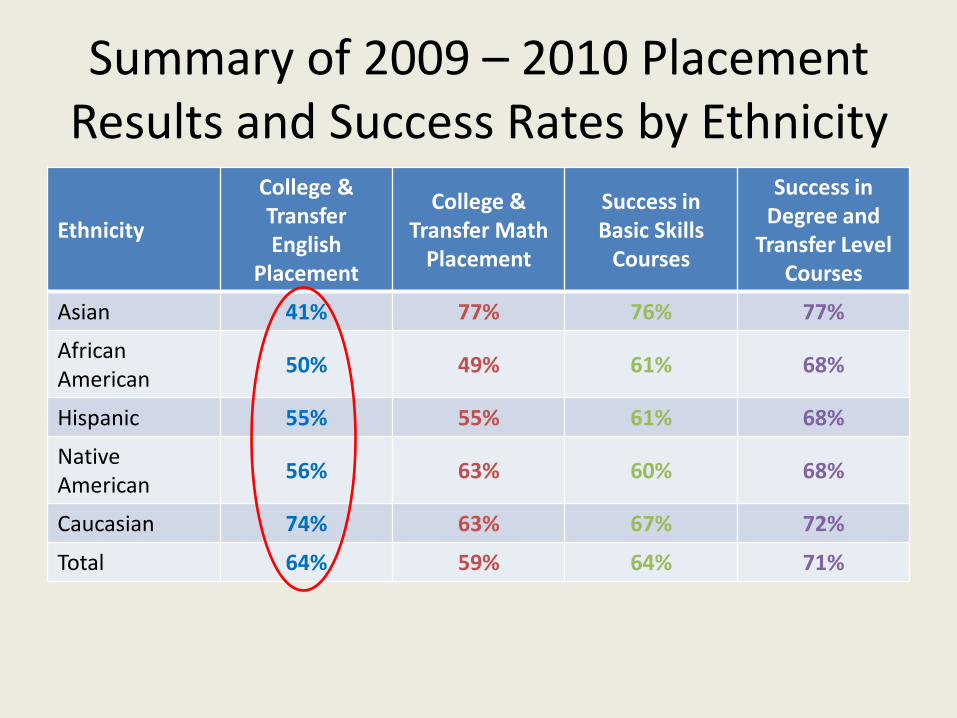
Asian, African American, and Hispanic Students Enter CHC with Lower College and Transfer Level English
Placements than White Students
41%50%
55%
74%
64%
0%
10%
20%
30%
40%
50%
60%
70%
80%
Asian African American
Hispanic Caucasian Total
Percent of Students Placing into College orTransfer Level (Not Basic Skills) English: 2009 – 2010
College level courses are courses that are degree applicable (0XX).Transfer level courses are courses that are transferable (100 or higher) to the California State University (CSU) and the University of California (UC).
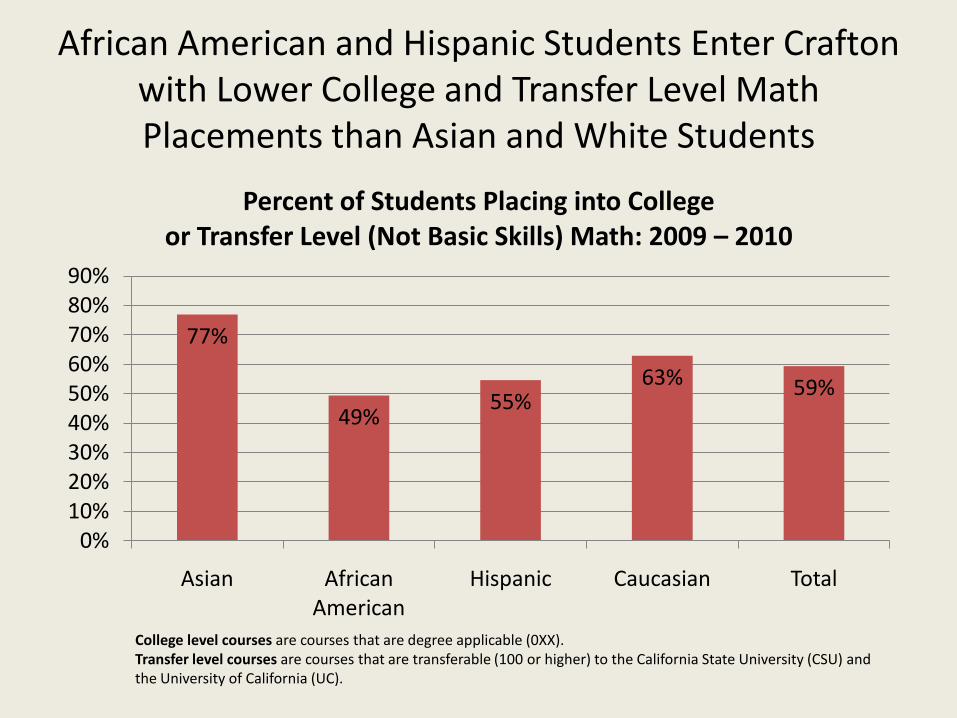
African American and Hispanic Students Enter Crafton with Lower College and Transfer Level Math Placements than Asian and White Students
77%
49%55%
63% 59%
0%10%20%30%40%50%60%70%80%90%
Asian African American
Hispanic Caucasian Total
Percent of Students Placing into Collegeor Transfer Level (Not Basic Skills) Math: 2009 – 2010
College level courses are courses that are degree applicable (0XX).Transfer level courses are courses that are transferable (100 or higher) to the California State University (CSU) and the University of California (UC).
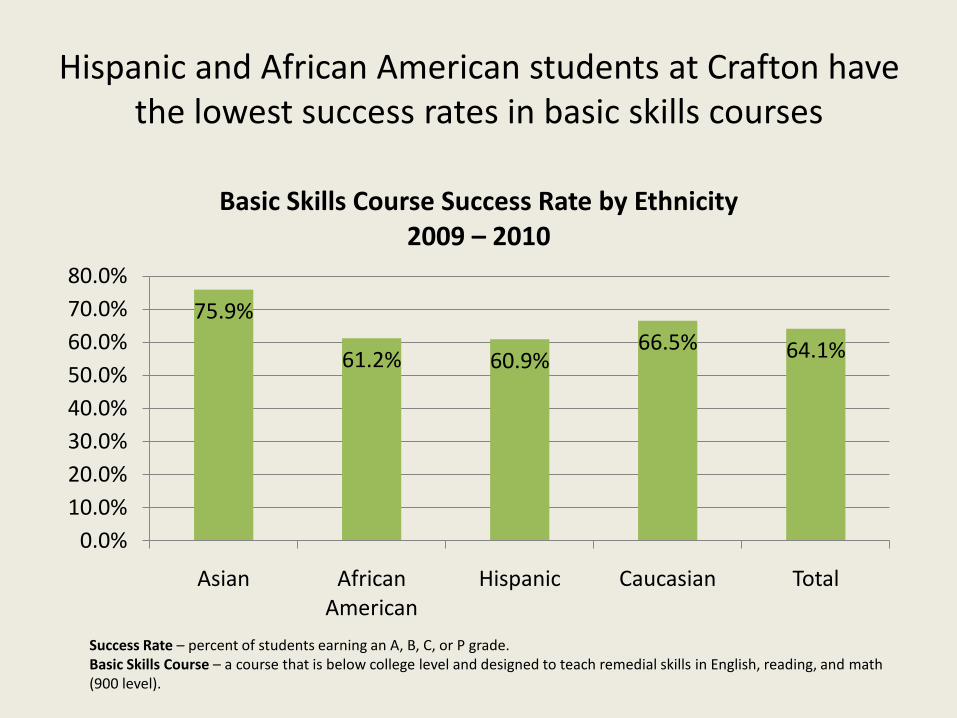
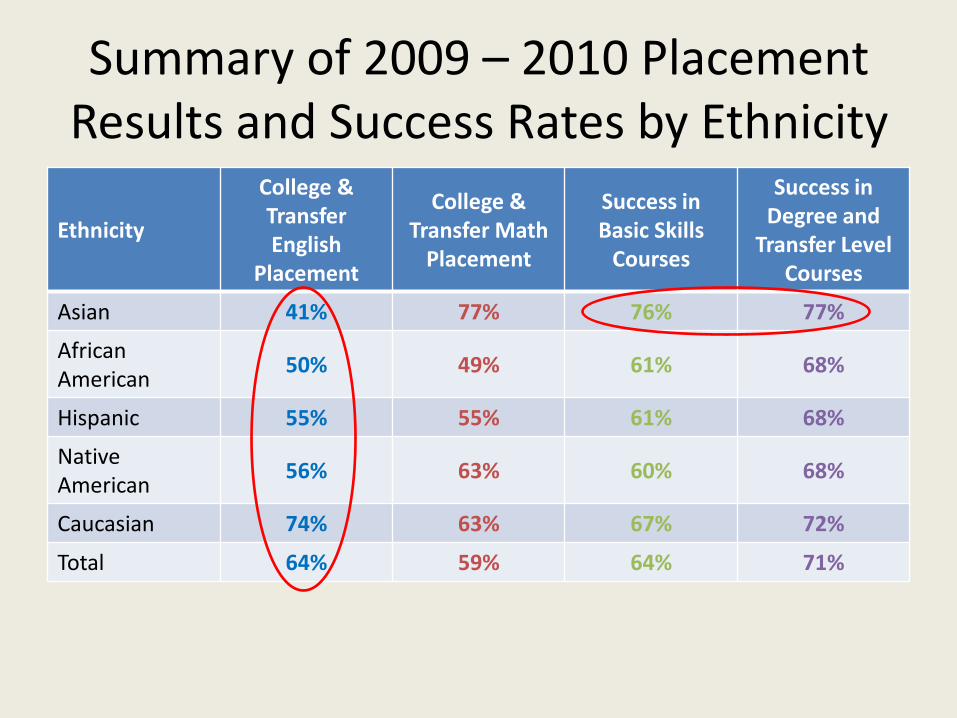
Hispanic and African American students at Crafton have the lowest success rates in basic skills courses
75.9%
61.2% 60.9%66.5% 64.1%
0.0%
10.0%
20.0%
30.0%
40.0%
50.0%
60.0%
70.0%
80.0%
Asian African American
Hispanic Caucasian Total
Basic Skills Course Success Rate by Ethnicity2009 – 2010
Success Rate – percent of students earning an A, B, C, or P grade.Basic Skills Course – a course that is below college level and designed to teach remedial skills in English, reading, and math (900 level).
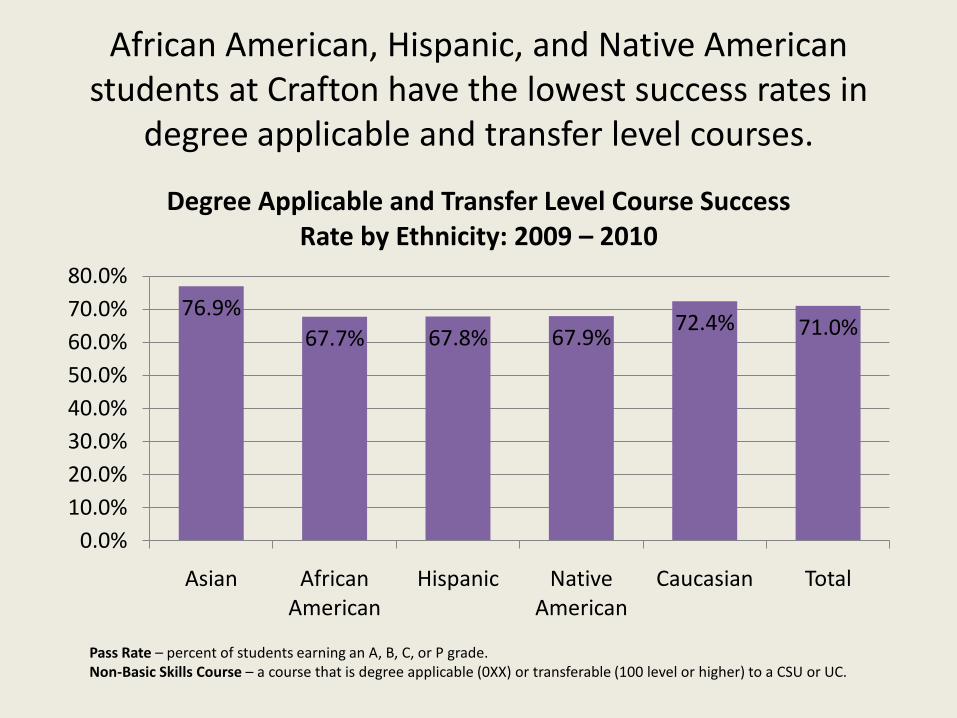
African American, Hispanic, and Native American students at Crafton have the lowest success rates in
degree applicable and transfer level courses.
76.9%
67.7% 67.8% 67.9%72.4% 71.0%
0.0%
10.0%
20.0%
30.0%
40.0%
50.0%
60.0%
70.0%
80.0%
Asian African American
Hispanic Native American
Caucasian Total
Degree Applicable and Transfer Level Course Success Rate by Ethnicity: 2009 – 2010
Pass Rate – percent of students earning an A, B, C, or P grade.Non-Basic Skills Course – a course that is degree applicable (0XX) or transferable (100 level or higher) to a CSU or UC.
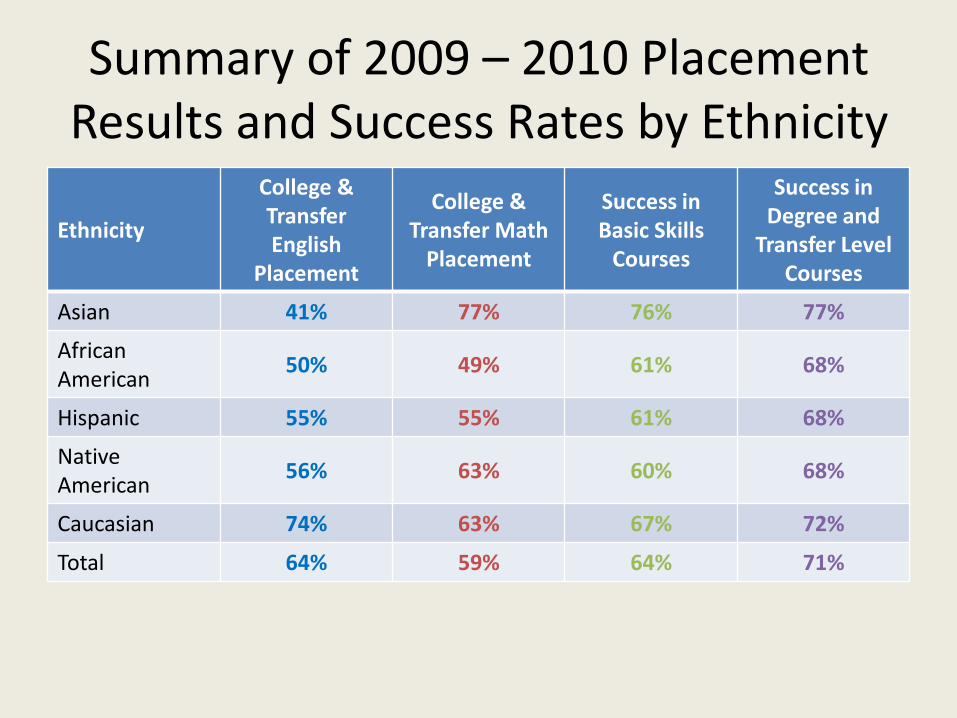
Summary of 2009 – 2010 Placement Results and Success Rates by Ethnicity
Ethnicity
College & Transfer English
Placement
College &Transfer Math
Placement
Success in Basic Skills
Courses
Success in Degree and
Transfer Level Courses
Asian 41% 77% 76% 77%
African American
50% 49% 61% 68%
Hispanic 55% 55% 61% 68%
Native American
56% 63% 60% 68%
Caucasian 74% 63% 67% 72%
Total 64% 59% 64% 71%
How can you use the research on Equity to help students?
Basic Skills Improvement
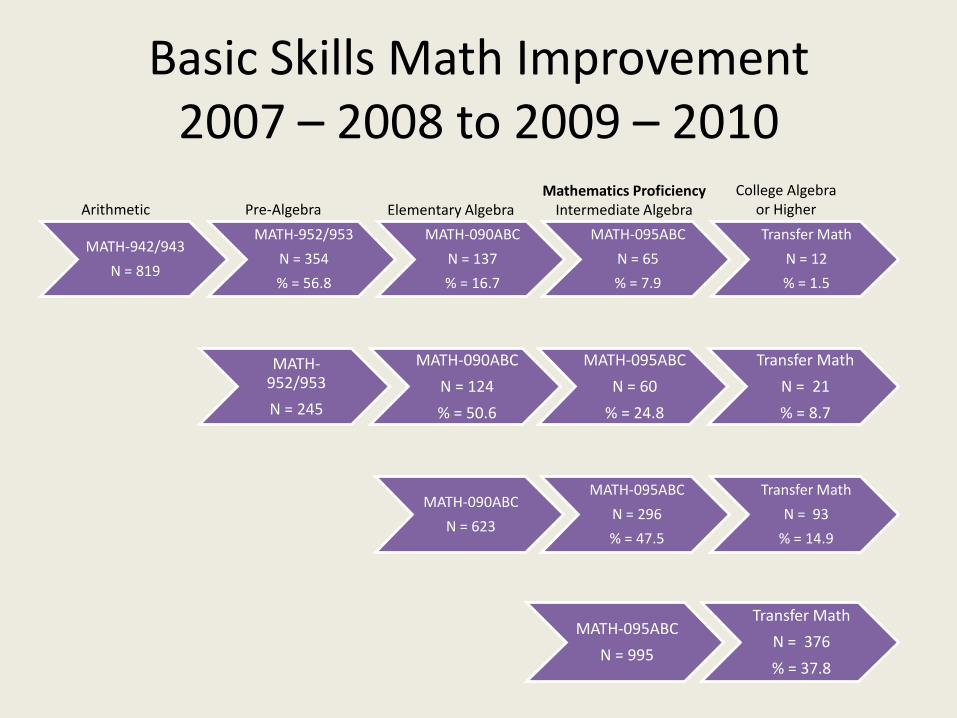
Basic Skills Math Improvement 2007 – 2008 to 2009 – 2010
MATH-942/943
N = 819
MATH-952/953
N = 354
% = 56.8
MATH-090ABC
N = 137
% = 16.7
MATH-095ABC
N = 65
% = 7.9
Transfer Math
N = 12
% = 1.5
Mathematics ProficiencyIntermediate Algebra
MATH-952/953
N = 245
MATH-090ABC
N = 124
% = 50.6
MATH-095ABC
N = 60
% = 24.8
Transfer Math
N = 21
% = 8.7
MATH-090ABC
N = 623
MATH-095ABC
N = 296
% = 47.5
Transfer Math
N = 93
% = 14.9
MATH-095ABC
N = 995
Transfer Math
N = 376
% = 37.8
Arithmetic Pre-Algebra Elementary AlgebraCollege Algebra
or Higher
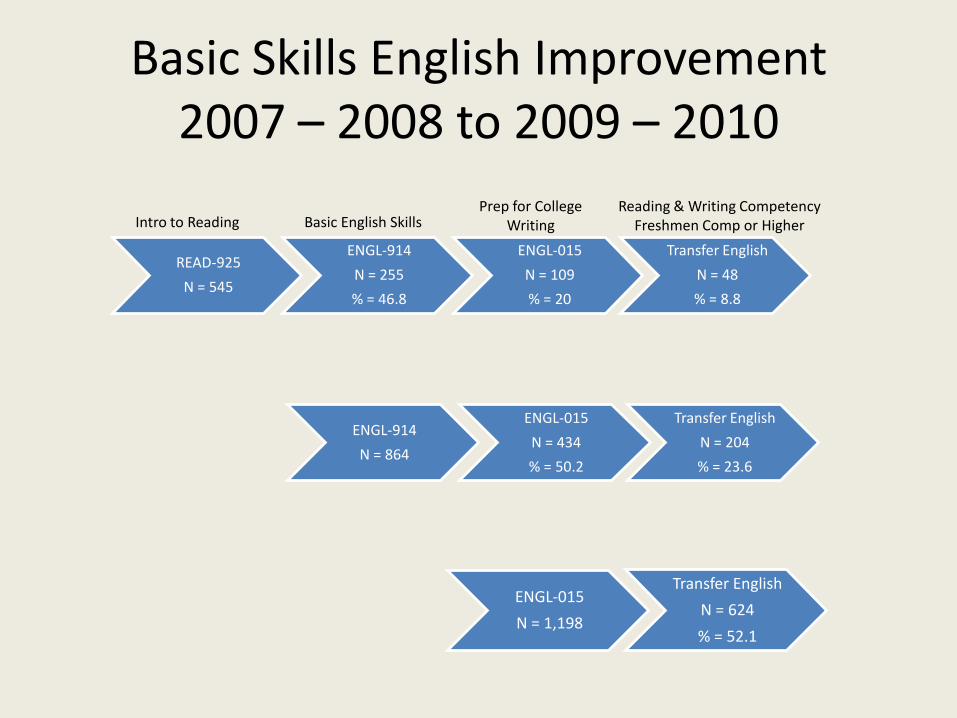
Basic Skills English Improvement2007 – 2008 to 2009 – 2010
READ-925
N = 545
ENGL-914
N = 255
% = 46.8
ENGL-015
N = 109
% = 20
Transfer English
N = 48
% = 8.8
Reading & Writing CompetencyFreshmen Comp or Higher
ENGL-914
N = 864
ENGL-015
N = 434
% = 50.2
Transfer English
N = 204
% = 23.6
ENGL-015
N = 1,198
Transfer English
N = 624
% = 52.1
Intro to Reading Basic English SkillsPrep for College
Writing
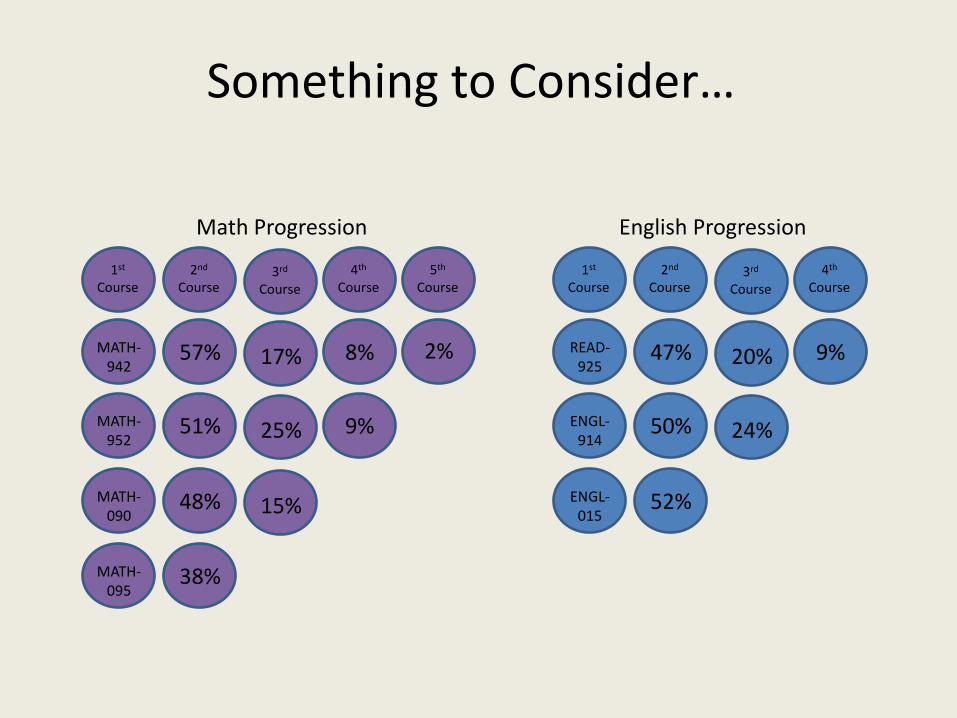
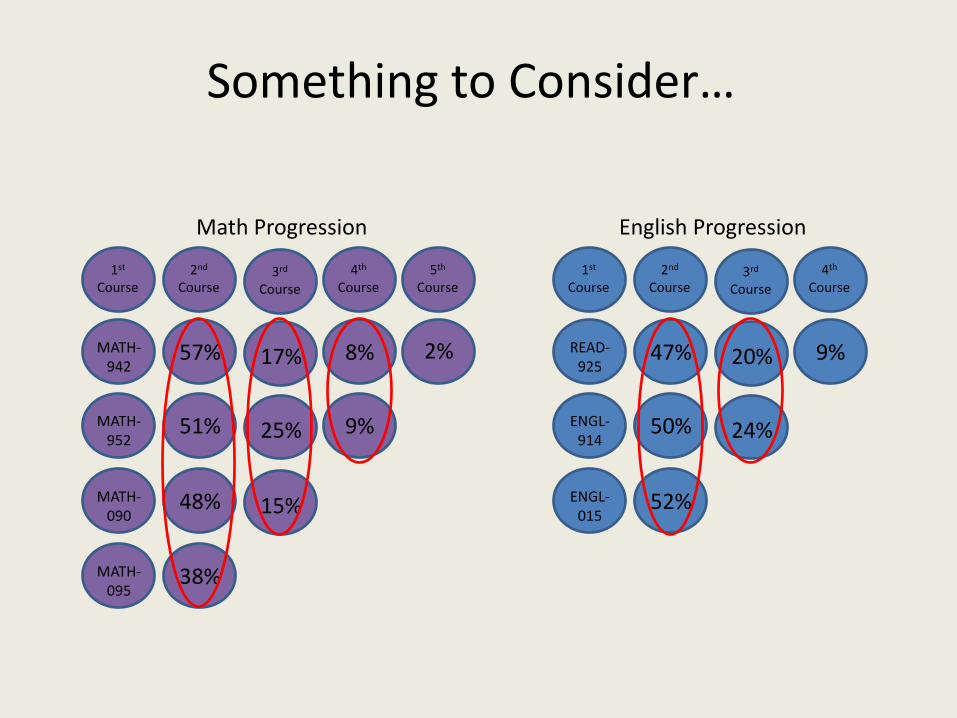
Something to Consider…
2nd
Course
57%
Math Progression
4th
Course
8%
5th
Course
2%
51% 9%
48%
38%
3rd
Course
17%
25%
15%
1st
Course
MATH-942
MATH-952
MATH-090
MATH-095
2nd
Course
47%
English Progression
4th
Course
9%
50%
52%
3rd
Course
20%
24%
1st
Course
READ-925
ENGL-914
ENGL-015
Something to Consider…
2nd
Course
57%
Math Progression
4th
Course
8%
5th
Course
2%
51% 9%
48%
38%
3rd
Course
17%
25%
15%
1st
Course
MATH-942
MATH-952
MATH-090
MATH-095
2nd
Course
47%
English Progression
4th
Course
9%
50%
52%
3rd
Course
20%
24%
1st
Course
READ-925
ENGL-914
ENGL-015
How can you use the research on Basic Skills Improvement help students?
ORP Research Team
Keith Wurtz, Director of Research & Planning
Michelle Riggs, Research Assistant
ORP Web Site
www.craftonhills.edu/research