three essays on institutional investment a thesis
TRANSCRIPT

THREE ESSAYS ON INSTITUTIONAL INVESTMENT
A thesis submitted to the University of Manchester for the degree of
Doctor of Philosophy
in the Faculty of Humanities.
2012
Nida Abdioglu Manchester Business School

2
LIST OF CONTENTS
ABSTRACT .................................................................................................................. 6
DECLARATION ......................................................................................................... 7
COPYRIGHT STATEMENT ..................................................................................... 7
DEDICATION .............................................................................................................. 8
ACKNOWLEDGEMENTS ......................................................................................... 8
CHAPTER 1- INTRODUCTION ............................................................................... 9
1.1.Motivation .......................................................................................................... 12
1.2.Purpose of The Thesis ........................................................................................ 16
1.3.Main Results ....................................................................................................... 23
1.4.Contribution ........................................................................................................ 26
1.5.Structure of The Thesis ...................................................................................... 28
CHAPTER 2- FOREIGN INSTITUTIONAL INVESTMENT: IS GOV ERNANCE QUALITY AT HOME IMPORTANT? ........................ ........................................... 29
2.1.Introduction ........................................................................................................ 29
2.2.Literature Review ............................................................................................... 33
2.3.Hypotheses ......................................................................................................... 37
2.4.Data and Methodology ....................................................................................... 41
2.4.1.Data .............................................................................................................. 41
2.4.2.Variables ...................................................................................................... 43
2.4.3.Methodology ................................................................................................ 48
2.5.Empirical Results ................................................................................................ 50
2.5.1.Descriptive Analyses ................................................................................... 50
2.5.2.Foreign Institutional Ownership and Country Governance ........................ 53
2.6.Robustness Tests ............................................................................................... 55
2.7.Conclusion .......................................................................................................... 60
CHAPTER 3- THE SARBANES-OXLEY ACT AND FOREIGN INSTITUTIONAL INVESTMENT IN THE US ................ ..................................... 79
3.1.Introduction ........................................................................................................ 79
3.2.Development of Hypotheses ............................................................................... 83

3
3.3.Data and Methodology ....................................................................................... 87
3.3.1.Independent Variables ................................................................................. 88
3.3.2.Methodology ................................................................................................ 92
3.3.3.Descriptive Statistics ................................................................................... 93
3.4. Empirical Results ............................................................................................... 94
3.4.1. SOX Effect on FIO ..................................................................................... 94
3.4.2. SOX Effect on Foreign Institutional Investors’ Firm Level Preferences ... 95
3.4.3.Passive FIO and SOX .................................................................................. 97
3.5.Robustness Tests ................................................................................................ 98
3.5.1.Am I Simply Reporting A Time Trend? ...................................................... 98
3.5.2.Macro Effects............................................................................................. 100
3.5.3.Further Tests .............................................................................................. 101
3.6.Conclusions ...................................................................................................... 102
CHAPTER 4- FIRM INNOVATION AND INSTITUTIONAL INVEST MENT: THE ROLE OF THE SARBANES-OXLEY ACT ................................................ 118
4.1.Introduction ...................................................................................................... 118
4.2.Hypothesis ........................................................................................................ 123
4.3.Data and Methodology ..................................................................................... 126
4.3.1.The Variables ............................................................................................. 127
4.3.2.Methodology .............................................................................................. 130
4.3.3.Descriptive Statistics ................................................................................. 131
4.4.Empirical Results .............................................................................................. 132
4.4.1.Univariate Analysis ................................................................................... 132
4.4.2.Multivariate Analyses ................................................................................ 133
4.5.Robustness Tests .............................................................................................. 135
4.5.1.The Effect of Increased Liquidity .............................................................. 135
4.5.2.Multivariate Difference-in-Differences Analysis ...................................... 137
4.6.Conclusion ........................................................................................................ 139
CHAPTER 5- CONCLUSION ................................................................................ 152
5.1.Summary of Findings and Future Research ..................................................... 152
5.2.Limitations ........................................................................................................ 156
REFERENCES ........................................................................................................ 161

4
LIST OF TABLES
Table 2.1.Institutional Ownership ............................................................................... 61
Table 2.2.Summary Statistics ....................................................................................... 62
Table 2.3.Correlation Matrix........................................................................................ 63
Table 2.4.Determinants of Foreign Institutional Ownership ....................................... 64
Table 2.5.Investment Preferences for Above/Below US Governance Quality at Home.. ...................................................................................................................................... 66
Table 2.6.Investment Preferences of Grey and Independent Foreign Institutional Investors .................................................................................................................... 68
Table 2.7.Alternative Proxies for Governance Quality at Home ................................. 70
Table 2.8.Alternative Specifications: SOX and Firm Fixed Effects ............................ 72
Appendix A: Ownership by Foreign Institutional Investor’s Country of Domicile. ... 75
Appendix B: Time Series Change in Governance Quality (GQ) by Country .............. 76
Appendix C: Details of the Directors’ Index (DINDEX) ............................................ 77
Table 3.1.Descriptive Statistics .................................................................................. 104
Table 3.2.Correlation Matrix...................................................................................... 106
Table 3.3.The SOX Effect on Foreign Institutional Investment ................................ 108
Table 3.4.The SOX Effect on the Firm-Level Preferences of Foreign Investors ..... 110
Table 3.5.Heterogeneous Effect of the Sarbanes-Oxley Act ..................................... 112
Table 3.6.Difference-in-Differences using Accelerated Filers .................................. 114
Table 3.7.Macro and Industry Effects ........................................................................ 116
Table 4.1.Descriptive Statistics .................................................................................. 141
Table 4.2.Correlation Matrix...................................................................................... 142
Table 4.3.Univariate Difference-in-Differences Results ........................................... 144
Table 4.4.The Effect of Innovation on the Relation between IO and SOX ............... 145
Table 4.5.The Effect of Increased Liquidity .............................................................. 148
Table 4.6.Multivariate Difference-in-Differences Results ....................................... 150

5
LIST OF FIGURES
Figure 1: Illustration of the main results reported in Tables 4 & 5 .............................. 74
This thesis contains 43,951 words including title page, tables and footnotes.

6
ABSTRACT The University of Manchester Nida Abdioglu Doctor of Philosophy Three Essays on Institutional Investment 28/05/2012
This thesis investigates the investment preferences of institutional investors in the United States (US). In the second chapter, I analyse the impact of both firm and country-level determinants of foreign institutional investment. I find that the governance quality in a foreign institutional investor’s (FII) home country is a determinant of their decision to invest in the US market. My findings indicate that investors who come from countries with governance setups similar to that of the US invest more in the United States. The investment levels though, are more pronounced for countries with governance setups just below that of the US. My results are consistent with both the ‘flight to quality’ and ‘familiarity’ arguments, and help reconcile prior contradictory empirical evidence. At the firm level, I present unequivocal evidence in favour of the familiarity argument. FII domiciled in countries with high governance quality prefer to invest in US firms with high corporate governance quality.
In the third chapter, I investigate the impact of the Sarbanes-Oxley Act (SOX) on foreign institutional investment in the United States. I find that, post-SOX, FII increase their equity holdings in US listed firms. This result is mainly driven by passive, non-monitoring FII, who have the most to gain from the SOX-led reduction in firm information asymmetry, and the consequent reduction in the value of private information. The enactment of SOX appears to have changed the firm-level investment preferences of FII towards firms that would not be their traditional investment targets based on prudent man rules, e.g., smaller and riskier firms. In contrast to the extant literature, which mostly documents a negative SOX effect for the US markets, my chapter provides evidence of a positive SOX effect, namely the increase in foreign investment.
In the fourth chapter, I examine the effect of SOX on the relation between firm innovation and institutional ownership. I find that US firms investing in innovation attract more institutional capital post-SOX. Prior literature highlights two SOX effects that could cause this result: a decreased level of information asymmetry (direct effect) and increased market liquidity (indirect effect). My findings support the direct effect, as I find that the positive relation between innovation and institutional ownership is driven by passive and dedicated institutional investors. A reduction in firms’ information asymmetry is beneficial for these investors while they gain less from increased market liquidity. Overall, my results indicate that SOX is an important policy that has strengthened the institutional investor’s support for firm innovation.

7
DECLARATION
No portion of the work referred to in the thesis has been submitted in support of an application for another degree or qualification of this or any other university or other institute of learning.
COPYRIGHT STATEMENT
The author of this thesis (including any appendices and/or schedules to this thesis) owns
certain copyright or related rights in it (the “Copyright”) and she has given The University of Manchester certain rights to use such Copyright, including for administrative purposes.
Copies of this thesis, either in full or in extracts and whether in hard or electronic copy, may be made only in accordance with the Copyright, Designs and Patents Act 1988 (as amended) and regulations issued under it or, where appropriate, in accordance with licensing agreements which the University has from time to time. This page must form part of any such copies made.
The ownership of certain Copyright, patents, designs, trade marks and other intellectual property (the “Intellectual Property”) and any reproductions of copyright works in the thesis, for example graphs and tables (“Reproductions”), which may be described in this thesis, may not be owned by the author and may be owned by third parties. Such Intellectual Property and Reproductions cannot and must not be made available for use without the prior written permission of the owner(s) of the relevant Intellectual Property and/or Reproductions.
Further information on the conditions under which disclosure, publication and commercialisation of this thesis, the Copyright and any Intellectual Property and/or Reproductions described in it may take place is available in the University IP Policy (see http://www.campus.manchester.ac.uk/medialibrary/policies/intellectual-property.pdf), in any relevant Thesis restriction declarations deposited in the University Library, The University Library’s regulations (see http://www.manchester.ac.uk/library/aboutus/regulations) and in The University’s policy on presentation of Theses.

8
DEDICATION
I would like to dedicate this thesis to my family and to everyone who loves me.
ACKNOWLEDGEMENTS
I deeply thank my supervisors Dr. Konstantinos Stathopoulos and Dr. Arif Khurshed for their excellent supervision during my PhD. I would also like to thank all the members of staff at Manchester Business School who provided useful feedbacks during the end of year reviews. I am indebted to Turkish Government who provided me funding for my PhD. My friends in Manchester also deserve thanks for their friendship and support. Finally, I must express my gratitude to my family for their continued support during my studies.
9
CHAPTER 1: INTRODUCTION
Institutional investors are the dominant owners of most of the listed United States (US)
firms. Current estimates show that nearly 70% of the equity of US firms is owned by
domestic and foreign institutional investors and that over the last decade, foreign
institutional investment has almost doubled. A report by the US Department of Treasury
(2010) shows an increase in the level of foreign investment in US firms from $1.395
trillion in 2002 to $2.252 trillion in 2009. Although the level of foreign institutional
investment has increased, not much is known about the reasons why foreign
institutional investors have increased their investment in the United States. My research
sheds some light on this issue. I also examine the investment preferences of both the
domestic and foreign institutional investors.
There is some literature on the role of corporate governance quality of target firms and
governance quality of target countries in determining institutional investment in the
US1. According to a survey made by McKinsey (2002), a vast majority of institutional
investors prefer to invest in firms with high corporate governance quality and countries
with high governance quality. However, our understanding of the role of the corporate
governance setups of the home country (country of origin) of the foreign institutional
investors in influencing their decision to invest in the US is rather limited. In the first
empirical chapter, I examine the effect of home country governance quality on the
investment preferences of foreign institutional investors who invest in US firms. If
foreign investors have a low level of governance quality in their home country, they
may try to find better investment opportunities in a globalised world and may invest in
higher governance quality countries such as the United States. Foreign institutional
1 i.e. Ferreira and Matos (2008); Leuz et al. (2008).
10
investors in my sample are quite diverse and come from many different corporate
governance backgrounds. This simplifies investigating the impact of home country
governance quality on foreign institutional investment.
As a response to the corporate scandals such as those of Enron and Worldcom, the US
government brought in the Sarbanes-Oxley Act (SOX) of 2002. William H. Donaldson,
chairman of SEC, explains the results of SOX as: “Since its enactment in the summer
of 2002, the Act has affected dramatic change across corporate America and beyond,
and is helping to re-establish investor confidence in the integrity of corporate
disclosures and financial reporting.” (SEC, 2005)2. Engel et al. (2007) also state that
since the enactment of SOX puts in place new disclosure rules and adds penalties to
corporate frauds, US listed firms have to increase their corporate transparency. Ever
since SOX was enacted, there has been an ongoing debate on its merits and
disadvantages. However, this debate has largely overlooked SOX’s impact on foreign
institutional investment in the US. Given that SOX has resulted in higher transparency
and better corporate governance of US firms (Engel et al., 2007), has foreign
institutional investment in US firms increased post-SOX? My second empirical chapter
sheds some light on this issue. Since foreign investors originate from outside the US,
information asymmetry level of the stocks they invest in the US are an important
consideration for these investors. Thus, I expect that increased transparency and better
corporate governance of US firms might attract more foreign institutional investment to
the US market post-SOX.
2 Article title: Testimony Concerning the Impact of the Sarbanes-Oxley Act; accessed April, 2012;
source: http://www.sec.gov/news/testimony/ts042105whd.htm

11
A common problem for studies examining structural breaks in an economy is the
potential for capturing confounding effects. Recently, there is consensus in the literature
that one way of mitigating concerns regarding confounding effects is through the use of
difference-in-differences (DD) estimations. Therefore, in order to isolate the effect of
SOX from other institutional changes in the last decade, I use DD estimations. Since I
compare two groups (non-accelerated vs. accelerated filers) over the same time period, I
avoid the problem of omitted trends. Secondly, by making a time-series comparison
(before and after SOX enactment) between the two groups, I control for the impact of
unobserved, omitted variables in the analysis. The key assumption in the DD analysis is
that in the absence of the enactment of SOX, there would have been no difference in the
average change in foreign institutional investment (FII). Since I find significant results
in DD estimation, I can state that there is a SOX effect on FII.
In the final empirical chapter of my thesis, I use the enactment of SOX as a setting to
test the relation between firm innovation and institutional investment (both domestic
and foreign). Johnston and Madura (2009) support the SOX-led improvement in the
information efficiency of the US market by reporting better IPO performance for US
firms. Since SOX has resulted in lower information asymmetry of US firms (Johnston
and Madura, 2009), the monitoring costs of institutional investors should reduce post-
SOX. Hence, I explore whether institutional investors have increased their investments
in highly innovative firms post-SOX, which are known as stocks with high information
asymmetry.
This thesis is structured into three separate essays on institutional investment. The
purpose of the thesis is to examine the investment preferences of institutional investors
investing in US firms. In this chapter, I aim to provide a brief outline of my thesis. The

12
motivation behind this thesis is outlined in section 1. In section 2, I summarise the main
hypotheses and research questions for each empirical chapter. The main results and
contribution of the thesis are given in sections 3 and 4, respectively. Section 5 provides
guidelines about the structure of the thesis.
1.1. Motivation
Berle and Means (1932) note that the separation of ownership and control could lead
executives to act in their own interests without taking into account the interests of
shareholders. However, internal and external control mechanisms constrain the
executives’ activities. The existence of institutional investors in a firm is one of the
external control mechanisms (Gillan and Starks, 2003). Institutional investors affect the
management’s actions through a high level of ownership in corporations. Their
involvement in monitoring and controlling activities is expected to reduce the agency
problems (Shleifer and Vishny, 1986; Maug, 1998; Noe, 2002). On the one hand,
institutional investors can affect the management of the firm through the threat of
exiting the investment, that is, voting with their feet (Parrino et al., 2003). In other
words, they could sell their shares and drive the price of the firm down if they were
dissatisfied with the firm’s management (Palmiter, 2002). Since the managers’
compensation is tied to share prices, the presence of institutional investors in a firm may
help to reduce the agency cost with disciplining managers and thus improve corporate
governance (Admati and Pfleiderer, 2009).
On the other hand, since it is not easy to sell large holdings, institutional investors
sometimes prefer to retain their investments and force management to act in the
13
shareholders’ interests (Demiralp et al., 2011). They have an incentive to monitor the
management of the firm since they cannot always sell the shares of firms with which
they are dissatisfied (Coffee, 1991; Gillan and Starks, 2000). For instance, Parrino et al.
(2003) find that, although some institutional investors vote with their feet when they are
dissatisfied with forced CEO turnover, over 45% of them prefer to stay with the firm
and influence change. Since the institutional investors have an impact on the
management of the firms through voting with their feet or monitoring ability, it is
important to understand the investors’ investment preferences for the firm management.
This role of institutional investors is one of the reasons that have motivated me to
examine their investment preferences.
Further, the difficulty of exiting also affects the investment preferences of institutional
investors. As a result of the difficulty of selling large shares, institutional investors have
an incentive to invest in reliable firms. In other words, they follow the prudent man rule
by investing in reliable assets, such as stocks with high corporate governance quality
and less information asymmetry (Badrinath et al., 1989). The behaviour of institutional
investors towards corporate governance quality and/or information asymmetry is the
motivation behind my investigation of their investment preferences in cases of low/high
information asymmetry and/or governance quality in their home country. In other
words, I explore whether foreign institutional investors’ preferences about investing in
prudent stocks show differences according to their home country governance quality
while investing in US firms. I am inspired by familiarity argument dominated in the
behaviour of foreign institutional investors to create this idea. Since foreign institutional
investors want to minimize information costs when investing abroad, they invest in
familiar stocks. I categorize stocks with high level of corporate governance quality in
14
the US as familiar stocks for the foreign investors who have high level of governance
quality in their country of origin.
The preferences of institutional investors regarding information asymmetry is applicable
to country-level as well as firm-level preferences. As a result of their incomplete
information about foreign markets, the cost of investing abroad is high for these
investors. Because of the information asymmetry cost, they avoid investing abroad. As a
result, a home bias phenomenon occurs (Tesar and Werner, 1995). In other words,
institutional investors prefer to hold more domestic assets than foreign assets. However,
with globalisation, foreign investment abroad has started to increase (Leuz et al., 2009;
Bekaert et al., 2002). The US Department of Treasury 2010 report shows an increase in
foreign holdings of US equities, from $1.395 trillion in 2002 to $2.252 trillion in 2009.3
A recent report by the Congressional Research Service (Jackson, 2010) also
demonstrates the rise in foreign investment in US financial assets over recent years. An
important question thus arises: What is the reason for the recent increase in the level of
foreign institutional investment in the United States? I explore some of the reasons
behind this increase in the second and third chapters. Given the growing level and
importance of foreign capital across firms, it is important to understand the factors that
attract investors to foreign markets. In the second chapter, I argue that one of these
factors is the home country governance quality of foreign institutional investors. In the
third chapter, it is the new regulation enacted in the US: SOX. Understanding the
motivation behind the high level of foreign capital inflow to the US market will help
regulators of the market to arrange the market conditions in a way to attract more
foreign investment.
3 Out of the total foreign investment in the US market, 80% is foreign institutional investment.
15
One of the most important contribution of this thesis is to show home country
governance quality as an investment determinant of foreign institutional investment. I
show the US market, a high governance quality market, as a safe place to invest
especially for the foreign investors who have low level of governance quality in their
home country. The lower level of information asymmetry cost they encounter in the US
market drives this result. Secondly, I argue that the enactment of SOX should affect the
investment level and preferences of foreign institutional investors investing in the US.
Since a higher level of foreign institutional investment can now be seen in the US
markets, the market conditions that might have induced this rise should be identified. A
change in market conditions might have been caused by a regulation enacted in the US.
SOX is seen as a significant milestone in the improvement of corporate governance in
the country. It was implemented in response to a series of corporate scandals and its aim
is to reinforce investor confidence in the capital markets, by imposing high levels of
disclosure on US listed firms. The increased transparency in the US market should have
resulted in lower levels of information asymmetry in US firms and thus reduced the
costs of monitoring managerial actions. Therefore, the improved market conditions
should have altered the attitudes of foreign institutional investors towards US listed
firms. This is my motivation in the third chapter where I examine foreign institutional
investors’ investment preferences after the enactment of SOX. In addition, lower
information asymmetry post-SOX should reduce the monitoring costs of institutional
investors, thus they should face lower agency costs. As a result, their behaviour in
relation to highly innovative firms, which are known to have high information
asymmetry, should change post SOX. I examine this relation in the fourth chapter.
16
1.2. Purpose of the Thesis
Merton’s (1987) model suggests that information costs have an impact on investor
behaviour. Since investors believe stocks they know nothing about to be risky, they
prefer not to invest in them. Thus, the level of information asymmetry in a stock affects
the behaviour of investors4. In addition, the behaviour of institutional investors is
affected by the prudent man rule (Del Guercio, 1996). In line with this rule, they invest
in fiduciary assets such as large firms, less leveraged firms, firms with less information
asymmetry, those with high governance quality, and the like5. Overall, prudent man rule
and information cost arguments show how the investment preferences of institutional
investors can be affected. In this thesis, I examine how effective these arguments are for
foreign (chapters 2 and 3) and overall institutional investors’ (chapter 4) preferences.
In general, I was inspired by the abovementioned theories, while examining the
investment preferences of institutional investors. In particular, in the second chapter, I
investigate whether the investment preferences of foreign institutional investors are
affected by their home countries’ governance quality. The research questions I created
for this chapter are as follows: 1) Does the governance quality of the home country play
any role in the foreign institutional investor’s decision to invest in the US? 2) Does
country-level governance quality affect the foreign institutional investors’ preferences
for specific US firms? By finding answers for these research questions, I investigate the
reasons of high level of foreign institutional investment in US firms. These research
4 For instance, Coval and Moskowitz (1999) highlight the importance of information costs by showing
investors’ willingness to hold the stocks of local companies. The information cost affects the behaviour of foreign investors as well as local investors. Kang and Stulz (1997) provide evidence in support of this argument, by finding more foreign investment in large firms. Since large firms are more information-efficient, they are preferred by foreign investors. 5 Chung et al. (2010) argue that high governance quality results in higher transparency and thus lower information asymmetry between insiders and outsiders.
17
questions are important in the sense that they aim to show how the home country
governance quality of the foreign investors is a determinant of their investment
preferences. They are also important in terms of showing how foreign investors trade
off information costs associated with investing abroad. Home country governance
quality of the foreign investors might be a determinant of foreign institutional
investment, as the lack of governance quality in their country might force them to seek
safer investment opportunities. By investing in a more informationally efficient
environment (US market), foreigners might reduce the information cost they encounter
at home.
Firstly, I argue that the decisions of foreign institutional investors regarding their
investment in a country with higher governance quality, the US, should vary according
to their home country’s governance quality. Prior literature generally examines how
country and firm-level policies affect the investment allocations of institutional
investors. Aggarwal et al. (2005) find that strong governance environments attract more
institutional investment. In particular, US mutual funds invest more in firms in
emerging-market countries with stronger accounting standards, shareholder rights, and
legal frameworks. Furthermore, Chan et al. (2005) report that foreign institutional
investors invest in countries they are familiar with and which have a high level of stock
market development. Li et al. (2006) find that institutional investors invest more in
countries with strong shareholder rights, effective legal enforcement and extensive
financial disclosure. All of these papers examine the impact of the governance quality in
the countries targeted by institutional investors. However, in the second chapter of this
thesis, I investigate the effect of the governance quality of a foreign institutional
investor’s home country on that investor’s investment preferences. I argue that low-
quality governance in a country results in weak investor protection, low information

18
disclosure and thus high information asymmetry. It is well known from the literature
that investors prefer to invest in high-quality governance countries and therefore
countries with a high level of investor protection (Aggarwal et al., 2011; Leuz et al.,
2009). This behaviour is in line with the prudent man rule. Even if a firm has a high
level of governance quality itself, if it is domiciled in a country with low governance
quality, it will benefit less from the capital markets (Doidge et al., 2007). Having high
firm-level governance quality cannot substitute for the governance quality at the country
level (Klapper and Love, 2004). For these reasons, I expect that the quality of the
governance environment should be a determinant of institutional investment. However,
in contrast to the literature, I expect that governance quality in the home country of the
investor will be influential on his investment preferences besides the target country’s
governance quality.
Further, in line with the good country bias theory of Giannetti and Koskinen (2010),
investors domiciled in countries with weak investor protection should prefer to invest
more in countries with higher investor protection than their home country. Therefore, a
good country bias should be seen in the investment preferences of institutional
investors. In other words, an impact of flight to quality will be seen in the investment
behaviour of foreign institutional investors who have lower governance quality at home
than exists in the US. They invest in the US to gain the benefit of high governance
quality.
In addition, I expect that the flight to quality by foreign institutional investors might
vary according to the relative distances in governance quality between the home country
and the US. This argument allows me to test the familiarity bias on foreign institutional
investment. In this case, I define a country as familiar to the US if it has similar
governance quality to that in the US. I expect a greater amount of foreign institutional
19
investment in US firms to come from countries with similar governance quality to the
US. Put differently, foreign investors prefer to invest in familiar environments. Since
familiar stocks help investors to reduce the costs associated with uncertainty, they prefer
to invest in familiar stocks (Chan et al., 2005). In sum, I predict that both the effect of
familiarity and flight to quality are likely to co-exist in the investment behaviour of
foreign institutional investors. The difference in governance quality between the home
country and the US will determine the combination of the two effects.
Secondly, an additional strand of the literature investigating the investment preferences
of institutional investors has typically focused on firm-level determinants of
institutional ownership, such as size, dividend yield and firm performance (Ferreira and
Matos, 2008; Kang and Stulz, 1997; Dahlquist and Robertsson, 2001; Falkenstein,
1996; Gompers and Metrick, 2001; Almazan et al., 2005), with almost no attention
given to home country governance quality. However, I investigate whether the home
country governance quality has any effect on the firm-level preferences of institutional
investors. According to Kang and Stulz (1997), foreign institutional investors invest in
stocks they know in order to avoid the information cost of investing in stocks they do
not. The former are known as familiar stocks. In this thesis, I define a firm as familiar to
a foreign investor if that firm has a similar level of information asymmetry (or
governance quality) as exists in the investor’s country of origin. I do not expect to
observe homogeneous preferences among the foreign institutional investors. I argue that
those with low information asymmetry in their home country invest in US stocks with
low information asymmetry. In other words, foreign institutional investors give
importance to familiarity in stock characteristics when they invest abroad. Since
familiarity decreases the information cost, familiar stocks are more attractive to foreign
investors.

20
In the third chapter, I examine how the enactment of SOX affects the investment
preferences of foreign institutional investors. Since the level of information asymmetry
in the market is expected to decrease as a result of the SOX implementation, I expect
foreign institutional investors to be attracted to US firms, post-SOX. Accepting the
changes in the US market transparency, I argue that finding answers to the following
research questions will be an important contribution to the literature: 1) What has been
the impact of SOX on investments by foreign institutional investors? 2) Have the
investment preferences of foreign institutional investors been affected by SOX? These
questions are important for the SOX literature, because I will demonstrate a new benefit
of SOX: foreign institutional investment. Further, it is important to show how an
improvement in market conditions attracts foreign investment in US firms. It is also
important to see whether enactment of a new regulation in the US market changes the
level and investment preferences of foreign institutional investors for specific US firms.
Although prudent man rule may dictate the investment preferences of foreign
institutional investors, an increase in the reliability of information in US firms with
SOX might result with new preferences for institutional investors.
Given the importance of information asymmetry for foreign institutional investors’
investment choices, I examine the impact of a reduction in the information asymmetry
level in the US market, through the enactment of SOX, on the level of foreign
institutional investment in US firms. A strand of the extant literature discusses the
benefits, and mostly the costs, of SOX. For example, Zhang (2007) finds negative
cumulative abnormal returns around SOX-related events for a sample of US firms.
Litvak (2007) concludes that there is a decline in the stock prices of foreign firms that
are subject to SOX, whereas he finds an increase in the stock prices of foreign firms not

21
subject to SOX. Ribstein (2002) and Romano (2005) find that high expected reporting,
regulatory and legal costs of listing on US exchanges are among the disadvantages of
SOX. Li et al. (2008) and Jain and Rezaee (2006) respectively report positive stock
price and positive abnormal return reactions to legislative events surrounding SOX.
Coates (2007) shows that enhanced trust in US capital markets is a benefit of SOX.
Unlike the existing literature, I argue that the level of foreign institutional ownership
has increased since the enactment of SOX. One of the main results of the enactment of
SOX is the increased disclosure, and decreased information asymmetry in the US
market.6 I expect that the reduction in information asymmetry should affect the
investment decisions of foreign institutional investors. Since one of the investment
determinants for institutional investors is a high level of corporate disclosure (Bushee
and Noe, 2000), they should be more attracted to investing in the US market post-SOX.
In addition, in the second hypothesis of chapter 3, I argue that foreign institutional
investors invest in non-prudent stocks as well as prudent stocks, post-SOX. Historically,
institutional investors have invested in reliable stocks, in line with the prudent man rule
(Badrinath et al., 1989).7 Since the foreign institutional investors come from outside the
US, information efficiency in the US market is more important for them. Given that
SOX has increased the information efficiency in the market, US assets should now be a
more reliable investment for foreign institutional investors. In particular, the assets that
used to be non-prudent must be more reliable post-SOX. Thus, I expect to find foreign
investment in these stocks as well.
6 Johnston and Madura (2009) present evidence of the increased information efficiency in the US market,
post-SOX.
7 Large firms, firms with high liquidity and those with a high book-to-market ratio can be shown to be examples of prudent stocks (Del Guercio, 1996).

22
In the final hypothesis of chapter 3, I separate foreign institutional investors into active
and passive ones. According to Brickley et al. (1988), passive investors (such as banks
and insurance companies) have a close business relationship with the management of
the firms in which they invest. Since they do not want to damage their relationship with
the firm, they face high costs of monitoring and do not expend effort collecting private
information about the firm (Chen et al., 2007). Thus, a reduction in the value of private
information will be beneficial for them. On the other hand, active institutional investors
(such as investment companies, independent investment advisors and public pension
funds) do not have close business ties with their investee firms (Brickley et al., 1988)
and they face lower legal restrictions (Jiao and Liu, 2009). As a result, they collect and
use private information (Almazan et al., 2005). A reduction in the value of private
information reduces the advantage of active investors. Given that SOX has increased the
information transparency in the US market, the value of private information should have
decreased post-SOX. Thus, I argue that passive institutional investment should now be
more pronounced in the US market than active. In particular, passive institutional
investment should be greater in firms with higher levels of private information.
In the final empirical chapter, I analyse how the reduction of information asymmetry by
SOX has affected the behaviour of institutional investors towards highly innovative
stocks, which are those with high information asymmetry. I have one main research
question in the last empirical chapter: Do highly innovative firms attract more
institutional investment after the enactment of SOX? It is important to investigate this
research question in order to determine whether this policy has resulted in a
strengthening of institutional investor support for firm innovation.
23
Because of their high level of information asymmetry,8 highly innovative firms cannot
attract institutional investment (Bushee, 1998; Graves and Waddock, 1990; Jacobs,
1991; Porter, 1992). For instance, since R&D expenditures are idiosyncratic, they
cannot easily be monitored. As a result, a high level of information asymmetry occurs
between insiders and outsiders in high-R&D firms (Aboody and Lev, 2000). As I have
mentioned in the above paragraphs, SOX has changed the information efficiency of the
US market. It imposes high disclosure requirements on US listed firms and has thus
made the US market more transparent (Engel et al., 2007). The enactment of SOX has
improved the reliability of public financial information and resulted in increased
investor confidence in financial reports. As a result, liquidity has increased in the US
market post-SOX (Jain et al., 2008). I predict that this increased information efficiency
and/or increased market liquidity has strengthened the relation between institutional
investment and firm innovation, post-SOX. Highly innovative firms should attract more
institutional investment with the reduced information asymmetry post-SOX.
1.3. Main Results
In the second chapter, I find that foreign institutional investors who have low
governance quality at home, invest more in US firms. This result supports the flight-to-
quality argument regarding the investment behaviour of institutional investors. In
addition, I find more foreign institutional investment in US firms from countries whose
governance quality is similar to that of the US. Thus, I support the familiarity argument
at the country level. However, investors from countries whose governance quality is just
below (above) that of the US, invest more (less) in US firms. I conclude that the flight-
8 See Mohd (2005), Aboody and Lev (2000), Barth and Kasznik (1999), Barth and McNichols (2001) and Boone and Raman (2001).
24
to-quality and familiarity arguments have complementary effects on the investment
preferences of foreign institutional investors.
In addition, I examine the differences in the investment preferences of foreign
institutional investors. Although prior studies have examined the firm-specific
investment preferences of these investors, none has investigated the impact of the home
country’s governance quality on these preferences. I find that foreign institutional
investors who originate from countries with high governance quality, invest in firms
with high governance quality in the US. Thus, at the firm level, my result is consistent
with the familiarity argument.
In the third chapter, I investigate the economic effect of the enactment of SOX in the
US market, by examining the foreign institutional investment in the US, post-SOX. I
find an increased level of foreign institutional investment in US firms post-SOX. I argue
that the increased level of corporate disclosure, and the resulting decrease in
information asymmetry in the US, has made the US market a more reliable target for
foreign institutional investors and, as a result, they have increased their investment in it.
I find that this result is mainly driven by passive institutional investors. The value of
private information decreases in the US market post-SOX as a result of increased
information efficiency. Since passive investors do not have private information about
their investee firms, a decrease in the value of private information is more beneficial for
them.
Finally, I investigate the effect of SOX on the firm-specific investment preferences of
foreign institutional investors. I find that foreign institutional investors invest in both
prudent and non-prudent stocks post-SOX. According to Del Guercio (1996),
institutional investors prefer to invest in prudent stocks, in line with prudent man
behaviour. Since the information disclosure in a country is more important for foreign

25
institutional investors, the decreased information asymmetry due to the enactment of
SOX makes the non-prudent stocks more attractive for these investors. Stocks which
were not the traditional target for foreign institutional investors should be more accurate
and reliable and, as a result, should attract more foreign institutional investment post-
SOX. In line with this argument, I find that foreign institutional investors invest in
smaller stocks, stocks with higher leverage and those with lower dividend yields.
In the fourth chapter, I investigate the impact of SOX on the relation between
innovation and overall institutional ownership. I find that highly innovative firms attract
more institutional investment post-SOX. Since my results are driven by passive
institutional investors, I conclude that reduced information asymmetry in the US market
strengthens the relation between institutional ownership and innovation. I also find
more dedicated institutional ownership in highly innovative firms, post-SOX. As a
result, I conclude that the increased level of liquidity post-SOX cannot explain the
positive relation between innovation and institutional ownership. If this was the case, I
should have found a more pronounced non-dedicated institutional investment. Since
non-dedicated investors trade frequently, market liquidity is an important determinant of
their investment preferences.
Although each essay is a separate empirical study, all of them have a common thread:
institutional investment. In the second and third chapters, I examine the investment
preferences of foreign institutional investors. However, I explore the investment
preferences of all institutional investors in the fourth chapter. Second and third chapters
are connected through foreign institutional investment where as third and fourth
chapters are connected through SOX. Each empirical chapter highlights the importance
of the level of information asymmetry in the stock market (or in a firm) to the
investment preferences of institutional investors. However, the application of this idea is
26
different in each empirical chapter. In the second chapter, I show that the high
information efficiency of the US market attracts more foreign institutional investment
from less information-efficient countries. Thus, besides the importance of the target
country’s information efficiency, the information asymmetry level in the home country
of the foreign investor is important for his investment preferences. Further, in the third
and fourth chapters I show that a regulation, SOX, has changed the investment
preferences of institutional investors. In the third chapter, I show that, with the reduced
information asymmetry level in the US market post-SOX, foreign institutional
investment has increased. In addition, since the market is more reliable post-SOX, the
foreign institutional investors invest in less prudent stocks as well as prudent ones.
Following this idea, I find in the fourth chapter that the reduction in the level of
information asymmetry in the US market, post-SOX, has made highly innovative firms
more attractive to institutional investors. Put differently, in the third and fourth chapters
I argue that the confidence of investors in the US market has increased post-SOX and
institutional investors have started to invest in less prudent stocks.
1.4. Contribution
This thesis’ contribution is centred on its investigation of the investment preferences of
foreign and overall institutional investors investing in the US. Although foreign
institutional investment shows an increasing pattern in the US stock market, the existing
literature mainly focuses on aspects of US institutional investment, in the US or abroad.
By investigating the recent trends in foreign institutional investment in the US market,
in the second and third chapters, I differentiate my study from the existing literature.
Past literature generally examines how country and firm-level policies affect the
investment allocations of institutional investors, for example, Ferreira and Matos
27
(2008), Kang and Stulz (1997) and Leuz et al. (2009). However, I highlight the
importance of home country (as opposed to target country) governance quality as a
determinant of foreign institutional investment. I contribute to the literature by showing
the negative effect of home country governance quality on foreign institutional
investors’ investment decisions when they invest in the US. This result is an important
contribution to the literature. By finding evidence of this behaviour by foreign
institutional investors, this thesis provides a guide to foreigners about how they can
trade off the information costs associated with foreign investment. The evidence also
gives some idea to foreigners of how they might minimise the information cost. For
instance, foreign institutional investors can target familiar stocks to achieve this benefit.
Although prior literature shows flight-to-quality and familiarity arguments as alternative
explanations for the investment preferences of institutional investors, I report a
complementary effect between these two arguments9. These two arguments coexist for
the investment preferences of foreign institutional investors. Another contribution of
this thesis is the reported evidence in favour of the familiarity argument in the
investment preferences of foreign institutional investors when they invest in the US10.
This thesis also contributes to the SOX literature by demonstrating its effect on
institutional ownership. SOX was enacted as a result of some high-profile corporate
governance scandals in the US. Since its implementation, the effect of SOX on the US
economy has been an open question. The existing literature generally examines the
benefits, and mostly the costs, of SOX on firms listed in the US exchanges. However,
none so far have examined its effect on institutional investment. I report a benefit of
9 I find that foreign institutional investors from countries with low governance quality invest more in US firms. I also find that the foreign institutional investment in the US is more pronounced from countries with a similar level of governance quality to the US. 10 Foreigners who have high governance quality at home invest more in US firms with high governance quality.

28
SOX, in terms of increased foreign institutional investment since its enactment. I also
show how SOX has changed the investment preferences of foreign institutional
investors. Since its enactment, they not only invest in prudent stocks but in non-prudent
stocks as well.
Finally, I contribute to the innovation literature by examining the impact of SOX on the
relation between innovation and institutional ownership. I show that an improvement in
the information efficiency of the US market, with SOX, results with attracting
institutional investment to innovative firms. The existing literature generally examines
the relation between innovation and institutional ownership. However, none of them has
examined an effect of a regulation on this relation. By investigating the impact of SOX
on this relation, I contribute to the literature.
1.5. Structure of the Thesis
The thesis is organised as follows: In the second chapter, I examine the effect of
governance quality at home on the investment preferences of foreign institutional
investors. In the third chapter, I investigate the effect of SOX on the investment
preferences of foreign institutional investors. In the fourth chapter, I discuss the role of
SOX in determining the relation between innovation and institutional ownership. The
fifth chapter concludes.
29
CHAPTER 2: FOREIGN INSTITUTIONAL INVESTMENT: IS GOV ERNANCE QUALITY AT HOME IMPORTANT?
2.1. Introduction
Investors allocate only a small fraction of their wealth to foreign markets, a practice
typically referred to as the ‘home bias puzzle’ (Tesar and Werner, 1995). Kang and
Stulz (1997) identify explicit and implicit barriers as the most important explanation of
the home bias puzzle.11 Information asymmetry is one of the barriers that foreign
investors encounter when they invest abroad. Since the foreign investors have an
informational disadvantage relative to local investors, the cost of investing abroad is
high for them and it is this cost that prevents them from investing in foreign markets.12
However, recent trends document an increase in foreign investment as a result of
globalisation. With globalisation, foreign capital has become an important source of
finance in many capital markets and foreign investors have started to allocate more of
their money abroad (Leuz et al., 2009; Bekaert et al., 2002).
Over the last decade, equity ownership by foreign institutional investors in United
States (US) firms has almost doubled in size. In 1999, nearly 4% of the equity in S&P
1500 firms13 was in the hands of foreign institutional investors. This had increased to
8% by 2008. According to the 2008 US Treasury report on institutional holdings,
$2.969 trillion worth of capital is in the hands of foreign institutional investors. This
substantial and growing foreign investment in the US motivates the investigation of the
11
One explicit barrier is the constraint on foreign exchange transactions. Political risk and information asymmetry differences between foreign and domestic investors are examples of implicit barriers. 12Several studies, such as Brennan and Cao (1997), Kang and Stulz (1997), report the information disadvantage of foreign investors relative to domestic investors. Dvorak (2003) also discusses the information asymmetry between foreign and domestic investors. 13
S&P Composite 1500 covers approximately 85% of the US market capitalisation.

30
determinants of foreign investment. The fact that most of it is channelled through
institutional investors justifies the research focus of this chapter.
Although foreign institutional investors have grown in size and importance in the US
market, most of the academic studies on institutional ownership focus on aspects of US
institutional investment, either within the US or abroad with almost no attention being
paid to foreign institutional investment in the United States. Further, studies that focus
on the determinants of institutional ownership have always considered firm- specific
variables, such as financial performance, liquidity, size, volatility and corporate
governance setups (for example see Dahlquist and Robertsson, 2001; Almazan et al.,
2005; Li et al., 2006). The role of country-level governance quality has largely been
ignored.14
In this chapter, I examine the investment preferences of foreign institutional investors
investing in US firms and investigate the role of country-level governance quality on
their investment preferences. Specifically, I address two important research questions:
First, does the governance quality of the home country15 play any role in the foreign
institutional investor’s decision to invest in the US? Second, does country- level
governance quality affect the foreign institutional investor’s preferences for specific US
firms?
So far, the existing literature finds that, in order to avoid high levels of investment costs,
foreign institutional investors place importance on the country-level governance quality
of the countries they invest in (Li et al., 2006; Leuz et al., 2009). However, in this
chapter I argue that the governance quality of the foreign institutional investors’ own
14 Notable exemptions are the studies by Kim et al. (2011) and Forbes (2010); I refer to these papers in detail below. 15 Home country is the foreign institutional investors’ country of domicile.

31
countries affects their investment preferences as well. If they have low-quality
governance at home, their costs when investing at home might be much higher than the
costs they bear when investing abroad. This trades off the information asymmetry costs
associated with foreign investment. In line with the ‘good country bias’ theory of
Giannetti and Koskinen (2010), I argue that weak investor protection, low information
disclosure and, therefore, high information asymmetry result from low-quality
governance in a country. Thus, institutional investors who are domiciled in a country
with weak investor protection are inclined to invest in foreign countries that provide
higher-quality corporate governance than their home country. As a result, a good
country bias is seen in the investment preferences of foreign institutional investors.
Putting this a different way, I expect to see a pronounced effect of flight to quality in the
investment behaviour of foreign institutional investors who have lower governance
quality at home than exists in the United States. Still, one should acknowledge the
possibility of higher institutional investment levels from countries with similar
(therefore, even just above that of the US) levels of governance quality. Based on the
familiarity argument (Chan et al., 2005), institutional investors prefer the familiar to the
unfamiliar, since the former allows them to reduce the costs associated with investment
uncertainty and ‘prudent man rule’ mandates. Therefore, I argue that both biases, flight
to quality and familiarity, affect foreign institutional investment preferences in the US
market. My argument allows for heterogeneity in the investment preferences of foreign
institutional investors based on the relative distance in governance quality between the
US and the home country.
Furthermore, although prior studies (i.e., Ferreira and Matos, 2008; Kang and Stulz,
1997) have examined the relation between foreign institutional investment and firm-
specific characteristics, they have not investigated whether this relation depends on the
32
home country’s governance quality. I argue that foreigners do not have homogeneous
preferences when choosing the firms they invest in. Foreign institutional investors who
have low information asymmetry at home (high governance quality) invest in low
information asymmetry US stocks (high corporate governance quality stocks). This
prediction is in line with the familiarity argument. Foreign institutional investors look
for familiarity in stock characteristics when they invest abroad, because familiarity will
reduce the information costs and, as a result, the home bias will decrease. I proxy
familiarity with the similarity between the level of information asymmetry a foreign
investor is exposed to at home and the level they experience in the target firm.16
I find that foreign institutional investors who have low governance quality at home
invest more in the US market. To my knowledge, this study is among the first in the
literature to focus on home country governance quality as a determinant of foreign
institutional investment preferences. In addition, I examine differences in the choices of
institutional investors, based on the different levels of governance quality they
experience at home. I split my sampled countries into those with governance quality
above and below that of the US (the Above-US and Below-US groups) and thus
investigate separately foreign institutional investment from countries with higher and
lower governance quality than the United States. Foreign institutional investors from
countries with similar (just above/below) governance quality to that of the US invest
more in the US market. Thus, I also find support for the familiarity argument at the
country level: the closer the foreign institutional investors are to the US, in terms of the
governance quality they experience at home, the more they invest in the US. These
16 The literature uses several proxies for familiarity. I present some of them in Section 3.

33
findings suggest a complementary effect (instead of a substitution one) between the
familiarity and flight to quality arguments.
At the firm level, my results show that foreign institutional investors who come from
countries with high governance quality invest in US firms with good corporate
governance systems. Thus, the home country’s level of governance affects the
investor’s portfolio choices abroad. I argue that the familiarity bias holds even for firm-
level preferences. My results also indicate that this effect is driven by grey investors,
who do not actively monitor the management teams of the firms they invest in, and
therefore have the most to gain from a reduction in information asymmetry.
The rest of the chapter is structured as follows. In Section 2, I provide an overview of
the literature on the investment preferences of foreign institutional investors and
highlight my contributions. Section 3 presents my hypotheses. My data and
methodology follow in Section 4. Section 5 discusses the empirical results. Section 6
presents my robustness tests. Section 7 provides my conclusions.
2.2. Literature Review
Prior empirical work that examines the investment preferences of foreign institutional
investors typically investigates the preferences of US institutional investors when
investing abroad. Leuz et al. (2009) analyse the foreign holdings of US investors and
document that the typical US investor invests less in countries with weak legal
institutions and poor information frameworks. Aggarwal et al. (2005) examine the
investment choices of US mutual funds in emerging markets. They find that strong
accounting standards, shareholder rights and legal frameworks attract more US

34
investment. Ferreira and Matos (2008) also find that foreign institutional investors
invest more in countries that have strong governance systems. Having analysed the
equity holdings of mutual funds from 26 developed countries, Chan et al. (2005) report
that high levels of foreign institutional investment are expected in countries with low
expropriation risk. Li et al. (2006) use the degree of enforcement of shareholder rights
as a proxy for a country’s governance quality. They find a positive association between
the degree of enforcement and foreign institutional investment. Finally, Gelos and Wei
(2005) find that international institutional investors invest in more transparent
markets.17
All the above papers examine the effect of the governance quality of the countries in
which the institutional investors are investing (target country) and establish a significant
link with foreign investment levels (capital inflows). However, I argue that foreign
institutional investment preferences are not homogeneous with regard to country-level
governance quality. By examining the differences between the home country’s
governance quality and a benchmark, i.e., the level of governance in the US, I study the
sources and impact of this heterogeneity. My research design allows me to examine the
impact of each country’s governance quality (home country) on the level of foreign
investment in the US by institutional investors domiciled in that country (capital
outflows). Two recent papers investigate foreign investment in the US market. Cai and
Warnock (2006) study the security-level investment preferences of foreign and domestic
institutional investors in the United States. They identify a preference of institutional
investors for domestic multinationals. They argue that this is a safe way of achieving
international diversification. The scope and focus of my study is different. In particular,
17 La Porta et al. (1997, 1998 and 2000) also examine the effect of country-level governance quality on investment decisions.

35
I relate investment preferences to home governance quality and investigate the
investment patterns of foreign institutional investors both at the country and firm levels.
I find that the heterogeneity in countries’ governance quality around the globe explains
the investment choices in the US market.
The paper closest to this study is that of Forbes (2010). She studies the level of foreign
investment in the US and concludes that foreign investors hold a greater amount of their
wealth in the United States, if they have a less developed financial market at home.
There are significant differences between my study and that of Forbes (2010). Forbes
(2010) studies the holdings of all types of foreign investors, including government
agencies and other official institutions. In contrast, I focus on private institutional
investment; I expect market-based considerations, e.g., governance quality, to be the
main driver of the decision making of this group of informed investors. Political, and
other non-market based, influences are expected to carry less weight in the investment
choices of this group. Also, Forbes (2010) investigates foreign holdings in both the
equity and debt markets. There are substantial differences in the profiles of investments
in equities and liabilities, e.g., risk characteristics and exposure, investment horizon,
investor types. To avoid capturing systematic differences in the investor profiles, which
might affect my results in unpredictable ways, I focus only on the equity markets. In
addition, my research design helps me to explore the heterogeneity in the governance
quality of countries with substantially different profiles to that of the United States. My
findings on the co-existence of the flight to quality and familiarity biases extend those
provided by Forbes (2010) and help us to reconcile the conflicting evidence she offers
with that of other studies (e.g., Aggarwal et al., 2005). Finally, but equally importantly,
I also provide security-level analyses, which highlight the importance of governance
36
quality at home for the firm-level investment preferences of foreign investors, which
Forbes (2010) does not consider; I turn to this literature below.
The literature examines the effect of firm-level governance quality on foreign
institutional investment, without taking into account the effect of the home country’s
governance quality. The definition of ‘good governance’ varies between studies.18 Kang
and Stulz (1997), Ahearne et al. (2004) and Aggarwal et al. (2005) use the ADR
(American Depository Receipt) issuance as a proxy for strong shareholder rights, or a
reduction in asymmetric information, for foreign firms and find that firms with ADR
issuance have high levels of US ownership. Leuz et al. (2009) also conclude that US
institutional investors invest less in foreign stocks with high information asymmetry and
high monitoring costs. Furthermore, Giannetti and Simonov (2006) show, for the
Swedish market, that foreigners invest less in firms with high levels of outside investor
expropriation.19
A recent study by Kim et al. (2011) finds that if an investor’s country has a low level of
disparity between ownership and control, the investor does not invest in high-disparity
firms in the Korean market. My study is different to that of Kim et al. (2011) in the
following ways: First, Kim et al. (2011) use the disparity between control and
ownership as their proxy for corporate governance risk, hence concentrating on the risk
of tunnelling by controlling shareholders. I capture the country-level governance quality
using the World Bank KKM (Kaufmann et al., 2008) indicators. These six key
18 McKinsey and Company (2002) report the following ranking in the investors’ governance priorities: strong shareholder rights (for 33% of investors), good accounting standards (for 32% of investors), more effective disclosure (for 31% of investors), and stronger enforcement (for 27% of investors). 19 Other studies examine the effect of firm-level accounting variables on institutional investment. For example, Dahlquist and Robertsson (2001), Kang and Stulz (1997), Gompers and Metrick (2001), Falkenstein (1996), Ferreira and Matos (2008) and Khurshed et al. (2011).
37
indicators provide a more holistic representation of a country’s governance level.20
Second, Kim et al. examine the behaviour of all investors, retail and institutional. I
concentrate on institutional investors since they are informed, highly-skilled traders, and
therefore my conjectures on their investment preferences, based on the governance
quality at home and abroad (the processing of which information requires expert
knowledge and tools), appear more robust. Third, Kim et al. examine the investment
preferences of foreign investors in an emerging market, i.e., Korea; it is unclear what
the foreign investors’ perceptions of the overall governance quality of Korea are (thus it
is unclear whether this factor affects the heterogeneity of foreign investors investing in
this country). However, I study foreign investment in the US, which undoubtedly has a
strong corporate governance system, thus allowing the maximum possible degree of
investor heterogeneity. Finally, my research design helps us to reconcile the results
reported in Kim et al. (2011) with the conflicting evidence provided by prior studies.
2.3. Hypotheses
Domestic investors prefer to invest more in their local market than abroad. This ‘home
bias puzzle’ (Lewis, 1999) is mainly attributed to the higher information asymmetry
costs associated with investing abroad. Given that domestic investors have more
information about the domestic economy, foreign investors suffer from adverse
selection problems and require a premium in order to compete with domestic investors.
However, there is a considerable and growing amount of foreign institutional
investment in the United States (see Table 2.1). This indicates that the US market offers
20
Beltratti et al. (2009) and Caprio et al. (2011) use the KKM measures as proxies for country-level governance quality.

38
investment opportunities to foreign investors that can give them the required premium
to compensate them for their adverse selection problems. Given the recent high levels of
foreign investment in the US, I explore the factors that attract high level of foreign
institutional investment to the US market. I argue that the level of investor protection is
one of the most important factors in drawing foreign investment to the United States.
Investor protection is defined as “...the extent of the laws that protect investors’ rights
and the strength of the legal institutions that facilitate law enforcement” (Defond and
Hung, 2004; p. 269). The level of investor protection depends on the governance quality
of a country. It is well-documented in the literature that investors prefer to invest in
countries with high-quality governance, and thus a high level of investor protection, for
e.g. Aggarwal et al. (2005) and Leuz et al. (2009). Even if a firm has good internal
corporate governance, if it is domiciled in a country with weak governance quality, it
benefits less from the domestic capital markets. It cannot reduce its cost of capital to the
level it would obtain if it was domiciled in a country with good governance (Doidge et
al., 2007). Firms cannot compensate for the absence of a high-quality governance
environment. They can improve the quality of their internal corporate governance
quality but this cannot substitute for the quality of legal rules (Klapper and Love, 2004).
In line with this argument, I predict that one of the most important determinants of
institutional investment is the quality of the governance environment. I expect the level
of governance at home to affect the level of institutional investment abroad, as investors
try to identify better investment opportunities in a globalised environment.
The good country bias theory of Giannetti and Koskinen (2010) helps me to build my
first hypothesis. I argue that institutional investors domiciled in countries with low
levels of investor protection, are inclined to seek investment opportunities in foreign
39
countries that provide better investor protection. This allows them to take advantage of
the high-quality governance in better protected economies and identify more cost-
efficient investments. The extent of this strategy depends on how bad the home
governance is compared to the level of governance in the target country. In other words,
I expect the flight to quality of foreign institutional investors to vary systematically with
respect to the relative distance in governance quality between the home and target
countries.
The investigation of the relative distance between countries also allows me to test an
alternative argument based on the familiarity bias. This postulates that foreign investors
prefer to invest more in familiar environments since this helps them reduce their
information asymmetry costs. Therefore, one would expect foreign investors to invest
more in countries with a similar level of governance quality to that of their home
country. The literature so far presents the familiarity and flight to quality biases as
substitutes. The evidence produced supports either but not both. In this chapter, I
hypothesise that both effects can co-exist; it is an empirical question whether the
magnitude of either effect is more pronounced.
Hypothesis 1a: If the governance quality of an investor’s country is lower than that of
the US, the investor will invest in the United States.
Hypothesis 1b: If the governance quality of an investor’s country is similar to that of
the US, the investor will invest in the United States.

40
I use the United States as the “benchmark” in order to investigate the importance of the
difference between countries’ governance regimes. The US economy provides a high
standard of investor protection and information disclosure, and thus can operate as an
ideal benchmark, since it should allow the greatest possible heterogeneity in foreign
investor origins, i.e., several countries will be represented.
As I mention above, one way of reducing the information asymmetry costs associated
with a foreign investment is by investing in familiar stocks abroad i.e., stocks that share
characteristics with firms at home. Merton (1987) documents that investors prefer to
invest in stocks they have information about. Chan et al. (2005) argue that foreign
institutional investors aim at investing in familiar stocks, since they can better process
the available information for these firms. Also, given that institutional investors are
typically bound by “prudent man rules” (Del Guercio, 1996), they need to invest in
reliable assets. According to these rules, institutional investors have incentives to
protect themselves from liability by tilting their portfolios toward those assets that are
easy to defend in court. Therefore, understanding the structure, organisation, business
activities, etc., of a firm is vital to them. In line with the familiarity argument, foreign
investors who experience high governance quality at home are expected to invest more
in US stocks with high-quality corporate governance.
Prior literature uses several definitions for familiarity. According to Kang and Stulz
(1997), larger and more internationally-known stocks are familiar stocks to foreign
investors. Coval and Moskowitz (1999) find that geographical proximity to be an
important factor for foreign mutual funds in identifying familiar stocks. Grinblatt and
Keloharju (2001) show common language and cultural background as a reason for
foreign investors to invest in Finland. I expect a firm to be familiar to a foreign investor

41
when the level of information asymmetry within the firm resembles the information
asymmetry level in the investor’s country of domicile.
I exploit the cross-sectional variation in the corporate governance quality of US firms. I
expect foreign institutional investors who have a high quality of country-level
governance quality at home to invest in US firms with high internal governance scores.
Thus, I expect that the governance quality in investors’ home countries affects their
portfolio choices abroad.
Hypothesis 2: Foreign institutional investors who experience high governance quality
in their home countries prefer to invest in US firms with high corporate governance
quality.
2.4. Data and Methodology
2.4.1 Data
I use the Thomson-Reuters Institutional Holdings database to collect data on foreign
institutional ownership from the 13F filings of US firms for the period 1999-2008.21 I
include all stocks listed in the S&P1500 index, i.e., constituent firms of the S&P 500,
S&P MidCap 400 and S&P SmallCap 600 indices; I exclude ADRs and foreign stocks. I
identify more than three million investor-level observations; foreign institutional
investors originate from 18 countries (see Appendix A).22 Foreign institutional investors
represented in my sample come from countries of English, French, German and
21 The availability of information on the country of origin of institutional investors dictates my choice on start date for my sample period, i.e., 1999. 22 The majority of foreign investment in the US originates from the United Kingdom, i.e., more than 50% in each year. I provide annual information on country-level holdings in Appendix A.
42
Scandinavian legal origin. Foreign investors from tax haven countries (Bahamas,
Barbados, Bermuda and Cayman Islands) are also included in my sample. A significant
proportion of foreign investors from tax haven countries are likely to be US investors
with business registered overseas rather than genuine domestic investors in these
countries. I examine the influence of this subsample on the results of my analysis by
conducting a robustness test in which I exclude this subsample. For every firm in my
sample, I aggregate the holdings of investors from the same countries, creating 77,697
country-level observations.
For the accounting variables I use the Compustat North America database. Data for
market turnover is collected from CRSP. Corporate governance information, i.e., the
directors’ index (DINDEX), is collected from the director files of the Investor
Responsibility Research Centre (IRRC), available through the RiskMetrics database.
Compustat, IRRC and CRSP provide the related firm-level data at each fiscal year-end.
The 13F filings report institutional investor holdings on a quarterly basis. I use the
institutional holdings reported for the last quarter of each fiscal year and merge these
with the other accounting and market data. Missing data on accounting variables and
firm-level governance indicators, reduces my sample size to 59,491 observations.
I follow Beltratti et al. (2009) in using the average of the Kaufmann, Kraay and
Mastruzzi (KKM) governance indicators as a proxy for a country’s governance quality.
The World Bank website provides these indicators for each country in my sample for all
related years.23 I collect additional country-level turnover data from Datastream.
23 http://info.worldbank.org/governance/wgi/index.asp

43
2.4.2 Variables
Country-Level Governance Quality
My main proxies for a country’s governance quality are the KKM governance quality
indicators as defined by Kaufman et al. (2008). I take the average of the six KKM
indicators to create a variable which captures the annual average governance quality of
a country. These indicators cover several dimensions of a country’s governance, related
to the level of accountability and freedom of speech, the efficiency and stability of the
political system, the quality and independence of public services, the regulatory quality,
the rule of law, and the level of corruption.24 All these indicators capture, to varying
degrees, the level of information asymmetry and uncertainty under which investors
operate in a country. For this reason, I attempt to isolate their joint effect by calculating
their average.
In my robustness checks, I alternatively define the level of governance in a country by
the turnover ratio of its main financial market. The large literature on the relationship
between law and finance (e.g., La Porta et al., 1998) finds that better governed countries
are associated with more developed financial markets. A proxy for the development and
depth of a market is its liquidity, typically measured through the dollar volume of shares
24
According to Kaufman et al. (2008, p. 3-4): “1. Voice and Accountability (VA), measures the extent to which a country's citizens are able to participate in selecting their government, as well as freedom of expression, freedom of association, and a free media. 2. Political Stability and Absence of Violence (PV), measures perceptions of the likelihood that the government will be destabilized or overthrown by unconstitutional or violent means, including domestic violence and terrorism. 3. Government Effectiveness (GE), measures the quality of public services, the quality of the civil service and the degree of its independence from political pressures, the quality of policy formulation and implementation, and the credibility of the government's commitment to such policies. 4. Regulatory Quality (RQ), measures the ability of the government to formulate and implement sound policies and regulations that permit and promote private sector development. 5. Rule of Law (RL), measures the extent to which agents have confidence in and abide by the rules of society, and in particular the quality of contract enforcement, the police, and the courts, as well as the likelihood of crime and violence. 6. Control of Corruption (CC), measures the extent to which public power is exercised for private gain, including both petty and grand forms of corruption, as well as “capture” of the state by elites and private interests.”

44
traded in the market over a given period, scaled by its market capitalisation, i.e.,
turnover ratio. To calculate the turnover ratio for all the countries in my sample, I
collect the appropriate variables from Datastream.25 I also collect information on the
holdings of US institutional investors abroad and use this to classify my countries. High
levels of US investment are associated with more developed foreign financial markets. I
retrieve the relevant data from the Bureau of Economic Analysis reports.
Firm-Level Variables
I follow the extant literature, in particular Ferreira and Matos (2006), Dahlquist and
Robertsson (2001) and Bushee et al. (2010), to identify and define the relevant firm-
level variables:
(i) Firm Size (SIZE): I take the logarithm of the fiscal year-end market value of equity
as a proxy for firm size (Compustat item MKVLT). Prior studies mainly report a
positive relation between firm size and institutional ownership. For example, Dahlquist
and Robertsson (2001) agree with Merton (1987) and Huberman (2001), who argue that
investors prefer firms which are more well-known and with which they are familiar, and
find a significant positive relationship between firm size and investor ownership. This
positive relationship between size and institutional ownership is consistent with the
results of Badrinath et al. (1989), Cready (1994), Falkenstein (1996), and Benett et al.
(2003) for US firms. In contrast, Hussain (2000) finds that institutional investors in the
UK prefer to invest in smaller and riskier firms. In addition, Bennett et al. (2003) find
that institutional investors appear to have recently changed their preferences in favour of
25
Turnover is defined as the average daily turnover by value in a year (Datastream item VA) divided by the average daily market value of the country in that year.

45
smaller and riskier securities since these stocks provide an opportunity for institutional
investors to exploit their informational advantages.
(ii) Book-to-Market Ratio (BM): I use the logarithm of the ratio of the book value of
common equity outstanding (Compustat item CEQ) to the market value of equity, to
calculate BM. BM is used to differentiate between value and growth stocks. High and
low values represent value and growth firms, respectively. According to Lakonishok et
al. (1994) and Dahlquist and Robertsson (2001), institutional investors prefer growth
firms. Ferreira and Matos (2008), however, find that US (foreign) institutional investors
prefer value (growth) stocks.
(iii) Firm Market Turnover (TURN): I first calculate the monthly turnover of a stock,
which is equal to its monthly volume (CRSP item VOL) scaled by the firm’s shares
outstanding for that month (CRSP item SHROUT). The annual figure is the average of
the twelve monthly observations. Turnover measures the market liquidity of a firm’s
shares (Dahlquist and Robertsson, 2001). According to Almazan et al. (2005), liquid
stocks are characterised by greater information flows, i.e., less information asymmetry,
which allows institutional investors to better identify and replace poor managers.
Gompers and Metrick (2001) use size, price and turnover as determinants of liquidity
and also report a positive relation between institutional holdings and market liquidity.
(iv) Dividend Yield (DY): Dividend yield is the dividend per share (Compustat item
DVPSX-F) divided by the fiscal year-end share price (Compustat item PRCC-F).
According to Dahlquist and Robertsson (2001), foreign institutional investors invest in
low dividend paying stocks because of tax advantages.

46
(v) Return on Equity (ROE): Return on equity proxies for the profitability of a firm
and is calculated as the ratio of net income (Compustat item NI) to common equity
(Compustat item CEQ). Aggarwal et al. (2005) find that institutional holdings are
positively related to the return on equity of the firms in which institutions invest.
(vi) Leverage (LEV): Leverage is the ratio of debt in current liabilities (Compustat
item DLC) plus long-term total debt (Compustat item DLTT) to total assets (Compustat
item AT). Leverage determines the investment choices of institutional investors in the
following ways. Jensen and Meckling (1976) argue that debt reduces a firm’s agency
costs through increased monitoring by the bondholders. If institutional ownership acts
as a monitoring mechanism as well, one would expect to see a negative relationship
between leverage and institutional ownership due to the substitution effect. Bathala et
al. (1994) examine the role of institutional ownership on managerial ownership and debt
policy. They indeed find a negative relation between debt levels and institutional
ownership. In addition, Dahlquist and Robertsson (2001) argue that leverage is a
measure of a firm’s long-term financial distress and find that foreign investors avoid
investing in firms with high leverage.
(vii) Cash (CASH): Cash is the ratio of cash and short-term investments (Compustat
item CHE) to total assets (Compustat item AT). According to Dahlquist and Robertsson
(2001), institutional investors prefer to invest in firms with more cash, since these firms
are associated with greater financial strength.
(viii) Directors Index (DINDEX): I follow Bushee et al. (2010) to create this index.
DINDEX includes five different dummy variables for: board size, percentage of
independent directors, CEO-chairman duality, presence of board interlocks, and
attendance of board meetings. If the CEO and chairman positions are combined, there
47
are less checks and balances for the CEO, and therefore less monitoring of his actions. I
create a dummy variable (CEO) which is equal to one if the positions are combined and
zero otherwise. Interlocked directors are defined as directors who serve on each other’s
boards and their presence on a board is considered an indicator of weaker governance.
Bushee et al. (2010, p. 11) explain the reasoning behind this idea as follows:
“Interlocked directors are considered indicative of weaker governance because such
directors have reciprocating relationships that create incentives to vote in ways that
benefit their counterparts and, hence, themselves.” I create a variable (DLOCK) which
is equal to one if there are any interlocks on the board of directors and zero otherwise. If
there is less attendance of board meetings, in theory the monitoring of the management
team will be less successful. Therefore, a low attendance level is an indication of
ineffective governance. I code a variable (DBAD) as one if any of the directors miss 75
percent or more of the board meetings and zero otherwise. The proxy for board size is
the logarithm of the number of directors (LNDIR). If the board is large, it is assumed
that there are communication, coordination and decision making problems. Next, since
independent directors’ careers do not depend heavily on the management team, they are
considered to be more effective monitors of a firm’s managers. To measure ineffective
governance, I calculate the percentage of directors that are dependent (PNID). DINDEX
so far includes three dummy variables, CEO, DLOCK and DBAD, and indicators for
whether the firm has high levels of LNDIR and PNID. I then split the distribution of
LNDIR and PNID into high and low groups using k-means cluster analysis. I create
dummies for these two variables which are equal to one if they are in the high group and
zero otherwise. Therefore, I now have five dummy variables and the DINDEX variable
(the sum of these five dummy variables) takes values between zero and five. A value of
zero (five) indicates a board with the most effective (weakest) governance structure.
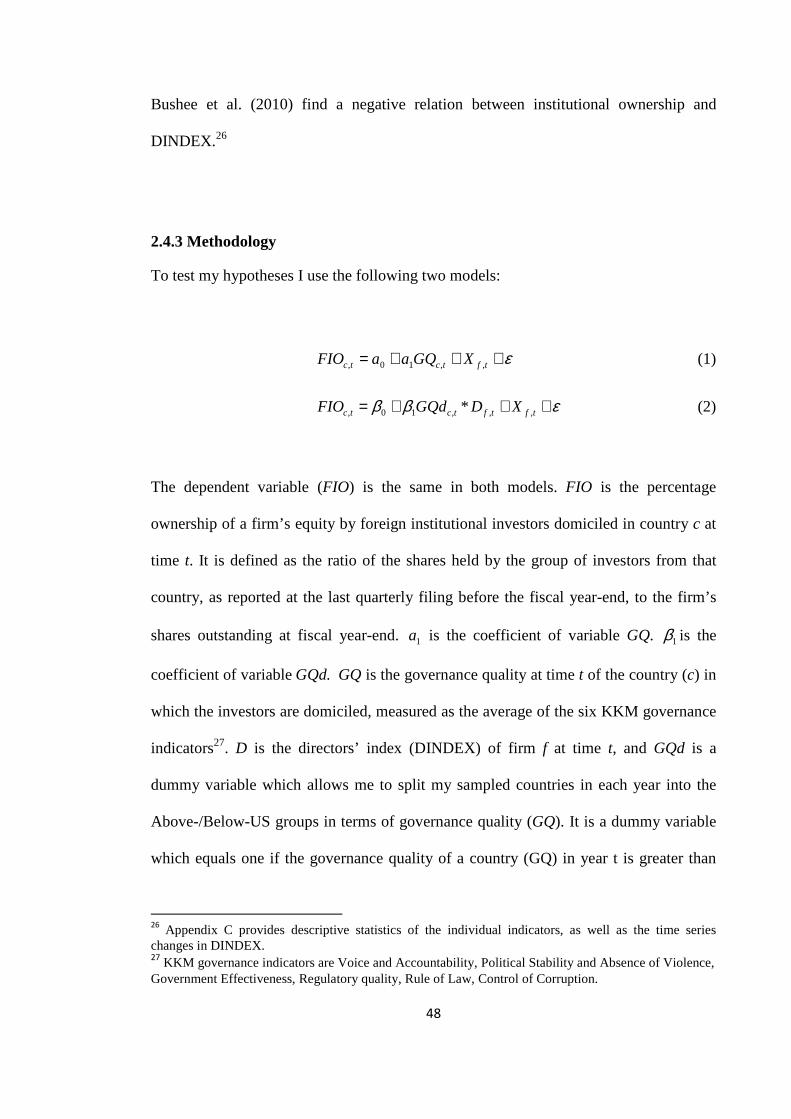
48
Bushee et al. (2010) find a negative relation between institutional ownership and
DINDEX.26
2.4.3 Methodology
To test my hypotheses I use the following two models:
ε+++= tftctc XGQaaFIO ,,10, (1)
εββ +++= tftftctc XDGQdFIO ,,,10, * (2)
The dependent variable (FIO) is the same in both models. FIO is the percentage
ownership of a firm’s equity by foreign institutional investors domiciled in country c at
time t. It is defined as the ratio of the shares held by the group of investors from that
country, as reported at the last quarterly filing before the fiscal year-end, to the firm’s
shares outstanding at fiscal year-end. 1a is the coefficient of variable GQ. 1β is the
coefficient of variable GQd. GQ is the governance quality at time t of the country (c) in
which the investors are domiciled, measured as the average of the six KKM governance
indicators27. D is the directors’ index (DINDEX) of firm f at time t, and GQd is a
dummy variable which allows me to split my sampled countries in each year into the
Above-/Below-US groups in terms of governance quality (GQ). It is a dummy variable
which equals one if the governance quality of a country (GQ) in year t is greater than
26
Appendix C provides descriptive statistics of the individual indicators, as well as the time series changes in DINDEX. 27
KKM governance indicators are Voice and Accountability, Political Stability and Absence of Violence, Government Effectiveness, Regulatory quality, Rule of Law, Control of Corruption.

49
that of the US in that year and zero otherwise. To confirm my hypotheses, I expect the
coefficients α1 and β1 to be negative and statistically significant.
In both models, I use the same vector of firm-level control variables (X). These are firm
size, book-to-market ratio, dividend yield, turnover ratio, return on equity, leverage and
cash level.
I use random-effect Tobit panel regressions to run my analyses. I opt for this model
specification since my dependent variable is censored between zero and one. Tobit
regressions allow me to control for the substantial observed clustering of the dependent
variable at values close to zero (left clustering at 0.001% is pronounced). All
specifications account for random unobserved firm effects. I also add country fixed
effects into my models, to account for omitted time-invariant country effects.28 In
addition, I include year dummies to control for cross-sectional dependence, i.e., market-
wide effects that could influence the level of foreign institutional investment in the US
market.
In my robustness section, I also present alternative model specifications that control for
the influence of specific market-wide influences, such as the enactment of the Sarbanes-
Oxley Act (SOX) in 2002, as well as firm fixed effects.
28
Leuz et al. (2009) present several additional macroeconomic factors that might affect the level of foreign institutional investment, for example the degree of market integration, transaction costs, language and restrictions on capital flows. Even though some of these factors change over time, arguably these changes are going to be small in my short time series.

50
2.5. Empirical Results
2.5.1. Descriptive Analyses
Table 2.1, Panel A, presents the fraction of shares held by foreign (FI) and domestic
(DI) institutional investors as well as overall institutional investment (TI) in the US
between the years 1999 and 2008. I define institutional investment (II ) as the fraction of
a firm’s stocks that are owned by institutional investors (Gompers and Metrick, 2001).
Panel A illustrates that TI increases almost monotonically over my sample period,
reaching 70% in 2008. DI follows a similar pattern. Apart from a decline in 2003,
foreign institutional ownership levels increase during the sample period. By the end of
2008, FI levels were twice of those that existed in 1999 (8% compared to 4%). This
large increase in FI confirms that the level of foreign institutional holdings in the US
has grown significantly in recent years.
Table 2.1, Panel B, gives a breakdown of the different types of institutional investors
who invest in the US. The Thomson-Reuters database identifies five types of
institutional investors: Banks, Insurance Companies, Investment Companies and their
managers, Independent Investment Advisors and Others. Others includes Public Pension
Funds, University Endowments and Foundations. However, Thomson-Reuters has
serious classification errors in the S34 file (widely reported in the literature) with many
banks and independent investment advisors classified as Others from 1998 onwards.
Because of this classification problem, I categorise institutional investors according to
the Bushee et al. (2010) classification.29 Following Bushee et al., I am able to identify
Public Pension Funds and therefore separate them from the Others group. I also classify
29 The data for this classification are available from http://acct3.wharton.upenn.edu/faculty/bushee/
51
investment companies and independent investment advisors into one group, which I call
investment advisors (IA). I end up with five different types of institutional investors:
Banks, Insurance Companies, Investment Advisors, Public Pension Funds and Others.
According to Panel B, out of the five types of institutional investors, Investment
Advisors invest the most in US firms. Their investment levels increase over the sample
period to reach 45% in 2008. Banks are the next largest investors after Investment
Advisors, in terms of holdings, reaching 15% in 2008. Insurance Companies and Public
Pension Funds do not show substantial increases in their holdings during the sample
period. The holdings of Others quadruple over my sample period.
Table 2.2, Panel A, presents summary statistics of the governance variables. The
governance indicators take values between 2.5 and -2.5. A value of 2.5 (-2.5), indicates
the highest (lowest) level of governance quality. Most governance indicators have an
average of one or above, indicating a high quality of governance at the global level.
Nevertheless, the standard deviation shows significant heterogeneity, both cross-
sectionally and along the time-series.30 Table 2.2, Panel B, reports the descriptive
statistics for the firm-specific characteristics. I winsorise leverage, dividend yield and
return on equity at 1% (two tail) because these variables are highly skewed. The average
firm in my sample has a market value of $5.7 billion and a return on equity of 9%. The
average log book-to-market ratio is -86%, leverage is at 23%, and turnover is almost
19%. Cash holdings account for 14% of the value of total assets and the average
directors’ index is 1.7, indicating an above average (i.e., 2.5) level of internal
governance quality. Ferreira and Matos (2008) report similar values for dividend yield,
30
I provide the cross-sectional and time-series changes in GQ in Appendix B.

52
leverage and cash ratio but a higher (lower) average return on equity (book-to-market
ratio). Bushee et al. (2010), report a similar average turnover ratio (15%).
Table 2.3 reports the Pearson correlation coefficients for all the variables used in this
study. At a univariate level, FIO is negatively correlated with size which is consistent
with prior literature (Ferreira and Matos, 2008). Moreover, I find a negative relation
between foreign institutional investment and DINDEX, indicating that institutional
investors prefer to invest in firms with high-quality corporate governance. DINDEX
takes values between zero and five. The higher the value of DINDEX the lower is the
firm’s governance quality. Since I find a negative coefficient for DINDEX, I conclude
that institutional investors prefer to invest in firms with high-quality corporate
governance. Country governance (GQ) positively affects FIO in the US market. This is
consistent with the familiarity argument. Still, caution should be exercised in
interpreting this result. I present detailed multivariate results in the next paragraphs
which illustrate that the univariate result is only part of the story. Finally, FIO is also
positively and significantly correlated with turnover and book-to-market ratio. In
contrast, FIO is negatively correlated with return on equity and monitoring cost.
The results presented in Table 2.3 show that multi-collinearity is not an issue in my
subsequent multivariate analyses. The only exception is the 50% correlation reported
between the turnover ratio and monitoring cost (MC), which is expected given that
monitoring cost is defined as 1/Turnover (Almazan et al., 2005). So I exclude turnover
from all model specifications that use MC to alleviate concerns about multi-collinearity.
My results are not sensitive to this decision (unreported results). I also check for multi-
53
collinearity using Belsley, Kuh, and Welsch (BKW) (1980) condition number and
conclude that multi-collinearity is not an issue in my analysis31.
2.5.2. Foreign Institutional Ownership and Country Governance
I start by examining whether the governance quality of foreign institutional investors’
home countries drives foreign institutional investment in the United States. Table 2.4
presents the results of random-effect Tobit regressions where the dependent variable is
FIO. Consistent with my predictions, I find a negative, significant relation between GQ
and foreign institutional ownership. Institutional investors from countries where the
governance is of a lower quality are associated with higher investment levels in US
firms. This result is in line with the flight to quality argument.
In the second model, I insert a dummy variable that splits the institutional investors’
countries into the Above-/Below-US groups (GQd). The coefficient of GQd is negative
and highly significant, further confirming the flight to quality argument.
To test my second hypothesis, I interact GQd with each firm’s DINDEX (GQd*D). I
find a negative, significant relation between GQd*D and FIO. This shows, consistent
with the familiarity argument, that foreign institutional investors who come from better
(than the US) -governed countries prefer to invest in US firms with high levels of
internal governance. The coefficient remains negative and significant even when I use
an alternative proxy (MC) for corporate governance in my last model, i.e., foreign
institutional investors from well-governed (better than the US) countries invest in US
firms with low monitoring costs.
31
The BKW condition number calculates and displays the matrix of variance decomposition proportions for the independent variables. Since the condition number is lower than 30 in my analysis, I conclude that multi-collinearity is not an issue.
54
The above results, even though significant and robust, do not allow me to observe any
heterogeneous preferences within the Above-/Below-US groups. In Table 2.5, I address
this limitation by running the initial test (the first model specification of Table 2.4)
separately for the investors from countries from each group. I find a negative (positive)
and significant relationship between FIO and GQ in the above (below) group. Thus,
among the foreign investors who experience a higher quality of governance at home
than exists in the US, it is those with a lower GQ that invest more in US firms.
Meanwhile, for the below-US group, foreign investors with a higher GQ invest more in
US firms. In other words, investors from countries that are closest to the US (just above
and below the US), in terms of governance quality, invest the most in the US market.
This is clear evidence of familiarity.
Figure 1 illustrates the country-level findings from Tables 2.4 and 2.5. Investors from
countries with higher (lower) governance quality than the US belong to the Above-
(Below-) US group. Results in Table 2.4 provide evidence of flight to quality by foreign
institutional investors. Investment levels in the average US firm are higher from the
Below-US countries than from the Above-US countries. But this result is mainly driven
by those countries whose governance levels are just below that of the US. In other
words, institutional investors from countries with significantly different governance
quality to that of the US do not invest in US firms. I can only speculate on the reasons
behind this. It seems rational that these institutional investors face only moderate
pressure from their end-users to invest in better quality countries. These investors might
also be faced with substantial barriers when trying to invest in the US (capital controls,
informational barriers, etc). Finally, this result might also be a manifestation that
smaller countries, that are less likely to have institutional investors big enough to
55
achieve internationally diversified portfolios, do not invest in their governance quality.32
In contrast, for the Above-US group, it is clear that investors from countries with a
significantly better level of governance quality than that of the US have no incentive to
invest in the US. For them, there are no benefits in investing in a country with a
significantly lower quality of governance that would justify the additional costs
associated with an investment abroad.
Appendices A and B show that amongst foreign institutional investors, the UK
institutional investors are the largest investors in US firms and that the UK has higher
level of governance quality than the US during my sample period. In order to test
whether my results in Table 2.5 are driven by the UK institutional investors, I exclude
institutional investors domiciled in the UK from my dataset and run my regression again
(Table 2.5, model 2). Given that the UK has higher governance quality than the US for
every year in my sample, it is only meaningful to re-run the Above-US regression
without UK domiciled institutional investors (indeed re-running the Below-US model
after excluding UK holdings gives me the same coefficients). My results are similar in
that I find a negative and significant relationship between FIO and GQ in the above
group. A difference from the previous regression results is that the large GQ coefficient
in Above-US regression (-11.793) drops to -1.554 when I exclude UK domiciled
institutional investors.
2.6. Robustness Tests
I run a series of tests to examine the robustness of my results. In Table 2.6, I show the
results of allowing heterogeneity in the monitoring activity of the foreign institutional 32 According to La Porta et. al. (2006) there is a positive relationship between the size of the country and its governance quality. Thus, if a country is small in size, its governance quality should be low. These low governance quality countries have small institutional investors that cannot achieve international diversification. Because of this, I do not expect an investment from these countries to the US.
56
investors. Foreign investment levels in the US could be driven by investors who bear
the monitoring costs in a firm (active monitors). These are investors who could try to
reduce their portfolios’ monitoring costs by investing in a country with lower MC
levels. If there are systematic differences in the country of origin of these investors I
could observe different results between active and passive institutional investors.
Following Bushee et al. (2010), I classify banks, insurance companies, corporate
pension funds, university foundation endowments and others as grey (passive)
investors. In contrast, investment companies, independent investment advisors and
public pension funds are classified as independent (active) investors. Table 2.6 shows
that there are no differences in the investment preferences of active and passive foreign
institutional investors, with regard to the governance of the country in which they are
investing. The flight to quality argument is valid for both types of investors.
Interestingly, there are differences with respect to firm-level investment. The familiarity
argument holds only for the grey foreign institutional investors. This is not a surprising
result: given that grey investors do not engage in active monitoring of a firm’s
management team, they are likely to prefer to invest in more familiar firms so as to
reduce the increased information asymmetry associated with investing abroad.
In Table 2.7, I use alternative proxies for a country’s governance quality. Following the
law and finance literature (La Porta et al., 1998) I assume a positive relationship
between a country’s governance quality and the development of its main financial
market. I use market liquidity (market turnover ratio) as a proxy for the development
and depth of the financial market. I introduce the variable Td*D in the first column.
Td*D is an interaction term that includes a country level turnover dummy (Td) and
DINDEX. Td is equal to one if the turnover ratio of a country’s market is greater than
the turnover ratio of the US market in a given year and zero otherwise. I test whether

57
foreign institutional investors who have developed markets at home (high governance
quality or less information asymmetry) prefer to invest in high governance quality
stocks (stocks with less information asymmetry) in the US. Table 2.7 reports a negative
relationship between Td*D and foreign institutional investment. Thus, foreign
institutional investors who experience less information asymmetry (high governance
quality or a developed market) in their home countries prefer to invest in stocks
involving less information asymmetry (those with high governance quality) in the US.
This result is consistent with the familiarity argument. The result becomes insignificant
if, instead of DINDEX, I use monitoring cost (MC) as the proxy for a firm’s information
asymmetry. However caution should be exercised when interpreting the turnover
results. Even though, as I mention above, the law and finance literature has routinely
used market liquidity as a proxy for market development, my research design limits its
usability. This is because the US has one of the most developed markets and hence one
of the highest turnover ratios. This leaves me with a heavily unbalanced split between
the Above- and Below-US turnover groups, with only six percent of my observations
classified into the Above-US group.
To address this issue, in the last two columns of Table 2.7, I show the results from
following prior studies on US institutional investment abroad and classifying countries
as more (less) developed depending on whether they have above (below) median US
investment levels. Hd is equal to one if the level of US holdings in a country is greater
than the median US holdings in the cross-section of sampled countries in that year and
zero otherwise. Hd*D is the interaction term based on the product of the US holdings
dummy (Hd) and DINDEX. In order to create Hd, I obtain the level of US portfolio

58
holdings of each country.33 I find a negative relation between the interaction term and
FIO further confirming my results, i.e., investors from more developed countries invest
in well-governed US firms. The result remains even if I use MC, instead of DINDEX, as
my proxy for information asymmetry in a firm.
I would like to highlight that in all my analyses I use country fixed effects. These fixed
effects capture the impact of omitted time invariant country characteristics, such as
language, educational and cultural bonds, closeness/familiarity, etc. However, there are
macroeconomic factors that might change over time, in which case their impact won’t
be captured by my country fixed effects. However, my time-series is relatively short,
compared to the typical periods examined in macroeconomics. As I argue in footnote
17, most of the macro factors will change little over the 10 years I examine. In order to
alleviate concerns that my results are driven by omitted macro effects, I construct some
of the variables used in the extant literature and re-estimate my main models presented
in Tables 2.4 and 2.5 (untabulated results). In particular, instead of the country dummies
I use 3 country-specific variables in all specifications: GDPPC is the gross domestic
product per capita (Chan et al., 2005); DISTANCE is a measure of geographical
distance which captures the bilateral distance of capital cities of countries, and is used
as a proxy for closeness (Frankel et al., 1995)34; MCAPGDP is the relative size of the
stock market of each country, measured by the stock market capitalization as a
33 I retrieve the data on US holdings abroad from the Bureau of Economic Analysis reports, available at http://www.bea.gov/international/di1usdbal.htm. 34 Chan et al. (2005) use distance as a familiarity proxy. Distance is used as a proxy for the barriers foreign investors encounter when obtaining information about potential foreign investment. They argue that foreign investors who are more familiar with a country through closer proximity will have less foreign bias in their mutual fund holdings.
59
percentage of the country's GDP and proxies for stock market development (Forbes
2010).35 My results remain largely unchanged.
Next, I present my results using alternative model specifications. First, instead of
controlling for time trends (market-wide effects) using year dummies, I control for the
effect of the enactment of the Sarbanes-Oxley Act (SOX) in 2002. SOX is expected to
impose higher disclosure and more accountability on firms listed in the US exchanges
(Hamilton and Trautman, 2002). Therefore, it is expected to increase the internal
corporate governance quality of US firms. I re-run my results using a SOX dummy that
takes the value of one (zero) post- (pre-) SOX, instead of the year dummies. Table 2.8,
columns 1-3, report the results of this specification. I obtain results consistent with the
prior analyses. Second, the use of Tobit models forces me to control for random
unobserved firm effects. To test the impact of the random firm effects assumption, I run
my analysis using OLS regressions. This allows me to assume fixed firm effects, but at
the cost of using a suboptimal regression technique (given the censoring of the
dependent variable, which makes it left-clustered). The results remain unchanged.
I also control for the effect of the current Financial Crisis by dropping the crisis year
2008 from my analysis. The regression results remain qualitatively unchanged, and I
conclude that my results do not appear to be driven by the effect of the Financial Crisis.
Finally, I examine the impact of countries of origin that are tax havens. It is reasonable
to expect that a large proportion of investors supposedly from tax-haven countries
(Bermuda, Bahamas, Barbados and the Cayman Islands) are in fact investors from the
US or elsewhere domiciled in these countries for tax reasons. As it is impossible to
35 In additional tests, I have also used LANGUAGE, that is a dummy variable taking the value of 1 for English speaking countries, zero otherwise, and CAPITAL CONTROL, which is a measure of “freedom” investors enjoy in a capital market. These two variables are highly correlated with GDPPC and DISTANCE, so I cannot use them in the same model.

60
determine the true country of origin of these foreign institutional investors, I conduct a
robustness check by excluding the tax havens. The results of my original analysis are
qualitatively unchanged.
2.7. Conclusion
The main contribution of this chapter lies in the examination of the influence of the
foreigners’ country-level governance quality on their investment preferences when they
invest in the United States. I reconcile prior evidence in the literature by presenting
results consistent with both the familiarity and flight to quality arguments. Institutional
investors from countries with governance quality similar to that of the US invest more
in US firms. But investors from countries with governance quality just below (just
above) that of the US invest more (less) in comparison.
I also present evidence that governance quality at home also affects the firm-level
investment preferences of foreign investors. My results indicate that foreign institutional
investors from high governance quality (low information asymmetry) countries invest in
US firms with high corporate governance quality (less information asymmetry). My
evidence supports the familiarity argument. My findings, both at the country and firm
level are robust to the use of different variable and model specifications.
In sum, I contribute to the foreign institutional investment literature by documenting
new determinants of institutional investment. Also, my research design allows me to
explore the heterogeneous preferences of foreign institutional investors depending on
the distance of their countries’ governance quality from that of the United States. This
helps me to reconcile contradictory evidence presented in prior studies on the validity of
the flight to quality and familiarity arguments.
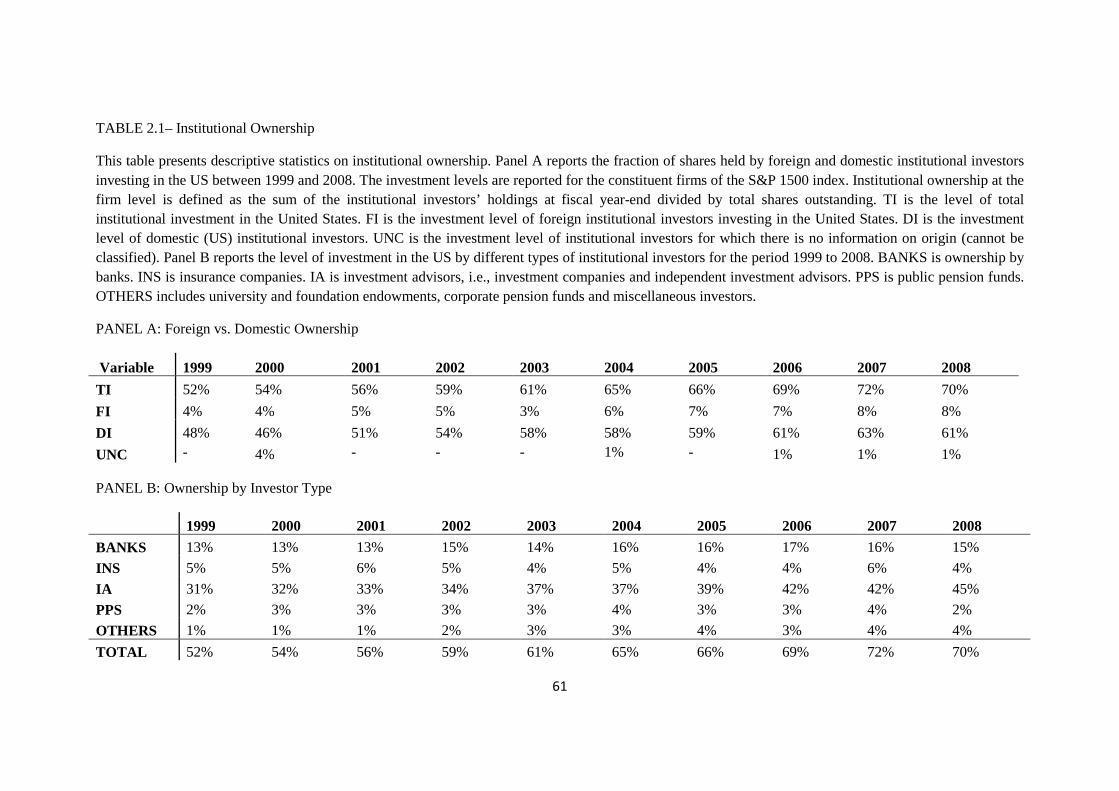
61
TABLE 2.1– Institutional Ownership
This table presents descriptive statistics on institutional ownership. Panel A reports the fraction of shares held by foreign and domestic institutional investors investing in the US between 1999 and 2008. The investment levels are reported for the constituent firms of the S&P 1500 index. Institutional ownership at the firm level is defined as the sum of the institutional investors’ holdings at fiscal year-end divided by total shares outstanding. TI is the level of total institutional investment in the United States. FI is the investment level of foreign institutional investors investing in the United States. DI is the investment level of domestic (US) institutional investors. UNC is the investment level of institutional investors for which there is no information on origin (cannot be classified). Panel B reports the level of investment in the US by different types of institutional investors for the period 1999 to 2008. BANKS is ownership by banks. INS is insurance companies. IA is investment advisors, i.e., investment companies and independent investment advisors. PPS is public pension funds. OTHERS includes university and foundation endowments, corporate pension funds and miscellaneous investors.
PANEL A: Foreign vs. Domestic Ownership
Variable 1999 2000 2001 2002 2003 2004 2005 2006 2007 2008
TI 52% 54% 56% 59% 61% 65% 66% 69% 72% 70%
FI 4% 4% 5% 5% 3% 6% 7% 7% 8% 8%
DI 48% 46% 51% 54% 58% 58% 59% 61% 63% 61%
UNC - 4% - - - 1% - 1% 1% 1% PANEL B: Ownership by Investor Type
1999 2000 2001 2002 2003 2004 2005 2006 2007 2008
BANKS 13% 13% 13% 15% 14% 16% 16% 17% 16% 15%
INS 5% 5% 6% 5% 4% 5% 4% 4% 6% 4%
IA 31% 32% 33% 34% 37% 37% 39% 42% 42% 45%
PPS 2% 3% 3% 3% 3% 4% 3% 3% 4% 2%
OTHERS 1% 1% 1% 2% 3% 3% 4% 3% 4% 4%
TOTAL 52% 54% 56% 59% 61% 65% 66% 69% 72% 70%
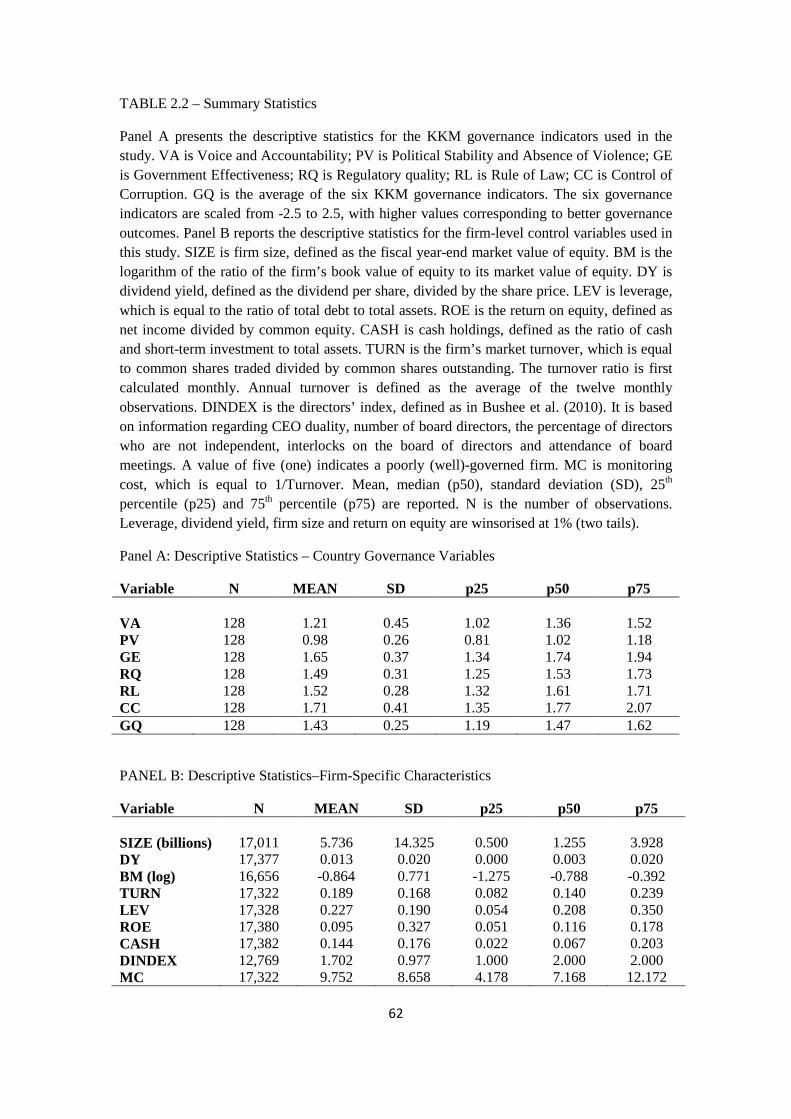
62
TABLE 2.2 – Summary Statistics
Panel A presents the descriptive statistics for the KKM governance indicators used in the study. VA is Voice and Accountability; PV is Political Stability and Absence of Violence; GE is Government Effectiveness; RQ is Regulatory quality; RL is Rule of Law; CC is Control of Corruption. GQ is the average of the six KKM governance indicators. The six governance indicators are scaled from -2.5 to 2.5, with higher values corresponding to better governance outcomes. Panel B reports the descriptive statistics for the firm-level control variables used in this study. SIZE is firm size, defined as the fiscal year-end market value of equity. BM is the logarithm of the ratio of the firm’s book value of equity to its market value of equity. DY is dividend yield, defined as the dividend per share, divided by the share price. LEV is leverage, which is equal to the ratio of total debt to total assets. ROE is the return on equity, defined as net income divided by common equity. CASH is cash holdings, defined as the ratio of cash and short-term investment to total assets. TURN is the firm’s market turnover, which is equal to common shares traded divided by common shares outstanding. The turnover ratio is first calculated monthly. Annual turnover is defined as the average of the twelve monthly observations. DINDEX is the directors’ index, defined as in Bushee et al. (2010). It is based on information regarding CEO duality, number of board directors, the percentage of directors who are not independent, interlocks on the board of directors and attendance of board meetings. A value of five (one) indicates a poorly (well)-governed firm. MC is monitoring cost, which is equal to 1/Turnover. Mean, median (p50), standard deviation (SD), 25th percentile (p25) and 75th percentile (p75) are reported. N is the number of observations. Leverage, dividend yield, firm size and return on equity are winsorised at 1% (two tails).
Panel A: Descriptive Statistics – Country Governance Variables
Variable N MEAN SD p25 p50 p75 VA 128 1.21 0.45 1.02 1.36 1.52 PV 128 0.98 0.26 0.81 1.02 1.18 GE 128 1.65 0.37 1.34 1.74 1.94 RQ 128 1.49 0.31 1.25 1.53 1.73 RL 128 1.52 0.28 1.32 1.61 1.71 CC 128 1.71 0.41 1.35 1.77 2.07 GQ 128 1.43 0.25 1.19 1.47 1.62
PANEL B: Descriptive Statistics–Firm-Specific Characteristics
Variable N MEAN SD p25 p50 p75 SIZE (billions) 17,011 5.736 14.325 0.500 1.255 3.928 DY 17,377 0.013 0.020 0.000 0.003 0.020 BM (log) 16,656 -0.864 0.771 -1.275 -0.788 -0.392 TURN 17,322 0.189 0.168 0.082 0.140 0.239 LEV 17,328 0.227 0.190 0.054 0.208 0.350 ROE 17,380 0.095 0.327 0.051 0.116 0.178 CASH 17,382 0.144 0.176 0.022 0.067 0.203 DINDEX 12,769 1.702 0.977 1.000 2.000 2.000 MC 17,322 9.752 8.658 4.178 7.168 12.172

63
TABLE 2.3 – Correlation Matrix
This table presents the Pearson correlation coefficients of the variables used in this study. FIO is the firm-level foreign institutional ownership in the United States. It aggregates the firm-level equity holdings of all investors domiciled in each country (i.e., country-level holdings in each US firm in my sample). GQ is the level of a country’s governance quality calculated as the average of the six KKM governance indicators. DINDEX is the directors’ index defined as in Bushee et al. (2010). It is based on information regarding CEO duality, the number of board directors, the percentage of directors who are not independent, interlocks on the board of directors and attendance of board meetings. A value of five (one) indicates a poorly (well)-governed firm. SIZE is the logarithm of firm size, which is defined as the fiscal year-end market value of equity. BM is the logarithm of the ratio of the firm’s book value of equity to its market value of equity. DY is dividend yield, defined as the dividend per share divided by the share price. LEV is leverage, which is equal to the ratio of total debt to total assets. ROE is return on equity, defined as net income divided by common equity. CASH is cash holdings, defined as the ratio of cash and short-term investment to total assets. TURN is a firm’s market turnover, which is equal to common shares traded divided by common shares outstanding. The turnover ratio is first calculated monthly. Annual turnover is defined as the average of the twelve monthly observations. MC is monitoring cost, which is equal to 1/Turnover. Leverage, dividend yield and return on equity are winsorised at 1% (two tails).
FIO GQ DINDEX SIZE DY BM TURN LEV ROE CASH MC FIO 1 GQ 0.105* 1 DINDEX -0.067* -0.021* 1 SIZE -0.130* -0.063* 0.247* 1 DY -0.001 0.032* 0.114* 0.089* 1 BM 0.048* 0.047* -0.016* -0.357* 0.238* 1 TURN 0.017* -0.019* -0.227* -0.078* -0.143* -0.011* 1 LEV -0.006 -0.003 0.084* 0.017* 0.289* 0.069* -0.080* 1 ROE -0.019* -0.020* 0.034* 0.198* -0.016* -0.404* -0.092* -0.025* 1 CASH 0.007 0.002 -0.184* -0.069* -0.293* -0.266* 0.327* -0.366* -0.021* 1 MC -0.031* 0.038* 0.260* -0.060* 0.149* 0.053* -0.504* 0.049* 0.033* -0.201* 1

64
TABLE 2.4 – Determinants of Foreign Institutional Ownership
This table presents the results of random-effect Tobit panel regressions on the determinants of foreign institutional ownership. The dependent variable in all the regressions is the firm-level, foreign institutional ownership in the United States (FIO). It measures the firm-level equity holdings of all investors domiciled in a given country (i.e., country-level holdings in each US firm in my sample). GQ is the level of a country’s governance quality, calculated as the average of the six KKM governance indicators. GQd is a dummy variable which equals one if the governance quality of a country (GQ) in year t is greater than that of the US in that year and zero otherwise. DINDEX is the directors’ index, defined as in Bushee et al. (2010). It is based on information regarding CEO duality, number of board directors, the percentage of directors who are not independent, interlocks on the board of directors and attendance of board meetings. A value of five (one) indicates a poorly(well)-governed firm. GQd*D is equal to the country-level governance quality dummy (GQd) multiplied by DINDEX. GQd*MC is equal to the country-level governance quality dummy (GQd) multiplied by MC. MC is monitoring cost, which is equal to 1/Turnover. SIZE is the logarithm of firm size, which is defined as the fiscal year-end market value of equity. BM is the logarithm of the ratio of the firm’s book value of equity to its market value of equity. DY is dividend yield, defined as the dividend per share divided by the share price. LEV is leverage, which is equal to the ratio of total debt to total assets. ROE is return on equity defined as net income divided by common equity. CASH is cash holdings, defined as the ratio of cash and short-term investment to total assets. TURN is a firm’s market turnover, which is equal to common shares traded divided by common shares outstanding. The turnover ratio is first calculated monthly. Annual turnover is defined as the average of the twelve monthly observations. Leverage, dividend yield and return on equity are winsorised at 1% (two tails). Year dummies (Year FE) and country dummies (Country FE) are included in all regressions. The numbers in brackets are p-values. * indicates 10% significance level, ** indicates 5% significance level and *** indicates 1% significance level. N is the number of observations.

65
FIO (%) GQ -5.480*** [0.000] GQd*D -0.180*** [0.000] GQd*MC -0.042*** [0.000] GQd -0.119*** 0.189*** 0.167*** [0.004] [0.000] [0.000] DINDEX -0.032*** -0.033*** 0.091*** -0.029*** [0.000] [0.000] [0.000] [0.000] MC 0.015*** [0.000] SIZE (log) 0.025*** 0.014*** 0.015*** 0.012** [0.000] [0.007] [0.003] [0.025] DY 0.994*** 0.849** 0.893** 1.213*** [0.004] [0.016] [0.011] [0.001] BM (log) -0.006 -0.014 -0.013 -0.008 [0.591] [0.203] [0.236] [0.473] TURN 0.417*** 0.400*** 0.405*** - [0.000] [0.000] [0.000] LEV 0.077* 0.058 0.060 0.055 [0.065] [0.173] [0.160] [0.197] ROE 0.090*** 0.089*** 0.092*** 0.086*** [0.000] [0.000] [0.000] [0.000] CASH 0.021 0.009 0.005 0.038 [0.668] [0.857] [0.917] [0.424] Constant 7.722*** -1.314*** -1.544*** -1.271*** [0.000] [0.000] [0.000] [0.000] Year FE Yes Yes Yes Yes Country FE Yes Yes Yes Yes N 59,491 59,491 59,491 59,491 Chi2 82,698 76,531 76,942 77,829 p-value 0 0 0 0

66
TABLE 2.5 – Investment Preferences for Above/Below US Governance Quality at Home
This table presents the results of random-effect Tobit panel regressions on the investment preferences of foreign institutional investors who come from countries with higher/lower governance quality than the United States. The dependent variable is still FIO, i.e., the firm-level foreign institutional investment in the US by each country represented in my sample, but now, for the ABOVE-(BELOW-) US models I only include foreign institutional ownership by institutional investors who come from countries with higher (lower) governance quality than that of the US. Given that the foreign investment coming from the UK accounts for the majority of foreign investment in the US, as well as the fact that the UK governance level is above that of the US for all years in my sample, I also run the Above-US regression excluding the investment originating by institutional investors domiciled in the UK. This allows me to test the sensitivity of my results to this one country. GQ is the level of a country’s governance quality calculated as the average of the six KKM governance indicators. DINDEX is the directors’ index defined as in Bushee et al. (2010). It is based on information regarding CEO duality, number of board directors, the percentage of directors who are not independent, interlocks on the board of directors and attendance of board meetings. A value of five (one) indicates a poorly (well)-governed firm. SIZE is the logarithm of firm size, which is defined as the fiscal year-end market value of equity. BM is the logarithm of the ratio of the firm’s book value of equity to its market value of equity. DY is the dividend yield, defined as the dividend per share divided by the share price. LEV is leverage, which is equal to the ratio of total debt to total assets. ROE is return on equity, defined as net income divided by common equity. CASH is cash holdings, defined as the ratio of cash and short-term investment to total assets. TURN is a firm’s market turnover, which is equal to common shares traded divided by common shares outstanding. The turnover ratio is first calculated monthly. Annual turnover is defined as the average of the twelve monthly observations. Leverage, dividend yield and return on equity are winsorised at 1% (two tails).Year dummies (Year FE) and country dummies (Country FE) are included in all regressions. The numbers in brackets are p-values. * indicates 10% significance level, ** indicates 5% significance level and *** indicates 1% significance level. N is the number of observations.
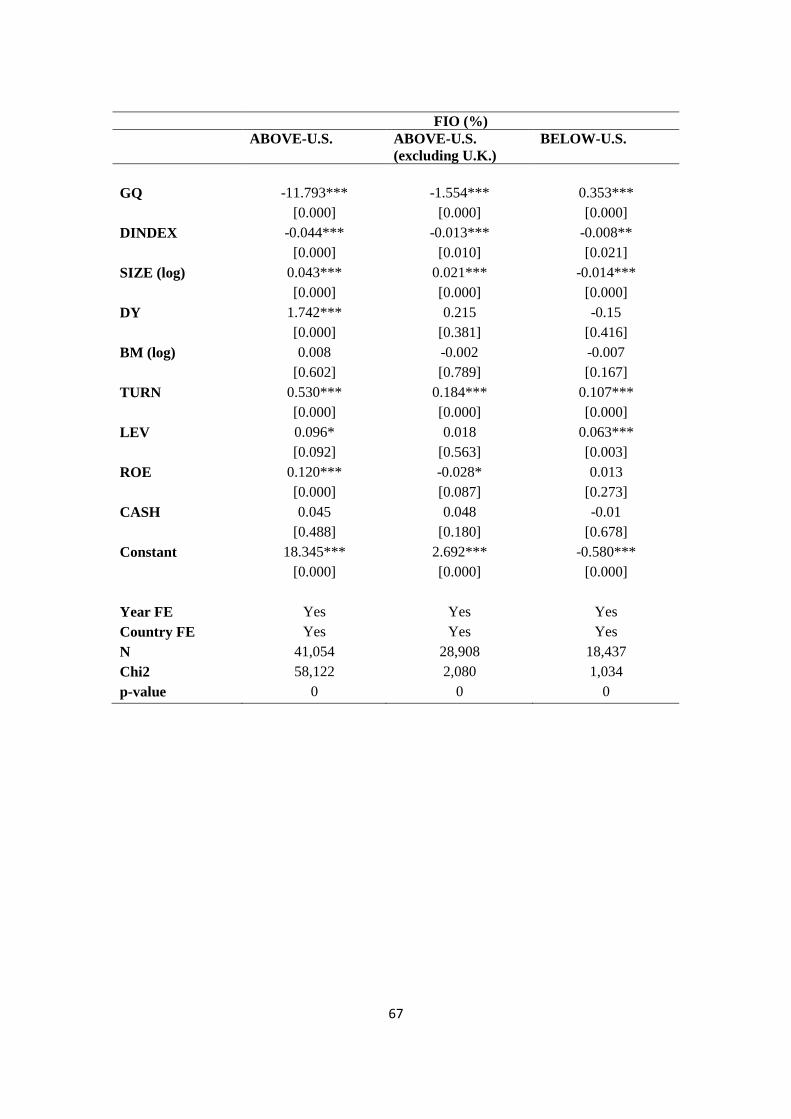
67
FIO (%) ABOVE-U.S. ABOVE-U.S.
(excluding U.K.) BELOW-U.S.
GQ -11.793*** -1.554*** 0.353*** [0.000] [0.000] [0.000] DINDEX -0.044*** -0.013*** -0.008** [0.000] [0.010] [0.021] SIZE (log) 0.043*** 0.021*** -0.014*** [0.000] [0.000] [0.000] DY 1.742*** 0.215 -0.15 [0.000] [0.381] [0.416] BM (log) 0.008 -0.002 -0.007 [0.602] [0.789] [0.167] TURN 0.530*** 0.184*** 0.107*** [0.000] [0.000] [0.000] LEV 0.096* 0.018 0.063*** [0.092] [0.563] [0.003] ROE 0.120*** -0.028* 0.013 [0.000] [0.087] [0.273] CASH 0.045 0.048 -0.01 [0.488] [0.180] [0.678] Constant 18.345*** 2.692*** -0.580*** [0.000] [0.000] [0.000] Year FE Yes Yes Yes Country FE Yes Yes Yes N 41,054 28,908 18,437 Chi2 58,122 2,080 1,034 p-value 0 0 0
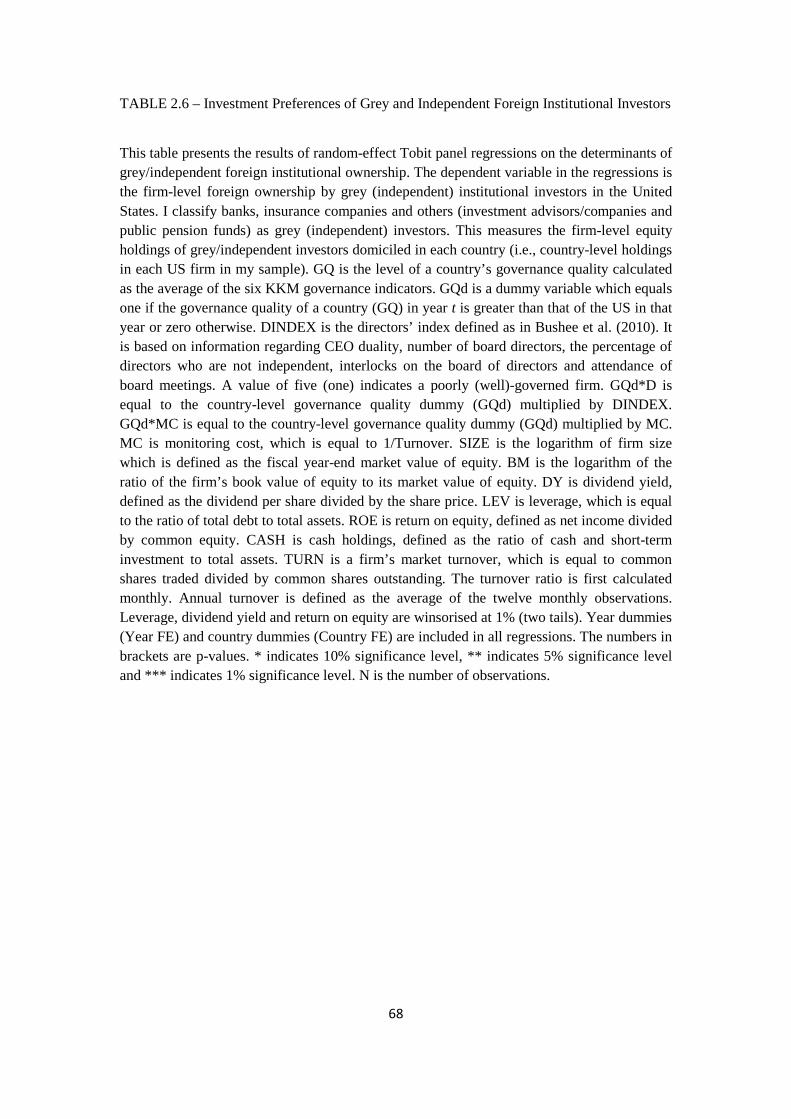
68
TABLE 2.6 – Investment Preferences of Grey and Independent Foreign Institutional Investors
This table presents the results of random-effect Tobit panel regressions on the determinants of grey/independent foreign institutional ownership. The dependent variable in the regressions is the firm-level foreign ownership by grey (independent) institutional investors in the United States. I classify banks, insurance companies and others (investment advisors/companies and public pension funds) as grey (independent) investors. This measures the firm-level equity holdings of grey/independent investors domiciled in each country (i.e., country-level holdings in each US firm in my sample). GQ is the level of a country’s governance quality calculated as the average of the six KKM governance indicators. GQd is a dummy variable which equals one if the governance quality of a country (GQ) in year t is greater than that of the US in that year or zero otherwise. DINDEX is the directors’ index defined as in Bushee et al. (2010). It is based on information regarding CEO duality, number of board directors, the percentage of directors who are not independent, interlocks on the board of directors and attendance of board meetings. A value of five (one) indicates a poorly (well)-governed firm. GQd*D is equal to the country-level governance quality dummy (GQd) multiplied by DINDEX. GQd*MC is equal to the country-level governance quality dummy (GQd) multiplied by MC. MC is monitoring cost, which is equal to 1/Turnover. SIZE is the logarithm of firm size which is defined as the fiscal year-end market value of equity. BM is the logarithm of the ratio of the firm’s book value of equity to its market value of equity. DY is dividend yield, defined as the dividend per share divided by the share price. LEV is leverage, which is equal to the ratio of total debt to total assets. ROE is return on equity, defined as net income divided by common equity. CASH is cash holdings, defined as the ratio of cash and short-term investment to total assets. TURN is a firm’s market turnover, which is equal to common shares traded divided by common shares outstanding. The turnover ratio is first calculated monthly. Annual turnover is defined as the average of the twelve monthly observations. Leverage, dividend yield and return on equity are winsorised at 1% (two tails). Year dummies (Year FE) and country dummies (Country FE) are included in all regressions. The numbers in brackets are p-values. * indicates 10% significance level, ** indicates 5% significance level and *** indicates 1% significance level. N is the number of observations.

69
FIO (%) GREY IND. GREY IND. GREY IND. GQ -5.821*** -0.225*** [0.000] [0.000] GQd*D -0.193*** -0.006 [0.000] [0.461] GQd*MC -0.054*** -0.001 [0.000] [0.556] GQd 0.447*** 0.027 0.435*** 0.021 [0.000] [0.308] [0.000] [0.400] MC 0.031*** -0.005*** [0.000] [0.000] DINDEX -0.034*** -0.016*** 0.123*** -0.013** -0.029*** -0.016*** [0.000] [0.000] [0.000] [0.037] [0.001] [0.004] SIZE -0.024*** 0.003 -0.018*** 0.003 -0.022*** 0.001 [0.000] [0.303] [0.003] [0.402] [0.000] [0.760] DY 2.188*** -0.584*** 2.057*** -0.583*** 2.497*** -0.517** [0.000] [0.007] [0.000] [0.007] [0.000] [0.017] BM 0.008 -0.012* -0.009 -0.012* -0.003 -0.012* [0.547] [0.069] [0.494] [0.066] [0.823] [0.070] TURN 0.190*** 0.251*** 0.224*** 0.250*** - - [0.000] [0.000] [0.000] [0.000] LEV 0.011 0.081*** -0.003 0.080*** -0.027 0.083*** [0.822] [0.001] [0.949] [0.002] [0.594] [0.001] ROE 0.132*** 0.01 0.118*** 0.011 0.125*** 0.002 [0.000] [0.466] [0.000] [0.446] [0.000] [0.871] CASH 0.063 -0.027 0.048 -0.028 0.028 0.013 [0.268] [0.348] [0.408] [0.339] [0.623] [0.654] Constant 5.402*** 0.340*** -1.683*** -0.055 -1.377** 0.071 [0.000] [0.005] [0.006] [0.399] [0.025] [0.273] Year FE Yes Yes Yes Yes Yes Yes Country FE Yes Yes Yes Yes Yes Yes N 38,712 42,932 38,712 42,932 38,712 42,932 Chi2 71,974 2,834 67,519 2,822 68,222 2,792 p-value 0 0 0 0 0 0

70
TABLE 2.7 – Alternative Proxies for Governance Quality at Home
This table presents the results of random-effect Tobit panel regressions on the determinants of foreign institutional ownership using alternative proxies for a country’s governance quality. The dependent variable in all the regressions is the firm-level foreign institutional ownership in the US (FIO). This measures the firm-level equity holdings of all investors domiciled in a given country (i.e., country-level holdings in each US firm in my sample). Td*D is an interaction term using the country-level turnover dummy (Td) and DINDEX. Td is equal to one if the turnover ratio of a country in year t is greater than that of the US in that year and zero otherwise. DINDEX is the directors’ index, defined as in Bushee et al. (2010). It is based on information regarding CEO duality, number of board directors, the percentage of directors who are not independent, interlocks on the board of directors and attendance of board meetings. A value of five (one) indicates a poorly (well)-governed firm. Td*MC is an interaction term based on the product of the country-level turnover dummy (Td) and monitoring cost (MC). MC is equal to 1/Turnover. Hd*D is the interaction term based on the product of the US holding dummy (Hd) and DINDEX. Hd*MC is the interaction term based on the product of the US holding dummy (Hd) and MC. Hd is equal to one if the level of US holdings in a country is greater than the median US holdings for the cross-section of sampled countries in that year and zero otherwise. SIZE is the logarithm of firm size, which is defined as the fiscal year-end market value of equity. BM is the logarithm of the ratio of the firm’s book value of equity to its market value of equity. DY is dividend yield, defined as the dividend per share divided by the share price. LEV is leverage, which is equal to the ratio of total debt to total assets. ROE is return on equity, defined as net income divided by common equity. CASH is cash holdings, defined as the ratio of cash and short-term investment to total assets. TURN is a firm’s market turnover, which is equal to common shares traded divided by common shares outstanding. The turnover ratio is first calculated monthly. Annual turnover is defined as the average of the twelve monthly observations. Leverage, dividend yield and return on equity are winsorised at 1% (two tails). Year dummies (Year FE) and country dummies (Country FE) are included in all regressions. The numbers in brackets are p-values. * indicates 10% significance level, ** indicates 5% significance level and *** indicates 1% significance level. N is the number of observations.
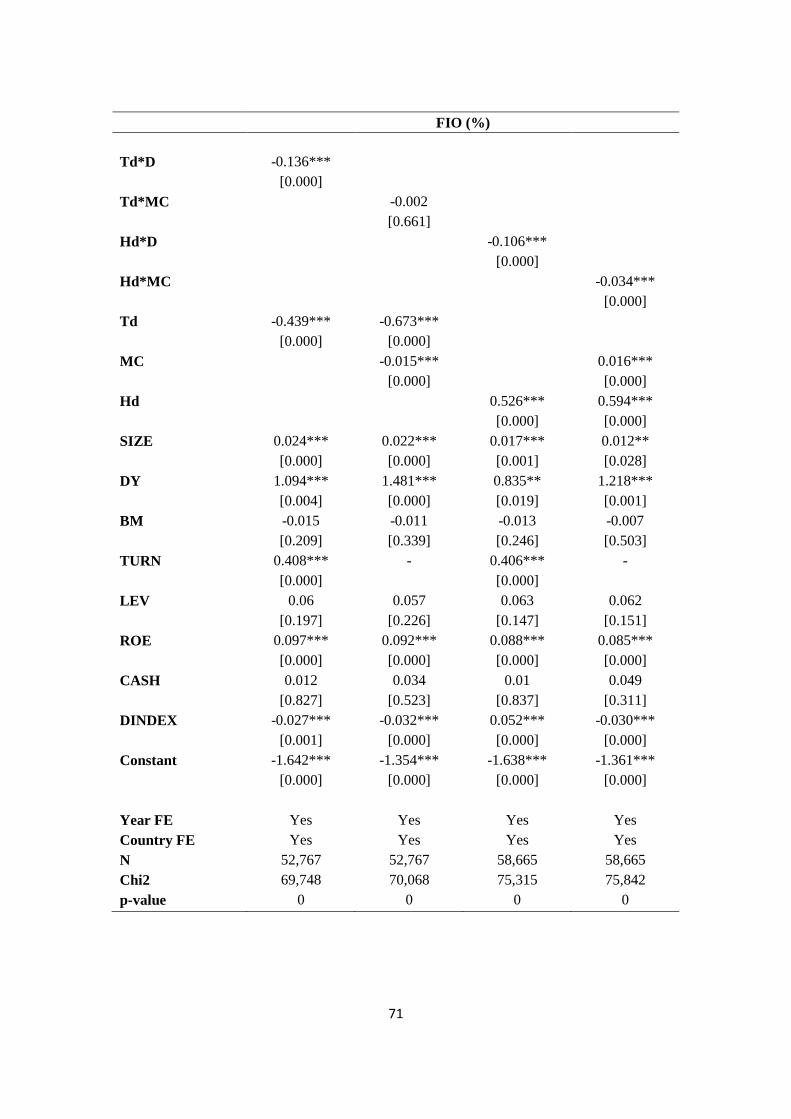
71
FIO (%) Td*D -0.136*** [0.000] Td*MC -0.002 [0.661] Hd*D -0.106*** [0.000] Hd*MC -0.034*** [0.000] Td -0.439*** -0.673*** [0.000] [0.000] MC -0.015*** 0.016*** [0.000] [0.000] Hd 0.526*** 0.594*** [0.000] [0.000] SIZE 0.024*** 0.022*** 0.017*** 0.012** [0.000] [0.000] [0.001] [0.028] DY 1.094*** 1.481*** 0.835** 1.218*** [0.004] [0.000] [0.019] [0.001] BM -0.015 -0.011 -0.013 -0.007 [0.209] [0.339] [0.246] [0.503] TURN 0.408*** - 0.406*** - [0.000] [0.000] LEV 0.06 0.057 0.063 0.062 [0.197] [0.226] [0.147] [0.151] ROE 0.097*** 0.092*** 0.088*** 0.085*** [0.000] [0.000] [0.000] [0.000] CASH 0.012 0.034 0.01 0.049 [0.827] [0.523] [0.837] [0.311] DINDEX -0.027*** -0.032*** 0.052*** -0.030*** [0.001] [0.000] [0.000] [0.000] Constant -1.642*** -1.354*** -1.638*** -1.361*** [0.000] [0.000] [0.000] [0.000] Year FE Yes Yes Yes Yes Country FE Yes Yes Yes Yes N 52,767 52,767 58,665 58,665 Chi2 69,748 70,068 75,315 75,842 p-value 0 0 0 0
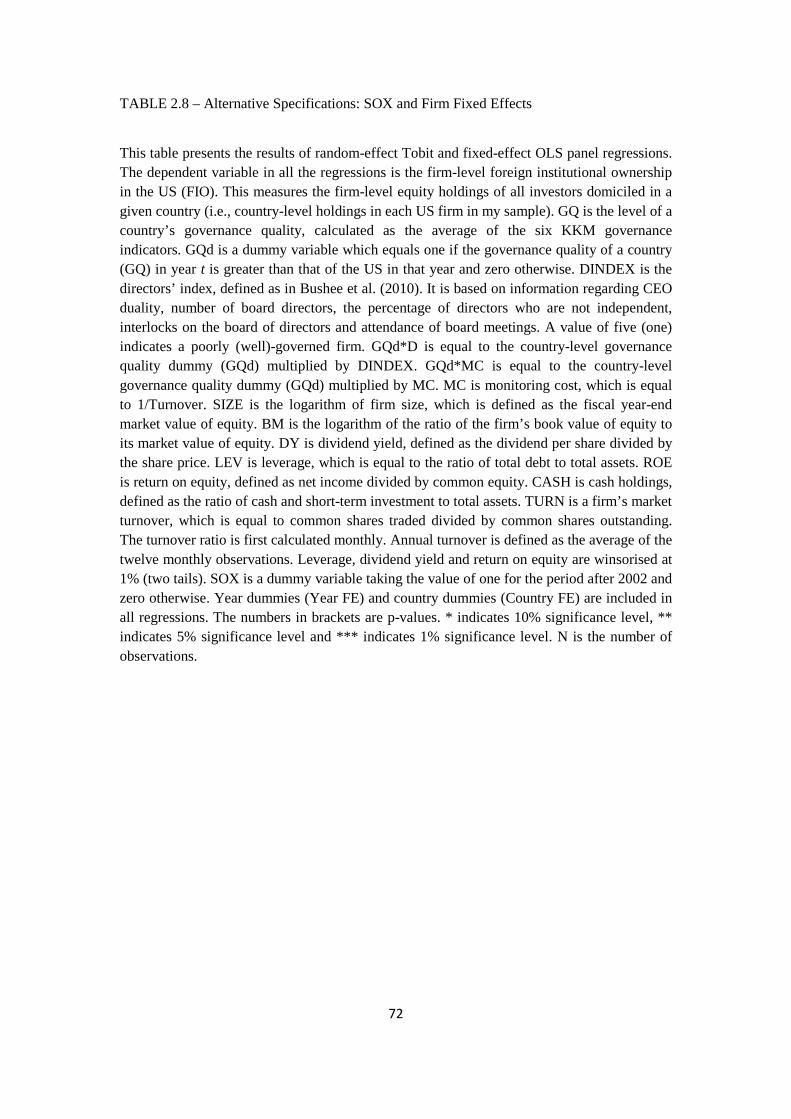
72
TABLE 2.8 – Alternative Specifications: SOX and Firm Fixed Effects
This table presents the results of random-effect Tobit and fixed-effect OLS panel regressions. The dependent variable in all the regressions is the firm-level foreign institutional ownership in the US (FIO). This measures the firm-level equity holdings of all investors domiciled in a given country (i.e., country-level holdings in each US firm in my sample). GQ is the level of a country’s governance quality, calculated as the average of the six KKM governance indicators. GQd is a dummy variable which equals one if the governance quality of a country (GQ) in year t is greater than that of the US in that year and zero otherwise. DINDEX is the directors’ index, defined as in Bushee et al. (2010). It is based on information regarding CEO duality, number of board directors, the percentage of directors who are not independent, interlocks on the board of directors and attendance of board meetings. A value of five (one) indicates a poorly (well)-governed firm. GQd*D is equal to the country-level governance quality dummy (GQd) multiplied by DINDEX. GQd*MC is equal to the country-level governance quality dummy (GQd) multiplied by MC. MC is monitoring cost, which is equal to 1/Turnover. SIZE is the logarithm of firm size, which is defined as the fiscal year-end market value of equity. BM is the logarithm of the ratio of the firm’s book value of equity to its market value of equity. DY is dividend yield, defined as the dividend per share divided by the share price. LEV is leverage, which is equal to the ratio of total debt to total assets. ROE is return on equity, defined as net income divided by common equity. CASH is cash holdings, defined as the ratio of cash and short-term investment to total assets. TURN is a firm’s market turnover, which is equal to common shares traded divided by common shares outstanding. The turnover ratio is first calculated monthly. Annual turnover is defined as the average of the twelve monthly observations. Leverage, dividend yield and return on equity are winsorised at 1% (two tails). SOX is a dummy variable taking the value of one for the period after 2002 and zero otherwise. Year dummies (Year FE) and country dummies (Country FE) are included in all regressions. The numbers in brackets are p-values. * indicates 10% significance level, ** indicates 5% significance level and *** indicates 1% significance level. N is the number of observations.
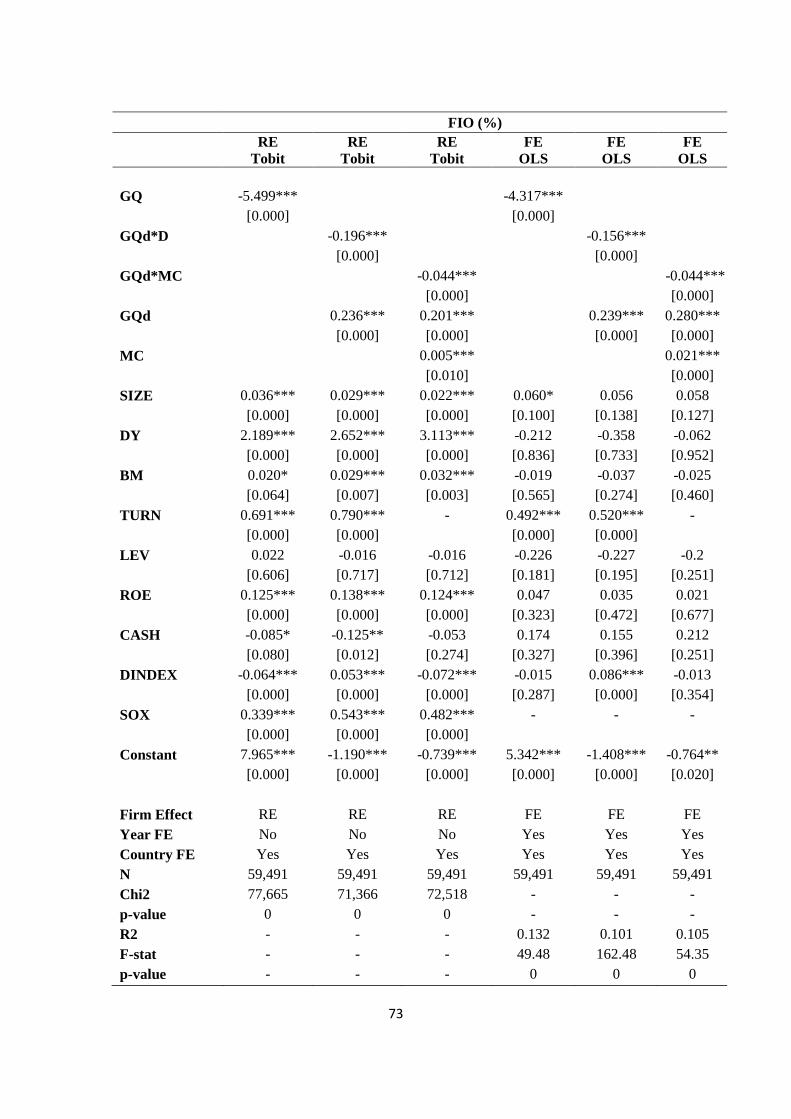
73
FIO (%) RE
Tobit RE
Tobit RE
Tobit FE
OLS FE
OLS FE
OLS GQ -5.499*** -4.317*** [0.000] [0.000] GQd*D -0.196*** -0.156*** [0.000] [0.000] GQd*MC -0.044*** -0.044*** [0.000] [0.000] GQd 0.236*** 0.201*** 0.239*** 0.280*** [0.000] [0.000] [0.000] [0.000] MC 0.005*** 0.021*** [0.010] [0.000] SIZE 0.036*** 0.029*** 0.022*** 0.060* 0.056 0.058 [0.000] [0.000] [0.000] [0.100] [0.138] [0.127] DY 2.189*** 2.652*** 3.113*** -0.212 -0.358 -0.062 [0.000] [0.000] [0.000] [0.836] [0.733] [0.952] BM 0.020* 0.029*** 0.032*** -0.019 -0.037 -0.025 [0.064] [0.007] [0.003] [0.565] [0.274] [0.460] TURN 0.691*** 0.790*** - 0.492*** 0.520*** - [0.000] [0.000] [0.000] [0.000] LEV 0.022 -0.016 -0.016 -0.226 -0.227 -0.2 [0.606] [0.717] [0.712] [0.181] [0.195] [0.251] ROE 0.125*** 0.138*** 0.124*** 0.047 0.035 0.021 [0.000] [0.000] [0.000] [0.323] [0.472] [0.677] CASH -0.085* -0.125** -0.053 0.174 0.155 0.212 [0.080] [0.012] [0.274] [0.327] [0.396] [0.251] DINDEX -0.064*** 0.053*** -0.072*** -0.015 0.086*** -0.013 [0.000] [0.000] [0.000] [0.287] [0.000] [0.354] SOX 0.339*** 0.543*** 0.482*** - - - [0.000] [0.000] [0.000] Constant 7.965*** -1.190*** -0.739*** 5.342*** -1.408*** -0. 764** [0.000] [0.000] [0.000] [0.000] [0.000] [0.020] Firm Effect RE RE RE FE FE FE Year FE No No No Yes Yes Yes Country FE Yes Yes Yes Yes Yes Yes N 59,491 59,491 59,491 59,491 59,491 59,491 Chi2 77,665 71,366 72,518 - - - p-value 0 0 0 - - - R2 - - - 0.132 0.101 0.105 F-stat - - - 49.48 162.48 54.35 p-value - - - 0 0 0
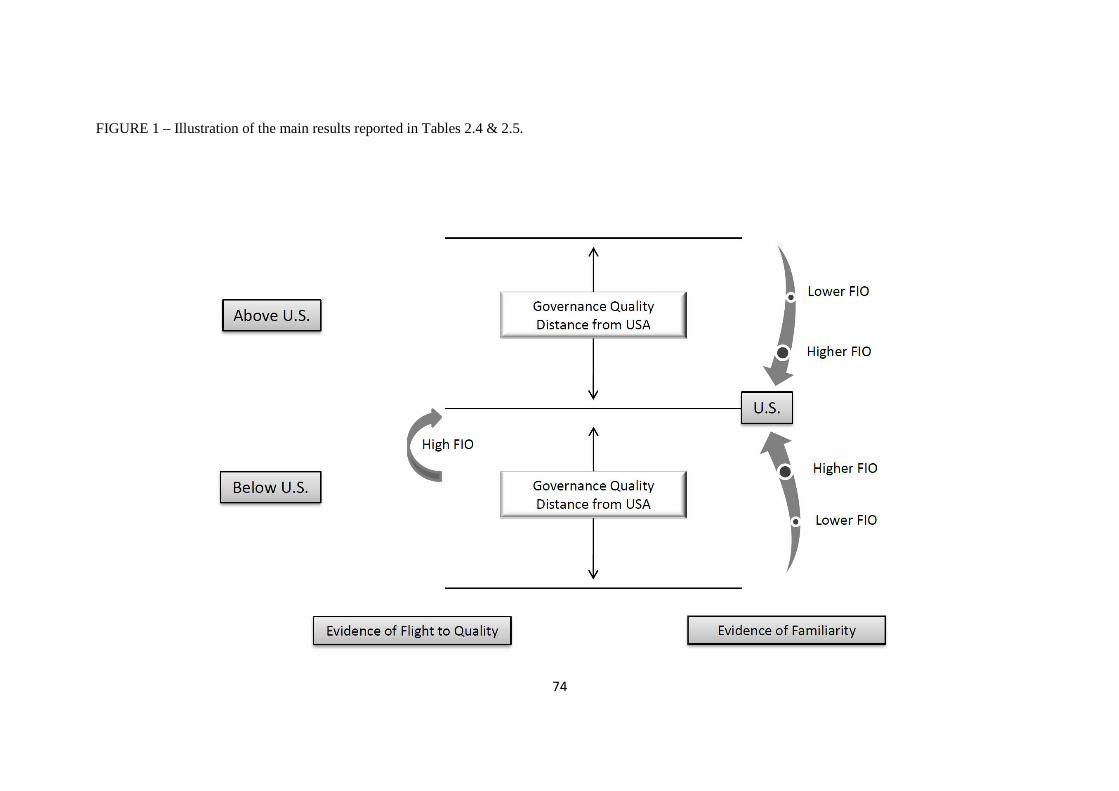
74
FIGURE 1 – Illustration of the main results reported in Tables 2.4 & 2.5.
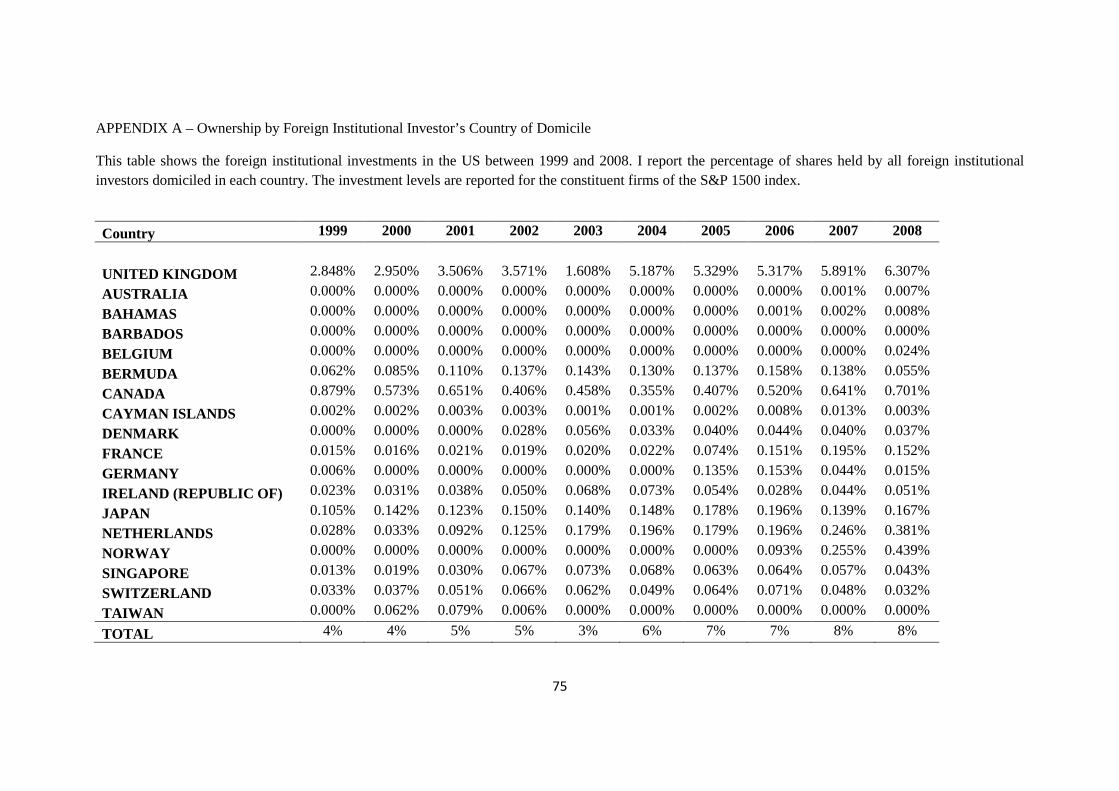
75
APPENDIX A – Ownership by Foreign Institutional Investor’s Country of Domicile
This table shows the foreign institutional investments in the US between 1999 and 2008. I report the percentage of shares held by all foreign institutional investors domiciled in each country. The investment levels are reported for the constituent firms of the S&P 1500 index.
Country 1999 2000 2001 2002 2003 2004 2005 2006 2007 2008
UNITED KINGDOM 2.848% 2.950% 3.506% 3.571% 1.608% 5.187% 5.329% 5.317% 5.891% 6.307%
AUSTRALIA 0.000% 0.000% 0.000% 0.000% 0.000% 0.000% 0.000% 0.000% 0.001% 0.007%
BAHAMAS 0.000% 0.000% 0.000% 0.000% 0.000% 0.000% 0.000% 0.001% 0.002% 0.008%
BARBADOS 0.000% 0.000% 0.000% 0.000% 0.000% 0.000% 0.000% 0.000% 0.000% 0.000%
BELGIUM 0.000% 0.000% 0.000% 0.000% 0.000% 0.000% 0.000% 0.000% 0.000% 0.024%
BERMUDA 0.062% 0.085% 0.110% 0.137% 0.143% 0.130% 0.137% 0.158% 0.138% 0.055%
CANADA 0.879% 0.573% 0.651% 0.406% 0.458% 0.355% 0.407% 0.520% 0.641% 0.701%
CAYMAN ISLANDS 0.002% 0.002% 0.003% 0.003% 0.001% 0.001% 0.002% 0.008% 0.013% 0.003%
DENMARK 0.000% 0.000% 0.000% 0.028% 0.056% 0.033% 0.040% 0.044% 0.040% 0.037%
FRANCE 0.015% 0.016% 0.021% 0.019% 0.020% 0.022% 0.074% 0.151% 0.195% 0.152%
GERMANY 0.006% 0.000% 0.000% 0.000% 0.000% 0.000% 0.135% 0.153% 0.044% 0.015%
IRELAND (REPUBLIC OF) 0.023% 0.031% 0.038% 0.050% 0.068% 0.073% 0.054% 0.028% 0.044% 0.051%
JAPAN 0.105% 0.142% 0.123% 0.150% 0.140% 0.148% 0.178% 0.196% 0.139% 0.167%
NETHERLANDS 0.028% 0.033% 0.092% 0.125% 0.179% 0.196% 0.179% 0.196% 0.246% 0.381%
NORWAY 0.000% 0.000% 0.000% 0.000% 0.000% 0.000% 0.000% 0.093% 0.255% 0.439%
SINGAPORE 0.013% 0.019% 0.030% 0.067% 0.073% 0.068% 0.063% 0.064% 0.057% 0.043%
SWITZERLAND 0.033% 0.037% 0.051% 0.066% 0.062% 0.049% 0.064% 0.071% 0.048% 0.032%
TAIWAN 0.000% 0.062% 0.079% 0.006% 0.000% 0.000% 0.000% 0.000% 0.000% 0.000%
TOTAL 4% 4% 5% 5% 3% 6% 7% 7% 8% 8%

76
APPENDIX B – Time Series Changes in Governance Quality (GQ) by Country
This table reports the time series changes in GQ for all countries examined in this study. GQ is the average of the six KKM governance indicators. The six governance indicators are scaled from -2.5 to 2.5, with higher values corresponding to better governance outcomes.
Country 1999 2000 2001 2002 2003 2004 2005 2006 2007 2008 AUSTRALIA 1.60 1.63 1.63 1.54 1.57 1.67 1.56 1.55 1.58 1.62 BAHAMAS 1.17 1.22 1.22 1.23 1.15 1.15 1.14 1.10 1.10 1.12 BARBADOS 1.30 1.30 1.30 1.26 1.21 1.18 1.20 1.11 1.17 1.18 BELGIUM 1.30 1.36 1.36 1.44 1.40 1.36 1.28 1.27 1.27 1.21 BERMUDA 1.19 1.13 1.13 1.14 1.14 1.14 1.07 1.06 1.05 1.07 CANADA 1.64 1.62 1.62 1.64 1.63 1.61 1.53 1.59 1.57 1.60 CAYMAN ISLANDS 1.36 1.38 1.38 1.39 1.15 1.20 1.16 1.17 1.17 1.07 DENMARK 1.74 1.75 1.75 1.81 1.80 1.85 1.77 1.82 1.84 1.82 FRANCE 1.15 1.22 1.22 1.22 1.23 1.31 1.26 1.25 1.22 1.24 GERMANY 1.55 1.60 1.60 1.56 1.44 1.45 1.46 1.50 1.49 1.43 IRELAND (REPUBLIC OF) 1.53 1.53 1.53 1.50 1.46 1.45 1.52 1.56 1.56 1.57 JAPAN 1.04 1.06 1.06 0.96 1.12 1.17 1.16 1.24 1.18 1.16 NETHERLANDS 1.81 1.82 1.82 1.74 1.69 1.70 1.63 1.60 1.62 1.61 NORWAY 1.73 1.61 1.61 1.69 1.65 1.72 1.64 1.66 1.64 1.64 SINGAPORE 1.44 1.44 1.44 1.44 1.41 1.49 1.43 1.40 1.45 1.51 SWITZERLAND 1.71 1.75 1.75 1.75 1.69 1.74 1.64 1.68 1.71 1.70 TAIWAN 0.80 0.80 0.80 0.84 0.88 0.91 0.88 0.78 0.73 0.79 UNITED KINGDOM 1.64 1.60 1.60 1.55 1.48 1.52 1.42 1.50 1.45 1.40 UNITED STATES 1.44 1.52 1.52 1.40 1.34 1.33 1.24 1.25 1.22 1.28

77
APPENDIX C – Details of the Directors’ Index (DINDEX)
This table presents the descriptive statistics for the directors’ index (DINDEX). DINDEX is defined as in Bushee et al. (2010). It is based on information regarding CEO duality, number of board directors, the percentage of directors who are not independent, interlocks on the board of directors and attendance of board meetings. A value of five (one) indicates a poorly(well)-governed firm. Panel A shows the average value of each governance indicator for each level of DINDEX. Panel B shows the time series changes in DINDEX. The numbers show the number of firms with each score. The percentages are calculated by scaling the number of firms by the total observations per year. CEO measures CEO duality. It is equal to one if the positions of CEO and Chairman are combined and zero otherwise. LNDIR is the logarithm of the number of directors. PNID is the percentage of directors that are not independent. To form these indicators, I split the distribution of LNDIR and PNID into high and low groups using k-means cluster analysis. For the high (low) group the variable equals one (zero). DLOCK is equal to one if there are any interlocks on the board of directors and zero otherwise. DBAD signifies poor attendance and equals one if any director misses 75% or more of the board meetings and zero otherwise.

78
PANEL A: Average values per governance indicator
DINDEX Scores 0 1 2 3 4 5
Variable CEO 0 0.67 0.91 0.95 0.99 1
LNDIR 0 0.13 0.6 0.82 0.95 1 PNID 0 0.16 0.4 0.71 0.93 1
DLOCK 0 0.00 0.02 0.14 0.47 1 DBAD 0 0.02 0.08 0.38 0.66 1
Obs. 1,216 4,427 4,940 1,928 438 68
PANEL B: Time-series changes in DINDEX
DINDEX 1999 2000 2001 2002 2003 2004 2005 2006 2007 2008 0 55 52 63 61 92 115 138 154 261 225 4% 4% 5% 5% 7% 8% 10% 11% 22% 18% 1 286 332 364 404 442 486 527 507 532 547 22% 26% 29% 31% 33% 36% 38% 38% 45% 43% 2 510 500 530 517 532 536 559 496 336 424 40% 39% 42% 40% 40% 40% 41% 37% 28% 33% 3 297 295 306 229 207 173 122 162 57 80 23% 23% 24% 18% 16% 13% 9% 12% 5% 6% 4 103 77 58 68 46 39 21 17 7 2 8% 6% 5% 5% 3% 3% 2% 1% 1% 0% 5 20 15 12 8 2 4 3 4 0 0 2% 1% 1% 1% 0% 0% 0% 0% 0% 0% Obs. 1,271 1,271 1,270 1,287 1,321 1,353 1,370 1,340 1,193 1,278
79
CHAPTER 3: THE SARBANES-OXLEY ACT AND FOREIGN INSTITUTIONAL INVESTMENT IN THE US
“…Sarbox and related reforms have produced much more reliable corporate financial statements, which investors rely on when deciding whether to buy or sell shares. For them, Sarbox has been a godsend.” (Business Week, 2007)36
3.1. Introduction
Several strands of literature study the direct and indirect impact of the Sarbanes-Oxley
Act (SOX) on US firms.37 While one set of studies focuses on the market reaction to
SOX-related events and finds conflicting results (Li et al., 2008; Chhaochharia and
Grinstein, 2007; Zhang, 2007; Jain and Rezaee, 2006, among others), another focuses
on the impact of SOX on firm behavior. Its results suggest that firms try to avoid
implementing SOX. For example, post-SOX, the frequency of firms going private has
modestly increased (Engel et al., 2007), the number of firms going dark has gone up
(Leuz et al., 2008) and the incentives for smaller firms to remain small have increased
(Gao et al., 2009). An additional strand of literature documents the costs of SOX. For
example, Linck et al. (2009) identify increased director and officer insurance premiums
and more costly audit committees among the costs of SOX. Ahmed et al. (2010)
quantify the net cost of SOX and document a significant drop in firms’ cash flow
36 Article title: “Not Everyone Hates SarbOx”; accessed January 2011; source: http://www.businessweek.com/magazine/content/07_05/b4019053.htm?chan=search 37 Some studies also focus on the impact of SOX on foreign firms, either listed or seeking a listing in the US. For example, Litvak (2007) finds that around key announcements relating to the implementation of SOX, the stock prices of SOX-exposed foreign firms declined significantly. Piotroski and Srinivasan (2008) show that, post-SOX, while the listing preferences (the choice between the US exchanges and the London Stock Exchange) of large foreign firms did not change, the likelihood of small foreign firms listing on the NASDAQ decreased. In a Wall Street Journal article, Karmin and Lucchetti (2006) argue that, post-SOX, the increased cost of issuing shares has resulted in many, mainly non-US firms de-listing from the US and moving to alternative markets.
80
profitability post-SOX. While most of these studies document the negative aspects of
SOX, a few papers discuss its benefits, in terms of enhanced trust in US capital markets
(Coates, 2007; Veenman et al., 2011).
In this chapter I examine the economic impact of the implementation of SOX, by
analyzing foreign institutional investment in US firms. A focus on foreign institutional
investment in the US is topical. The latest US Department of the Treasury report (2010)
shows that foreign holdings of US equities have increased from $1.395 trillion in 2002,
to $2.252 trillion in 2009. Nearly 80% of these foreign holdings belong to foreign
institutional investors (FII). This rising importance of foreign investment in the US is
not only being closely watched by academics (Forbes, 2010; Abdioglu et al., 2011) but
also by the members of the US Congress. A recent report by the Congressional
Research Service (Jackson, 2010) charts the rise of foreign ownership of US financial
assets over the last decade and discusses the benefits and costs of such changes in
ownership of US assets.
The last decade has also seen some high-profile corporate scandals in the US. These
scandals have resulted in a number of important changes to the US regulatory setup, the
most important being the enactment of the Sarbanes-Oxley Act in 2002. Ever since
SOX was implemented, its impact on the US economy has been an open debate. In this
chapter, I focus on both FII and SOX. Particularly, I focus on two important questions.
First, what has been the impact of SOX on investments by FII? Second, have the
investment preferences of FII been affected by SOX?
Since one of the most important factors that affect the investment decisions of
institutional investors is the level of corporate disclosure (Bushee and Noe, 2000), post-
81
SOX, with the increased amount of disclosure, and the resulting expected decrease in
information asymmetry in US firms, FII should find the prospect of investing in the US
more attractive. My results show that this is indeed the case. I find that FII have
increased their investment levels in the US since the enactment of SOX.
Information asymmetry regarding potential target assets, and the constraints of the
‘prudent man’ rule, have traditionally led US institutional investors to invest in
‘reliable’ assets, such as the stocks of large, low leverage, high liquidity firms
(Badrinath et al., 1989). Given that the FII come from outside the US, information
asymmetry regarding US assets is more acute for these investors. Since SOX was
enacted to improve the accuracy and reliability of corporate disclosure across the board,
that is, for all US listed firms, one would expect higher foreign investment levels in
firms that are not the traditional clientele of FII, post-SOX. My results confirm this
assertion. I find that, post-SOX, FII invest in smaller stocks, stocks with lower dividend
yields and the stocks of firms with higher leverage.
To test the robustness of my inferences on FII investment preferences, I divide them
into active and passive groups. Historically, passive investors have expended minimum
effort in monitoring their investee firms, mainly because of the costs of acquiring
private information. Post-SOX, such costs should be lower because of lower
information asymmetry. This should attract passive investors to invest more in the US
market in general and in stocks with high private information levels in particular, post-
SOX. Indeed, I find that, post-SOX, the increase in the investment by passive FII is
greater than that by active FII. Passive FII also invest more in high private information
(high R&D) stocks.

82
To check if confounding effects could be driving my results, I run a battery of
robustness checks. First, I test whether I am simply reporting a time trend, rather than a
SOX effect on foreign institutional investment. I select a group of firms that are not
exposed to the implications of SOX, that is, non-accelerated filers. These firms have
market value of equity lower than $75 million and are exempt from complying with
SOX during the course of my time series. I classify these firms as a control group and
all other firms as the treatment group. Using a difference-in-differences estimation, I
test the post-SOX investment in the treatment group. I find positive significant foreign
institutional investment levels for my treatment group (accelerated filers), post-SOX.
This result indicates that the increase in FII investment in my treatment group is above
and beyond general time trends in foreign investment in US firms. Finally, I examine
global macroeconomic trends as an alternative reason for higher foreign investment
levels in the US. The SOX effect persists.
My study contributes both to the literature on the economic impact of regulatory
changes, and to that on institutional investment. I show that the implementation of SOX
has brought benefits to the US economy in that, post-SOX, investment by FII has
increased.38 SOX has also had an impact on the investment decisions of FII. Smaller US
firms, traditionally overlooked by FII, are now considered targets for investment.
38 Higher foreign investment also has its downsides. The Congressional Research Service (CRS) report (Jackson, 2010) highlights how a net outflow of income payments (for example, dividend payments to foreign investors) can have a negative impact on the US economy. It discusses the possibility of a coordinated withdrawal of foreign investors, and the impact it would have on US markets. The report also highlights how increased foreign ownership of US firms can blur the distinction between domestic and foreign-owned firms and how this may change the way firms view trade, economic and other types of public policies. On average though, high foreign investment in a country is considered a positive force for its economic development.

83
Similarly, firms with lower dividend yields and higher leverage also attract FII.
Collectively, my results indicate that FII also invest in less prudent stocks post-SOX.
The remainder of the chapter is organized as follows. In Section 2, I present my
hypotheses. Section 3 provides details of the data and methodology. In Section 4, I
discuss the main findings, and I report the robustness tests in Section 5. I conclude in
Section 6.
3.2. Development of Hypotheses
A high level of disclosure in a company/country attracts more institutional investment.
Several studies in the literature document the positive relationship between institutional
investment and high levels of corporate disclosure (e.g. Healy et al., 1999; Bushee and
Noe, 2000). Bushee and Noe (2000) identify three reasons for the institutional
investors’ sensitivity to the corporate disclosure level. First, more disclosure reduces the
price impact of trades; this attracts investors to invest in high disclosure stocks (see also
Healy et al., 1999).39 Second, high disclosure levels substitute for private information
collection, thus allowing professional investors to better identify profitable investment
opportunities. Finally, institutional investors value higher corporate disclosure since it
allows them to carry out their corporate governance activities, for example, monitoring
managerial performance, at a lower cost.40
39 Falkenstein (1996) and Gompers and Metrick (2001) find that institutional investors prefer to invest in firms with high trading volumes. This result is consistent with the argument that institutional investors prefer firms in which trades have a lower price impact. 40 According to Healy et al. (1999), the reason behind the increased level of institutional investment is the institutions’ desire to get the benefits of improved disclosure. Since institutional investors can extract

84
The Sarbanes-Oxley Act was implemented with a view to increase the accuracy and
reliability of corporate disclosure, by imposing high disclosure requirements on firms
listed on US exchanges (Hamilton and Trautman, 2002). Increased necessity of
corporate transparency for the US listed firms post-SOX is also raised by Engel et al.
(2007). They link the increased transparency with the new disclosure rules and the
penalties to corporate frauds. By reporting better IPO performance for US firms,
Johnston and Madura (2009) also support the notion of reduced level of information
asymmetry in the US market post-SOX. I argue that, post-SOX, an improvement in the
information environment of US firms41 may lead to lower information asymmetry, and
consequently the need for less effort (thus lower costs) in monitoring managerial
actions. Such improved market conditions may attract investors from foreign countries
and increase the level of foreign institutional investment in the US, post-SOX.
H1: The level of foreign institutional investment in the US has increased since the
enactment of SOX.
In the second hypothesis, I aim to investigate the impact of SOX on the firm-specific
investment preferences of FII. Historically, in line with the prudent man rules,
institutional investors have invested in ‘reliable’ assets.42 Badrinath et al. (1989) provide
greater benefits in markets with higher disclosure levels, their investment preferences are positively related to the level of disclosure in a market. 41 The idea of a SOX-led improvement in the US information environment is supported by recent evidence. Johnston and Madura (2009) report better Initial Public Offering (IPO) performance, that is lower underpricing and higher post-IPO performance, for US firms, which they attribute to the enhanced transparency brought about by SOX provisions. 42 Under the constraint of the ‘prudent man’ rule, institutional investors have incentives to protect themselves from liability by tilting their portfolios toward those assets that are easy to defend in court.

85
supporting evidence on the effect of prudent man rules. They show that the level of
institutional shareholdings is positively associated with firm size, past performance,
company beta, trading liquidity, and listing history, and negatively associated with stock
return volatility. Del Guercio (1996) also argues that institutional investors tilt their
portfolios towards prudent stocks (large firms, firms with high book-to-market ratios
and high liquidity) in line with prudent man behavior. In addition, following the existing
literature I assume a reduction in the information asymmetry level post- SOX (Engel et
al., 2007; Johnston and Madura, 2009). Given, though, that SOX has resulted in a
market-wide reduction in information asymmetry, it is now easier for investors to
monitor firms that are not necessarily under the media or analyst spotlight, that is,
smaller firms. At the same time, lower information asymmetry discourages managerial
malpractice by making it easier to spot (Donaldson, 2005). Finally, SOX has
substantially increased managerial accountability and litigation risk (Sen, 2007).
Therefore, managers are expected to be more risk-averse (Cohen et al., 2009). As a
result of the above, FII investment preferences towards specific firm characteristics may
change post-SOX. In other words, depending on the impact of SOX on market-wide
information asymmetry, FII may show an affinity towards less prudent stocks. I
formulate two alternative hypotheses:
H2a: Post-SOX, foreign institutional investors continue to invest only in prudent
stocks.
H2b: Post-SOX, foreign institutional investors invest in less prudent stocks, as well.

86
In line with the extant literature, I classify as less prudent stocks those of smaller firms,
firms with lower book-to-market ratios, lower liquidity, and higher leverage, as well as
firms with lower dividend yields.
My final two hypotheses relate to the investment preferences of different types of FII.
Post-SOX, enhanced disclosure should lead to a drop in the value of private information
in the US markets. I argue that this reduction in the value of private information will
influence FII behavior in the US. In line with Bushee et al. (2010)43 I categorize FII into
active and passive investors and examine the post-SOX investment behavior of these
investors in all firms, as well as in firms where the level of private information is
expected to be high (high research and development (R&D) expenditure firms).
According to Brickley et al. (1988), in order to protect existing or potential business
relationships, passive institutional investors (such as banks and insurance companies)
tend not to put pressure on the managers of their investee firms. Since they do not want
to damage their relationship with the company management, that is, face high costs of
monitoring, passive institutional investors are not expected to expend effort in
collecting private information (Chen et al., 2007). As a result, a potential reduction in
the value of private information favors them greatly. On the other hand, active
institutional investors (such as investment companies, independent investment advisors
and public pension funds) do not actively seek business ties with the firms they invest in
(Brickley et al., 1988) and encounter lower legal restrictions on their investments (Jiao
and Liu, 2009). Thus, they are more likely to collect and use private information
(Almazan et al., 2005). A potential reduction in the value of private information could
therefore signal a loss of competitive advantage for active institutional investors. 43
The data for this classification are available from http://acct3.wharton.upenn.edu/faculty/bushee/
87
The additional information transparency in the US markets, brought about by SOX, is
expected to result in a reduction in the value of private information. As a result, I
expect, post-SOX, passive foreign institutional investment in the US to increase more
than active foreign institutional investment. In addition, I expect this increase to be
more pronounced in firms with higher levels of private information, for example, high
R&D expenditure firms. This leads to the following hypotheses:
H3: Post-SOX, the increase in investment by passive FII is greater than that by active
FII.
H4: Post-SOX, the investment by passive FII in high private information firms is
higher than that by active FII.
3.3. Data and Methodology
I use the Thomson Reuters 13F database to collect information on the holdings of FII in
US firms over the period 1999 to 2008. I include all constituent firms of the following
indices: S&P 500, S&P MidCap 400 and S&P SmallCap 600.44 In total, I gather
information on the holdings of institutional investors from 18 different foreign
countries. I define foreign institutional ownership (FIO) at the firm level as the number
of shares held by FII, divided by the firm’s number of shares outstanding.
Compustat, the Investor Responsibility Research Centre (IRRC) and CRSP provide the
relevant firm-level data at fiscal year-end. Corporate governance information is
44 I exclude American Depository Receipts (ADRs) and foreign stocks from my sample.

88
collected from the director files of IRRC, available through the RiskMetrics database.
The 13F filings report institutional investor holdings on a quarterly basis. I use the
institutional holdings reported for the last quarter of each fiscal year and merge these
with the other accounting and market data. After excluding firm-years with missing
values for some of the accounting data, in particular firm-level governance information,
I end up with an unbalanced panel of 12,336 firm-years.
3.3.1 Independent Variables45
In this subsection, I briefly describe the independent variables used in my empirical
analysis. I closely follow the extant literature in identifying and defining my variables.
Firm Size (SIZE): My proxy for firm size is the market value of equity at fiscal year-end
(Compustat item MKVALT). The institutional ownership literature mostly finds a
positive relationship between firm size and institutional ownership (e.g., Badrinath et
al., 1989; Cready, 1994; Falkenstein, 1996; Dahlquist and Robertsson, 2001; Bennett et
al., 2003). Dahlquist and Robertsson (2001) explain this based on institutional
investors’ preference for investing in well-known firms and firms with which they are
familiar.
Book-to-Market Ratio (BM): Book-to-market ratio is defined as the logarithm of the
ratio of the book value of common equity outstanding (Compustat item CEQ) to the
market value of equity. High (low) values represent value (growth) firms. Lakonishok et
al. (1994) and Dahlquist and Robertsson (2001) find that institutional investors prefer
45 In my robustness tests, I use two additional independent variables that capture the macroeconomic conditions in the US economy. I present more details of these two variables in the robustness section.
89
growth firms. In contrast, Ferreira and Matos (2008) show that US (foreign)
institutional investors invest more in value (growth) stocks.
Firm Market Turnover (TURN): My measure of stock market liquidity is turnover
(Dahlquist and Robertsson, 2001). I first calculate the monthly turnover of a stock.
Monthly stock turnover is defined as the monthly volume of a stock (CRSP item VOL),
divided by the firm’s shares outstanding at the end of that month (CRSP item
SHROUT). An annual figure is obtained by taking the average of the twelve monthly
observations. Institutional investors prefer liquid stocks as they reduce their trading
costs and also represent firms with greater information flows, hence less information
asymmetry. In these firms, institutional investors can better identify and replace poor
managers (Almazan et al., 2005). Gompers and Metrick (2001) report a positive relation
between institutional ownership and market liquidity.
Dividend Yield (DY): This variable is the dividend per share (Compustat item DVPSX-
F) divided by the fiscal year-end share price (Compustat item PRCC-F). According to
Del Guercio (1996), institutional investors should invest in high dividend yield stocks,
in line with prudent man rules.
Return on Equity (ROE): This is a measure of firm profitability. It is the ratio of net
income (Compustat item NI) to common equity (Compustat item CEQ). Aggarwal et al.
(2005) find a positive relationship between return on equity and institutional
investment.
Leverage (LEV): I define leverage as the ratio of debt in current liabilities (Compustat
item DLC) plus long-term total debt (Compustat item DLTT), to total assets (Compustat

90
item AT). Bathala et al. (1994) examine the role of institutional ownership on
managerial ownership and debt policy, and find a negative relationship between
institutional investment and debt levels. In addition, Dahlquist and Robertsson (2001)
use leverage as a proxy for a firm’s long-term financial distress and find a negative
relationship between it and foreign investment.
Cash Holdings (CASH): I measure cash holdings as the ratio of cash and short-term
investments (Compustat item CHE) to total assets (Compustat item AT). Since firms
with more cash are typically classified as having greater financial strength, I expect
institutional investors to prefer to invest in these firms (Dahlquist and Robertsson,
2001).
Directors’ Index (DINDEX): This is my measure of a firm’s governance quality. I
follow Bushee et al. (2010) to create DINDEX. It includes five different dummy
variables: CEO-chairman duality, the presence of board interlocks, attendance of board
meetings, board size and the percentage of independent directors. Bushee et al. (2010)
classify firms where the CEO is also the Chairman of the board as having lower
governance quality. My CEO dummy variable takes the value one if the two positions
are combined and zero otherwise. Interlocked directors are defined as directors who
serve on each other’s boards, and their presence on a board is considered an indicator of
weaker governance. This is because these directors might have incentives to vote in
ways that benefit their counterparts and themselves (Bushee et al., 2010). I create a
variable (DLOCK), which is equal to one if there are any interlocks on the board of
directors and zero otherwise. Less attendance of board meetings is associated with less
successful monitoring of the management team. Therefore, a low level of attendance is

91
an indication of weaker governance. I create a dummy variable (DBAD), taking the
value one if any of the directors misses 75% or more of the board meetings and zero
otherwise. The proxy for board size is the logarithm of the number of directors
(LNDIR). If the board size is large, Bushee et al. (2010) expect there to be greater
problems with communication, coordination and decision making. Next, fewer
independent directors on the board indicate weaker corporate governance of the firm.
Since independent directors’ careers do not depend heavily on the management team,
they are considered to be more effective monitors of a firm’s managers. I calculate the
percentage of directors that are dependent (PNID). I split the distribution of LNDIR and
PNID into high and low groups using k-means cluster analysis. I create dummies for
these two variables which are equal to one if they are in the high group and zero
otherwise. I end up with five dummy variables; DINDEX is the sum of these five
dummy variables. A value of zero (five) indicates boards with the strongest (weakest)
governance structures. Bushee et al. (2010) find a negative relation between institutional
ownership and DINDEX.
Research and Development (RD): Following the extant literature (e.g., Aboody and
Lev, 2000), my proxy for the level of private information is defined as the ratio of R&D
expenditure (Compustat item XRD) to the book value of assets (Compustat item AT).
Institutional investors avoid investing in high private information firms (Graves and
Waddock, 1990; Jacobs, 1991; Porter, 1992; Bushee, 1998).

92
3.3.2 Methodology
To test my hypotheses I run the following regressions:
ε++++= YDXaSOXaaFIO tfztf ,10, (1)
εδδδδ +++++= YDXSOXXSOXFIO tfztftf ,,210, * (2)
εβββββ ++++++= YDXRDSOXRDSOXPASSCONS tfztftftf ,,3,210, * (3)
The dependent variable (FIO) is the same in models 1 and 2. FIOf,t is the total
percentage ownership of a firm’s equity by FII in firm f at time t. It is defined as the
ratio of the shares held by the FII in the firm to the firm’s shares outstanding at fiscal
year-end. PASSCONS is the concentration level of passive foreign institutional
investment. It is equal to total foreign passive institutional ownership divided by total
foreign institutional ownership in firm f at time t. I separate institutional investors into
active vs. passive institutional investors in line with Bushee et al. (2010). Independent
investment advisors, investment companies and public pension funds are classified as
active institutional investors. Banks, insurance companies, university and foundation
endowments, corporate pension funds and miscellaneous investors are classified as
passive institutional investors. SOX is a dummy which is equal to one for firm-years
after 2002 and zero otherwise. In each model, I use the following vector of firm-level
control variables (X): firm size, book-to-market ratio, dividend yield, turnover ratio,
return on equity, leverage, cash level and DINDEX. XSOX* is a vector of interaction

93
terms, created by interacting each control variable with the SOX dummy. RD is a proxy
of the level of private information in firm f at time t. RD*SOX is the interaction between
RD and the SOX dummy. YD are year dummies.
I use firm fixed effect panel regressions to test each model.46 This allows me to account
for time-invariant firm-level omitted variables that could bias my results. I also use year
dummies in all my regressions in order to control for cross-sectional dependence
(Gujarati, 2004). The year dummies also help me to remove deterministic time trends
from my analyses (see Section 5.1 for more details). Finally, in all regressions I use
heteroskedasticity robust standard errors; I cluster them at the firm level to control for
time-series dependence.
3.3.3. Descriptive Statistics
Table 3.1, Panel A, shows the time series of institutional investment by foreign (FI),
domestic (DI) and all institutional investors (TI) in the US between the years 1999 and
2008.47 Panel A illustrates that both TI and DI increase almost monotonically between
1999 and 2008. TI increases from 52% in 1999 to 70% in 2008. DI also reaches 61% in
2008. Between 1999 and 2008, the level of foreign institutional ownership in US firms
has doubled (8% compared to 4%). I argue that the enactment of SOX is one of the
reasons behind this increase in FI; I test this line of argument in the following sections.
46 Even though my dependent variable is censored at 0 and 100%, I decide against reporting the results of the censored regressions given there is no significant clustering of observations at either cut-off point. My results remain qualitatively the same when I run censored regressions. 47 Following Gompers and Metrick (2001), in order to calculate market-level institutional ownership variables I aggregate all institutional investor shareholdings (per category) and divide them by the sum of the shares outstanding for all of the firms in my sample.

94
Table 3.1, Panel B, presents the descriptive statistics of the control variables used in this
study. I winsorize size, leverage, dividend yield and return on equity at the 1% level
(two tails), since the original distributions of these variables are skewed. The average
firm in the sample has a market value of $6.9 billion and a dividend yield of 1%; its
leverage stands at 22% and its turnover is 19%. Return on equity is 10%, the book-to-
market ratio is 0.14, DINDEX is 1.7 and the ratio of cash holdings to total assets is
13.5%. R&D expenditure accounts for 2% of the book value of assets.
Table 3.2 reports Pearson correlation coefficients for all of the variables used in this
study. FIO is positively and significantly correlated to SOX. Thus, I confirm, at a
univariate level, the positive relation between foreign institutional investment in US
firms, and SOX. Moreover, I find that FIO is also positively and significantly correlated
with firm size, dividend yield, turnover, return on equity and cash holdings. In contrast,
FIO is negatively correlated with DINDEX and the book-to-market ratio.
3.4. Empirical Results
3.4.1 SOX Effect on FIO
I begin my multivariate analysis by examining whether the enactment of SOX has had
an effect on the level of foreign institutional investment in US firms. Table 3.3 presents
the results of firm fixed effect panel regressions where the dependent variable is FIO.
Foreign institutional investment is positively associated with SOX. This result is
consistent with my hypothesis 1. I argue that the positive coefficient is a result of

95
increased disclosure and better internal accountability and monitoring in US firms since
the enactment of SOX.
To further support my inferences, I investigate separately the investment preferences of
active and passive institutional investors, shown in columns 2 and 3, respectively. I
expect both types of institutional investors to respond positively to the enactment of
SOX. However, given that passive institutional investors are bound to benefit the most
from a reduction in the value of private information, I expect the SOX effect to be more
pronounced for them. I find positive, significant SOX coefficients in both cases. Both
types of institutional investors increase their stakes in US firms, post-SOX. However,
the magnitudes of the coefficients reveal that the increase in overall foreign investment
levels is mainly driven by passive investors. I return to this issue in Section 4.3.
The signs of the coefficients of the control variables included in the analysis are in line
with those reported in prior studies. In Table 3.3, column 1, I report that FII prefer to
invest in firms with high turnover ratios, high past performance, high cash holdings and
lower leverage. These preferences are mainly driven by the passive FII. In contrast, the
active FII are primarily attracted by firm size and market liquidity.
3.4.2 SOX Effect on Foreign Institutional Investors’ Firm-Level Preferences
Table 3.4 reports the results of my regression analysis relating to hypothesis 2. In this
table, I report the effect of SOX on the firm-level investment preferences of FII. My aim
is to report the changes in their preferences that occur as a result of the enhanced
corporate transparency and reliability, post-SOX. I interact the SOX dummy with each

96
of the firm-specific characteristics, separately. I use all of the interaction terms in my
regressions to find the SOX marginal effect on foreign institutional investment for each
firm-specific characteristic.
In column 1, the dependent variable is FIO. Post-SOX, FII increase their holdings in
smaller firms, firms paying lower dividends and those with higher leverage levels. They
also increase their holdings in better governed and more liquid firms. These results are
mostly driven by the passive FII, as indicated by the signs and magnitudes of the
coefficients in column 3.
These results are broadly consistent with hypothesis 2. Indeed, FII appear to increase
their investment levels, post-SOX, in firms that are not their traditional turf, that is,
smaller, riskier firms. Investment in these firms is not in line with prudent man rule
expectations (Del Guercio, 1996). The fact that this effect is mainly driven by passive
investors further supports my inference that it is due to a reduction in information
asymmetry and the resulting negative impact of SOX on the value of private
information. I provide additional results relating to this in Section 4.3.
I note that FIO increases in better governed, more liquid firms, post-SOX. This is not
surprising, given that the enactment of SOX has led to a market-wide improvement in
corporate governance quality. The SOX-initiated reduction in information asymmetry
has also led to an improvement in stock market liquidity across the board (Jain et al.,
2008).

97
3.4.3. Passive FIO and SOX
So far, my results indicate that passive FII have benefited the most from the enactment
of SOX. I argue that this is illustrated by the significantly greater increase in their post-
SOX holdings of US equity than that for active FII. Given that passive investors do not
monitor the management teams of the firms in which they invest, they stand to gain the
most from a reduction in the value of private information through better disclosure and
internal monitoring. I therefore expect post-SOX passive FIO to increase (relative to
active FIO) in firms where the level of private information is traditionally higher, that
is, high information asymmetry firms.
Table 3.5 reports the results relating to these predictions. The dependent variable is the
foreign passive institutional investment concentration (PASSCONS). It captures the
investments of passive institutional investors relative to active institutional investors. In
addition, I opt to use an accounting-based proxy for firm-level private information,
which is commonly used in the extant literature, that is, the R&D expenditure scaled by
the book value of assets. Market-based proxies, for example measures of stock market
liquidity, are not appropriate since there is a direct SOX effect on them (Jain et al.,
2008).
Table 3.5, column 1, reports a highly significant positive coefficient of SOX, which
confirms that passive FII invest more, post-SOX, in US firms, relative to active
institutional investors (my hypothesis 3). In line with my predictions in hypothesis 4, I
also find a positive significant marginal SOX effect on the relation between firm-level
private information and passive ownership concentration (column 2). Post-SOX passive
FII increase their holdings in high private information firms, more than active investors.

98
To further strengthen my inferences, in column 3 I run an alternative specification.
Instead of using the RD level in a firm, I split my sample into above/below the sample
median RD, and create a dummy variable (R&D), taking the value one for above-
median RD levels and zero otherwise. This allows me to broadly classify my cross-
section into high vs. low private information firms, thus avoiding the influence of time-
series changes in the absolute levels of RD. Only the relative position of a firm (in terms
of RD spending) in the cross-section is important in this setting. The interaction of this
variable with SOX is positive and significant, confirming my inferences.
3.5. Robustness Tests
3.5.1 Am I Simply Reporting a Time Trend?
A common shortcoming in studies that investigate structural breaks in an economy is
that it is difficult to exclude alternative explanations based on confounding effects. A
frequent criticism is that the reported relations are manifestations of time trends in the
data. As a first attempt to alleviate concerns that my findings are driven by such time
trends, I have included year dummies in all my prior analyses. Time dummies should
capture deterministic (as opposed to stochastic) time trends. In this section, I use more
robust methods to deal with this issue.
The implementation of SOX was compulsory, with immediate effect, for all US listed
firms, apart from some small firms which were allowed more time to comply with the
act, as regulators concluded that these firms would not be able to cope with the
99
increased compliance costs imposed by SOX.48 The exempted firms, called non-
accelerated filers, were firms with a market value of equity lower than $75 million. I
expect to see no change in the investment preferences of FII for these firms. As a result,
they form an ideal control group.
The existence of non-accelerated filers in the US market allows me to run a difference-
in-differences (DD) estimation. This estimation helps me avoid the problem of omitted
trends, since I compare the two groups (non-accelerated vs. accelerated filers) over the
same time period. It also allows me to carry out a time-series comparison (before and
after the SOX enactment) between the two groups, thereby alleviating concerns
regarding the impact of unobserved, omitted variables in the analysis.
In order to establish my treatment group, I create a new dummy variable (ACCE), which
takes the value one if a firm is classified as an accelerated filer, and zero if it is a non-
accelerated filer. I interact this with the SOX dummy (SOX). All model specifications
also include the uninteracted variables and the control variables used in my prior
analyses.
Table 3.6 reports the results of the DD regressions for total FIO, as well as for passive
and active FIO.49 There is a positive significant effect of SOX on foreign institutional
investment for accelerated filers. The coefficient of ACCE*SOX is statistically
48 The US Securities and Exchange Commission (SEC) extended the compliance dates for non-accelerated filers on several occasions, so that they could improve the quality of their efforts. The last recorded date was in 2010, well after the introduction of SOX; this means that the exemption for non-accelerated filers applied throughout my sample period. 49 Throughout my previous analyses, I control for the level of corporate governance quality (DINDEX). This restricts my sample to 12,336 observations due to missing values in DINDEX; most of the data unavailability is for smaller firms. This leaves me with very few non-accelerated filers in my sample. Given the importance of this sub-group of firms for the analysis of this section, I exclude DINDEX in order to capture more non-accelerated filers. None of my previous analyses are sensitive to the decision to include DINDEX.

100
significant in two out of the three models. The effect on FIO is mainly driven by the
passive FII, consistent with my prior results. One would have expected to see
insignificant coefficients, if my prior results were simply a manifestation of a time trend
in FIO or some other confounding effect. The fact that I find significant results in the
DD analysis supports my conclusions regarding the positive effect of SOX on FIO.
3.5.2 Macro effects
Foreign institutional investment is affected by global macroeconomic conditions.
Therefore, the observed increase in FIO for US firms, post-SOX, could be due to better
prospects for the US economy, or an increase in the global wealth available for
investment in the equity markets. A recent CRS report (Jackson, 2010) discusses the
‘safe haven’ effect during times of uncertainty, favorable returns on investments relative
to risk, a surplus of savings in countries around the world, the well-developed US
financial system, and the overall stability of the US economy, as reasons for the foreign
capital inflows into the US. In principle, the analysis I ran in Section 5.1 should address
the possible impact of omitted variables on the FII-SOX relationship. In addition, the
use of year dummies in all of my models should capture the effect of cross-sectional
dependence, that is, market-wide effects that could influence FIO. However, I run a
further model specification, where instead of the year dummies I add two variables, one
that proxies for the implied risk in the US economy (the CBOE Volatility Index; VIX)
and another that captures the global economic growth (the weighted average GDP
growth for all of the countries represented in my dataset; WVGDP). Table 3.7, column
101
1, reports the results of this specification. The SOX coefficient remains positive and
highly significant.
3.5.3 Further tests
The extant literature on institutional investment has provided evidence of reverse
causality between institutional ownership levels and specific firm characteristics, for
example firm size and profitability. Therefore, some of the base (not marginal) effects I
report in my tables could be interpreted based on reverse causality inferences.
Regarding this issue, I would like to point out that the level of foreign institutional
ownership is very small compared to that of domestic institutions. The average foreign
ownership during 2007-8 is 8%, compared to more than 60% for domestic institutions.
Therefore, the impact of FII on firm characteristics should be minimal. In addition, in
order to alleviate reverse causality concerns, I exclude from my sample any foreign
investors with more than 10% equity holdings in a specific firm, and re-run my analyses
(untabulated result). The results remain unchanged.
I also test two model specification choices I have made in this chapter, namely the
clustering of standard errors at the firm level and the use of firm fixed effects. In all my
regressions, I cluster the standard errors at the firm level to account for time-series
dependence. In Table 3.7, column 2, I show the sensitivity of my main result to this
model specification. In particular, I re-estimate the model in equation 1, but now cluster
the standard errors at the industry level, using the two-digit SIC classifications. The
SOX coefficient remains positive and significant. I also re-run the analyses for the other
102
three hypotheses. The results remain unchanged (untabulated result). Furthermore, I test
the accuracy of the fixed effect specification. Firstly, I run the Breusch and Pagan
(1980) Lagrange multiplier test to identify the existence of random effects. I reject the
null hypothesis that the variance of the random firm effects equals zero. Thus, the
random effect model is preferred to OLS. Secondly, I run a Hausman (1978) test and
strongly reject the null hypothesis, which indicates that the fixed effect specification
will give the most unbiased coefficients. I conclude that the firm fixed effect
specification gives the most robust results.
Finally, I run a Variance Inflation Factors (VIF) analysis for all models to check
whether my results are driven by multicollinearity. I find no indication of a bias.
3.6. Conclusions
In this chapter, I focus on the effect of the Sarbanes-Oxley Act on foreign institutional
investment in US firms, and examine whether SOX has had an impact on the investment
preferences of FII. SOX was enacted to reinforce confidence in the US markets after a
number of high profile corporate scandals in the early part of this century. Its
implementation is expected to result with an increased level of disclosure by US firms. I
document that this change in the information environment of US firms has had a
positive impact on their foreign institutional investment levels.
I not only find an increase in foreign institutional investment, post-SOX, but also report
changes in FII investment preferences. I document several important results. First, post-
SOX, FII exhibit a shift in their investment behavior towards less prudent stocks. I find

103
that, although FII continue to invest in large firms, they have also begun to invest in
smaller firms, firms with lower dividend yields and firms with higher leverage. Second,
the increase in passive FIO has been larger than that in active FIO, post-SOX. I argue
that this is driven by a reduction in the value of private information, post-SOX. Indeed,
I document that passive FII invest more in high private information stocks than active
FII do, post-SOX.
Overall, my results highlight a positive effect of the enactment of SOX, namely higher
foreign institutional investment in US firms. Further, firms which were traditionally
overlooked by institutional investors are now attracting their attention. Such attention,
however, has its advantages and disadvantages. If the FII trends documented in my
chapter continue in the future, it is very likely that the shape and form of US firms may
begin to look very different to what exists today. Future research should investigate the
potential implications of this trend.

104
TABLE 3.1- Descriptive Statistics
This table reports descriptive statistics on institutional ownership, as well as the firm characteristics of my sampled firms. Panel A reports the fraction of shares held by foreign and domestic institutional investors investing in the US between 1999 and 2008. The investment levels are reported for the constituent firms of the S&P 1500 index. Institutional ownership at the market level is defined as the sum of the institutional investor holdings at fiscal year-end, divided by the sum of total shares outstanding, for all of the firms in my sample. TI is the level of total institutional investment in S&P 1500 firms. FI is the investment level of foreign institutional investors (FII) investing in S&P 1500 firms. DI is the investment level of domestic (US) institutional investors. UNC is the investment level of institutional investors for which there is no information on origin (cannot be classified). Panel B reports the descriptive statistics for the firm-level variables used in this study. SIZE is firm size, defined as the fiscal year-end market value of equity. BM is the logarithm of the ratio of a firm’s book value of equity to its market value of equity. DY is the dividend yield, defined as the dividend per share, divided by the share price. LEV is leverage, defined as the ratio of total debt to total assets. ROE is the return on equity, defined as net income divided by common equity. CASH is cash holdings, defined as the ratio of cash and short-term investment to total assets. TURN is the firm’s market turnover, which is equal to common shares traded divided by common shares outstanding. The turnover ratio is first calculated monthly. Annual turnover is defined as the average of the twelve monthly observations. DINDEX is the directors’ index, defined as in Bushee et al. (2010). It is based on information regarding CEO duality, number of board directors, the percentage of directors who are not independent, interlocks on the board of directors and attendance of board meetings. A value of five (one) indicates a poorly (well)-governed firm. RD is the research and development expenditure divided by the book value of assets. VIX is the Chicago Board Options Exchange Volatility Index and is a measure of the implied volatility of the S&P 500 index options. WVGDP is the value-weighted world GDP growth. It is obtained by multiplying each country’s GDP growth rate by its GDP as a proportion of global GDP. Mean, median (P50), standard deviation (SD), 25th percentile (P25) and 75th percentile (P75) are reported. N is the number of observations. Leverage, dividend yield, firm size and return on equity are winsorised at 1% (two tails).

105
PANEL A: Institutional Ownership
Variable 1999 2000 2001 2002 2003 2004 2005 2006 2007 2008
TI 52% 54% 56% 59% 61% 65% 66% 69% 72% 70%
FI 4% 4% 5% 5% 3% 6% 7% 7% 8% 8%
DI 48% 46% 51% 54% 58% 58% 59% 61% 63% 61%
UNC - 4% - - - 1% - 1% 1% 1%
PANEL B: Firm Level Characteristics Variable N MEAN SD P25 P50 P75 SIZE (billions) 12,336 6.927 15.814 0.674 1.677 5.197 DY 12,336 0.013 0.019 0.000 0.006 0.021 BM (log) 12,336 -0.865 0.736 -1.263 -0.788 -0.414 TURN 12,336 0.189 0.161 0.085 0.141 0.238 LEV 12,336 0.220 0.170 0.065 0.213 0.338 ROE 12,336 0.100 0.274 0.057 0.120 0.181 CASH 12,336 0.135 0.166 0.022 0.062 0.189 DINDEX 12,336 1.706 0.977 1.000 2.000 2.000 RD 12,336 0.021 0.033 0.000 0.000 0.031 VIX 12,336 21.323 6.319 15.480 21.983 25.750 WVGDP (%) 12,336 2.198 1.012 1.397 2.460 2.936

106
TABLE 3.2- Correlation Matrix
This table reports the Pearson correlation coefficients of the variables used in this study. FIO is the firm-level foreign institutional ownership for the firms in my sample. SOX is a dummy variable, taking the value one after the year 2002 and zero otherwise. SIZE is firm size, defined as the fiscal year-end market value of equity. BM is the logarithm of the ratio of a firm’s book value of equity to its market value of equity. DY is the dividend yield, defined as the dividend per share, divided by the share price. LEV is leverage, defined as the ratio of total debt to total assets. ROE is the return on equity, defined as net income divided by common equity. CASH is cash holdings, defined as the ratio of cash and short-term investment to total assets. TURN is the firm’s market turnover, which is equal to common shares traded divided by common shares outstanding. The turnover ratio is first calculated monthly. Annual turnover is defined as the average of the twelve monthly observations. DINDEX is the directors’ index, defined as in Bushee et al. (2010). A value of five (one) indicates a poorly (well)-governed firm. RD is the research and development expenditure divided by the book value of assets. VIX is the Chicago Board Options Exchange Volatility Index and is a measure of the implied volatility of the S&P 500 index options. WVGDP is the value-weighted world GDP growth. It is obtained by multiplying each country’s GDP growth rate by its GDP as a proportion of global GDP. * denotes significance at the 1% level.

107
FIO SOX SIZE DY BM TURN LEV ROE CASH DINDEX RD VIX WVGDP
FIO 1
SOX 0.379* 1
SIZE 0.059* 0.023* 1
DY 0.061* -0.004 0.058* 1
BM -0.026* -0.006 -0.267* 0.209* 1
TURN 0.264* 0.207* -0.101* -0.197* -0.066* 1
LEV -0.001 -0.089* 0.015 0.255* 0.070* -0.109* 1
ROE 0.068* 0.038* 0.145* 0.009 -0.395* -0.106* -0.026* 1
CASH 0.029* 0.062* -0.008 -0.281* -0.230* 0.344* -0.417* -0.054* 1
DINDEX -0.170* -0.258* 0.171* 0.137* -0.008 -0.220* 0.127* 0.053* -0.187* 1
RD 0.014 -0.007 0.071* -0.266* -0.223* 0.256* -0.288* -0.122* 0.538* -0.180* 1
VIX -0.103* -0.499* -0.046* 0.120* 0.152* 0.071* 0.078* -0.110* -0.047* 0.074* -0.003 1
WVGDP -0.159* -0.015 0.038* -0.085* -0.149* -0.199* -0.008 0.111* -0.011 0.094* -0.003 -0.654* 1
108
Table 3.3- The SOX Effect on Foreign Institutional Investment
This table shows the effect of the Sarbanes-Oxley Act on foreign institutional investment in US listed firms. The dependent variables are the levels of total (FIO), active (ACTIVEFIO), and passive (PASSIVEFIO) foreign institutional ownership, respectively. Active institutional investors are investment companies, independent investment advisors and public pension funds. Passive institutional investors are banks, insurance companies and others. SOX is a dummy variable taking the value one after the year 2002 and zero otherwise. SIZE is firm size, which is defined as the fiscal year-end market value of equity. BM is the logarithm of the ratio of the firm’s book value of equity to its market value of equity. DY is the dividend yield, defined as the dividend per share divided by the share price. LEV is leverage, defined as the ratio of total debt to total assets. ROE is the return on equity, defined as net income divided by common equity. CASH is cash holdings, defined as the ratio of cash and short-term investment to total assets. TURN is a firm’s market turnover, which is equal to common shares traded divided by common shares outstanding. DINDEX is the directors’ index, defined as in Bushee et al. (2010). A value of five (one) indicates a poorly (well)-governed firm. Year dummies (Year FE) and firm fixed effects (Firm FE) are included in the regressions. The numbers in brackets are p-values. ***, **, and * denote significance at the 1%, 5% and 10% levels, respectively. N is the number of observations. I use heteroskedasticity robust standard errors, clustered at the firm level.

109
Variable FIO ACTIVEFIO PASSIVEFIO SOX 5.157*** 0.239*** 4.877*** [0.000] [0.004] [0.000] SIZE 0.002 0.006*** -0.006* [0.613] [0.002] [0.092] DY -2.595 -0.46 -1.502 [0.253] [0.718] [0.406] BM (log) 0.102 -0.044 0.143*** [0.115] [0.260] [0.004] TURN 1.391*** 0.765*** 0.601* [0.000] [0.000] [0.052] LEV -0.884*** 0.034 -0.835*** [0.004] [0.844] [0.001] ROE 0.305** 0.138* 0.176** [0.010] [0.063] [0.048] CASH 1.546*** 0.032 1.453*** [0.000] [0.872] [0.000] DINDEX -0.051 -0.011 -0.036 [0.150] [0.568] [0.213] Constant 3.693*** 1.018*** 2.654*** [0.000] [0.000] [0.000] Year FE Yes Yes Yes Firm FE Yes Yes Yes R-squared 0.458 0.076 0.491 N 12,336 12,336 12,336
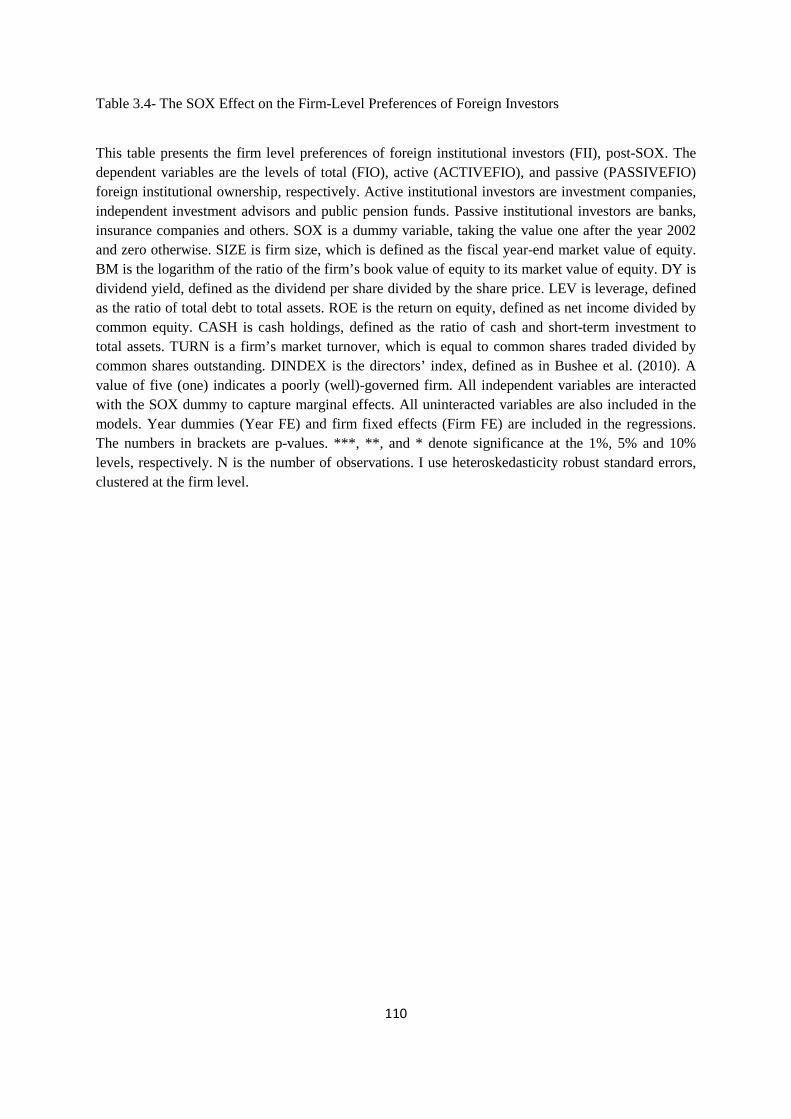
110
Table 3.4- The SOX Effect on the Firm-Level Preferences of Foreign Investors
This table presents the firm level preferences of foreign institutional investors (FII), post-SOX. The dependent variables are the levels of total (FIO), active (ACTIVEFIO), and passive (PASSIVEFIO) foreign institutional ownership, respectively. Active institutional investors are investment companies, independent investment advisors and public pension funds. Passive institutional investors are banks, insurance companies and others. SOX is a dummy variable, taking the value one after the year 2002 and zero otherwise. SIZE is firm size, which is defined as the fiscal year-end market value of equity. BM is the logarithm of the ratio of the firm’s book value of equity to its market value of equity. DY is dividend yield, defined as the dividend per share divided by the share price. LEV is leverage, defined as the ratio of total debt to total assets. ROE is the return on equity, defined as net income divided by common equity. CASH is cash holdings, defined as the ratio of cash and short-term investment to total assets. TURN is a firm’s market turnover, which is equal to common shares traded divided by common shares outstanding. DINDEX is the directors’ index, defined as in Bushee et al. (2010). A value of five (one) indicates a poorly (well)-governed firm. All independent variables are interacted with the SOX dummy to capture marginal effects. All uninteracted variables are also included in the models. Year dummies (Year FE) and firm fixed effects (Firm FE) are included in the regressions. The numbers in brackets are p-values. ***, **, and * denote significance at the 1%, 5% and 10% levels, respectively. N is the number of observations. I use heteroskedasticity robust standard errors, clustered at the firm level.

111
Variable FIO ACTIVEFIO PASSIVEFIO
SIZE*SOX -0.013*** 0.002** -0.014***
[0.000] [0.040] [0.000]
DY*SOX -9.756*** -1.575 -7.457***
[0.000] [0.290] [0.001]
BM*SOX -0.02 -0.046 0.074
[0.806] [0.335] [0.261]
TURN*SOX 2.730*** 0.637*** 2.041***
[0.000] [0.005] [0.000]
LEV*SOX 0.786** 0.554*** 0.22
[0.012] [0.001] [0.389]
ROE*SOX 0.329 -0.145 0.446***
[0.125] [0.262] [0.006]
CASH*SOX 0.155 -0.015 0.3
[0.654] [0.937] [0.284]
DINDEX*SOX -0.162*** -0.01 -0.154***
[0.002] [0.722] [0.000]
SOX -1.551*** -0.795*** -0.748***
[0.000] [0.000] [0.000]
SIZE 0.012*** 0.005** 0.005
[0.007] [0.024] [0.144]
DY 3.194 0.395 3.049
[0.231] [0.796] [0.156]
BM (log) 0.101 -0.033 0.109**
[0.151] [0.443] [0.039]
TURN 0.005 0.420** -0.42
[0.990] [0.035] [0.165]
LEV -1.394*** -0.298 -0.995***
[0.000] [0.122] [0.000]
ROE 0.104 0.217** -0.083
[0.489] [0.023] [0.433]
CASH 1.360*** 0.019 1.207***
[0.000] [0.935] [0.000]
DINDEX 0.03 -0.005 0.041
[0.461] [0.831] [0.208]
Constant 3.682*** 1.124*** 2.516***
[0.000] [0.000] [0.000]
Year FE Yes Yes Yes
Firm FE Yes Yes Yes
R-squared 0.466 0.078 0.5
N 12,336 12,336 12,336

112
Table 3.5- Heterogeneous Effect of the Sarbanes-Oxley Act
This table presents the SOX effect on passive institutional ownership concentration. PASSCONS is the ratio of the level of passive foreign institutional investment to total foreign institutional investment in a firm. Passive institutional investors are banks, insurance companies and others. SOX is a dummy variable, taking the value one for the years after 2002 and zero otherwise. SIZE is firm size, which is defined as the fiscal year-end market value of equity. BM is the logarithm of the ratio of the firm’s book value of equity to its market value of equity. DY is the dividend yield, defined as the dividend per share divided by the share price. LEV is leverage, defined as the ratio of total debt to total assets. ROE is the return on equity, defined as net income divided by common equity. CASH is cash holdings, defined as the ratio of cash and short-term investment to total assets. TURN is a firm’s market turnover, which is equal to common shares traded divided by common shares outstanding. DINDEX is the directors’ index, defined as in Bushee et al. (2010). A value of five (one) indicates a poorly (well)-governed firm. RD is defined as the research and development expenditure divided by the book value of assets. R&D is a research and development expenditure dummy. If the RD ratio is higher than the population median for the year, the dummy is set equal to one; otherwise it is set to zero. R&D*SOX is an interaction term obtained by multiplying R&D with SOX. Year dummies (Year FE) and firm fixed effects (Firm FE) are included in the regressions. The numbers in brackets are p-values. ***, **, and * denote significance at the 1%, 5% and 10% levels, respectively. N is the number of observations. I use heteroskedasticity robust standard errors, clustered at the firm level.

113
Variable PASSCONS PASSCONS PASSCONS
SOX 0.084*** 0.074*** 0.074***
[0.000] [0.000] [0.000]
RD*SOX - 0.365*** -
[0.010]
RD - 0.532 -
[0.105]
R&D*SOX - - 0.023**
[0.011]
R&D - - -0.045**
[0.031]
SIZE -0.001* -0.001 -0.001*
[0.078] [0.157] [0.090]
DY 0.131 0.115 0.132
[0.380] [0.439] [0.377]
BM (log) 0.036*** 0.036*** 0.035***
[0.000] [0.000] [0.000]
TURN -0.088*** -0.072*** -0.081***
[0.000] [0.001] [0.000]
LEV 0.04 0.042 0.039
[0.135] [0.121] [0.148]
ROE -0.013 -0.012 -0.014
[0.177] [0.210] [0.156]
CASH 0.025 0.031 0.023
[0.375] [0.284] [0.426]
DINDEX 0.0004 -0.001 -0.001
[0.894] [0.849] [0.835]
Constant 0.796*** 0.781*** 0.815***
[0.000] [0.000] [0.000]
Year FE Yes Yes Yes
Firm FE Yes Yes Yes
R-squared 0.255 0.256 0.256
N 12,336 12,336 12,336

114
Table 3.6- Difference-in-Differences using Accelerated Filers
This table reports a difference-in-differences regression on the investment preferences of foreign institutional investors (FII). The dependent variables are the levels of total (FIO), active (ACTIVEFIO), and passive (PASSIVEFIO) foreign institutional ownership, respectively. Active institutional investors are investment companies, independent investment advisors and public pension funds. Passive institutional investors are banks, insurance companies and others. SOX is a dummy variable, taking the value one after the year 2002 and zero otherwise. ACCE equals one if a firm has a fiscal year-end market value of equity of more than $75 million and zero otherwise. ACCE*SOX is an interaction term obtained by multiplying SOX by ACCE. SIZE is firm size, which is defined as the fiscal year-end market value of equity. BM is the logarithm of the ratio of the firm’s book value of equity to its market value of equity. DY is dividend yield, defined as the dividend per share divided by the share price. LEV is leverage, defined as the ratio of total debt to total assets. ROE is the return on equity, defined as net income divided by common equity. CASH is cash holdings, defined as the ratio of cash and short-term investment to total assets. TURN is a firm’s market turnover, which is equal to common shares traded divided by common shares outstanding. Year dummies (Year FE) and firm fixed effects (Firm FE) are included in the regressions. The numbers in brackets are p-values. ***, **, and * denote significance at the 1%, 5% and 10% levels, respectively. N is the number of observations. I use heteroskedasticity robust standard errors, clustered at the firm level.

115
Variable FIO ACTIVEFIO PASSIVEFIO SOX 3.195*** 0.148 3.018*** [0.000] [0.358] [0.000] ACCE*SOX 1.196*** -0.048 1.139*** [0.001] [0.753] [0.000] ACCE 0.919*** 0.175* 0.813*** [0.000] [0.089] [0.000] SIZE 0.010* 0.009*** -0.002 [0.060] [0.000] [0.698] DY -2.653 -0.777 -0.309 [0.307] [0.514] [0.878] BM (log) 0.122** -0.054 0.175*** [0.034] [0.117] [0.000] TURN 1.958*** 1.018*** 0.885*** [0.000] [0.000] [0.001] LEV -0.709** -0.03 -0.641** [0.030] [0.868] [0.011] ROE 0.271*** 0.128** 0.135* [0.008] [0.027] [0.082] CASH 0.843** 0.096 0.718*** [0.015] [0.657] [0.006] Constant 2.152*** 0.729*** 1.343*** [0.000] [0.000] [0.000] Year FE Yes Yes Yes Firm FE Yes Yes Yes R-squared 0.466 0.076 0.507 N 16,558 16,558 16,558

116
Table 3.7- Macro and Industry Effects
This table reports the sensitivity of my main result to alternative model specifications. FIO is the level of foreign institutional ownership in a firm. SOX is a dummy variable taking the value one for the years after 2002 and zero otherwise. SIZE is firm size, which is defined as the fiscal year-end market value of equity. BM is the logarithm of the ratio of the firm’s book value of equity to its market value of equity. DY is dividend yield, defined as the dividend per share divided by the share price. LEV is leverage, defined as the ratio of total debt to total assets. ROE is the return on equity, defined as net income divided by common equity. CASH is cash holdings, defined as the ratio of cash and short-term investment to total assets. TURN is a firm’s market turnover, which is equal to common shares traded divided by common shares outstanding. DINDEX is the directors’ index, defined as in Bushee et al. (2010). A value of five (one) indicates a poorly (well)-governed firm. WVGDP is the value-weighted world GDP growth. It is obtained by multiplying each country’s GDP growth rate by its GDP as a proportion of global GDP. VIX is the Chicago Board Options Exchange Volatility Index and is a measure of the implied volatility of the S&P 500 index options. Year dummies (Year FE) are included in the second column. Firm fixed effects (Firm FE) are included in both regressions. The numbers in brackets are p-values. ***, **, and * denote significance at the 1%, 5% and 10% levels, respectively. N is the number of observations. I use heteroskedasticity robust standard errors, clustered at the firm (industry) level in column 1 (column 2).

117
Variables FIO FIO SOX 1.310*** 5.157*** [0.000] [0.000] SIZE 0.043*** 0.002 [0.000] [0.700] DY 15.085*** -2.595 [0.000] [0.271] BM (log) 0.512*** 0.102 [0.000] [0.173] TURN 5.519*** 1.391*** [0.000] [0.004] LEV -0.980*** -0.884** [0.008] [0.021] ROE 0.750*** 0.305** [0.000] [0.035] CASH -0.242 1.546*** [0.582] [0.000] DINDEX -0.416*** -0.051 [0.000] [0.131] WVGDP -0.525*** - [0.000] VIX -0.074*** - [0.000] Constant 7.229*** 3.693*** [0.000] [0.000] Year FE No Yes Firm FE Yes Yes SE industry clustered No Yes R-squared 0.209 0.458 N 12,336 12,336

118
CHAPTER 4: FIRM INNOVATION AND INSTITUTIONAL INVEST MENT: THE ROLE OF THE SARBANES-OXLEY ACT
4.1. Introduction
This chapter examines the impact of the Sarbanes-Oxley Act (SOX) on the relation between
institutional ownership (IO) and firm innovation. Prior literature reports the difficulty highly
innovative firms face in attracting equity capital in general and institutional investment in
particular (Bushee, 1998; Graves and Waddock, 1990; Jacobs, 1991; Porter, 1992). One of
the prevailing reasons is the high level of information asymmetry in these firms, which
translates into high costs of monitoring for outsiders. However, the enactment of SOX has led
to more transparency in financial reporting and better, as well as timelier, information
disclosure (Engel et al., 2007). I therefore predict a positive relation between IO and firm
innovation post-SOX. Based on prior studies, I propose two explanations for the change in
this relation: the decrease in these firms’ information asymmetry (direct effect) and the
increase in their market liquidity (indirect effect), post-SOX. I find strong results supporting
the direct effect explanation. This chapter identifies a policy implication, which is important
given the need for developed markets to continue their investment in innovation in the face of
global competition.
As a result of their high level of information asymmetry, highly innovative firms attract less
institutional investment (Porter, 1992). Aboody and Lev (2000) report high levels of
information asymmetry between insiders and outsiders in firms with high levels of
expenditure on research and development (R&D). They suggest that this is because R&D
expenditure is idiosyncratic (unique), which makes it difficult to monitor and understand.
Bushee (1998) explains the negative relation between IO and innovation using the myopic

119
investment hypothesis. Bushee (1998), and earlier Froot et al. (1992) and Porter (1992),
indicate that institutional investors prefer firms with high current earnings to those with high
R&D expenditure (so future potential earnings) because of the high information asymmetry
surrounding R&D expenditure. The existence of this information asymmetry is linked to
institutional investors’ ability to predict short-term price movements rather than long-term
prospects (Bushee, 1998). In other words, the institutional investor’s inability to evaluate a
firm’s long-run performance, means that he/she will focus on performance measures that are
easily measurable, such as current earnings (Porter, 1992; Lang and McNichols, 1997; Kim et
al., 1997; Brown and Brooke, 1993).
The extant SOX literature has examined some benefits, but mostly the costs, associated with
the enactment of SOX. For example, Linck et al. (2009) argue that increased director and
officer insurance premiums and more costly audit committees should be thought of as costs
of SOX. Also, Ahmed et al. (2010) find that firms’ cash-flow profitability drops post-SOX. In
contrast, Coates (2007) discusses the benefits of SOX in terms of enhanced trust in US capital
markets. Abdioglu et al. (2011) present an increase in foreign institutional investment in the
US market post-SOX as a positive consequence of SOX. In addition, a number of studies
(Rezaee, 2002, 2004; Osterland, 2002; Cunningham, 2003; Coates, 2007) predict, but do not
test, the following SOX effects: (1) a reduction in the information asymmetry between
managers and shareholders, which would lead to improved corporate governance; (2) a
reduction in information risk, that is, the risk that financial statements are inaccurate,
incomplete or false (Jain et al., 2008). According to Hamilton and Trautmann (2002), SOX
was implemented in order to increase corporate disclosure, by imposing high disclosure

120
requirements on firms listed on US exchanges.50 The increased level of disclosure, thus
decreased information asymmetry, imposed by SOX makes the market more reliable. The
increased information efficiency should also result in an increase in market liquidity.
According to Jain et al. (2008), as a direct result of the improved reliability of public financial
information and the restored investor confidence in financial reports, the US market has
become more liquid since the enactment of SOX.
Although a growing body of literature is studying either the effect of SOX on the US market
or the relation between innovation and IO, as far as I am aware none of the existing studies
has examined the SOX effect on the relation between IO and firm innovation. I contribute to
the literature by examining whether a policy, specifically the SOX enactment, has altered
institutional investors’ investment preferences regarding firm innovation. Specifically, my
main research question is the following: Do highly innovative firms attract more institutional
investment since the enactment of SOX? I predict that the reduced information asymmetry
and/or increased liquidity in the US market will strengthen the relation between IO and
innovation. In other words, I expect highly innovative firms to attract more institutional
investment post-SOX.
Consistent with my prediction, I find that highly innovative firms do attract more institutional
investment post-SOX. Both my univariate and multivariate analyses highlight a strong SOX
effect. In order to investigate which of the two effects―that is, the reduced information
asymmetry or the increased market liquidity―drives my results, I conduct the following
analyses: First, I separate institutional investors into active and passive groups and investigate 50 Sections 401, 403, 404, 406, 407 and 409 of SOX are among the sections related to firm disclosure obligations. According to Section 401, financial statements must be published accurately by the issuers and must not contain incorrect statements. In addition, Section 404 entails that all publicly-traded companies must establish, document, test and maintain internal controls for financial reporting. Section 409 insists on the real-time disclosure of any material change in the financial condition of the firm.

121
their investment preferences separately.51 Passive institutional investors typically avoid
investing in firms with high information asymmetry since the cost of monitoring is too high
for them, compared to the cost for active investors. A reduction in the value of private
information post-SOX would favour the passive investors greatly, since their competitive
disadvantage (compared to active investors) would be lower. So, given the SOX-led
reduction in information asymmetry levels, highly innovative firms should be able to attract
more passive institutional investment post-SOX. Indeed, I find higher levels of passive
institutional investment in highly innovative firms post-SOX. The marginal SOX effect is
higher for passive than for active institutional investors. Thus, I conclude that the information
asymmetry effect explains my hypothesis. For my second piece of analysis, I argue that the
increased level of liquidity post-SOX could also explain the positive relation between
innovation and IO. In order to test this, I separate institutional investors into dedicated and
non-dedicated groups52 and examine their preferences. If market liquidity drives my result I
will expect to find more pronounced non-dedicated institutional investment in highly
innovative firms post-SOX. This is because non-dedicated investors trade frequently, so
market liquidity is an important determinant of their investment allocations. In contrast,
dedicated investors are long-horizon, buy-and-hold investors. A reduction in trading costs
should not greatly affect their investment preferences. I find a higher increase in the
investment levels of dedicated (compared to non-dedicated) investors in highly innovative
firms post-SOX. This result indicates that the liquidity effect is not the main driver of my
results. I also run alternative model specifications―cross-sectional regressions based on
51 I define passive and active institutional investors in section 3.1. 52 I define dedicated and non-dedicated institutional investors in section 3.1.

122
improvements (changes) in market liquidity―which confirm that improvements in market
liquidity do not drive my results.
Finally, I use difference-in-differences (DD) estimations in order to confirm the SOX effect
on the relation between IO and firm innovation. By using a DD estimation, I mitigate the
impact of omitted time trends and other unobserved omitted variables. There are some firms,
that is, non-accelerated filers, that the Securities and Exchange Commission (SEC) has
exempted from complying with SOX. These firms have a market value of equity lower than
$75 million and the SEC has judged that they cannot bear the SOX-related compliance costs.
So, I classify them as a control group in my DD tests. I classify all other firms as the
treatment group. I find a positive relation between IO and innovation in my treatment group,
post-SOX. This result further supports my conclusions about the positive SOX effect on the
relation between IO and innovation.
My study contributes to the literature on the economic impact of SOX, as well as that on
institutional investment and innovation. I show that the implementation of SOX has a direct
positive effect on the relation between IO and innovation. Highly innovative firms attract
more institutional investment post-SOX. The result is driven by the reduced level of
information asymmetry in the US market, post-SOX.
The remainder of the chapter is organized as follows: Section 2 introduces my hypothesis.
Section 3 describes my data and methodology. Section 4 presents my empirical findings.
Section 5 shows my robustness tests. Section 6 concludes.
123
4.2. Hypothesis
The public information environment plays an important role in the investment preferences of
institutional investors. Consistent with this view, prior studies report that firms which have
less information asymmetry (Merton, 1987), that is, those with a greater analyst following
(O’Brien and Bhushan, 1990), a higher disclosure quality (Bushee and Noe, 2000), that are
larger (Kang and Stulz, 1997) or are at a smaller distance (local) (Coval and Moskowitz,
1999), attract higher levels of institutional investment. Investors deem the riskiness of stocks
they do not know to be very high and thus avoid investing in them. Since highly innovative
firms are expected to have high levels of information asymmetry,53 they cannot easily attract
institutional capital. Graves and Waddock (1990), Jacobs (1991), and Porter (1992) all report
that institutional investors avoid investing in firms with high innovation expenditure.54 The
“myopic” viewpoint of institutional investors also explains the negative relation between
innovation and IO.55 According to the myopic investment hypothesis, institutional investors
value short-term gains more than long-term benefits (Kochar and David, 1996; Drucker,
1986; Mitroff, 1987; Scherer, 1984; Loescher, 1984). Since R&D investments have long-term
horizons, institutional investors avoid investing in highly innovative firms. Since the
53 See Mohd (2005), Aboody and Lev (2000), Barth and Kasznik (1999), Barth and McNichols (2001) and Boone and Raman (2001). 54 Aboody and Lev (2000) show R&D expenditure to be a major contributor to information asymmetry between corporate insiders and outside investors. According to them, because of the intangibles created by R&D spending, corporate insiders have an information advantage and gain at the expense of outsiders. Since R&D is uniquely related to each firm, outside investors cannot find enough information about the value of the firm. As a result, firms with high R&D expenditure cannot attract enough institutional investment capital.
55 In addition to the managerial myopia hypothesis, two alternative hypotheses are presented in the extant literature. According to the first, institutional investors aim for long-term gains and thus invest in highly innovative firms (Allen, 1993; Jarrell et al., 1985; Jensen, 1988). Based on the first, the second predicts that institutional investors might influence firms to increase their innovation expenditure. Since they have large holdings, they have an incentive to monitor managers and influence the firm’s decisions (Taylor, 1990; Useem, 1993). So far, the empirical results on the relation between IO and firm innovation offer little support for these alternative hypotheses.

124
investors do not have the ability to evaluate the long-term value of a firm (Porter, 1992), they
focus on easily measurable performance measures, such as current earnings (Porter, 1992;
Lang and McNichols, 1997; Kim et al., 1997; Brown and Brooke, 1993). Since the
institutional investors’ prudence is judged by earnings, they prefer to invest in better-
performing (in the short-term) firms (Badrinath et al, 1989).
I argue that a decrease in the information asymmetry level in the US market might change the
relation between innovation and IO. I expect SOX to be one of the main drivers of the
increased information efficiency in the US market.56 SOX requires firms to make more timely
and extensive financial disclosures, which leads to greater transparency (Engel et al., 2007). I
argue that, as a result of higher transparency in the US market, the information asymmetry
level should decrease. Post-SOX, I expect the relation between innovation and institutional
investment to strengthen. This is mainly for two reasons: First, the lower information
asymmetry allows professional investors, such as institutional investors, to monitor
management actions at a lower cost, that is, there are lower agency costs. As I mention above,
the prior literature offers overwhelming support for a negative relation between institutional
investment and agency costs (e.g., O’Brien and Bhushan, 1990; Bushee and Noe, 2000; Kang
and Stulz, 1997; Coval and Moskowitz, 1999). At the same time, the greater information
transparency/efficiency improves the forecasting ability of investors with regard to long-term
firm value (Healy and Palepu, 2001). This should contribute towards lower levels of investor,
in particular professional investor, myopia.
56 Lev (1988) indicates that, after the enactment of an accounting regulation, the information asymmetry among investors decreases. The increased disclosure brought about by the new accounting regulation is one of the reasons for the decreased information asymmetry. According to Leuz and Verrecchia (2000), increased accounting disclosure reduces the information asymmetry both between firms and shareholders and among investors.
125
In addition to the information asymmetry effect, increased liquidity post-SOX could drive the
positive relation between firm innovation and IO. Prior literature reports increased liquidity
in the US market since the enactment of SOX (Jain et al., 2008). According to Bhide (1993),
an increase in US market liquidity makes it easier for institutional investors to exit an
investment. Put differently, if they are dissatisfied with the firms they have invested in,
institutional investors can sell their shares more easily (at a lower cost) in a liquid market.
Assuming institutional investors prefer highly innovative firms (Allen, 1993; Jarrell et al.,
1985; Jensen, 1988), they could use the threat of exiting the investment if firms do not invest
sufficiently in innovation.57 This option to exit should force the managers in the investee
firms to spend more on innovation. Therefore, I predict that the increased US market liquidity
causes a positive relation between IO and innovation, post-SOX.
Taking all of the above arguments together, I form the following hypothesis:
H1: Post-SOX, the relation between innovation and institutional investment strengthens.
57 Institutional investors can put pressure on boards behind the scenes, by using their exit option, if they are dissatisfied with the management (Aghion et al., 2009).

126
4.3. Data and Methodology
I use the Thomson Reuters 13F database to collect information on the holdings of
institutional investors investing in US firms over the period from 1998 to 2009. I define IO at
the firm level as the total number of shares held by institutional investors, divided by the
number of shares outstanding in the firm. I examine all the institutional holdings in the S&P
1500 index, which includes the following indices: S&P 500, S&P MidCap 400 and S&P
SmallCap 600.
I collect the data for my dependent variable, innovation (RD), from the Compustat
Fundamentals Annual database. I define RD as the R&D expenditure, divided by the book
value of total assets, measured at the end of fiscal year t.58 I also collect sales, market-to-
book, leverage, return on assets, investment opportunities, and debt-to-equity ratio data from
the Compustat Fundamentals Annual database, diversification data from the Compustat
Segments database, and bid-ask spread data from CRSP.59 The IO data is collected on a
quarterly basis and the other variables on an annual basis. I merge the IO reported for the last
quarter of each fiscal year with the other fiscal year-end variables. My final sample has
16,797 firm-year observations.
58 I replace R&D expenditure with 0, if it is missing. 59 The definitions of these control variables are given in section 3.1.

127
4.3.1. The Variables
This section provides the definitions of my dependent and independent variables. I follow the
literature on firm innovation to determine the control variables I use in this chapter.60
Research and Development Expenditure (RD): I measure innovation using the R&D
expenditure made by a firm during the fiscal year as a proxy. I define RD as the ratio of R&D
expenditure (Compustat item XRD) to the book value of assets (Compustat item AT). Graves
and Waddock (1990), Jacobs (1991), Porter (1992) and Bushee (1998) all report a negative
relation between institutional investment and the level of R&D expenditure in a firm.
Institutional Ownership (IO): IO is the number of shares held by institutional investors,
divided by the number of shares outstanding in a firm at fiscal year-end. As mentioned above,
institutional investors avoid investing in firms with high innovation expenditure. I separate
institutional investors according to their legal type and trading behaviour, following Bushee
et al. (2010) and Bushee (1998)61. I classify the different types of investors into active and
passive institutional investors. Active institutional investors are investment companies,
independent investment advisors and public pension funds. Passive institutional investors are
banks, insurance companies and others. Passive institutional investors have close business
relations with their investee firms and, in order to protect these relations, they do not expend
effort in collecting private information about these firms. As a result, they prefer not to
monitor their investee firms (Chen et al., 2007). In contrast, active institutional investors
collect private information about their investee firms because they are unwilling to create
business ties with these firms. In other words, they are the investors who bear the monitoring
60 In particular, Aghion et al. (2009), Fang et al. (2011), Kochhar and David (1996) and Faleye et al. (2011). 61 The data for these classifications are available from http://acct3.wharton.upenn.edu/faculty/bushee/

128
costs (Brickley et al., 1988). In addition, I classify institutional investors according to their
trading behaviour, into dedicated vs. non-dedicated institutional investors (Bushee, 1998).
Dedicated investors have long-term investment horizons and, as a result, they trade their
investee firms’ stocks infrequently. However, non-dedicated investors, that is quasi indexers
and transient investors, trade frequently (Aghion et al., 2009) and so market liquidity is an
important investment allocation determinant for them.
Sales (SALES): This variable captures gross sales, that is the amount of actual billings to
customers for regular sales, completed during the fiscal year, reduced by cash discounts, trade
discounts, and returned sales, as well as allowances for credit given to customers (Compustat
item SALE). According to Schumpeter (1961), since large firms have continuous and
efficient R&D programmes, they are more innovative than small firms. Knott and Posen
(2009) assume that there is a positive relation between R&D intensity and the level of sales
and capital. Using sales as a proxy of firm size, Shrieves (1978) finds that R&D expenditure
decreases with firm size.
Market-to-Book Ratio (M2B): M2B is the fiscal year-end market value of assets divided by
the fiscal year-end book value of assets (Compustat item M2B = (MVE+AT-CEQ)/AT,
where MVE= CSHO*PRCC_F). According to Wahal and McConnell (2000), growth
opportunities might influence R&D expenditure. They find a negative relation between the
change in market-to-book value, their proxy of the change in growth opportunities, and the
change in R&D expenditure.
Leverage (LEV): I measure leverage as the ratio of debt in current liabilities (Compustat item
DLC) plus long-term debt (Compustat item DLTT) to total assets (Compustat item AT). Fang
et al. (2011) find that firms with lower leverage are more innovative. According to Smith and

129
Warner (1979), an increase in the level of debt results in higher managerial risk aversion in a
firm. As a result, Baysinger and Hoskisson (1989) find a negative relation between the level
of long-term debt and R&D investment.
Return on Assets (ROA): This variable measures a firm’s profitability. I define return on
assets as operating income before depreciation (Compustat item OIBDP), divided by the
book value of total assets (Compustat item AT), measured at the end of fiscal year t. Hitt et
al. (1991) report that ROA has a negative effect on patent intensity. However, Fang et al.
(2011) find a positive relation between firm profitability and the level of firm innovation.
Investment Opportunities (INVOP): This variable is the ratio of capital expenditure
(Compustat item CAPX) to sales (Compustat item SALES). Faleye et al. (2011) find a
positive relation between investment opportunities and R&D expenditure.
Debt-to-equity ratio (DER): This is the ratio of the book value of total assets (Compustat item
AT) minus the book value of common equity (Compustat item CEQ) to the market value of
common equity (Compustat item MKVALT) (Bhandari, 1988). I use the debt-to-equity ratio
as a measure of financial slack. According to Chen and Miller (2007), as the firm’s slack
resources increase, R&D intensity increases. “Slack acts as an important catalyst for
innovation because it causes managers to relax controls and permit experimentation even in
the face of uncertainty” (Chen and Miller, 2007, pg. 370).
Diversification (DIVERS): I control for the effects of diversification by using the entropy
measure (Jacquemin and Berry, 1979; Palepu, 1985): )/1ln( jj PPsureEntropyMea ∑=

130
where jP is defined as the share of sales in segment j and )/1ln( jP is the weight of each
segment j (the logarithm of the inverse of its sales), as in Kochhar and David, 1996. Faleye et
al. (2011) find a negative relation between corporate diversification and innovation activity.
Stock Liquidity (SPREAD): Spread is the ratio of the closing ask price (CRSP item ask)
minus the closing bid price (CRSP item bid) to the midpoint ((ask+bid)/2). In order to
calculate the annual spread, I annualise the daily spread observations. Fang et al. (2011)
reports that, if a firm has higher spread (lower liquidity), it generates a larger number of
patents in a year.
4.3.2. Methodology
I use the following model to test my hypothesis:
tftftftftf IDYDbXSOXIOaSOXaIOaaRD ,,,32,10, * ε+++++++= (1)
The dependent variable (RD) is the ratio of R&D expenditure to the book value of assets in
firm f at time t. IO is the total IO level in firm f at time t. SOX is a SOX dummy variable
equal to 1 for the years after 2002, and 0 otherwise. SOXIO tf *, is an interaction term which
is created by interacting IO with the SOX dummy, and captures the marginal SOX effect on
the relation between IO and RD. X is a vector of firm-level control variables, that is sales,
market-to-book ratio, leverage, return on assets, investment opportunities, debt-to-equity

131
ratio, diversification and spread. YD is the set of year dummies and ID is the industry
dummies.
I use random-effect Tobit panel regression in my analyses. Since the dependent variable, RD,
is replaced by zero if it has a missing value, I end up with a dependent variable that is
censored at zero. Using a Tobit model allows me to control for a clustering of the dependent
variable at zero. My regressions also account for random unobserved firm effects. To control
for cross-sectional dependence and to remove deterministic time trends from my model, I use
time dummies. I also add 48 industry dummies to my analysis, as defined by Fama and
French (1997).
4.3.3. Descriptive Statistics
Table 4.1 reports the descriptive statistics of the dependent and independent variables used in
this study. I winsorise RD, sales, market-to-book ratio, leverage, return on assets, investment
opportunities, debt-to-equity ratio and spread at the 1% level (two tails) in order to reduce the
effect of outliers. Table 4.1 shows that, on average, 66% of the firms’ equity is held by
institutional investors. Dedicated institutional investors hold 5% of the equity. Transient and
quasi-indexer institutional investors hold 18% and 40% of the equity, respectively. The
average firm in my sample reports sales of $4.2 billion a year. The mean RD is 3% and the
average market-to-book ratio is 2.10. The average firm earned a 13% annual return on assets,
has 8% in investment opportunities, and a debt-to-equity ratio of 1.17. Finally, the average
firm has a diversification ratio of 61%, leverage of 22% and a bid-ask spread of 0.01.

132
Table 4.2 reports the Pearson correlation coefficients for all variables used in this study.
According to Table 4.2, RD is negatively correlated with IO. Therefore, institutional
investment is negatively correlated with RD overall, and before controlling for the effect of
SOX. Most of the signs of the correlation coefficients between RD and the other control
variables are consistent with the innovation literature. For example, RD is negatively
correlated with sales, leverage and ROA.
4.4. Empirical Results
4.4.1. Univariate Analysis
I first conduct a univariate analysis to estimate the effect of SOX on the relation between RD
and IO. My aim is to illustrate that institutional investment in highly innovative firms is more
pronounced post-SOX than in the pre-SOX period. To alleviate concerns about confounding
effects, I use the DD methodology. This allows me to identify the effect of the specific event,
that is, the enactment of SOX, on the relation between RD and IO. First, I compare the
institutional investment in highly vs. less innovative firms, pre-SOX. I define highly (less)
innovative firms as firms with above (below) median RD levels. Table 4.3, Panel A, shows
that institutional investors invest more in less innovative firms pre-SOX, investing 56.49% of
the total average investment in those firms, compared to 54.70% of the investment in highly
innovative firms. The difference is statistically significant at the 1% level; it is also
economically significant, since 1.78% translates to a difference of $100.75 million in
institutional investment in the average firm in my sample. Next, I examine the institutional
investment in highly vs. less innovative firms, post-SOX. I find that the institutional investors
133
are responsible for a greater proportion of highly innovative firms’ total investment, post-
SOX than pre-SOX (72.72% of highly innovative firms’ total shares and 70.60% of less
innovative firms’ shares). This difference is again statistically and economically significant.
Finally, I take the DD approach in the third section of Table 4.3. The univariate DD estimates
the difference between the two groups (highly vs. less innovative firms) in terms of average
IO levels in the post- and pre-SOX periods. The difference is negative and highly
economically and statistically significant, at -3.31% (p-value < 0.000). The institutional
investment in highly innovative firms is higher than the investment in less innovative firms,
post-SOX.
4.4.2. Multivariate Analyses
I start my multivariate analyses by examining whether the highly innovative firms attract
more institutional investment post-SOX. Table 4.4, column 1, reports the result of my main
random-effect Tobit regression. SOX*IO is an interaction term between the IO and SOX
dummy (SOX) variables. I find a positive significant coefficient for the interaction term. This
result is in line with my prediction, as well as the univariate analysis, indicating that post-
SOX the relation between innovation and institutional investment strengthens. I argue that the
positive coefficient could be a result of decreased information asymmetry and/or increased
liquidity in the US stock market post-SOX. I turn my attention to this below.
To test the information asymmetry argument, I examine my main hypothesis separately for
the active and passive institutional investors. Passive institutional investors do not monitor
their investee firms, because the cost of collecting private information is high for these

134
investors (Chen et al., 2007). Given this prohibitive cost, passive investors do not typically
invest in firms with high information asymmetry, since they are at a disadvantage relative to
active investors, who collect private information and can therefore trade on it. Post-SOX, the
value of private information decreases though; I expect passive investors to benefit greatly
from this reduction, since now their disadvantage relative to active investors, that is, the value
of private information, has decreased. Since the information efficiency is expected to increase
for the whole of the US market post-SOX, the information asymmetry in the innovative
firms, which traditionally have high levels of private information, decreases as well. Thus,
passive institutional investors should be more attracted to highly innovative firms post-SOX,
in particular when compared to active investors. To test my argument, I test the main
hypothesis separately for the active and passive investors in columns 2 and 3 of Table 4.4. I
interact SOX with ACTIVEIO and PASSIVEIO, separately. ACTIVEIO and PASSIVEIO are
the levels of active and passive institutional investment, respectively. The difference between
the two coefficients is pronounced. While I find a 3% coefficient for the passive investor
interaction term (SOX*PASSIVEIO), the SOX marginal effect for active investors
(SOX*ACTIVEIO) is only 1%. Wald tests reveal that this difference in coefficients is
significant at the 1% level. This result indicates that the information asymmetry argument
explains the strengthening of the relation between IO and RD, post-SOX.
I now test whether the increased level of market liquidity post-SOX could be driving my
results. In order to test this, I separate institutional investors into dedicated and non-dedicated
groups in columns 4 and 5 of Table 4.4. Trading costs are not as important in determining the
investment preferences of dedicated institutional investors as those of non-dedicated ones.
This is because, by definition, dedicated institutional investors have a long-term investment

135
horizon and trade their investee firms’ stock only infrequently. In contrast, for non-dedicated
investors, that is quasi-indexers and transient investors, market liquidity is an important
determinant of their investment allocations, since their trading frequency is higher. Since, on
average, trading costs are expected to be lower post-SOX, as a result of increased information
efficiency, non-dedicated investors should benefit relatively more than dedicated investors
from this SOX-induced change. Therefore, if my results are driven by the (indirect) liquidity
effect, the coefficient of the SOX marginal effect for non-dedicated investors
(SOX*NONDEDI) should be positive and greater than that for the dedicated investors
(SOX*DED). My results do not support this argument however. In particular, I get a higher
coefficient for SOX*DED than SOX*NONDED (2% and 1% respectively). Thus, there is
little evidence that the strengthening in the IO–RD relation is due to improvements in market
liquidity post-SOX, that is, the hypothesised indirect effect. Instead, most of my results fit
well with the information asymmetry argument (direct effect).
4.5. Robustness Tests
4.5.1. The Effect of Increased Liquidity
My results so far support only a SOX-induced change in information asymmetry, and not in
market liquidity, as the main driver of my findings. In this section, I provide further evidence
against the market liquidity argument. Prior research shows that an increase in market
liquidity might affect the exit behaviour of institutional investors (Porter, 1992; Bhide, 1993),
since high liquidity makes it easier for institutional investors to exit an investment. In other
words, if they are dissatisfied with one of their investee firms, it should be easier for them to

136
sell their shares in a liquid market. So, assuming institutional investors prefer high levels of
firm innovation, they could use the threat of exiting the firm to motivate managers to invest
more in R&D spending. Therefore, my finding of a positive marginal effect of SOX on the
relation between my variables, RD and IO, could be explained by the increased liquidity,
post-SOX. If this is the case then one would expect to see higher levels of institutional
investment in firms that have improved a lot, in terms of market liquidity, between the pre-
and post-SOX periods.
In order to test this, I calculate the change in trading costs, that is, the delta bid-ask spread,
for every firm in my sample. The delta spread is the difference between the average spread
values in the post-SOX and pre-SOX periods. I then create a dummy variable (HIGHLIQ)
which is equal to one if the delta spread is lower than the population median and zero
otherwise. In other words, HIGHLIQ is equal to one for the big improvers in terms of
liquidity (the firms that have seen the largest increase in liquidity post-SOX).62 In Table 4.5, I
also use the average values of all other control variables and run cross-sectional regressions.
In Table 4.5, column 1, I create the interaction term HIGHLIQ*IOmean, which captures the
marginal effect of the improvement in liquidity on the IO–RD relation. Its coefficient is not
statistically significant. When I further investigate this relation separately for dedicated and
non-dedicated investors, I again find no impact of market liquidity on the post-SOX
investment preferences of these investors towards firm innovation. I also create another
variable (CDF) which is based on the cumulative distribution function of the delta spread.
This allows me to take into account only the cross-sectional ranking of each firm in terms of
market liquidity improvements, instead of the level of the improvement. I then create similar
62 I find that most firms in my cross-section have a negative delta spread value. This is consistent with the conjecture that there is an improvement in market liquidity post-SOX. The more negative is the delta spread value, the greater is the improvement in market liquidity―hence my definition of the HIGHLIQ dummy.

137
interaction terms and again study the relation between RD and IO. The results remain
unchanged (see columns 4–6 of Table 4.5).
4.5.2. Multivariate Difference-in-Differences Analysis
Studies examining the impact of structural breaks in an economy, such as, in this case, the
enactment of SOX, are vulnerable to criticism concerning confounding effects. In all my
analyses presented so far I try to address this issue either by incorporating a range of control
variables (in my multivariate analyses) or by using a DD test (in my univariate analysis). In
order to be assured that the DD test provides robust results, one needs to identify a control
group that is not affected by the structural break. In the univariate results presented in Section
4.1, I implicitly assume that the cross-sectional ranking of firms in terms of RD, that is
whether a firm has an above- or below-median RD level, is not affected by the enactment of
SOX. Admittedly, this is a weak assumption but it is driven by the inability to run a three-
way DD test at a univariate level.63
Here I relax this assumption by identifying a control group that is, by definition, not affected
by the enactment of SOX. Although the implementation of SOX was compulsory for all US
listed firms, some small firms were allowed more time to comply with the act. The Securities
and Exchange Commission (SEC) exempted firms with market values of equity lower than
$75 million from complying with the act immediately, feeling these firms would not be able
63 Univariate DD tests allow only for two-way comparisons, that is, the impact of the effect (i.e., SOX) on the treatment group compared to the control group, which is assumed not to be affected by the investigated effect. In my setting I care about the SOX effect on the relation between RD and IO. If I assume that SOX affects both RD and IO then one needs to create treatment and control groups based on a separate (third) dimension. This three-way comparison cannot be done at a univariate level. I address this issue in this section in a multivariate setting.
138
to cope with the costs imposed by SOX. These firms are called non-accelerated filers and,
over the period of my time series, that is, until 2009, they did not have to apply SOX. For
these firms, I do not expect to see any change in the relation between innovation and
institutional investment after the initial enactment of SOX. Thus, they form a control group in
my analysis. My treatment group includes all firms that have a market value of equity higher
than $75 million (i.e., accelerated filers).
This DD estimation also helps me avoid the problem of omitted time trends, since I compare
non-accelerated filers vs. accelerated filers over the same time period. Obviously, since DD
estimation allows me to do a time-series comparison (before and after the SOX enactment)
between these two groups, it also removes the impact of other unobserved omitted variables
in the analysis. In Table 4.6, I report the DD estimation results. I create a dummy variable
(ACCE) which takes the value of one if a firm is classified as an accelerated filer, and zero
otherwise. I interact SOX and IO with ACCE, resulting in the following interaction term,
SOX*ACCE*IO.64 Table 4.6 shows the results of my DD regression, using a random effect
Tobit regression (column 1) and an OLS regression (column 2). The coefficient of the
interaction term is positively significant in both of the models. The fact that I find significant
results in the DD analysis supports my conclusions regarding the positive effect of SOX on
the relation between IO and innovation. That is, the impact of SOX on that relation is above
and beyond any time, or other omitted, trends.
64 The typical DD specification involves only the interaction of the time series and the cross-sectional estimators, in my case SOX and ACCE. Given, though, that I wish to investigate the impact of SOX on the RD–IO relation, I use a modified DD test that involves this triple interaction term, i.e. SOX*ACCE*IO. The coefficient of this variable captures the relation between IO and RD only for the post-treatment observations (the treatment group, post-SOX). Furthermore, I use a number of additional covariates (control variables). This allows me to control for the possibility of non-random (endogenous) assignment to the treatment and control groups.
139
4.6. Conclusion
In this chapter, I investigate the impact of SOX on the relation between innovation and
institutional ownership. Highly innovative firms attract less institutional investment (Graves
and Waddock, 1990; Jacobs, 1991; Porter, 1992). Prior research identifies the high level of
information asymmetry within these firms as the main reason for this negative relation
(Bushee, 1998). However, the enactment of SOX has led to market-wide reductions in
information asymmetry. I find that the decreased information asymmetry strengthens the
relation between innovation and IO. Highly innovative firms can attract more institutional
capital, post-SOX. A limitation of this chapter might be shown as lack of finding a valid
instrument to test for reverse causality. The reverse causality argument requires that post-
SOX an increase in RD should lead to an increase in institutional investment. Such a relation
is not necessarily supported by the theoretical arguments presented in the chapter. In contrast,
I examine whether a possible reduction in information asymmetry post-SOX results in high
level of institutional investment in highly innovative firms. Theoretical arguments supports
that there is an improvement in the US market in terms of information efficieny post-SOX.
Thus, by using this argument I examine the relation between institutional investment and RD.
However, I do not come across with any argument which supports that post-SOX the level of
RD increases in the US market and this affects the level of institutional investment. Still, I try
to find a valid instrument to test for reverse causality but fail to find ones. For example,
following Faccio et al. (2011), I use the fraction of other institutional investment in the same
firm as an instrument and I use IV (Instrumental Variables) estimation to test endogeneity.
However, this instrument is not valid in my setting.

140
An alternative explanation is based on the impact of the increased level of market liquidity
(indirect effect) due to the enactment of SOX. In particular, prior studies argue that an
improvement in market liquidity strengthens the threat of exit by institutional investors. If
institutional investors are positively predisposed towards innovation, they can use any
exogenous increases in market liquidity to bargain with the management for higher R&D
spending. My findings do not provide any support for this indirect SOX effect on the relation
between institutional investment and firm innovation. Overall, my results highlight the role of
policy making in strengthening capital investment in highly innovative firms in the US.
Recently, there has been some debate over ways of strengthening the innovation activity in
developed economies, so that they can maintain a competitive advantage in a globalised
world. This chapter contributes to this debate by showing that an improvement in market
conditions, that is disclosure and accountability, can have a positive effect on attracting
investment capital to innovative firms.

141
TABLE 4.1 - Descriptive Statistics
This table presents the descriptive statistics for the dependent and independent variables used in this study. IO is the level of total institutional ownership in S&P 1500 firms between 1998 and 2009. DED is the level of dedicated institutional investment. Dedicated investors are undiversified investors and do not trade much. NONDED is the level of non-dedicated institutional investment in the related firms in my sample period. Non-dedicated investors are transient and quasi-indexer institutional investors. Transient investors are diversified investors and trade often. Quasi-indexers are diversified investors and do not trade much (Aghion et al., 2009). ACTIVEIO and PASSIVEIO are active and passive IO levels, respectively. Active institutional investors are investment companies, independent investment advisors and public pension funds. Passive institutional investors are banks, insurance companies and others. RD is the R&D expenditure divided by the book value of assets. SALE captures gross sales, that is, the amount of actual billings to customers for regular sales completed during the fiscal year, reduced by cash discounts, trade discounts, and returned sales as well as allowances for credit given to customers. M2B is the market-to-book ratio which is equal to the year-end market value of the assets divided by the year-end book value of assets. LEV is leverage, defined as the ratio of total debt to total assets. ROA is return on assets, which is the ratio of operating income before depreciation to the book value of total assets. INVOP is investment opportunities, defined as capital expenditure divided by sales. DER is the debt-to-equity ratio, defined as the ratio of the book value of total assets minus the book value of common equity to the market value of common equity.
DIVER is the entropy measure of diversification. )/1ln( jj PPsureEntropyMea ∑= where jP is
defined as the share of sales in segment j and )/1ln( jP is the weight of each segment j (the logarithm
of the inverse of its sales). SPREAD is the ratio of the ask price minus the bid price to the midpoint. Mean, median (P50), standard deviation (SD), 25th percentile (P25) and 75th percentile (P75) are reported. N is the number of observations. All the variables, except DIVERS and IO, are winsorised at 1% (two tails).
VARIABLE
N
MEAN
SD
P25
P50
P75
IO 16,797 0.656 0.223 0.527 0.699 0.827
DED 16,797 0.054 0.075 0 0.019 0.088
NONDED 16,797 0.583 0.215 0.447 0.608 0.746
ACTIVEIO 16,797 0.467 0.177 0.348 0.486 0.599
PASSIVEIO 16,797 0.182 0.088 0.123 0.183 0.24
RD 16,797 0.032 0.057 0 0 0.04
SALE (billions) 16,797 4.206 9.52 0.361 1.055 3.282
M2B 16,797 2.102 1.697 1.188 1.564 2.341
LEV 16,797 0.219 0.188 0.039 0.203 0.341
ROA 16,797 0.133 0.104 0.085 0.13 0.186
INVOP 16,797 0.079 0.126 0.022 0.04 0.078
DER 16,797 1.166 3.869 0.193 0.476 1.084
DIVERS 16,797 0.613 0.23 0.693 0.693 0.693
SPREAD 16,797 0.008 0.011 0.001 0.003 0.011
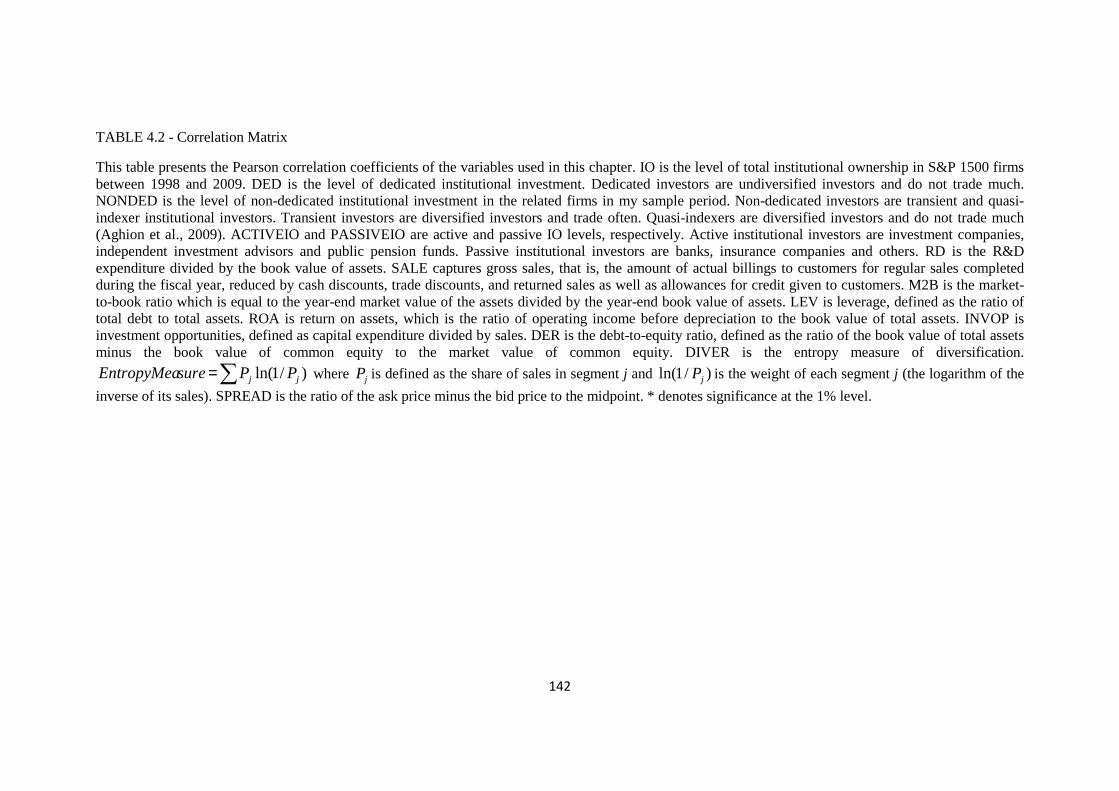
142
TABLE 4.2 - Correlation Matrix
This table presents the Pearson correlation coefficients of the variables used in this chapter. IO is the level of total institutional ownership in S&P 1500 firms between 1998 and 2009. DED is the level of dedicated institutional investment. Dedicated investors are undiversified investors and do not trade much. NONDED is the level of non-dedicated institutional investment in the related firms in my sample period. Non-dedicated investors are transient and quasi-indexer institutional investors. Transient investors are diversified investors and trade often. Quasi-indexers are diversified investors and do not trade much (Aghion et al., 2009). ACTIVEIO and PASSIVEIO are active and passive IO levels, respectively. Active institutional investors are investment companies, independent investment advisors and public pension funds. Passive institutional investors are banks, insurance companies and others. RD is the R&D expenditure divided by the book value of assets. SALE captures gross sales, that is, the amount of actual billings to customers for regular sales completed during the fiscal year, reduced by cash discounts, trade discounts, and returned sales as well as allowances for credit given to customers. M2B is the market-to-book ratio which is equal to the year-end market value of the assets divided by the year-end book value of assets. LEV is leverage, defined as the ratio of total debt to total assets. ROA is return on assets, which is the ratio of operating income before depreciation to the book value of total assets. INVOP is investment opportunities, defined as capital expenditure divided by sales. DER is the debt-to-equity ratio, defined as the ratio of the book value of total assets minus the book value of common equity to the market value of common equity. DIVER is the entropy measure of diversification.
)/1ln( jj PPsureEntropyMea ∑= where jP is defined as the share of sales in segment j and )/1ln( jP is the weight of each segment j (the logarithm of the
inverse of its sales). SPREAD is the ratio of the ask price minus the bid price to the midpoint. * denotes significance at the 1% level.

143
IO DED NONDED ACTIVEIO PASSIVEIO RD SALE M2B LEV RO A INVOP DER DIVERS SPREAD
IO 1
DED 0.180* 1
NONDED 0.940* -0.142* 1
ACTIVEIO 0.924* 0.226* 0.855* 1
PASSIVEIO 0.657* 0.014 0.656* 0.328* 1
RD -0.076* -0.022* -0.069* -0.026* -0.141* 1
SALE 0.047* 0.003 0.038* -0.061* 0.235* -0.106* 1
M2B -0.036* 0.0003 -0.031* -0.010 -0.072* 0.348* -0.057* 1
LEV -0.043* 0.070* -0.069* -0.070* 0.029* -0.231* 0.075* -0.234* 1
ROA 0.156* 0.020 0.156* 0.119* 0.158* -0.296* 0.043* 0.248* -0.076* 1
INVOP -0.039* 0.012 -0.047* -0.036* -0.036* -0.030* -0.063* 0.011 0.160* -0.046* 1
DER -0.108* -0.006 -0.111* -0.099* -0.075* -0.094* 0.088* -0.150* 0.234* -0.155* -0.027* 1
DIVERS 0.029* -0.035* 0.041* 0.018 0.037* 0.072* -0.009 0.008 -0.028* 0.015 -0.040* -0.048* 1
SPREAD -0.464* 0.063* -0.476* -0.381* -0.405* -0.005 -0.149* -0.117* 0.165* -0.138* 0.049* 0.152* -0.038* 1

144
TABLE 4.3 - Univariate Difference-in-Differences Results
This table reports the univariate analyses carried out to show the influence of SOX on the relation between IO and innovation. RD is the R&D expenditure divided by the book value of assets. A firm is defined as highly innovative if it has a RD ratio higher than the population median, and less innovative if it has a RD ratio less than the population median. The first section (1) presents the level of institutional investment in highly innovative (Group 1) and less innovative firms (Group 0) pre-SOX. Section (2) presents the institutional investment level in highly innovative and less innovative firms, post-SOX. Section (3) reports the DD analysis at the univariate level. I test the difference in the mean values of IO between the post- and pre-SOX periods in the highly and less innovative firms. Obs is the number of observations. Mean is the mean value of institutional investment. *** denotes significance at the 1% level.
(1) (2) (3)
If SOX=0 If SOX=1 D-in-D
Group Obs Mean Group Obs Mean Group Obs Mean
0 5,697 56.49 0 8,282 70.60 0 1,188 17.39
1 2,035 54.70 1 2,383 72.72 1 391 20.70
combined 7,732 56.02 combined 10,665 71.07 combined 1,579 18.21
diff 1.78*** diff -2.12*** diff -3.31***

145
TABLE 4.4 - The Effect of Innovation on the Relation between IO and SOX
This table presents the results of random-effect Tobit panel regressions. It shows the effect of SOX on the relation between innovation and institutional investment. I separate institutional investors according to type and style and examine this relation for each of them. In columns 2 and 3 I examine the active and passive institutional investors, respectively. In columns 4 and 5, I examine the dedicated and non-dedicated institutional investors, respectively. RD is the R&D expenditure divided by the book value of assets. IO is the level of total institutional investment in S&P 1500 firms between 1998 and 2009. ACTIVEIO and PASSIVEIO are active and passive IO levels, respectively. Active institutional investors are investment companies, independent investment advisors and public pension funds. Passive institutional investors are banks, insurance companies and others. DED is the level of dedicated institutional investment in the S&P 1500 firms between 1998 and 2009. NONDED is the level of transient and quasi-indexer institutional investment level in the related firms in my sample period. Dedicated investors are undiversified investors and do not trade much. Non-dedicated investors are transient and quasi-indexer institutional investors. Transient investors are diversified investors and trade often. Quasi-indexers are diversified investors and do not trade much (Aghion et al., 2009). SOX is a dummy variable taking the value one after the year 2002 and zero otherwise. The operator * indicates an interaction term, so A*B for example is the result of multiplying A by B. Thus, SOX*IO is an interaction term obtained by multiplying IO by SOX, etc. SALE is defined as the gross sales (the amount of actual billings to customers for regular sales completed during the period) reduced by cash discounts, trade discounts, and returned sales and allowances for credit given to customers, for each operating segment. M2B is the market-to-book ratio which is equal to the year-end market value of the assets divided by the year-end book value of assets. LEV is leverage, defined as the ratio of total debt to total assets. ROA is return on assets, which is the ratio of operating income before depreciation to the book value of total assets. INVOP is investment opportunities, defined as capital expenditure divided by sales. DER is the debt-to-equity ratio, defined as the ratio of the book value of total assets minus the book value of common equity to the market value of common equity. DIVER is the entropy measure of diversification.
)/1ln( jj PPsureEntropyMea ∑= where jP is defined as the share of sales in segment j and
)/1ln( jP is the weight of each segment j (the logarithm of the inverse of its sales). SPREAD
is the ratio of the ask price minus the bid price to the midpoint. All the variables, except DIVERS and IO, are winsorised at 1% (two tails). Year dummies (Year FE) and industry dummies (Industry FE) are included in the regressions. The numbers in brackets are p-values. ***, **, and * denote significance at the 1%, 5% and 10% levels, respectively. N is the number of observations.

146
RD
SOX*IO 0.007**
[0.031]
IO -0.027***
[0.000]
SOX*ACTIVEIO 0.009**
[0.038]
ACTIVEIO -0.028***
[0.000]
SOX*PASSIVEIO 0.028***
[0.001]
PASSIVEIO -0.044***
[0.000]
SOX*DED 0.019*
[0.086]
DED -0.032***
[0.000]
SOX* NONDED 0.007*
[0.054]
NONDED -0.025***
[0.000]
SOX -0.012*** -0.007*** -0.016*** -0.012*** -0.013***
[0.000] [0.003] [0.000] [0.000] [0.000]
SALE 0.0002** 0.0002*** 0.0002** 0.0002** 0.0002**
[0.050] [0.007] [0.046] [0.014] [0.044]
M2B 0.003*** 0.003*** 0.003*** 0.003*** 0.003***
[0.000] [0.000] [0.000] [0.000] [0.000]
LEV -0.030*** -0.029*** -0.030*** -0.030*** -0.030***
[0.000] [0.000] [0.000] [0.000] [0.000]
ROA -0.113*** -0.113*** -0.116*** -0.119*** -0.113***
[0.000] [0.000] [0.000] [0.000] [0.000]
INVOP -0.006 -0.003 -0.006 -0.005 -0.006
[0.324] [0.565] [0.260] [0.346] [0.314]
DER -0.000*** -0.000** -0.000** -0.000** -0.000**
[0.009] [0.032] [0.037] [0.048] [0.013]
DIVERS -0.002 -0.001 -0.001 -0.002 -0.002
[0.542] [0.658] [0.569] [0.481] [0.506]
SPREAD 0.408*** 0.479*** 0.487*** 0.543*** 0.425***
[0.000] [0.000] [0.000] [0.000] [0.000]
Constant -0.023*** -0.031*** -0.029*** -0.036*** -0.024***
[0.002] [0.000] [0.000] [0.000] [0.001]

147
Year FE Yes Yes Yes Yes Yes
Industry FE Yes Yes Yes Yes Yes
N 16,797 16,797 16,797 16,797 16,797
Chi2 3,155 3,085 3,075 3,082 3,245
p-value 0 0 0 0 0

148
TABLE 4.5 - The Effect of Increased Liquidity
This table shows the results of a Tobit cross-sectional regression and an OLS regression, in the first and second columns, respectively. It presents the effect of liquidity on the relation between IO and RD. RDmean is the mean value of R&D expenditure divided by the book value of assets. HIGHLIQ is a dummy variable equal to one if the delta spread is lower than the population median; otherwise it is set to zero. Delta spread is the difference in the mean values of the post-SOX and pre-SOX spread. I use the mean values of all of the control variables to create a cross-sectional data set. IOmean is the mean value of the level of total institutional investment in S&P 1500 firms between 1998 and 2009. The operator * indicates an interaction term, so A*B for example is the result of multiplying A by B. Thus, HIGHLIQ*IOmean is an interaction term obtained by multiplying IOmean by HIGHLIQ, etc. DEDmean is the mean value of the level of dedicated institutional investment in the S&P 1500 firms between 1998 and 2009. NONDEDmean is the mean value of the level of transient and quasi-indexer institutional investment in the related firms during my sample period. Dedicated investors are undiversified investors and do not trade much. Non-dedicated investors are transient and quasi-indexer institutional investors. Transient investors are diversified investors and trade often. Quasi-indexers are diversified investors and do not trade much (Aghion et al., 2009). CDF is the value of the cumulative distribution function of the delta spread. SALEmean is defined as the mean value of the gross sales (the amount of actual billings to customers for regular sales completed during the period) reduced by cash discounts, trade discounts, and returned sales and allowances for credit given to customers, for each operating segment. M2Bmean is the mean value of the market-to-book ratio which is equal to the year-end market value of the assets divided by the year-end book value of assets. LEVmean is the mean value of leverage, defined as the ratio of total debt to total assets. ROAmean is mean value of return on assets which is the ratio of operating income before depreciation to the book value of total assets. INVOPmean is the mean value of investment opportunities, defined as capital expenditure divided by sales. DERmean is mean value of the debt-to-equity ratio, defined as the ratio of the book value of total assets minus the book value of common equity to the market value of common equity. DIVERmean is the mean value of
the entropy measure of diversification. )/1ln( jj PPsureEntropyMea ∑= where jP is
defined as the share of sales in segment j and )/1ln( jP is the weight of segment j (the
logarithm of the inverse of its sales). SPREADmean is the mean value of the ratio of ask price minus bid price to midpoint. All the variables, except DIVERS and IO, are winsorised at 1% (two tails). Industry dummies (Industry FE) are included in the regressions. The numbers in brackets are p-values. ***, **, and * denote significance at the 1%, 5% and 10% levels, respectively. N is the number of observations.

149
RDmean HIGHLIQ*IOmean -0.012
[0.529]
HIGHLIQ*DEDmean -0.018
[0.797]
HIGHLIQ*NONDEDmean -0.009
[0.666]
CDF*IOmean -0.032
[0.264]
CDF*DEDmean -0.11
[0.393]
CDF*NONDEDmean -0.024
[0.421]
HIGHLIQ -0.005 -0.012*** -0.007
[0.734] [0.004] [0.595]
CDF -0.005 -0.024*** -0.012
[0.814] [0.001] [0.554]
IOmean 0.019 0.024
[0.225] [0.193]
DEDmean 0.027 0.06
[0.533] [0.361]
NONDEDmean 0.011 0.019
[0.514] [0.332]
SALEmean 0.0002 0.0002 0.0003 0.0002 0.0002 0.0002
[0.103] [0.158] [0.130] [0.138] [0.198] [0.156]
M2Bmean 0.027*** 0.027*** 0.027*** 0.027*** 0.027*** 0.027***
[0.000] [0.000] [0.000] [0.000] [0.000] [0.000]
LEVmean -0.035*** -0.025** -0.025** -0.023** -0.024** -0.023**
[0.001] [0.017] [0.020] [0.030] [0.026] [0.030]
ROAmean -0.318*** -0.308*** -0.310*** -0.301*** -0.299*** -0.301***
[0.000] [0.000] [0.000] [0.000] [0.000] [0.000]
INVOPmean -0.059** -0.057** -0.056** -0.059** -0.059** -0.060**
[0.036] [0.041] [0.044] [0.035] [0.035] [0.034]
DERmean -0.001 -0.002** -0.002** -0.002** -0.002** -0.002**
[0.169] [0.022] [0.020] [0.015] [0.018] [0.015]
DIVERmean 0.024*** 0.029*** 0.030*** 0.030*** 0.029*** 0.030***
[0.007] [0.001] [0.001] [0.000] [0.001] [0.001]
SPREADmean -0.136 -0.353 -0.182 0.088 -0.228 0.002
[0.839] [0.531] [0.785] [0.895] [0.682] [0.998]
Constant -0.037** -0.051*** -0.057*** -0.061*** -0.045*** -0.056***
[0.018] [0.000] [0.000] [0.000] [0.000] [0.001]
Industry FE Yes Yes Yes Yes Yes Yes
N 1,533 1,533 1,533 1,533 1,533 1,533
Chi2 1,487 1,458 1,458 1,468 1,467 1,468
p-value 0 0 0 0 0 0

150
Table 4.6 - Multivariate Difference-in-Differences Results
This table presents a DD regression on the effect of SOX on the relation between IO and RD. The first column shows the random-effect Tobit regression results, and the second shows the OLS regression results. SOX is a dummy variable, taking the value one after the year 2002 and zero otherwise. ACCE equals one if a firm has a fiscal year-end market value of equity of more than $75 million and zero otherwise. IO is the level of total institutional investment in S&P 1500 firms between 1998 and 2009. SOX*ACCE*IO is an interaction term obtained by multiplying ACCE by IO by SOX. SALE is defined as the gross sales (the amount of actual billings to customers for regular sales completed during the period) reduced by cash discounts, trade discounts, and returned sales and allowances for credit given to customers, for each operating segment. M2B is the market-to-book ratio which is equal to the year-end market value of the assets divided by the year-end book value of assets. LEV is leverage, defined as the ratio of total debt to total assets. ROA is the return on assets, which is the ratio of operating income before depreciation to the book value of total assets. INVOP is investment opportunities, defined as capital expenditures divided by sales. DER is the debt-to-equity ratio, defined as the ratio of the book value of total assets minus the book value of common equity to the market value of common equity. DIVER is the entropy measure of
diversification. )/1ln( jj PPsureEntropyMea ∑= where jP is defined as the share of sales
in segment j and )/1ln( jP is the weight of segment j (the logarithm of the inverse of its
sales). SPREAD is the ratio of ask price minus bid price to midpoint. All the variables, except DIVERS and IO, are winsorised at 1% (two tails). Year dummies (Year FE) and industry dummies (Industry FE) are included in the regressions. The numbers in brackets are p-values. ***, **, and * denote significance at the 1%, 5% and 10% levels, respectively. N is the number of observations.
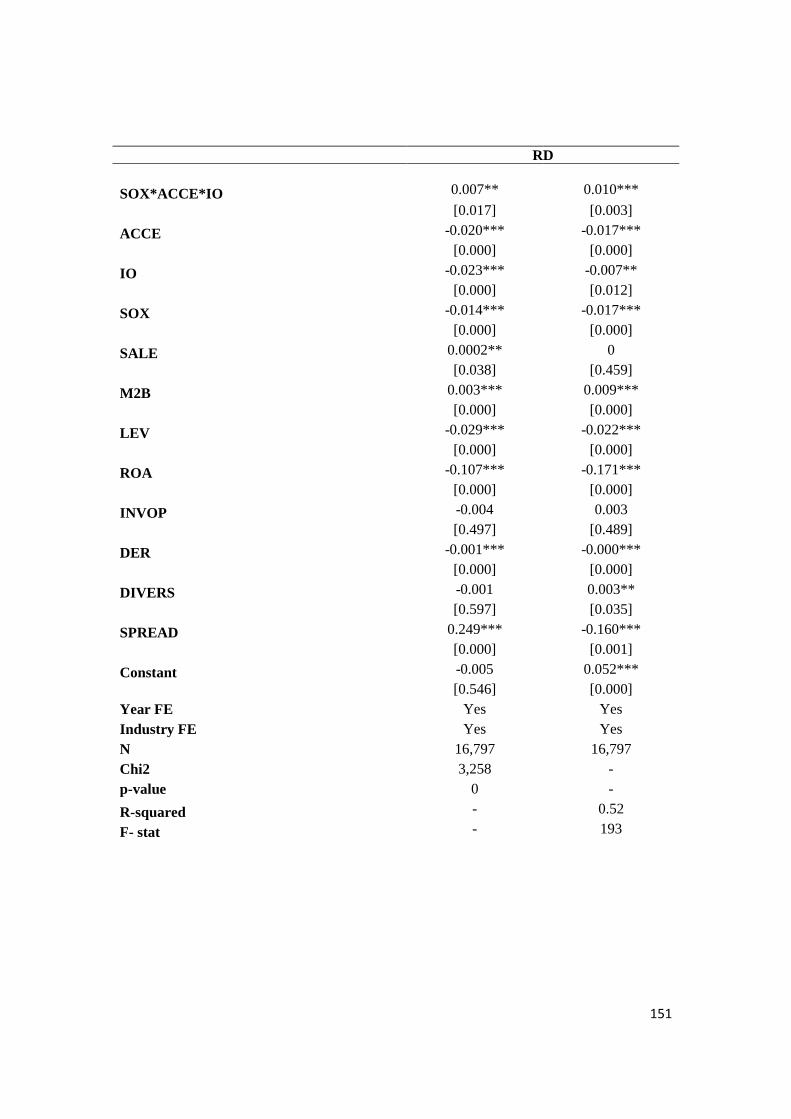
151
RD SOX*ACCE*IO 0.007** 0.010***
[0.017] [0.003]
ACCE -0.020*** -0.017***
[0.000] [0.000]
IO -0.023*** -0.007**
[0.000] [0.012]
SOX -0.014*** -0.017***
[0.000] [0.000]
SALE 0.0002** 0
[0.038] [0.459]
M2B 0.003*** 0.009***
[0.000] [0.000]
LEV -0.029*** -0.022***
[0.000] [0.000]
ROA -0.107*** -0.171***
[0.000] [0.000]
INVOP -0.004 0.003
[0.497] [0.489]
DER -0.001*** -0.000***
[0.000] [0.000]
DIVERS -0.001 0.003**
[0.597] [0.035]
SPREAD 0.249*** -0.160***
[0.000] [0.001]
Constant -0.005 0.052***
[0.546] [0.000] Year FE Yes Yes Industry FE Yes Yes N 16,797 16,797 Chi2 3,258 - p-value 0 -
R-squared - 0.52
F- stat - 193

152
CHAPTER 5: CONCLUSION
I summarise my main findings in this chapter. The main results I find in this thesis are
as follows: First, home country governance quality is an important determinant of
foreign institutional investment in the US. Second, the enactment of Sarbanes-Oxley
Act (SOX) has affected the level of foreign institutional investment in US firms. It has
also resulted in foreign institutional investors changing some of their investment
preferences. Finally, the relation between institutional ownership (IO) and innovation
changes post-SOX. I briefly summarise my main results and present some paths for
future research in section 1. I then review the limitations of the thesis in section 2.
5.1. Summary of Findings and Future Research
In chapter 2, my main contribution to the literature is to highlight the home country’s
governance quality as an investment determinant of foreign institutional investors. I
contribute to the literature by finding that both flight-to-quality and familiarity
arguments coexist in foreign institutional investors’ investment preferences. I
conclude that foreign institutional investors from countries with low governance
quality invest more in the US. This finding supports the flight-to-quality argument.
Because of the high information cost at home, these investors prefer to invest in a
more information-efficient country. Secondly, I find that foreign institutional
investors from countries whose governance quality is similar to that of the US, invest
more in the US market. However, investors from countries with governance quality
just below (above) the US, invest more (less) in US firms. Thus, in contrast to the

153
existing literature, I find that the familiarity and flight-to-quality arguments have
complementary effects on the investment preferences of institutional investors.
I also contribute to the literature by showing the effect of the home country’s
governance quality on the firm-level investment preferences of foreign institutional
investors. Foreign investors from countries with high governance quality (low
information asymmetry) invest more in US firms with high governance quality (low
information asymmetry). This finding supports the familiarity argument as well.
Given that I find higher foreign institutional investment in firms with high governance
quality, this thesis might provide useful insights for future research into the
importance of the level of investment protection in attracting foreign institutional
investment from countries with high governance quality. If foreign institutional
investors continue to apply familiarity preferences, it might be worth examining
further regulations that US firms might follow in order to improve their governance
quality and attract more foreign capital. Further, I examine whether a change in
governance quality due to a regulation (the enactment of SOX) in the US market
changes the preferences of foreign institutional investors. In addition to this, it might
be worth examining whether a change in the governance quality in the foreigner’s
own country would affect this relation.
In the third chapter, I differentiate my study from the existing SOX literature by
identifying a new SOX benefit to the US economy―an increase in foreign
institutional investment. The implementation of SOX has forced US firms to increase
their disclosure levels. I conclude that this improvement in the US information
environment affects the foreign institutional investment level.

154
I also find that foreign institutional investors have changed their investment
preferences. Although institutional investors have typically invested in prudent stocks,
following prudent man rules, they have shifted their preferences towards less prudent
stocks, post-SOX. I find that foreigners continue to invest in prudent stocks but they
have also started to invest in smaller firms, firms with lower dividend yields and firms
with higher leverage. I also find that passive foreign institutional investors make up a
greater proportion of the foreign investment than active foreign institutional investors.
Passive institutional investors benefit more from the reduced value of private
information than active institutional investors, and I find a more pronounced passive
institutional investment in my results. I also find that passive investors invest more in
firms with a high level of private information than active investors, post-SOX.
Future research could examine whether high levels of foreign investment affect the
performance of US firms. This could help determine whether the foreign institutional
investors are more effective in monitoring and influencing the management’s
decisions, post-SOX. Further, since active investment is associated with greater firm
performance (Ferraira and Matos, 2008), it would be worth investigating whether
these investors still affect firm performance.65 The changes in the information
environment post-SOX might change the type of institutional investor that affects
firm performance.
In the fourth chapter, I investigate the impact of the enactment of SOX on the relation
between overall institutional ownership and firm innovation. Traditionally,
institutional investors avoid investing in highly innovative firms because these firms
have high levels of information asymmetry. However, I find that the enactment of
65 The fact that they have fewer business relations with firms leads to this predicted relation.

155
SOX has changed this relation. The US market has become more transparent, thus
information-efficient, post-SOX. As a result of the decreased information asymmetry,
highly innovative firms are attracting more institutional capital, post-SOX.
I also find that the positive relation between innovation and institutional investment is
mostly driven by passive institutional investors. Passive institutional investors benefit
from a reduction in information asymmetry more than active investors. Thus, I
conclude that the reduction in information asymmetry determines the positive relation
between institutional investment and innovation.
Although I suspect that an increase in market liquidity post-SOX could drive my
results, I do not find any evidence of this. Prior literature states that an increase in
liquidity strengthens the threat of exit from institutional investors (Jain et al., 2008).
Since institutional investors prefer to invest in highly innovative firms post-SOX, the
increased liquidity may make it easier for them to bargain with the management and
encourage higher innovation. However, I do not find any evidence of the effect of
liquidity in my results. In sum, I contribute to the literature by showing that an
improvement in market conditions due to a regulation can attract institutional
investors to highly innovative firms. Through increasing innovation expenditures, a
country can obtain or maintain a competitive advantage in a globalised world.
An investigation of the effect of institutional investors’ portfolio sizes on my results
could be considered in future work since the portfolio size of an investor can help us
to determine whether that investor is informed or not informed. Ni (2009) finds that
fund managers with larger portfolios are more informed.66 If this is true, I would
66 Ni (2009) measures the size of assets allocated to each fund manager, by the aggregated funds’ net asset value.

156
expect to see higher levels of institutional investment by investors with smaller
portfolios in highly innovative stocks, post-SOX. The investors with smaller
portfolios would have been less informed pre-SOX. However, the information
environment of the US market has now changed. More information is available in the
market now and the disadvantage for these investors in terms of information has
decreased. Future research could examine this relation between portfolio size and
innovation. Since foreign investors with large portfolios are more informed (Ni,
2009), it would also be worth examining this relation by separating overall investors
into foreign and domestic. By separating investors into foreign and domestic, future
research would also have the chance to separate investors according to their
information advantages. Since foreign investors should have more information post-
SOX, their disadvantage in terms of information cost should decrease.
5.2. Limitations
The most important limitation of this thesis is data availability. I originally used
Thomson One Banker (TOB) to collect my data because of the supposedly better level
of disclosure in that dataset. When I compared the values I got from TOB with those
from published papers, however, it was obvious that there was something wrong with
the data I was using. The descriptive results I produced not only did not match any of
the statistics reported in prior studies but also presented unrealistically high aggregate
holdings for institutional investors in the US. When I enquired with staff from TOB
about my concerns, they could not come up with convincing arguments about why
this was the case. I thus had to change all my datasets in the second year of my PhD

157
and collected data from the Thomson Reuters Ownership Database, i.e. 13F data in
WRDS (Wharton Research Data Services) instead.
Further, the availability of data for the classification of institutional investors was
limited. I used the Bushee classification for active vs. passive, and dedicated vs. non-
dedicated institutional investors. Another classification of the institutional investors
might be the sizes of assets allocated to each fund manager (Ni, 2009). This
classification is important in order to determine the value of private information for
different investor types. However, because of the limitation of data availability I did
not have a chance to classify institutional investors in that way. In addition, the
definition of institutional investors according to their turnover could have been useful
for my research. TOB has this type of classification, however, because of the issues I
had with the TOB data I could not use it.67
Further, the investigation of the foreign institutional investors’ home countries was
another restriction in this thesis. For the second and third chapters, I used foreign
institutional investment data and therefore needed to determine each investor’s
country of origin. I ended up with 18 countries in my dataset. I excluded (they were
reported in 13F but I dropped these observations) from my analyses ownership data
from the following countries: Brazil, the British Virgin Islands, the Channel Islands,
Hong Kong, Luxembourg, Sweden, and the US Virgin Islands. The number of firm-
67 TOB defines three different types of institutional investors according to their turnover: low, moderate and high. Low: Annual portfolio turnover rate is less than or equal to 50%; therefore, the average holding period exceeds 2 years and is indicative of a general preference for longer term investing. Moderate: Annual portfolio turnover rate is greater than 50% and less than or equal to 100%; therefore, the average holding period is between 1 year and 2 years and is indicative of a medium-term investment horizon. High: Annual portfolio turnover rate is greater than 100%; therefore, the average holding period is less than 1 year and is indicative of either a shorter term investment horizon or more frequent trading around a core position.

158
year observations recorded for these countries was extremely low. Other studies, such
as Forbes (2010), examine the investment preferences of investors originating from a
larger number of countries than I have done. Because I also use firm-level data in this
study, I was forced to use the 13F dataset though, which produced a sample of
investors originating from only 18 countries. The law requires all institutional
investors with $100 million or more in Assets under Management to file a 13F form
with the Securities and Exchange Commission (SEC). Therefore, if a country is not
represented in my sample, it will be because of one of the following scenarios: (a)
there is no institutional investment in S&P 1500 firms originating from this country;
(b) institutional investors originating from this country manage very small portfolios
(less than $100 million) so they do not have to comply with 13F rules (in that case
their holdings are expected to be minimal and would concern only a very small
number of firms); (c) this country invests in US equities through special investment
vehicles and not through institutional investors.
The limited sample period is also a limitation of this thesis. I had to start my analysis
from the year 1999 in the second and third chapters because the 13F database does not
give country information on investors before then. Further, in chapter 2 I use the
KKM (Kaufmann et al., 2008) variables as a measure of the governance quality in a
country. It would be interesting to use the governance quality measures of La Porta et
al. (2006), such as disclosure requirements. However, La Porta et al. (2006) do not
provide the related governance data for my sample period. Another data limitation of
chapter 2 is the macroeconomic factors I use in the robustness section. I control for
the macroeconomic factors that might change over time in my analysis. However, I
am not able to add the variables LANGUAGE and CAPITAL CONTROL because

159
they are highly correlated with other macroeconomic factors I use: GDPPC and
DISTANCE.68
In the third and fourth chapters, I use Differences in Differences (DD) estimation in
order to test whether I am simply reporting a time trend for the foreign institutional
investment level in US firms post-SOX. In order to use this estimation, I define a
group of firms that are not exposed to SOX as the control group and another group of
firms that are exposed to SOX as the treatment group. Specifically, I put non-
accelerated filers into the control group and all other firms into the treatment group.
Non-accelerated filers have a market value of equity lower than $75 million and were
exempt from complying with SOX during the course of my time series. It was not
possible to define another control group in my dataset because most firms listed in the
US had to apply the SOX requirements.
For the fourth chapter, patents and citations data might have been used in order to
give a more precise measure of innovation. R&D values might reflect other firm-
related characteristics, such as growth opportunities, rather than innovation. However,
the database that provides patents and citation data (NBER) only covers the period
from 1976 to 2006 and I needed data between 2006 and 2009 as well, so I did not use
patents and citations data in my analysis. Another limitation of the fourth chapter is
the endogeneity issue. My argument in this chapter is that due to a possible reduction
in information asymmetry level post-SOX, institutional investors invest more in
highly innovative firms. The reverse causality argument should state that post-SOX an
increase in RD should result in higher level of institutional investment. This relation is
68
LANGUAGE is a dummy variable taking the value of 1 for English-speaking countries, and 0 otherwise. CAPITAL CONTROL is a measure of the “freedom” investors enjoy in a capital market. GDPPC is the gross domestic product per capita. DISTANCE is a measure of geographical distance, which captures the bilateral distance between the capital cities of two countries (Frankel et al., 1995).

160
not supported by theoretical arguments presented in the chapter. , I tried but failed to
find a valid instrument to test for reverse causality.

161
REFERENCES
Abdioglu, N., Khurshed, A., Stathopoulos, K., 2011. Foreign Institutional Investment: Is Governance Quality at Home Important? Working Paper. The University of Manchester.
Abdioglu, N., Khurshed, A., Stathopoulos, K., 2011. The Sarbanes-Oxley Act and Foreign Institutional Investment in the US. Working Paper. The University of Manchester.
Aboody, D., Lev, B., 2000. Information Asymmetry, R&D and Insider Gains. The Journal of Finance. 55 (6), 2747-2766.
Admati, A. R., Pfleiderer, P., 2009. The “Wall Street Walk” and Shareholder Activism: Exit as a Form of Voice. Review of Financial Studies. 22 (7), 2645-2685.
Aggarwal, R., Klapper, L., Wysocki, P. D., 2005. Portfolio Preferences of Foreign Institutional Investors. Journal of Banking and Finance. 29, 2919–2946.
Aggarwal, R., Klapper, L., Erel, I., Ferreira, M., Matos, P., 2011. Does Governance Travel around the World? Evidence from Institutional Investors. Journal of Financial Economics. 100 (1), 154-181.
Aghion, P., Reenen, J. V., Zingales, L., 2009. Innovation and Institutional Ownership. NBER Working Paper. No 14769.
Ahearne, A.G., Griever, W.L., Warnock, F.E., 2004. Information Costs and Home Bias: An Analysis of US Holdings of Foreign Equities. Journal of International Economics. 62 (2), 313- 336.
Ahmed, A. S., McAnally, M. L., Rasmussen, S., Weaver, C. D., 2010. How Costly is the Sarbanes Oxley Act? Evidence on the Effects of the Act on Corporate Profitability. Journal of Corporate Finance. 16, 352-369.
Allen, F., 1993. Strategic Management and Financial Markets. Strategic Management Journal. 14 (Summer Special Issue), 11-22.
Almazan, A., Hartzell, J. C., Starks, L. T., 2005. Active Institutional Shareholders and Costs of Monitoring: Evidence from Executive Compensation. Financial Management. 34 (4), 5-34.
Badrinath, S. G., Gay, C., Kale, J. R., 1989. Patterns of Institutional Investment, Prudence and the Managerial Safety Net Hypothesis. Journal of Risk and Insurance. 56 (4), 605-629.

162
Barth, M. E., Kasznik, R., 1999. Share Repurchases and Intangible Assets. Journal of Accounting and Economics. 28 (2), 211-241.
Barth, M., McNichols, M., 2001. Analyst Coverage and Intangible Assets. Journal of Accounting Research. 39, 1-34.
Bathala, C.T., Moon, K.P, Rao, R.P., 1994. Managerial Ownership, Debt Policy, and the Impact of Institutional Holdings: An Agency Perspective. Financial Management. 23 (3), 38-50.
Baysinger, B., Hoskisson, R. E., 1989. Diversification Strategy and R&D Intensity in Multiproduct Firms. Academy of Management Journal. 32, 310-332.
Bekaert, G., Harvey, C. R., Lumsdaine, R. L., 2002. Dating the Integration of World Capital Markets. Journal of Financial Economics. 65 (2), 203–247.
Belsley, D.A., Kuh, E., Welsch, R.E, 1980. Regression Diagnostics: Identifying Influential Data and Sources of Collinearity. John Wiley & Sons: New York.
Beltratti, A., Stulz, R.M., 2009. Why Did Some Banks Perform Better During the Credit Crisis? A Cross-Country Study of the Impact of Governance and Regulation. NBER Working Paper. No 15180.
Bennett, J. A., Sias, R.W., Starks, L.T., 2003. Greener Pastures and the Impact of Dynamic Institutional Preferences. The Review of Financial Studies. 16 (4), 1203-1238
Berle, A., Means, G., 1932. Blockholdings in Europe: An International Comparison. European Economic Review. 43, 1049-1056.
Bhandari, L.C., 1988. Debt/Equity Ratio and Expected Common Stock Returns: Empirical Evidence. The Journal of Finance. 43 (2), 507-528.
Bhide, A., 1993. The Hidden Costs of Stock Market Liquidity. Journal of Financial Economics. 34 (1), 31-51.
Boone, J., Raman, K. K., 2001. Off-Balance Sheet R&D Assets and Market Liquidity. Journal of Accounting and Public Policy. 20 (2), 97-128.
Brennan, M.J., Cao, H.H., 1997. International Portfolio Investment Flows. Journal of Finance. 52 (5), 1851-1880.
Breusch, T., Pagan, A., 1980. The Lagrange Multiplier Test and Its Applications to Model Specification in Econometrics. Review of Economic Studies 47, 239–253.
Brickley, J. A., Lease, R. C., Smith Jr., C. W., 1988. Ownership Structure and Voting on Antitakeover Amendments. Journal of Financial Economics. 20, 267–291.

163
Brown, K., Brooke. B., 1993. Institutional Demand and Security Price Pressure: The Case of Corporate Spin-Offs. Financial Analysts Journal. 49 (September/October), 53-62.
Bushee, B. J., 1998. The Influence of Institutional Investors on Myopic R&D Investment Behaviour. The Accounting Review. 73 (3), 305-333.
Bushee, B. J., Noe, C. F., 2000. Corporate Disclosure Practices, Institutional Investors, and Stock Return Volatility. Journal of Accounting Research. 38, 171–202.
Bushee, B.J., Carter, M.E., Gerakos, J., 2010. Institutional Investor Preferences for Corporate Governance Mechanisms. Working Paper. The Wharton School of the University of Pennsylvania.
Cai, F., Warnock, F.E., 2006. International Diversification at Home and Abroad. NBER working paper. No 12220.
Caprio, L., Faccio, M., McConnell, J.J., 2011. Sheltering Corporate Assets from Political Extraction. The Journal of Law, Economics and Organization. Forthcoming.
Chan, K., Covrig, V., Ng, L., 2005. What Determines the Domestic Bias and Foreign Bias? Evidence from Mutual Fund Equity Allocations Worldwide. Journal of Finance. 60 (3), 1495-1534.
Chen, W. R., Miller, K. D., 2007. Situational and Institutional Determinants of Firms’ R&D Search Intensity. Strategic Management Journal. 28, 369-381.
Chen, X., Harford, J., Li, K., 2007. Monitoring: Which Institutions Matter? Journal of Financial Economics. 86, 279–305.
Chhaochharia, V., Grinstein, Y., 2007. Corporate Governance and Firm Value: The Impact of the 2002 Governance Rules. The Journal of Finance. 62 (4), 1789-1825.
Chung, K. H., Elder, J., Kim, J.-C., 2010. Corporate Governance and Liquidity. Journal of Financial and Quantitative Analysis. 45, 265–291.
Coates, J. C., 2007. The Goals and Promise of the Sarbanes Oxley Act. Journal of Economic Perspectives. 21 (1), 91-116.
Coffee, J. C., 1991. Liquidity versus Control: The Institutional Investor as Corporate Monitor. Columbia Law Review. 91, 1277–368.
Cohen, D., Dey, A., Lys, T., 2009. The Sarbanes Oxley Act of 2002: Implications for Compensation Contracts and Managerial Risk-Taking. Working Paper. Stern Business School.
164
Coval, J. D., Moskowitz, T. J., 1999. Home Bias at Home: Local Equity Preference in Domestic Portfolios. Journal of Finance. 54 (6), 2045-2073.
Cready, W., 1994. Determinants of Relative Investor Demand for Common Stocks. Journal of Accounting, Auditing, & Finance. 9 (3), 487-509.
Cunningham, L. A., 2003. The Sarbanes-Oxley Yawn: Heavy Rhetoric, Light Reform (and It Just Might Work). Connecticut Law Review. 35 (Spring), 915–988.
Dahlquist, M., Robertsson, G., 2001. Direct Foreign Ownership, Institutional Investors and Firm Characteristics. Journal of Financial Economics. 59, 413–440.
Defond, M. L., Hung, M., 2004. Investor Protection and Corporate Governance: Evidence from Worldwide CEO Turnover. Journal of Accounting Research. 42 (2), 269-312.
Del Guercio, D., 1996. The Distorting Effect of the Prudent Man Laws on Institutional Equity Investments. Journal of Financial Economics. 40 (1), 31-62.
Demiralp, I., D'Mello, R., Schlingemann, F. P., Subramaniam, V., 2011. Are there Monitoring Benefits to Institutional Ownership? Evidence from Seasoned Equity Offerings. Journal of Corporate Finance. 17, 1340–1359.
Doidge, C., Karolyi, G. A., Stulz, R. M., 2007. Why do Countries Matter so much for Corporate Governance? Journal of Financial Economics. 86, 1–39.
Donaldson, W.H., 2005. Speech by SEC Chairman: Remarks before the Financial Services Roundtable. U.S. Securities and Exchange Commission (April 1), http://www.sec.gov/news/speech/spch040105whd.htm.
Drucker, P. F., 1986. To End the Raiding Roulette Game. Across the Board. 23 (4), 30-39.
Dvorak, T., 2003. Gross Capital Flows and Asymmetric Information. Journal of International Money and Finance. 22, 835-864.
Engel, E., Hayes, R. M., Wang, X., 2007. The Sarbanes-Oxley Act and Firms' Going-Private Decisions. Journal of Accounting and Economics. 44, 116–145.
Faccio, M., Marchica, M. T., Mura, R., 2011. Large Shareholder Diversification and Corporate Risk-Taking. Review of Financial Studies. 24 (11), 3601-3641. Faleye, O., Hoitash, R., Hoitash, U., 2011. The Costs of Intense Board Monitoring.
Journal of Financial Economics. 101 (1), 160-181.
Falkenstein, E. G., 1996. Preferences for Stock Characteristics as Revealed by Mutual Fund Portfolio Holdings. Journal of Finance. 51 (1), 111-135.

165
Fama, E. F., French, K. R., 1997. Industry Cost of Equity. Journal of Financial Economics. 43, 153-193.
Fang, V. W., Tian, X., Tice, S., 2011. Does Stock Liquidity Enhance or Impede Firm Innovation? SSRN Working Paper.
Ferreira, M. A., Matos, P., 2008. The Colors of Investors’ Money: The Role of Institutional Investors Around the World. Journal of Financial Economics. 88 (3), 499–533.
Forbes, K. J., 2010. Why do Foreigners Invest in the United States? Journal of International Economics. 80 (1), 3-21.
Frankel, J., Stein, E., Wei, S., 1995. Trading Blocs and the Americas: The Natural, the Unnatural, and the Super-Natural? Journal of Development Economics. 47, 61-95.
Froot, K., Perold, A., Stein, J., 1992. Shareholder Trading Practices and Corporate Investment Horizons. Journal of Applied Corporate Finance. 5(2), 42-58.
Gao, F., Wu, J.S., Zimmerman, J., 2009. Unintended Consequences of Granting Small Firms Exemptions from Securities Regulation: Evidence from the Sarbanes-Oxley Act. Journal of Accounting Research. 47 (2), 459-506.
Gelos, R.G., Wei, S.-J., 2005. Transparency and International Portfolio Holdings. The Journal of Finance. 60 (6), 2987-3020.
Giannetti, M., Simonov, A., 2006. Which Investors Fear Expropriation? Evidence from Investors’ Portfolio Choices. Journal of Finance. 61 (3), 1507-1547.
Giannetti , M., Koskinen , Y., 2010. Investor Protection, Equity Returns and Financial Globalization. Journal of Financial and Quantitative Analysis. 45 (1), 135-168.
Gillan, S. T., Starks, L. T., 2000. Corporate Governance Proposals and Shareholder Activism: The Role of Institutional Investors. Journal of Financial Economics. 57, 275- 305.
Gillan, S. T., Starks, L. T., 2003. Corporate Governance, Corporate Ownership and the Role of Institutional Investors: A Global Perspective. Journal of Applied Finance. 13 (2), 4-22.
Gompers, P. A., Metrick, A., 2001. Institutional Investors and Equity Prices. Quarterly Journal of Economics. 116 (1), 229-259.
Graves, S. B., Waddock, S. A., 1990. Institutional Ownership and Control: Implications for Long-Term Corporate Strategy. Academy of Management Executive. 4 (1), 75-83.
166
Grinblatt, M., Keloharju, M., 2000. The Investment Behavior and Performance of Various Investor Types: A Study of Finland's Unique Data Set. Journal of Financial Economics. 55, 43-67.
Gujarati, D.N., 2004. Basic Econometrics. The McGraw−Hill Companies.
Hamilton, J., Trautmann, T., 2002. Sarbanes-Oxley Act of 2002: Law and Explanation. Chicago: CCH Incorporated.
Hausman, J.A., 1978. Specification Tests in Econometrics. Econometrica. 46, 1251–1271.
Healy, P.M, Hutton, A.P., Palepu, K.G., 1999. Stock Performance and Intermediation Changes Surrounding Sustained Increases in Disclosure. Contemporary Accounting Research. 16 (3), 485-520.
Healy, P., Palepu, K., 2001. Information Asymmetry, Corporate Disclosure, and the Capital Markets: A Review of the Empirical Disclosure Literature. Journal of Accounting and Economics. 31 (1-3), 405-440.
Hitt, M. A., Hoskisson, R. E., Ireland, R. D., Harrison, J. S., 1991. Effects of Acquisitions on R&D Inputs and Outputs. Academy of Management Journal. 34 (3), 693-706.
Huberman, G., 2001. Familiarity Breeds Investment. The Review of Financial Studies. 14 (3), 659-680.
Hussain, S., 2000. Simultaneous Determination of UK Analyst Following and Institutional Ownership. Accounting and Business Research. 30 (2), 111-124.
Jackson, J., 2010. Foreign Investment in U.S. Securities. Congressional Research Service (CRS) Report for the U.S. Congress. www.crs.gov.
Jacobs, M., 1991. Short-Term America: The Causes and Cures of Our Business Myopia. Harvard Business School Press.
Jacquemin, A. P., Berry, C. H., 1979. Entropy Measure of Diversification and Corporate Growth. Journal of Industrial Economics. 27, 359-369.
Jain, P. K., Rezaee, Z., 2006. The Sarbanes-Oxley Act of 2002 and Capital-Market Behavior: Early Evidence. Contemporary Accounting Research 23 (3), 629–654.
Jain, P. K., Kim, J. C., Rezaee, Z., 2008. The Sarbanes-Oxley Act of 2002 and Market Liquidity. The Financial Review. 43, 361-382.
Jarrell, G. A., Lehn, K., Marr, W., 1985. Institutional Ownership, Tender Offers and Long-Term Investment. Office of The Chief Economist, Securities and Exchange Commission, Washington, DC.

167
Jensen, M. C., 1988. The Takeover Controversy: Analysis and Evidence. In Coffee, J. C., Lowenstein, L. and Rose-Ackerman, S. (eds.), Knights, Raiders, and Targets: The Impact of Hostile Takeovers. Oxford University Press, Oxford, 314-354.
Jensen, M. C., Meckling, W. H., 1976. Theory of the Firm: Managerial Behavior, Agency Costs, and Ownership Structure. Journal of Financial Economics. 3 (4), 305-360.
Jiao, Y., Liu, M. H., 2009. Independent Institutional Investors and Equity Returns. SSRN Working Paper.
Johnston, J., Madura, J., 2009. The Pricing of IPOs Post-Sarbanes-Oxley. The Financial Review. 44, 291-310.
Kang, J. K., Stulz, R. M., 1997. Why Is There A Home Bias? An Analysis of Foreign Portfolio Equity Ownership in Japan. Journal of Financial Economics. 46 (1), 3–28.
Karmin, C., Lucchetti, A., 2006. New York Loses Edge in Snagging Foreign Listings. Wall Street Journal (26 January): C1.
Kaufmann, D., Kraay, A., Mastruzzi, M., 2008. Governance Matters VI: Aggregate and Individual Governance Indicators 1996-2006. The World Bank Research Observer. 23 (1), 1-30
Khurshed, A., Lin, S., Wang M, 2011. Institutional Block-Holdings in UK firms: Do Corporate Control Mechanisms Matter? European Journal of Finance. 17 (2), 133-152
Kim, J.-B., Krinsky, I., Lee. J., 1997. Institutional Holdings and Trading Volume Reactions to Quarterly Earnings Announcements. Journal of Accounting, Auditing, and Finance. 12 (1), 1-14.
Kim, W., Sung, T., Wei, S.J., 2011. How Does Corporate Governance Risk at Home Affect Investment Choices Abroad? Journal of International Economics, 85 (1), 25-41.
Klapper, L. F., Love, I., 2004. Corporate Governance, Investor Protection, and Performance in Emerging Markets. Journal of Corporate Finance. 10 (5), 703–728.
Knott, A. M., Posen, H. E., 2009. Firm R&D Behavior and Evolving Technology in Established Industries. 20 (2), 352-367.
Kochhar, R., David, P., 1996. Institutional Investors and Firm Innovation: A Test of Competing Hypotheses. Strategic Management Journal. 17 (1), 73-84.
La Porta, R., Lopez-de-Silanes, F., Shleifer, A., Vishny, R.W.,1997. Legal Determinants of External Finance. Journal of Finance. 52 (3), 1131–1150.
168
La Porta, R., Lopez-de-Silanes, F., Shleifer, A., Vishny, R.W., 1998. Law and Finance. Journal of Political Economy. 106 (6), 1113–1155.
La Porta, R., Lopez-de-Silanes, F., Shleifer, A., Vishny, R.W.,2000. Agency Problems and Dividend Policies Around the World. Journal of Finance. 55 (1), 1–33.
La Porta, R., Lopez-de-Silanes, F., Shleifer, A., 2006. What Works in Securities Laws? Journal of Finance. 61 (1), 1-32.
Lakonishok, J., Shleifer, A., Vishny, R.W., 1994. Contrarian Investment, Extrapolation and Risk. Journal of Finance. 49 (5), 1541-1578.
Lang, M., McNichols, M., 1997. Institutional Trading and Corporate Performance. Stanford University Working Paper.
Leuz, C., Verrecchia, R. E., 2000. The Economic Consequences of Increased Disclosure. Journal of Accounting Research. 38, 91-124.
Leuz, C., Triantis, A., Wang, T.Y., 2008. Why Do Firms Go Dark? Causes and Consequences of Voluntary SEC Deregistrations. Journal of Accounting and Economics. 45, 181-208.
Leuz, C., Lins, K. V. and Warnock, F. E., 2009. Do Foreigners Invest Less in Poorly Governed Firms? Review of Financial Studies. 22 (8), 3245-3285.
Lev, B., 1988. Toward a Theory of Equitable and Efficient Accounting Policy. The Accounting Review. 63 (1), 1-22.
Lewis, K.K., 1999. Trying to Explain Home Bias in Equities and Consumption. Journal of Economic Literature. 37 (2), 571-608
Li, D., Moshirian, F., Pham, P. K. , Zein, J., 2006. When Financial Institutions are Large Shareholders: The Role of Macro Corporate Governance Environments. Journal of Finance 61 (6), 2975-3007.
Li, H., Pincus, M., Rego, S.O., 2008. Market Reaction to Events Surrounding the Sarbanes-Oxley Act of 2002 and Earnings Management. Journal of Law and Economics. 51, 111-134.
Linck, J. S., Netter, J. M., Yang, T., 2009. The Effects and Unintended Consequences of the Sarbanes-Oxley Act on the Supply and Demand for Directors. The Review of Financial Studies. 22 (8), 3287-3328.
Litvak, K., 2007. The Effect of the Sarbanes-Oxley Act on non-US Companies Cross Listed in the US. Journal of Corporate Finance. 13, 195–228.

169
Loescher, S. M., 1984. Bureaucratic Measurement, Shuttling Stock Shares and Shortened Time Horizons: Implications for Economic Growth. Quarterly Review of Economics and Business. 24, 1-24.
Maug, E., 1998. Large Shareholders as Monitors: Is there a Trade-off between Liquidity and Control. Journal of Finance. 53 (1), 65-98.
McKinsey&Company, 2002. Global Investor Opinion Survey: Key Findings.
Merton, R. C., 1987. A Simple Model of Capital Market Equilibrium with Incomplete Information. Journal of Finance. 42 (3), 483-510.
Mitroff, I. I., 1987. Rethinking Our Individual, Corporate, and Industrial Strategies for Global Competition. Jossey Bass Business and Management Series, San Francisco, CA.
Mohd, E., 2005. Accounting for Software Development Costs and Information Asymmetry. The Accounting Review. 80 (4), 1211-1231.
Ni, J, 2009. The Effects of Portfolio Size on International Equity Home Bias Puzzle. International Review of Economics and Finance. 18, 469–478.
Noe, T., 2002. Institutional Activism and Financial Market Structure. Review of Financial Studies. 15, 289-319.
O'Brien, P. C., Bhushan. R., 1990. Analyst Following and Institutional Ownership. Journal of Accounting Research. 28 (supplement), 55-76.
Osterland, A., 2002. No more Mr. Nice Guy: A CFO Survey Suggests that Recently Passed Rules for Auditors may be a Wise Idea. CFO Magazine. September, 1–7. http://www.cfo.com/article.cfm/3006158?f=search.
Palepu, K., 1985. Diversification Strategy, Profit Performance and the Entropy Measure. Strategic Management Journal. 6(3), 239-255.
Palmiter, A. R. 2002. Mutual Fund Voting of Portfolio Shares: Why Not Disclose? Cardozo Law Review. 23(4), 1419–91.
Parrino, R., Sias, R. W., Starks, L. T., 2003. Voting with their Feet: Institutional Investors and CEO Turnover. Journal of Financial Economics. 68 (1), 3-46.
Piotroski, J.D., Srinivasan, S., 2008. Regulation and Bonding: The Sarbanes Oxley Act and the Flow of International Listings. Journal of Accounting Research. 46 (2), 383-425.
Porter, M., 1992. Capital Disadvantage: America’s Failing Capital Investment System. Harvard Business Review. 70 (5), 65-82.

170
Rezaee, Z., 2002. Financial Statement Fraud: Prevention and Detection. JohnWiley & Sons, New York.
Rezaee, Z., 2004. Corporate Governance Role in Financial Reporting. Research in Accounting Regulation. 17, 107–149.
Ribstein, L. E., 2002. Market vs. Regulatory Responses to Corporate Fraud: A Critique of the Sarbanes-Oxley Act of 2002. Journal of Corporation Law 28 (1), 1–67.
Roberts, M.R., Whited, T.M., 2011. Endogeneity in Empirical Corporate Finance. Working paper. Simon Graduate School of Business.
Romano, R., 2005. The Sarbanes-Oxley Act and the Making of Quack Corporate Governance. Sarbanes-Oxley Act. 2002. Pub. L. 107–204, Enacted July 30, 2002. Stat.116.745. The Yale Law Journal. 114, 1521–1611.
Scherer, F. M., 1984. Innovation and Growth: Schumpeterian Perspectives. MIT Press, Cambridge, MA.
Schumpeter, J. A. 1961. Theory of Economic Development. Oxford University Press, New York.
Sen, P., 2007. Ownership Incentives and Management Fraud. Journal of Business Finance and Accounting. 34 (7-8), 1123-1140.
Shleifer, A., Vishny, R., 1986. Large Shareholders and Corporate Control. Journal of Political Economy. 94 (3), 461-480.
Shrieves, R., 1978. Market Structure and Innovation: A New Perspective. Journal of Industrial Economics. 26, 329–347.
Smith, C. L., & Warner, J. B., 1979. Bankruptcy, Secured Debt and Optimal Capital Structure: A Comment. Journal of Finance. 34, 347-351.
Taylor, W., 1990. Can Big Owners Make a Difference? Harvard Business Review. 68 (5), 70-82.
Tesar, L. L., Werner, I. M., 1995. Home Bias and High Turnover. Journal of International Money and Finance. 14 (4), 467-492.
Useem, M., 1993. Executive Defense: Shareholder Power and Corporate Reorganization. Harvard University Press, Cambridge, MA.
Veenman, D., Hodgson, A., van Praag, B., Zhang, W., 2011. Decomposing Executive Stock Option Exercises: Relative Information and Incentives to Manage Earnings. Journal of Business Finance and Accounting. 38 (5-6), 536-573.

171
Wahal, S., McConnell, 2000. Do Institutional Investors Exacerbate Managerial Myopia? Journal of Corporate Finance. 6, 307- 329.
Zhang, I. X., 2007. Economic Consequences of the Sarbanes-Oxley Act of 2002. Journal of Accounting and Economics. 44, 74–115.